richards 2000 tracing european founder lineages in the...
TRANSCRIPT
Am. J. Hum. Genet. 67:1251–1276, 2000
1251
Tracing European Founder Lineages in the Near Eastern mtDNA PoolMartin Richards,1,3 Vincent Macaulay,1,2 Eileen Hickey,1 Emilce Vega,1 Bryan Sykes,1Valentina Guida,6 Chiara Rengo,6,7 Daniele Sellitto,6 Fulvio Cruciani,6 Toomas Kivisild,8Richard Villems,8 Mark Thomas,4 Serge Rychkov,9 Oksana Rychkov,9 Yuri Rychkov,9,*
Mukaddes Golge,10 Dimitar Dimitrov,5 Emmeline Hill,11 Dan Bradley,11 Valentino Romano,12,13
Francesco Calı,12 Giuseppe Vona,14 Andrew Demaine,15 Surinder Papiha,16
Costas Triantaphyllidis,17 Gheorghe Stefanescu,18 Jiri Hatina,19 Michele Belledi,20,*
Anna Di Rienzo,21 Andrea Novelletto,22 Ariella Oppenheim,23 Søren Nørby,24
Nadia Al-Zaheri,25 Silvana Santachiara-Benerecetti,26 Rosaria Scozzari,4 Antonio Torroni,6,27
and Hans-Jurgen Bandelt28
1Institute of Molecular Medicine and 2Department of Statistics, University of Oxford, Oxford; 3Department of Biology and 4Center for GeneticAnthropology, Departments of Anthropology and Biology, University College London, and 5The Linnaean Society of London, London;6Dipartimento di Genetica e Biologia Molecolare, Universita di Roma “La Sapienza”, and 7Istituto di Medicina Legale, Universita Cattolicadel Sacro Cuore, Rome; 8Department of Evolutionary Biology, Tartu University, Tartu, Estonia; 9Human Genetics Laboratory, Institute ofGeneral Genetics, Moscow; 10Department of Physiology, University of Kiel, Kiel; 11Department of Genetics, Trinity College, Dublin;12Associazione Oasi Maria SS, Istituto di Ricovero e Cura a Carattere Scientifico per lo Studio del Ritardo Mentale e dell’InvoluzioneCerebrale, Troina, Italy; 13Dipartimento di Biopatologia e Metodologie Biomediche, Universita di Palermo; 14Dipartimento di BiologiaSperimentale, Sezione di Antropologia, Universita di Cagliari, Cagliari, Italy; 15Postgraduate Medical School, University of Plymouth,Plymouth, United Kingdom; 16Department of Biochemistry and Genetics, University of Newcastle upon Tyne, Newcastle upon Tyne;17Department of Genetics, Development and Molecular Biology, Aristotle University of Thessaloniki, Thessaloniki, Greece; 18Institutul deCercetari Biologice, Iasi, Romania; 19Charles University, Medical Faculty in Pilsen, Institute of Biology, Pilsen; 20Dipartimento di BiologiaEvolutiva, Sezione di Biologia Umana, Parma, Italy; 21Department of Human Genetics, University of Chicago, Chicago; 22Department of CellBiology, University of Calabria, Rende, Italy; 23Department of Hematology, Hebrew University-Hadassah Medical School, Jerusalem;24Laboratory of Biological Anthropology, Institute of Forensic Medicine, University of Copenhagen, Denmark; 25Department of Biotechnology,College of Science, University of Baghdad, Baghdad; 26Dipartimento di Genetica e Microbiologia, Universita di Pavia, Pavia, Italy; 27Istitutodi Biochimica, Universita di Urbino, Urbino, Italy; and 28Fachbereich Mathematik, Universitat Hamburg, Hamburg
Founder analysis is a method for analysis of nonrecombining DNA sequence data, with the aim of identificationand dating of migrations into new territory. The method picks out founder sequence types in potential sourcepopulations and dates lineage clusters deriving from them in the settlement zone of interest. Here, using mtDNA,we apply the approach to the colonization of Europe, to estimate the proportion of modern lineages whose ancestorsarrived during each major phase of settlement. To estimate the Palaeolithic and Neolithic contributions to EuropeanmtDNA diversity more accurately than was previously achievable, we have now extended the Near Eastern, Eu-ropean, and northern-Caucasus databases to 1,234, 2,804, and 208 samples, respectively. Both back-migration intothe source population and recurrent mutation in the source and derived populations represent major obstacles tothis approach. We have developed phylogenetic criteria to take account of both these factors, and we suggest away to account for multiple dispersals of common sequence types. We conclude that (i) there has been substantialback-migration into the Near East, (ii) the majority of extant mtDNA lineages entered Europe in several wavesduring the Upper Palaeolithic, (iii) there was a founder effect or bottleneck associated with the Last Glacial Max-imum, 20,000 years ago, from which derives the largest fraction of surviving lineages, and (iv) the immigrantNeolithic component is likely to comprise less than one-quarter of the mtDNA pool of modern Europeans.
Introduction
It is generally agreed that many components of earlyEuropean farming, including domesticated emmer
Received April 4, 2000; accepted for publication September 6, 2000;electronically published October 16, 2000.
Address for correspondence and reprints: Dr. Martin Richards, De-partment of Chemical and Biological Sciences, University of Hud-dersfield, Queensgate, Huddersfield, HD1 3DH, United Kingdom. E-mail: [email protected]
∗ Deceased.q 2000 by The American Society of Human Genetics. All rights reserved.
0002-9297/2000/6705-0022$02.00
wheat, barley, sheep and goats, were introduced intoEurope from the Near East during the Neolithic, begin-ning some 9,000 years before the present (YBP) (Thorpe1996). Nevertheless, there is uncertainty concerning thenature of the spread of these components into Europe.Two extreme hypotheses have been proposed. The re-placement hypothesis suggests that the onset of agri-culture was accompanied by extensive immigration bydemic diffusion from the Near East, such that most ofthe gene pool of modern Europeans is derived from thenewcomers (Diamond 1997; Barbujani et al. 1998; Chi-khi et al. 1998b). Many archaeologists have rejected this
1252 Am. J. Hum. Genet. 67:1251–1276, 2000
view, in favor of a model based on trade and culturaldiffusion (Dennell 1983; Barker 1985; Whittle 1996),which would have left the gene pool of prehistoric Eu-rope essentially autochthonous. There is clearly a spec-trum of possibilities between these two extremes, in-cluding demic diffusion involving a substantial minorityof newcomers, perhaps practicing hypergamy (Cavalli-Sforza and Minch 1997), and pioneer colonization in-volving fewer newcomers and a more substantial con-tribution from the indigenous Mesolithic population(Zvelebil 1986, 1989; Sherratt 1994).
The study of the geographic distribution and diversityof genetic variation, known as the “phylogeographicapproach” (Avise et al. 1987; Templeton et al. 1995),is emerging as a useful tool for the investigation of rangeexpansions, migrations, and other forms of gene flowduring prehistory. It is particularly suited to the studyof nonrecombining-marker systems such as mtDNA,which is inherited down the female line and evolvesrapidly, so that, provided that sufficient characters areassayed, the maternal genealogy can be well resolved.European mtDNAs fall into a number of distinct clus-ters, or haplogroups (Torroni et al. 1994a, 1996; Rich-ards et al. 1998a; Macaulay et al. 1999). Most of theseclusters are clades defined by particular control-regionand/or coding-region motifs, although recurrent mu-tation, especially in the control region, can sometimeserase diagnostic elements of these motifs. The majorclades are H–K, T, U3–U5, and V–X. As has been ar-gued elsewhere (Richards et al. 1998a; Macaulay et al.1999), the RFLP haplogroup U (Torroni et al. 1996)subsumes both haplogroup K and a number of otherclusters (U1–U6), including several (U1, U2, and U6)found rarely in Europe but more frequently in the NearEast and northern Africa (Macaulay et al. 1999). Inaddition, lineages are occasionally seen in Europe thatbelong to clusters more commonly found elsewhere,such as members of haplogroups M from eastern Eur-asia (Ballinger et al. 1992; Passarino et al. 1992, 1996;Torroni et al. 1994b) or L1 and L2 from Africa (Chenet al. 1995; Watson et al. 1997).
In previous work, it was suggested that much of theextant European mtDNA lineages have their ancestryin Late Glacial expansions within Europe (Richards etal. 1996; Torroni et al. 1998), with only ∼10% datingto the earliest Upper Palaeolithic settlement of the con-tinent (Richards et al. 1998a) and with ∼<20% datingto fresh immigrations during the early Neolithic. How-ever, these estimates depend on a reliable determinationof founder sequence types, since the undetected presenceof ancestral heterogeneity in a colonizing populationwould result in an overestimation of the age. If this werethe case, Europe could have been populated far morerecently—for example, during the Neolithic—by amuch more diverse founder population (Barbujani et al.
1998). A limitation of the initial analysis (Richards etal. 1996) was that it was based on a very small set ofpublished Near Eastern sequences—42 from the Levantand the Arabian peninsula, mainly from the Bedouin(Di Rienzo and Wilson 1991; Richards and Sykes 1998).Although these sequences were difficult to assign, withcertainty, to mtDNA clusters, since they encompassedonly the first hypervariable segment (HVS-I) of the con-trol region, they appeared to comprise mainly clustersJ and T, pre-HV, a few sequences belonging to X, M,and L1/L2, and some probably belonging to cluster U.There were very few or no members of the major Eu-ropean cluster H, which occurs at a frequency of40%–60% in most European populations, and therewere no representatives of either its sister cluster V orof clusters I, W, K, or U5.
More data from the Near East have been publishedsince this initial analysis, suggesting that the Bedouinmay be unrepresentative of Near Eastern populations.Both Calafell et al. (1996) and Comas et al. (1996) havepresented data from Turkey. These data suggest thepresence of substantial frequencies of cluster H (al-though lower than that in Europe) (Torroni et al. 1998),as well as of I, W, K, and U4, in addition to clustersalready identified in the Bedouin. Torroni et al. (1998)also analyzed a sample of Druze from Israel, using high-resolution RFLPs, and concluded that haplogroup H,but not haplogroup V, evolved first in the Near Eastand subsequently migrated into Europe. Here, we ex-tend the Near Eastern database further, to a total of1,234 individuals sampled from throughout the region,including ∼500 from the vicinity of the Fertile Crescent,where agriculture emerged from the increasingly sed-entary Natufian populations at the end of the last IceAge (Henry 1989).
We have formalized the procedure for founder anal-ysis, investigated the extent of confounding recurrentgene flow between the putative source and derived pop-ulations, and developed criteria that take into accountthe effects of both gene flow and recurrent mutation.This has enabled us to provide an estimate of the con-tribution, to the present-day mtDNA pool, of immigra-tion events at different times during Europe’s past.
Although previous genetic studies, using classicalmarkers, have inferred a demic component to the spreadof agriculture into Europe from the Near East (Menozziet al. 1978; Ammerman and Cavalli-Sforza 1984; Sokalet al. 1991), the present study allows us for the firsttime to quantify that component realistically—at leastfor maternal lineages. Furthermore, the founder analysisusing mtDNA allows us to trace lineages farther backinto prehistory, through the Last Glacial Maximum(LGM), to the first settlement of Europe by anatomicallymodern humans, almost 50,000 YBP.

Richards et al.: Tracing European Founder mtDNAs 1253
Subjects and Methods
Subjects
For the purposes of this analysis, the Near East wastaken to include the whole of Turkey, the Fertile Crescentfrom Israel to western Iran, and the whole of the Arabianpeninsula (see Kuhrt 1995, p. 1). The lower Nile (Egyptand northern Sudan) was also included, since this regionis often treated historically with the Near East and sincethe HVS-I sequence data show that a large proportionof typically Near Eastern mtDNAs have penetrated theNile Valley, where they coexist with sub-Saharan AfricanmtDNAs (Krings et al. 1999). We sampled widely in theNear East, for several reasons. First, we wished to tracethe ancestry of European lineages as far back as 50,000YBP. We therefore needed as wide a source-populationdatabase as possible. Second, even though there is a par-ticular concern with the origin of European Neolithiclineages in this work, we did not wish to focus exclu-sively on the core region for the origin of agriculture inthe Fertile Crescent. This is because extensive gene flowwithin the Near East since the early Neolithic may wellhave dispersed founder sequence types at least as farafield as Egypt, the southern Caucasus, and Iran.
The Near Eastern populations analyzed for sequencevariation in HVS-I of the mtDNA control region were asfollows: 80 Nubians and 67 Egyptians (Krings et al.1999); 29 Bedouin (Di Rienzo and Wilson 1991); 43 Ye-meni Jews, including 5 from the study by Di Rienzo andWilson (1991); 116 Iraqis, sampled from four regions ofIraq; 12 Iranians, sampled in Iran and Germany; 69 Syr-ians from Damascus; 146 Jordanians (45 from the DeadSea region and 101 from the Amman region [V. Cabreraand N. Karadsheh, personal communication]); 117 IsraeliPalestinians, including 8 from the study by Di Rienzo andWilson (1991); 45 Israeli Druze (Macaulay et al. 1999);218 Turks from Turkey, including 74 from the studies byComas et al. (1996) and Calafell et al. (1996); 53 Kurdsfrom eastern Turkey; 191 Armenians from Armenia; and48 Azeris from Azerbaijan.
The European populations were analyzed by a mod-ified version of the paleo-climatological model of Gam-ble (1986, 1999), as described elsewhere (Richards et al.1998a): southeastern Europe—141 Bulgarians, includ-ing 30 from the study by Calafell et al. (1996), and 92Romanians from Maramures (65) and Vrancea (27);eastern Mediterranean—65 Greeks from Thessaloniki,60 Sarakatsani from northern Greece, and 42 Albanians(Belledi et al. 2000); central Mediterranean—49 Italiansfrom Tuscany (Francalacci et al. 1996; Torroni et al.1998) and 48 from Rome, 90 Sicilians (42 from Troinaand 48 from Trapani), and 115 Sardinians, including69 from the study by Di Rienzo and Wilson (1991);western Mediterranean—54 Portuguese (Corte-Real et
al. 1996), 71 Spaniards (Corte-Real et al. 1996), 92 Ga-licians (Salas et al. 1998) (156 Basques from northernSpain, including those from the studies by Bertranpetitet al. [1995] and Corte-Real et al. [1996], were treat-ed separately); Alps—70 Swiss (Pult et al. 1994), 49South Germans from Bavaria (Richards et al. 1996), and99 Austrians (Parson et al. 1998); north-central Eu-rope—37 Poles, 83 Czechs, 174 Germans (Richards etal. 1996; Hofmann et al. 1997), and 38 Danes, including33 from the study by Richards et al. (1996); Scandi-navia—32 Swedes (Sajantila et al. 1996), 231 Norwe-gians, including 215 from the study by Opdal et al.(1998), and 53 Icelanders (Sajantila et al. 1995; Richardset al. 1996); northwestern Europe—71 French, com-prising 47 from northeastern France and 24 from theCEPH database, 100 British (Piercy et al. 1993), 92 in-dividuals from Cornwall, including 69 from the studyby Richards et al. (1996), 92 individuals from Wales(Richards et al. 1996), and 101 individuals from westernIreland; northeastern Europe—25 Russians from thenorthern Caucasus, 36 Chuvash from Chuvashia (Rus-sia), 163 Finns and Karelians, including 133 from thestudy by Sajantila et al. (1995) and 29 from the studyby Richards et al. (1996), 149 Estonians, including 28from the study by Sajantila et al. (1995) and 20 fromthe study by Sajantila et al. (1996), and 34 Volga-Finns(Sajantila et al. 1995); and northern Caucasus—106northern Ossetians, 13 Chechens, 39 Kabardians, and50 Adygei (Macaulay et al. 1999). Several publishedsequences containing ambiguities were excluded. Unat-tributed sequence data had previously been unpublishedand were generated by the authors. HVS-I sequenceswere analyzed between nucleotide positions 16090 and16365 (in the numbering system according to Andersonet al. [1981], which is used throughout this article), tobe able to incorporate earlier data, but new sequencesgenerally extended from ∼16050 to 16495, so that ad-ditional informative positions could be incorporated.The status at nucleotide position 16482 was checked ina number of previously analyzed samples, by use of therestriction enzyme DdeI, in order to assign H lineagesincluding a transition at nucleotide position 16362 tothe subcluster with HVS-I motif 16362-16482. In orderto classify mtDNAs that did not harbor a diagnostichaplogroup motif in their HVS-I sequence, additionaldiagnostic markers were assayed, when this was possi-ble. This screening mainly involved haplogroups H(7025 AluI), HV (14766 MseI and/or 00073), and U (byuse of a mismatched 12308 HinfI [Torroni et al. 1996]).By use of restriction digestion with the enzymes HaeIIIand Tsp509I, the former in conjunction with a mis-matched primer, the status at nucleotide positions 11719and 11251, respectively, was checked in 12 mtDNAsharboring the motif 16126C-16362C, which, until now,had been a cluster with an ambiguous position in the

1254 Am. J. Hum. Genet. 67:1251–1276, 2000
mtDNA phylogeny (Macaulay et al. 1999), being eitherpre-HV or pre-JT. All samples bore the 11719G(111718HaeIII) mutation that is characteristic of HV(Saillard et al., in press), whereas none of them bore the11251G (–11251Tsp509I) mutation that is character-istic of JT (Hofmann et al. 1997; Macaulay et al. 1999).Thus, these mtDNAs were shown to constitute an earlybranch in the pre-HV cluster.
mtDNA Classification
The mtDNA nomenclature has been described in detailby Richards et al. (1998a) and Macaulay et al. (1999).In brief, named clades of the phylogeny typically eitherrefer to early branchings or are distinguished by an in-teresting geographic distribution. Major clades, by tra-dition called “haplogroups,” are denoted in terms of up-percase roman letters (e.g., H, J, etc.), and nestedsubclades are denoted by alternating positive integers andlowercase roman letters (e.g., J2, J1a, J1b1, etc.). Super-clades, if not denoted by a single letter (e.g., M or N),are denoted by concatenating clade names (e.g., HV)whenever the smallest superclade comprising those cladesis meant; the largest superclade containing those but noother named clades receives the prefix “pre-” (e.g., pre-HV). Possibly paraphyletic groups coalescing in an un-resolved multifurcation that exclude the named clades de-riving from this coalescence are marked by an asterisk (*)appended to the list of those named clades (e.g., HV*).
We use the term “sequence type” to refer to haplo-types of HVS-I sequences, and we use the term “lineage”to denote an individual subject’s sequence. Hence, a par-ticular sequence type, such as that which, within HVS-I, matches the Cambridge reference sequence (CRS [An-derson et al. 1981]), might comprise several lineages, ifseveral individuals in a population sample display thesame sequence type. As before, we denote sequence typesin terms of the positions at which they differ from theCRS, so that an HVS-I sequence type differing by a tran-sition at nucleotide position 16311 is denoted “16311,”and a type differing by transitions at nucleotide positions16145 and 16223 and a CrG transversion at nucleotideposition 16176 is denoted “16145-16176G-16223.”The term “founder type” denotes a sequence type thathas been carried from a source population to a derivedpopulation. “Founder cluster” refers to the cluster thathas evolved from the founder type in the derivedpopulation.
The phylogenetic analysis was based on the construc-tion of reduced median networks (Bandelt et al. 1995).These networks had to be further reduced, since we re-quired a tree in order to perform founder analysis. Forwestern-Eurasian mtDNA data, combined analyses ofcontrol-region and coding-region data have resulted inthe basal part of the phylogeny becoming clear (Ma-
caulay et al. 1999). Assignment to major clades on thebasis of control-region data can therefore readily beachieved with the limited amount of additional RFLPtyping described above. In the case of published dataand other samples that could not be tested for additionalmarkers, sequences could usually be unproblematicallyassigned to clusters by use of sequence matches or relatedtypes of known cluster. However, clear resolution withinmajor clades can still remain a problem, particularlywhen the clades have little branching substructure. Sev-eral cases required special attention:
1. A subset of haplogroup T (referred to as “T*”in the study by Richards et al. [1998a]) includesthe nodes 16126-16294, 16126-16294-16296, 16126-16294-16296-16304, and 16126-16294-16304, whichform a four-cycle in the network, with additional am-biguity surrounding nucleotide positions 16292 and16153 (Richards et al. 1998a). Unfortunately, compar-ative coding-region data have not yet helped to resolvethis four-cycle. A possible explanation for this is thatthe transition at nucleotide position 16294 destabilizessites in its vicinity, where two runs of three cytosines areseparated by an adenine. If this were the case, the nu-cleotide positions 16292 and 16296 might be unstablein this subcluster (as also has been noted by Malyarchukand Derenko [1999]). Instability at nucleotide position16296 is supported by its recurrence in T1 and by nu-cleotide position 16146 in T*, a slowly-evolving positionthat, nevertheless, occurs on both 16126-16294 and16126-16294-16296 backgrounds; 16153 also occurson both backgrounds (although it appears again, clearlyresolved, on a 16126-16266-16294 background). Thebasic T* network therefore is probably best resolved intothe path 16126-16294 (root), 16126-16294-16296,16126-16294-16296-16304, and 16126-16294-16304(since 16126-16294-16296 has higher diversity thandoes 16126-16294-16304). The difficulties with nucle-otide position 16296 are acute, however, so we zero-weighted this character when constructing the T* net-work; this suggested that the position had mutated aminimum of 10 times within T*. This analysis also sug-gested that nucleotide position 16292, which might, forthe same reason, also be thought likely to be destabilizedhas mutated only twice in T*. Position 16153 also ap-peared to have mutated only twice. Setting aside thestatus at nucleotide position 16296 enabled us to dis-tinguish additional subclusters within T: T2 (16126-16294-16304), T3 (16126-16292-16294), T4 (16126-16294-16324), and T5 (16126-16153-16294). Theseclusters are worth delineating, since they represent someof the main founder clusters within T. We here updateT* as the remainder of T when T1–T5 are excluded.
2. Haplogroup U5 appears to suffer instability at nu-cleotide position 16192 (Macaulay et al. 1999; Finnila

Richards et al.: Tracing European Founder mtDNAs 1255
et al. 2000), resulting in a four-cycle as above. We there-fore assigned the 16189-16192-16270 type to subclusterU5b and assigned 16192-16311 to U5*. However,16189-16192-16256-16270 was assigned to U5a1*, onthe basis of the more stable nucleotide position 16256.
3. Haplogroup K appears to suffer multiple hits at nu-cleotide position 16093. However, it was usually possibleto resolve 16093 transitions on the basis of additionalHVS-I information (resolving in favor of slower positionsfrom the list in the study by Hasegawa et al. [1993]);therefore, this character was retained. Nevertheless, the16093-16224-16311 type itself may well have evolvedfrom 16224-16311 more than once, which would ac-count for the very low age estimate for this cluster.
4. Haplogroup H needed particular processing. Wedid this by analyzing the data from cluster H site by site,constructing reduced median networks of all sequencescontaining the variant base at each site. Two criteriawere then used to evaluate which of these aggregatesformed valid clusters:
a. Connectivity.—If there was a starlike phylogenywith an extant central node and one-step connectedderivatives, it was considered likely that the groupof sequences formed a phylogenetic cluster.
b. Relative mutation rates of sites.—If ambiguity re-mained after criterion (a) was employed, the clusterswere further resolved by cutting of links corre-sponding to positions with lower weights—that is,with higher individual mutation rates. The weightswere assigned by counting the number of majorclusters in which the variant base occurred, as aminimum estimate of the number of times that ithas mutated in the data set.
5. The HVS-I CRS sequence type, along with commonone-step derivatives resulting from transitions at fastsites such as 16129, 16189, 16311, and 16362, maybelong to haplogroups H, HV, pre-HV, U, or R. Foreach region, the additional typing information avail-able was sufficient to allow us to distribute untypedHVS-I CRS lineages among the haplogroups. Thiswas done on the basis of their known frequency, withfully typed data, region by region. Typically, almostall lineages were allocated to haplogroup H withinEurope. The HVS-I types 16129, 16189, 16311, and16362 were treated in the same way where this wasnecessary, and types that included these variants wereassigned to clusters by a favoring of slower-evolvingpositions.
Founder Analysis
Here we take an approach toward the identificationof European founders that is more formal than that usedelsewhere (Richards et al. 1996). Similar kinds of anal-ysis have been performed by Stoneking and Wilson(1989), Stoneking et al. (1990), and Sykes et al. (1995),
for the populations of the Pacific, and by Torroni et al.(1993a, 1993b) and Forster et al. (1996), for the pop-ulations of the Americas. However, as a consequence ofboth our larger data set and the closer genetic contactbetween the Near East and Europe, it has proved nec-essary here to incorporate a data-processing step, to al-low for the high levels of recurrent mutation and back-migration.
We identified “candidate” founders by searching for
1. identical sequence types in the Near East and Europe,and
2. inferred matches within the Near Eastern and Euro-pean phylogeny, which are either
a. unsampled types with both European and NearEastern derivatives, or
b. sequence types sampled only in the Near East andwhose immediate derivatives include at least oneEuropean, or
c. sequence types sampled only in Europe and whoseimmediate derivatives include at least one NearEastern individual.
We then developed criteria for screening out recurrentmutation and back-migration. These criteria were de-signed to identify types that had most likely evolved inthe Near East and to exclude those which had migratedthere during the more recent past; the presence of derivedtypes in the Near East was used to distinguish the former.
We applied three levels of stringency to identify foun-der candidates, and we also performed analyses on thecandidate list itself (f0). Two of the levels, f1 and f2,were threshold levels, designed particularly to minimizethe effects of recurrent mutation. Especially in the caseof a shared frequent type, a parallel mutation in bothregions, usually at a fast position, is likely to be recon-structed as a single event, so that the mtDNAs bearingthe derived state seem to be more closely related thanthey are. A sequence match (either sampled or inferred)between populations—and, hence, a false founder can-didate—can result. The threshold criteria aimed to re-duce the impact of this effect, by requiring that matchesshould not be at the tips of the Near Eastern phylogeny:they are required to have either one (f1) or two (f2)branches deriving from them in the Near East. Further-more, the derived types must connect to the foundercandidate via Near Eastern (or shared) sequence typesand not via sequence types found only in Europe. Thesecriteria also provide a screen against recent back-migra-tion into the Near East, since recently back-migratedtypes should also lack derivatives in the Near Easternpopulation.
A weakness of this approach for detection of back-migration is that it is dependent on the frequency of thefounder cluster candidates in Europe. Clearly, for rarer

1256 Am. J. Hum. Genet. 67:1251–1276, 2000
types, the chance that back-migration or recurrent mu-tation will be detected is lower—and, for common types,it is higher—so that the criteria might be both too strin-gent for rare clusters and too weak for common clusters.We therefore introduced an alternative to f2, referred toas “fs,” in which the frequency of the cluster derivingfrom each candidate founder in Europe was used to scalethe number of derivatives required in the Near East inorder for the candidate to be counted as a founder type.To this end, we rescaled the (absolute) frequency of foun-der candidate clusters in Europe by taking logarithmsto the base 10, rounding to the nearest integer, andthen adding 1, allowing the outcome to be 1–4. Thisoutcome was then used to designate the number of de-rivatives required in order for the candidate to qualifyas a founder. In addition, to investigate the effect ofsample size and differential back-migration into themore peripheral Near Eastern populations, we reappliedthe fs criterion, excluding these populations (a procedurereferred to as the “fs′” analysis).
Frequency Estimates
We estimated the posterior distribution of the pro-portion of a group of lineages in the population, giventhe sample, by using a binomial likelihood and a uniformprior on the population proportion. From this posteriordistribution, we calculated a central 95% “credible re-gion” (CR) (Berger 1985).
Dating and Age Classes
Having identified a list of founder types correspond-ing to each of these criteria, we measured the diversityin the clusters to which they have given rise within Eu-rope, using the statistic r, the mean number of transi-tions from the founder sequence type to the lineages inthe cluster (Forster et al. 1996). This is an unbiasedestimate of the time to the most common ancestor ofthe cluster (TMRCA), measured in mutational units.This value was converted to an age estimate, by use ofa mutation rate of 1 transition (between nucleotide po-sitions 16090 and 16365) per 20,180 years (Forster etal. 1996), which closely approximates other rates usedfor HVS-I (Ward et al. 1991; Macaulay et al. 1997). Ifthe underlying genealogy of a cluster is starlike, we canreadily calculate the posterior distribution of itsTMRCA, given the sequence type of the ancestor, as-suming a uniform prior distribution for the TMRCA anda Poisson distribution for the mutational process. Fromthe (gamma-distributed) posterior, we calculated a cen-tral 95% CR. We did this for all clusters, regardless ofwhether their phylogeny was starlike. When the phy-logeny is markedly non-starlike, this is highlighted, sincethis method is expected to underestimate considerablythe width of the true CR.
We employed two simple Procrustean models of dem-ographic prehistory to partition the founder clusters, un-der each criterion, into migration events. The first, or“basic,” model assumes four major prehistoric migra-tions from the Near East to Europe: (i) early Upper Pa-laeolithic (EUP), 45,000 YBP; (ii) middle Upper Palaeo-lithic (MUP), 26,000 YBP; (iii) late Upper Palaeolithic(LUP), 14,500 YBP; and (iv) Neolithic, 9,000 YBP. Italso employed a fifth class, at 3,000 YBP, in order todistinguish Neolithic from more-recent migration events.
These age classes were chosen by combining archae-ological and paleo-climatological information (e.g., seeDansgaard et al. 1993; Strauss 1995) with an eyeballingof the ages of the more common founder clusters (seetable 3 and fig. 1). These clusters appeared to fall roughlyinto at least three age classes, roughly corresponding tothe beginning of the EUP, the LUP, and the Neolithic,with some clusters falling broadly between the LUP andthe EUP. The MUP date of 26,000 YBP was chosen toallow immigrants arriving during ∼30,000–20,000 YBPto register, and it also corresponds to a slight climaticimprovement. The EUP and LUP dates also correspondto more-substantial climatic ameliorations, especially theLUP dates, which are based on the rapid onset of theBølling warm phase (Dansgaard et al. 1993).
With this latter point in mind, we also considered an“extended” model, which included a Mesolithic com-ponent during the dramatic rewarming following theYounger Dryas glacial interlude at 11,500 YBP (Dans-gaard et al. 1993). This was stimulated by the sugges-tion, by Adams and Otte (1999), that recovery from thisbrief cold period, like that from the LGM, may have ledto renewed population dispersals in Europe, possiblyincluding some from Near Eastern refugia. Mesolithicevents would, of course, be difficult to distinguish fromboth LUP and Neolithic expansions, but the possibilityof a Mesolithic contribution should nevertheless beborne in mind.
Our partition analysis involves making the followingassumptions: (i) each cluster can be assigned, in its en-tirety, to one of the proposed migration phases; (ii) eachcluster expanded in Europe, immediately after the mi-gration event, so that, as a result, the genealogy of eachfounder cluster is starlike, with a time depth closely ap-proximating the time of the migration event; (iii) themutation-rate estimate is accurate; (iv) the phylogeneticanalysis has resolved all mutations; and (v) the founderanalysis has correctly identified the sequence types of thefounders. We determined the probabilities that eachfounder cluster took part in each of the migration events,on the basis of the age of the cluster. Then, given theproportion of the modern sample contained in each clus-ter, we estimated the proportion of the sample (and, byimplication, the modern population of Europe) that isderived from each migration event. In detail, the migra-

Richards et al.: Tracing European Founder mtDNAs 1257
tion-event times, tm ( , where for the1 < m < M M p 5basic model and for the extended model), wereM p 6first scaled by the mutation rate m; that is, . Ift p mtm m
we were to know from which event a cluster derived,then, under our assumption about the genealogy, thesampling distribution of r would be Poisson, with theparameter given by the total (scaled) length of the tree(which equals the number of samples in the cluster mul-tiplied by the scaled time of the event); that is,
pr(rFa p 1,t ) p constant # exp[2n (t 2 r lnt )] ,i im m i m i m
where ri is the value of r for the ith cluster ( ),1 < i < Ini is the sample size of the ith cluster, and if thea p 1im
ith cluster is associated with the mth event and a pim
otherwise. Then, the application of Bayes’s theorem,0with an uninformative prior , yields21pr(a p 1) p Mim
the posterior probability that :a p 1im
exp[2n (t 2 r lnt )]i m i mpr(a p 1Fr ,t ) p .Mim i m O exp[2n (t 2 r lnt )]i m i mmp1
The proportion of the total sample that is associatedwith the mth event, Sm, is , where n is the21 In O a nip1 im i
total sample size. Exploiting the distribution derivedabove for aim, we evaluated the posterior mean of Sm
and the root-mean-square deviation from the mean, toprovide an overall indication of the likely contributionof each migration to the extant mtDNA pool. We per-formed the analysis on the three founder lists identifiedon the basis of the criteria f1, f2, and fs, as well as onthe basis of the f0 list. The analysis was repeated withthe migration dates varied by as much as 2,000 years,to establish that this did not greatly affect the outcome.
Multiple dispersals of single sequence types are clear-ly a possibility, particularly for older types that are fre-quent in the Near East. Although most western-EurasianmtDNA types are rare, one in particular, the root ofhaplogroup H (having the CRS in HVS-I and, hence,referred to as “H-CRS”), is very common, accountingfor 16% of European lineages and for 6% of those fromthe Near East. Since this type is as much as 30,000 yearsold, it may have spread into Europe more than once. Toallow for this possibility, we removed from the partitionanalysis the cluster derived from this type and then re-peated the analysis. We then distributed the H-CRS clus-ter in Europe into the migrations, in proportion to theoverall contribution of other lineages to each migration,while excluding the EUP, which occurred before this typehad evolved. We term this the “fsr” analysis. No otherNear Eastern type occurs at 12% of the total—exceptfor the K type 16224-16311 (3.0%), which is !25,000years old.
Members of haplogroups of eastern-Eurasian and Af-
rican origin were excluded from these analyses, as “er-ratics”—that is, occasional migrants rather than partsof major range expansions. Few of these types occurmore than once. We also excluded possible members ofR1, R* (Macaulay et al. 1999), and N* (see below).These sets of lineages lack informative HVS-I markers,and, in the absence of additional RFLP typing, whichwas not possible for data assembled from the literature,they could not be unambiguously identified. However,they are extremely rare in Europe, amounting to !1%of the lineages.
Results
mtDNA in the Near East
Table 1 shows frequencies and age estimates of themain mtDNA haplogroups that occur in the Near Eastand Europe. These clusters are restricted primarily toEurope and the Near East (western Eurasia). Western-Eurasian lineages are found at moderate frequencies asfar east as central Asia (Comas et al. 1998) and are foundat low frequencies in both India (Kivisild et al. 1999a)and Siberia (Torroni et al. 1998), but, in these cases,only restricted subsets of the western-Eurasian haplo-groups have been found, suggesting that they are mostprobably the result of secondary expansions from thecore Near Eastern/European zone.
The ages are estimates of the TMRCA of each cluster.Since these clusters are largely restricted to Europe andthe Near East, they are likely to have originated in eitherone or the other region and to have subsequently dis-persed into the other. In this case, there may be an overallreduction in the diversity of a cluster in the region thatwas settled, which gives an indication of the directionof gene flow, although this will not automatically be thecase, depending on the diversity carried from the source.If this were the case, the older of the two age estimateswould be a better estimate of the age of the cluster; theestimate for the younger population then would berather meaningless. A founder analysis would be nec-essary to date the migration event.
As table 1 indicates, a number of the major haplo-groups have greater diversities in the Near East than inEurope. This is the case for haplogroups H, J, and T,for which the central 95% CRs of their TMRCAs in theNear East and Europe do not overlap. Haplogroup Uappears to be similar in age in both Europe and the NearEast and has ancient geographically specific subclusters.In these two regions, haplogroups I, W, and X are alsoindistinguishable, possibly as a result of their low samplesizes. We also calculated haplogroup diversity in thenorthern-Caucasian samples; however, although high,these values cannot be very meaningfully converted intoage estimates, since the cluster phylogenies in this region

Table 1
Estimated Frequencies and Ages of Major Haplogroups and Their Major Subclusters, in the Near East and Europe
HAPLOGROUP
OR SUBCLUSTERa
ANCESTRAL SEQUENCE TYPE IN
HVS-I
NEAR EASTERN SAMPLE EUROPEAN SAMPLE
No. of Lineages (95%CR for Proportion)
95% CR for Age(YBP) Phylogeny
No. of Lineages in EuropeanSample (95% CR for Proportion)
95% CR for Age(YBP) Phylogeny
HV CRS 376 (.280–.331) 24,300–29,000 Starlike 1,464 (.504–.541) 20,700–22,800 StarlikeH CRS 302 (.222–.270) 23,200–28,400 Starlike 1,300 (.445–.482) 19,200–21,400 StarlikeV 16298 6 (.002–.011) 9,500–43,900 Starlike 128 (.039–.054) 11,100–16,900 StarlikeHV1 16067 29 (.016–.034) 11,300–24,800 Starlike 9 (.002–.006) 22,200–58,300 Starlike
pre-HV 16126-16362 44 (.027–.048) 18,600–31,800 Starlike 12 (.002–.007) 15,400–41,600 StarlikeJ 16069-16126 116 (.079–.112) 42,400–53,700 Non-starlike 261 (.083–.104) 22,000–27,400 Non-starlikeT 16126-16294 121 (.083–.116) 41,900–52,900 Non-starlike 229 (.072–.092) 33,100–40,200 Non-starlike
T1 16126-16163-16186-16189-16294 50 (.031–.053) 16,700–28,400 Starlike 64 (.018–.029) 6,100–12,800 StarlikeU CRS 269 (.196–.242) 50,400–58,300 Starlike 607 (.201–.232) 53,600–58,900 Starlike
K 16224-16311 63 (.040–.065) 15,500–25,500 Non-starlike 159 (.049–.066) 12,900–18,300 Non-starlikeU1a 16189-16249 29 (.016–.034) 17,000–33,100 Starlike 12 (.002–.007) 20,500–49,900 StarlikeU1b 16249-16327 11 (.005–.016) 14,000–40,800 Starlike 2 (.000–.003) 2,400–56,200 StarlikeU2 16129C-16189-16362 10 (.004–.015) 14,000–42,300 Non-starlike 18 (.004–.010) 23,600–48,000 StarlikeU3 16343 62 (.039–.064) 16,300–26,600 Starlike 26 (.006–.014) 11,900–26,800 StarlikeU4 16356 21 (.011–.026) 16,300–35,500 Starlike 84 (.024–.037) 16,100–24,700 Non-starlikeU5 16270 22 (.012–.027) 46,000–75,000 Non-starlike 257 (.081–.103) 45,100–52,800 Non-starlikeU7 16318T 13 (.006–.018) 23,900–53,600 Non-starlike 7 (.001–.005) 11,900–45,400 Non-starlike
N1b 16145-16176G-16223 19 (.010–.024) 8,900–24,900 Starlike 8 (.001–.006) 21,100–59,300 StarlikeI 16129-16223 20 (.011–.025) 32,300–58,400 Non-starlike 59 (.016–.027) 27,200–40,500 Non-starlikeW 16223-16292 20 (.011–.025) 18,000–38,400 Starlike 54 (.015–.025) 17,100–28,400 StarlikeX 16189-16223-16278 36 (.021–.040) 13,700–26,600 Starlike 42 (.011–.020) 17,000–30,000 Starlike
a Subclusters of haplogroups are indented. The less common haplogroups are not shown in this table; they account for 213 of the 1,234 Near Eastern lineages (95% CR p.153–.195) and for 68 of the 2,804 European lineages (95% CR p .019–.031). Also excluded are the northern-Caucasian samples.

Richards et al.: Tracing European Founder mtDNAs 1259
are markedly non-starlike, evidently displaying driftonto rare sequence types, often near the tips of the phy-logenies. Although the Caucasian data are therefore dif-ficult to interpret, the presence there of cluster distri-butions that are similar to those of Europe and the NearEast should caution us that both Europe and the NearEast could have been populated from a third region,perhaps closer to either the extant Caucasian populationor other populations in eastern Europe. More-recent in-cursions from eastern Europe, particularly during theBronze Age, are also likely to have taken place.
Most of the major western-Eurasian clades (Macaulayet al. 1999, table 2) occur in the Near East at a frequencyof >1%. In addition to these, we here define U7 (HVS-I motif 16318T [Kivisild et al. 1999a]), HV1 (HVS-Imotif 16067), and a clade in pre-HV (HVS-I motif16126-16362). We subdivide the haplogroup N definedby 10873T (110871MnlI) (Quintana-Murci et al.1999), which encompasses almost all Eurasian mtDNAs(including haplogroups A, B, F, H–J, K, R, and T–Y)that do not fall into haplogroup M. A subcluster N1,characterized by 10238C (110237HphI), can be iden-tified (Kivisild et al. 1999b) that includes haplogroup Iand that has distinct subclusters: N1a (tentative HVS-Imotif 16147A/G–16172-16223-16248-16355), N1b(probable HVS-I motif 16145-16176G-16223), and N1c(probable HVS-I motif 16223-16265). Another N sub-cluster with HVS-I motif 16223-16257A-16261 has apredominantly eastern-Eurasian distribution. HV1, thespecific clade of pre-HV, N1a–c, and U7 all occur at lowfrequency in the northern-Caucasian sample. If we enu-merate named subclusters of mtDNA clades in the NearEast, Europe, and the Caucasus, we also find more inthe Near East than in either of the other two regions,again supporting a Near Eastern origin for the mainclusters.
The principal exception is cluster V, which seems tohave expanded within Europe ∼13,000 YBP (Torroni etal. 1998). Cluster U5 is an additional unusual case. Al-though U5 occurs at ∼2% in the Near East, its phylo-geography, as we discuss below, suggests that it evolvedmainly within Europe during the past ∼50,000 years.Haplogroups V and U5 occur in the Near East at ∼11%and ∼19%, respectively, of their European frequencies,in most cases as occasional haplotypes that are derivedfrom European lineages. These can be regarded as “er-ratics,” in the same way that African and eastern-Eu-rasian types can be regarded as such in Europe.
Cluster H is the most frequent cluster in the NearEast, as it is in Europe; nevertheless, it is present at afrequency of only 25% (95% CR p .222–.270) in theNear East, compared with 46% (95% CR p.445–.482) in Europeans as a whole. It occurs in thenorthern Caucasus at a frequency of ∼25% (95% CRp .200–.318). It is almost absent in certain popula-
tions, such as the Arabians and the Saami (Sajantila etal. 1995). The age estimate for H in the Near East is23,200–28,400 years. This is significantly older thanits age estimate in Europe (19,200–21,400 years) andperhaps gives an indication of the TMRCA of haplo-group H.
A similar picture emerges with regard to the sisterhaplogroups, T and J, which both date to ∼50,000 YBPin the Near East but more-recent dates in Europe. Clus-ter J reaches its highest frequencies in Arabia (25% inthe Bedouin and Yemeni [95% CR .165–.361]), along-side equally exceptional frequencies of the specific cladewithin pre-HV (22% [95% CR .142–.331]), perhaps asa result of the same founder effects or low populationsizes that appear to have excluded or eliminated clusterH from the Arabian peninsula. Arabia is by far the mostdistinctive region in the Near East, and it is notable thatthe Bedouin and Yemeni populations would appear tohave a common origin, as judged on the basis of theirstriking similarity in unusual cluster frequencies. Hap-logroup U, which is 150,000 years old in the Near Eastand which harbors both specific European (U5), north-ern-African (U6 [Rando et al. 1998; Macaulay et al.1999]), and Indian (U2i [Kivisild et al. 1999a]) com-ponents, each dating to ∼50,000 YBP, occurs in bothArabia and the northern Caucasus and, indeed, through-out the Near East.
There is in the Near East a moderate frequency ofclusters originating in Africa (even when Egypt and Nu-bia—where the frequency of lineages of African originis obviously higher—are excluded from the Near Easternsample): ∼1% L1, ∼1% L2, and !3% African L3* (dis-tinguished from the Eurasian haplogroups M and N, atnucleotide positions 10400 and 10873, respectively[Quintana-Murci et al. 1999]). The cluster M1, usuallyfound in eastern Africa (Passarino et al. 1998; Quintana-Murci et al. 1999), also occurs at !1%. Thus, sub-Sa-haran African input in the Near East amounts to ∼5%,rather less than our estimates of gene flow from Europe.There are also !1% northern-African U6 mtDNAs.
There are even fewer eastern-Eurasian lineages rep-resented, amounting to ∼2% in total: 3 individuals withhaplogroup A, 4 with B, 7 with C (or pre-C), 2 with F,1 from N*, 1 with Y, and 10 additional potential mem-bers of the eastern-Eurasian haplogroup M, some ofwhich may be D (Torroni et al. 1993b). As in the caseof Africa, these are probably attributable to fairly recentgene flow. Most of them would imply incursions fromcentral/eastern Asia, and their occurrence in Turkey,Greece, Bulgaria, and the Caucasus, as well as in boththe Saami and northeastern Europe, implies that theymay be the result of historically attested migrations intothese areas.

1260
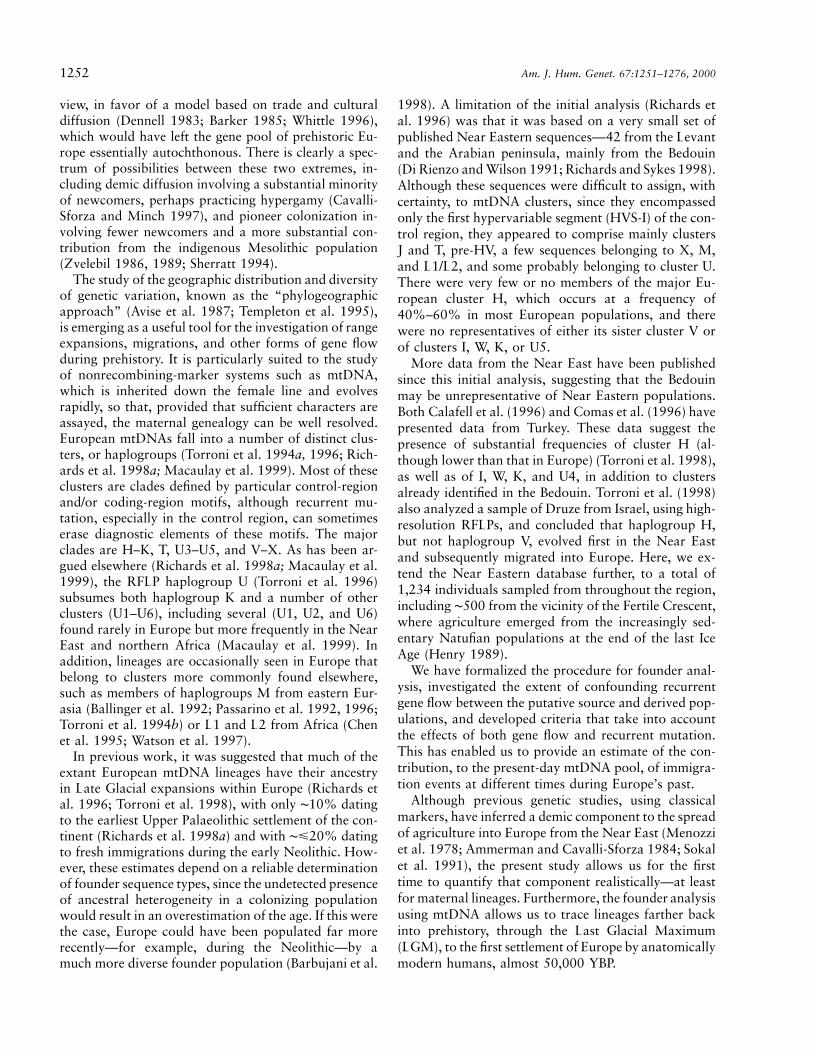
Table 2
Founder Status of All Founder Candidate Sequence Types, under Five Different Criteria
FOUNDER STATUS, FOR CRITERIONa
HAPLOGROUP
OR SUBCLUSTER HVS-I SEQUENCE TYPEbf0 f1 f2 fs fs′
• • • • • H 0• • • • H 16092• H 16092-16311• H 16111• H 16129• H 16172• H 16189• H 16189-16311• H 16212• H 16244• H 16284• H 16289• H 16311• H 16362• H 16192-16304• H 16207-16304• H 16210-16304• • • • • H 16304• H 16304-16327• H 16304-16362• H 16256-16295-16352• • • • • H 16256-16311-16352• • • • • H 16256-16352• • H 16218-16328A• H 16092-16293-16311• • • • H 16293-16311• • H 16291• • H 16162• • • H 16162-16172• H 16148-16256-16319• • H 16256• H 16093-16293• • H 16293• • • • H 16111-16362-16482• H 16129-16362-16482• • • • • H 16362-16482• • H 16093• • • H 16318T• • H 16176• H 16209• • H 16213• H 16218• • H 16192• H 16222• • H 16240• • H 16278• • • • • H 16261• H 16263• • • • H 16274• • H 16286• • H 16287• • • • H 16295• H 16265-16298• • • • H 16298• • H 16354• • H 16355• • • • • H 16234• • • • H 16093-16265• • • • H 16265
(continued)

1261
Table 2 (continued)
FOUNDER STATUS, FOR CRITERIONa
HAPLOGROUP
OR SUBCLUSTER HVS-I SEQUENCE TYPEbf0 f1 f2 fs fs′
• • • H 16150-16192• • H 16248• • • • H 16356• • • • • H 16266• • • • H 16266-16311• H 16266-16311-16362• • H 16145• H 16188G• • • • • H 16288-16362• • • • • H 16357• • • • • HV 0• • • • HV 16129• HV 16129-16221• HV 16172-16311• • HV 16221• • HV 16311• • • • HV 16362• • • • • HV1 16067• • • HV1 16067-16311• • • • HV1 16067-16355• • • • • I 16129-16223• I 16129-16172-16223-16311• • I 16129-16223-16311• • • • I 16129-16223-16311-16362• • • • I 16223-16311• • • • • I 16129-16148-16223• • • • I 16129-16223-16311-16319• • • • I 16129-16223-16270-16311-16319-16362• • • • • J 16069-16126• J 16069-16126-16145• J 16069-16126-16148• J 16069-16126-16189• J 16069-16126-16193-16256-16300-16309• J 16069-16126-16241• • • • J 16069-16126-16300• J 16069-16126-16311• J 16069-16126-16319• J1 16069-16126-16145-16172-16261• • • • • J1 16069-16126-16145-16261• • • • • J1 16069-16126-16261• J1a 16069-16126-16145-16189-16231-16261• • • • • J1a 16069-16126-16145-16231-16261• • • • • J1b 16069-16126-16145-16222-16261• • • • J1b 16069-16126-16145-16222-16261-16274• J1b1 16069-16126-16145-16172-16222-16261• • • • • J2 16069-16126-16193• J2 16069-16126-16193-16278• J2 16069-16126-16193-16311• K 16093-16224-16234-16311• • • K 16189-16224-16311• • K 16224-16234-16311• • • • K 16224-16291-16311• • • K 16224-16304-16311• • • • • K 16224-16311• • K 16093-16189-16224-16311• K 16093-16224• K 16093-16224-16278-16311• • • • • K 16093-16224-16311
• N 16223
(continued)
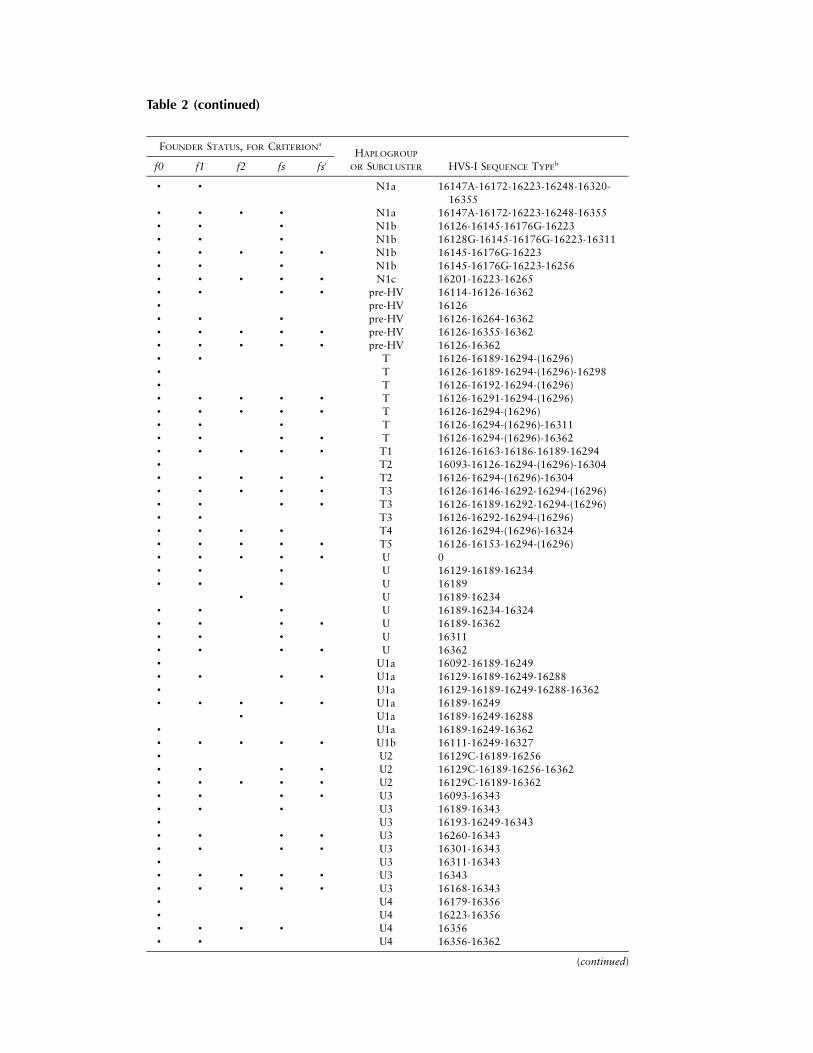
Table 2 (continued)
FOUNDER STATUS, FOR CRITERIONa
HAPLOGROUP
OR SUBCLUSTER HVS-I SEQUENCE TYPEbf0 f1 f2 fs fs′
• • N1a 16147A-16172-16223-16248-16320-16355
• • • • N1a 16147A-16172-16223-16248-16355• • • N1b 16126-16145-16176G-16223• • • N1b 16128G-16145-16176G-16223-16311• • • • • N1b 16145-16176G-16223• • • N1b 16145-16176G-16223-16256• • • • • N1c 16201-16223-16265• • • • pre-HV 16114-16126-16362• pre-HV 16126• • • pre-HV 16126-16264-16362• • • • • pre-HV 16126-16355-16362• • • • • pre-HV 16126-16362• • T 16126-16189-16294-(16296)• T 16126-16189-16294-(16296)-16298• T 16126-16192-16294-(16296)• • • • • T 16126-16291-16294-(16296)• • • • • T 16126-16294-(16296)• • • T 16126-16294-(16296)-16311• • • • T 16126-16294-(16296)-16362• • • • • T1 16126-16163-16186-16189-16294• T2 16093-16126-16294-(16296)-16304• • • • • T2 16126-16294-(16296)-16304• • • • • T3 16126-16146-16292-16294-(16296)• • • • T3 16126-16189-16292-16294-(16296)• • T3 16126-16292-16294-(16296)• • • • T4 16126-16294-(16296)-16324• • • • • T5 16126-16153-16294-(16296)• • • • • U 0• • • U 16129-16189-16234• • • U 16189
• U 16189-16234• • • U 16189-16234-16324• • • • U 16189-16362• • • U 16311• • • • U 16362• U1a 16092-16189-16249• • • • U1a 16129-16189-16249-16288• U1a 16129-16189-16249-16288-16362• • • • • U1a 16189-16249
• U1a 16189-16249-16288• U1a 16189-16249-16362• • • • • U1b 16111-16249-16327• U2 16129C-16189-16256• • • • U2 16129C-16189-16256-16362• • • • • U2 16129C-16189-16362• • • • U3 16093-16343• • • U3 16189-16343• U3 16193-16249-16343• • • • U3 16260-16343• • • • U3 16301-16343• U3 16311-16343• • • • • U3 16343• • • • • U3 16168-16343• U4 16179-16356• U4 16223-16356• • • • U4 16356• • U4 16356-16362
(continued)
Richards et al.: Tracing European Founder mtDNAs 1263
Table 2 (continued)
FOUNDER STATUS, FOR CRITERIONa
HAPLOGROUP
OR SUBCLUSTER HVS-I SEQUENCE TYPEbf0 f1 f2 fs fs′
• • U4 16134-16356• • • U5 16270• • • U5 16270-16296• • • U5a 16187-16192-16270• U5a1 16093-16192-16256-16270-16291• U5a1 16189-16192-16256-16270• • • • U5a1 16192-16256-16270• • • • U5a1 16192-16256-16270-16291• U5a1 16192-16256-16270-16311• • • U5a1a 16189-16256-16270• • • • U5a1a 16256-16270• U5a1a 16256-16270-16295• • U5b 16189-16270• U5b 16189-16270-16311• • U5b1 16144-16189-16270• • • • • U7 16318T• • • • • U7 16309-16318C• • • • • U7 16309-16318T• V 16216-16261-16298• V 16239-16298• • • V 16274-16298• • • V 16298• V 16298-16311• W 16093-16223-16292• W 16129-16223-16292• W 16172-16223-16231-16292• • • • W 16223-16292• • • • W 16223-16292-16295• • W 16192-16223-16292-16325
• • W 16223-16292-16325• X 16093-16189-16223-16278• X 16126-16189-16223-16278• • • X 16189-16223-16248-16278• • • X 16189-16223-16265-16278• • • X 16189-16223-16274-16278• • • • • X 16189-16223-16278• X 16189-16223-16278-16293• • • • X 16189-16223-16278-16344• X 16189-16278
a Founder clusters are indicated by bullets (•).b Parentheses denote that, as discussed in the Subjects and Methods section, nucleotide position 16296
in haplogroup T is unstable, making the state of this position in the founder sequence uncertain. Sequencetypes that are formally founders but whose clusters are empty in the European sample are not included.
Back-Migration from Europe
Recent back-migration can be estimated by an ex-amination of the presence, in the Near East, of clustersthat are most likely to have evolved within Europe. Hap-logroup U5 is very ancient (∼50,000 years old) in bothEurope and the Near East, but it occurs more sporadi-cally in the Near East and is absent from Arabia. In theNear East, it is largely restricted to peripheral popula-tions (Turks, Kurds, Armenians, Azeris, or Egyptians):only three individuals from the core Near Eastern re-gions (namely, the Fertile Crescent and Arabia) harborU5 sequence types; of these, one is the root sequencetype, whereas the other two are members of the highly
derived subcluster U5a1a (for the nomenclature for U5,see table 2). Overall, 8 of 22 Near Eastern U5 types aremembers of this highly derived subcluster, and an ad-ditional 6 are members of the next-most-derived sub-cluster, U5a1*. There are four members of U5b, onemember of U5a*, and only three members of U5*. More-over, these Near Eastern types are frequently derivativesof European intermediate types: one Egyptian type isderived from a Basque type, and many Armenian andAzeri types are derived from European and northern-Caucasian types. Therefore, whereas the U5 root se-quence type (16270) could conceivably have originatedin the Near East and have spread to Europe ∼50,000
1264 Am. J. Hum. Genet. 67:1251–1276, 2000
YBP, with recurrent back-migration ever since, a Euro-pean origin for the U5 cluster seems just as probable. Ineither case, the U5 cluster itself would have evolved es-sentially in Europe. U5 lineages, although rare elsewherein the Near East, are especially concentrated in theKurds, Armenians, and Azeris. This may be a hint of apartial European ancestry for these populations—not entirely unexpected on historical and linguisticgrounds—but may simply reflect their proximity to theCaucasus and the steppes. Of the Near Eastern lineages,1.8% (95% CR p .012–.027) are members of U5, incontrast to 9.1% (95% CR p .081–.103) in Europe; inthe core region of Syria-Palestine through Iraq, the pro-portion falls to 0.5% (95% CR p .002–.015). Overall,this suggests the presence of as much as 20% of back-migrated mtDNA in the Near East but only ∼6% in thecore region.
It seems likely that haplogroup V also originatedwithin Europe and subsequently spread eastward (Tor-roni et al. 1998), although its lower diversity providesless opportunity to differentiate lineages by their ages.A slightly lower figure for back-migration is obtainedwhen V is used: 0.5% (95% CR p .002–.011) of sam-ples in the Near East (in Turkey, Azerbaijan, and Syria)versus 4.6% (95% CR p .039–.054) in Europe, sug-gesting a value of ∼11% back-migrants overall. Again,two-thirds of these back-migrants are in either Turkeyor the southern Caucasus, which reduces the estimatefor the core region to ∼8%. Given the small sample sizesinvolved and the resulting uncertainties in the estimates,these values are in good agreement with the figure es-timated when U5 is used, especially since haplogroup Vis both rarer in eastern Europe (whence much of theback-migration is likely to have originated) than in west-ern Europe (Torroni et al. 1998) and of more recentorigin than U5. Hence, the scale of back-migration isconsiderable. It needs to be taken into account as a majorfactor in the founder analysis and also suggests that itwill be worthwhile to compare a founder analysis basedonly on the core regions versus a founder analysis basedon the Near Eastern data as a whole.
Founder Analysis
Identification of founders.—A total of 2,736 of 2,804lineages in Europe could be assigned to haplogroups ofwestern-Eurasian origin; of the remaining 68, “erratic”lineages, there were likely members of African (19),north-African (6), and eastern-Eurasian (22) clusters, theremainder being either members of R (7), ambiguousbetween (African) L3* and (Eurasian) N* (11), or un-classified (3). Table 2 shows all of the candidate typesfor European founders, as well as their founder statusunder the various founder criteria. There were 210 foun-der-candidate types (referred to as “f0”). Of these, 134
were types shared by Europe and the Near East, and theremaining 76 were inferred matches. A total of 134 foun-ders were identified by use of the f1 criterion; 58 by themore stringent, f2 criterion; and 106 by the more flex-ible, fs criterion. Under the fs criterion only, the roottypes of both haplogroup V and haplogroup U5 wereexcluded as founders. U5 is very likely to be of indig-enous European origin (see above). Within U5, types thatqualified as founders could have back-migrated into theNear East sufficiently long ago to have contributed tosubsequent dispersals into Europe (as, e.g., the root typesof U5a1 or U5a1a), or they may represent cases in whichthe founder criteria have not winnowed out simple back-migrants. U5a1 and U5a1a lineages in Europe may,therefore, have been derived from either indigenous Eu-ropean or redispersing Near Eastern types. (Althoughthis may be true for U5a1a, U5a1 is an implausible foun-der cluster, since its “Near Eastern” distribution is ac-counted for primarily by the southern Caucasus, whereonly a few derived types occur. Since related derivedtypes are also quite common in the northern Caucasus,U5a1 seems likely to have arrived from Europe via thenorthern Caucasus, fairly recently. This being the case,the fs′ analysis would provide a better estimate for theEUP component than would be provided by fs.) Hap-logroup V is also thought likely to have evolved in Eu-rope (Torroni et al. 1998), and, again, a number of theNear Eastern V sequence types could be identified asderivatives of European types. This outcome suggeststhat the fs criterion indeed performs better than thethreshold criteria f1 and f2. The fs′ analysis, performedby applying the fs criterion when the more peripheralNear Eastern populations (Egyptians, Turks, Kurds, Ar-menians, and Azeris) are excluded, resulted in 72founders.
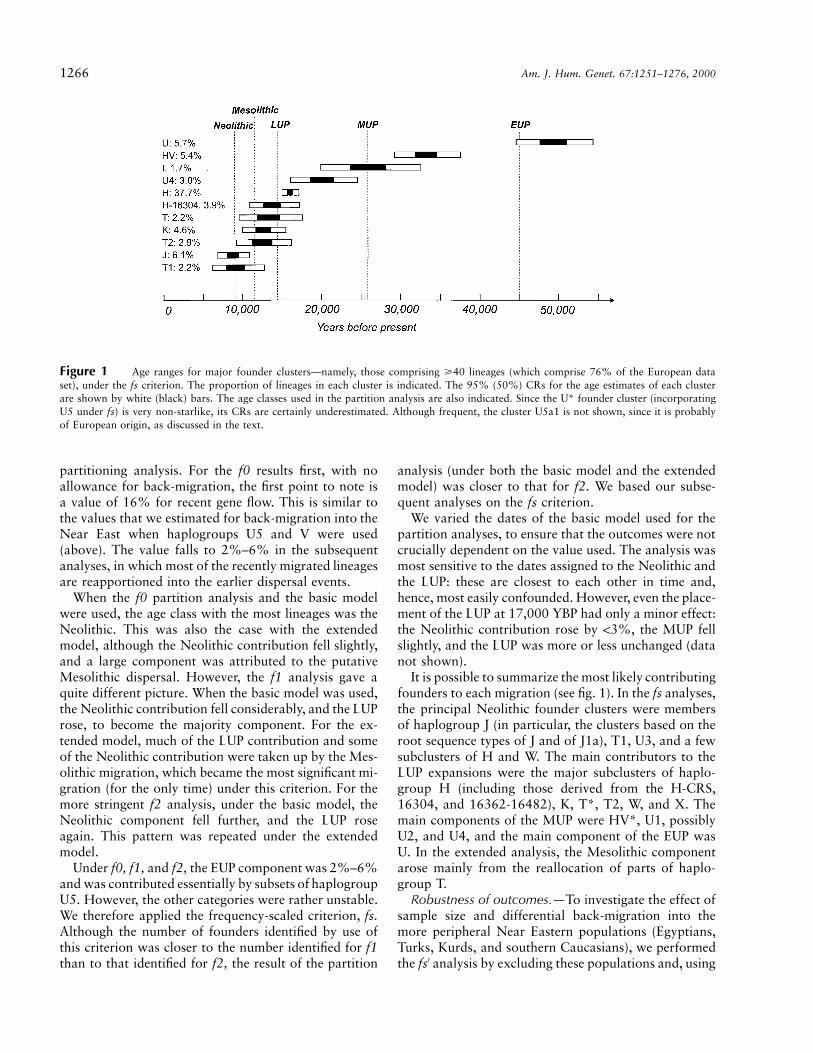
The 95% CRs of the ages of the more common foun-ders under each criterion are given in table 3. Figure 1shows the major founders and also indicates the ageclasses of the migration models. There are two majorfounders associated with the Neolithic (the root typesof J and T1), several with the LUP (the root types of T,T2, and K and the H-16304 type), and several withsomewhat earlier dates through the LUP and MUP (theroot types of H, U4, I, and HV); and the root type ofU is associated with the EUP. Note that, although, inthe partition analysis, the H-CRS founder would befirmly associated with the LUP, it is in fact somewhatolder than the Bølling rewarming, suggesting an earlierMUP immigration as well. It is also worth noting that,although several 95% CRs overlap the Mesolithic, onlyone of the 50% CRs does. The figure therefore providessome provisional support for the age classes in the basicmodel—but rather little support for the extended modelwith a Mesolithic migration.
Partition analyses.—Table 4 shows the results of the
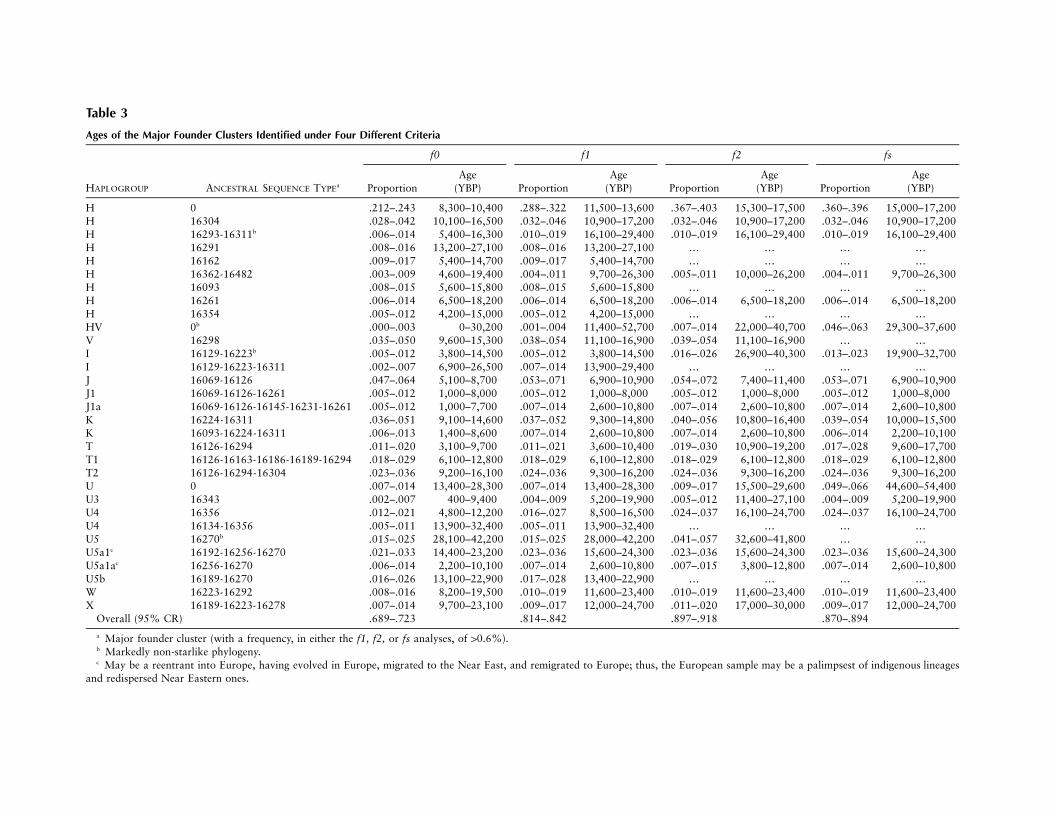
Table 3
Ages of the Major Founder Clusters Identified under Four Different Criteria
HAPLOGROUP ANCESTRAL SEQUENCE TYPEa
f0 f1 f2 fs
ProportionAge
(YBP) ProportionAge
(YBP) ProportionAge
(YBP) ProportionAge
(YBP)
H 0 .212–.243 8,300–10,400 .288–.322 11,500–13,600 .367–.403 15,300–17,500 .360–.396 15,000–17,200H 16304 .028–.042 10,100–16,500 .032–.046 10,900–17,200 .032–.046 10,900–17,200 .032–.046 10,900–17,200H 16293-16311b .006–.014 5,400–16,300 .010–.019 16,100–29,400 .010–.019 16,100–29,400 .010–.019 16,100–29,400H 16291 .008–.016 13,200–27,100 .008–.016 13,200–27,100 … … … …H 16162 .009–.017 5,400–14,700 .009–.017 5,400–14,700 … … … …H 16362-16482 .003–.009 4,600–19,400 .004–.011 9,700–26,300 .005–.011 10,000–26,200 .004–.011 9,700–26,300H 16093 .008–.015 5,600–15,800 .008–.015 5,600–15,800 … … … …H 16261 .006–.014 6,500–18,200 .006–.014 6,500–18,200 .006–.014 6,500–18,200 .006–.014 6,500–18,200H 16354 .005–.012 4,200–15,000 .005–.012 4,200–15,000 … … … …HV 0b .000–.003 0–30,200 .001–.004 11,400–52,700 .007–.014 22,000–40,700 .046–.063 29,300–37,600V 16298 .035–.050 9,600–15,300 .038–.054 11,100–16,900 .039–.054 11,100–16,900 … …I 16129-16223b .005–.012 3,800–14,500 .005–.012 3,800–14,500 .016–.026 26,900–40,300 .013–.023 19,900–32,700I 16129-16223-16311 .002–.007 6,900–26,500 .007–.014 13,900–29,400 … … … …J 16069-16126 .047–.064 5,100–8,700 .053–.071 6,900–10,900 .054–.072 7,400–11,400 .053–.071 6,900–10,900J1 16069-16126-16261 .005–.012 1,000–8,000 .005–.012 1,000–8,000 .005–.012 1,000–8,000 .005–.012 1,000–8,000J1a 16069-16126-16145-16231-16261 .005–.012 1,000–7,700 .007–.014 2,600–10,800 .007–.014 2,600–10,800 .007–.014 2,600–10,800K 16224-16311 .036–.051 9,100–14,600 .037–.052 9,300–14,800 .040–.056 10,800–16,400 .039–.054 10,000–15,500K 16093-16224-16311 .006–.013 1,400–8,600 .007–.014 2,600–10,800 .007–.014 2,600–10,800 .006–.014 2,200–10,100T 16126-16294 .011–.020 3,100–9,700 .011–.021 3,600–10,400 .019–.030 10,900–19,200 .017–.028 9,600–17,700T1 16126-16163-16186-16189-16294 .018–.029 6,100–12,800 .018–.029 6,100–12,800 .018–.029 6,100–12,800 .018–.029 6,100–12,800T2 16126-16294-16304 .023–.036 9,200–16,100 .024–.036 9,300–16,200 .024–.036 9,300–16,200 .024–.036 9,300–16,200U 0 .007–.014 13,400–28,300 .007–.014 13,400–28,300 .009–.017 15,500–29,600 .049–.066 44,600–54,400U3 16343 .002–.007 400–9,400 .004–.009 5,200–19,900 .005–.012 11,400–27,100 .004–.009 5,200–19,900U4 16356 .012–.021 4,800–12,200 .016–.027 8,500–16,500 .024–.037 16,100–24,700 .024–.037 16,100–24,700U4 16134-16356 .005–.011 13,900–32,400 .005–.011 13,900–32,400 … … … …U5 16270b .015–.025 28,100–42,200 .015–.025 28,000–42,200 .041–.057 32,600–41,800 … …U5a1c 16192-16256-16270 .021–.033 14,400–23,200 .023–.036 15,600–24,300 .023–.036 15,600–24,300 .023–.036 15,600–24,300U5a1ac 16256-16270 .006–.014 2,200–10,100 .007–.014 2,600–10,800 .007–.015 3,800–12,800 .007–.014 2,600–10,800U5b 16189-16270 .016–.026 13,100–22,900 .017–.028 13,400–22,900 … … … …W 16223-16292 .008–.016 8,200–19,500 .010–.019 11,600–23,400 .010–.019 11,600–23,400 .010–.019 11,600–23,400X 16189-16223-16278 .007–.014 9,700–23,100 .009–.017 12,000–24,700 .011–.020 17,000–30,000 .009–.017 12,000–24,700
Overall (95% CR) .689–.723 .814–.842 .897–.918 .870–.894
a Major founder cluster (with a frequency, in either the f1, f2, or fs analyses, of 10.6%).b Markedly non-starlike phylogeny.c May be a reentrant into Europe, having evolved in Europe, migrated to the Near East, and remigrated to Europe; thus, the European sample may be a palimpsest of indigenous lineages
and redispersed Near Eastern ones.
1266 Am. J. Hum. Genet. 67:1251–1276, 2000
Figure 1 Age ranges for major founder clusters—namely, those comprising >40 lineages (which comprise 76% of the European dataset), under the fs criterion. The proportion of lineages in each cluster is indicated. The 95% (50%) CRs for the age estimates of each clusterare shown by white (black) bars. The age classes used in the partition analysis are also indicated. Since the U* founder cluster (incorporatingU5 under fs) is very non-starlike, its CRs are certainly underestimated. Although frequent, the cluster U5a1 is not shown, since it is probablyof European origin, as discussed in the text.
partitioning analysis. For the f0 results first, with noallowance for back-migration, the first point to note isa value of 16% for recent gene flow. This is similar tothe values that we estimated for back-migration into theNear East when haplogroups U5 and V were used(above). The value falls to 2%–6% in the subsequentanalyses, in which most of the recently migrated lineagesare reapportioned into the earlier dispersal events.
When the f0 partition analysis and the basic modelwere used, the age class with the most lineages was theNeolithic. This was also the case with the extendedmodel, although the Neolithic contribution fell slightly,and a large component was attributed to the putativeMesolithic dispersal. However, the f1 analysis gave aquite different picture. When the basic model was used,the Neolithic contribution fell considerably, and the LUProse, to become the majority component. For the ex-tended model, much of the LUP contribution and someof the Neolithic contribution were taken up by the Mes-olithic migration, which became the most significant mi-gration (for the only time) under this criterion. For themore stringent f2 analysis, under the basic model, theNeolithic component fell further, and the LUP roseagain. This pattern was repeated under the extendedmodel.
Under f0, f1, and f2, the EUP component was 2%–6%and was contributed essentially by subsets of haplogroupU5. However, the other categories were rather unstable.We therefore applied the frequency-scaled criterion, fs.Although the number of founders identified by use ofthis criterion was closer to the number identified for f1than to that identified for f2, the result of the partition
analysis (under both the basic model and the extendedmodel) was closer to that for f2. We based our subse-quent analyses on the fs criterion.
We varied the dates of the basic model used for thepartition analyses, to ensure that the outcomes were notcrucially dependent on the value used. The analysis wasmost sensitive to the dates assigned to the Neolithic andthe LUP: these are closest to each other in time and,hence, most easily confounded. However, even the place-ment of the LUP at 17,000 YBP had only a minor effect:the Neolithic contribution rose by !3%, the MUP fellslightly, and the LUP was more or less unchanged (datanot shown).
It is possible to summarize the most likely contributingfounders to each migration (see fig. 1). In the fs analyses,the principal Neolithic founder clusters were membersof haplogroup J (in particular, the clusters based on theroot sequence types of J and of J1a), T1, U3, and a fewsubclusters of H and W. The main contributors to theLUP expansions were the major subclusters of haplo-group H (including those derived from the H-CRS,16304, and 16362-16482), K, T*, T2, W, and X. Themain components of the MUP were HV*, U1, possiblyU2, and U4, and the main component of the EUP wasU. In the extended analysis, the Mesolithic componentarose mainly from the reallocation of parts of haplo-group T.
Robustness of outcomes.—To investigate the effect ofsample size and differential back-migration into themore peripheral Near Eastern populations (Egyptians,Turks, Kurds, and southern Caucasians), we performedthe fs′ analysis by excluding these populations and, using

Richards et al.: Tracing European Founder mtDNAs 1267
Table 4
Percentage, of Extant European mtDNA Pool, Derived, in Each Migration Event, from Near Eastern Founder Lineages
MIGRATION EVENT
MEAN 5 ROOT-MEAN-SQUARE ERROR, OF CONTRIBUTION, FOR CRITERIONa
(%)
f0 f1 f2 fs fs′ fsr
Basic model:Bronze Age/recent 16.3 5 1.2 5.9 5 1.2 2.6 5 .7 4.0 5 .9 2.7 5 .7 7Neolithic 48.5 5 3.5 21.8 5 3.1 12.4 5 1.6 13.3 5 2.0 11.9 5 1.9 23LUP 25.1 5 3.5 58.8 5 3.4 63.7 5 2.6 58.8 5 2.8 55.4 5 1.9 36MUP 5.8 5 1.5 9.3 5 2.1 12.8 5 2.3 14.6 5 2.2 11.0 5 .9 25EUP 1.8 5 1.0 1.7 5 1.0 6.0 5 .7 6.9 5 .5 16.5 5 .5 7
Extended model:Bronze Age/recent 15.2 5 1.2 5.1 5 1.2 2.4 5 .8 3.6 5 .9 2.5 5 .7 6Neolithic 41.5 5 3.0 16.5 5 2.8 10.1 5 2.5 10.7 5 2.6 9.7 5 2.5 18Mesolithic 18.5 5 4.1 45.2 5 5.9 9.6 5 4.6 10.8 5 4.0 9.5 5 4.0 19LUP 15.4 5 3.6 20.3 5 5.8 56.9 5 4.5 51.2 5 4.0 48.6 5 3.5 23MUP 5.3 5 1.5 8.8 5 2.1 12.6 5 2.3 14.4 5 2.2 10.8 5 .9 25EUP 1.7 5 1.0 1.6 5 1.0 6.0 5 .7 6.8 5 .5 16.5 5 .5 7
a Calculated as described in the Subjects and Methods section. No error estimates are shown for fsr because the (intuitivelylarge) uncertainty introduced by the repartitioning process is hard to assess. Some (2.4%) of lineages (“erratics”) were notassigned to founders and account for the remainder for each criterion; they are either the result of recent east Eurasian orAfrican admixture or are rare types that could not be classified.
the remaining 577 Near Eastern samples, repeating thefounder analysis. As table 4 shows, the results are re-markably similar to those derived from use of the com-plete data set, with the exception of the EUP category,which grows slightly at the expense of the others (sinceseveral haplogroups, including U4 and W, lose founderstatus and, hence, gain time depth within Europe). Thissuggests that our sample size is likely to be adequateand that most important founders have been identified.
Multiple migrations.—To try to address the problemof possible multiple dispersals of lineages bearing the H-CRS, we partitioned the fs data into migration classes,with the H-CRS cluster omitted (the fsr analysis). Wethen repartitioned the H-CRS cluster (out of the LUPclass, where it is placed when a single migration is as-sumed) into other feasible age categories (i.e., recent,Neolithic, and MUP; EUP is earlier than the estimatedage of the H-CRS). The results are shown in table 4.The Neolithic component rises to 23% (in the basicmodel), and lineages are also partitioned more evenlybetween LUP and MUP. Therefore the main implicationsof reexpansion of the H-CRS, when this crude extrap-olation from more–easily characterized lineages areused, would be a moderate rise in the Neolithic and MUPcontributions and a concomitant fall in the LUP.
Regional analyses.—To examine the data for regionalpatterns, we performed the analysis region by region,using the fs criterion. The results are shown in table 5.Strikingly, although the level of recent gene flow surviv-ing under this criterion is similar for most populations,at 5%–9%, the eastern-Mediterranean region (samplesfrom Thessaloniki, Sarakatsani, and Albanians) has avery high value, 20%. This may reflect the heavy his-
torical gene flow known between Greece and other pop-ulations of the eastern Mediterranean.
With respect to their Neolithic components, theregions fall into several groups. The southeastern, north-central, Alpine, northeastern, and northwestern regionsof Europe have the highest components (15%–22%).The Mediterranean zone has a consistently lower (9%–12%) Neolithic component, suggesting that Neolithiccolonization along the coast had a demographic impactless than that which resulted from the expansions incentral Europe. Scandinavia has a similarly low value,and the Basque Country has the lowest value of all, only7%.
The LUP values are, by contrast, higher toward thewest: the western Mediterranean, the Basque Country,and the northwestern, north-central, Scandinavian, andAlpine regions of Europe have 52%–59% LUP, with thecentral-Mediterranean region having a value of almost50%. The MUP values are perhaps highest in the Med-iterranean zone, especially the central Mediterranean re-gion. The EUP values are highest in Scandinavia, theBasque Country, and northeastern Europe.
Discussion
Assumptions of the Founder Analysis
Several previous studies have applied the basic prin-ciples of founder analysis to human mtDNA variationin America (Torroni et al. 1992, 1993a) and in the Pacific(Stoneking and Wilson 1989; Stoneking et al. 1992; Sy-kes et al. 1995; Richards et al. 1998b). The use of Y-chromosome variation for founder analysis of data from
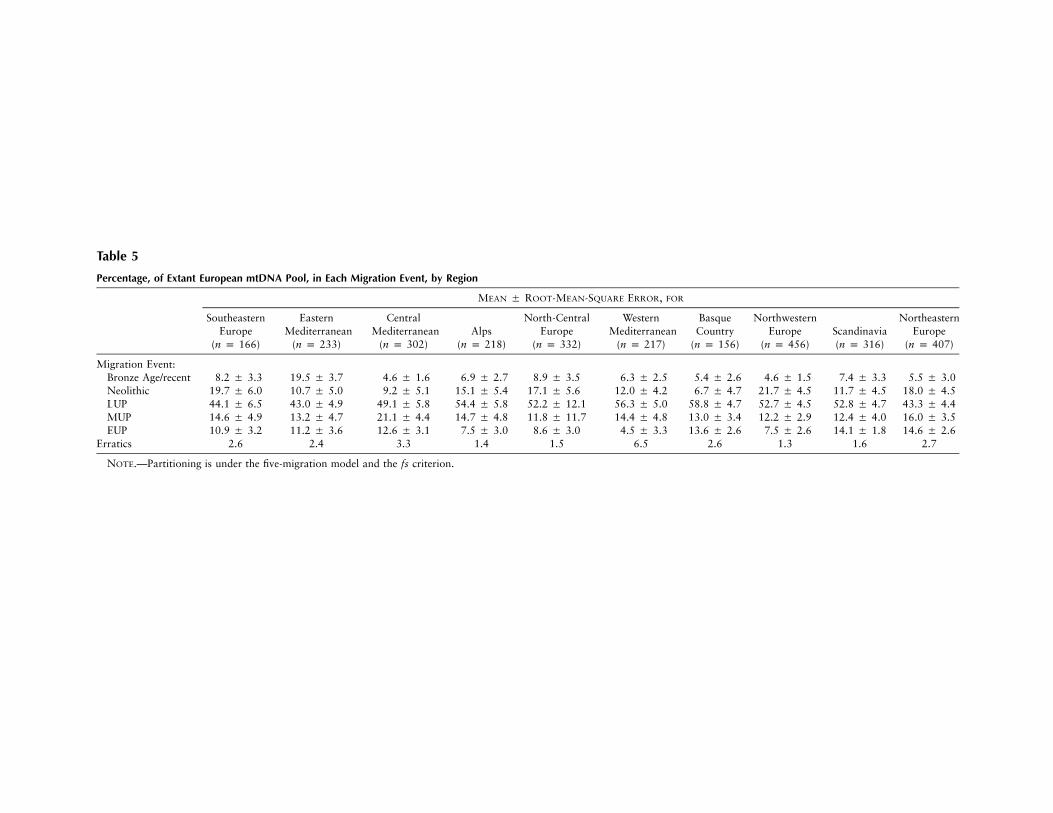
Table 5
Percentage, of Extant European mtDNA Pool, in Each Migration Event, by Region
MEAN 5 ROOT-MEAN-SQUARE ERROR, FOR
SoutheasternEurope
(n p 166)
EasternMediterranean
(n p 233)
CentralMediterranean
(n p 302)Alps
(n p 218)
North-CentralEurope
(n p 332)
WesternMediterranean
(n p 217)
BasqueCountry
(n p 156)
NorthwesternEurope
(n p 456)Scandinavia(n p 316)
NortheasternEurope
(n p 407)
Migration Event:Bronze Age/recent 8.2 5 3.3 19.5 5 3.7 4.6 5 1.6 6.9 5 2.7 8.9 5 3.5 6.3 5 2.5 5.4 5 2.6 4.6 5 1.5 7.4 5 3.3 5.5 5 3.0Neolithic 19.7 5 6.0 10.7 5 5.0 9.2 5 5.1 15.1 5 5.4 17.1 5 5.6 12.0 5 4.2 6.7 5 4.7 21.7 5 4.5 11.7 5 4.5 18.0 5 4.5LUP 44.1 5 6.5 43.0 5 4.9 49.1 5 5.8 54.4 5 5.8 52.2 5 12.1 56.3 5 5.0 58.8 5 4.7 52.7 5 4.5 52.8 5 4.7 43.3 5 4.4MUP 14.6 5 4.9 13.2 5 4.7 21.1 5 4.4 14.7 5 4.8 11.8 5 11.7 14.4 5 4.8 13.0 5 3.4 12.2 5 2.9 12.4 5 4.0 16.0 5 3.5EUP 10.9 5 3.2 11.2 5 3.6 12.6 5 3.1 7.5 5 3.0 8.6 5 3.0 4.5 5 3.3 13.6 5 2.6 7.5 5 2.6 14.1 5 1.8 14.6 5 2.6
Erratics 2.6 2.4 3.3 1.4 1.5 6.5 2.6 1.3 1.6 2.7
NOTE.—Partitioning is under the five-migration model and the fs criterion.
Richards et al.: Tracing European Founder mtDNAs 1269
America also has begun (Ruiz Linares et al. 1996; Kar-afet et al. 1999). Both situations are thought to be likelyto be amenable to such an analysis, in that they haverelatively well-defined source regions, only one majordispersal event, and probably minimal postsettlementgene exchange with those regions (although they un-doubtedly are more complex than usually is supposed;see Terrell 1986).
Europe clearly presents a more difficult case. The timedepth is such that it is unclear whether the Near Eastrepresents a suitable source population stretching backprior to the LGM. Settlement seems likely to have oc-curred in multiple waves from the east and to have beensubsequently obscured by millennia of recurrent geneflow. There may well have been significant levels of geneflow throughout Eurasia, from the Upper Palaeolithic tothe present, particularly during the Holocene (the “Ho-locene filter”), which would obscure the signals of earlierdispersals. The problem is particularly acute for the NearEast, since the latter forms the junction between threecontinents. Therefore, it is important to take into ac-count recurrent gene flow when a founder analysis ofEurope is performed.
Sample size may also be an issue. Despite a source-population sample (n p 1,234) much larger than hasbeen used in all previous studies, there are reasons to becautious. Both the higher diversity and degree of sub-structure in the Near East, in comparison with Europe,and the greater number of potential founder lineagesraise the possibility that some founders may be missedin the sampling.
Our aim was to identify the principal founder lineagesthat have entered Europe and to date the times of theirentry, in order to quantify the contribution that the mainepisodes of new settlement during European prehistoryhave made to the modern mtDNA pool. As regularlyhas been pointed out (e.g., see Barbujani et al. 1998),the divergence time estimated on the basis of the geneticdiversity of the population as a whole will not, in gen-eral, indicate the time of settlement. This is because someof the preexisting diversity of the source population isexpected to be carried into the derived population, sothat some of the earlier branches in the genealogy willhave been generated in the former rather than in thelatter. The founder methodology is intended to take intoaccount the presence of ancestral heterogeneity in thefounding population. The principle is to sample exten-sively from the likely source population and to identifymatching lineages between the source population andthe derived population. The diversity in the derived pop-ulation can then be corrected to allow for the preexistingdiversity generated before the founder event. However,several assumptions that are involved when this is at-tempted should be made explicit:
1. We assume that the Near East was the sourceregion for most of the genetic variation extant in Eu-rope. For the Neolithic, this assumption is readily jus-tified on archaeological grounds (Henry 1989; Harris1996); it is much less secure as one goes farther backin time, although archaeologists have argued in favorof a Near Eastern origin for the EUP, and it is evenpossible that the Aurignacian industry may havespread from the Levant and Anatolia (Gilead 1991;Mellars 1992; Olszewski and Dibble 1994; Bar-Yosef1998). Analyses of classical genetic markers have alsoindicated expansions from the Near East, albeit alsofrom eastern Europe (Cavalli-Sforza et al. 1994). Theraw age estimates for the major clusters in Europe andthe Near East are consistent with this assumption,since they indicate that the clusters are at least asold—and, in some cases, considerably older—in theNear East compared with Europe. However, we can-not rule out the possibility that significant dispersalsmay have originated not in the Near East but in eitherthe northern Caucasus or eastern Europe, as has beensuggested for the MUP (Soffer 1987). Given the highlevels of drift that have occurred in the northern Cau-casus (which have resulted in markedly non-starlikephylogenies for most haplogroups), our present sam-ple size of 208 is insufficient for realistic estimationof the age of the various haplogroups.
2. We assume that the Near East and Europe canbe meaningfully considered as well-separated popu-lations. This overlooks the extreme proximity ofGreece and Turkey, for example. In fact, the historicalevidence for gene flow between Europe and the NearEast provides strong grounds for assuming that thereis at least some back-migration from Europe acrossthe Bosporus—or, farther east, across the Caucasusinto the Near East—throughout the past 10,000 years.Candidates include the Philistine migrations from theAegean into the Levant during the Bronze Age (Kuhrt1995; Tubb 1998); the expansion of Greek, Phrygian,and Armenian speakers into western Anatolia, cen-tral Anatolia, and Armenia, respectively, ∼1,200 B.C.(Redgate 1998); and the importation of European aswell as African slaves by the Islamic caliphs of Syriaand Iraq during the medieval period (Lewis 1998).Recurrent gene flow would raise the number ofmatches between the two regions—and would reducethe estimated divergence times. That said, the level ofrecurrent gene flow has certainly not been largeenough to equilibrate the European and Near EasternmtDNA pools. However, the question of back-migra-tion is one of the major challenges for this analysis,a challenge that we have addressed by demandingfurther evidence—that is, more evidence than merelythe existence of a shared node in the phylogeny—ofa Near Eastern origin for any founder candidate.

1270 Am. J. Hum. Genet. 67:1251–1276, 2000
3. A further assumption for the founder method-ology is the infinite-alleles model—that is, that recur-rent mutation is not a disturbing factor. In fact, par-allel mutation and back-mutation are an importantforce in mtDNA, especially in the control region (Has-egawa et al. 1993), a force that, again, will artificiallyraise the number of matches between the two regions,thereby acting to reduce the divergence times. Ourfounder criteria again endeavor to address this issueby attributing an independent origin to recently de-rived shared types.
4. The method assumes that most of the foundinglineages have survived in the source population andthat they have all been sampled. For a region as ge-netically diverse as the Near East, this assumptionmay be problematic, even with the sample of 11,200presented here. Failure to identify important foun-ders would increase the estimated age of the founderevents. A recent founder analysis of Icelandic mtDNAmakes this point well (Helgason et al. 2000). Thesparseness of Near Eastern data previously availablewas a handicap for previous studies of the settlementof Europe (Richards et al. 1996; Barbujani et al. 1998;Renfrew 1998). However, several lines of reasoningsuggest that we may have identified the majority ofimportant founders by use of the present, larger-scaleanalysis. First, one argument against equating the Ice-landic settlement with the European (Neolithic) foun-der scenario is that in the former case there likely waspunctuated displacement of some unknown popula-tion(s), whereas in the latter case the expansion (inboth range and head count) affected a large territoryin the source, as well as in the settled areas, so thatfounders should be much easier to identify. Second,by employing a phylogenetic approach to the identi-fication of founder candidates, rather than simplyscreening for sequence matches, we identify many can-didate nodes in the network, even if they are unsam-pled. Third, although we have identified a large num-ber of founders, we also have identified a similarlylarge number of likely back-migrants, using ourscreening criteria. In comparison with major foundertypes, back-migrants are likely to be rare in the sourcepopulation, having typically arrived in the populationmore recently and at low frequency; this suggests thatfurther searching would tend to uncover more back-migrants than genuine founder lineages. Furthermore,the outcome of our partitioning analysis was very littleaffected when we excluded a large proportion (∼50%)of the Near Eastern sample: Egyptians, Turks, Kurds,Armenians, and Azeris. This implies both that thesample is adequate and that the presence of peripheraland intermediate populations in the Near East has notunduly skewed the results.
5. It is an implicit assumption of the founder anal-
ysis that each founder type is involved in only a singlemigration. If the same founder type were involved intwo migrations, the estimated age of the founder inthe derived population would be sometime betweenthe age of the two events. However, if there were morethan two migrations, the problem would become moreacute. In practice, this is only likely to be a problemin the case of the CRS-derived founder cluster in hap-logroup H. When only HVS-I data, a minimum ofdiagnostic RFLP sites, and, when available, HVS-IIdata are used, this part of the mtDNA genealogy isnot well resolved. The H-CRS sequence type, whichis as much as 30,000 years old, represents 6% of theNear Eastern lineages and 16% of the European line-ages, and the H-CRS cluster in the fs analysis amountsto 38% of the European lineages. Other founder typeswere either infrequent in the Near East or insuffi-ciently old to have contributed to more than two con-secutive dispersals. Our response to this difficultytherefore focused on the H-CRS founder, exploringhow the outcome was effected by repartitioning thiscluster in the proportions exhibited by the remainderof the data.
6. With regard to the formation of the distinct pop-ulations, the method also assumes a model in whichonly a limited number of types are transferred, duringeach successive phase of settlement. The outcome inthe present day is a genetic palimpsest. This contrastswith the model of sequential population splits, whichis often assumed in classical population genetics (e.g.,see Cavalli-Sforza et al. 1994). Simulations (notshown) suggest that, as the initial size of the derivedpopulation approaches that of the source population,the founder methodology will overestimate the diver-gence time of clusters in the derived population, sincethe number of founders would become too large tobe adequately sampled. Several features of worldwidemtDNA diversity patterns imply support for strongfounder effects during colonization—for example,during the late-Pleistocene movement of anatomicallymodern humans out of Africa (Watson et al. 1997;Quintana-Murci et al. 1999) and during the coloni-zation of Oceania from Indonesia (Redd et al. 1995;Sykes et al. 1995; Richards et al. 1998b).
7. These assumptions are, of course, in addition tothe usual problems associated with genetic dating.These problems include the rate of mutation and thedependence of the variance on the demographic his-tory, as reflected in the shape of the genealogy. It hasbeen argued elsewhere that the mutation rate is wellsupported (Macaulay et al. 1997), and, since we areusually dating very starlike mtDNA phylogenies whendealing with European founder candidates, the dem-ographic-variance issue may not be a major problemfor the dating of most pan-European clusters. For
Richards et al.: Tracing European Founder mtDNAs 1271
some minor non-starlike clusters, such as I, J1b, andJ2 in Europe, the variance of these time estimates iscertainly underestimated. Furthermore, it is quite pos-sible that the phylogeny of a small cluster could appearstarlike and yet that the underlying genealogy couldbe markedly structured, since the phylogeny may re-solve only a small fraction of the underlying geneal-ogy; in such a case, although r would be an unbiasedestimator of the TMRCA of the sample, the variancewould again be underestimated.
Migration into the Near East
We have employed a novel method to identify andquantify back-migration from Europe and the Near East.We have done this by identifying two European hap-logroups (i.e., U5 and V) that appear to have evolvedin situ. Extrapolating from the frequency of these clus-ters in the Near East has provided us with estimates forback-migration in general. These are strikingly high. Weestimate that 10%–20% of extant Near Eastern lineageshave a European ancestry, although this estimate fallsto 6%–8% for the core zone of the Fertile Crescent. Thiscontrasts with estimates of ∼5% for sub-Saharan Africanlineages and only ∼2% for lineages originating in easternEurasia. It emphasizes the importance of taking back-migration from Europe into account when colonizationtimes are estimated by founder analysis.
Distribution of European Colonization Times
We first performed a naive founder analysis, using allfounder candidates (f0). Although this analysis makesno allowance whatsoever for back-migration, the resultfrom the partition analysis is interesting for what it doesnot show. Even this analysis attributes only 49% of ma-ternal lineages to the Neolithic expansion, contradictingextreme Neolithic demic-diffusion–replacement viewssuch as those of Chikhi et al. (1998a). Even when weallow for multiple dispersals of the H-CRS, by reparti-tioning this cluster within Europe, the analysis yields aNeolithic component of only slightly 150% (data notshown).
The Neolithic components in the f1, f2, and fs analyseswere 22%, 12%, and 13%, respectively; the fsr valuereaches 23% when possible multiple migrations of theH-CRS are allowed. This robustness to differing criteriafor the exclusion of back-migration and recurrent mu-tation suggests that the Neolithic contribution to theextant mtDNA pool is probably on the order of 10%–20% overall. Our regional analyses support this, withvalues of ∼20% for southeastern, central, northwestern,and northeastern Europe. The principal clusters involvedseem to have been most of J, T1, and U3, with a possibleH component. This would suggest that the early-Neo-
lithic LBK expansions through central Europe did indeedinclude a substantial demic component, as has been pro-posed both by archaeologists and by geneticists (Am-merman and Cavalli-Sforza 1984; Sokal et al. 1991).Incoming lineages, at least on the maternal side, werenevertheless in the minority, in comparison with indig-enous Mesolithic lineages whose bearers adopted thenew way of life. This does not exclude the possibilitythat acculturation occurred principally in southeast-ern Europe and that there was considerable replacementin central Europe. The Mesolithic component is evenhigher along the Mediterranean coastline, where ar-chaeologists have suggested Neolithic pioneer coloni-zation of uninhabited coastal areas by boat and a de-veloping patchwork of coexisting Mesolithic andNeolithic communities for several millennia (Zilhao1993, 1998). The Neolithic component here is ∼10%.It is similar in Scandinavia, where, again, the develop-ment of the Neolithic was very late and the impact ofnewcomers likely was slight. It is lowest of all, as mightbe expected, in the Basque Country (7%), although thepresence of a number of rare European types at elevat-ed frequency in the Basques points to the action of ge-netic drift in the region, as well as to a lack of Neolithicsettlement. It is worth noting that the consistency be-tween these results and the evidence of archaeology pro-vides additional support for the founder methodology.Our analyses provide little support for Mesolithic dis-persals into Europe after the Younger Dryas glacial in-terlude, suggesting that, if they occurred at all, theyprobably were limited to ∼10% of the total.
The new analyses confirm that the greatest impact onthe modern mtDNA pool was migration during the LUP.The regional analyses lend some support to the sugges-tion that much of western and central Europe was re-populated largely from the southwest when the climateimproved, as has been suggested, on both archaeological(Housley et al. 1997) and genetic (Torroni et al. 1998)grounds, by previous studies. The LUP component ishighest in western and central Europe and is slightlylower to the north and east. However, allowing for mul-tiple dispersals modifies the picture somewhat. The LUPcomponent is on the order of 45%–60% of extant line-ages in the fs analysis but falls to ∼36% if the H-CRSis repartitioned to allow for possible multiple expan-sions. The lineages involved include much of the mostcommon haplogroup, H, as well as much of K, T, W,and X.
Whether there were migrations of H into Europe fromthe east during the LUP is unclear, but, despite the as-sumptions of the founder analysis, such immigrationsseem unlikely to constitute the main LUP component,for several reasons. First, there is little or no archaeo-logical evidence for expansions from the Near East dur-ing the Late Glacial period, and there is strong evidence
1272 Am. J. Hum. Genet. 67:1251–1276, 2000
for major demographic expansions from core areas insouthwestern Europe and probably also central andsoutheastern Europe (Jochim 1987; Soffer 1987; Hous-ley et al. 1997). Second, haplogroup V, the sister clusterof H within HV, appears to have evolved within Europe,possibly in the southwest, and to have expanded withthe LUP component (Torroni et al. 1998). Finally, theLUP component is most common in the west (the west-ern-Mediterranean region, the Basque Country, andnorthwestern Europe), substantiating its western origin.
Although a Near Eastern refugium giving rise to freshEuropean immigration after the LGM is not impossible,the dates for the major founders of H (especially the H-CRS, 16304, and 16362-16482) can be readily ex-plained if bottlenecks in Europe at the LGM were suf-ficiently dramatic to partially erase preexisting diversity.The fact that the overall age of the European H-CRScluster in the f2 and fs analyses is somewhat greater thanthe LUP date of, for example, haplogroup V and theH–16304, K, and T founder clusters, might also supportthis suggestion. Fortunately, this hypothesis is testable.We can date the H-CRS founder cluster in mainlandItaly, where continuity would be expected between MUPpopulations and LUP populations (Bietti 1990; Leigh-ton 1999). In this region, the Late Glacial–expansioncluster V (Torroni et al. 1998) is rare, and a founderanalysis suggests a date of ∼24,000 YBP (95% CR p16,400–32,900) for the H-CRS cluster—markedly olderthan the age for the continent overall. This is supportedby the regional analysis shown in table 5, in which thecentral-Mediterranean region has the greatest MUPcomponent outside the Caucasus, where continuity mayalso be anticipated (Dolukhanov 1994). It seems plau-sible, then, that many founders of haplogroup H—and,possibly, founders from other haplogroups dating to theLUP, such as much of K, T, W, and X—may have (a)arrived prior to the LGM, (b) suffered reductions indiversity, as a result of population contractions at theonset of the LGM, and (c) subsequently reexpanded.
As we move back in time, the picture becomes lessclear. The value for the MUP is rather low in the basicfs analysis, at ∼10%–15%, and is highest along the Med-iterranean, especially in the central-Mediterranean re-gion. However, after allowance is made for multiple ex-pansions of the H-CRS, it rises to ∼25% overall. Thecontributing clusters are mainly HV*, I, U4, and (in therepartitioned version) H. For the first settlement of Eu-rope, at least, the picture seems to be clearer. The re-gional EUP component varies 5%–15% and comprisesmainly haplogroup U5. The values are highest in south-ern and eastern Europe, as well as in Scandinavia andthe Basque Country.
These analyses allow us to quantify the effects thatvarious prehistoric processes have had on the compo-sition of the modern mtDNA pool of Europe. They sug-
gest that !10% of extant lineages date back to the firstcolonization of Europe by anatomically modern humansand that ∼20% arrived during the Neolithic. Most ofthe other lineages seem most likely to have arrived dur-ing the MUP and to have reexpanded during the LUP.Given the uncertainties associated with the analyses, weshould not rule out the possibility of a Mesolithic mi-gration, but we have found virtually no evidence sup-porting this idea. The results of our study are consistentwith the archaeological evidence but, nevertheless, areinteresting for the low values obtained for the demiccomponent of the Neolithic expansion. Classical anal-yses, which were the first that used genetic data to predictcolonization from the Near East (Ammerman and Cav-alli-Sforza 1984; Sokal et al. 1991; Cavalli-Sforza et al.1994), have often been interpreted as implying a ma-jority Neolithic input, but the identification of relativelyfew markers showing northwest-southeast clines (e.g.,see Sokal et al. 1989) seems to be consistent with themtDNA picture. Indeed, Cavalli-Sforza and Minch(1997) also have recently interpreted the low proportionof variance associated with the first principal componentfor classical markers (26%) as implying a minority con-tribution from the Neolithic newcomers. It remains tobe seen whether similar results will be obtained by per-forming such analyses on Y-chromosome data, prelim-inary analyses of which have indicated northwest-south-east clines (Semino et al. 1996; Casalotti et al. 1999).Nevertheless, particularly in view of the possibility ofhypergamy (in which case, the mtDNA picture mightsomewhat underestimate the overall Neolithic geneticcontribution; see Cavalli-Sforza and Minch 1997), itseems that a consensus may be within reach.
Finally, it is important to bear in mind that these val-ues indicate the likely contribution of each prehistoricexpansion to the composition of the present-day mtDNApool. Extrapolating from this information to details ofthe demography at the time of the migration, althoughof course highly desirable for the reconstruction of ar-chaeological processes, is unlikely to be straightforward.
Acknowledgments
We thank Peter Forster, Heinrich Harke, Agnar Helgason,Martin Jones, Stephen Oppenheimer, Colin Renfrew, and Ste-phen Shennan for critical advice; David Goldstein for support;Vicente Cabrera and Naif Karadsheh for access to their unpub-lished Jordanian data; Peter Forster and Anna Katharina Forsterfor providing Polish and Danish samples; Pierre-Marie Danze,Anne Cambon-Thomsen, and CEPH for the French samples;Heinrich Harke and Andrej B. Belinskij for help with collectingthe Russian samples; Sarah Webb, Kersten Griffin, and membersof the Stavanger Archaeological Museum for help with collectingthe Norwegian samples; Steve Jones for collecting the Syriansamples; Savita Shanker for her work at the University of FloridaDNA Sequencing Core Laboratory; and Mark Stoneking for
Richards et al.: Tracing European Founder mtDNAs 1273
forwarding the Nile Valley sequences. This research receivedsupport from The Wellcome Trust and from Italian ConsiglioNazionale delle Ricerche grant 99.02620.CT04 (to A.T.), by theFaculty of Biological Sciences, University of Urbino (support toA.T.), by the Ministero dell’Universita e Ricerca Scientifica eTecnologica: Grandi Progetti Ateneo (support to R.S.), by theProgetti Ricerca Interesse Nazionale 1999 (support to R.S. andS.S.-B.), and by the Progetto Finalizzato C.N.R. “Beni Culturali”(Cultural Heritage, Italy). N.A.-Z. was supported by an Inter-national Center for Genetic Engineering and Biotechnology fel-lowship. The Romanian contribution to this work was sup-ported by the EC Commission, Directorate General XII (50%),and by the Romanian Ministry of Research and Technology(50%), within the framework of the Cooperation in Science andTechnology with Central and Eastern European Countries (sup-plementary agreement ERBCIPDCT 940038 to the contractERBCHRXCT 920032 coordinated by Prof. Alberto Piazza,University of Turin, Turin). M.R. was supported by a WellcomeTrust Bioarchaeology fellowship, V.M. was supported by a Well-come Trust Research Career Development fellowship, and H.-J.B. was supported by a Deutscher Akademischer Austausch-dienst travel grant.
Electronic-Database Information
The URL for data in this article is as follows:
Authors’ data available online, http://www.stats.ox.ac.uk/˜macaulay/founder2000/index.html
References
Adams J, Otte M (1999) Did Indo-European languages spreadbefore farming? Curr Anthropol 40:73–77
Ammerman AJ, Cavalli-Sforza LL (1984) The Neolithic tran-sition and the genetics of populations in Europe. PrincetonUniversity Press, Princeton, NJ
Anderson S, Bankier AT, Barrell BG, de Bruijn MHL, CoulsonAR, Drouin J, Eperon IC, Nierlich DP, Roe BA, Sanger F,Schreier PH, Smith AJH, Staden R, Young IG (1981) Se-quence and organization of the human mitochondrial ge-nome. Nature 290:457–465
Avise J, Arnold J, Ball RM, Bermingham E, Lamb T, NeigelJE, Reeb CA, Saunders NC (1987) Intraspecific phylogeog-raphy: the molecular bridge between population geneticsand systematics. Annu Rev Ecol Syst 18:489–522
Ballinger SW, Schurr TG, Torroni A, Gan YY, Hodge JA, Has-san K, Chen K-H, Wallace DC (1992) Southeast Asian mi-tochondrial DNA analysis reveals genetic continuity of an-cient mongoloid migrations. Genetics 130:139–152
Bandelt H-J, Forster P, Sykes BC, Richards MB (1995) Mi-tochondrial portraits of human populations using mediannetworks. Genetics 141:743–753
Barbujani G, Bertorelle G, Chikhi L (1998) Evidence for Pa-leolithic and Neolithic gene flow in Europe. Am J HumGenet 62:488–491
Barker G (1985) Prehistoric farming in Europe. CambridgeUniversity Press, Cambridge
Bar-Yosef O (1998) On the nature of transitions: the Middle
to Upper Palaeolithic and the Neolithic Revolution. CambArcheol J 8:141–163
Belledi M, Poloni ES, Casalotti R, Conterio F, Mikerezi I, Tag-liavini J, Excoffier L (2000) Maternal and paternal lineagesin Albania and the genetic structure of Indo-European pop-ulations. Eur J Hum Genet 8:480–486
Berger JO (1985) Statistical decision theory and Bayesian anal-ysis. Springer-Verlag, New York
Bertranpetit J, Sala J, Calafell F, Underhill PA, Moral P, ComasD (1995) Human mitochondrial DNA variation and the or-igin of Basques. Ann Hum Genet 59:63–81
Bietti A (1990) The Late Upper Palaeolithic of Italy: an over-view. J World Prehist 4:95–155
Calafell F, Underhill P, Tolun A, Angelicheva D, KalaydjievaL (1996) From Asia to Europe: mitochondrial DNA se-quence variability in Bulgarians and Turks. Ann Hum Genet60:35–49
Casalotti R, Simoni L, Belledi M, Barbujani G (1999) Y-chro-mosome polymorphisms and the origins of the Europeangene pool. Proc R Soc Lond B Biol Sci 266:1959–1965
Cavalli-Sforza LL, Menozzi P, Piazza A (1994) The history andgeography of human genes. Princeton University Press,Princeton, NJ
Cavalli-Sforza LL, Minch E (1997) Paleolithic and neolithiclineages in the European mitochondrial gene pool. Am JHum Genet 61:247–251
Chen Y-S, Torroni A, Excoffier L, Santachiara-Benerecetti AS,Wallace DC (1995) Analysis of mtDNA variation in Africanpopulations reveals the most ancient of all human continent-specific haplogroups. Am J Hum Genet 57:133–149
Chikhi L, Destro-Bisol G, Bertorelle G, Pascali V, BarbujaniG (1998a) Clines of nuclear DNA markers suggest a largelyNeolithic ancestry of the European gene pool. Proc NatlAcad Sci USA 95:9053–9058
Chikhi L, Destro-Bisol G, Pascali V, Baravelli V, Dobosz M,Barbujani G (1998b) Clinal variation in the nuclear DNAof Europeans. Hum Biol 70:643–657
Comas D, Calafell F, Mateu E, Perez-Lezaun A, BertranpetitJ (1996) Geographic variation in human mitochondrialDNA control region sequence: the population history of Tur-key and its relationship to the European populations. MolBiol Evol 13:1067–1077
Comas D, Calafell F, Mateu E, Perez-Lezaun A, Bosch E, Mar-tınez-Arias R, Clarimon J, Facchini F, Fiori G, Luiselli D,Pettener D, Bertranpetit J (1998) Trading genes along theSilk Road: mtDNA sequences and the origin of central Asianpopulations. Am J Hum Genet 63:1824–1838
Corte-Real HBSM, Macaulay VA, Richards MB, Hariti G, Is-sad MS, Cambon-Thomsen A, Papiha S, Bertranpetit J, Sy-kes BC (1996) Genetic diversity in the Iberian peninsuladetermined from mitochondrial sequence analysis. AnnHum Genet 60:331–350
Dansgaard W, Johnsen SJ, Clausen HB, Dahl-Jensen D, Gun-destrup NS, Hammer CU, Hvidberg CS, Steffensen JO, Sve-inbjornsdottir AE, Jouzel J, Bond G (1993) Evidence forgeneral instability of past climate from a 250-kyr ice-corerecord. Nature 364:218–220
Dennell R (1983) European economic prehistory: a new ap-proach. Academic Press, London
1274 Am. J. Hum. Genet. 67:1251–1276, 2000
Diamond JM (1997) The language steamrollers. Nature 389:544–546
Di Rienzo A, Wilson AC (1991) Branching pattern in the ev-olutionary tree for human mitochondrial DNA. Proc NatlAcad Sci USA 88:1597–1601
Dolukhanov P (1994) Environment and ethnicity in the ancientMiddle East. Avebury, Aldershot
Finnila, S, Hassinen IE, Ala-Kokko L, Majamaa K (2000) Phy-logenetic network of the mtDNA haplogroup U in northernFinland based on sequence analysis of the complete codingregion by conformative-sensitive gel electrophoresis. Am JHum Genet 66:1017–1026
Forster P, Harding R, Torroni A, Bandelt H-J (1996) Originand evolution of Native American mtDNA variation: a re-appraisal. Am J Hum Genet 59:935–945
Francalacci P, Bertranpetit J, Calafell F, Underhill PA (1996)Sequence diversity of the control region of mitochondrialDNA in Tuscany and its implications for the peopling ofEurope. Am J Phys Anthropol 100:443–460
Gamble C (1986) The Palaeolithic settlement of Europe. Cam-bridge University Press, Cambridge
——— (1999) The Palaeolithic societies of Europe. Cam-bridge University Press, Cambridge
Gilead I (1991) The Upper Palaeolithic Period in the Levant.J World Prehist 5:105–154
Harris DR (1996) The origins and spread of agriculture andpastoralism in Eurasia. University College London Press,London
Hasegawa M, Di Rienzo A, Kocher TD, Wilson AC (1993)Toward a more accurate time scale for the human mito-chondrial DNA tree. J Mol Evol 37:347–354
Helgason A, Sigurðardottir S, Gulcher JR, Ward R, StefanssonK (2000) mtDNA and the origin of the Icelanders: deci-phering signals of recent population history. Am J HumGenet 66:999–1016
Henry DO (1989) From foraging to agriculture. University ofPennsylvania Press, Philadelphia
Hofmann S, Jaksch M, Bezold R, Mertens S, Aholt S, PaprottaA, Gerbitz KD (1997) Population genetics and disease sus-ceptibility: characterization of central European haplo-groups by mtDNA gene mutations, correlations with D loopvariants and association with disease. Hum Mol Genet 6:1835–1846
Housley RA, Gamble CS, Street M, Pettitt P (1997) Radio-carbon evidence for the Lateglacial human recolonisaton ofnorthern Europe. Proc Prehist Soc 63:25–54
Jochim M (1987) Late Pleistocene refugia in Europe. In: SofferO (ed) The Pleistocene Old World. Plenum Press, New York,pp 317–331
Karafet TM, Zegura SL, Posukh O, Osipova L, Bergen A, LongJ, Goldman D, Klitz K, Harihara S, de Knijff P, Wiebe V,Griffiths RC, Templeton AR, Hammer MF (1999) AncestralAsian source(s) of New World Y-chromosome founder hap-lotypes. Am J Hum Genet 64:817–831
Kivisild T, Bamshad MJ, Kaldma K, Metspalu M, MetspaluE, Reidla M, Laos S, Parik J, Watkins WS, Dixon ME, Pa-piha SS, Mastana SS, Mir MR, Ferak V, Villems R (1999a)Deep common ancestry of Indian and western-Eurasian mi-tochondrial DNA lineages. Curr Biol 9:1331–1334
Kivisild T, Kaldma K, Metspalu M, Parik J, Papiha S, Villems
R (1999b) The place of the Indian mitochondrial DNA var-iants in the global network of maternal lineages and thepeopling of the Old World. In: Papiha S, Deka R, Chak-raborty R (eds) Genomic diversity: applications in humanpopulation genetics. Plenum Press, New York, pp 135–152
Krings M, Salem AH, Bauer K, Geisert H, Malek A, Chaix L,Simon C, Welsby D, Di Rienzo A, Utermann G, SajantilaA, Paabo S, Stoneking M (1999) mtDNA analysis of NileRiver Valley populations: a genetic corridor or a barrier tomigration? Am J Hum Genet 64:1166–1176
Kuhrt A (1995) The ancient Near East. Vol 1: 3000–330 B.C.Routledge, London
Leighton R (1999) Sicily before history. Duckworth, LondonLewis B (1998) The multiple identities of the Middle East.
Weidenfeld & Nicholson, LondonMacaulay VA, Richards MB, Forster P, Bendall KA, Watson
E, Sykes BC, Bandelt H-J (1997) mtDNA mutation rates—no need to panic. Am J Hum Genet 61:983–986
Macaulay V, Richards M, Hickey E, Vega E, Cruciani F, GuidaV, Scozzari R, Bonne-Tamir B, Sykes B, Torroni A (1999)The emerging tree of west Eurasian mtDNAs: a synthesis ofcontrol-region sequences and RFLPs. Am J Hum Genet 64:232–249
Malyarchuk BA, Derenko MV (1999) Molecular instability ofthe mitochondrial haplogroup T sequences at nucleotide po-sitions 16292 and 16296. Ann Hum Genet 63:489–497
Mellars PA (1992) Archaeology and the population-dispersalhypothesis of modern human origins in Europe. Philos TransR Soc Lond B Biol Sci 337:225–234
Menozzi P, Piazza A, Cavalli-Sforza LL (1978) Synthetic mapsof human gene frequencies in Europeans. Science 201:786–792
Olszewski DI, Dibble HL (1994) The Zagros Aurignacian.Curr Anthropol 35:68–75
Opdal SH, Rognum TO, Vege A, Stave A, Dupuy BM, EgelandT (1998) Increased number of substitutions in the D-loopof mitochondrial DNA in the sudden infant death syndrome.Acta Paediatr 87:1039–1044
Parson W, Parsons TJ, Scheithauer R, Holland MM (1998)Population data for 101 Austrian Caucasian mitochondrialDNA D-loop sequences: application of mtDNA sequenceanalysis to a forensic case. Int J Legal Med 111:124–132
Passarino G, Semino O, Bernini LG, Santachiara-BenerecettiAS (1996) Pre-caucasoid and caucasoid genetic features ofthe Indian population, revealed by mtDNA polymorphisms.Am J Hum Genet 59:927–934
Passarino G, Semino O, Pepe G, Shrestha SL, Modiano G,Santachiara-Benerecetti AS (1992) mtDNA polymorphismsamong Tharus of eastern Terai (Nepal). Gene Geogr 6:139–147
Passarino G, Semino O, Quintana-Murci L, Excoffier L, Ham-mer M, Santachiara-Benerecetti AS (1998) Different genet-ic components in the Ethiopian population, identified bymtDNA and Y-chromosome polymorphisms. Am J Hum Ge-net 62:420–434
Piercy R, Sullivan KM, Benson N, Gill P (1993) The appli-cation of mitochondrial DNA typing to the study of whitecaucasian genetic identification. Int J Legal Med 106:85–90
Pult I, Sajantila A, Simanainen J, Georgiev O, Schaffner W,Paabo S (1994) Mitochondrial DNA sequences from Swit-
Richards et al.: Tracing European Founder mtDNAs 1275
zerland reveal striking homogeneity of European popula-tions. Biol Chem Hoppe Seyler 375:837–840
Quintana-Murci L, Semino O, Bandelt H-J, Passarino G,McElreavey K, Santachiara-Benerecetti AS (1999) Geneticevidence for an early exit of Homo sapiens sapiens fromAfrica through eastern Africa. Nat Genet 23:437–441
Rando JC, Pinto F, Gonzalez AM, Hernandez M, Larruga JM,Cabrera VM, Bandelt H-J (1998) Mitochondrial DNA anal-ysis of northwest African populations reveals genetic ex-changes with European, near-Eastern, and sub-Saharan pop-ulations. Ann Hum Genet 62:531–550
Redd AJ, Takezaki N, Sherry ST, McGarvey ST, Sofro ASM,Stoneking M (1995) Evolutionary history of the COII/t-RNALys intergenic 9 base pair deletion in human mito-chondrial DNAs from the Pacific. Mol Biol Evol 12:604–615
Redgate AE (1998) The Armenians. Blackwell, OxfordRenfrew C (1998) The origins of world linguistic diversity: an
archaeological perspective. In: Jablonski NG, Aiello LC (eds)The origins and diversification of language. California Acad-emy of Sciences, San Francisco, pp 171–192
Richards M, Corte-Real H, Forster P, Macaulay V, Wilkinson-Herbots H, Demaine A, Papiha S, Hedges R, Bandelt H-J,Sykes B (1996) Paleolithic and neolithic lineages in the Eu-ropean mitochondrial gene pool. Am J Hum Genet 59:185–203
Richards MB, Macaulay VA, Bandelt H-J, Sykes BC (1998a)Phylogeography of mitochondrial DNA in western Europe.Ann Hum Genet 62:241–260
Richards M, Oppenheimer S, Sykes B (1998b) mtDNA sug-gests Polynesian origins in eastern Indonesia. Am J HumGenet 63:1234–1236
Richards M, Sykes B (1998) Reply to Barbujani et al. Am JHum Genet 62:491–492
Ruiz Linares A, Nayar K, Goldstein DB, Hebert JM, SeielstadMT, Underhill PA, Lin AA, Feldman MW, Cavalli-Sforza LL(1996) Geographic clustering of human Y-chromosome hap-lotypes. Ann Hum Genet 60:401–408
Saillard J, Magalhaes PJ, Schwartz M, Rosenberg T, Nørby S.Mitochondrial DNA variant 11719G is a marker for themtDNA haplogroup cluster HV. Hum Biol (in press)
Sajantila A, Lahermo P, Anttinen T, Lukka M, Sistonen P,Savontaus ML, Aula P, Beckman L, Tranebjaerg L, Ged-dedahl T, Isseltarver L, Dirienzo A, Paabo S (1995) Genesand languages in Europe—an analysis of mitochondrial line-ages. Genome Res 5:42–52
Sajantila A, Salem AH, Savolainen P, Bauer K, Gierig C, PaaboS (1996) Paternal and maternal DNA lineages reveal a bot-tleneck in the founding of the Finnish population. Proc NatlAcad Sci USA 93:12035–12039
Salas A, Comas D, Lareu MV, Bertranpetit J, Carracedo A(1998) mtDNA analysis of the Galician population: a geneticedge of European variation. Eur J Hum Genet 6:365–375
Semino O, Passarino G, Brega A, Fellous M, Santachiara-Be-nerecetti AS (1996) A view of the neolithic demic diffusionin Europe through two Y chromosome-specific markers. AmJ Hum Genet 59:964–968
Sherratt A (1994) The transformation of early agrarian Eu-rope: the later Neolithic and Copper Ages. In: Cunliffe B(ed) The Oxford illustrated prehistory of Europe. OxfordUniversity Press, Oxford
Soffer O (1987) Upper Paleolithic connubia, refugia, and thearchaeological record from eastern Europe. In: Soffer O (ed)The Pleistocene Old World. Plenum Press, New York, pp333–348
Sokal RR, Harding RM, Oden NL (1989) Spatial patterns ofhuman gene frequencies in Europe. Am J Phys Anthropol80:267–294
Sokal RR, Ogden NL, Wilson C (1991) Genetic evidence forthe spread of agriculture in Europe by demic diffusion. Na-ture 351:143–144
Stoneking M, Jorde LB, Bhatia K, Wilson AC (1990) Geo-graphic variation in human mitochondrial DNA from PapuaNew Guinea. Genetics 124:717–733
Stoneking M, Sherry ST, Redd AJ, Vigilant L (1992) Newapproaches to dating suggest a recent age for the humanmtDNA ancestor. Philos Trans R Soc Lond B Biol Sci 337:167–175
Stoneking M, Wilson AC (1989) Mitochondrial DNA. In: HillAVS, Serjeantson S (eds) The colonization of the Pacific: agenetic trail. Oxford University Press, Oxford, pp 215–245
Strauss LG (1995) The Upper Palaeolithic of Europe: an over-view. Evol Anthropol 4:4–16
Sykes B, Leiboff A, Low-Beer J, Tetzner S, Richards M (1995)The origins of the Polynesians—an interpretation from mi-tochondrial lineage analysis. Am J Hum Genet 57:1463–1475
Templeton AR, Routman E, Phillips CA (1995) Separatingpopulation structure from population history: a cladisticanalysis of the geographical distribution of mitochondrialDNA haplotypes in the tiger salamander, Ambystoma ti-grinum. Genetics 140:767–782
Terrell JE (1986) Prehistory in the Pacific Islands. CambridgeUniversity Press, Cambridge
Thorpe IJ (1996) The origins of agriculture in Europe. Rou-tledge, London
Torroni A, Bandelt H-J, D’Urbano L, Lahermo P, Moral P,Sellitto D, Rengo C, Forster P, Savantaus M-L, Bonne-TamirB, Scozzari R (1998) mtDNA analysis reveals a major latePaleolithic population expansion from southwestern tonortheastern Europe. Am J Hum Genet 62:1137–1152
Torroni A, Huoponen K, Francalacci P, Petrozzi M, MorelliL, Scozzari R, Obinu D, Savontaus M-L, Wallace DC (1996)Classification of European mtDNAs from an analysis ofthree European populations. Genetics 144:1835–1850
Torroni A, Lott MT, Cabell MF, Chen Y-S, Lavergne L, WallaceDC (1994a) mtDNA and the origin of Caucasians: identi-fication of ancient Caucasian-specific haplogroups, one ofwhich is prone to a recurrent somatic duplication in the D-loop region. Am J Hum Genet 55:760–776
Torroni A, Miller JA, Moore LG, Zamudio S, Zhuang J,Droma T, Wallace DC (1994b) Mitochondrial DNA analysisin Tibet: implications for the origin of the Tibetan popu-lation and its adaptation to high altitude. Am J Phys An-thropol 93:189–199
Torroni A, Schurr TG, Cabell MF, Brown MD, Neel JV, LarsenM, Smith DG, Vullo CM, Wallace DC (1993a) Asian affin-ities and continental radiation of the four founding NativeAmerican mtDNAs. Am J Hum Genet 53:563–590
Torroni A, Schurr TG, Yang C-C, Szathmary EJE, WilliamsRC, Schanfield MS, Troup GA, Knowler WC, Lawrence DN,
1276 Am. J. Hum. Genet. 67:1251–1276, 2000
Weiss KM, Wallace DC (1992) Native American mitochon-drial DNA analysis indicates that the Amerind and the Na-dene populations were founded by two independent migra-tions. Genetics 130:153–162
Torroni A, Sukernik RI, Schurr TG, Starikovskaya YB, CabellMF, Crawford MH, Comuzzie AG, Wallace DC (1993b)mtDNA variation of aboriginal Siberians reveals distinct ge-netic affinities with Native Americans. Am J Hum Genet 53:591–608
Tubb JN (1998) Canaanites. British Museum Press, LondonWard RH, Frazier BL, Dew-Jager K, Paabo S (1991) Extensive
mitochondrial diversity within a single Amerindian tribe.Proc Natl Acad Sci USA 88:8720–8724
Watson E, Forster P, Richards M, Bandelt H-J (1997) Mito-chondrial footprints of human expansions in Africa. Am JHum Genet 61:691–704
Whittle A (1996) Europe in the Neolithic. Cambridge Uni-versity Press, Cambridge
Zilhao J (1993) The spread of agro-pastoral economies acrossMediterranean Europe: a view from the Far-West. J MediterrArcheol 6:5–63
——— (1998) On logical and empirical aspects of the Mes-olithic-Neolithic transition in the Iberian peninsula. CurrAnthropol 39:690–698
Zvelebil M (1986) Mesolithic prelude and neolithic revolution.In: Zvelebil M (ed) Hunters in transition: Mesolithic soci-eties of temperate Eurasia and their transition to farming.Cambridge University Press, Cambridge, pp 5–15
——— (1989) On the transition to farming in Europe, or whatwas spreading with the Neolithic: a reply to Ammerman(1989). Antiquity 63:379–383