richardt. reed, town manager …. reed, town manager november 30, 2016 sean cronin ... prepared by:...
TRANSCRIPT

TOWN OF BEDFORD BEDFORD, MASSACHUSETI'S 01730
RichardT. Reed, Town Manager
November 30, 2016
Sean Cronin Senior Deputy Commissioner Division of Local Services Department of Revenue P 0 Box 9569 Boston MA 02114
Re: Great Road Market Study
Dear~n:
www.bedfordma .gov
Town Hall Bedford, MA 01730
781-275-1111
Per the guidance of Juan Vega of the Executive Office of Housing and Economic Development, please be advised that the Town of Bedford has completed the Great Road Market Study with the assistance of Economic Development consultant, Fine Point Associates. We have enclosed a hardcopy report for your records.
This project provided a comprehensive and detailed assessment of Bedford ' s main commercial corridor and provided important economic data highlighting business strengths of the corridor as well as the identification of future opportunities to pursue to maintain the vibrancy of the corridor. The report has already been presented to a Working Group comprised of staff and community representatives from the Bedford Selectmen, Planning Board, and Chamber of Commerce.
Staff has planned a presentation and joint meeting of the Selectmen and Planning Board for December 6, 2016 to review and discuss the report. The report will be helpful for the Boards to utilize and guide them in developing priorities and zoning recommendations for the Great Road over the next two years.
Very truly yours,
~ Richard T. Reed Town Manager
Encl.
Great Road Commercial Corridor�Business District Assessment & Market Analysis
Prepared by: FinePoint Associates, www.FinePointAssociates.com Peg Barringer, Project Director
Prepared for: Town of Bedford Alyssa Sandoval, Economic Development Coordinator In Collaboration with: The Great Road Working Group December, 2016

2
Thank you to the real estate professionals that provided information and expert opinions, and the 26 business representatives that graciously agreed to be interviewed. And, thank you to to the over 900 community residents and area employees that responded to the Consumer Preferences Survey.
This project was conducted by FinePoint Associates, Peg Barringer, Project Director, in collaboration with the Bedford Great Road Working Group, comprised of Town Staff and community representatives. Funding Vupport was provided by the Massachusetts Community Compact Initiative.
Special thanks to Alyssa Sandoval, Economic Development Coordinator, for guidance, support, insights and data collection provided throughout this project.
Great Road Working Group
Jeff Cohen, Planning Board Amy Lloyd, Planning Board Catherine Perry, Planner Richard Reed, Town Manager
Alyssa Sandoval, Economic Development Coordinator Adam Schwartz, Bedford Chamber of Commerce Mark Siegenthaler, Bedford Selectman
Acknowledgements�

3
Contents �
Project Scope, Purpose and Study Area…………………………………………………….……5
Part I. Business District Profile: Real Estate, Business Conditions & Commercial Mix……………..6
A. Real Estate Overview B. Establishment Characteristics C. Business Interview Results – Customer Volume, Sales Trends, Location Advantages & Disadvantages D. Business District Composition Assessment E. Comparative Business Mix Analysis
Part II. Market Profile: Understanding of the Potential Retail Market ……………………………20
A. Overview of Potential Market Segments B. Resident Market Segment
1. Trade Area Delineation 2. Trade Area Consumer Characteristics 3. Market Demand and Sales Leakage
(including Summary of Trade Area Demographics, Expenditures and Sales Leakage Data Charts) C. Non Resident Market Segments
Part III. Consumer Patterns and Preferences Survey …………………………………………………34
A. Survey Overview of Potential Market Segments B. Consumer Patterns C. Consumer Satisfaction & Preferences
Part IV. Summary of Findings and Suggestions for Consideration……………………………………42
4
List of Tables and Figures �Figures 1. Regional Context 2. Study Area Map 3. Commercial Units by Size 4. Commercial Nodes 5. Commercial Tax Rate Analysis 6. Ownership Characteristics 7. Establishment Operating Hours 8. Years in Operation 9. Average Daily Customers 10. Sales Trends 11. Composition of Uses 12. Business Mix Comparison 13. Restaurants by Ownership Type 14. Restaurants by Node 15. Retail Mix 16. Comparison with Other Commercial Centers 17. Location of Surrounding Commercial Facilities 18. Zip Code Map 19. Trade Areas 20. Summary Demographics, Expenditures & Sales Leakage 21. Weekly Visits to Great Road Corridor 22. Change in Patronage 23. Establishments Visited During Shopping/Trip 24. Great Road Establishments Visited in Last 7 days 25. Restaurant Spending in Great Road Corridor – Residents 26. Employee & Student Meal Purchasing – Capture
Tables 1. Commercial Units & Establishments 2. Establishment Type by Number and Square Footage 3. Top Ten Most Frequently Found Establishments 4. Eating & Drinking Establishment Types 5. Resident Annual Expenditures 6. Sales Leakage in Selected Categories (millions) 7. Eating and Drinking Places Sales Leakage Analysis 8. Additional Demographics Data 9. Survey Response Tally 10. Number of Meals Purchased per Week – Residents 11. Employee & Student Meal Purchasing Frequency and Amount Spent 12. Consumer Satisfaction Ratings 13. Consumer-Desired Business Mix Changes
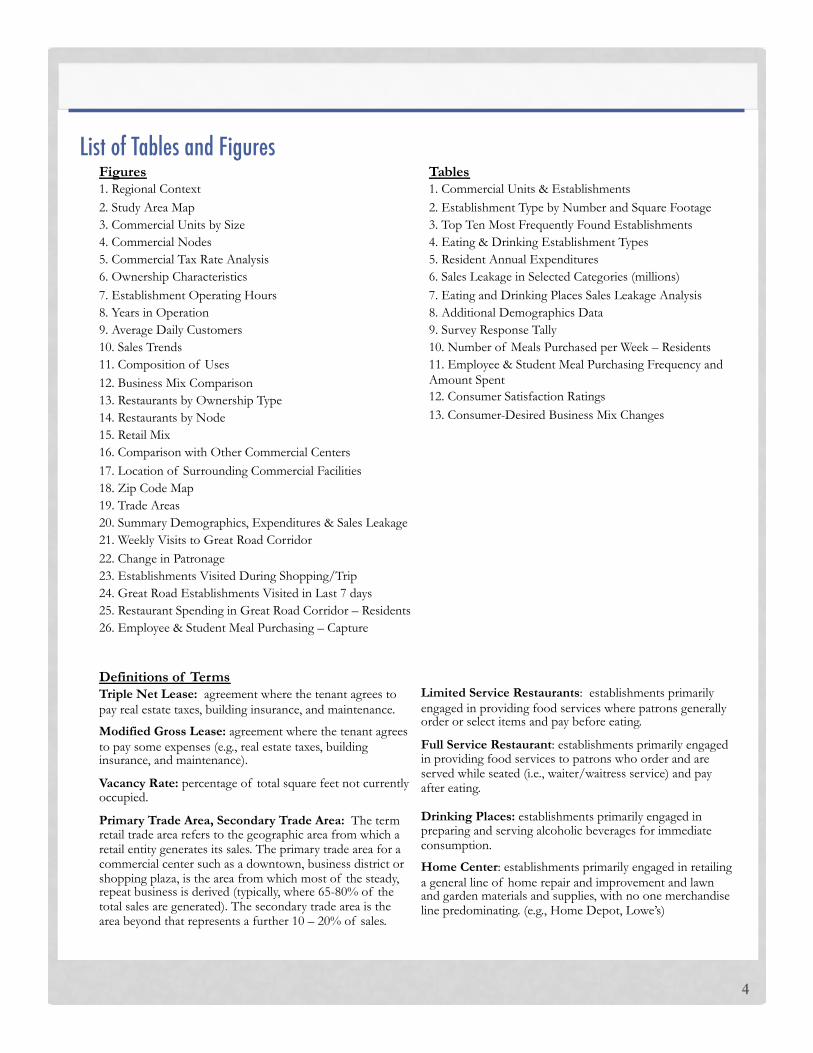
Definitions of Terms Triple Net Lease: agreement where the tenant agrees to pay real estate taxes, building insurance, and maintenance.
Modified Gross Lease: agreement where the tenant agrees to pay some expenses (e.g., real estate taxes, building insurance, and maintenance).
Vacancy Rate: percentage of total square feet not currently occupied.
Primary Trade Area, Secondary Trade Area: The term retail trade area refers to the geographic area from which a retail entity generates its sales. The primary trade area for a commercial center such as a downtown, business district or shopping plaza, is the area from which most of the steady, repeat business is derived (typically, where 65-80% of the total sales are generated). The secondary trade area is the area beyond that represents a further 10 – 20% of sales.
Limited Service Restaurants: establishments primarily engaged in providing food services where patrons generally order or select items and pay before eating.
Full Service Restaurant: establishments primarily engaged in providing food services to patrons who order and are served while seated (i.e., waiter/waitress service) and pay after eating.
Drinking Places: establishments primarily engaged in preparing and serving alcoholic beverages for immediate consumption.
Home Center: establishments primarily engaged in retailing a general line of home repair and improvement and lawn and garden materials and supplies, with no one merchandise line predominating. (e.g., Home Depot, Lowe’s)

Prepared by: Peg Barringer, FinePoint Associates, in collaboration with the Great Road Working Group www.FinePointAssociates.com 5
Project Scope, Purpose and Study Area�
Purpose: To conduct a business district assessment and market analysis for the Great Road Commercial Corridor that will help to inform future revitalization activities and potential re-zoning efforts. �
Scope: To work collaboratively with community representatives to 1) assess business and real estate conditions and analyze the commercial mix, 2) conduct a retail market study, identify market segments, analyze trade area demographics, expenditures and sales leakage, 3) design a consumer preference survey and analyze results, and 4) summarize findings and suggestions for consideration.
Study Area: The Great Road Corridor is located in the Town of Bedford approximately 15 miles northwest of Boston. The Corridor is easily accessed 1.5 miles off Rt. 95 via Rt. 4 and 2 miles off Rt. 3 via Rt. 62. Bedford is surrounded by the towns of Burlington, Lexington, Concord, Carlisle and Billerica. The Corridor extends along Rt. 4 approximately 1.5 miles from Shawsheen Road to the intersection of Carlisle Road.
Figure 1. Regional Context
Figure 2. Study Area Map
Great Road, Bedford
Commercial Corridor Study Area Municipal Buildings, Library, High School

Prepared by: Peg Barringer, FinePoint Associates, in collaboration with the Great Road Working Group www.FinePointAssociates.com
! In total, the Great Road Corridor contains 678,571 s.f. of commercial space “under roof ”. To put this in perspective, this is about one-half the size of the Burlington Mall. Approximately 83% of the commercial space is located on the first floor.
! There are 181 commercial units within the district; 134 have a first floor presence and 47 are located entirely on other floors. Median unit size is 1,328 s.f.
! At the time of the inventory (August, 2016), approximately 7% of the total commercial space was vacant (representing a mix of retail and office space). The vacancy rate for only space with a first floor presence (presumably retail) was 4%. (Note: vacancy rates fluctuate and can change quickly.) Nationally, shopping center vacancy is 7.6%, down from 8.1% from the previous year, and the vacancy rate for Boston stands at 3.8% (according to Cushman and Wakefield 2016 Q2 Report).
! The Great Road Corridor has two concentrations of vacant space, along with a few scattered single sites.
- Several newly developed vacant retail units at the Marketplace Shopping Center (152 – 170 Great Rd.), which has been undergoing major renovation
- Several vacant office space units (renovated and build-to-suit) at Emerson Place (41-55 North Rd.)
6
Part I. Business District Profile: Real Estate, Business Conditions & Commercial Mix�
0
20
40
60
80
100
<1,500 1,500 - 4,999 5,000-9,999 ≥10,000
Figure 3. Commercial Units by Size (s.f.)
Other Flr.
First Flr. Presence
A. Real Estate Overview �
Great Road Commercial Corridor �
Figure 4. Commercial Nodes
Note: This analysis is based upon a business and property inventory developed with information provided by the Town’s Economic Development Department and primary data collection conducted by FinePoint Associates. The square footage data pertaining to businesses and commercial units is an estimate of Gross Leasable Area obtained from a variety of sources and should be considered approximations. Information may be less complete for businesses not located on the first floor due to difficulty obtaining data.
North Rd
Bedford Ctr/Marketplace
Great Rd Shopping Ctr/Shawsheen
! The commercial district is largely an auto-oriented corridor with free-standing businesses and several shopping plazas along the 1.5 mile stretch. It is comprised of three commercial nodes.
Commercial Units Estabs.
Total s.f.
# Avg. s.f.
Median s.f.
#
North Rd 106,540 33 3,228 900 27
Bedford Ctr/Marketplace 239,771 93 2,578 1,300 83
Great Rd Shopping Ctr/Shawsheen
332,260 55 6,041 1,500 53
All 678,571 181 3,749 1,328 162
Table 1. Units & Establishments by Sub Area
Configuration and Nodes

Prepared by: Peg Barringer, FinePoint Associates, in collaboration with the Great Road Working Group www.FinePointAssociates.com 7
Great Road Commercial Corridor �
! North Road Node – has the smallest number of businesses and is the least pedestrian-oriented. This node contains Bedford Farms, a very well-known ice cream shop, Emerson Place, a large property with many recently renovated medical office suites, a small plaza, small motel and free standing auto sales, gas, tire shop, appliance store and other businesses.
! Bedford Center/Marketplace Node– the most central and walkable node, contains the largest number of businesses, situated along Great Road and in 3 shopping plazas (the largest and newly renovated Marketplace, anchored by Whole Foods, Marshalls and Learning Express Store with Activity Center), 200 Great Road, a retail and office plaza and Blue Ribbon Plaza, containing Starbucks). The northern end of this node contains the Town Common and is the area that is the closest in atmosphere to a village center.
! Great Road Shopping Center/Shawsheen Node– contains Great Road Shopping Center (anchored by Stop & Shop, Home Goods, TJ Maxx, and Ocean State Job Lot), 363 Great Road Village (a retail and office plaza), some free-standing fast food and auto businesses, and the Bedford Plaza Hotel (a 99-room, 3-story hotel).
Business District Profile (cont’d) �
Prepared by: Peg Barringer, FinePoint Associates, in collaboration with the Great Road Working Group www.FinePointAssociates.com
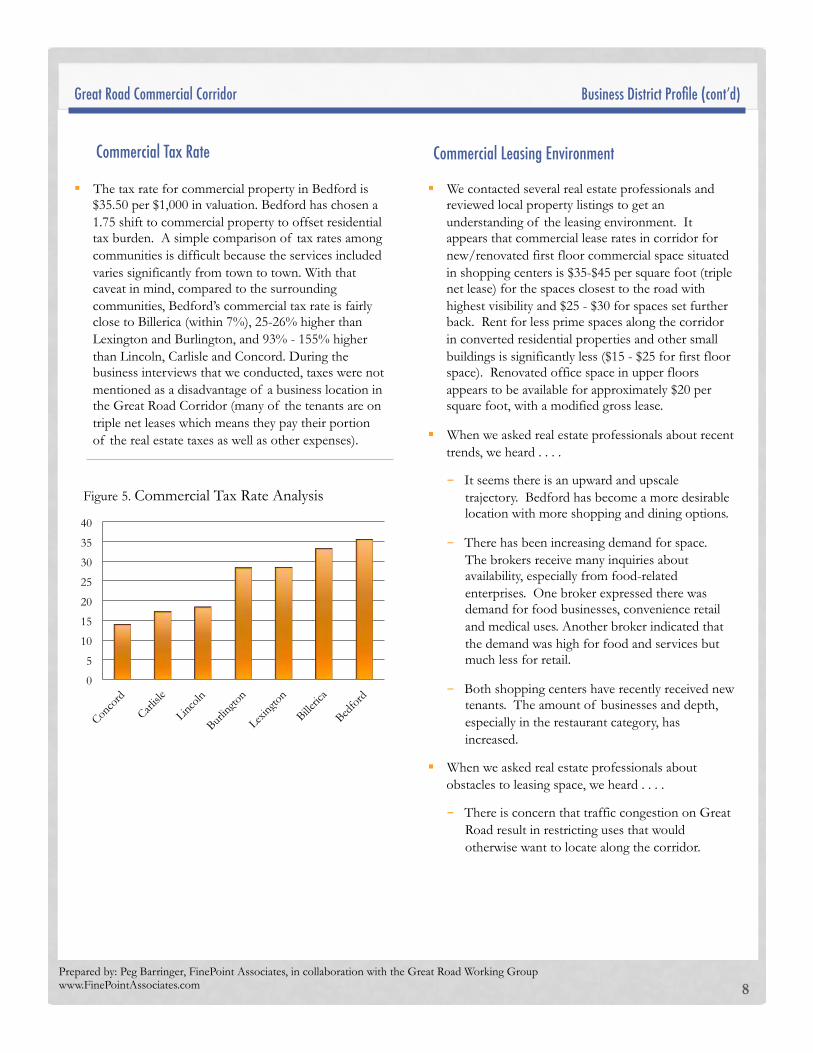
! The tax rate for commercial property in Bedford is $35.50 per $1,000 in valuation. Bedford has chosen a 1.75 shift to commercial property to offset residential tax burden. A simple comparison of tax rates among communities is difficult because the services included varies significantly from town to town. With that caveat in mind, compared to the surrounding communities, Bedford’s commercial tax rate is fairly close to Billerica (within 7%), 25-26% higher than Lexington and Burlington, and 93% - 155% higher than Lincoln, Carlisle and Concord. During the business interviews that we conducted, taxes were not mentioned as a disadvantage of a business location in the Great Road Corridor (many of the tenants are on triple net leases which means they pay their portion of the real estate taxes as well as other expenses).
8
0
5
10
15
20
25
30
35
40
Figure 5. Commercial Tax Rate Analysis
Great Road Commercial Corridor �
Commercial Tax Rate Commercial Leasing Environment
Business District Profile (cont’d) �
! We contacted several real estate professionals and reviewed local property listings to get an understanding of the leasing environment. It appears that commercial lease rates in corridor for new/renovated first floor commercial space situated in shopping centers is $35-$45 per square foot (triple net lease) for the spaces closest to the road with highest visibility and $25 - $30 for spaces set further back. Rent for less prime spaces along the corridor in converted residential properties and other small buildings is significantly less ($15 - $25 for first floor space). Renovated office space in upper floors appears to be available for approximately $20 per square foot, with a modified gross lease.
! When we asked real estate professionals about recent trends, we heard . . . .
- It seems there is an upward and upscale trajectory. Bedford has become a more desirable location with more shopping and dining options.
- There has been increasing demand for space. The brokers receive many inquiries about availability, especially from food-related enterprises. One broker expressed there was demand for food businesses, convenience retail and medical uses. Another broker indicated that the demand was high for food and services but much less for retail.
- Both shopping centers have recently received new tenants. The amount of businesses and depth, especially in the restaurant category, has increased.
! When we asked real estate professionals about obstacles to leasing space, we heard . . . .
- There is concern that traffic congestion on Great Road result in restricting uses that would otherwise want to locate along the corridor.

Prepared by: Peg Barringer, FinePoint Associates, in collaboration with the Great Road Working Group www.FinePointAssociates.com
Business District Profile (cont’d) �Great Road Commercial Corridor �
9
! The Great Road Corridor is home to approximately 162 establishments including retail, restaurants, banks, services, contractors, etc. (Note: There is a complex of municipal buildings adjacent to the corridor on Mudge Way (Town Hall, Library, Police, High School, Town Center Building, etc.) that have not been included in the inventory.
! Most of the establishments are small with the median size at around 1,300 s.f., however, the business district also contains several large establishments.
20,000 – 49,999 s.f.
Whole Foods Market
HomeGoods
Ocean State Job Lot
Marshall's
TJ Maxx
10,000 – 19,999 s.f. Minuteman Volkwagen
Ace Hardware
CVS
Over 50,000 s.f.
Bedford Plaza Hotel
Super Stop and Shop
Commercial Establishment Type # S.F.
Retail 35 303,653 Motor Vehicle & Parts 3 30,284 Furniture & Furnishings 3 28,685 Electronics & Appliances 2 4,630 Building Mat. & Garden Equip 3 14,848 Food & Beverage Stores 5 114,370 Health & Personal Care Stores 2 11,832 Gasoline Stations 4 13,989 Clothing and Accessories 2 1,860 Sporting Goods, Hobby, Books 2 9,210 General Merchandise Stores 3 60,050 Misc. Retail Stores 6 13,895
Eating, Drinking & Lodging 31 183,305 Arts, Entertainment & Recreation 5 4,446 Accommodation 2 119,312 Eating and Drinking Places 24 59,547
Services 81 121,422 Finance & Insurance 16 32,348 Real Estate and Rental/Leasing 3 3,400 Professional, Scientific & Tech. 11 11,900 Educational Services 2 4,600 Health Care & Social Assist. 22 29,110 Repair & Maintenance 4 8,434 Personal Care & Laundry 23 31,630
Other 15 20,065 Agric., Forest, Fishing, Mining 0 - Util., Const., Mfg., Wholesale 5 7,200 Transport, Postal & Warehouse 2 1,250 Information 7 6,715 Admin./Sup. & Waste Mgmt 1 4,900 Total Establishments 162 628,445
Table 2.
Vacant Commercial Units 19 50,126 TOTAL Commercial Units and Space 181 678,571
B. Establishment Characteristics�
5,000 – 9,999 s.f. Sullivan's Tire and Auto Service
Gas Station/Dunkin Donuts
Learning Express Toys/Activity Center
The Paper Store
Chestnut Dental
Bedford Funeral Home
Red Heat Tavern
Lincoln Liquors
Bedford Car Wash
Prepared by: Peg Barringer, FinePoint Associates, in collaboration with the Great Road Working Group www.FinePointAssociates.com
Great Road Commercial Corridor �
10
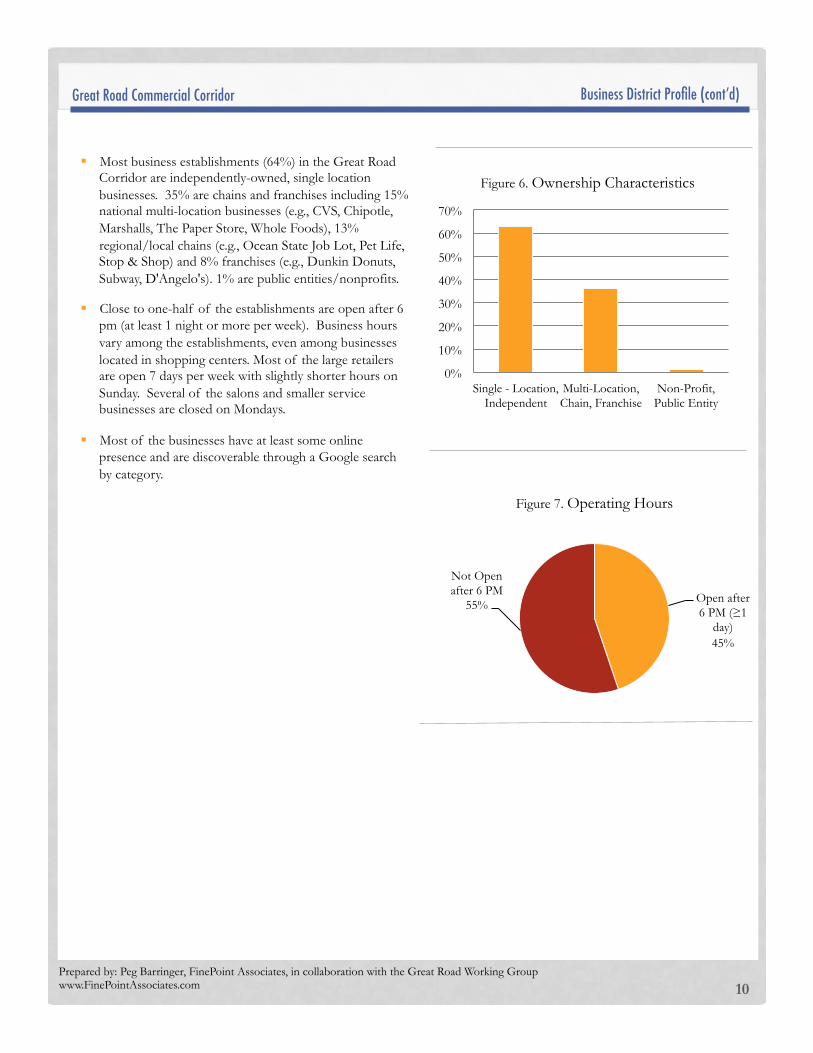
! Most business establishments (64%) in the Great Road Corridor are independently-owned, single location businesses. 35% are chains and franchises including 15% national multi-location businesses (e.g., CVS, Chipotle, Marshalls, The Paper Store, Whole Foods), 13% regional/local chains (e.g., Ocean State Job Lot, Pet Life, Stop & Shop) and 8% franchises (e.g., Dunkin Donuts, Subway, D'Angelo's). 1% are public entities/nonprofits.
! Close to one-half of the establishments are open after 6 pm (at least 1 night or more per week). Business hours vary among the establishments, even among businesses located in shopping centers. Most of the large retailers are open 7 days per week with slightly shorter hours on Sunday. Several of the salons and smaller service businesses are closed on Mondays.
! Most of the businesses have at least some online presence and are discoverable through a Google search by category.
Business District Profile (cont’d) �
0%
10%
20%
30%
40%
50%
60%
70%
Single - Location, Independent
Multi-Location, Chain, Franchise
Non-Profit, Public Entity
Figure 6. Ownership Characteristics
Open after 6 PM (≥1
day) 45%
Not Open after 6 PM
55%
Figure 7. Operating Hours

Prepared by: Peg Barringer, FinePoint Associates, in collaboration with the Great Road Working Group www.FinePointAssociates.com
Business District Profile (cont’d) �Great Road Commercial Corridor �
11
C. Business Interviews – Customers, Sales Trends, Location Advantages & Disadvantages��
! Interviews were conducted with business representatives to get information about their market draw, operating characteristics, and sales trends as well as their views on locational advantages and disadvantages. This survey is representative of tenants under 10,000 s.f. We did not include any of the large anchor tenants (Whole Foods, TJ Maxx, Home Goods, Stop & Shop, Ocean State Job Lot) due to the difficulty of getting a representative respondent given corporate management structures. We interviewed 26 businesses (33% retailers, 33% restaurants, recreation, lodging, 30% service providers and 4% other)
! 35% of the businesses interviewed have been in operation at a Great Road Corridor location for more than 20 years while 19% have been in operation for 10 to 19 years and 46% for less than 10 years.
! Daily customer count varies widely among the businesses interviewed (and also varies from day to day). The chain restaurants and a long time local eatery reported average daily customer counts ranging from 301 to 500. Most local independent restaurants and convenience goods retailers reported 101 to 300. Busy service providers and medium-size retailers reported 51 to 100 customers while service providers with less foot traffic (e.g., banks and some personal services) along with small retailers (e.g., furnishings, appliance, jewelry) reported counts of under 30.
! Approximately three-quarters of the businesses indicated that sales had increased or stayed the same over the last 3 years while one-quarter reported that sales had declined. 43% of the businesses indicated a positive sales trend.
≥ 20 yrs. 35%
< 5 yrs. 19%
5 - 9 yrs. 27%
10 - 19 yrs. 19%
Figure 8. Years in Operation
0%
20%
40%
60%
≤ 30 31 - 100 101 - 300 301 - 500
% o
f B
usin
esse
s In
terv
iew
ed
Figure 9. Average Daily Customers
Sales Up 43%
Sales Down 24%
Sales About the
Same 33%
Figure 10. Sales Trends (Last 3 Years)
! Several businesses cited the following Advantages of a business location within the Great Road Corridor . . .
- Easy access from 128 - Lots of traffic, “main drag”, people passing through
from other communities - High visibility for business - Location close to Lexington - Opportunity for crossover patronage from other
nearby businesses
! Several businesses cited the following Disadvantages . . .
- Traffic congestion, especially certain times of day, resulting in customers avoiding the area
- Restrictive sign regulations prevent visibility for business (e.g., sign process difficult, size regulations, can’t get name added to shopping center sign, would like to be able to have lighting for sign, want to be able to have “open” sign)
- Inadequate parking, signage about available parking
- Too many chains/franchises, and too many of the same kind, would like more independent businesses and more variety (fewer banks, nail salons)
- North Road Node is not friendly for pedestrians/bikes, no cross walk, unsafe for walking customers, especially for large number walking from school to Dunkin Donuts, Bedford Farms & Callahan’s Karate
�
Prepared by: Peg Barringer, FinePoint Associates, in collaboration with the Great Road Working Group www.FinePointAssociates.com
Business District Profile (cont’d) �Great Road Commercial Corridor �
12
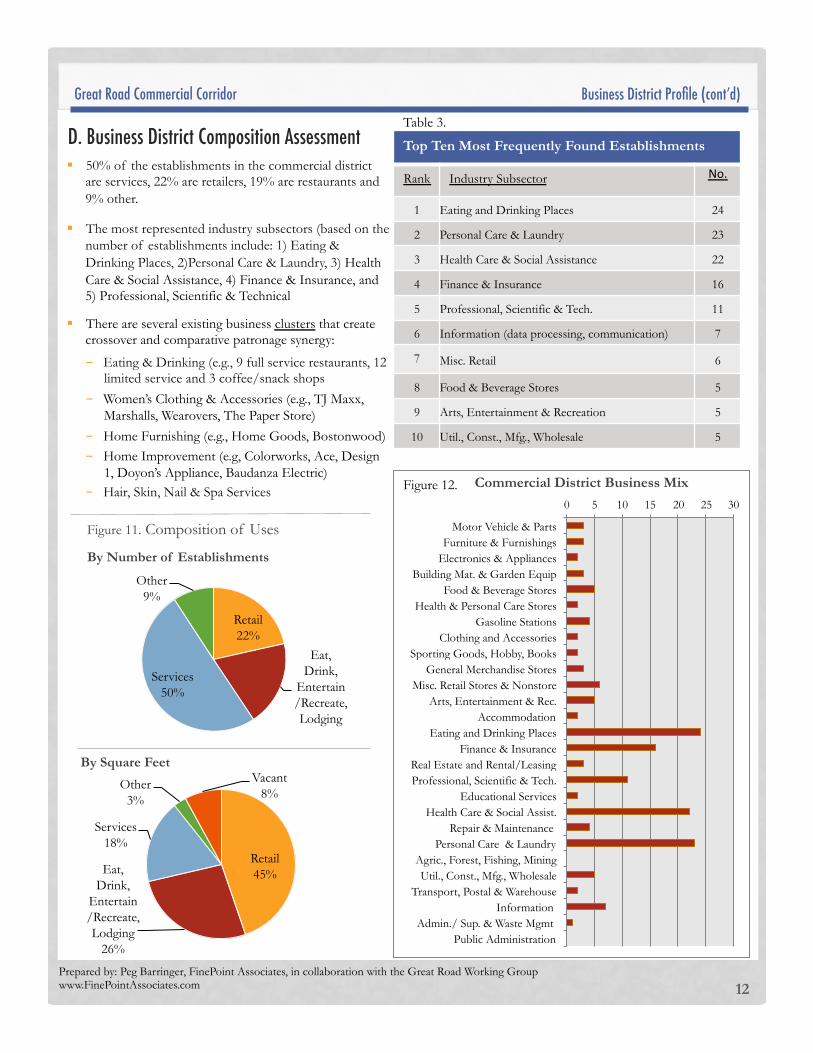
Top Ten Most Frequently Found Establishments
Rank Industry Subsector No.$$
1 Eating and Drinking Places 24
2 Personal Care & Laundry 23
3 Health Care & Social Assistance 22
4 Finance & Insurance 16
5 Professional, Scientific & Tech. 11
6 Information (data processing, communication) 7
7 Misc. Retail 6
8 Food & Beverage Stores 5
9 Arts, Entertainment & Recreation 5
10 Util., Const., Mfg., Wholesale 5
0 5 10 15 20 25 30
Motor Vehicle & Parts Furniture & Furnishings
Electronics & Appliances Building Mat. & Garden Equip
Food & Beverage Stores Health & Personal Care Stores
Gasoline Stations Clothing and Accessories
Sporting Goods, Hobby, Books General Merchandise Stores
Misc. Retail Stores & Nonstore Arts, Entertainment & Rec.
Accommodation Eating and Drinking Places
Finance & Insurance Real Estate and Rental/Leasing Professional, Scientific & Tech.
Educational Services Health Care & Social Assist.
Repair & Maintenance Personal Care & Laundry
Agric., Forest, Fishing, Mining Util., Const., Mfg., Wholesale
Transport, Postal & Warehouse Information
Admin./ Sup. & Waste Mgmt Public Administration
Commercial District Business Mix
! 50% of the establishments in the commercial district are services, 22% are retailers, 19% are restaurants and 9% other.
! The most represented industry subsectors (based on the number of establishments include: 1) Eating & Drinking Places, 2)Personal Care & Laundry, 3) Health Care & Social Assistance, 4) Finance & Insurance, and 5) Professional, Scientific & Technical
! There are several existing business clusters that create crossover and comparative patronage synergy:
- Eating & Drinking (e.g., 9 full service restaurants, 12 limited service and 3 coffee/snack shops
- Women’s Clothing & Accessories (e.g., TJ Maxx, Marshalls, Wearovers, The Paper Store)
- Home Furnishing (e.g., Home Goods, Bostonwood) - Home Improvement (e.g, Colorworks, Ace, Design
1, Doyon’s Appliance, Baudanza Electric) - Hair, Skin, Nail & Spa Services
D. Business District Composition Assessment �Table 3.
Figure 12.
Retail 22%
Eat, Drink,
Entertain/Recreate, Lodging
Services 50%
Other 9%
Figure 11. Composition of Uses
By Number of Establishments
Retail 45% Eat,
Drink, Entertain/Recreate, Lodging
26%
Services 18%
Other 3%
Vacant 8%
By Square Feet
Prepared by: Peg Barringer, FinePoint Associates, in collaboration with the Great Road Working Group www.FinePointAssociates.com
Great Road Commercial Corridor �
13
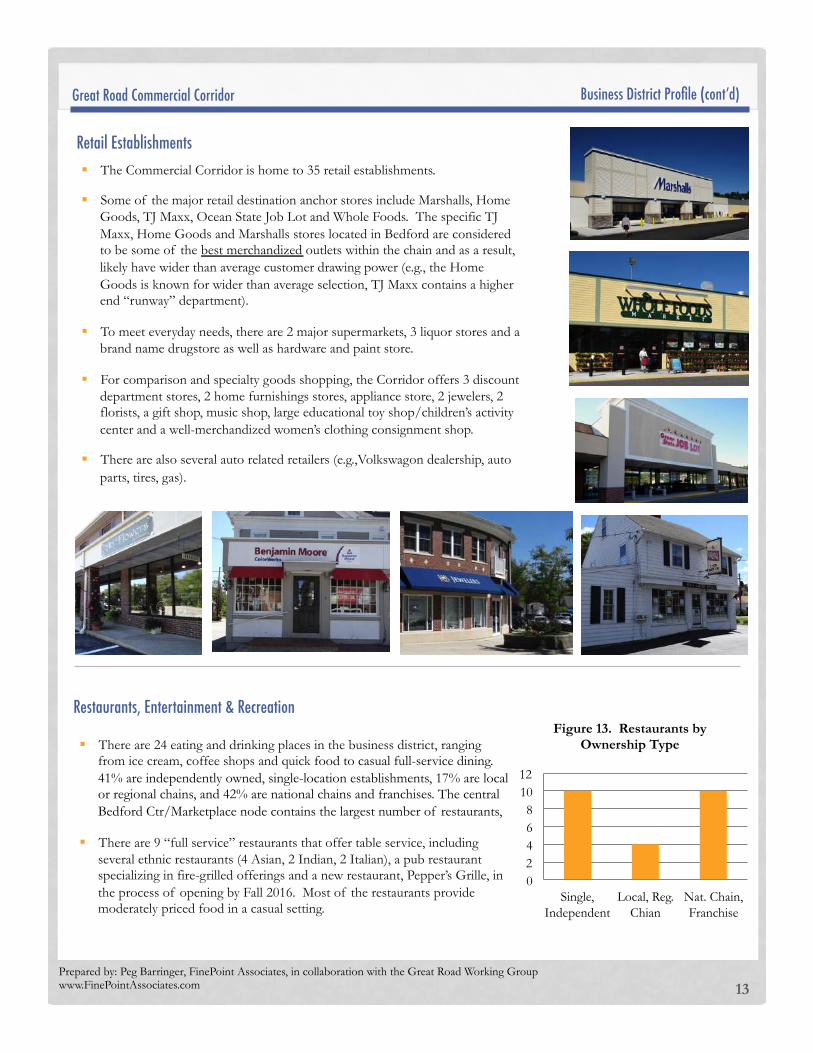
Retail Establishments �� ! The Commercial Corridor is home to 35 retail establishments.
! Some of the major retail destination anchor stores include Marshalls, Home Goods, TJ Maxx, Ocean State Job Lot and Whole Foods. The specific TJ Maxx, Home Goods and Marshalls stores located in Bedford are considered to be some of the best merchandized outlets within the chain and as a result, likely have wider than average customer drawing power (e.g., the Home Goods is known for wider than average selection, TJ Maxx contains a higher end “runway” department).
! To meet everyday needs, there are 2 major supermarkets, 3 liquor stores and a brand name drugstore as well as hardware and paint store.
! For comparison and specialty goods shopping, the Corridor offers 3 discount department stores, 2 home furnishings stores, appliance store, 2 jewelers, 2 florists, a gift shop, music shop, large educational toy shop/children’s activity center and a well-merchandized women’s clothing consignment shop.
! There are also several auto related retailers (e.g.,Volkswagon dealership, auto parts, tires, gas).
Business District Profile (cont’d) �
! There are 24 eating and drinking places in the business district, ranging from ice cream, coffee shops and quick food to casual full-service dining. 41% are independently owned, single-location establishments, 17% are local or regional chains, and 42% are national chains and franchises. The central Bedford Ctr/Marketplace node contains the largest number of restaurants,
! There are 9 “full service” restaurants that offer table service, including several ethnic restaurants (4 Asian, 2 Indian, 2 Italian), a pub restaurant specializing in fire-grilled offerings and a new restaurant, Pepper’s Grille, in the process of opening by Fall 2016. Most of the restaurants provide moderately priced food in a casual setting.
Restaurants, Entertainment & Recreation
0 2 4 6 8
10 12
Single, Independent
Local, Reg. Chian
Nat. Chain, Franchise
Figure 13. Restaurants by Ownership Type

Prepared by: Peg Barringer, FinePoint Associates, in collaboration with the Great Road Working Group www.FinePointAssociates.com
Great Road Commercial Corridor �
14
! 12 of the eating places offer more casual dining options and fall into the category of “limited service”, meaning that customers order and/or pay at a counter rather than at a table. These restaurants include quick service (e.g. McDonalds), pizza/sub shops (e.g., Steve’s House of Pizza, Papa Gino’s) and fast casual restaurants (B. Good, Prince Street Café and Bakery, Ken’s NY Deli).
! The are 3 snack and beverage bars. Starbucks and Dunkin Donuts are well-known coffee shops specializes in coffee, tea and very light fare with all-day customer traffic. Bedford Farms is a local/regional favorite ice cream stand open year-round a walk-up window (and the oldest business in Bedford, evolving from the original dairy farm).
! 11 restaurants serve alcohol. All 9 of the full service restaurants have a full liquor license and 2 of the limited service restaurants serve wine and beer. 2 full service restaurants offer outdoor dining and a few limited service restaurants have outdoor tables. None of the restaurants offer entertainment.
! There are 3 recreation establishments (yoga & fitness related). In addition, there are recreation facilities located in the Town Center municipal complex adjacent to the Commercial Corridor. There are no entertainment establishments located in the Corridor.
Eating & Drinking Establishment Type #
Full Service Restaurants (with wait staff) 9 Limited Service Restaurants 12
Snack & Non-Alcoholic Beverage Bars 3 Establishments that Serve Alcohols 11
Business District Profile (cont’d) �
Restaurants, Entertainment & Recreation (cont’d)
Table 4.
0 2 4 6 8
10 12 14
Bedford Ctr/Marketplace
Great Rd Shop Ctr/Shawsheen
North Rd
Figure 14. Restaurants by Node
Prepared by: Peg Barringer, FinePoint Associates, in collaboration with the Great Road Working Group www.FinePointAssociates.com
Great Road Commercial Corridor �
15
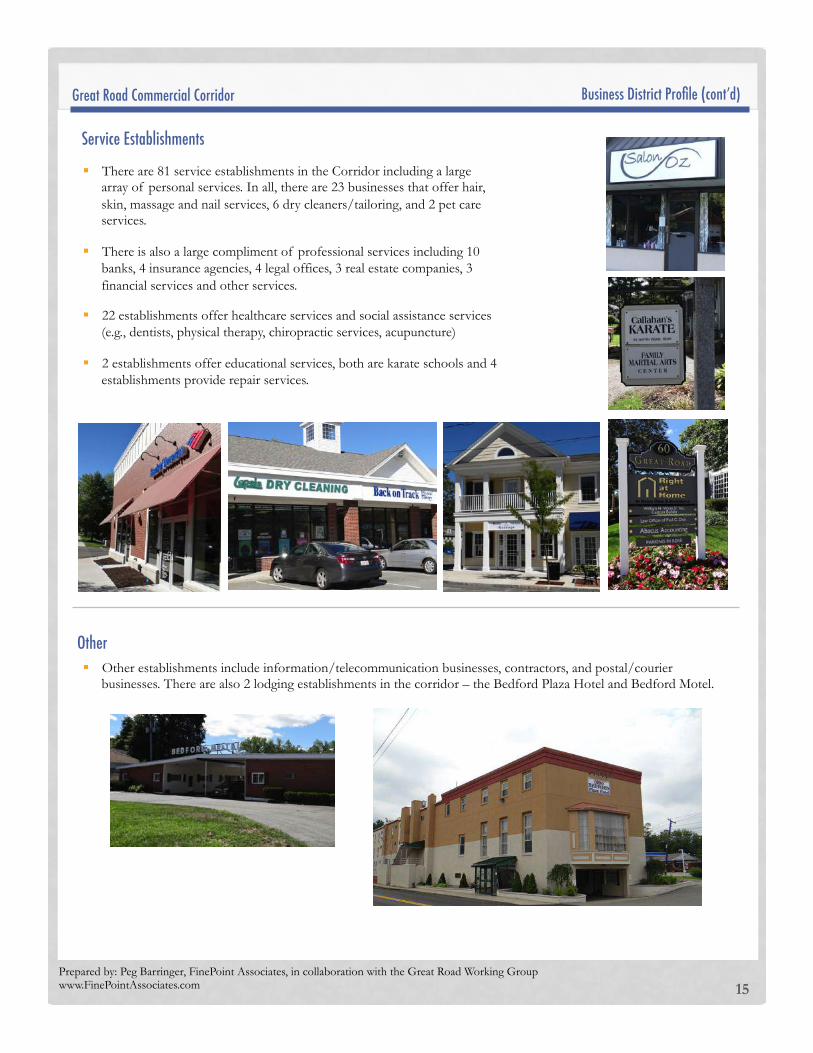
! There are 81 service establishments in the Corridor including a large array of personal services. In all, there are 23 businesses that offer hair, skin, massage and nail services, 6 dry cleaners/tailoring, and 2 pet care services.
! There is also a large compliment of professional services including 10 banks, 4 insurance agencies, 4 legal offices, 3 real estate companies, 3 financial services and other services.
! 22 establishments offer healthcare services and social assistance services (e.g., dentists, physical therapy, chiropractic services, acupuncture)
! 2 establishments offer educational services, both are karate schools and 4 establishments provide repair services.
Business District Profile (cont’d) �
Service Establishments
! Other establishments include information/telecommunication businesses, contractors, and postal/courier businesses. There are also 2 lodging establishments in the corridor – the Bedford Plaza Hotel and Bedford Motel.
Other

Prepared by: Peg Barringer, FinePoint Associates, in collaboration with the Great Road Working Group www.FinePointAssociates.com
Great Road Commercial Corridor �
16
Furnishings & Furniture Bostonwood Great Road Gallery and Framing HomeGoods
Appliances & Electronics
Doyons TV & Appliances Inc. Verizon Hardware & Home Improvement
Colorworks Ace Hardware
Bedford Lock and Key Food & Beverage
Super Stop and Shop Bedford Package Store Fitzgeralds Package Store
Lincoln Liquors Whole Foods Market
Health Care Stores & Optical Goods
CVS Bedford Vision Center
Jewelry Bedford Jewelers KB Jewelers
Sporting Goods, Hobby, Toy & Game Learning Express Toys/Activity Center
Leonard's Music
Gen. Merchandise/Department Stores
Marshall's TJ Maxx
Ocean State Job Lot
Florists & Gifts
Art of Flowers by Bonnie Bedford Florist The Paper Store
Used Goods Corner Antiques Wearovers (clothing consignment)
Eating & Drinking Places
Asiana Bistro B.Good Restaurant Bedford Farms
Bedford House of Roast Beef Bruegger's Bagels/Jamba Juice
Chipotle Mexican Grill Comella's Restaurant D'Angelo's Grilled Sandwiches
Domino's Pizza Dunkin' Donuts
Ginger Japanese Restaurant Great Wall Chinese Restaurant Holi Restaurant
Ken's NY Deli Ken’s Pub
McDonald's Papa Gino's Pepper's Grill
Prince Street Café and Bakery Red Heat Tavern
Starbuck's Steve's House of Pizza Subway
Virsa De Punjab
Amusement & Recreation
Get in Shape for Women Live Long Pilates Serenity Yoga
Postal Services, Couriers UPS Store
U.S. Post Office
Banks Bank of America
Bank of America ATM
Brookline Bank Cambridge Savings Bank Citizen's Bank Hanscom Federal Credit Union
Middlesex Savings Bank SalemFive Bank
Santander Bank TD Bank
Insurance
Harold F. Nichols Insurance Magovern Office Baldwin Insurance Normland Insurance
Richard A. Egan Insurance Agency
Real Estate
Higgins Group Realtors Shawsheen Realty Suzanne and Company Realty
Legal Services Brown and Brown
Michael Fulton Law Office Neil F. McCarran Attorney at Law Robert D'Auria Law Office
Finacial Advice, Investing, Services H&R Block
Aavishkar Innovations, Inc. College Funding Advisors
Arch., Engin., Design & Other Prof. Services Dahlgren Creative Mary Peacock Photography Newlex
QEI, Inc. Seaglex Software
Educational Services Callahan's Karate Elite Freestyle Karate
Business District Profile (cont’d) �
Business Listing by Category

Prepared by: Peg Barringer, FinePoint Associates, in collaboration with the Great Road Working Group www.FinePointAssociates.com
Great Road Commercial Corridor �
17
Healthcare Services American Muscle Care Clinic Back on Track Physical Therapy Barbara Crème, LMHC
Bedford Chiropractic Bedford Dental Arts
Bedford Muscular Therapy Bedford Orthodontics Bedford Periodontal & Dental Implant
Chestnut Dental Dogan Naomi M. Licensed Psychologist
Dr. Beth Douglas, Chiropractor Great Meadows Dental Group Jennifer Cecchetti
KLK Associates Massage Therapy Associates Qigong Acupuncture
Reliance Dental Care Robert M. Kennedy DDS
The Moss Group Well Effect
Social Assistance Clarendon Family Day Care Inc.
Right at Home
Artists Clayful Expressions
Martha Shea Smith
Accommodations
Bedford Motel Bedford Plaza Hotel
Hair, Skin & Nail Services
Aglow Tanning Salon Barber Shop
Body Temple Massage Great Clips Nails and Spa
Organic Nail and Spa Organix Spa and Salon
ProNails Spa Salon Elegante Salon Reyna Simply Nails and Spa
Simply Natural Nails Spa and Polish
Supercuts TL Nail Salon
Dry Cleaning, Laundry & Tailoring
Papazian Tailoring & Alterations Bedford Cleaners Great Cleaners
Lapel's Dry Cleaning Luongo's Cleaners
Top Cleaners
Pet Supplies & Services Cat Doctor
FetchIt Pet Life
Gas, Auto Sales, Parts & Services Minuteman Volkwagen Bedford Auto Parts
Bedford Car Wash Gas Station/Dunkin Donuts/Northside Convenience Gulf/Convenience Store Jiffy Lube Shell/Convenience Store
Sullivan's Tire and Auto Service Sunoco
Funeral Homes Bedford Funeral Home Shawsheen Funeral Home
Other Bedford Mechanical Argus Construction
Baudanza Electric Company
Bedford TV Bridge Interface Systems Builderwire Inc. Design 1 Kitchen and Bath
Hub Recruiting Mass Building Solutions
Mead Bros Tree Service RNK Telecommunications Technology Expectations, Inc.
Trans Tech Verdant Networks
Business District Profile (cont’d) �
Business Listing by Category

Prepared by: Peg Barringer, FinePoint Associates, in collaboration with the Great Road Working Group www.FinePointAssociates.com
Great Road Commercial Corridor ��
18
E. Comparative Business Mix Analysis �
Business District Profile (cont’d) �
Compared to Lexington Center and Wellesley Center, a few establishment types that Great Road has in lower supply include:
! Clothing & Accessory Stores (although Great Road contains TJ Maxx and Marshalls which are classified as general merchandise/department stores but contain predominantly clothing)
! Sporting goods, hobby
! Additional educational service businesses, especially for young people (e.g., dance school, tutoring/test prep/afterschool programs)
! Additional healthcare/medical offices (e.g., chiropractor, acupuncture, physical therapy, psychologist, etc.)
! Additional professional services (e.g., accounting, architecture, web design, photography, etc.)
A few other commonly found tenants not present in the Great Road Corridor include:
! Restaurants that offer entertainment such as live music, open mic nights games, etc. (although Red Heat Tavern has recently begun hosting Trivia Nights)
! Fine dining options
! Cosmetics/beauty products store
! Gym/fitness center/YMCA (however, there are two fitness centers located just outside of the study area, Summit Fitness and Boston Sports Club nearby in Lexington)
On the other hand, Great Road has an abundance of restaurants and personal services.
For a community the size of Bedford, there appear to be quite a large and varied mix of retail and services.
The chart below illustrates the business mix in the Great Road Corridor compared to two other town center commercial districts (Lexington and Wellesley) as well as two typical types of single-developer commercial centers. In comparison to all of the other commercial centers, Great Road has a slightly larger proportion of eating and drinking places. In comparison to Typical Community Shopping Centers and Lifestyle Centers, Great Road has a smaller proportion of comparison goods and a larger portion of personal services.
0% 10% 20% 30% 40% 50% 60% 70% 80% 90%
100%
Great Road Corridor
Lexington Center Wellesley Center Typical Community Shopping Ctr. (125k-400k sf)
Typical Lifestyle Center
Est
ablis
hmen
ts
Figure 15. Retail Mix (*excludes professional services and other non-retail)
Eating, Drinking & Entertainment/Recreation
Comparison Goods (General, Apparel, Furniture & Other)
Convenience Goods & Personal Services

Prepared by: Peg Barringer, FinePoint Associates, in collaboration with the Great Road Working Group www.FinePointAssociates.com 19
Figure 16. Comparison with Other Commercial Centers (Selected Categories by Number of Establishments)
Business District Profile (cont’d) �
E. Comparative Business Mix Analysis (cont’d) � 0 10 20 30 40 50 60 70
441 - Motor Vehicle & Parts
442 - Furniture & Furnishings
443 - Electronics & Appliances
444 - Building Materials & Garden Equip
445 - Food & Beverage Stores
446 - Health & Personal Care Stores
447 - Gasoline Stations
448 - Clothing and Accessories
451 - Sporting Goods, Hobby, Books
452 - General Merchandise Stores
453/454 - Misc. Retail Stores & Nonstore Retail
71 - Arts, Entertainment & Recreation
721 - Accommodation
722 - Eating and Drinking Places
52 - Finance & Insurance
53 - Real Estate and Rental and Leasing
54 - Professional, Scientific & Technical Services
61 - Educational Services
62 - Health Care & Social Assistance
811 - Repair and Maintenance (incl. auto)
812 - Personal Care & Laundry Services
Great Road Corridor
Lexington Center
Wellesley Center
Great Road Commercial Corridor ��

Prepared by: Peg Barringer, FinePoint Associates, in collaboration with the Great Road Working Group www.FinePointAssociates.com 20
Great Road Commercial Corridor �
Part II. Market Profile: Understanding the Potential Retail Market ��A. Overview of Potential Market Segments�
Businesses located in the Great Road Corridor have the opportunity to serve several potential market segments. These market segments include: 1) Residents of the Surrounding Area (primary trade area residents and secondary trade area residents) and 2) Non Resident Market Segments, consisting of
- Employees of Nearby Businesses (primary segment) - Employees and College Students located elsewhere in Bedford (secondary segment)
Residents of the Surrounding Area�The major potential customer base for the Great Road Corridor is the adjacent residential population. The identified primary trade area (where most of the repeat business is expected to be derived) is comprised of the Towns of Bedford, Carlisle, Concord, Lexington and the Hanscom Air Force Base. The primary trade area contains approximately 75,153 residents. The secondary trade area is identified as a 7-mile radius, containing approximately 236,231 residents. The rationale for the trade area delineation and the demographic and consumer characteristics of the population in each trade area are described in following sections of this report. Non Resident Market Segments - Employees of Area Businesses and College Students�In addition to the residential customer base, there is a very large daytime population of employees and college students that represent a market opportunity for lunchtime meal purchase as well as other convenience goods and services purchased before and after work or school. The primary employee market segment is comprised of the employees that work in very close proximity to the business corridor. This includes the Great Road/Wiggins Avenue Area and the Hanscom Air Force Base. The Great Road/Wiggins Avenue Area has over 4,000 employees and the Hanscom Air Force Base (located in Bedford and Lincoln) has close to 10,000 employees. A secondary employee and student market segment is comprised of employees in Bedford not located in the immediate area (estimated over 15,000) and students of Middlesex Community College. A large concentration of employees is located in the Crosby Road/Middlesex Turnpike Area. The Bedford campus of Middlesex Community College is located about 2.5 miles from the Great Road Corridor. More information about the non-resident market segments is presented later in this report. Note: According to “Municipal Data”, Massachusetts Office of Workforce and Labor Development Website, the total 2015 employee count for Bedford is 21,942.
Prepared by: Peg Barringer, FinePoint Associates, in collaboration with the Great Road Working Group www.FinePointAssociates.com 21
Market Profile (cont’d) �
�
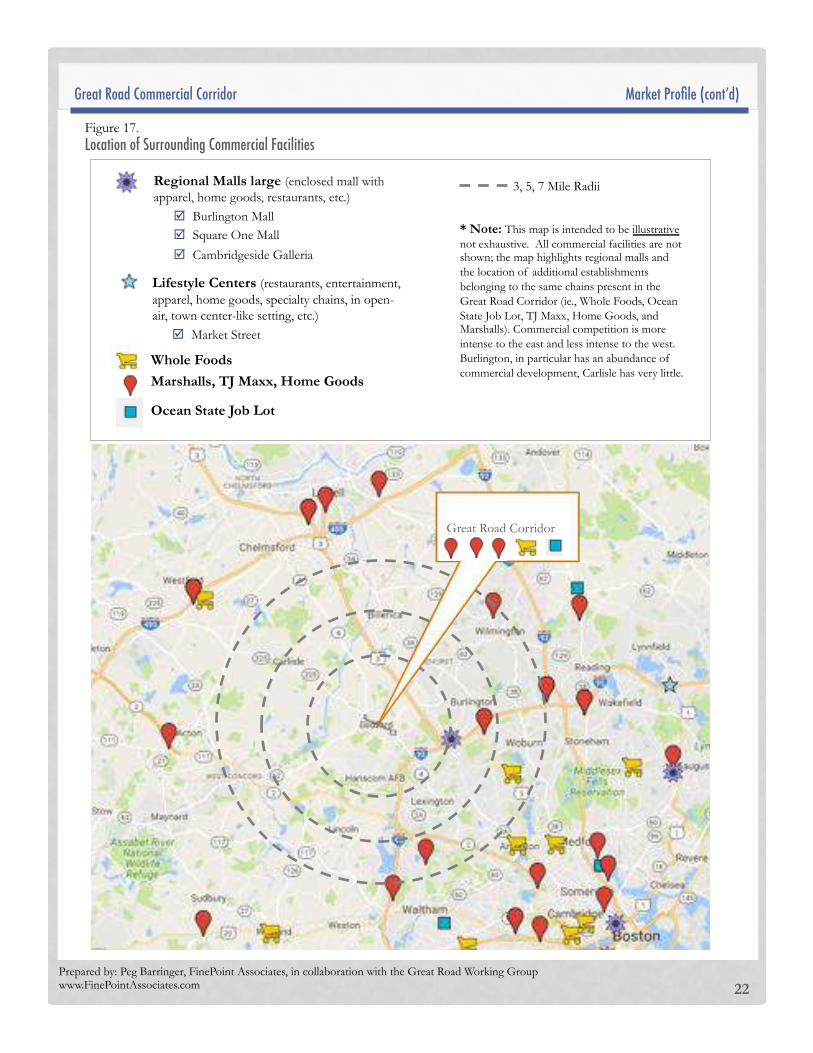
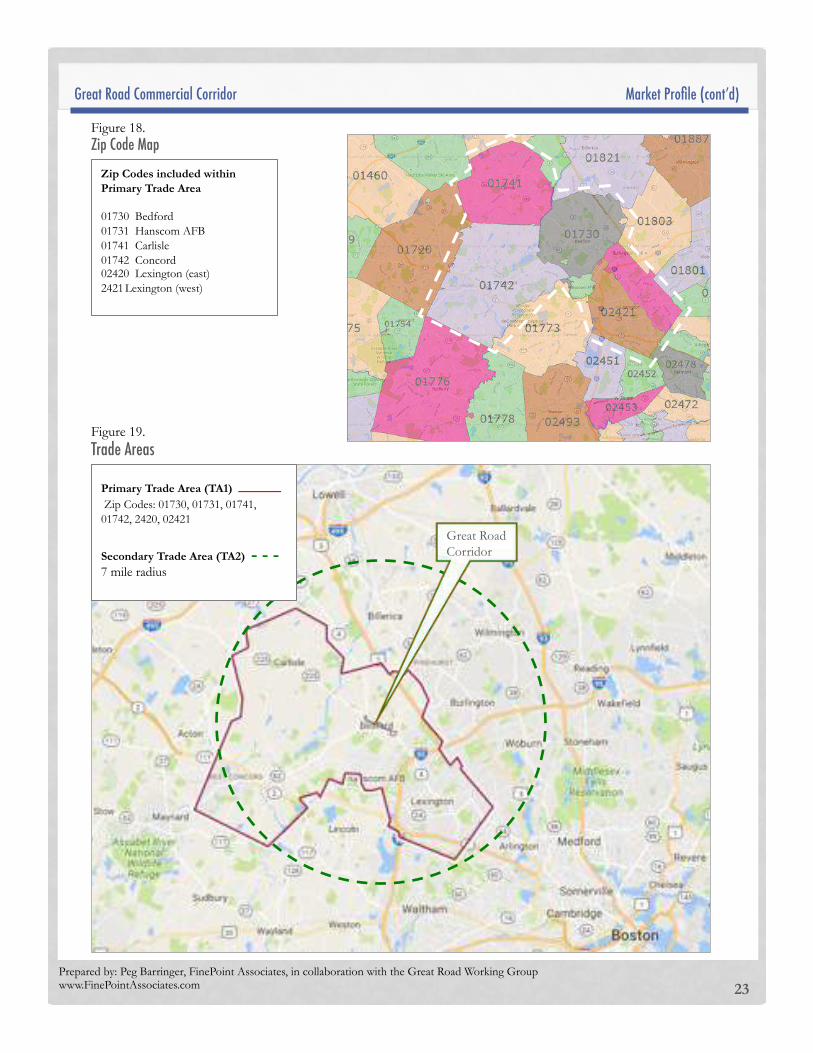
B. Resident Market Segment � 1. Trade Area Delineation�Defining the trade area is the first step in determining market potential for a commercial district. Once the trade area is defined, we can quantify the amount of potential customers that live within the area as well as examine their characteristics and purchasing habits to provide a picture of the potential market. The term retail trade area refers to the geographic area from which a retail entity generates its sales. The primary trade area for a commercial center, such as a downtown, business district or shopping plaza, is the area from which most of the steady, repeat business is derived (typically, where 65-80% of the total sales are generated). A combination of factors determines the size and boundaries of the primary trade area include: travel time and distance for shoppers, travel patterns, location of competing commercial centers, physical barriers that might effect access, socio-economic characteristics, and the size and scope of the commercial center itself. (Generally, the larger the variety, breadth and uniqueness of the merchandise offerings, the greater the distance customers are willing to travel, and therefore, the larger the trade area will be.) The competing commercial facilities surrounding the Great Road Commercial Corridor are identified in Figure 18 on the following page. (Note that this map is intended to be illustrative of key competitors; not all commercial facilities are shown.) The competition becomes much greater to the east of Route 3 (Burlington) and to the south of Lexington. After assessing the location of existing commercial facilities, discussing consumers patterns with local business owners and residents and reviewing travel times and circulation routes, it was determined that the likely potential primary trade area for the Business District is comprised of the communities of Bedford, Carlisle, Concord, Lexington and the Hanscom Air Force Base (see Figure 19). Only part of the Town of Lincoln (the part that contains the Hanscom Air Force Base) is included in the primary trade area. While the residents of the Hanscom Air Force Base can easily exit the Hartwell Avenue gate and travel the short distance to shop in the Great Road Corridor, access for the rest of the Lincoln residents is more difficult. The Hanscom Air Force Base and Airfield create a trade barrier that Lincoln residents living south of Route 2A must circumvent to travel to the Great Road Corridor, making them more likely to shop in Lexington, Waltham and Concord. There may also be potential to attract some customers from a secondary trade area, the area included within a 7-mile radius (see Figure 19). This secondary trade area was identified because it represents a relatively reasonable travel time to acquire goods and services. However, it is expected that capture rate would be significantly less than in the primary trade area and would depend on the uniqueness and quality of the merchandise or services being offered. The demographic and consumer characteristics of the population in these trade areas is described throughout the following section. �
Sources: The Nielsen Company, U.S. Census, InfoUSA, American Community Survey, Primary Data Collection, FinePointAssociates
Great Road Commercial Corridor �
Prepared by: Peg Barringer, FinePoint Associates, in collaboration with the Great Road Working Group www.FinePointAssociates.com
22
Regional Malls large (enclosed mall with apparel, home goods, restaurants, etc.)
" Burlington Mall " Square One Mall
" Cambridgeside Galleria
Lifestyle Centers (restaurants, entertainment, apparel, home goods, specialty chains, in open-air, town center-like setting, etc.)
" Market Street
Whole Foods
Marshalls, TJ Maxx, Home Goods
Ocean State Job Lot
Figure 17. Location of Surrounding Commercial Facilities�
Market Profile (cont’d) �
* Note: This map is intended to be illustrative not exhaustive. All commercial facilities are not shown; the map highlights regional malls and the location of additional establishments belonging to the same chains present in the Great Road Corridor (ie., Whole Foods, Ocean State Job Lot, TJ Maxx, Home Goods, and Marshalls). Commercial competition is more intense to the east and less intense to the west. Burlington, in particular has an abundance of commercial development, Carlisle has very little.
•
3, 5, 7 Mile Radii
Great Road Corridor
Great Road Commercial Corridor �
Prepared by: Peg Barringer, FinePoint Associates, in collaboration with the Great Road Working Group www.FinePointAssociates.com 23
Figure 18. Zip Code Map�
Market Profile (cont’d) �
Great Road Corridor
Primary Trade Area (TA1) ____ Zip Codes: 01730, 01731, 01741, 01742, 2420, 02421
Secondary Trade Area (TA2) - - - 7 mile radius
Figure 19. Trade Areas�
Zip Codes included within Primary Trade Area 01730 Bedford 01731 Hanscom AFB 01741 Carlisle 01742 Concord 02420 Lexington (east) 2421 Lexington (west)
Great Road Commercial Corridor �
Prepared by: Peg Barringer, FinePoint Associates, in collaboration with the Great Road Working Group www.FinePointAssociates.com 24
Market Profile (cont’d) �
B. Resident Market Segment (cont’d) � 2. Trade Area Consumer Characteristics��Primary Trade Area (TA1) �There are approximately 73,153 people living within the primary trade area. The population is predominantly high income, and highly educated. The estimated median household income for 2016 is $137,363, which is close to double the statewide median of $69,807. There is a significant upper income segment – 32% of the households earn over $200,000 per year. Educational attainment is high -- 72% of the population (over the age of 25) has at least a Bachelor’s Degree and 43% has a Master’s Degree or higher compared statewide rates of 40% and 18% respectively. The population is predominantly White (78%), with a significantly large portion of Asians (15% compared to 6% in MA), and relatively small portion of Black/African Americans (3%) and other races (4%). Only 4% of the population is Hispanic compared to 11% statewide. The most significant cultural/ancestral concentrations are Asian (15%), Irish (12%), Italian (9%) and English (8%) compared to concentration in the United States of 5%, 7%, 4% and 5% respectively. Compared to Massachusetts overall, the primary trade area population, on average, is older, more likely to be married, have children under 18 in the household, own their home and have a car. The median age is 44.6, about 17% higher than in Massachusetts and 23% higher than in the US. 20% of the population is 65 years of age or older compared to 16% in the state and 15% in the U.S. The population is comprised predominantly of family households (74%), meaning more than one person in the household related by blood or marriage, with an above-average percentage of 2-parent households. 37% of the households contain children under 18, compared to 31% statewide and 34% in the U.S. About 23% of the households contain only one person, compared to 29% statewide. Homeownership is significantly higher; 77% of the occupied homes are owner-occupied compared to 62% statewide. The vast majority of the market has mobile access to a private vehicle for acquiring goods and services. Only a very small portion of households (6%) do not own a vehicle and therefore represent a market segment dependent on public transportation or walking to acquire goods and services. In fact, two-thirds of the households have 2 cars or more. Projected Growth - The population and the number of households in the primary trade area is expected to grow at a higher rate than rate than Massachusetts overall. According to projections obtained from Nielsen, between 2016 and 2021, the population is expected to grow annually by approximately .99% and the number of households by 1.1%, while the statewide projections are .69% and .76%. These projections are based on data from the American Community Survey (conducted more frequently that the decennial census), data from the U.S. Post Office, new construction data, and the Nielsen Master Address File. Secondary Trade Area (TA2) �There are approximately 236,231 people living within the secondary trade area. Household income and educational attainment is lower than in the primary trade area but still higher than in Massachusetts overall. The median household income of $108,597 is about 21% lower than the primary trade area but still 55% higher than Massachusetts. In the secondary trade area, 54% of the population (over the age of 25) has at least a Bachelor’s Degree, compared to 72% in the primary trade area and 40% statewide. Race and ethnicity is similar in both trade areas, although the secondary trade area has a slightly lower percentage of Asian residents (12%) compared to 15% in the primary trade area and 6% in MA. The annual growth rate between 2016 and 2021 is projected at .95% for population and 1.0% for the number of households, fairly close to the primary trade area projections (.99% and 1.1%) and higher than the statewide projections (.69% and .76%). �A summary presentation of data charts and tables illustrating trade area consumer characteristics, expenditures and sales leakage analysis is presented in Section 4.
�Sources: The Nielsen Company, U.S. Census, InfoUSA, American Community Survey, Social Explorer
Great Road Commercial Corridor �
Prepared by: Peg Barringer, FinePoint Associates, in collaboration with the Great Road Working Group www.FinePointAssociates.com 25
Market Profile (cont’d) �
B. Resident Market Segment(cont’d) ���
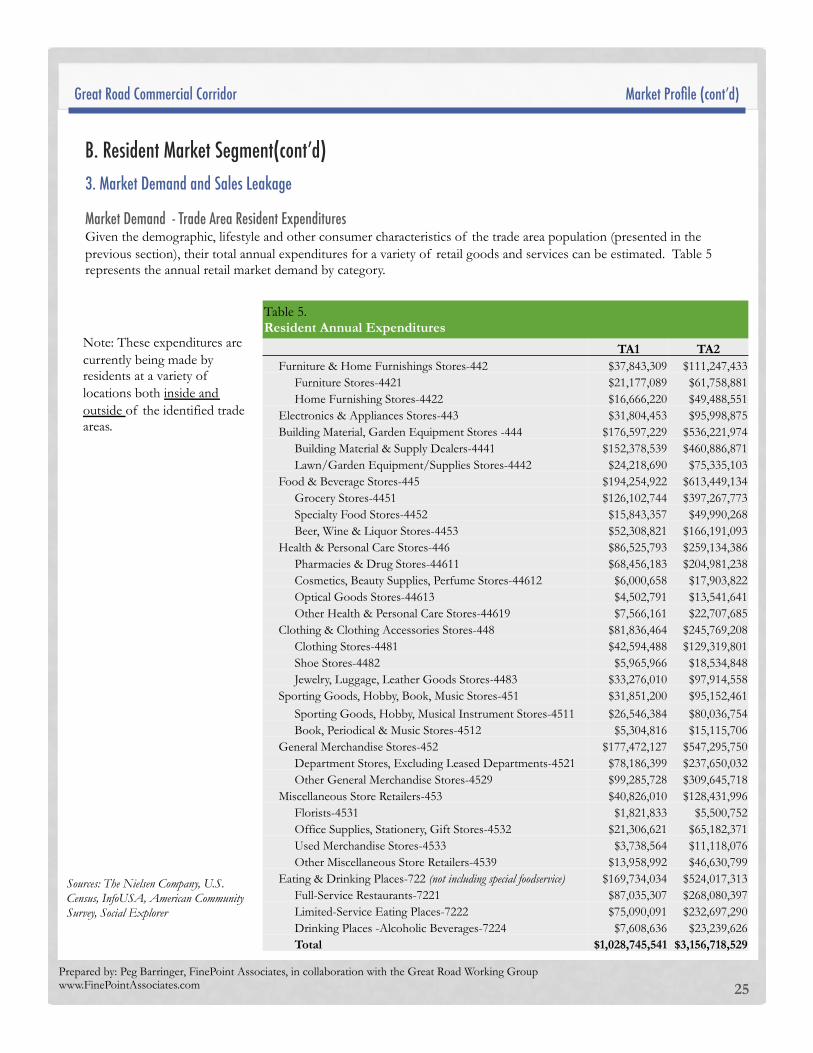
3. Market Demand and Sales Leakage��Market Demand - Trade Area Resident Expenditures Given the demographic, lifestyle and other consumer characteristics of the trade area population (presented in the previous section), their total annual expenditures for a variety of retail goods and services can be estimated. Table 5 represents the annual retail market demand by category.
Table 5. Resident Annual Expenditures
TA1 TA2 Furniture & Home Furnishings Stores-442 $37,843,309 $111,247,433
Furniture Stores-4421 $21,177,089 $61,758,881 Home Furnishing Stores-4422 $16,666,220 $49,488,551
Electronics & Appliances Stores-443 $31,804,453 $95,998,875 Building Material, Garden Equipment Stores -444 $176,597,229 $536,221,974
Building Material & Supply Dealers-4441 $152,378,539 $460,886,871 Lawn/Garden Equipment/Supplies Stores-4442 $24,218,690 $75,335,103
Food & Beverage Stores-445 $194,254,922 $613,449,134 Grocery Stores-4451 $126,102,744 $397,267,773 Specialty Food Stores-4452 $15,843,357 $49,990,268 Beer, Wine & Liquor Stores-4453 $52,308,821 $166,191,093
Health & Personal Care Stores-446 $86,525,793 $259,134,386 Pharmacies & Drug Stores-44611 $68,456,183 $204,981,238 Cosmetics, Beauty Supplies, Perfume Stores-44612 $6,000,658 $17,903,822 Optical Goods Stores-44613 $4,502,791 $13,541,641 Other Health & Personal Care Stores-44619 $7,566,161 $22,707,685
Clothing & Clothing Accessories Stores-448 $81,836,464 $245,769,208 Clothing Stores-4481 $42,594,488 $129,319,801 Shoe Stores-4482 $5,965,966 $18,534,848 Jewelry, Luggage, Leather Goods Stores-4483 $33,276,010 $97,914,558
Sporting Goods, Hobby, Book, Music Stores-451 $31,851,200 $95,152,461 Sporting Goods, Hobby, Musical Instrument Stores-4511 $26,546,384 $80,036,754 Book, Periodical & Music Stores-4512 $5,304,816 $15,115,706
General Merchandise Stores-452 $177,472,127 $547,295,750 Department Stores, Excluding Leased Departments-4521 $78,186,399 $237,650,032 Other General Merchandise Stores-4529 $99,285,728 $309,645,718
Miscellaneous Store Retailers-453 $40,826,010 $128,431,996 Florists-4531 $1,821,833 $5,500,752 Office Supplies, Stationery, Gift Stores-4532 $21,306,621 $65,182,371 Used Merchandise Stores-4533 $3,738,564 $11,118,076 Other Miscellaneous Store Retailers-4539 $13,958,992 $46,630,799
Eating & Drinking Places-722 (not including special foodservice) $169,734,034 $524,017,313 Full-Service Restaurants-7221 $87,035,307 $268,080,397 Limited-Service Eating Places-7222 $75,090,091 $232,697,290 Drinking Places -Alcoholic Beverages-7224 $7,608,636 $23,239,626 Total $1,028,745,541 $3,156,718,529
Note: These expenditures are currently being made by residents at a variety of locations both inside and outside of the identified trade areas.
Sources: The Nielsen Company, U.S. Census, InfoUSA, American Community Survey, Social Explorer
Great Road Commercial Corridor �

Prepared by: Peg Barringer, FinePoint Associates, in collaboration with the Great Road Working Group www.FinePointAssociates.com 26
Market Profile (cont’d) �
B. Resident Market Segment (cont’d) ��
Sales Leakage Analysis - General �A sales leakage analysis estimates the amount and type of annual purchases that residents are currently making outside of the trade area by comparing the projected resident expenditures with area business sales. If the analysis shows significant leakage, it might point to possible opportunities for new or existing businesses within those categories.
! More than 75,000 residents live within the primary trade area (TA1); these residents spend over $1.03 billion per year at stores and restaurants. Currently, more than $493 million is being spent outside TA1 in selected categories. There is at least some sales leakage in most categories, however, there is no sales leakage in the categories of Drug Stores, Limited Service Restaurants, Home Furnishings, Shoe Stores, Paint & Wallpaper Stores and Florists. The most significant sales leakage is in categories indicated by an asterisk in the table below. For the purposes of this analysis, “most significant” is defined as the categories in which a 60% market capture rate in the trade area would be sufficient to support at least one new business.
! More than 236,000 residents live within the secondary trade area (TA2); these residents spend over $3.16 billion per year at retail stores and restaurants. Currently, more than $774 million is being spent outside TA2 in selected categories. A much smaller market capture would be expected within this secondary trade area, however, depending on the uniqueness of the offering, there may be some opportunity for capturing expenditures especially for specialty retail or services.
Table 6. Sales Leakage in Selected Categories (millions)
TA1 TA2 Other General Merchandise Stores-4529 $90.99 * $208.54 Department Stores excl. Leased Depts-4521 $61.65 * $22.74 Home Centers-44411 $61.36 * $153.95 Supermarkets, Groc. (excl. Conv)-44511 $43.66 $33.82 Beer, Wine and Liquor Stores-4453 $39.96 * $130.20 Full-Service Restaurants-7221 $32.30 * $12.74 Clothing Stores-4481 $29.52 * -$49.18 Jewelry Stores-44831 $25.31 * $65.96 Furniture Stores-4421 $16.83 * -$0.28 Sporting Goods, Hobby Stores-4511 $13.14 * $22.74 Specialty Food Stores-4452 $13.04 * $39.43 Electronics and Appliance Stores-443 $9.52 -$9.53 Other Miscellaneous Store Retailers-4539 $9.30 * $24.60 Drinking Places- Alcoholic Beverages-7224 $7.47 * $22.52 Office Supplies and Stationery -45321 $7.25 -$8.44 Gift, Novelty and Souvenir Stores-45322 $7.16 * $13.76 Hardware Stores-44413 $5.41 -$34.24 Cosmetics, Beauty Supplies-44612 $4.81 * -$1.48 Book, Periodical and Music Stores-4512 $4.15 * $4.25 Other Health/Personal Care Stores-44619 $2.59 $9.20 Used Merchandise Stores-4533 $2.48 * $7.61 Optical Goods Stores-44613 $2.43 $1.23 Convenience Stores-44512 $2.36 -$0.09 Florists-4531 -$0.76 $0.38 Paint and Wallpaper Stores-44412 -$1.16 $0.10 Shoe Stores-4482 -$1.28 -$1.47 Home Furnishing Stores-4422 -$3.19 -$8.94 Limited-Service Eating Places-7222 -$14.26 -$1.03 Pharmacies and Drug Stores-44611 -$61.04 -$125.89
Sales leakage indicates a retail gap and a geographic advantage for new or existing businesses within the trade area (as it indicates that residents are currently traveling outside the trade area to acquire goods and services). However, some caveats should be noted as follows. 1) The potential for businesses to capture this sales leakage would be dependent on their ability to offer comparable quality goods, services and shopping environment to change existing consumer patterns. 2) Some business types (e.g., shoes, clothing, accessories) do best when they are clustered with related businesses that offer comparative and/or crossover options for consumers; therefore if there is no existing similar or related establishments already in the business district to build on, there might be less potential to recruit these types of businesses. 3) Some business categories are experiencing substantial decline in bricks and mortar locations due to intense online sales competition (e.g., bookstores) and therefore it would be less likely to attract new outlets of this type. 4) Although there may be sales leakage in certain categories, there might not be adequate space available or infrastructure (e.g., parking) to support the type of enterprise in the business district (e.g., large department stores, large electronic stores, supermarkets). Sources: The Nielsen Company, U.S. Census, InfoUSA, American Community Survey
Great Road Commercial Corridor �

Prepared by: Peg Barringer, FinePoint Associates, in collaboration with the Great Road Working Group www.FinePointAssociates.com 27
Market Profile (cont’d) �
B. Resident Market Segment (cont’d) ���
Sales Leakage Analysis – Eating and Drinking Places� ! Restaurants are typical recruitment targets for business districts and therefore worthy of special attention. Residents
within the primary trade area (TA1) spend close to $170 million per year at eating and drinking places while residents living within the secondary trade area (TA2) spend over $524 million.
! The findings of the sales leakage analysis for the various restaurant categories are provided in the Table 7. Category definitions are provided below. (However, it should be noted that the distinctions between categories are not always consistently applied.)
! There is at least $32 million of unmet demand (annual expenditures not captured) for Full Service Restaurants in the primary trade area and close to $13 million in the secondary trade area.
! The analysis shows no sales leakage in the Limited-Service Eating Places Category. In fact, there is a substantial surplus. This is likely due to significant sales in this category generated from a non-resident market segment, specifically the employees of area businesses. It is possible that there is unmet market opportunity in this category, but it cannot be identified from this sales leakage analysis.
! A summary of demographic characteristics and consumer
patterns is presented in Figure 6 and table 3.
Sources: The Nielsen Company, U.S. Census, InfoUSA, American Community Survey, Social Explorer
Table 7. Eating & Drinking Places Sales Leakage Analysis
Annual Resident Expenditures Sales Leakage
TA1 TA2 TA1 TA2
Total Eating & Drinking Places! $169,734,034 $524,017,313 Full-Service Restaurants$ $87,035,307 $268,080,397 $32,304,390 $12,741,875 Limited-Service Eating Places$ $75,090,091 $232,697,290 -$14,261,997 -$1,030,961 Drinking Places$ $7,608,636 $23,239,626 $7,473,423 $22,516,143
Definitions
Full Service Restaurant: This industry group comprises establishments primarily engaged in providing food services to patrons who order and are served while seated (i.e., waiter/waitress service) and pay after eating. Establishments that provide these types of food services to patrons with any combination of other services, such as takeout services, are classified in this industry.
Limited Service Restaurants: This industry group comprises establishments primarily engaged in providing food services where patrons generally order or select items and pay before eating. Most establishments do not have waiter/waitress service, but some provide limited service, such as cooking to order (i.e., per special request), bringing food to seated customers, or providing off-site delivery.
Drinking Places: This industry group comprises establishments primarily engaged in preparing and serving alcoholic beverages for immediate consumption.
Great Road Commercial Corridor �
Prepared by: Peg Barringer, FinePoint Associates, in collaboration with the Great Road Working Group www.FinePointAssociates.com
* Excludes motor vehicle and gas station purchases. ** All data is 2016 estimates unless noted.
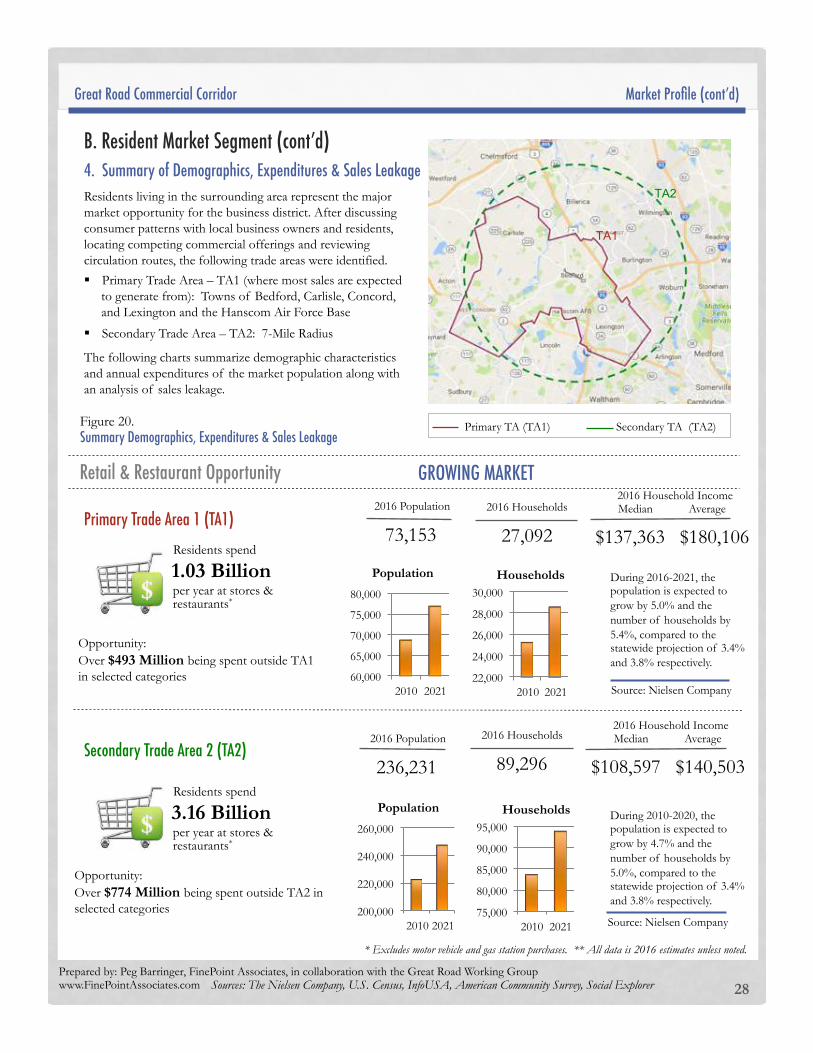
Residents living in the surrounding area represent the major market opportunity for the business district. After discussing consumer patterns with local business owners and residents, locating competing commercial offerings and reviewing circulation routes, the following trade areas were identified.
! Primary Trade Area – TA1 (where most sales are expected to generate from): Towns of Bedford, Carlisle, Concord, and Lexington and the Hanscom Air Force Base
! Secondary Trade Area – TA2: 7-Mile Radius
The following charts summarize demographic characteristics and annual expenditures of the market population along with an analysis of sales leakage.
28
Secondary Trade Area 2 (TA2) �
2016 Population
73,153
2016 Households
27,092
2016 Household Income Median Average
$137,363 $180,106
2016 Population
236,231
2016 Households
89,296
2016 Household Income Median Average
$108,597 $140,503
Opportunity: Over $774 Million being spent outside TA2 in selected categories
22,000
24,000
26,000
28,000
30,000
2010 2021
Households
60,000
65,000
70,000
75,000
80,000
2010 2021
Population
GROWING MARKET�Retail & Restaurant Opportunity�
Residents spend
1.03 Billion per year at stores & restaurants*
Residents spend
3.16 Billion per year at stores & restaurants*
Opportunity: Over $493 Million being spent outside TA1 in selected categories
Primary Trade Area 1 (TA1) �
B. Resident Market Segment (cont’d) ��
4. Summary of Demographics, Expenditures & Sales Leakage�
Market Profile (cont’d) �
75,000
80,000
85,000
90,000
95,000
2010 2021
Households
200,000
220,000
240,000
260,000
2010 2021
Population
During 2016-2021, the population is expected to grow by 5.0% and the number of households by 5.4%, compared to the statewide projection of 3.4% and 3.8% respectively.
Source: Nielsen Company
Source: Nielsen Company
Primary TA (TA1) Secondary TA (TA2)
During 2010-2020, the population is expected to grow by 4.7% and the number of households by 5.0%, compared to the statewide projection of 3.4% and 3.8% respectively.
TA1
TA2
Sources: The Nielsen Company, U.S. Census, InfoUSA, American Community Survey, Social Explorer
Figure 20. Summary Demographics, Expenditures & Sales Leakage�
Great Road Commercial Corridor �

Prepared by: Peg Barringer, FinePoint Associates, in collaboration with the Great Road Working Group www.FinePointAssociates.com
- 5 10 15 20 25 30 35
<$25,000
$25 - $49,999
$50 - $74,999
$75 - $99,999
$100 - $149,999
$150,000 +
Thousands
Households by Income
TA1 TA2 Households not in TA1
- 5,000 10,000 15,000 20,000 25,000 30,000
Other nonfamily
One person
Other family
Married couple
Single parent
Married couple
Households by Composition
TA1 TA2 Households not in TA1
Market Profile (cont’d) �
29
Median age is in TA1 and in TA2 compared to 39.7 statewide and 38.0 in U.S.
44.6 � 43.5 �
of households in TA1 and in TA2 contain children compared to 31% statewide and 34% U.S.
37% �
34% �
Race & Ethnicity
TA1 TA2 MA
White Alone 78% 82% 78% Black/African American 3% 3% 7% Asian 15% 12% 6% Other/More than 1 Race 4% 4% 8% Latino/Hispanic 4% 4% 11%
77% � Homeowners in TA1, in TA2, 62% in MA 75%�
2.6 �Persons per Household in TA1 and 2.6 in TA2 compared to 2.5 statewide
0%
10%
20%
30%
40%
0-14 15-24 25 - 44 45 - 64 65 +
Population by Age TA1 TA2 U.S.
77% �of TA1 and 60% of TA2 residents have an Associates Degree or higher (48% MA, 37% U.S.). 72% of TA1 and 54% of TA2 have at least a Bachelor’s Degree (40% MA, 29% U.S.).
21% of TA1 and 19% of TA2 residents speak a language besides English at home
Asian/Pacific Island Language: 9% and 6% Indo/European Language: 9%, Spanish: 2%, Other: <1%
CU
LT
UR
AL
MIX
Residents
Lifestyle
Kid
s N
o K
ids
households in TA1 have income > $75,000; Median household income is $137,363 and $108,137 in TA1 & TA2; $69,807 statewide, $55,551 in U.S.
19,363 �
74% Families TA1 66% in U.S.
. . . 6% car-free households in TA1 and
6% in TA2 -- these residents are likely to shop close to home Foot Traffic� . . . �
Cultural Concentration/Ancestry TA1 TA2 US
Asian 15% 12% 5% Irish 12% 18% 7% Italian 9% 14% 4% English 8% 7% 5%
Figure 20. (cont’d): Summary Demographics, Expenditures & Sales Leakage�
Sources: The Nielsen Company, U.S. Census, InfoUSA, American Community Survey, Social Explorer
Great Road Commercial Corridor �

Prepared by: Peg Barringer, FinePoint Associates, in collaboration with the Great Road Working Group www.FinePointAssociates.com
Expenditures
TA1 TA2
$37.8 $111.2
$31.8 $96.0
$176.6 $536.2
$194.3 $613.4
$86.5 $259.1
$81.8 $245.8
$31.9 $95.2
$177.5 $547.3
$40.8 $128.4 $169.7 $524.0
$ millions
Market Profile (cont’d) �
30
-100% -50% 0% 50% 100%
Furniture & Home Furnishings
Electronics & Appliances
Bldg. Materials, Garden Equip. & Supply*
Food & Beverage Stores
Health & Personal Care Stores
Clothing & Accessories
Sporting Gds., Hobby, Books, Music
General Merchandise
Misc. Store Retailers
Food Service & Drinking (excl. spec. foodservices)
Local Demand Compared to Local Business Sales
TA1 TA2 Sales Leakage/Opportunity�
Est. Sales Leakage - Select Categories *
TA1
TA2
Furniture Stores-4421 $16.83 * ($0.28) Home Furnishing Stores-4422 ($3.19) ($8.94) Electronics and Appliance Stores-443 $9.52 ($9.53) Home Centers-44411 $61.36 * $153.95 Paint and Wallpaper Stores-44412 ($1.16) $0.10 Hardware Stores-44413 $5.41 ($34.24) Supermarkets, Groc. (Ex Conv)-44511 $43.66 $33.82 Convenience Stores-44512 $2.36 ($0.09) Specialty Food Stores-4452 $13.04 * $39.43 Beer, Wine and Liquor Stores-4453 $39.96 * $130.20 Pharmacies and Drug Stores-44611 ($61.04) ($125.89) Cosmetics, Beauty Supplies-44612 $4.81 * ($1.48) Optical Goods Stores-44613 $2.43 $1.23 Other Health/Personal Care Stores-44619 $2.59 $9.20 Clothing Stores-4481 $29.52 * ($49.18) Shoe Stores-4482 ($1.28) ($1.47) Jewelry Stores-44831 $25.31 * $65.96 Sporting Goods, Hobby Stores-4511 $13.14 * $22.74 Book, Periodical and Music Stores-4512 $4.15 * $4.25 Department Stores Ex Leased Depts-4521 $61.65 * $22.74 Other General Merchandise Stores-4529 $90.99 * $208.54 Florists-4531 ($0.76) $0.38 Office Supplies and Stationery -45321 $7.25 * ($8.44) Gift, Novelty and Souvenir Stores-45322 $7.16 * $13.76 Used Merchandise Stores-4533 $2.48 * $7.61 Other Miscellaneous Store Retailers-4539 $9.30 * $24.60 Full-Service Restaurants-7221 $32.30 * $12.74 Limited-Service Eating Places-7222 ($14.26) ($1.03) Drinking Places- Alcoholic Beverages-7224 $7.47 * $22.52
Opportunity Gap (Sales Leakage) The retail categories with high sales leakage may suggest opportunity for local businesses (existing and/or new businesses). To determine the feasibility of capturing the leakage, it is necessary to evaluate the strength of the competing businesses outside of the trade area that are currently attracting resident expenditures.
In categories showing little or no leakage, it does not necessarily mean that there is no opportunity. There might be opportunity depending on the ability of local businesses to attract expenditures from non-resident market segments (i.e., employees and visitors) and/or overtake trade from existing competition by offering more desirable products or services. Negative Sales Leakage (Surplus) Categories with negative sales leakage indicate that businesses are currently meeting more than just local demand. Businesses in these categories are generating sales from customers that live outside of the identified trade area which may include employees of nearby businesses or visitors travelling into the district from beyond the immediate area because of attractions or destination businesses. *Note: Sales leakage calculations include all businesses in the trade area, not just the business in the commercial district.
Spen
ding P
ower�
$ millions *Sales Leakage - In the categories indicated with an asterisk, the current sales leakage is sufficient to support at least one new business (of average size) under a 60% capture ratio in the Primary Trade Area (TA1).
Figure 20. (cont’d) Summary Demographics, Expenditures & Sales Leakage�
Sources: The Nielsen Company, U.S. Census, InfoUSA, American Community Survey, Social Explorer
Great Road Commercial Corridor �
Prepared by: Peg Barringer, FinePoint Associates, in collaboration with the Great Road Working Group www.FinePointAssociates.com
Market Profile (cont’d) �
31
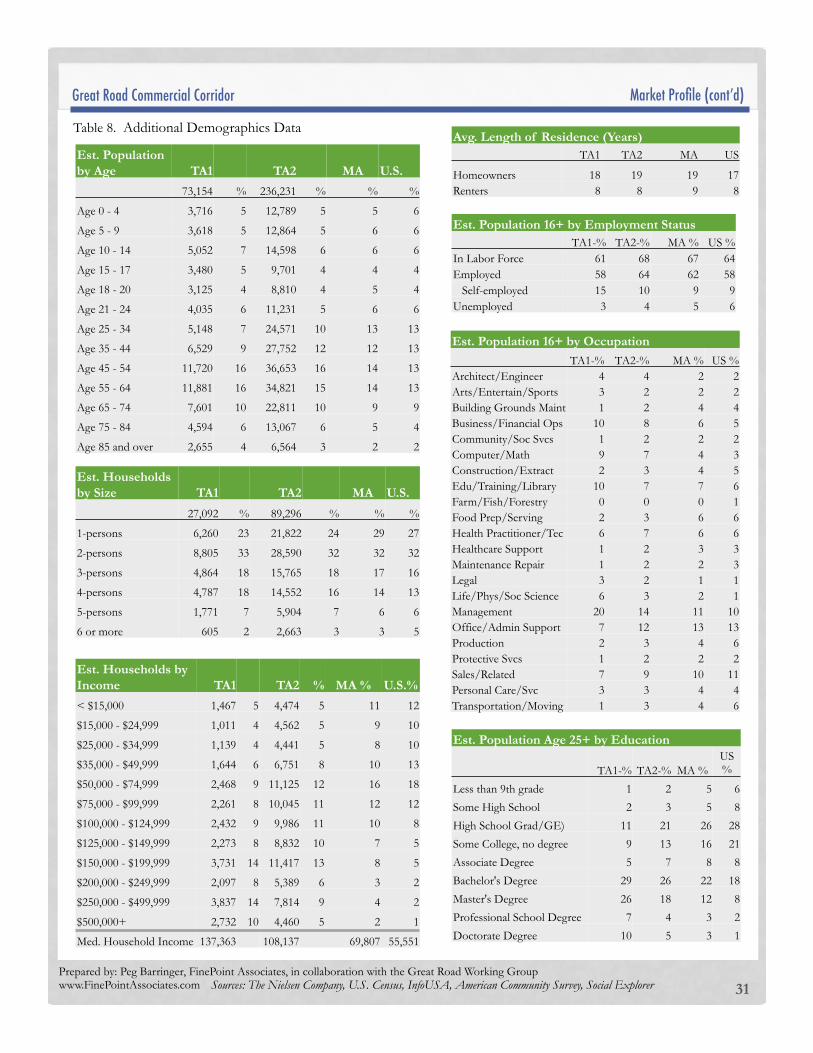
Table 8. Additional Demographics Data
Est. Population by Age TA1 TA2 MA U.S.
73,154 % 236,231 % % %
Age 0 - 4 3,716 5 12,789 5 5 6
Age 5 - 9 3,618 5 12,864 5 6 6
Age 10 - 14 5,052 7 14,598 6 6 6
Age 15 - 17 3,480 5 9,701 4 4 4
Age 18 - 20 3,125 4 8,810 4 5 4
Age 21 - 24 4,035 6 11,231 5 6 6
Age 25 - 34 5,148 7 24,571 10 13 13
Age 35 - 44 6,529 9 27,752 12 12 13
Age 45 - 54 11,720 16 36,653 16 14 13
Age 55 - 64 11,881 16 34,821 15 14 13
Age 65 - 74 7,601 10 22,811 10 9 9
Age 75 - 84 4,594 6 13,067 6 5 4
Age 85 and over 2,655 4 6,564 3 2 2
Est. Population Age 25+ by Education
TA1-% TA2-% MA % US %
Less than 9th grade 1 2 5 6
Some High School 2 3 5 8
High School Grad/GE) 11 21 26 28
Some College, no degree 9 13 16 21
Associate Degree 5 7 8 8
Bachelor's Degree 29 26 22 18
Master's Degree 26 18 12 8
Professional School Degree 7 4 3 2
Doctorate Degree 10 5 3 1
Avg. Length of Residence (Years) TA1 TA2 MA US
Homeowners 18 19 19 17 Renters 8 8 9 8
Est. Population 16+ by Occupation TA1-% TA2-% MA % US %
Architect/Engineer 4 4 2 2 Arts/Entertain/Sports 3 2 2 2 Building Grounds Maint 1 2 4 4 Business/Financial Ops 10 8 6 5 Community/Soc Svcs 1 2 2 2 Computer/Math 9 7 4 3 Construction/Extract 2 3 4 5 Edu/Training/Library 10 7 7 6 Farm/Fish/Forestry 0 0 0 1 Food Prep/Serving 2 3 6 6 Health Practitioner/Tec 6 7 6 6 Healthcare Support 1 2 3 3 Maintenance Repair 1 2 2 3 Legal 3 2 1 1 Life/Phys/Soc Science 6 3 2 1 Management 20 14 11 10 Office/Admin Support 7 12 13 13 Production 2 3 4 6 Protective Svcs 1 2 2 2 Sales/Related 7 9 10 11 Personal Care/Svc 3 3 4 4 Transportation/Moving 1 3 4 6
Est. Population 16+ by Employment Status TA1-% TA2-% MA % US %
In Labor Force 61 68 67 64 Employed 58 64 62 58 Self-employed 15 10 9 9 Unemployed 3 4 5 6
Est. Households by Size TA1 TA2 MA U.S.
27,092 % 89,296 % % %
1-persons 6,260 23 21,822 24 29 27
2-persons 8,805 33 28,590 32 32 32
3-persons 4,864 18 15,765 18 17 16
4-persons 4,787 18 14,552 16 14 13
5-persons 1,771 7 5,904 7 6 6
6 or more 605 2 2,663 3 3 5
Est. Households by Income TA1 TA2 % MA % U.S.%
< $15,000 1,467 5 4,474 5 11 12
$15,000 - $24,999 1,011 4 4,562 5 9 10
$25,000 - $34,999 1,139 4 4,441 5 8 10
$35,000 - $49,999 1,644 6 6,751 8 10 13
$50,000 - $74,999 2,468 9 11,125 12 16 18
$75,000 - $99,999 2,261 8 10,045 11 12 12
$100,000 - $124,999 2,432 9 9,986 11 10 8
$125,000 - $149,999 2,273 8 8,832 10 7 5
$150,000 - $199,999 3,731 14 11,417 13 8 5
$200,000 - $249,999 2,097 8 5,389 6 3 2
$250,000 - $499,999 3,837 14 7,814 9 4 2
$500,000+ 2,732 10 4,460 5 2 1
Med. Household Income 137,363 108,137 69,807 55,551
Sources: The Nielsen Company, U.S. Census, InfoUSA, American Community Survey, Social Explorer
Great Road Commercial Corridor �
Prepared by: Peg Barringer, FinePoint Associates, in collaboration with the Great Road Working Group www.FinePointAssociates.com
Market Profile (cont’d) �
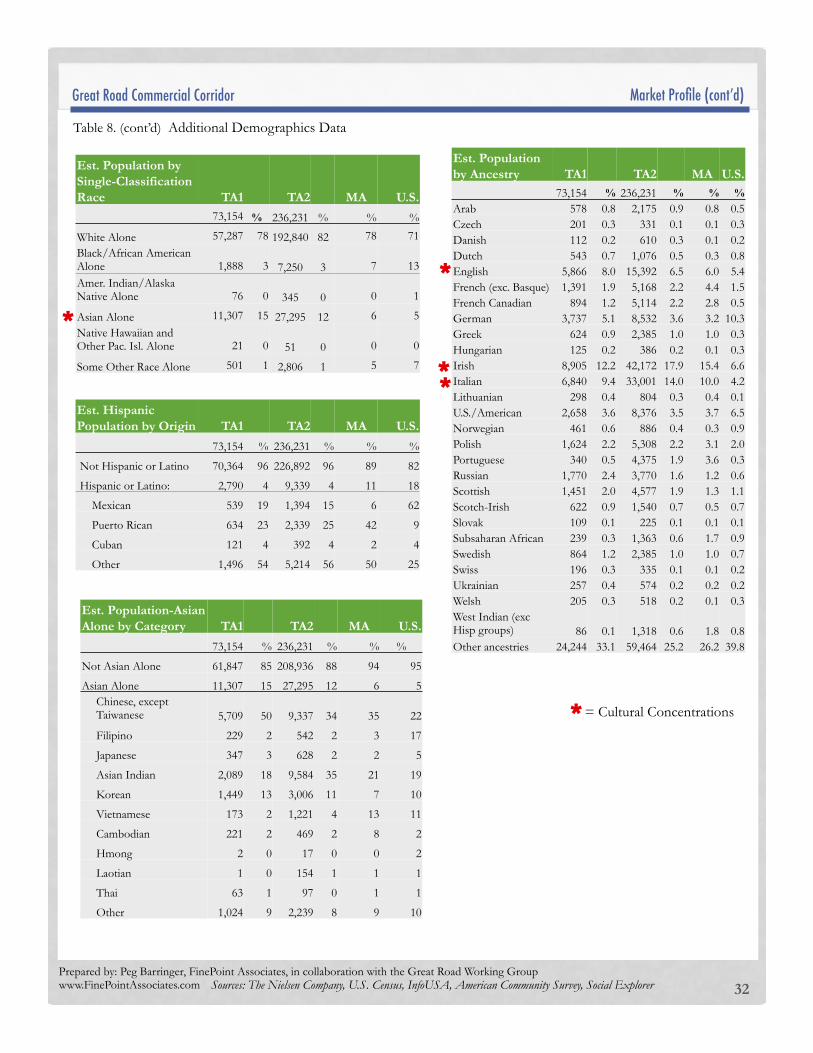
32
Est. Population by Ancestry TA1 TA2 MA U.S.
73,154 % 236,231 % % % Arab 578 0.8 2,175 0.9 0.8 0.5 Czech 201 0.3 331 0.1 0.1 0.3 Danish 112 0.2 610 0.3 0.1 0.2 Dutch 543 0.7 1,076 0.5 0.3 0.8 English 5,866 8.0 15,392 6.5 6.0 5.4 French (exc. Basque) 1,391 1.9 5,168 2.2 4.4 1.5 French Canadian 894 1.2 5,114 2.2 2.8 0.5 German 3,737 5.1 8,532 3.6 3.2 10.3 Greek 624 0.9 2,385 1.0 1.0 0.3 Hungarian 125 0.2 386 0.2 0.1 0.3 Irish 8,905 12.2 42,172 17.9 15.4 6.6 Italian 6,840 9.4 33,001 14.0 10.0 4.2 Lithuanian 298 0.4 804 0.3 0.4 0.1 U.S./American 2,658 3.6 8,376 3.5 3.7 6.5 Norwegian 461 0.6 886 0.4 0.3 0.9 Polish 1,624 2.2 5,308 2.2 3.1 2.0 Portuguese 340 0.5 4,375 1.9 3.6 0.3 Russian 1,770 2.4 3,770 1.6 1.2 0.6 Scottish 1,451 2.0 4,577 1.9 1.3 1.1 Scotch-Irish 622 0.9 1,540 0.7 0.5 0.7 Slovak 109 0.1 225 0.1 0.1 0.1 Subsaharan African 239 0.3 1,363 0.6 1.7 0.9 Swedish 864 1.2 2,385 1.0 1.0 0.7 Swiss 196 0.3 335 0.1 0.1 0.2 Ukrainian 257 0.4 574 0.2 0.2 0.2 Welsh 205 0.3 518 0.2 0.1 0.3 West Indian (exc Hisp groups) 86 0.1 1,318 0.6 1.8 0.8 Other ancestries 24,244 33.1 59,464 25.2 26.2 39.8
Est. Population-Asian Alone by Category TA1 TA2 MA U.S.
73,154 % 236,231 % % %
Not Asian Alone 61,847 85 208,936 88 94 95
Asian Alone 11,307 15 27,295 12 6 5 Chinese, except Taiwanese 5,709 50 9,337 34 35 22
Filipino 229 2 542 2 3 17
Japanese 347 3 628 2 2 5
Asian Indian 2,089 18 9,584 35 21 19
Korean 1,449 13 3,006 11 7 10
Vietnamese 173 2 1,221 4 13 11
Cambodian 221 2 469 2 8 2
Hmong 2 0 17 0 0 2
Laotian 1 0 154 1 1 1
Thai 63 1 97 0 1 1
Other 1,024 9 2,239 8 9 10
Est. Hispanic Population by Origin TA1 TA2 MA U.S.
73,154 % 236,231 % % %
Not Hispanic or Latino 70,364 96 226,892 96 89 82
Hispanic or Latino: 2,790 4 9,339 4 11 18
Mexican 539 19 1,394 15 6 62
Puerto Rican 634 23 2,339 25 42 9
Cuban 121 4 392 4 2 4
Other 1,496 54 5,214 56 50 25
= Cultural Concentrations
Table 8. (cont’d) Additional Demographics Data
Sources: The Nielsen Company, U.S. Census, InfoUSA, American Community Survey, Social Explorer
Est. Population by Single-Classification Race TA1 TA2 MA U.S.
73,154 % 236,231 % % %
White Alone 57,287 78 192,840 82 78 71 Black/African American Alone 1,888 3 7,250 3 7 13 Amer. Indian/Alaska Native Alone 76 0 345 0 0 1
Asian Alone 11,307 15 27,295 12 6 5 Native Hawaiian and Other Pac. Isl. Alone 21 0 51 0 0 0
Some Other Race Alone 501 1 2,806 1 5 7
Great Road Commercial Corridor �
*
**
*
*
Prepared by: Peg Barringer, FinePoint Associates, in collaboration with the Great Road Working Group www.FinePointAssociates.com 33
C. Non Resident Market Segments In addition to the residential customer base, there is a very large daytime population of employees and college students in Bedford. This represents a market opportunity for lunchtime meal purchase as well as other convenience goods and services purchased before and after work. Employees or college students might be interested in taking care of errands and personal care close to their work or school (such as dry cleaning, tailoring, hair and nail services, dental services, banking services), purchasing lunch, coffee, breakfast or snacks, or shopping at one of the large retailers (e.g., Marshalls, TJ Maxx). 1. Employee Market Segment – Primary �
The primary employee market segment is comprised of the employees that work in very close proximity to the business corridor. This includes two primary employee concentrations: 1) the Great Road/Wiggins Avenue Area in Bedford and 2) the Hanscom Air Force Base (AFB) in Bedford and Lincoln. The Great Road/Wiggins Avenue Area includes many employers and over 4,000 employees. A few of largest employers are Instrumentation Laboratories, Toxicon Corporation, Anika Therapeutics and EMD Millipore. Hanscom Air Force Base has close to 10,000 military and civilian employees on site. A breakdown is provided below. Hanscom AFB Total Employees: 9,936 MIT Lincoln Lab – 3,798 Contractors – 2,054 Active Duty – 1,412 Life Cycle Management Center Civilians – 1,873 Dept. of Defense Civilians – 417 MA National Guard – 290 Non-Dept. of Defense Civilians – 92
Source: http://www.hanscom.af.mils
2. Employee & Student Market Segment – Secondary � The secondary employee and student market segment is comprised of the other employees in Bedford not located in the immediate area (estimated at over 15,000) and the students of Middlesex Community College. The largest concentration of employees is located in the Crosby Road/Middlesex Turnpike Area (about a 2.2 – 3.2 mile drive from Great Road) on the east side of Route 3. Middlesex Community College is located about a 2.2 mile drive from Great Road on the west side of Route 3. This segment is considered secondary because the consumers (employees and students) are located further away from Great Road and close to Route 3, with easy access to other dining and shopping options. However, recently the Town has launched a new shuttle service which might attract more users from this segment. Currently only in the pilot phase, the shuttle runs a route from the Crosby Drive Area to the Great Road Commercial Corridor once per week bringing employees into the area at lunchtime. A few of the largest employers in Crosby Road/Middlesex Turnpike Area includes: Interactive Data, MITRE Corporation, Progress Software, RSA Security and iRobot Corporation. Middlesex Community College is also located within close proximity to Route 3 offering employees and student easy access to competing facilities.
Market Profile (cont’d) �Great Road Commercial Corridor �

Prepared by: Peg Barringer, FinePoint Associates, in collaboration with the Great Road Working Group www.FinePointAssociates.com 34
Part III. Consumer Patterns and Preference Survey��
A. Survey Overview
The purpose of the Consumer Patterns and Preference Survey is to expand on the findings of the Market Profile research. This primary research provides information specifically about the customers of the Great Road Corridor including consumer behavior that might point to potential market opportunities as well as satisfaction level with the current offerings and conditions. The survey was conducted from September 26 to October 26, 2016. Survey Market Segment Targets �The survey was targeted to the users of the Great Road Corridor. The two primary market segments targeted were the residents of the primary trade area and the employees of businesses located within close proximity and easy access to the Corridor. These segments are identified as “primary” because the potential market capture is expected to be the greatest due to juxtaposition and other previously discussed locational factors. We also attempted to obtain information about “secondary” employee and student segments located in other parts of Bedford that may also present market opportunity for businesses in the corridor, although likely to a lesser extent due to their access to competing commercial facilities.
! Primary Trade Area (TA1) Residents - residents of Bedford and surrounding communities of Carlisle, Concord, Lexington and Hanscom AFB.
! Primary Employee Market Segment - employees of Great Road/Wiggins Avenue Area and Hanscom AFB.
! Secondary Employee and Student Segments - employees and students of Middlesex Community College and employees of Crosby Road/Middlesex Turnpike Area (although we only received a small number of responses from the later)
�Survey Response�In total, 927 survey responses were received, a very strong response for a community the size of Bedford.
�
Explanation of Survey Response Segregation & Data Labels�Many survey respondents fall into more than one category. For example, some Middlesex Community College students and Great Road Area employees are also TA1 residents. In the analysis and charts that follow, the responses from employees and students whom are not TA1 residents are frequently segregated and highlighted. This is done in order to provide a more accurate portrayal of the market consumers whom represent an additional demand segment. We have also segregated Bedford responses from Other TA1 residents to illustrate any differences and to better represent Other TA1 residents, given the large portion of Bedford respondents.
Survey Response Tally
Total Survey Responses 927
Primary Trade Area Residents 706
Bedford Residents 660
Other TA1 Residents 46
Primary Employee Market Segment 162
Great Road/Wiggins Area Employees 95
Hanscom Air Force Base Employees 67
Secondary Employee & Student Segments 135
Middlesex Community College Employees/Students 105
Crosby Road/Middlesex Area Employees 15
Data Label Definition
All TA1 Res. Includes responses from all TA1 residents
Bedford Res. Includes responses from only Bedford residents
Other TA1 Res. Includes responses from other TA1 residents (Carlisle, Concord, Lexington, Hanscom AFB)
Primary Empl – Non Res.
Includes only responses from primary employee segment respondents whom are not residents of the TA1
Second. Empl/Stu – Non Res.
Includes only responses from secondary employee & student segment respondents whom are not residents of the TA1
Primary Empl – All
Includes all responses from primary employee segment
Second. Empl/Stu – All
Includes all responses from secondary employee & student segments
Table 9.
Great Road Commercial Corridor �

Prepared by: Peg Barringer, FinePoint Associates, in collaboration with the Great Road Working Group www.FinePointAssociates.com 35
B. Consumer Patterns
�1. Patronage Frequency and Trends�Customers visit the Corridor frequently. Bedford residents visit Great Road establishments an average of 3.07 times per week, while other TA1 residents visit 2.21 times per week. The primary employees (whom are not TA1 residents) make an average of 1.9 visits per week and the secondary employees & students (whom are not TA1 residents), on average, visit just under once per week. Patronage appears to be holding constant or increasing among all market segments. All Bedford residents reported either no change or an increase in their visits to Great Road establishments over the last few years. Not a single Bedford resident reported a decrease in visits. Among the other TA1 residents, close to the same portion increased their visits (24%) as decreased their visits (20%). This was also the case with the primary employee segment - 25% reported an increase and 25% reported a decrease. On the other hand, the secondary employee/student segment showed an overall increase in visits; 31% reported an increase while only 9% reported a decrease.
Consumer Patterns and Preference (cont’d) �
0%
10%
20%
30%
40%
50%
60%
70%
80%
90%
Stayed the Same Increased Decreased Does Not Apply
Change in Patronage Over Last Few Years
All PTA Res. Bedford Res. Other PTA Res. Primary Empl -Non Res. Second. Empl/Stu - Non Res.
�2. Establishments Visited�Consumers tend to visit more than one establishment during their shopping/dining trips to Great Road. TA1 residents visit an average of 2.05 establishments each trip. Even the employee segments visit multiple establishments per trip (an average of 1.6) indicating they are patronizing other establishments beyond just making meal purchases.
3.05 3.07
2.21 1.90
0.93
0.00
0.50
1.00
1.50
2.00
2.50
3.00
3.50
All PTA Res. Bedford Res. Other PTA Res.
Primary Empl - Non
Res.
Second. Empl/Stu - Non Res.
Weekly Visits to Great Road Corridor Establishments (Weighted Average Estimate)
2.05 2.07 1.94
1.60 1.60
0.00
0.50
1.00
1.50
2.00
2.50
All PTA Res. Bedford Res. Other PTA Res.
Primary Empl - Non
Res.
Second. Empl/Stu - Non Res.
Number of Establishments Visited During Most Recent Great Road Shopping/Dining Trip
(Weighted Average Estimate)
Figure 21.
Figure 22.
Figure 23.
Great Road Commercial Corridor �

Prepared by: Peg Barringer, FinePoint Associates, in collaboration with the Great Road Working Group www.FinePointAssociates.com 36
2. Establishments Visited (Cont’d) �
As illustrated in Figure 24, Great Road Establishment of all types enjoy significant patronage from both resident and employee market segments. The most frequently visited establishments by TA1 residents (more than 35% each week) include CVS, Stop & Shop, Whole Foods, Restaurants for Carryout, Banks, Restaurants for Eat-In, and Marshalls. This list comprises the most frequently visited establishments by both Bedford residents and Other TA1 residents with the exception of Banks, which are much less frequently visited by non-Bedford residents. The survey results further suggest that 15 – 34% of Bedford residents visit the following establishments each week: Hardware/Home Improvement Store, Liquor Store, TJ Maxx, Home Goods, The Paper Store, Ocean State Job Lot, Dry Cleaners, and Hair, Skin or Nail Services. For Other TA1 residents, the survey results suggest 15 – 34% visit the following establishments each week: TJ Maxx, Ocean State Job Lot, Hardware/Home Improvement Store, Home Goods, The Paper Store, Liquor Store, Banks, and Hair, Skin or Nail Services. As expected, the employee and student segments most frequently visit restaurants (both for carryout and eat-in), however, they also frequently visit Whole Foods. The survey results suggest that 35-50% of the primary employee segment (whom are not TA1 residents) visit the following establishments each week: Restaurants for Carryout, Whole Foods, and Restaurants for Eat-In. In addition, 15-34% visit: CVS, Stop & Shop, Banks, Home Goods, TJ Maxx, and Marshalls.
Consumer Patterns and Preference (cont’d) �
0% 10% 20% 30% 40% 50% 60% 70% 80%
CVS
Stop & Shop
Whole Foods
Restaurant - Carry out
Bank
Restaurant- Eat In
Marshalls
Hardware, home imp. store
Liquor store
TJ Maxx
Home Goods
The Paper Store
Ocean State Job Lot
Dry cleaners
Hair, skin or nail service
Pet supplies or services
Other professional services
Recreation (karate, yoga, pilates)
Healthcare establishment
Resale clothing, antique store
Great Road Corridor Establishments Visited in Last 7 Days
All PTA Res.
Bedford Res.
Other PTA Res.
Primary Empl -Non Res.
Second. Empl/Stu - Non Res.
Figure 24.
Great Road Commercial Corridor �
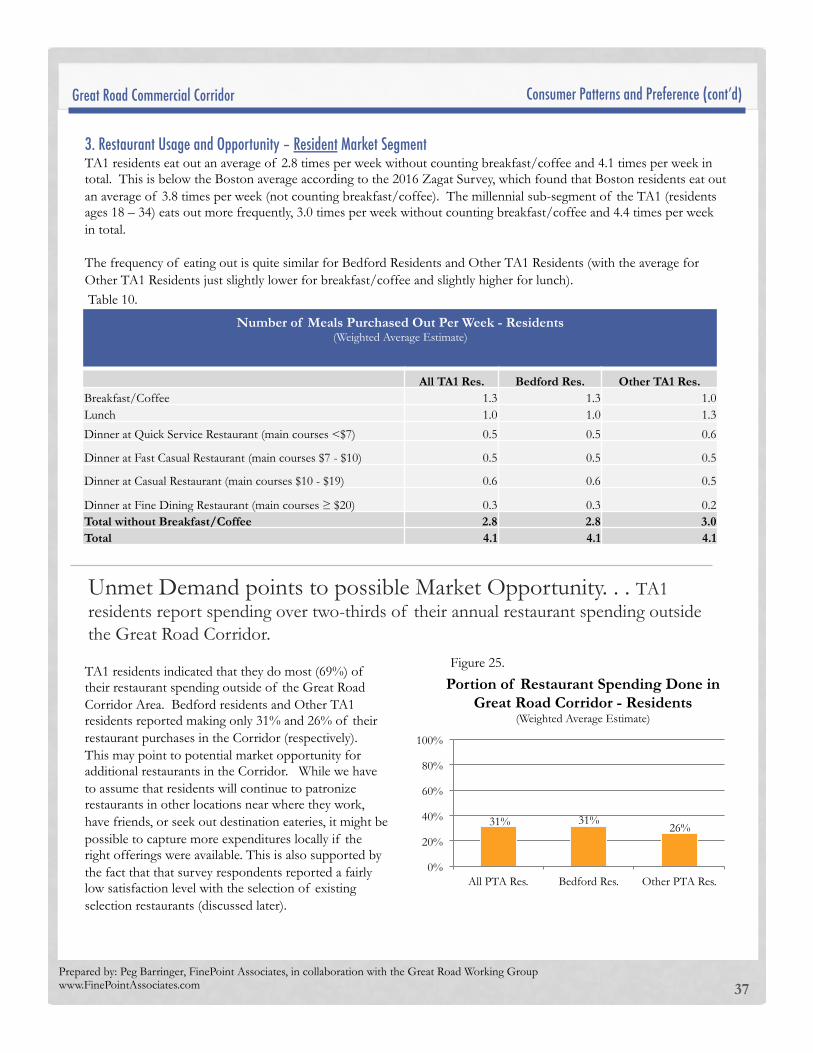
Prepared by: Peg Barringer, FinePoint Associates, in collaboration with the Great Road Working Group www.FinePointAssociates.com 37
3. Restaurant Usage and Opportunity – Resident Market Segment �TA1 residents eat out an average of 2.8 times per week without counting breakfast/coffee and 4.1 times per week in total. This is below the Boston average according to the 2016 Zagat Survey, which found that Boston residents eat out an average of 3.8 times per week (not counting breakfast/coffee). The millennial sub-segment of the TA1 (residents ages 18 – 34) eats out more frequently, 3.0 times per week without counting breakfast/coffee and 4.4 times per week in total. The frequency of eating out is quite similar for Bedford Residents and Other TA1 Residents (with the average for Other TA1 Residents just slightly lower for breakfast/coffee and slightly higher for lunch).
Consumer Patterns and Preference (cont’d) �
TA1 residents indicated that they do most (69%) of their restaurant spending outside of the Great Road Corridor Area. Bedford residents and Other TA1 residents reported making only 31% and 26% of their restaurant purchases in the Corridor (respectively). This may point to potential market opportunity for additional restaurants in the Corridor. While we have to assume that residents will continue to patronize restaurants in other locations near where they work, have friends, or seek out destination eateries, it might be possible to capture more expenditures locally if the right offerings were available. This is also supported by the fact that that survey respondents reported a fairly low satisfaction level with the selection of existing selection restaurants (discussed later).
31% 31% 26%
0%
20%
40%
60%
80%
100%
All PTA Res. Bedford Res. Other PTA Res.
Portion of Restaurant Spending Done in Great Road Corridor - Residents
(Weighted Average Estimate)
Number of Meals Purchased Out Per Week - Residents (Weighted Average Estimate)
All TA1 Res. Bedford Res. Other TA1 Res. Breakfast/Coffee 1.3 1.3 1.0 Lunch 1.0 1.0 1.3
Dinner at Quick Service Restaurant (main courses <$7) 0.5 0.5 0.6
Dinner at Fast Casual Restaurant (main courses $7 - $10) 0.5 0.5 0.5
Dinner at Casual Restaurant (main courses $10 - $19) 0.6 0.6 0.5
Dinner at Fine Dining Restaurant (main courses ≥ $20) 0.3 0.3 0.2 Total without Breakfast/Coffee 2.8 2.8 3.0 Total 4.1 4.1 4.1
Unmet Demand points to possible Market Opportunity. . . TA1 residents report spending over two-thirds of their annual restaurant spending outside the Great Road Corridor.
Figure 25.
Table 10.
Great Road Commercial Corridor �

Prepared by: Peg Barringer, FinePoint Associates, in collaboration with the Great Road Working Group www.FinePointAssociates.com
Work Day/School Day Meal Purchasing Market Capture by Great Road Businesses – Employees and Students
Primary Employee Market Segment
Coffee/Breakfast Lunch Drinks/appetizers after
Work/School Dinner on the way from or to
work/school
Secondary Employee and Student Segment (Great Road Market capture)
18% 15% 10% 12%
Capture 27%
Spent Outside
73%
38
4. Restaurant Usage and Opportunity– Employee and Student Market Segment �The large daytime population of employees creates a significant market opportunity for Great Road businesses especially restaurants. Lunch and coffee are the most frequent purchases made close to work locations, but employees also may stop for drinks after work, have dinner at a local restaurant or pick up a carryout meal on their way home. The employee and student segments spend an average of $32 - $37 per week on work day/school day meal purchases. Multiplied by the over 25,000 primary and secondary employees, this adds up to a very sizeable market, but it appears that the Great Road Corridor is only capturing a small portion. This may point to potential market opportunity. The table below indicates the work-related meal purchasing habits reported by local employees. The reported spending habits by the primary employee segment amounts to an average of $36.47 per week. The primary employee segment reported making a fairly modest portion of their work day meal purchases in the Great Road Corridor --- 33% of breakfast/coffee purchasing , 37% of lunch purchasing, 27% of dinner after work purchasing and only 19% of drinks/appetizers spending. The overall capture rate for all meal categories is 31%. The secondary employee and student segment reported spending even less in the Great Road Area; the capture rate for all meal categories is 15%.
Consumer Patterns and Preference (cont’d) �
Work Day/School Day Meal Purchasing
Times Per Week
Amount Spent Per Employee/Student Per Week
(Weighted Average Estimates)
Primary Empl - All
Second. Empl/Stu - All
Primary Empl - All
Second. Empl/Stu - All
Coffee/Breakfast 1.6 1.9 $6.27 $9.47 Lunch 1.4 1.3 $12.89 $11.79 Drinks/appetizers after Work/School 0.4 0.5 $4.42 $4.34 Dinner on the way from or to work/school 0.7 0.6 $12.89 $7.23
Total --- Work Day/School Day Only 4.1 4.3 $36.47 $32.84
Unmet Demand points to possible Market Opportunity. . . Employees working within close proximity spend an average of $36.47 per week on
work day meal purchases but report spending only 31% at Great Road restaurants.
Capture 37%
Spent Outside
63%
Capture 33%
Spent Outside
67%
Capture 19%
Spent Outside
81%
Table 11. Meal Purchasing Frequency and Amount Spent – Employees and Students
Figure 26. Meal Purchasing Market Capture by Great Road Businesses – Employees and Students
Great Road Commercial Corridor �
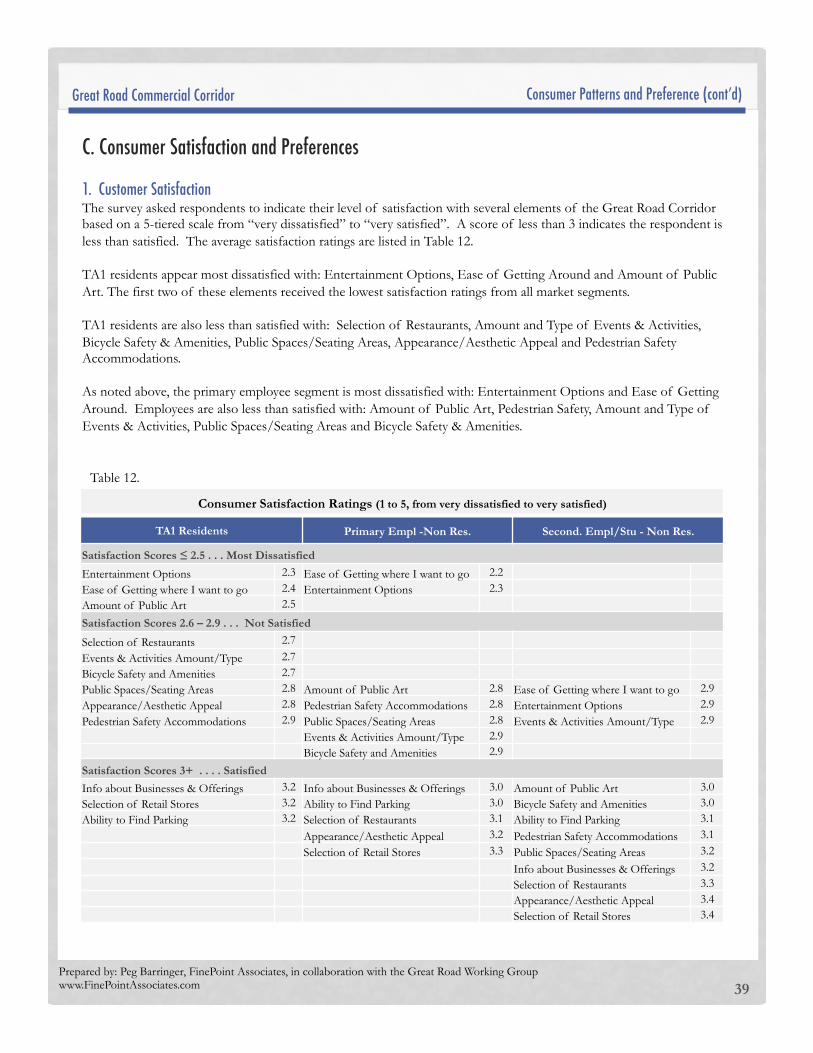
Prepared by: Peg Barringer, FinePoint Associates, in collaboration with the Great Road Working Group www.FinePointAssociates.com 39
C. Consumer Satisfaction and Preferences
�1. Customer Satisfaction�The survey asked respondents to indicate their level of satisfaction with several elements of the Great Road Corridor based on a 5-tiered scale from “very dissatisfied” to “very satisfied”. A score of less than 3 indicates the respondent is less than satisfied. The average satisfaction ratings are listed in Table 12. TA1 residents appear most dissatisfied with: Entertainment Options, Ease of Getting Around and Amount of Public Art. The first two of these elements received the lowest satisfaction ratings from all market segments. TA1 residents are also less than satisfied with: Selection of Restaurants, Amount and Type of Events & Activities, Bicycle Safety & Amenities, Public Spaces/Seating Areas, Appearance/Aesthetic Appeal and Pedestrian Safety Accommodations. As noted above, the primary employee segment is most dissatisfied with: Entertainment Options and Ease of Getting Around. Employees are also less than satisfied with: Amount of Public Art, Pedestrian Safety, Amount and Type of Events & Activities, Public Spaces/Seating Areas and Bicycle Safety & Amenities.
Consumer Patterns and Preference (cont’d) �
Consumer Satisfaction Ratings (1 to 5, from very dissatisfied to very satisfied)
TA1 Residents Primary Empl -Non Res. Second. Empl/Stu - Non Res.
Satisfaction Scores ≤ 2.5 . . . Most Dissatisfied
Entertainment Options 2.3 Ease of Getting where I want to go 2.2 Ease of Getting where I want to go 2.4 Entertainment Options 2.3 Amount of Public Art 2.5
Satisfaction Scores 2.6 – 2.9 . . . Not Satisfied
Selection of Restaurants 2.7
Events & Activities Amount/Type 2.7 Bicycle Safety and Amenities 2.7 Public Spaces/Seating Areas 2.8 Amount of Public Art 2.8 Ease of Getting where I want to go 2.9 Appearance/Aesthetic Appeal 2.8 Pedestrian Safety Accommodations 2.8 Entertainment Options 2.9 Pedestrian Safety Accommodations 2.9 Public Spaces/Seating Areas 2.8 Events & Activities Amount/Type 2.9
Events & Activities Amount/Type 2.9 Bicycle Safety and Amenities 2.9
Satisfaction Scores 3+ . . . . Satisfied
Info about Businesses & Offerings 3.2 Info about Businesses & Offerings 3.0 Amount of Public Art 3.0 Selection of Retail Stores 3.2 Ability to Find Parking 3.0 Bicycle Safety and Amenities 3.0 Ability to Find Parking 3.2 Selection of Restaurants 3.1 Ability to Find Parking 3.1
Appearance/Aesthetic Appeal 3.2 Pedestrian Safety Accommodations 3.1
Selection of Retail Stores 3.3 Public Spaces/Seating Areas 3.2
Info about Businesses & Offerings 3.2
Selection of Restaurants 3.3 Appearance/Aesthetic Appeal 3.4 Selection of Retail Stores 3.4
Table 12.
Great Road Commercial Corridor �

Prepared by: Peg Barringer, FinePoint Associates, in collaboration with the Great Road Working Group www.FinePointAssociates.com 40
C. Consumer Satisfaction and Preferences
�2. Preferences About Business Mix �The survey asked respondents to indicate how they felt about having more various types of establishments in the Great Road Corridor based on a 5-tiered scale from “very undesirable” to “very desirable”. All market segments reported wanting more: Outdoor Dining, Casual Restaurants with Wait Staff, and Entertainment Venues (theater, music). In addition, TA1 residents would like more Fine Dining, Recreation (bowling, fitness, sports) and Arts Instruction (dance, music, art, etc.) Both employee segments expressed a desire for more Fast Casual Restaurants with Counter Service and Food & Beverage Stores, while TA1 residents were less interested in expanding these offerings. TA1 residents were also clear about what they feel would be less than desirable additions to the Corridor. . . including Banks, Hair, Skin & Nail Services, Other Services (real estate, legal, acctg) and Department Stores.
Consumer Patterns and Preference (cont’d) �
Consumer-Desired Business Mix Changes (ratings of 1 to 5, from very undesirable to very desirable)
TA1 Residents Primary Empl -Non Res. Second. Empl/Stu - Non Res.
Want More - Scores ≥ 3.5
Outdoor Dining 3.8 Outdoor Dining 3.7 Food & Beverage Stores 3.6
Casual Restaurants with Wait Staff 3.7 Restaurants offering Entertainment 3.7 Outdoor Dining 3.6
Fine Dining Restaurants 3.7 Food & Beverage Stores 3.6 Casual Restaurants with Wait Staff 3.6
Entertainment Venues (theater, music) 3.5 Casual Restaurants with Wait Staff 3.6 Fast Casual Restaurants -Counter Serv. 3.5 Recreation (bowling, fitness, sports) 3.5 Recreation (bowling, fitness, sports) 3.6 Clothing, Shoes & Accessory Stores 3.5 Arts Instruction (dance, music, art, etc.) 3.5 Entertainment Venues (theater, music) 3.6 Entertainment Venues (theater, music) 3.5
Fast Casual Restaurants -Counter Serv. 3.5 Fine Dining Restaurants 3.5
Do NOT want More – Scores ≤ 2.5
Department Stores 2.5
Other Services (real estate, legal, acctg) 2.5
Hair, Skin & Nail Services 2.3 Banks 1.8
Nuetral - Scores 2.6 – 3.4
Sporting Goods/Hobby/Craft Supply 3.4 Sporting Goods/Hobby/Craft Supply 3.4 Gifts, Novelty Stores 3.4 Restaurants offering Entertainment 3.3 Fine Dining Restaurants 3.4 Sporting Goods/Hobby/Craft Supply 3.4 Food & Beverage Stores 3.3 Clothing, Shoes & Accessory Stores 3.3 Recreation (bowling, fitness, sports) 3.4 Clothing, Shoes & Accessory Stores 3.3 Arts Instruction (dance, music, art, etc) 3.1 Restaurants offering Entertainment 3.4 Gifts, Novelty Stores 3.2 Home Imp., Hardware, Garden Supply 3.1 Arts Instruction (dance, music, art, etc) 3.2 Fast Casual Restaurants -Counter Serv. 2.8 Gifts, Novelty Stores 3.1 Banks 3.2 Healthcare Establishments 2.8 Electronics & Appliance Stores 2.9 Healthcare Establishments 3.2 Home Imp., Hardware, Garden Supply 2.8 Department Stores 2.9 Department Stores 3.2
Electronics & Appliance Stores 2.6 Other Services (real estate, legal, acctg) 2.8 Hair, Skin & Nail Services 3.1
Home Furnishings & Furniture Stores 2.6 Home Furnishings & Furniture Stores 2.8 Home Imp., Hardware, Garden Supply 3.0
Healthcare Establishments 2.7 Home Furnishings & Furniture Stores 3.0
Banks 2.6 Electronics & Appliance Stores 3.0 Hair, Skin & Nail Services 2.6 Other Services (real estate, legal, acctg) 2.8
Table 13.
Great Road Commercial Corridor �

Prepared by: Peg Barringer, FinePoint Associates, in collaboration with the Great Road Working Group www.FinePointAssociates.com 41
C. Consumer Satisfaction and Preferences
�2. Preferences About Business Mix (Cont’d) � The survey asked respondents an open-ended question about establishment types or specific businesses they would like to see in the Great Road Corridor -- the following represent some of the recurring themes among the responses. ! Entertainment and recreation uses: bowling, movie theater, gaming arcade, dance instruction, rock climbing, board
game pub, live music cafe ! Fitness facilities: gym, fitness centers, yoga ! Better selection of restaurants
! More sit-down restaurants, fine dining, gastro pub, upscale, nicer restaurants, small-menu fresh made food ! More ethnic restaurants of all kinds, especially Thai and Mexican ! Healthy food restaurants: healthy food options, Life Alive, ! Specific types of restaurants: diner, seafood, steakhouse, breakfast place, Panera, brew pub ! Independent/non-chain restaurants: independent café/coffee shop ! Many people mentioned how much they miss Café Luigi’s
! More small, independently owned businesses instead of chains ! Craft/hobby store, needlework, yarn, art supply ! Bakery/pastry shop ! Sporting goods ! Gift shop, small boutiques ! Cosmetics, Ulta ! Concern about additional retail increasing traffic ! Many people commented about wanting the full-size post office back in operation ! Some people mentioned how much they miss Staples
Consumer Patterns and Preference (cont’d) �Great Road Commercial Corridor �
Prepared by: Peg Barringer, FinePoint Associates, in collaboration with the Great Road Working Group www.FinePointAssociates.com 42
A. Summary of Findings�
1. Business and Real Estate Conditions� ! The commercial district is largely an auto-oriented corridor with free-standing businesses and several shopping plaza
along the 1.5 mile stretch. It is comprised of three commercial nodes: 1)North Road Node, 2)Bedford Center/Marketplace Node (the most central and walkable node), and 3)Great Road Shopping Center/Shawsheen Node.
! The Great Road Corridor contains close to 680,000 s.f. At the time of the inventory (August, 2016), 7% of the total commercial space was vacant.
! Lease rates for new/renovated commercial space in shopping centers is $35-$45 per square foot for the spaces with highest visibility and $25 - $30 for spaces set further back. Rent for less prime retail space along the corridor is $15 - $25 and renovated office space in upper floors is available for around $20 per square foot.
! The local realtors interviewed were positive about market conditions and rising demand, citing a rise in inquiries about space (especially food-related) and noting “there is an upward and upscale trajectory”. However, they also expressed concern over traffic congestion potentially restricting uses.
! The Great Road Corridor is home to approximately 162 establishments including retail, restaurants, services, contractors, public and non profit entities. (median size is 1,300 s.f.)
! Most of the establishments (64%) are independently-owned, single location businesses, 35% are chains and franchises, and 1% are public entities/nonprofits.
! Daily customer counts vary widely. Chain restaurants reported 300 to 500 daily customers while most independent restaurants and convenience goods retailers reported 100 to 300 customers. Busy service providers and medium-size retailers reported 50 to 100 customers and service providers with less foot traffic such as banks and small retailers reported counts of under 30. (We were not able to get customer counts for the large anchor retail stores.)
! 43% of the businesses interviewed reported sales have increased in the last 3 years, 33% said sales stayed about the same, and 24% said their sales have gone down.
2. Locational Advantages and Challenges for Businesses
Locational Advantages of Great Road Corridor: ��
! Easy access from 128 ! Lots of traffic, “main drag”, people passing through from other communities ! High visibility for business ! Location close to Lexington line ! Opportunity for crossover patronage from other nearby businesses ! Access to market population with high disposable incomes
Part III. Summary of Findings and Suggestions for Consideration�
Great Road Commercial Corridor ��

Prepared by: Peg Barringer, FinePoint Associates, in collaboration with the Great Road Working Group www.FinePointAssociates.com 43
A. Summary of Findings (cont’d) �
Locational Disadvantages/Challenges (cited by businesses that were interviewed): ��
! Traffic congestion, especially certain times of day, resulting in customers avoiding the area ! Restrictive sign regulations prevent visibility for business ! Too many chains/franchises, too many of the same kind, would like more independent businesses and more variety ! North Road Node is unfriendly for pedestrians/bikes, no cross walk, unsafe for walking customers, especially children ! Inadequate parking, signage about parking �3. Business Mix ��! 50% of the establishments in the Corridor are services, 22% are retailers, 19% are restaurants and 9% other. Large
anchors include Stop & Shop, Whole Foods, Marshalls, TJ Maxx, Home Goods and Ocean State Job Lot
! The most represented industry subsectors (based on the number of establishments include: 1) Eating & Drinking Places, 2) Personal Care & Laundry (especially salons), and 3) Health Care.
! Several existing business clusters create crossover and comparative patronage synergy, including: Eating & Drinking, Women’s Clothing & Accessories, Home Furnishing, Home Improvement and Hair, Skin, Nail & Spa Services
! In comparison to other commercial centers, Great Road has a slightly larger proportion of eating & drinking places (likely due to the large daytime employee base). Example of establishments less present in Great Road compared to other town centers (Wellesley, Lexington) or similar commercial corridors: fine dining, sporting goods/hobby, independent clothing boutique/gift store, educational services, cosmetics/beauty products store, additional healthcare services, restaurants that offer entertainment such as live music, open mic nights games, etc. (although Red Heat Tavern has recently begun hosting Trivia Nights)
4. Market Conditions �Resident Market Segment ��
75,153 people live within the primary trade area (consisting of Bedford, Carlisle, Concord, Lexington and the Hanscom Air Force Base). This population is growing faster than the statewide average. The median household income is $137,363, close to double the statewide median of $69,807. There is a significant upper income segment – 32% of the households earn over $200,000 per year. Educational attainment is high (72% have Bachelor’s Degrees, 43% have Master’s Degrees).
Summary & Suggestions (cont’d) �
Most Significant Leakage TA1 Other General Merchandise Stores-4529 $90.99 Department Stores Ex Leased Depts-4521 $61.65 Home Centers-44411 $61.36 Beer, Wine and Liquor Stores-4453 $39.96 Full-Service Restaurants-7221 $32.30 Clothing Stores-4481 $29.52 Jewelry Stores-44831 $25.31 Furniture Stores-4421 $16.83 Sporting Goods, Hobby Stores-4511 $13.14 Specialty Food Stores-4452 $13.04 Other Miscellaneous Store Retailers-4539 $9.30 Drinking Places- Alcoholic Beverages-7224 $7.47 Gift, Novelty and Souvenir Stores-45322 $7.16 Cosmetics, Beauty Supplies-44612 $4.81
Residents of the primary trade area (TA1) spend approximately $1.03 billion per year at stores and restaurants. A comparison of resident expenditures to sales of trade area businesses shows a gap of $493 million indicating that TA1 residents are spending at least that amount outside of the trade area. The most significant leakage is in the categories illustrated in the table to the right. 236,231 people live within the secondary trade area (where it might be possible to draw a small portion of sales depending on the uniqueness and quality of merchandise or services being offered). The median household income is $108,597, 55% higher than the statewide median. Residents of the secondary trade area spend $3.16 billion per year at stores and restaurants and the sales leakage analysis shows they are spending at least $774 million outside the trade area.
Great Road Commercial Corridor �
Prepared by: Peg Barringer, FinePoint Associates, in collaboration with the Great Road Working Group www.FinePointAssociates.com 44
A. Summary of Findings (cont’d) ��Non-Resident Market Segments��
In addition to the residential customer base, there is a very large daytime population of employees and college students representing a market opportunity for lunchtime meal purchases as well as other convenience goods and services. The primary employee market segment . . . is comprised of the employees that work in very close proximity to the business corridor including: 1) the Great Road/Wiggins Avenue Area with over 4,000 employees, and 2) the Hanscom Air Force Base with close to 10,000 military and civilian employees. The secondary employee and student market segment . . .is comprised of the other employees in Bedford not located in the immediate area (estimated at over 15,000), with the largest concentration in the Crosby Road/Middlesex Turnpike Area, and the students of Middlesex Community College. This segment is considered secondary because the consumers (employees and students) are located further away from Great Road and close to Route 3, with easy access to other dining and shopping options. (However, the Town recently started testing a once-per-week shuttle service that bring Crosby Road employees into the Great Road area at lunchtime.)
5. Consumer Patterns and Preferences Survey�
The survey was conducted from September 26 to October 26, 2016 and generated a host of information about consumer behavior and satisfaction level with current offerings in the Corridor described in the final report. Below are some highlights. �Consumer Patterns �
! It appears that citizens are very engaged and care about the Great Road Corridor, as evidenced by the overwhelming response – 927 people willing to take the time to provide information about their consumer habits and preferences.
! Customers visit the Corridor frequently. On average, Bedford residents visit 3.1 times per week, other TA1 residents visit 2.2 times per week. The primary employees visit 1.9 visits per week and the secondary employees & students visit just under once per week (.9).
! Patronage appears to be holding constant or increasing among all market segments.
! TA1 residents visit an average of 2.0 establishments during each trip. Even the employee segments visit multiple establishments (an average of 1.6) indicating they are not just making meal purchases.
! The most frequently visited establishments by TA1 residents include: CVS, Stop & Shop, Whole Foods, Restaurants
for Carryout, Banks, Restaurants for Eat-In, and Marshalls (more than 35% of TA1 residents visit these establishments each week). As expected, the employee and student segments most frequently visit restaurants, but they also, just as frequently, visit Whole Foods ( which may be serving as a restaurant/carry out place for them). Each week, 35-50% of the primary employee segment visits: Restaurants for Carryout, Whole Foods, and Restaurants for Eat-In.
! TA1 residents eat out an average of 4.1 times per week, however according to the survey results, they currently are doing most (69%) of their restaurant spending outside of the Great Road Corridor Area. Bedford residents and Other TA1 residents reported making only 31% and 26% of their restaurant purchases in the Corridor (respectively). This may point to potential market opportunity for restaurants in the Corridor.
Great Road Commercial Corridor � Summary & Suggestions (cont’d) �

Prepared by: Peg Barringer, FinePoint Associates, in collaboration with the Great Road Working Group www.FinePointAssociates.com 45
A. Summary of Findings (cont’d) � ! The employee and student segments spend an average of $32 - $37 per week on work day/school day meal
purchases. Multiplied by the over 25,000 primary and secondary employees, this adds up to a very sizeable market, but it appears that the Great Road Corridor is only capturing a small portion. This may point to potential market opportunity for restaurants in the Corridor.
! Employees working within close proximity spend an average of $36.47 per week on work day meal purchases but report spending only 31% at restaurants in the Great Road Corridor. (33% of breakfast/coffee purchasing , 37% of lunch purchasing, 27% of dinner after work purchasing and only 19% of drinks/appetizers spending.) The secondary employee and student segment reported spending even less in the Great Road Area; the overall capture rate for all meal categories is 15%.
Consumer Satisfaction and Preferences�
! TA1 residents appear most dissatisfied with: Entertainment Options, Ease of Getting Around and Amount of Public Art. (These elements received a rating of 2.5 or below, based on a 5-tiered scale from “very dissatisfied” to “very satisfied”.)
! TA1 residents are also less than satisfied with: Selection of Restaurants, Amount and Type of Events & Activities, Bicycle Safety & Amenities, Public Spaces/Seating Areas, Appearance/Aesthetic Appeal and Pedestrian Safety Accommodations.
! The primary employee segment is most dissatisfied with: Entertainment Options and Ease of Getting Around. The employees are also less than satisfied with: Amount of Public Art, Pedestrian Safety, Amount and Type of Events & Activities, Public Spaces/Seating Areas and Bicycle Safety & Amenities.
! All market segments reported wanting more: Outdoor Dining, Casual Restaurants with Wait Staff, and Entertainment Venues (theater, music). In addition, TA1 residents would like more Fine Dining, Recreation (bowling, fitness, sports) and Arts Instruction (dance, music, art, etc.)
! Both employee segments expressed a desire for more Fast Casual Restaurants with Counter Service and Food & Beverage Stores, while TA1 residents were less interested in expanding these offerings.
! TA1 residents were also clear about what they feel would be less than desirable additions to the Corridor. . . including Banks, Hair, Skin & Nail Services, Other Services (real estate, legal, accounting) and Department Stores.
! Below are some recurring themes for the open-ended question about what consumers want to see in Great Road
# More entertainment, recreation, fitness uses - all kinds (bowling, theater, dance, live music, rock climbing…) # Better selection of restaurants (higher end, sit-down, independent, ethnic, seafood, steakhouse, fresh, healthy…) # Craft/hobby store, needlework, yarn, art supply # Bakery/pastry shop # Sporting goods # Gift shop, small boutiques # Cosmetics, Ulta # More small, independently owned businesses instead of chains
# Several people expressed concern about additional uses increasing traffic congestion
Great Road Commercial Corridor � Summary & Suggestions (cont’d) �

Prepared by: Peg Barringer, FinePoint Associates, in collaboration with the Great Road Working Group www.FinePointAssociates.com 46
B. Suggestions for Consideration�
1. Improve the business mix, work toward recruiting business that people want and the market will support in the Corridor �
Potential Strategies: ! Get the word out . . . Write press release and/or news articles about results of this study and desired businesses. ! Make existing businesses aware of study results (especially business that could possibly meet unmet market demand). ! Develop business recruitment brochure, fact sheets or other material to provide to business prospects, realtors, and
property owners including why GRC is a great place to do business, market data and targeted business types. Consider developing a business card-size format that residents can present to favorite businesses located outside of Bedford.
! Focus on encouraging existing and new restaurants with specific sought-after characteristics, entertainment/recreation uses and other business types that were cited as desirable. Review current entertainment regulations.
! Add a “Would your Business be Great on Great Road?” document to the town website economic development page. ! Develop a “How to open a Business Guide” targeting small business and outlining permitting and signage regulations
(also see signage workshop under suggestion #2 below). �2. Promote Great Road businesses to residents and especially to the employee segment �
Potential Strategies: ! Develop an attractive hard-copy business directory showcasing businesses by category (indicating location) that could
be available at Great Road businesses to encourage crossover patronage and distributed to employees, students, on the shuttle, etc. (or could start with only restaurant and retail directory).
! Develop online, searchable version of business directory. ! Provide a workshop for businesses about signage, including strategies for creating effective attractive signage that is
compatible with the recently revised signage regulations, along with other promotional ideas. �3. Alleviate traffic congestion Potential Strategies: ! Improve vehicular and pedestrian connectivity between parking lots so customers can navigate from one to the other
without re-entering the street and/or park once and walk to multiple commercial locations. ! Promote walking - improve sidewalks, connectivity, pedestrian comfort and safety amenities within and between nodes
(especially in the North Road Area). ! Make sure drivers know where they need to go; confused drivers add to congestion. Improve wayfinding signage
directing drivers to parking, public facilities, businesses, etc. ! Evaluate the impact of the Crosby Drive Pilot shuttle with regard to impact on traffic. Consider testing a shuttle
service route that would stop at two or three nodes along Great Road Corridor. ! Create a parking map showing all public and private parking areas along Great Road. ! Evaluate the need for additional municipal parking. ! Investigate new transportation modes; be open to new strategies and technologies and how to support them (e.g., car-
sharing, bicycle-sharing, electric vehicle charging, etc.). 4. Activate public spaces, promote hosting of special events on the Common and in other public areas
Potential Strategies: ! Increase the number and variety of events and activities in the Corridor. Residents expressed dissatisfaction with the
current amount and type plus events can generate positive economic impacts. (A FinePoint Associates Study of the economic impact of events in 9 Boston commercial districts showed that events attract people from beyond the local zip code, increase awareness of local businesses and generate sales - attendees visit an average of 2 local businesses before, during or after events).
Great Road Commercial Corridor � Summary & Suggestions (cont’d) �

Prepared by: Peg Barringer, FinePoint Associates, in collaboration with the Great Road Working Group www.FinePointAssociates.com 47
B. Suggestions for Consideration (cont’d) ��! Promote the establishment of an events committee to organize special events for Great Road. ! Consider creating an initiative that might be coordinated by a community partnership organization that would put out
a call to cultural organizations and artists interested in putting on events in the Corridor, accept proposals and provide small grants to support festivals, concerts, art shows, creative art installations, street musicians, etc.
! Work with Bicycle/Pedestrian Master Plan Committee/Chamber of Commerce to host street festivals such as the Walkabout Series and extend to other areas of the Great Road Corridor.
5. Engage community in placemaking activities to explore options for public art, public seating, and social gathering spaces � Potential Strategies: ! Look for funding mechanisms to advance placemaking and public art (e.g., Commonwealth Places is a statewide
program that can help fund community-driven projects – art installations, parks, bike trails, markets, etc. through a crowdfunding platform with the incentive of a dollar-for-dollar funding match).
! Explore the possibility of a public art initiative for the utility boxes in the Corridor. ! Develop a walking and bike map highlighting trails, bike rack locations, public restrooms, seating areas, historic sites,
commercial areas and other areas of interest in and near Corridor. ! Promote Great Road’s historic character and link to the American Revolution 6. Ensure that zoning, licensing or other regulations allow and promote desired uses and take into account identified issues �
! Desirable Uses: # Outdoor dining (i.e., on-premise and sidewalk dining) # Entertainment and Recreation Uses (e.g., theater, live music, bowling, dance/sports instruction, fitness, games) # Restaurants (especially full service, sit-down restaurants with wait staff) # Preference for independent businesses and smaller businesses over chains and department stores # Broadening the variety of the business mix with uses other than additional banks and salons # Pedestrian and vehicular connectivity between parking lots to limit requirement for street re-entry # Pedestrian connectivity especially within nodes # Bicycle accommodations and amenities
! Identified Issues
# Need to review adequacy of parking and wayfinding signage # Concern about traffic congestion (see suggestion #3)
7. Consider establishing an entity to coordinate and carry out tasks associated with maintaining the vibrancy of Great Road
Potential Strategies: ! Develop a community partnership organization to focus on the on-going vibrancy-maintaining activities that would
include business owners, residents, property owners and public sector representatives willing to work together. The feasibility of creating a Business Improvement District (BID) could be explored.
! Create working committees as appropriate (e.g. events, promotion, beautification).
Great Road Commercial Corridor � Summary & Suggestions (cont’d) �