richland.k12.la.usrichland.k12.la.us/documents/common core standards/cc/8th... · web viewbefore...
TRANSCRIPT

2012-13 and 2013-14 Transitional Comprehensive Curriculum
Grade 8Mathematics
Unit 5: Functions, Growth and Patterns, Part 1
Time Frame: Approximately four weeks
Unit Description
This unit examines the nature of changes to the input variables in function settings through the use of tables and sequences. There is emphasis on recognizing and differentiating between linear and exponential change and developing the expression for the nth term for a given arithmetic or geometric sequence.
Student Understandings
Students recognize the nature of linear growth and exponential growth in terms of constant or multiplicative rates of change and can use this to test their generalizations. They understand that a table, a graph, an algebraic expression, or a verbal description can be used as different representations of the same sequence of numbers.
Guiding Questions
1. Can students differentiate between function relationships and those relations that are not functions using coordinates, tables and graphs?
2. Can students understand and apply the definition of a function in evaluating expressions (output rules) as to whether they are functions?
3. Can students differentiate between linear and non linear growth patterns and discuss each verbally, numerically, graphically, and symbolically?
Unit 5 Grade-Level Expectations (GLEs) and Common Core State Standards (CCSS)
Grade-Level ExpectationsGLE # GLE Text and Benchmarks13. Switch between functions represented as tables, equations, graphs, and verbal
representations, with and without technology (A-3-M) (P-2-M) (A-4-M)14. Construct a table of x- and y-values satisfying a linear equation and construct
a graph of the line on the coordinate plane (A-3-M) (A-2-M)46. Distinguish between and explain when real-life numerical patterns are
linear/arithmetic (i.e., grows by addition) or exponential/geometric (i.e., grows by multiplication) (P-1-M)
Grade 8 Mathematics Unit 5 Functions, Growth and Patterns 5-1

2012-13 and 2013-14 Transitional Comprehensive Curriculum
CCSS# CCSS Text8.F.1 Understand that a function is a rule that assigns to each input exactly one
output. The graph of a function is the set of ordered pairs consisting of an input and the corresponding output.
8.F.3 Interpret the equation y = mx + b as defining a linear function, whose graph is a straight line; give examples of functions that are not linear. For example, the function A = s2 giving the area of a square as a function of its side length is not linear because its graph contains the points (1,1), (2,4) and (3,9), which are not a straight line.
8.F.4 Construct a function to model a linear relationship between two quantities. Determine the rate of change and initial value of the function from a description of a relationship or from two (x, y) values, including reading from a table or from a graph. Interpret the rate of change and initial value of a linear function in terms of the situation models, and in terms of its graph or table of values.
8.F.5 Describe qualitatively the functional relationship between two quantities by analyzing a graph (e.g., where the function is increasing or decreasing, linear or nonlinear). Sketch a graph that exhibits the qualitative features of a function that has been described verbally.
Sample Activities
Activity 1: To Function or Not to Function! (GLE: 14; CCSS: 8.F.1)
Materials: Vocabulary Self-Awareness Chart BLM, Function or not BLM, pencil, paper
Begin the activity by distributing the Vocabulary Self-Awareness Chart BLM. Students will begin with the vocabulary self-awareness (view literacy strategy descriptions ) . Since this is the first time they have done a Vocabulary Self-Awareness in math, the words have been written in the chart. Later, you might want to provide the chart and have the students write the words in from a list on the board. Students should rate their understanding of each of the vocabulary words by placing a plus sign (+) if they are very comfortable with the word, a check mark () if they are uncertain of the exact meaning and a minus sign if the word is completely new (-) to them. Through this unit, students should develop an understanding of the vocabulary in the chart. Throughout the unit, students should be encouraged to pull out the chart and edit their chart as the vocabulary meanings are more understandable. The repeated use of the vocabulary chart will give the students multiple opportunities to practice and extend their growing understandings of the vocabulary.This lesson was written to develop the idea of a function. Draw the following tile pattern on the board. Instruct the students to make an “Input/Output” table for the tile pattern. The input should be the figure number. The output should be the number of tiles.
Grade 8 Mathematics Unit 5 Functions, Growth and Patterns 5-2
figure 4figure 3figure 2figure 1
Pattern 1

2012-13 and 2013-14 Transitional Comprehensive Curriculum
Students should have a table like Table 1 which represents a function.A function is a rule that assigns to each input exactly one output.
In Table 1, each input value (1) corresponds to one and only one output value (2). Have the students write the set of ordered pairs as shown in the table. (1,2), (2,3), (3,4), (4,5). Note that in this set of ordered pairs, each output is used exactly one time. Therefore, it fulfills the definition of a function. The graph of a function is the set of ordered pairs consisting of an input and the corresponding output. The input values are placed on the horizontal axis, and the output values are placed on the vertical axis. Make sure to relate the pattern, graph and table, ensuring that all students understand how they are related.
Have students look at the following tables and determine if the ordered pairs represent a function.
In Practice #1 the output increases by 2 with each additional figure; the input is doubled and then one is added.
A mapping of this input/output table has been drawn at the right. The mapping has one oval drawn that contains the input values and a second that contains the output values. The arrows illustrate the input that is connected to the output, and each output value is associated with one input value.
In Practice # 2, output increases by 4 each time. The mapping is shown to the right of the table for Practice #2.
Grade 8 Mathematics Unit 5 Functions, Growth and Patterns
Table 1Input Figure #
1 2 3 4
OutputNumber of tile
2 3 4 5
Practice #1Input Figure #
1 2 3 4
OutputNumber of tiles
3 5 7 9
Practice #2Input Figure #
1 2 3 4
OutputNumber of tiles
4 8 12 16
5-3
1234
3579
1
2
3
4
4
8
12
16
0
5
4
3
2
1
4321
# Tile
Arrangement #

2012-13 and 2013-14 Transitional Comprehensive Curriculum
Next, copy Table 2 on the board. Have the students write the ordered pairs, graph them, and determine if the table of values represents a function.
Since the input 2 is matched to two different outputs, it does not represent a function. By definition, a function is a rule that assigns to each input exactly one output. This table has two outputs for 2, (2, 1) and (2, -1). The graph and the mapping of this is a good illustration of the input value “2” having more than one output value (1 and -1).
Draw another table, without inputs or outputs, on the board and have students work in pairs to determine a set of values that will not be a function. Ask students to justify why the table does not represent a function. Have the students share with another pair of students and discuss as a class any misunderstandings that might occur during these discussions.
Copy Table 3 on the board. Ask students to determine if this is a function.
This should bring out some discussion because of the two 4 values in the outputs. Some students may say that it is not a function. Have the students restate the definition of a function. The table shows that there is one y-value (output) for each of the input values. The mapping shows that each input corresponds to one output, although one of the output values corresponds to two distinct input values. This does represent a function.
Distribute Function or Not BLM, and have the students work in pairs or groups of four to determine whether each relationship represents a function. Discuss results after students have completed the BLM.
Grade 8 Mathematics Unit 5 Functions, Growth and Patterns
Table 2Input 1 2 3 2Output 0 1 -2 -1
Table 3Input 1 2 3 -2Output 0 4 9 4
5-4
123
01-2-1
1
2
3
-2
0
4
9

2012-13 and 2013-14 Transitional Comprehensive Curriculum
As a closure activity, ask students to explain any terms from their Vocabulary Self-Awareness chart that have become clearer throughout the activity.
Activity 2: What’s a Function? (CCSS: 8.F.1)
Materials List: paper, pencil, Vocabulary Self-Awareness Chart BLM, What is a Function? BLM, calculator (optional)
Have students complete the Vocabulary Self-Awareness Chart BLM for this unit. Vocabulary self-awareness (view literacy strategy descriptions) is valuable because it highlights students’ understanding of what they know, as well as what they still need to learn in order to fully comprehend the concept. Students indicate their understanding of a term/concept, but then adjust or change the marking to reflect their change in understanding. The objective is to have all terms marked with a + at the end. A sample chart is included in the blackline masters. Be sure to allow students to revisit their self-awareness charts often to monitor their developing knowledge about important concepts.
Have students use the What is a Function? BLM to complete this activity.
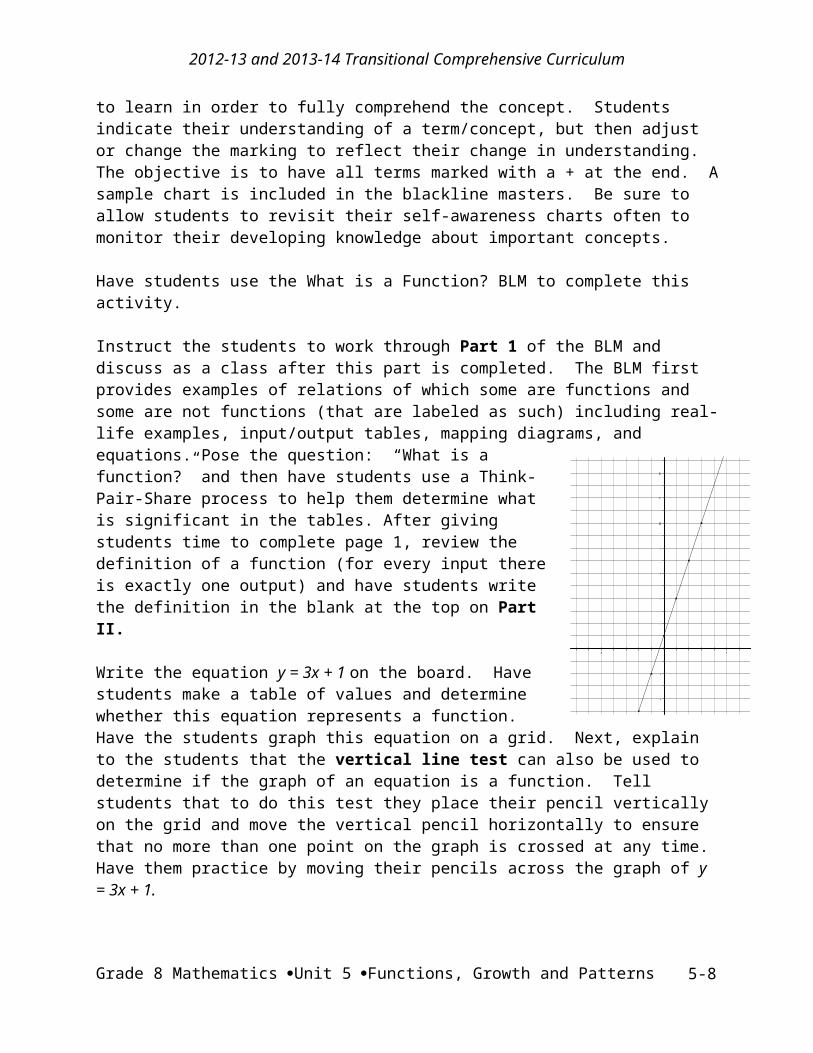
Instruct the students to work through Part 1 of the BLM and discuss as a class after this part is completed. The BLM first provides examples of relations of which some are functions and some are not functions (that are labeled as such) including real-life examples, input/output tables, mapping diagrams, and equations. Pose the question: “What is a function?” and then have students use a Think-Pair-Share process to help them determine what is significant in the tables. After giving students time to complete page 1, review the definition of a function (for every input there is exactly one output) and have students write the definition in the blank at the top on Part II.
Write the equation y = 3x + 1 on the board. Have students make a table of values and determine whether this equation represents a function. Have the students graph this equation on a grid. Next, explain to the students that the vertical line test can also be used to determine if the graph of an equation is a function. Tell students that to do this test they place their pencil vertically on the grid and move the vertical pencil horizontally to ensure that no more than one point on the graph is crossed at any time. Have them practice by moving their pencils across the graph of y = 3x + 1.
Tell the students that they will practice recognizing functions in Part II by comparing different representations. Give additional practice as needed.
Ask students to form a conjecture as to why the vertical line test works to determine if a graph is a function. Explain to the students that this test is a test to perform when the graph is given, or they have plotted points and want to determine if the relationship represents a function.
Grade 8 Mathematics Unit 5 Functions, Growth and Patterns 5-5
14
12
10
8
6
4
2
-2
-4
-5 5

String cuts
2012-13 and 2013-14 Transitional Comprehensive Curriculum
According to the test, if each vertical line drawn through any point on the graph of a relation intersects the graph at no more than one point, then that relation is a function. It is easily performed by placing the pencil or a ruler vertical to the x-axis on the graph and moving it horizontally to determine that it crosses only one point on the graph at any time.
Once the students have completed Parts I and II of the BLM, instruct them that the final part of this activity provides them with a graph of y = 3x +1 and ask them if this would be a function (at right). Ask the students to determine if the set of ordered pairs in the input/output tables generated using y = 3x +1 with x values of -2, -1 and 0 will satisfy the definition of a function (i.e., for each input value (x), there is exactly one output value (y)). Now, have students draw several vertical lines through the input values to illustrate the idea that for a function, a vertical line intersects the graph of a function at exactly one point. This is called the vertical line test.
Explain that this means that if they assign “x” the value of (-2) then they have to substitute the -2 into the equation, “y = 2x+3,” making the value of the equation “y=2(-2) + 3” or y = -1.
Part III of the BLM provides practice for students making connections between ordered pairs, equations, tables and graphs. Be sure to ask questions that will help the students make these connections. Questions such as: What part of the equation helps me locate a starting point for my graph without the ordered pairs? (y-intercept) How can you tell from the input/output table, what the rate of change of the graph will be? (difference in y-values divided by the difference in x-values). Where is the rate of change found in the equation? (The number before the x is called the coefficient. If there is no number before the x, the slope is 1 because 1(x) = x as it is understood to be the rate of change). How can the rate of change be found on a linear graph without an equation or input/output table? (Identify two points along the line that intersect with the intersections of the grid and count vertically then horizontally to see rise/run). Give students additional input-output rules for more practice as needed.
Provide closure to the activity by summarizing and reviewing the major concepts presented in the activity. Students will describe how to recognize a function and understand that there can be no more than one value for each x value on a graph. They will also explain how to use the vertical line test to determine if a graph represents a function.
Activity 3: Stringy Situation! (CCSS: 8.F.4)
Materials List: string, scissors, pencil, paper, Stringy Situation BLM, Grid paper
Begin this activity by distributing string and scissors to each pair of students. Tell the students to cut 4 pieces of string, each about 2 feet long. Instruct the students to take one of the pieces of string and make 1 cut as shown in the picture below. Ask, how many pieces of string do they have as a result of one cut? (If one cut is made, there are three pieces of string; if two cuts are made, there are 5 pieces.)
Distribute Stringy Situation BLM and have the students begin filling data into the chart as requested.
Grade 8 Mathematics Unit 5 Functions, Growth and Patterns 5-6

2012-13 and 2013-14 Transitional Comprehensive Curriculum
Once the students have completed the top part of the BLM, distribute additional pieces of string and have students complete the table and the remainder of the BLM.
Distribute grid paper and have the students graph both of the equations that have been written on the same graph. This is a good time for the students to compare the different slopes and how the larger the rate of change, the steeper the graph of the equation.
Discuss the BLM and graphs, ensuring student understanding. As closure, have the students respond in the math learning log (view literacy strategy descriptions ) to the statement: If the string is folded into fourths, and cuts are made as in class today, explain in your own words how many pieces there would be with one, two or three cuts. Write the new equation.
Activity 4: Find that Rule (CCSS: 8.F.1)
Materials List: Find that Rule BLM, More Patterns and Rules BLM, pencil, paper, math learning log, poster paper, markers
This activity was not changed because it already incorporates the CCSS.
Write the following questions on the board or overhead and have the students copy them in the left column of a sheet of paper which has been formatted for split-page notetaking (view literacy strategy descriptions). Notetaking is an essential skill students must develop in order to be effective learners in mathematics. The volume of information, vocabulary, and concepts will be processed easier if they develop a notetaking system that helps them organize their thinking and make necessary connections in the mathematics class. Students will complete the split-page note taking as they complete the Find that Rule Activity. The questions in the left column are important concepts for students to observe. It is important for students to look for these things as the lesson progresses. Complete this column for the students to enable them to understand what is important to look for as they complete the BLM.
Arithmetic and Geometric Number Patterns1) What do you notice about the difference in the y-values in consecutive patterns in A – E on Find the Rule BLM? 2) Define: arithmetic sequence
3a) What do you notice about the differences in y values of the More Patterns and Rules BLM when the x-values are consecutive values?3b) Divide each y-value by the preceding y value and determine if there is a pattern.4) Define: Geometric Sequence
Grade 8 Mathematics Unit 5 Functions, Growth and Patterns 5-7
2012-13 and 2013-14 Transitional Comprehensive Curriculum
Divide the students into groups of four. Distribute Find that Rule BLM and give the students time to find the perimeters and then the areas of the arrangements, recording each in the appropriate tables. Students should find the “rule” for finding the perimeters and areas in the summary chart on the second page of the BLM. Lead the classes in a discussion about the rules, having students explain how their rule would help them determine the perimeter or area of the 100th or 150th arrangement.
Define arithmetic sequences as sequences in which the difference between two consecutive terms is the same and geometric sequence as sequences in which the quotient between two consecutive terms is the same. Discuss whether the rules illustrate an arithmetic or geometric sequence. Make sure the students understand that all of the perimeter patterns show a linear relationship. The area relationships A-C show linear patterns. Pattern E is an area relationship. It is not a linear or geometric; it is a quadratic (power of 2).
Once the students have completed the Find that Rule BLM, instruct them to answer question 1 on their split-page notetaking sheet and define what is meant by an arithmetic sequence.
Distribute the More Patterns and Rules BLM and have the groups work to complete the BLM. Once the students have completed the questions, have groups of four get with another group of four and discuss their answers. Circulate and redirect student thinking as any questions or misconceptions arise. Direct the students back to their notetaking page and have them answer question 3a and 3b and define what is meant by a geometric sequence. The student discussion should bring out the difference in an arithmetic and geometric sequence. At this point, all students should have the questions answered and their own definitions formed on the notetaking sheet.
Have students explain in their own words the difference between arithmetic and geometric patterns in their math learning logs (view literacy strategy descriptions ).
Activity 5: Make that Connection! (GLE: 14; CCSS: 8.F.3, 8.F.4)
Materials List: paper, pencil, calculator, graph paper
Review the slope-intercept form of an equation (y = mx + b where m represents the slope and b represents the y-intercept). An example would be the cost of renting a car is $25 plus $0.35 per mile (the rate of change is $.35 per mile, thus it is the slope and the $25 is a one-time charge, making it the y-intercept). The equation would be y = .35x + 25. Make a table of values and sketch a graph to represent the data (10, 28.50), (20, 32), and (30, 35.50). From this graph, write your equation for the line. Have groups determine the equation of the line by examining the graph for the slope and y-intercept. Ask probing questions that lead students to understand that the value of y (the price of the rental) is determined by the value of x (the number of miles). Therefore, y is the dependent variable and x is the independent variable. Continue leading students to understand that the value of y will always increase as the value of x increases. This is
Grade 8 Mathematics Unit 5 Functions, Growth and Patterns 5-8

Rule: 4x + 1 = Area321
2012-13 and 2013-14 Transitional Comprehensive Curriculum
indicated by the fact that there is a positive slope. Finally, help students discover that the y-intercept would be located at the origin if there were no initial cost.
This situation states that the initial cost is $25, so the y-intercept is 25.
Have students generate a table of values for a given linear function expressed as y = mx + b, where m is the slope and b is the y-intercept. Have students label the input value column of the table “Independent Variable” and the output value column “Dependent Variable.” Have students select their own domain values for the independent variable and generate the range values for the dependent variable. Ask the students what the constant rate of change in the table or graph is represented by? ($.35) This is represented in the equation by m. The initial value of the rental would be what? ($25) and this is called the y-intercept. In the equation this is represented by the “b”.
Next, have students calculate the differences in successive values of the dependent variable, and find a constant difference. Then, have them relate this constant difference to the slope of the linear function. Have students graph the ordered pairs and connect them with a straight line. Finally, discuss with the students the connections between the table of values, the constant difference found, and the graph. Last, have students do the same activity using a linear function that models a real-world application. For example, students could investigate the connections between the algebraic representation of a cost function, the table of values, and the graph.
Activity 6: Use That Rule! (CCSS: 8.F.4)
Materials List: Use That Rule! BLM, paper, pencil
This activity was not changed because it already incorporates the CCSS.
Before class begins, write on the board before class:R – The role of the writer is from the perspective of the tile in the pattern; A – The audience is another math studentF – The format is a letterT – The topic is how area changes as tile are added.
Talk briefly about RAFT writing (view literacy strategy descriptions ) indicating the purpose of the writing is to help clarify, recall and question further ideas. RAFT writing is used to helps students extend their understanding. A sample letter follows:
Grade 8 Mathematics Unit 5 Functions, Growth and Patterns 5-9
Area = 4x + 1y = 4x + 1

2012-13 and 2013-14 Transitional Comprehensive Curriculum
Partner, I know that you have been working with many of us making patterns. When finding the area, it is best if you will use the arrangement number as your “x” value and the area as the “y” value. If you can imagine my figure number as the input into an input/output machine, and then find a way to come up with the area or the output, you have determined a rule!
Another way to determine the pattern is to make a table like the one shown below:x (arrangement number)
y (area)
1 52 93 13
There is a difference of 4 between two consecutive y values. The rule is y= 4x +1, so the 20th arrangement would have an area of 81 square units. I also know that this is an arithmetic sequence, and if I graphed the points, I would get a line. The slope of the line is 4, and the y-intercept is 1.
I hope my explanation helped you understand my purpose in the math class.
Sincerely,The Red Tile Give the students time to read their RAFTs to a classmate. After monitoring students’ sharing of their RAFTs, select one or two of them to read to the entire class. Students should listen for accuracy and logic in their classmates’ RAFTs. Clarify misconceptions and add additional explanation as needed.
Distribute Use That Rule BLM and have students generate a mathematical representation of the rule and sketch the first three arrangements of the pattern. Then generate ten terms of the sequence and create a table of values for the arrangement number and the area and/or perimeter relationship of the pattern that was developed. It is important that time is spent relating each part of the pattern to the rule.Spend time relating each part of the rule to the pattern. Students should be able to relate parts of the equation, such as Area = total number of tiles (value of y), 4 = the number of tiles that are added with each arrangement (coefficient of x), and 1 = y-intercept.
Have students generate the sequence of values for the rule “start with $1 and double your money each day.” Then have them generate the values for the rule. Start with $1 and add $2 each day. Lead a discussion as to the difference in these two examples and how an arithmetic sequence is different from a geometric sequence.
Grade 8 Mathematics Unit 5 Functions, Growth and Patterns 5-10

2012-13 and 2013-14 Transitional Comprehensive Curriculum
Activity 7: Hexagonal Confusion! (CCSS: 8.F.4)
Materials: Hexagon BLM, Polygon Extensions BLM, hexagons (if needed), pencils, paper
Put the following pattern on a PowerPoint or on the board. If you have hexagons available, have students build the first three figure numbers below and compute the perimeter of each one.
Have the students write three mathematical observations about the perimeter of the first three figures. Give students time to share their observations.
Distribute Hexagon BLM to students. Give groups of students time to complete the task and ask them to share their mathematical solutions for finding the perimeter of the 10th figure. Challenge groups to determine the perimeter of the 25th figure. (102 units)
If student understanding is demonstrated, ask the students to determine which figure number has a perimeter of 126 units? Have the students explain their solution.
Challenge: The total perimeter of two consecutive figures in this hexagon pattern is 80 units. What are the two figure numbers? (4x + 2) + (4(x+1) + 2) = 80 Let x represent the first 4x + 2 + 4x + 4 + 2 = 80figure and (x + 1) 8x +8 = 80represent the second figure 8x = 72
x = 9 So figures 9 and 10 would be the answer.
Distribute the Polygon Extensions BLM and give students time to explore these questions with a partner.
Once the BLM is completed, give students opportunities to share discoveries using a discussion strategy (view literacy strategy descriptions) called “fishbowl”. This discussion strategy involves two small groups of students. One group of students will discuss one or more of the extension questions (in the fishbowl) while the second group stands outside the group and must listen to the discussion without contributing to the deliberations of the students “in the fishbowl.” Time the discussions so that the students in the fish bowl have the needed time but not so much time that the observers lose interest and get distracted. Once the discussion is completed, give the observers time to discuss among themselves their reactions to the fishbowl group’s responses.
Activity 8: Patterns and Slope (GLE: 13; CCSS: 8.F.1)
Materials List: math learning log, paper, pencil, square tiles, Patterns and Slope BLM, graph paper
Have students use the Patterns and Slope BLM to complete this activity.
Grade 8 Mathematics Unit 5 Functions, Growth and Patterns 5-11
figure 3figure 2figure 1

2012-13 and 2013-14 Transitional Comprehensive Curriculum
Divide students into groups and provide them with square algebra tiles. Have the students arrange 3 tiles in a rectangle and record the width (x) and the perimeter (y) on the BLM. Have the students fit 3 more tiles under the previous tiles and continue adding tiles, putting the values in a table. Students should continue working with their groups to complete the BLM through the completion of the table. Guide students as they complete the remainder of the BLM.
Have students notice that the change in the y-values is the same. Have them graph the data and decide if it is linear. Ask students what changed in the pattern (the widths that keep increasing) and what remained constant (the length of the sides added together (3+3)). Have students write a formula to describe the pattern ( ). Encourage students to think about what function must be done to the x-value to determine the y-value. So the function of x is to double the input and add 6 to get the output.
Direct students to think about the tile pattern. Ask them to determine what stayed the same each time the next pattern in the sequence was built (the three across the bottom). Guide students to conclude that what remained constant in the pattern will be the constant in the formula. Ask students what the rate of change in the pattern had been (three added in each row). Explain that the word they will use for rate of change is the slope. Have students take the Vocabulary Self-Awareness activity sheet out and make some clarification to the word slope on the sheet. Guide students to make a connection between the table, graph and algebraic representation of the slope. (The table representation will be the difference in the y-values in the table divided by the difference in the x-values in the table. The graph representation will be found by following points along the line of the equation at intersection points and finding how far up would have to be counted divided by the number of places right or left to get to the next point. The algebraic expression is the number that they have to multiply by the x-value which shows them the part of the equation that remained the same or proved it was an arithmetic sequence of y-values.)
In their math learning logs (view literacy strategy descriptions) have students respond to the following prompt:
A child’s height is an example of a variable showing a positive rate of change over time. Give two examples of a variable showing a negative rate of change over time. Explain your answer.
Have students share their answers with the class and combine a class list of all student answers. Discuss the answers and have students determine whether the examples are indeed negative rates of change.
Activity 9: Rate of Change (GLE: 13; CCSS: 8.F.4)
Materials List: paper, pencil, Rate of Change BLM, graph paper, straight edge
Use the Rate of Change BLM to introduce the following problem:
Grade 8 Mathematics Unit 5 Functions, Growth and Patterns 5-12

2012-13 and 2013-14 Transitional Comprehensive Curriculum
David owns a farm market. The amount a customer pays for sweet corn depends on the number of ears that are purchased. David sells a dozen ears of corn for $3.00. Place the students in groups and ask each group to make a table reflecting prices for purchases of 6, 12, 18, and 24 ears of corn.
Place students in groups and have each group complete the Rate of Change BLM. Students will write and graph four ordered pairs that represent the number of ears of corn and the price of the purchase. They will write an explanation of how the table was developed, how the ordered pairs were determined, and how the graph was constructed. After ensuring that each group has a valid product, ask the students to use a straightedge to construct the line passing through the points on the graph. Each group will find the slope of the line. Review with students the idea that slope is an expression of a rate of change. Ask students to explain the real-life meaning of the slope. (For every ear of corn purchased, the price goes up $.25).
Refer to the slope/intercept form of an equation and have groups determine the equation of the line by analyzing the graph for the slope and the y-intercept. Point out that the y-intercept is at the origin because if someone does not make a purchase, the price is zero. Use their equation to find the cost of 6 ears of corn.
Have students work with their groups to complete the second problem on the Rate of Change BLM.
Have students participate in a math text chain (view literacy strategy descriptions) activity to create word problems using real-life applications that are linear relationships. To complete a text chain, form groups of four students. Each student should get a sheet of paper and begin a word problem by writing one sentence of a word problem. The student passes his/her paper to the right, and the next student writes a second sentence to the word problem begun by the first group member. These go to the third and fourth person, each adding to the word problem. The fifth stop returns to the originator of the problem who should answer the question and check the problem for accuracy.
Here is an example of a text chain for a problem on Rate of Change:
Student 1: Jimi wants to save money to buy a car.Student 2: He has been mowing lawns to earn moneyStudent 3: He charges $30 per lawn.Student 4: What is the rate of change of this linear relationship?
Have groups share their text chain problems with the entire class and have the other groups solve and critique the problems.
Grade 8 Mathematics Unit 5 Functions, Growth and Patterns 5-13

2012-13 and 2013-14 Transitional Comprehensive Curriculum
Activity 10: Sloping Lines (GLE: 13; CCSS: 8.F.4)
Materials: Linear Graphs BLM, pencil, paper Explain to the students that they will be given graphs and they will work with a partner to determine the slope of the lines. Distribute the Linear Graphs BLM and give students time to determine the slope of each of the lines.
Once the students have found the slopes of the lines, have a student describe the method of finding the slope that was used. Most of the students will probably count spaces on the grid using rise over run. If no one used points along the line to find the slope, have students identify (-8, -5) and (1, -1) on the first graph. Ask if anyone can explain how to use these points and find the rise of the line (the distance from -5 to -1 or -5 – (-1) = -4) The run will be the difference in -8 – 1 or -9 and that -4/-9 gives a slope of 4/9. Tell the students that any two points on a line can be used to determine the slope by taking the difference of the y-value of one set and the y-value of the other set and dividing by the difference in x-values by taking the difference of the x-value of the first set and the x-value of the second set.
Ask the students where the line crosses the y-axis. Remind them that this point is the y-intercept. Graph 1 crosses the y-axis at -1.5, so this would be the y-intercept. Ask the students what the x-value will be when the line crosses the y-axis at -1.5 (0). Have the students write the ordered pair and reflect on the slope-intercept form of an equation, then substitute the values to form the
equations for the lines. The three equations are 1) ; 2) ; and 3)
. Students should be able to use the grid and determine the slope and the y-intercept, writing the equation in y-intercept form.
Activity 11: Horizontal and Vertical lines (GLE: 13; CCSS: 8.F.5)
Materials: Exploring Slope BLM, paper, pencil
Post the following ordered pairs on the board (-4, 8) and (6, 8). Ask the students what is special about this set of ordered pairs. Ask students for another point that would fit their explanation.
Explain to the students that they will use the discussion strategy (view literacy strategy descriptions ) called Round Robin. Tell them that they will work in groups of 4 and will go around the circle, giving possible solutions to the question that is posed. They are allowed one “pass” on a response, but eventually every student must respond. Students should record their response on paper, so that all responses are acknowledged and valued by every student in the group.
Pose the question: How do you think the relationship of these ordered pairs will affect the slope of an equation? The y-value is the same for both ordered pairs, so the rise will be zero and the points will form a horizontal line.
Grade 8 Mathematics Unit 5 Functions, Growth and Patterns 5-14

2012-13 and 2013-14 Transitional Comprehensive Curriculum
After groups have had time to each have input, as group responses are taking place, monitor groups to identify those ideas that may be helpful to others or those that may lead to misconceptions so that they can be clarified.
Have students take a sheet of grid paper and plot these two points and draw a line through them. Give groups time to validate or determine the error in their thinking once this is done.
Tell the students to use the points to determine the slope of the line.
Distribute the Exploring Slope BLM and complete the questions asked independently. When discussing these two graphs, be sure to discuss that the second graph an undefined slope because the denominator would be zero. The horizontal line’s slope will always be 0 because the numerator is always 0.
Activity 12: Slopes and y-Intercepts (GLE: 13; CCSS: 8.F.4)
Materials List: paper, pencil, Slopes and Y-intercepts BLM, graphing calculator
Have students use the Slopes and Y-intercepts BLM to complete this activity. After students have completed the BLM, have a class discussion of their findings. Have students explain how the changes in the y-intercepts affect the graphs. Have students explain the effects of the change in the slope on the graphs. Have students make conjectures about positive and negative slopes. Discuss the slopes of horizontal and vertical lines and the lines and . The is called the parent graph because it is a 1:1 relationship between the independent and dependent variables. Have students relate slope (rate of change) to m and the y-intercept in graphs to b for each of these linear functions expressed as y =mx + b. Looking at the graphs of these two equations, it can be seen that is positive, the slope is 1, and y-intercept is 0. Looking at
, it is seen that graph is negative, the slope is -1, and the y-intercept is 0. If looking at the graphs of these equations, a positive slope will increase from left to right and a negative slope will decrease from left to right. An undefined slope is a vertical line on the graph. The line is at its steepest (rise) but there is no (run). There cannot be division by zero because if the rise is “5” and the run is “0,” there is no number that can be multiplied by zero and get 5. This is an example of when the slope is undefined. A good example of this would be an elevator, most elevators go straight up and down; they do not move right and left. The slope is undefined.
After activities 8 - 12, have students participate in a professor know-it-all activity (view literacy strategy descriptions). This activity asks students to assume roles of professor know-it-all or experts who are to provide answers to questions posed by their classmates. Form groups of three or four students. Give them time to review the content covered in the previous activities. Have the groups generate three to five questions about the content. Call a group to the front of the class. These are the “professors know-it-all.” Invite questions from the other groups. Have the chosen group huddle, discuss, and then answer the questions. After about 5 minutes, ask a new group to come up and repeat the process. The class should make sure the professor know-it-all groups respond accurately and logically to their questions.
Grade 8 Mathematics Unit 5 Functions, Growth and Patterns 5-15
2012-13 and 2013-14 Transitional Comprehensive Curriculum
Sample Assessments
General Assessments
The student will make a concentration game matching sequences and rules that describe the sequence. The student will prepare at least 15 matching sets to complete the game.
The student will generate at least three different patterns of area and perimeter and determine the rule that describes the pattern. The student will also label each rule as either an arithmetic or geometric sequence.
The student will research and find a real-life situation that demonstrates an arithmetic sequence and another that demonstrates a geometric sequence. The students will present these situations to the class.
The teacher will provide the student with a list of numbers and have the student explain in writing how to determine whether the list of numbers is an arithmetic sequence or a geometric sequence.
The teacher will provide the student with an arithmetic or geometric sequence that describes a real-world situation. The student will determine specific terms of the sequence.
The student will determine whether a specific number is a term in a sequence whose nth term is given. For example, is 24 a term in the sequence whose nth term is
? The teacher will provide the student with several terms of an arithmetic or geometric
sequence. The student will generate the rule and the nth term in the sequence. Whenever possible, the teacher will create extensions to an activity by increasing the
difficulty or by asking “what if” questions. The student will create portfolios containing samples of their experiments and
activities.
Activity-Specific Assessments
Activity 4 : The student will explain whether his/her sequence is arithmetic or geometric and why. The student will should make a class presentation of the pattern and graph.
Activity 5 The student will determine the rule for a pattern and determine if the pattern is arithmetic or geometric.
Activity 8: The student will be given two sets of ordered pairs and be asked to find the slope of the line through these two points.
Grade 8 Mathematics Unit 5 Functions, Growth and Patterns 5-16