rics cobra 2018 - cardiff university
TRANSCRIPT
rics.org/cobraconference
RICS COBRA 201823 – 24 April 2018RICS HQ, London, UK
In association with
RICS COBRA 2018The Construction, Building and Real Estate Research Conference of the Royal Institution of Chartered Surveyors
Held in London, UK in association with University College London
23 – 24 April 2018RICS HQ, London, UK
© RICS, 2018ISBN: 978-1-78321-277-4ISSN: 2398-8614
Royal Institution of Chartered Surveyors Parliament SquareLondonSW1P 3ADUnited Kingdom
rics.org/cobraconference
The papers in this proceeding are intended for knowledge sharing, stimulate debate, and research findings only. This publication does not necessarily represent the views of RICS or University College London.
133 Occupants’ perceptions of indoor environmental conditions in two BREEAM excellent buildings
rics.org/cobraconference
COBRA 2018 OCCUPANTS’ PERCEPTIONS OF INDOOR ENVIRONMENTAL CONDITIONS IN TWO BREEAM EXCELLENT BUILDINGS Dr Gabriela Zapata-Lancaster 1 Welsh School of Architecture, Cardiff University. King Edward VII Av CF10 3NB Cardiff, UK. ABSTRACT
This paper presents a qualitative study that investigated occupants’ practices in two BREEAM Excellent buildings. The work investigated the levels of satisfaction of the building occupants with the thermal, lighting and aural environment and the actions taken by occupants to achieve comfort in different seasons. Seasonal building user surveys were applied to identify the occupant practices to achieve comfort and their satisfaction with the indoor conditions. Indoor environment conditions were monitored as reference to the occupants’ responses. The participants reported taking a range of actions to enhance their comfort, even in situations where they had limited access to controls to modify their environment; for example, exerting personal adaptation and rearranging spaces to achieve thermal comfort. Like prior research, the study found that occupants’ practices were not motivated by energy efficiency concerns. Occupants tend to adopt practices with the aim to improve their comfort and enable them to carry the everyday activities in the building, even if those actions defeat the energy saving intentions. Energy efficiency strategies that do not consider occupants’ activities and preferences tend to be ignored or bypassed in the daily building operation, even where the control strategies limit the interaction between the occupant and the building technologies. Energy efficiency initiatives could benefit from considering the existing occupant practices to achieve comfort and promote the non-energy benefits of good building performance (i.e. occupants’ health and wellbeing) in order to motivate stakeholders to adopt practices that contribute to energy efficiency. Keywords: user studies, occupants’ satisfaction, indoor environment, BREEAM buildings.
INTRODUCTION Building environmental rating systems are means to evaluate the ecological and sustainability performance of the built environment. They seek to reduce the impact of the built environment on the natural environment and encourage greener practices. The Building Research Establishment Environmental Assessment Method (BREEAM) is a voluntary rating system used in the UK and internationally to promote the sustainable built environment practices. BREEAM can be applied to new and existing built environment developments to evaluate their impact in a number of aspects including energy and indoor environmental quality. It is widely acknowledge that

rics.org/cobraconference
green buildings that integrate environmental and social requirements have the potential to enhance the quality of life and satisfaction of the building occupants. Good building performance can increase the productivity and satisfaction in workplaces (Smith and Pitt, 2011; Feige et al, 2013). Building performance evaluation exercises that consider the occupants’ perspectives have contributed to a better understanding of building performance in relation to occupants’ satisfaction; exploring the integration and balance between social and environmental requirements in green buildings. User studies help to identify the levels of satisfaction of the building occupants and increase the understanding of human factors that affect the building performance and lead to performance gaps (Sawyer et al, 2008; Brown et al, 2010; Stringer et al, 2012; Schakib-Ekbatan et al, 2010). Building performance research has engaged with building occupants to explore their degree of tolerance and satisfaction with the indoor environmental conditions (Baird and Field, 2013; Schiavon and Altomonte, 2014, Gou et al, 2013; Chen and Ford, 2013). Building user studies help to understand the building performance in relation to occupant practices and idiosyncrasies. Occupants’ opinions and satisfaction levels about the buildings are shaped by subjective aspects related to expectations, perceived needs and subjective comfort preferences. The occupants’ evaluation of comfort depends on a number of factors beyond physical comfort; ‘[occupants] bring feelings, memories, expectations, and preferences into their assessment, and this increases the complexity of the outcomes being measured’ (Veitch, 2008). It is estimated that occupant factors (behaviours and practice) cause 10-80% of the performance gaps between as-designed and in-use performance (van Dronkelaar et al, 2015). Therefore, it is important to investigate the occupant practices in everyday use of buildings and their relation to the resulting building performance for aspects such as indoor environmental conditions and energy use. This paper presents a study that investigated the perceptions of occupant factors that affect the in-use performance in two BREEAM Excellent building, with focus on the management of the indoor environmental conditions and the energy consumption. The study focused on the thermal, lighting and aural indoor environment, exploring the building occupant’s practices and behaviours adopted to achieve comfort and their satisfaction with the indoor conditions in the case studies. The purpose of the study was to identify:
• The levels of satisfaction of the building occupants with different aspects of performance of BREEAM certified building at different times of the year, focused on thermal, acoustic and lighting comfort levels.
• Occupant practices and organisational norms that affect the level of adaptation by building occupants and their satisfaction with the indoor conditions (adaptation opportunities and restrictions to personal adaptation: clothing levels, operation of windows, use of blinds, etc.)
As a secondary aspect, the study explored the occupants’ awareness about the sustainable and energy efficiency features of the buildings.

rics.org/cobraconference
RESEARCH METHODOLOGY This study explored the occupants’ satisfaction levels and perceptions with regards to the thermal, lighting, acoustic environment; the occupants’ routines and practices in the buildings; and their knowledge about the energy efficient strategies and features of the buildings, the controls and practices to modify the thermal, lighting and acoustic parameters of the indoor environment. The study comprised physical monitoring and users’ studies in two BREEAM Excellent offices buildings. The information about the case studies is presented in Table 1 Table 1 Summary of the case studies Case Study 1 2 Building type Office Office Location South Wales South West England Area 3736 1130 BER KgCO2/m2 24.88 14.81 EPC A A DEC B 31 B 34 BREEAM Rating Excellent Excellent BREEAM Credits 73.89% 74.42% A physical monitoring study was carried for one year to record the key indicators of indoor environmental conditions: globe temperature, air temperature, CO2 levels and relative humidity; using a multi-sensor Extech Sd800 data-logger at 5 minute intervals. The parameters were monitored as proxy of the thermal conditions and ventilation in the buildings. Two locations were monitored in case study 1 and three locations were monitored in case study 2. Information about the electricity and gas consumption was obtained from the research sites using the meter readers (Case Study 1) and the Building Management System recordings (Case Study 2). Detailed monitoring was not implemented in the buildings due to resource limitations; yet, the data available provided a reference to the building performance in relation to thermal conditions, ventilation and energy consumption. Four visits were scheduled in one day of each season (summer, autumn, winter and spring) per case study. During the seasonal visits, qualitative studies were conducted with the building occupants to identify their perceptions and satisfaction about the indoor environmental conditions. During the seasonal visits in-situ measurements of indoor environmental parameters were taken to compare them to the satisfaction with the indoor environmental conditions reported by occupants. The indoor environmental parameters monitored in the seasonal visits were the internal air temperature, mean radiant –globe- temperature, air velocity, relative humidity, illuminance levels and ambient noise level. The instruments used were (1) Testo 435 anemometer, (2) Tes 1332 digital lux meter, (3) Digital impulse sound level meter Dave D14-22C and calibrator, (4) Eltek squirrer data logger 1000 server to record the globe temperature, illuminance and relative humidity. User studies were conducted during the seasonal visits as a snapshot of the occupants’ perceptions about the indoor environmental conditions in the buildings: the thermal, acoustic and lighting environment. The user studies comprised semi-structured

rics.org/cobraconference
interviews and two questionnaires: (1) General questionnaire; and, (2) Seasonal perception. Two questionnaires were administered in each of the seasonal visits. The General questionnaires comprised questions about the occupants’ satisfaction levels with the indoor conditions; actions taken to achieve comfort and modify the thermal, lighting and acoustic conditions; and, their understanding of building systems and controls to modify the thermal and lighting conditions. The Seasonal Perception questionnaire was administered to identify the satisfaction levels of the building occupants on the day of the seasonal visits and the actions taken to achieve comfort. The Seasonal Perception questionnaire had a morning and an afternoon section to explore variations during the day of the visit. The seasonal perception questionnaires were analysed in the light of the monitored data measured in-situ on the day of the visit. Table 2 shows the number of questionnaires that were returned in the case studies: Table 2 Questionnaires returned per case study
Case Study No. General data Section 2 questionnaire (AM/PM variations) Summer Autumn Winter Spring
CS 1 28 13 16 13 12 CS 2 28 16 8 13 12
The semi-structured interviews included open-ended questions to key informants in the buildings, facilities managers and occupant representatives (i.e. teacher, employees in the office). The length of the each interview was between 45 and 60 minutes. It should be noted that this research is of qualitative nature and is indicative of occupant practices in BREEAM buildings in relation to measurements of indoor environment conditions and energy consumption. The purpose is to explore the variations in conditions and perceptions throughout the year and to analyse these in relation to the in-use performance. These aspects are of importance in the light of performance gaps and the ongoing intentions by policy and industry to improve the performance of existing buildings. OCCUPANTS’ PERCEPTIONS ABOUT THE INDOOR ENVIRONMENT Case study 1: office in South Wales The key indicators of the indoor environmental parameters recorded on the day of the seasonal visits is summarised in Table 3. These figures correspond to measurements taken in the office area and at working plane level. Table 3 Environmental parameters on the day of the seasonal visits
summer autumn winter spring
Temperature C 24-25.6 23-26.5 22.5-24.5 24.0-25.4
Lighting (lux) 411-560 459-519 402-422 270-394
Noise (dB) 43-56.7 48.6-60.8 53.6-59.4 n/a

rics.org/cobraconference
During the long-term monitoring period between August and December, the temperature in the building was recorded to be between 25-27oC during 50% of the working hours. The average CO2 level was 936.6ppm with a maximum of 1026.6. The benchmark for BREEAM Natural ventilated buildings is 800ppm. The average relative humidity was 46.6%. The responses of the seasonal questionnaires show that the main occupant complaint was overheating: 71.43% of respondents reported overheating to be a problem in summer, 37.50% of responses in autumn and 28.57% in winter. Respondents were generally satisfied in spring, only 14.29% of respondents reported overheating discomfort. It was reported that the company is eager to provide a comfortable environment to foster the productivity of the employees in Case Study 1. Therefore, occupants are encouraged to exert adaptation strategies to achieve comfort: flexible dressing code, personalised arrangements for the distribution of the office spaces on the second floor (open plan office configuration) and the use of personal fans and lamps in the workstations. It was reported that employees were able to choose the location of their desk after one year of occupation in the building. The workstations were distributed in the office space according to people’s preferences; for example, people who tend to feel hot sit next to the windows and those who tend to feel cold sit nearby the radiators or in the core of the office plan: Interviewee C: ‘We have had people who specifically asked to move desks to somewhere else because they were hot or cold. One of our girls used to sit near the window but she is really cold so when other of the staff wanted the window opened, she was not happy. But of course, the ones in the middle wanted to get a bit of flow of air so she moved away from the window and near the radiator so in the winter she would have the radiator. So people have said I don’t like it here, it’s too hot, too cold and moved appropriately to a better position.... still you can’t please everybody but we’ve tried the best we can to sit people in a position that make them in a more comfortable environment. In the monitoring exercise that collected data for one year, CO2 levels were recorded as a proxy of indoor air quality and ventilation in the building. Globe temperature and air temperature were monitored as indication of the thermal conditions in the building. These indicators were recorded in two positions in the second floor of the building, the open plan office area where the seasonal surveys and user studies were conducted as shown in Table 4 Table 4 Annual monitoring dataset of globe temperature, air temperature and CO2 in case study 1 Position 1 Position 2 Globe
Temp oC Air Temp oC
CO2 ppm Globe Temp oC
Air Temp oC
CO2 ppm
Maximum 28.9 29.2 2241.0 27.9 28.8 4267.0 Minimum 17.5 18.1 301.0 16.5 17.2 348.0 average 24.6 24.9 850.7 23.5 24.5 870.7 A number of extra lamps, personal fans and personal fan heaters were used in the workstations. Some workstations have one computer and one laptop each. According to CIBSE Guide F, the average power consumption of PC and monitor is 120-175W

rics.org/cobraconference
and of laptops is 20W. During the winter visit, there were 24 computers in the office and 8 laptops in the second floor where approximately 25 employees are based. However, the occupation in the second floor is intermittent and on the day of the visit there were only 10 employees in the office. The employees are discouraged to turn off the computers. The computers remain switched on during the weekends and out of office hours so the employees can have remote access to the office network and computers outside working hours: Interviewee C: ‘Most of the people leave the computers on. We are able to get remotely from home so if you ask lot of people would be logging in away from home so they will leave their computer on in case they need access. We don’t have a policy with regards to switch it off, computers actually. I think most people sign out but don’t power off. Personally, I sign out but leave my computer on. I always turn my monitors off and my printer but it’s not something we have a policy on, tell everybody to turn off, so the majority would probably leave them on...’ The electricity consumption in this case study was 136kWh/m2 while typical electricity benchmark according to CIBSE Guide F is 85 kWh/m2 and for good practice is 54kWh/m2. In terms of lighting strategy, the building was designed to use PIR to control the lights. However, the occupants dislike the lighting system because lights go off during office hours if there is little movement in the office: Interviewee C: ‘We did have problems when we very first moved in ... we actually had all the sensors changed to be the maximum because again, upstairs there is not a lot of movement because people are head down, we are not a moving company, people are sitting at the desk working, [with] very limited [movement] so we had all the lights put on to their maximum time…’. It was reported that additional lights were installed on the second floor: Interviewee C: ‘We did at the very beginning because the distribution of lights on the second floor was quite sparse so people were struggling and they felt it was too dark to be looking at papers and things and we did go and put more lights in between, but since then, it has not been any more problems, that solved the issue’. In terms of lighting conditions, the majority of respondents were satisfied with the lighting levels. Lux levels varied from 243-422 lux in the working space. The percentage of respondents satisfied with the lighting conditions throughout the year were 83% in summer, 63% in autumn, 100% in winter and 83% in spring. In terms of acoustic conditions, the percentage of respondents satisfied with the indoor conditions were: 67% in summer, 38% in autumn, 83% in winter and 50% in spring. In terms of understanding of controls, the prevalent responses were the neutral understanding of controls for heating and lighting. 50% of respondents rated their understanding of heating controls as neutral and 35% rated the understanding of lighting controls as neutral. The majority of participants reported to know the location of thermal controls (85.19%) and how to use them (82.14%). The participants are able to modify the settings of the radiator; exert passive strategies (operation of windows)

rics.org/cobraconference
and personal adaptation (extra layers of clothes, having a drink). In relation to lighting, the participants modify the lighting levels using blinds, desk lamps and changing the brightness of their computer screens. Case study 2: office in South West England The key indicators of the indoor environmental parameters recorded on the day of the seasonal visits is summarised in Table 5: Table 5 Environmental parameters on the seasonal visit
summer autumn winter spring
TemperatureC 20.0-25.2 23.0-25.0 22.0-24.0 22.0-24.5
Lighting(lux) 447-766 447-878 545-828 264-510
Noise(dB) 45-59 44.3-67 58.2-62.7 n/a The main complaint in this building is that overheating in summer (85.71% of responses). In winter 33.33% of respondents rated the building as stale and noisy (open plan office building with central atrium connecting 3 floors). Table 6 summarises key indicators of temperature and CO2 levels as proxy of thermal conditions and indoor air quality in three sample locations in the building. Table 6 Annual monitoring dataset on temperature and CO2 levels Position 1- ground floor Position 2- first floor Position 3- second floor Globe
Temp oC
Air Temp oC
CO2 ppm
Globe Temp oC
Air Temp oC
CO2 ppm
Globe Temp oC
Air Temp oC
CO2 ppm
Maximum 27.4 27.3 1542.0 35.1 26.6 1802.0 27.7 28.2 1399.0 Minimum 15.4 15.9 318.0 18.2 18.4 314.0 16.9 18.4 239.0 average 22.9 23.4 536.3 23.2 23.2 527.3 22.9 23.4 536.5 The research participants complained about the thermal conditions in the building; for example the variation of temperature between different areas of the building and the high temperature in certain rooms: Interviewee D: ‘The upstairs is always warmer than the downstairs by 1 or 2 degrees and certainly the south side of the building tends to be warmer because the sun is on the windows for longer throughout the days…’ Interviewee D: ‘The building has got very hot. I am not sure what the actual temperature has been [in different parts of the building] but in the current part has been 31-32 degrees, certainly 28-33 through the half term period. Because the windows are automated [controlled by CO2 levels], they will close at night, heat suddenly builds up and it is going to go up throughout the day. When the sun comes out, it is going to warm the building up. The internal temperatures do nothing but going up.’ There is no facilities manager on site. The building is part of the estate portfolio of an institution that has a central facilities team. A technician based in the building liaises with the central facilities management team for the operation of the building. This

rics.org/cobraconference
technician expressed that one of the common complaints is the automatic opening of windows, controlled by the BMS on the basis of CO2 levels. When windows open during heavy rain, water enters the building. If the windows open when it is windy, the breeze blows the papers and documents from the desks. The system can be overridden to open and close the windows manually: Interviewee D: ‘Well, there is nothing we can [do]… the windows we can control, but depending on the strength of the wind people will close them. Because the air comes in and blows all the papers of people so people then close them so it gets warmer. If I come in early at 7 o’clock, I try to walk through and open every single window in the building and try to get the coolest air as possible. It is not hot hot but it is not comfortable and even today it is stale air. I opened my window to get fresh air this morning and because the windows don’t get opened fully’. The occupants expressed their dissatisfaction with the lighting system controlled by PIR because the lights go off when people are using the office space: Interviewee D: ‘The lights are set on PIR so they switch off when people stop moving. You see people doing dances. People sit on a desk for an hour and they do not move... sometimes the turning on of the light is a little slow, sometimes it takes 45 seconds to turn back on but it’s not big deal.’ The interviewee said that in the past, the building occupants have reported some discomfort due to glare, especially the occupants whose desks are located next to windows: Interviewee D: ‘People have complained that it is too bright so they have put the blinds on. The only problem with blinds is the wind blowing. You have to compromise. Yes, there is screen glare with the sun coming in.’ The lighting level measured during the seasonal visits ranged from 447-550 with a maximum of 828 lux in office areas at work plane high. The responses during the seasonal questionnaires show that the percentage of respondents satisfied with the lighting conditions throughout the year were 50% in summer, 100% in autumn, 40% in winter and 67% in spring. In terms of acoustic conditions, the percentage of respondents satisfied with the indoor conditions were: 63% in summer, 60% in autumn, 50% in winter and 83% in spring. It was reported that the building has taken part of an Eco-competition to promote environmentally friendly buildings. Case Study 2 won the award in 2009, 2010 and 2011. During the competition for environmental friendly building, an eco-board was used to post information about energy efficiency and recycling. The Ecoboard displays advice about energy efficiency and strategies to save energy, predominantly based on reduction of electricity consumption by switching off lights and equipment that is not in use. Despite of the advice to encourage the reduction of electricity consumption, the technician pointed out that the computers tend to remain on outside working hours: Interviewee D: ‘What happens with the computers is quite interesting... [people are encouraged to] not turn off the computers too frequently, and the computer backups happen at night so if someone turns the computer on usually on a Monday morning or
rics.org/cobraconference
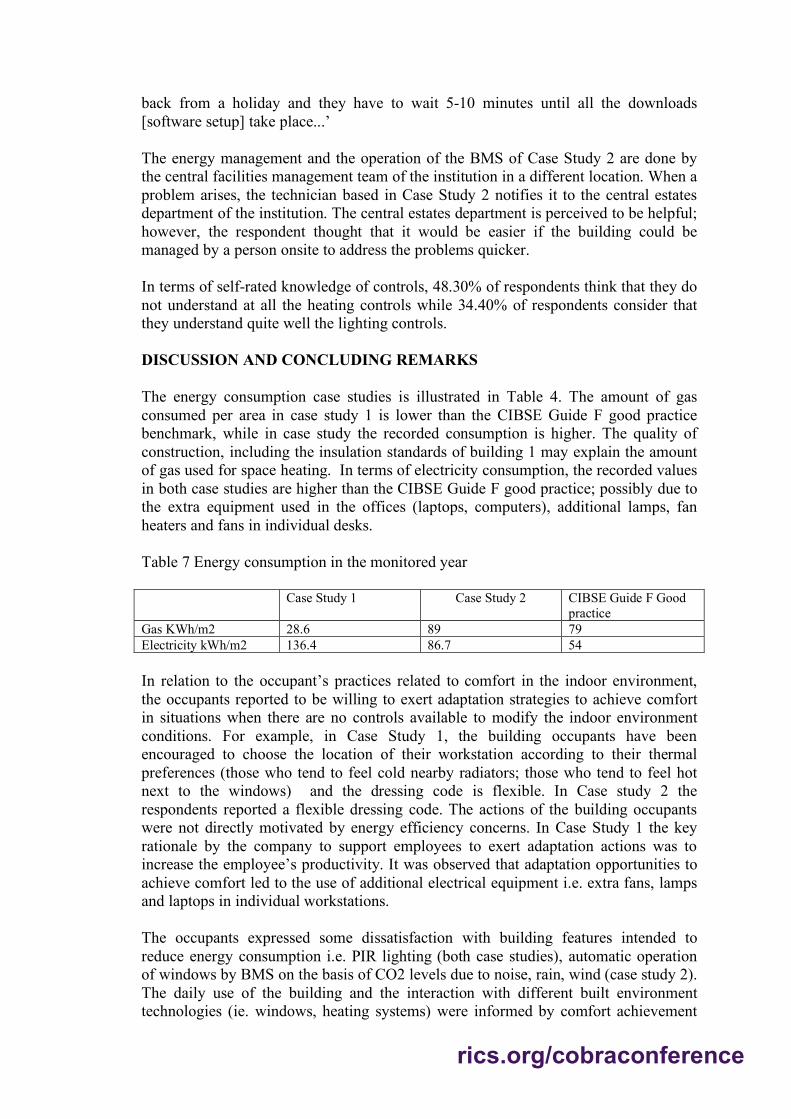
back from a holiday and they have to wait 5-10 minutes until all the downloads [software setup] take place...’ The energy management and the operation of the BMS of Case Study 2 are done by the central facilities management team of the institution in a different location. When a problem arises, the technician based in Case Study 2 notifies it to the central estates department of the institution. The central estates department is perceived to be helpful; however, the respondent thought that it would be easier if the building could be managed by a person onsite to address the problems quicker. In terms of self-rated knowledge of controls, 48.30% of respondents think that they do not understand at all the heating controls while 34.40% of respondents consider that they understand quite well the lighting controls. DISCUSSION AND CONCLUDING REMARKS The energy consumption case studies is illustrated in Table 4. The amount of gas consumed per area in case study 1 is lower than the CIBSE Guide F good practice benchmark, while in case study the recorded consumption is higher. The quality of construction, including the insulation standards of building 1 may explain the amount of gas used for space heating. In terms of electricity consumption, the recorded values in both case studies are higher than the CIBSE Guide F good practice; possibly due to the extra equipment used in the offices (laptops, computers), additional lamps, fan heaters and fans in individual desks. Table 7 Energy consumption in the monitored year Case Study 1 Case Study 2 CIBSE Guide F Good
practice Gas KWh/m2 28.6 89 79 Electricity kWh/m2 136.4 86.7 54 In relation to the occupant’s practices related to comfort in the indoor environment, the occupants reported to be willing to exert adaptation strategies to achieve comfort in situations when there are no controls available to modify the indoor environment conditions. For example, in Case Study 1, the building occupants have been encouraged to choose the location of their workstation according to their thermal preferences (those who tend to feel cold nearby radiators; those who tend to feel hot next to the windows) and the dressing code is flexible. In Case study 2 the respondents reported a flexible dressing code. The actions of the building occupants were not directly motivated by energy efficiency concerns. In Case Study 1 the key rationale by the company to support employees to exert adaptation actions was to increase the employee’s productivity. It was observed that adaptation opportunities to achieve comfort led to the use of additional electrical equipment i.e. extra fans, lamps and laptops in individual workstations. The occupants expressed some dissatisfaction with building features intended to reduce energy consumption i.e. PIR lighting (both case studies), automatic operation of windows by BMS on the basis of CO2 levels due to noise, rain, wind (case study 2). The daily use of the building and the interaction with different built environment technologies (ie. windows, heating systems) were informed by comfort achievement
rics.org/cobraconference
goals primarily. Energy efficiency did not feature as a concern that informed the actions and strategies to modify the indoor environment in everyday use of the buildings. It is acknowledged that due to the scope and nature of the study, it simply offers an indication of the occupants’ perception during different seasons in two case studies. The study is a snapshot of the occupants’ opinions about the buildings and the actions taken to modify the indoor environmental conditions. While the results are indicative of the particular circumstances of the case studies, it illustrates that occupants of non-domestic buildings are willing to engage with controls and to take a range of actions to modify their immediate indoor environment; from personal adaptation to the use of building technologies and controls. These actions have a bearing on the perceived satisfaction with the indoor environmental conditions and the energy consumption in the building. Initiatives to improve the energy performance of existing may benefit from considering the everyday practices enacted by different stakeholders to achieve comfort in the indoor environment, including the wide range of actions and strategies used to modify the indoor conditions. One aspect that warrants further research is examining in detail how occupants engage with a range of strategies to modify their indoor environment and to what extend is desirable to give occupants control of their immediate environment. It is acknowledged that occupants are more tolerant of indoor conditions if they can modify their environment via controls and personal adaptation, particularly in terms of thermal comfort perception. Detailed studies to identify the occupants’ preferences in terms of range of actions to achieve comfort, from adaptation actions to the use of technologies (building technologies such as windows as well as automated control systems) could explore the nexus between comfort achievement, occupant satisfaction and energy consumption in non-domestic buildings. In relation to the management of the indoor environment, another area of further investigation is exploring the different motivations that could drive stakeholders to promote energy efficient practices in non-domestic buildings; for example, health and wellbeing of occupants. REFERENCES Baird, G., Field, C. (2013) Thermal comfort conditions in sustainable buildings – Results of a worldwide survey of users’ perceptions. Renewable Energy 49, 44-47.
BREEAM Building Research Establishment Environmental Assessment Method (2006) http://www.breeam.com/new-construction
Brown, Z., Cole, R., Robinson, J., and Dowlatabadi, H. (2010) Evaluating user experience in green buildings in relation to workplace culture and context. Facilities, 28(3/4), pp.225–238.
Building Bulletin 101: ventilation of school buildings Accessed in December 2015 at https://www.gov.uk/government/publications/building-bulletin-101-ventilation-for-school-buildings

rics.org/cobraconference
Chen, Y., Ford, B. (2013) How Do Occupants Perceive the Building Performance of Award-winning Schools in the UK. In Proceedings of Passive and Low Energy Architecture Conference 29th Conference, Sustainable Architecture for a Renewable Future, Munich, Germany 10-12 September 2013
CIBSE, G. F. (2004). Energy efficiency in buildings. Chartered Institution of Building Services Engineers.
Feige, A., Wallbaum, H., Janser, M., Windlinger, L., (2013). Impact of sustainable office buildings on occupant's comfort and productivity, Journal of Corporate Real Estate, Vol. 15 (1), pp.7 - 34
Gou, Z., Prasad, D., Siu-Yu Lau, S. (2013) Are green buildings more satisfactory and comfortable? Habitat International 39, 156-161.
Sawyer, L., Wilde, P.d., Turpin- Brooks, S. (2008) Energy performance and occupancy satisfaction: A comparison of two closely related buildings. Facilities 26, 542-551.
Schakib-Ekbatan, K., Wagner, A., Lussac, C. (2010) Occupant satisfaction as an indicator for the socio-cultural dimension of sustainable office buildings – Development of an overall building index. In Proceedings of Conference: Adapting to Change: New Thinking on Comfort Cumberland Lodge, Windsor, UK, 9-11 April 2010. London: Network for Comfort and Energy Use in Buildings
Schiavon, S. and Altomonte, S. (2014) Influence of factors unrelated to environmental quality on occupant satisfaction in LEED and non-LEED certified buildings. Building and Environment. 77, 148-159
Smith, A., Pitt, M. (2011) Sustainable workplaces and building user comfort and satisfaction. Journal of Corporate Real Estate 13, 144-156.
Stringer, A., Dunne, J., Boussabaine, H. (2012) Schools design quality: A user perspective. Architectural Engineering and Design Management 8, 257-272.
Veitch, J. C. (2008) Towards a user-centered theory of the built environment. Building Research & Information, 36(3), 231–240.