rieti-jer workshop: economics of aging in japan and other ... · economics of aging in japan and...
TRANSCRIPT
Economics of Aging in Japan and other Societies
YUDA Michio
December 13, 2014
RIETI-JER Workshop
Presentation
Research Institute of Economy, Trade and Industry (RIETI) http://www.rieti.go.jp/en/index.html
Associate Professor, School of Economics, Chukyo University
HOW INFORMAL CAREGIVERS’ HEALTH AFFECTS RECIPIENTS
Michio Yuda (School of Economics, Chukyo University)
and Jinkook Lee
(School of Gerontology, University of Southern California/ RAND Corporation)
1 How Informal Caregivers' Health Affects Recipients By Yuda & Lee
RIETI-JER Conference Dec 13, 2014
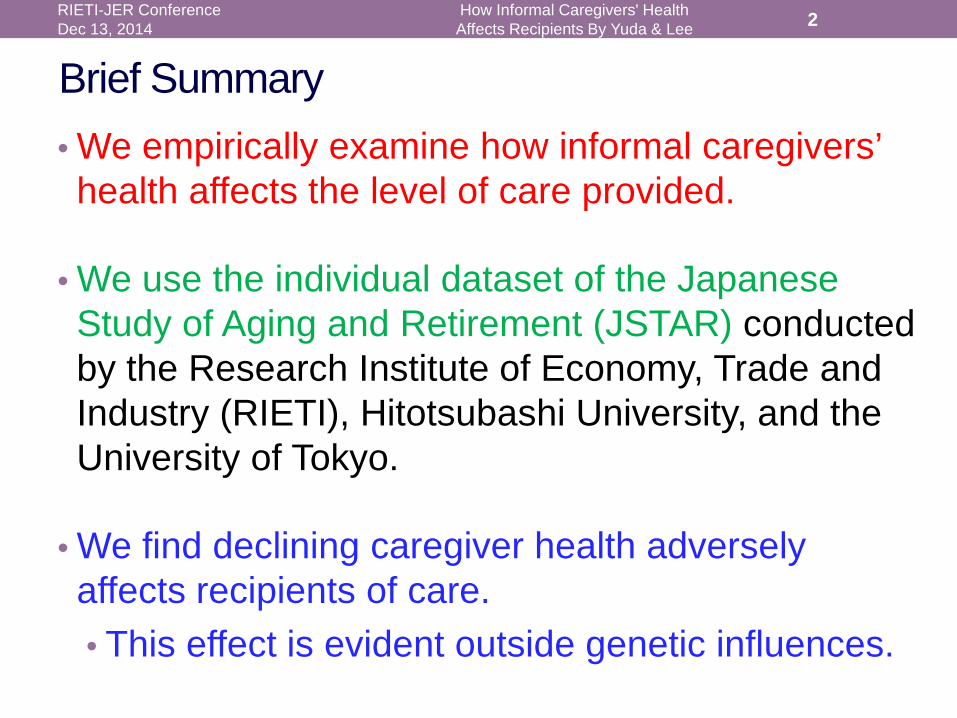
Brief Summary • We empirically examine how informal caregivers’ health affects the level of care provided.
• We use the individual dataset of the Japanese Study of Aging and Retirement (JSTAR) conducted by the Research Institute of Economy, Trade and Industry (RIETI), Hitotsubashi University, and the University of Tokyo.
• We find declining caregiver health adversely affects recipients of care. • This effect is evident outside genetic influences.
2 How Informal Caregivers' Health Affects Recipients By Yuda & Lee
RIETI-JER Conference Dec 13, 2014

Background • In recent years, informal care provision has become
increasingly important in countries that face population aging.
• Advantages • Within a family, informal care, typically by a child for
their elderly parent, can suit the elderly’s needs in their familiar home and environment.
• Informal care can also help alleviate the financial burden of public-health and long-term care systems.
• Disadvantages • Informal care can burden the care providers, worsening
their physical and psychological health, hampering their labor supply, or disrupting their leisure activities.
3 How Informal Caregivers' Health Affects Recipients By Yuda & Lee
RIETI-JER Conference Dec 13, 2014

Previous studies on informal care (1/2) • The relationship between informal and formal care provision.
• Pezzin et al., (1996 JHR), Van Houtven & Norton (2004 JHE, 2008 JHE), Hanaoka & Norton (2008 SSM), Bonsang (2009 JHE), Spillman & Long (2009 Inquiry), Tamiya et al., (2011 Lancet), Kikuchi (2012), Paraponaris et al., (2012 EJHE).
• They find that informal care substitutes for formal care although the effects differ by situation.
• Providing informal care negatively affects the caregiver’s labor
supply. • Carmichael and Charles (1998 JHE, 2003 JHE), Pezzin & Schone,
(1999 JHR), Noguchi & Shimizutani (2004), Carmichael et al., (2010 JHE), Hassink & Van den Berg (2011 SSM), Tamiya et al., (2011 Lancet), Otsu and Komamura (2012), Van Houtven et al., (2013 JHE).
4 How Informal Caregivers' Health Affects Recipients By Yuda & Lee
RIETI-JER Conference Dec 13, 2014

Previous studies on informal care (2/2) • Exploring who becomes a caregiver within a family.
• Fontaine et al., (2009 HE), Pezzin et al., (2009 REH).
• They find that economic conditions of siblings and the relationship between children and parents significantly affect this decision.
• Investigating the burden of family caregiving on caregiver’s
health condition • Kishida & Takagi (2007) and Suzuki et al., (2008 SER), Rubin & White-
Means (2009 JFEI) • Caregiving adversely affects a caregiver’s health (Kisida & Tanigaki (2007),
Suzuki et al., (2008 SER)). • There is no significant effect (Rubin & White-Means (2009 JFEI)).
5 How Informal Caregivers' Health Affects Recipients By Yuda & Lee
RIETI-JER Conference Dec 13, 2014

Contributions • These studies show how long-term care can affect
caregiver behaviors but give little attention to how changes in caregiver’s circumstances ultimately affect those receiving care.
• Using the Japanese Study of Aging and Retirement (JSTAR). • Japan is a critical setting for such research because of
its rapid pace of population aging. • The elder-to-elder nursing care problem (Fig.1).
• This analysis will provide useful insights to policy
makers in other countries facing population aging.
6 How Informal Caregivers' Health Affects Recipients By Yuda & Lee
RIETI-JER Conference Dec 13, 2014

Fig.1 Trends of the Main Caregiver's Age in a Household
Source: The Comprehensive Survey of Living Conditions in 2013, the Ministry of Health, Labour, and Welfare in Japan.
7 How Informal Caregivers' Health Affects Recipients By Yuda & Lee
RIETI-JER Conference Dec 13, 2014
54.4 58.1 58.9 62.7
69.0
40.6 41.1
47.6
45.9
51.2
18.7 19.6 24.9
25.5 29.0
0.0
10.0
20.0
30.0
40.0
50.0
60.0
70.0
80.0
2001 2004 2007 2010 2013
%
over 60 over 65 over 75
The age of informal caregivers has been increasing.
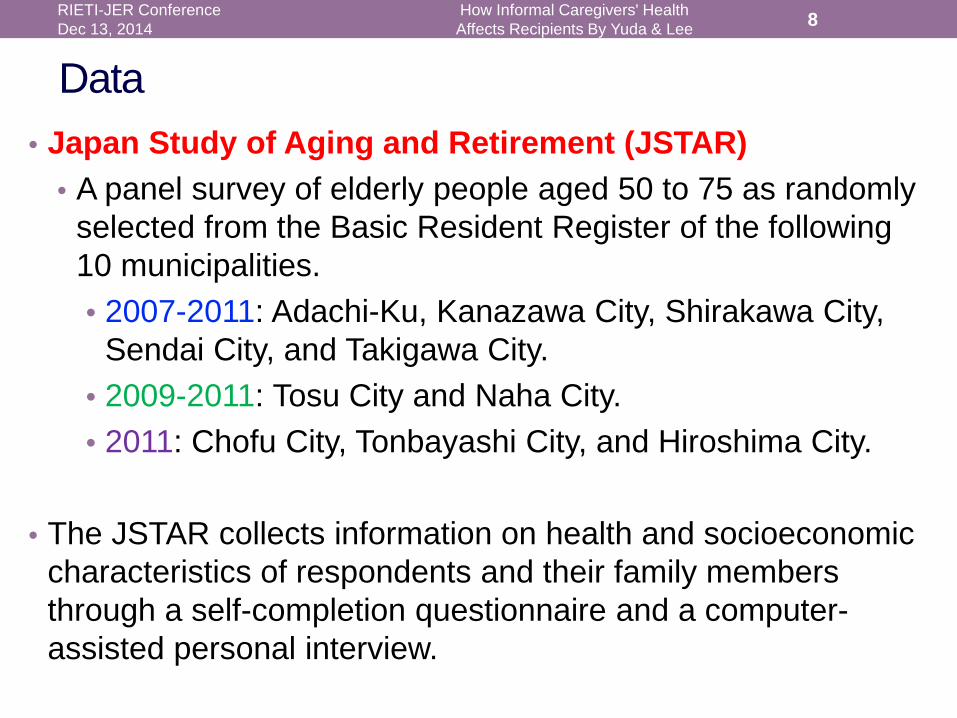
Data • Japan Study of Aging and Retirement (JSTAR)
• A panel survey of elderly people aged 50 to 75 as randomly selected from the Basic Resident Register of the following 10 municipalities. • 2007-2011: Adachi-Ku, Kanazawa City, Shirakawa City,
Sendai City, and Takigawa City. • 2009-2011: Tosu City and Naha City. • 2011: Chofu City, Tonbayashi City, and Hiroshima City.
• The JSTAR collects information on health and socioeconomic
characteristics of respondents and their family members through a self-completion questionnaire and a computer-assisted personal interview.
8 How Informal Caregivers' Health Affects Recipients By Yuda & Lee
RIETI-JER Conference Dec 13, 2014

Main Variables in the Empirical Analysis • Target
• The JSTAR respondents’ still-living parents and parents-in-law at the first survey who are certified for specified care and support levels under the long-term care system.
• We examine the effect of caregiver’s health on care receiver’s care level. • Care receiver’s Health Condition
• Elderly Care Receiver’s Care Level. • Caregiver’s Health Conditions
• Subjective Self-reported Health Status. • The Number of Caregiver’s Difficulty in Performing
Daily Activities. • The Number of Caregiver’s Chronic Diseases
Diagnosed by a Doctor.
9 How Informal Caregivers' Health Affects Recipients By Yuda & Lee
RIETI-JER Conference Dec 13, 2014
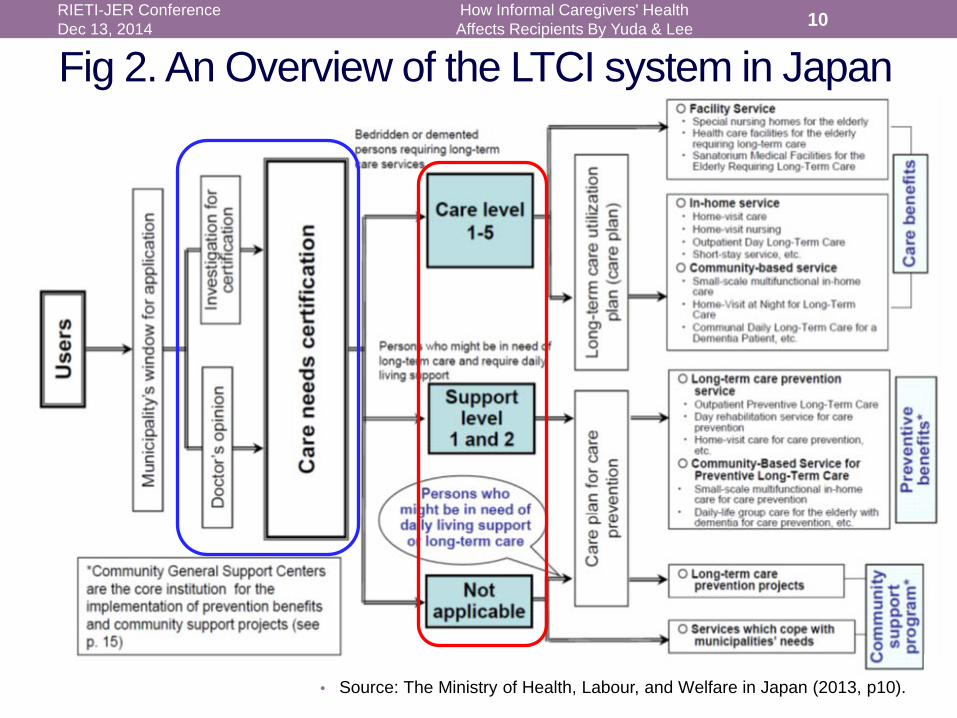
Fig 2. An Overview of the LTCI system in Japan
• Source: The Ministry of Health, Labour, and Welfare in Japan (2013, p10).
RIETI-JER Conference Dec 13, 2014
How Informal Caregivers' Health Affects Recipients By Yuda & Lee 10

Descriptive Statistics : Care Receiver
• The question is “Is your father/ mother/ spouse’s father/ spouse’s mother certified to receive care? If so, at what level of care? Please answer to the best of your ability.”
11 How Informal Caregivers' Health Affects Recipients By Yuda & Lee
RIETI-JER Conference Dec 13, 2014
City 5 MunicipalitiesYear 2007 2009 2011 Total
N (%) N (%) N (%) N (%)Not certified (= 0) 1167 71.0% 651 52.1% 220 45.1% 2038 60.3%Certified for support level 1 43 2.6% 32 2.6% 11 2.3% 86 2.5%
support level 2 34 2.1% 40 3.2% 14 2.9% 88 2.6%care level 1 56 3.4% 32 2.6% 16 3.3% 104 3.1%care level 2 81 4.9% 59 4.7% 37 7.6% 177 5.2%care level 3 87 5.3% 83 6.6% 38 7.8% 208 6.2%care level 4 82 5.0% 74 5.9% 25 5.1% 181 5.4%care level 5 94 5.7% 71 5.7% 36 7.4% 201 5.9%
Death (= 8) 0 0.0% 207 16.6% 91 18.6% 298 8.8%Total 1644 100.0% 1249 100.0% 488 100.0% 3381 100.0%Mean/ (SD) 1.331 (2.314) 2.767 (3.268) 3.186 (3.295) 2.129 (2.955)City 2 Municipalities 3 MunicipalitiesYear 2009 2011 Total 2011
N (%) N (%) N (%) N (%)Not certified (= 0) 320 64.4% 73 40.6% 393 58.1% 243 50.9%Certified for support level 1 15 3.0% 4 2.2% 19 2.8% 15 3.1%
support level 2 20 4.0% 10 5.6% 30 4.4% 28 5.9%care level 1 25 5.0% 7 3.9% 32 4.7% 41 8.6%care level 2 23 4.6% 9 5.0% 32 4.7% 32 6.7%care level 3 30 6.0% 12 6.7% 42 6.2% 37 7.8%care level 4 22 4.4% 10 5.6% 32 4.7% 36 7.5%care level 5 42 8.5% 18 10.0% 60 8.9% 45 9.4%
Death (= 8) 0 0.0% 37 20.6% 37 5.5% 0 0.0%Total 497 100.0% 180 100.0% 677 100.0% 477 100.0%Mean/ (SD) 1.606 (2.462) 3.461 (3.347) 2.099 (2.843) 2.176 (2.583)

Main Variables in the Empirical Analysis • Target
• The JSTAR respondents’ still-living parents and parents-in-law at the first survey who are certified for specified care and support levels under the long-term care system.
• We examine the effect of caregiver’s health on care receiver’s care level. • Care receiver’s Health Condition
• Elderly Care Receiver’s Care Level. • Caregiver’s Health Conditions
• Subjective Self-reported Health Status. • The Number of Caregiver’s Difficulty in Performing
Daily Activities. • The Number of Caregiver’s Chronic Diseases
Diagnosed by a Doctor.
12 How Informal Caregivers' Health Affects Recipients By Yuda & Lee
RIETI-JER Conference Dec 13, 2014
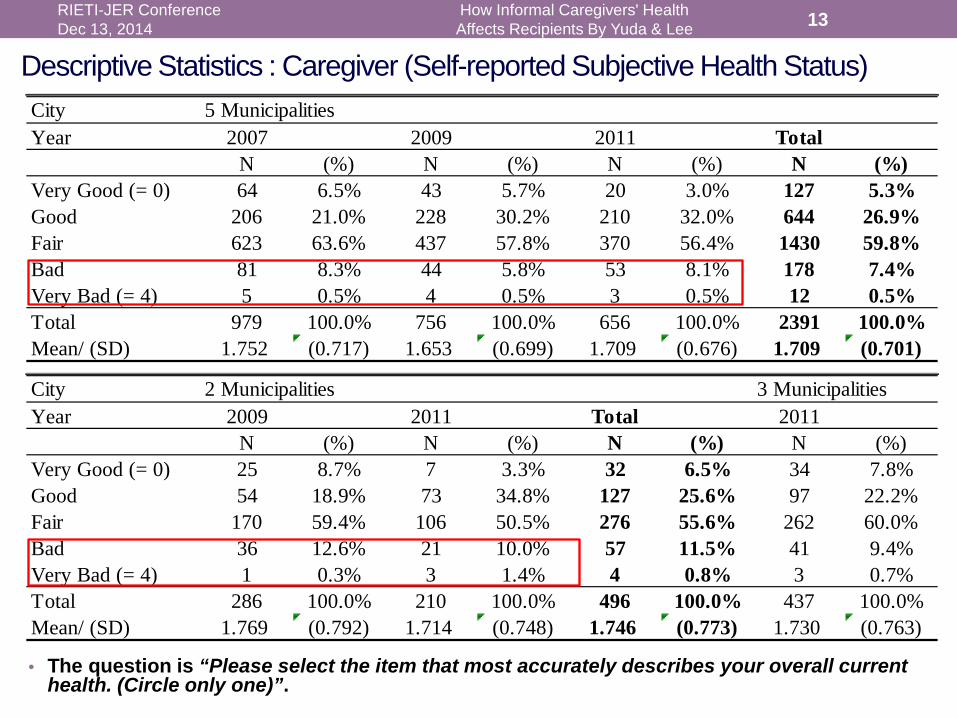
Descriptive Statistics : Caregiver (Self-reported Subjective Health Status)
• The question is “Please select the item that most accurately describes your overall current health. (Circle only one)”.
13 How Informal Caregivers' Health Affects Recipients By Yuda & Lee
RIETI-JER Conference Dec 13, 2014
City 5 MunicipalitiesYear 2007 2009 2011 Total
N (%) N (%) N (%) N (%)Very Good (= 0) 64 6.5% 43 5.7% 20 3.0% 127 5.3%Good 206 21.0% 228 30.2% 210 32.0% 644 26.9%Fair 623 63.6% 437 57.8% 370 56.4% 1430 59.8%Bad 81 8.3% 44 5.8% 53 8.1% 178 7.4%Very Bad (= 4) 5 0.5% 4 0.5% 3 0.5% 12 0.5%Total 979 100.0% 756 100.0% 656 100.0% 2391 100.0%Mean/ (SD) 1.752 (0.717) 1.653 (0.699) 1.709 (0.676) 1.709 (0.701)
City 2 Municipalities 3 MunicipalitiesYear 2009 2011 Total 2011
N (%) N (%) N (%) N (%)Very Good (= 0) 25 8.7% 7 3.3% 32 6.5% 34 7.8%Good 54 18.9% 73 34.8% 127 25.6% 97 22.2%Fair 170 59.4% 106 50.5% 276 55.6% 262 60.0%Bad 36 12.6% 21 10.0% 57 11.5% 41 9.4%Very Bad (= 4) 1 0.3% 3 1.4% 4 0.8% 3 0.7%Total 286 100.0% 210 100.0% 496 100.0% 437 100.0%Mean/ (SD) 1.769 (0.792) 1.714 (0.748) 1.746 (0.773) 1.730 (0.763)

Descriptive Statistics : Caregiver (The Number of Caregiver’s Difficulty in Performing Daily Activities)
14 How Informal Caregivers' Health Affects Recipients By Yuda & Lee
RIETI-JER Conference Dec 13, 2014
City 5 MunicipalitiesYear 2007 2009 2011 Total# of difficulties N (%) N (%) N (%) N (%)
0 894 87.0% 879 90.0% 571 83.4% 2344 87.1%1 56 5.5% 41 4.2% 58 8.5% 155 5.8%2 33 3.2% 18 1.8% 18 2.6% 69 2.6%3 10 1.0% 10 1.0% 8 1.2% 28 1.0%4 11 1.1% 10 1.0% 8 1.2% 29 1.1%5 6 0.6% 6 0.6% 2 0.3% 14 0.5%6 4 0.4% 4 0.4% 0 0.0% 8 0.3%7 4 0.4% 2 0.2% 3 0.4% 9 0.3%8 2 0.2% 1 0.1% 2 0.3% 5 0.2%9 5 0.5% 2 0.2% 4 0.6% 11 0.4%
10 3 0.3% 4 0.4% 11 1.6% 18 0.7%Total 1028 100.0% 977 100.0% 685 100.0% 2690 100.0%Mean/ (SD) 0.359 (1.265) 0.288 (1.154) 0.501 (1.667) 0.369 (1.346)City 2 Municipalities 3 MunicipalitiesYear 2009 2011 Total 2011# of difficulties N (%) N (%) N (%) N (%)
0 279 84.0% 197 84.9% 476 84.4% 425 87.4%1 29 8.7% 17 7.3% 46 8.2% 22 4.5%2 7 2.1% 5 2.2% 12 2.1% 12 2.5%3 6 1.8% 3 1.3% 9 1.6% 11 2.3%4 5 1.5% 2 0.9% 7 1.2% 7 1.4%5 3 0.9% 1 0.4% 4 0.7% 1 0.2%6 1 0.3% 2 0.9% 3 0.5% 2 0.4%7 0 0.0% 1 0.4% 1 0.2% 0 0.0%8 0 0.0% 1 0.4% 1 0.2% 3 0.6%9 1 0.3% 0 0.0% 1 0.2% 2 0.4%
10 1 0.3% 3 1.3% 4 0.7% 1 0.2%Total 332 100.0% 232 100.0% 564 100.0% 486 100.0%Mean/ (SD) 0.366 (1.152) 0.457 (1.554) 0.402 (1.331) 0.362 (1.259)

Note: Definitions of The difficulty in performing daily activities
• Walk 100 meters. • Sit in a chair for two hours continuously. • Get up from a chair after sitting continuously for a long
time. • Climb up several flights of stairs without using the handrail. • Climb up one flight of stairs without using the handrail. • Squat or kneel. • Raise your hands above your shoulders. • Push or pull a large object such as a living-room chair or
sofa. • Lift and carry an object weighing 5kg or more, such as a
bag of rice. • Pick up a small object such as a one-yen coin from a
desktop with your fingers.
15 How Informal Caregivers' Health Affects Recipients By Yuda & Lee
RIETI-JER Conference Dec 13, 2014
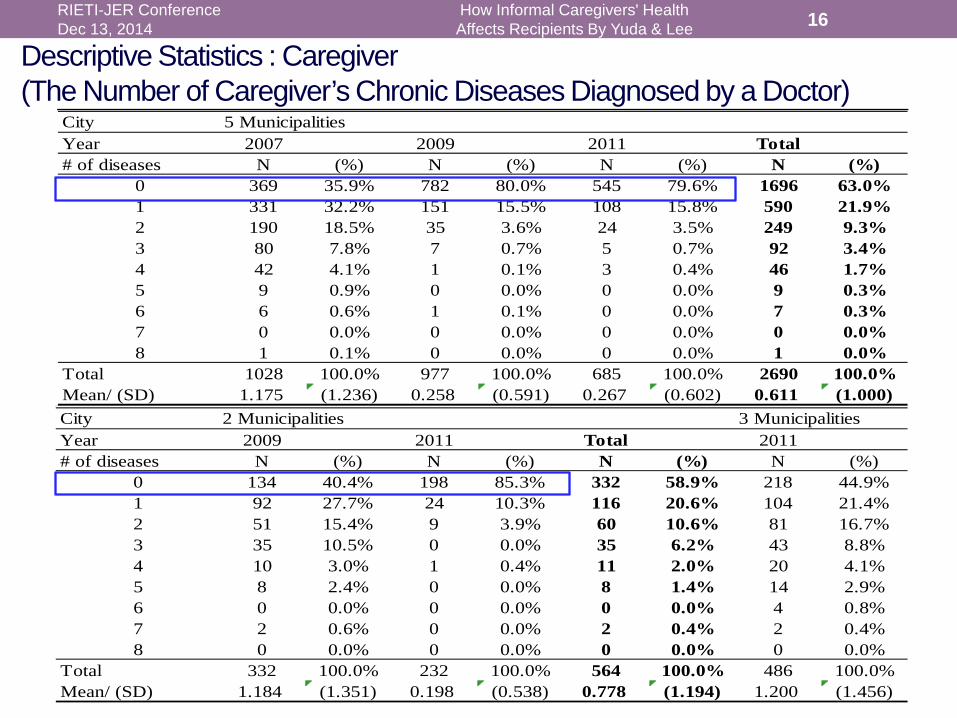
Descriptive Statistics : Caregiver (The Number of Caregiver’s Chronic Diseases Diagnosed by a Doctor)
16 How Informal Caregivers' Health Affects Recipients By Yuda & Lee
RIETI-JER Conference Dec 13, 2014
City 5 MunicipalitiesYear 2007 2009 2011 Total# of diseases N (%) N (%) N (%) N (%)
0 369 35.9% 782 80.0% 545 79.6% 1696 63.0%1 331 32.2% 151 15.5% 108 15.8% 590 21.9%2 190 18.5% 35 3.6% 24 3.5% 249 9.3%3 80 7.8% 7 0.7% 5 0.7% 92 3.4%4 42 4.1% 1 0.1% 3 0.4% 46 1.7%5 9 0.9% 0 0.0% 0 0.0% 9 0.3%6 6 0.6% 1 0.1% 0 0.0% 7 0.3%7 0 0.0% 0 0.0% 0 0.0% 0 0.0%8 1 0.1% 0 0.0% 0 0.0% 1 0.0%
Total 1028 100.0% 977 100.0% 685 100.0% 2690 100.0%Mean/ (SD) 1.175 (1.236) 0.258 (0.591) 0.267 (0.602) 0.611 (1.000)City 2 Municipalities 3 MunicipalitiesYear 2009 2011 Total 2011# of diseases N (%) N (%) N (%) N (%)
0 134 40.4% 198 85.3% 332 58.9% 218 44.9%1 92 27.7% 24 10.3% 116 20.6% 104 21.4%2 51 15.4% 9 3.9% 60 10.6% 81 16.7%3 35 10.5% 0 0.0% 35 6.2% 43 8.8%4 10 3.0% 1 0.4% 11 2.0% 20 4.1%5 8 2.4% 0 0.0% 8 1.4% 14 2.9%6 0 0.0% 0 0.0% 0 0.0% 4 0.8%7 2 0.6% 0 0.0% 2 0.4% 2 0.4%8 0 0.0% 0 0.0% 0 0.0% 0 0.0%
Total 332 100.0% 232 100.0% 564 100.0% 486 100.0%Mean/ (SD) 1.184 (1.351) 0.198 (0.538) 0.778 (1.194) 1.200 (1.456)

Note: Definitions of The chronic diseases • Heart disease (angina, heart failure, cardiac infarction, valve disease, etc.) • High blood pressure • Hyperlipimia • Cerebral accident • Cerebrovascular accident • Diabetes • Chronic lung disease (chronic bronchitis, emphysema, etc.), • Asthma • Liver disease (hepatitis B or C, hepatic cirrhosis, etc. Not including liver cancer) • Ulcer or other stomach disorder • Joint disorder (Arthritis, rheumatism) • Broken hip • Osteoporosis • Eye disease (Cataracts, glaucoma, etc.) • Ear disorder (hard of hearing, etc.) • Bladder disorder (incontinence,leakage, difficulty in urinating, enlarged prostate) • Parkinson's Disease • Depression and emotional disorder • Dementia • Skin disorder • Cancer (including leukemia, lymphoma; not including benign skin cancer) • Other.
17 How Informal Caregivers' Health Affects Recipients By Yuda & Lee
RIETI-JER Conference Dec 13, 2014
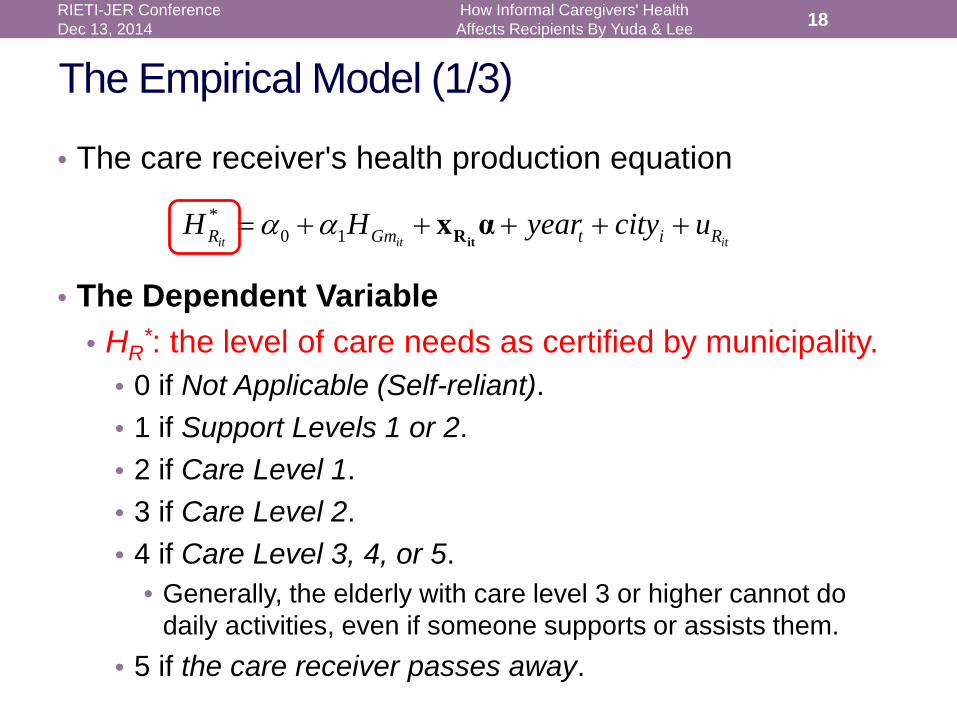
The Empirical Model (1/3)
• The care receiver's health production equation
• The Dependent Variable • HR
*: the level of care needs as certified by municipality. • 0 if Not Applicable (Self-reliant). • 1 if Support Levels 1 or 2. • 2 if Care Level 1. • 3 if Care Level 2. • 4 if Care Level 3, 4, or 5.
• Generally, the elderly with care level 3 or higher cannot do daily activities, even if someone supports or assists them.
• 5 if the care receiver passes away.
18 How Informal Caregivers' Health Affects Recipients By Yuda & Lee
RIETI-JER Conference Dec 13, 2014
*0 1it it itR Gm t i RH H year city uα α= + + + + +
itRx α

The Empirical Model (2/3) • The care receiver's health production equation
• The Important Independent Variable • HGm: the caregiver’s health condition.
• HG1: subjective self-reported health status. • 0 = Very Good, 1 = Good, 2 = Fair, 3 = Bad, 4 = Very Bad.
• HG2: an index for caregiver's difficulty in performing daily activities. • 1 if the caregiver has more than one difficulty.
• HG3: an index for caregiver's chronic diseases diagnosed by a doctor. • 1 if the caregiver has more than one chronic disease.
• If α1 > 0, deterioration in the aged caregiver’s health leads to worse care for those receiving it.
19 How Informal Caregivers' Health Affects Recipients By Yuda & Lee
RIETI-JER Conference Dec 13, 2014
*0 1it it itR Gm t i RH H year city uα α= + + + + +
itRx α
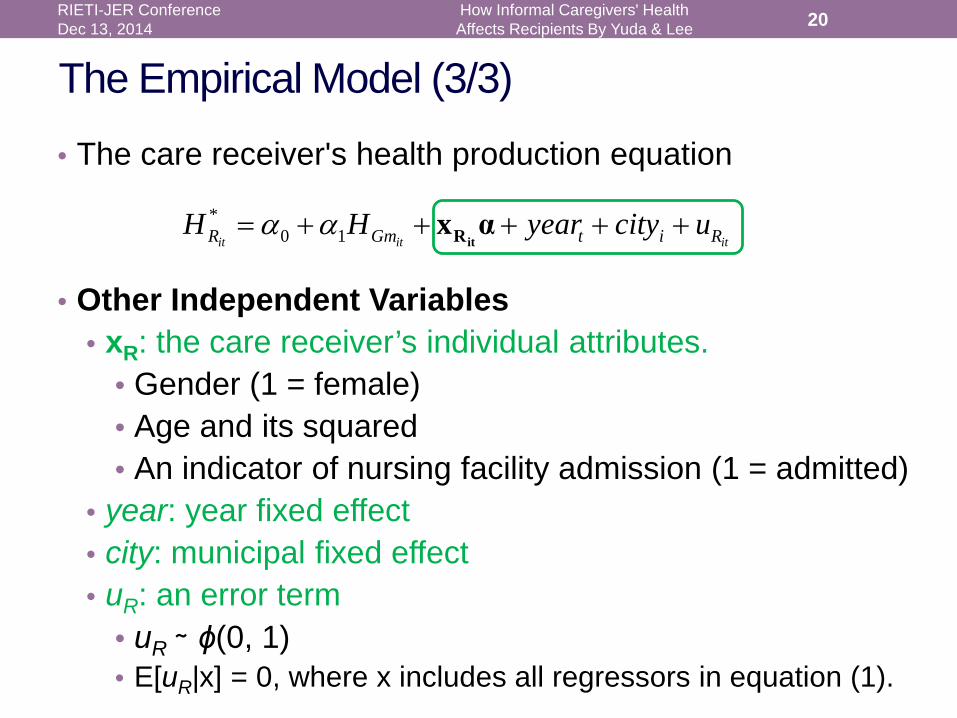
The Empirical Model (3/3)
• The care receiver's health production equation
• Other Independent Variables • xR: the care receiver’s individual attributes.
• Gender (1 = female) • Age and its squared • An indicator of nursing facility admission (1 = admitted)
• year: year fixed effect • city: municipal fixed effect • uR: an error term
• uR ∼ ϕ(0, 1) • E[uR|x] = 0, where x includes all regressors in equation (1).
20 How Informal Caregivers' Health Affects Recipients By Yuda & Lee
RIETI-JER Conference Dec 13, 2014
*0 1it it itR Gm t i RH H year city uα α= + + + + +
itRx α

Endogenous Problem • We should think that HGm are also endogenous.
• This may make estimated parameters biased. • Solution to this problem: Joint estimation
• xG: the caregiver’s individual attributes = Instrumental variables
• Gender (1 = female)/ Age and its squared/ years of education • marital status/ the number of dependent minors (aged 19 and under) • gross yearly (marital) income, the amount of (marital) assets. • an index for having financial support from another person besides
one’s spouse • [hours of informal care provision per day]
• uR’ & uG : error terms • (uR’, uG) ∼ ϕ2(0, 0, 1, 1, ρ) • E[uR’ |x] = 0 and E[uG |z] = 0,
21 How Informal Caregivers' Health Affects Recipients By Yuda & Lee
RIETI-JER Conference Dec 13, 2014
'* *
0 1it it itR Gm t i R
H H year city uα α= + + + + +itRx α
*0it itGm t i GH year city uβ= + + + + +
it itG Rx β x γ
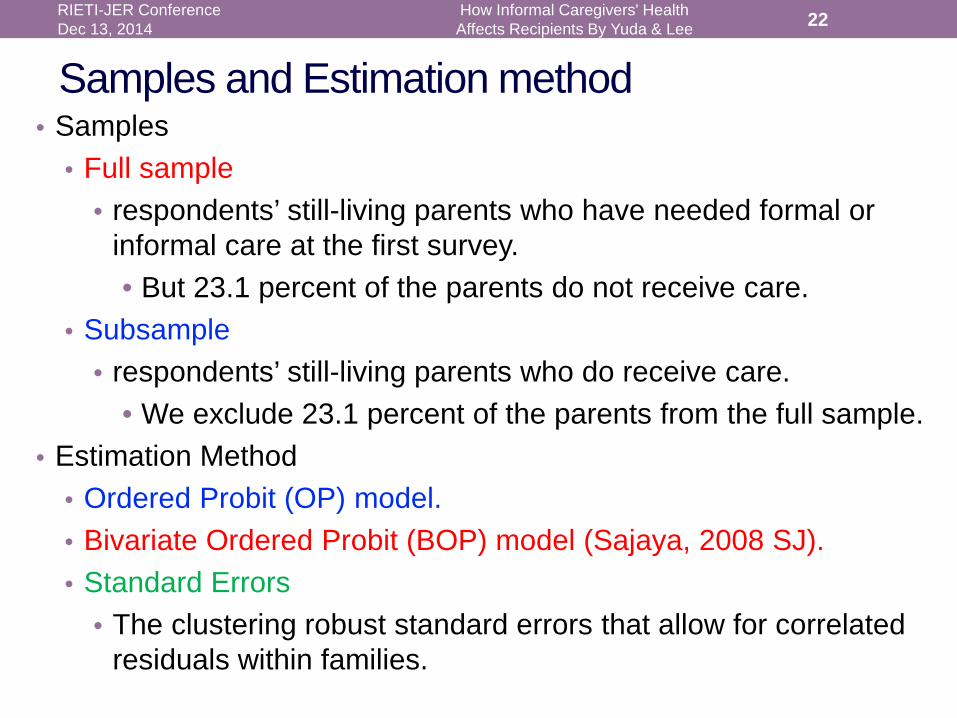
Samples and Estimation method • Samples
• Full sample • respondents’ still-living parents who have needed formal or
informal care at the first survey. • But 23.1 percent of the parents do not receive care.
• Subsample • respondents’ still-living parents who do receive care.
• We exclude 23.1 percent of the parents from the full sample. • Estimation Method
• Ordered Probit (OP) model. • Bivariate Ordered Probit (BOP) model (Sajaya, 2008 SJ). • Standard Errors
• The clustering robust standard errors that allow for correlated residuals within families.
22 How Informal Caregivers' Health Affects Recipients By Yuda & Lee
RIETI-JER Conference Dec 13, 2014

23 How Informal Caregivers' Health Affects Recipients By Yuda & Lee
RIETI-JER Conference Dec 13, 2014
Sample Full sample SubsampleEndogenous variables Mean SD Min Max Mean SD Min Max Care receiver's Care Level 1.408 1.878 0 5 1.812 1.952 0 5 Caregiver's Self-reported Health Status 1.712 0.713 0 4 1.716 0.720 0 4 Caregiver's Difficulty Performing (=1 if Yes) 0.122 0.327 0 1 0.131 0.338 0 1 Caregiver's Diseases Diagnosed by a Doctor (=1 if Yes) 0.441 0.497 0 1 0.448 0.497 0 1Care Receiver's Charactristics Female 0.741 0.438 0 1 0.761 0.427 0 1 Age 86.578 6.508 59 105 87.746 6.295 59 105 Institutioned 0.208 0.406 0 1 0.268 0.443 0 1Caregiver's Charactristics Female 0.483 0.500 0 1 0.488 0.500 0 1 Age 60.127 5.739 50 79 60.863 5.907 50 79 Years of Education 12.735 2.389 9 21 12.614 2.415 9 21 Marriage 0.903 0.296 0 1 0.881 0.323 0 1 Number of Dependents aged under 19 0.091 0.388 0 4 0.079 0.368 0 4 Income (10 million yen) 0.400 0.661 0 27.524 0.387 0.699 0 27.524 Financial Asset (10 million yen) 0.627 1.392 0 15.2 0.632 1.356 0 15.2 Financial Support (=1 if Yes) 0.105 0.307 0 1 0.106 0.308 0 1 Hours of Providing Informal Care per Day 0.435 1.369 0 24 0.463 1.388 0 24Number of observations 4535 3524Number of Groups (Individuals) 2700 2075Number of Clusters (Families) 1582 1578
Descriptive Statistics
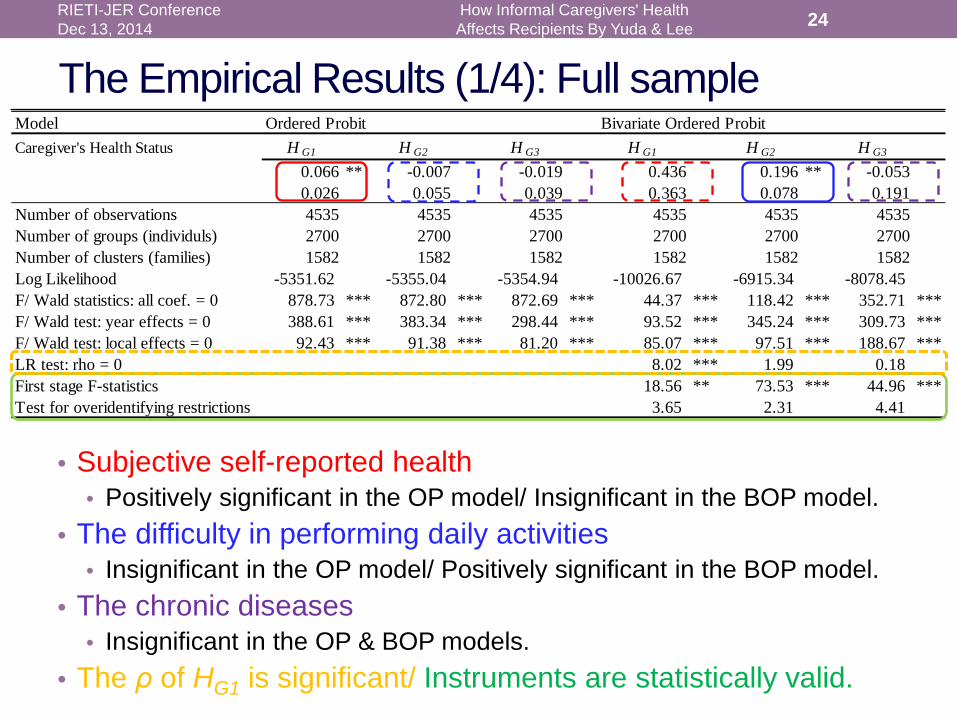
The Empirical Results (1/4): Full sample 24 How Informal Caregivers' Health
Affects Recipients By Yuda & Lee RIETI-JER Conference Dec 13, 2014
Model Ordered Probit Bivariate Ordered ProbitCaregiver's Health Status H G1 H G2 H G3 H G1 H G2 H G3
0.066 ** -0.007 -0.019 0.436 0.196 ** -0.0530.026 0.055 0.039 0.363 0.078 0.191
Number of observations 4535 4535 4535 4535 4535 4535Number of groups (individuls) 2700 2700 2700 2700 2700 2700Number of clusters (families) 1582 1582 1582 1582 1582 1582Log Likelihood -5351.62 -5355.04 -5354.94 -10026.67 -6915.34 -8078.45F/ Wald statistics: all coef. = 0 878.73 *** 872.80 *** 872.69 *** 44.37 *** 118.42 *** 352.71 ***F/ Wald test: year effects = 0 388.61 *** 383.34 *** 298.44 *** 93.52 *** 345.24 *** 309.73 ***F/ Wald test: local effects = 0 92.43 *** 91.38 *** 81.20 *** 85.07 *** 97.51 *** 188.67 ***LR test: rho = 0 8.02 *** 1.99 0.18First stage F-statistics 18.56 ** 73.53 *** 44.96 ***Test for overidentifying restrictions 3.65 2.31 4.41
• Subjective self-reported health • Positively significant in the OP model/ Insignificant in the BOP model.
• The difficulty in performing daily activities • Insignificant in the OP model/ Positively significant in the BOP model.
• The chronic diseases • Insignificant in the OP & BOP models.
• The ρ of HG1 is significant/ Instruments are statistically valid.

The Empirical Results (2/4): Full sample 25 How Informal Caregivers' Health
Affects Recipients By Yuda & Lee RIETI-JER Conference Dec 13, 2014
Model Bivariate Ordered Probit BOP model with hours of informal care per dayCaregiver's Health Status H G1 H G2 H G3 H G1 H G2 H G3
0.436 0.196 ** -0.053 0.687 0.238 *** 0.0240.363 0.078 0.191 0.502 0.090 0.322
Number of observations 4535 4535 4535 4535 4535 4535Number of groups (individuls) 2700 2700 2700 2700 2700 2700Number of clusters (families) 1582 1582 1582 1582 1582 1582Log Likelihood -10026.67 -6915.34 -8078.45 -10025.15 -6912.90 -8078.06F/ Wald statistics: all coef. = 0 44.37 *** 118.42 *** 352.71 *** 39.90 ** 119.24 *** 355.43 ***F/ Wald test: year effects = 0 93.52 *** 345.24 *** 309.73 *** 13.37 *** 318.56 *** 310.68 ***F/ Wald test: local effects = 0 85.07 *** 97.51 *** 188.67 *** 49.54 *** 95.65 *** 190.61 ***LR test: rho = 0 8.02 *** 1.99 0.18 11.74 *** 3.73 * 0.21First stage F-statistics 18.56 ** 73.53 *** 44.96 *** 14.70 71.34 *** 46.88 ***Test for overidentifying restrictions 3.65 2.31 4.41 4.11 3.08 4.61
• Subjective self-reported health • Insignificant in the both BOP model.
• The difficulty in performing daily activities • Positively significant in the both BOP model.
• The chronic diseases • Insignificant in the both BOP model.
• The ρs of HG1 & HG2 are significant/ Instruments are statistically valid.

The Empirical Results (3/4): Subsample 26 How Informal Caregivers' Health
Affects Recipients By Yuda & Lee RIETI-JER Conference Dec 13, 2014
Model Ordered Probit Bivariate Ordered ProbitCaregiver's Health Status H G1 H G2 H G3 H G1 H G2 H G3
0.066 ** -0.024 -0.036 -0.186 0.162 * -0.2370.028 0.059 0.043 0.546 0.086 0.232
Number of observations 3524 3524 3524 3524 3524 3524Number of groups (individuls) 2075 2075 2075 2075 2075 2075Number of clusters (families) 1578 1578 1578 1578 1578 1578Log Likelihood -4847.29 -4850.23 -4849.94 -8515.39 -6123.85 -6958.24F/ Wald statistics: all coef. = 0 701.87 *** 693.96 *** 692.98 *** 53.72 *** 114.10 *** 351.54 ***F/ Wald test: year effects = 0 478.17 *** 473.01 *** 365.03 *** 34.44 *** 421.38 *** 304.24 ***F/ Wald test: local effects = 0 76.64 *** 75.75 *** 64.35 *** 73.30 *** 82.43 *** 188.44 ***LR test: rho = 0 6.62 ** 2.13 1.50First stage F-statistics 24.39 *** 75.41 *** 39.62 ***Test for overidentifying restrictions 4.93 2.74 4.92
• Subjective self-reported health • Positively significant in the OP model/ Insignificant in the BOP model.
• The difficulty in performing daily activities • Insignificant in the OP model/ Positively significant in the BOP model.
• The chronic diseases • Insignificant in the OP & BOP models.
• The ρ of HG1 is significant/ Instruments are statistically valid.

The Empirical Results (4/4): Subsample 27 How Informal Caregivers' Health
Affects Recipients By Yuda & Lee RIETI-JER Conference Dec 13, 2014
Model Bivariate Ordered Probit BOP model with hours of informal care per dayCaregiver's Health Status H G1 H G2 H G3 H G1 H G2 H G3
-0.186 0.162 * -0.237 -0.287 0.199 *** -0.2050.546 0.086 0.232 1.346 0.089 0.373
Number of observations 3524 3524 3524 3524 3524 3524Number of groups (individuls) 2075 2075 2075 2075 2075 2075Number of clusters (families) 1578 1578 1578 1578 1578 1578Log Likelihood -8515.39 -6123.85 -6958.24 -8515.32 -6120.71 -6958.19F/ Wald statistics: all coef. = 0 53.72 *** 114.10 *** 351.54 *** 53.82 *** 114.91 *** 352.35 ***F/ Wald test: year effects = 0 34.44 *** 421.38 *** 304.24 *** 14.99 *** 394.59 *** 305.28 ***F/ Wald test: local effects = 0 73.30 *** 82.43 *** 188.44 *** 65.23 *** 82.00 *** 186.14 ***LR test: rho = 0 6.62 ** 2.13 1.50 6.06 ** 3.28 * 1.32First stage F-statistics 24.39 *** 75.41 *** 39.62 *** 23.97 *** 73.14 *** 41.01 ***Test for overidentifying restrictions 4.93 2.74 4.92 5.25 3.54 5.71
• Subjective self-reported health • Insignificant in the both BOP model.
• The difficulty in performing daily activities • Positively significant in the both BOP model.
• The chronic diseases • Insignificant in the both BOP model.
• The ρs of HG1 & HG2 are significant/ Instruments are statistically valid.

Exclusion of Genetic Effect (1/5)
• Genes can affect health and activities (E.g., Conley, 2009 BSB; Cawley et al., 2011 HE, Cawley and Ruhm, 2012 HBHE). • The previous empirical results may reflect that health
deterioration of both parents and adult children resulting from shared genetic characteristics.
• We remove genetic effects from our analysis by
examining the effect of caregiver’s health on the health of in-laws receiving care.
28 How Informal Caregivers' Health Affects Recipients By Yuda & Lee
RIETI-JER Conference Dec 13, 2014

Exclusion of Genetic Effect (2/5): Full sample 29 How Informal Caregivers' Health
Affects Recipients By Yuda & Lee RIETI-JER Conference Dec 13, 2014
Model Ordered Probit Bivariate Ordered ProbitCaregiver's Health Status H G1 H G2 H G3 H G1 H G2 H G3
0.079 * 0.156 0.057 0.671 *** 0.263 -0.0780.043 0.098 0.065 0.252 0.298 0.390
Number of observations 1738 1738 1738 1738 1738 1738Number of groups (individuls) 1197 1197 1197 1197 1197 1197Number of clusters (families) 972 972 972 972 972 972Log Likelihood -1874.58 -1875.01 -1875.97 -3656.52 -2422.35 -2940.55F/ Wald statistics: all coef. = 0 395.83 *** 391.16 *** 397.28 *** 34.89 ** 62.20 *** 179.85 ***F/ Wald test: year effects = 0 175.10 *** 174.46 *** 143.77 *** 35.60 *** 164.47 *** 154.84 ***F/ Wald test: local effects = 0 60.81 *** 62.65 *** 60.50 *** 41.50 *** 67.19 *** 83.20 ***LR test: rho = 0 5.89 ** 2.84 * 0.83First stage F-statistics 14.86 * 27.18 *** 29.68 ***Test for overidentifying restrictions 2.17 2.88 0.30
• Subjective self-reported health • Positively significant in the OP & BOP model.
• The difficulty in performing daily activities • Insignificant in the OP & BOP model.
• The chronic diseases • Insignificant in the OP & BOP model.
• The ρs of HG1 & HG2 are significant/ Instruments are statistically valid.
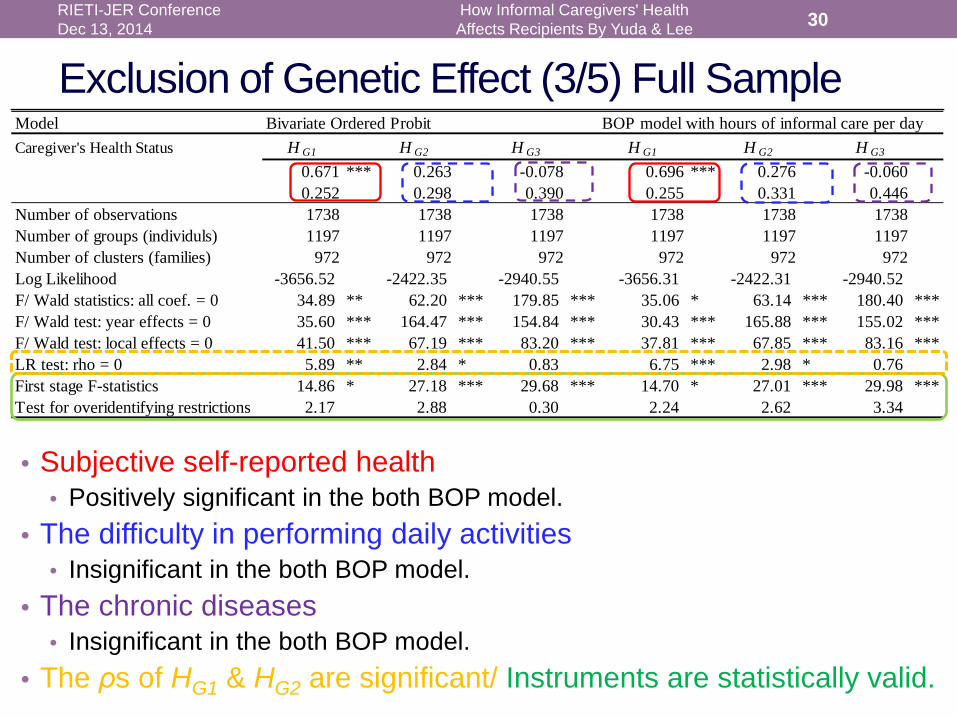
Exclusion of Genetic Effect (3/5) Full Sample 30 How Informal Caregivers' Health
Affects Recipients By Yuda & Lee RIETI-JER Conference Dec 13, 2014
Model Bivariate Ordered Probit BOP model with hours of informal care per dayCaregiver's Health Status H G1 H G2 H G3 H G1 H G2 H G3
0.671 *** 0.263 -0.078 0.696 *** 0.276 -0.0600.252 0.298 0.390 0.255 0.331 0.446
Number of observations 1738 1738 1738 1738 1738 1738Number of groups (individuls) 1197 1197 1197 1197 1197 1197Number of clusters (families) 972 972 972 972 972 972Log Likelihood -3656.52 -2422.35 -2940.55 -3656.31 -2422.31 -2940.52F/ Wald statistics: all coef. = 0 34.89 ** 62.20 *** 179.85 *** 35.06 * 63.14 *** 180.40 ***F/ Wald test: year effects = 0 35.60 *** 164.47 *** 154.84 *** 30.43 *** 165.88 *** 155.02 ***F/ Wald test: local effects = 0 41.50 *** 67.19 *** 83.20 *** 37.81 *** 67.85 *** 83.16 ***LR test: rho = 0 5.89 ** 2.84 * 0.83 6.75 *** 2.98 * 0.76First stage F-statistics 14.86 * 27.18 *** 29.68 *** 14.70 * 27.01 *** 29.98 ***Test for overidentifying restrictions 2.17 2.88 0.30 2.24 2.62 3.34
• Subjective self-reported health • Positively significant in the both BOP model.
• The difficulty in performing daily activities • Insignificant in the both BOP model.
• The chronic diseases • Insignificant in the both BOP model.
• The ρs of HG1 & HG2 are significant/ Instruments are statistically valid.

Exclusion of Genetic Effect (4/5) Subsample
• Subjective self-reported health • Positively significant in the OP & BOP model.
• The difficulty in performing daily activities • Insignificant in the OP model/ Positively significant in the BOP model.
• The chronic diseases • Insignificant in the OP model/ Negatively significant in the BOP model.
• All ρs are significant/ Most of instruments are statistically valid.
31 How Informal Caregivers' Health Affects Recipients By Yuda & Lee
RIETI-JER Conference Dec 13, 2014
Model Ordered Probit Bivariate Ordered ProbitCaregiver's Health Status H G1 H G2 H G3 H G1 H G2 H G3
0.082 * 0.119 0.098 0.904 *** 0.592 * -0.632 **0.046 0.109 0.073 0.124 0.321 0.301
Number of observations 1215 1215 1215 1215 1215 1215Number of groups (individuls) 840 840 840 840 840 840Number of clusters (families) 765 765 765 765 765 765Log Likelihood -1621.31 -1622.20 -1621.95 -2860.58 -2038.26 -2349.39F/ Wald statistics: all coef. = 0 314.03 *** 310.53 *** 311.04 *** 31.01 * 40.75 *** 174.37 ***F/ Wald test: year effects = 0 222.87 *** 222.75 *** 184.16 *** 9.74 ** 34.29 *** 131.69 ***F/ Wald test: local effects = 0 59.21 *** 59.82 *** 59.12 *** 24.00 * 42.04 *** 66.50 ***LR test: rho = 0 15.39 *** 7.93 *** 10.40 ***First stage F-statistics 7.62 19.48 ** 19.76 **Test for overidentifying restrictions 3.74 3.72 3.76

Exclusion of Genetic Effect (5/5) Subsample 32 How Informal Caregivers' Health
Affects Recipients By Yuda & Lee RIETI-JER Conference Dec 13, 2014
Model Bivariate Ordered Probit BOP model with hours of informal care per dayCaregiver's Health Status H G1 H G2 H G3 H G1 H G2 H G3
0.904 *** 0.592 * -0.632 ** 0.902 *** 0.598 * -0.636 **0.124 0.321 0.301 0.123 0.314 0.310
Number of observations 1215 1215 1215 1215 1215 1215Number of groups (individuls) 840 840 840 840 840 840Number of clusters (families) 765 765 765 765 765 765Log Likelihood -2860.58 -2038.26 -2349.39 -2860.21 -2037.99 -2349.38F/ Wald statistics: all coef. = 0 31.01 * 40.75 *** 174.37 *** 31.25 41.15 ** 174.60 ***F/ Wald test: year effects = 0 9.74 ** 34.29 *** 131.69 *** 10.09 ** 33.43 *** 131.72 ***F/ Wald test: local effects = 0 24.00 * 42.04 *** 66.50 *** 24.19 * 41.61 *** 66.52 ***LR test: rho = 0 15.39 *** 7.93 *** 10.40 *** 15.42 *** 8.20 *** 10.38 ***First stage F-statistics 7.62 19.48 ** 19.76 ** 7.94 19.26 ** 20.45 **Test for overidentifying restrictions 3.74 3.72 3.76 4.03 3.85 4.04
• Subjective self-reported health • Positively significant in the both BOP model.
• The difficulty in performing daily activities • Positively significant in the both BOP model.
• The chronic diseases • Negatively significant in the both BOP model.
• All ρs are significant/ Most of instruments are statistically valid.
Concluding Remarks • We use the JSTAR to examine how informal caregivers’
health affects the level of care provided. • We find that deteriorating health for a caregiver adversely
affects the health of the recipient, and that this effect persists even among individuals who are not genetically related.
• These results imply that creating circumstances that maintain middle-aged caregiver’s good psychosomatic health conditions may also help maintain the health of care recipients. • This suggests policymakers should introduce aggressive
health promotion and care prevention policies for middle-aged people.
33 How Informal Caregivers' Health Affects Recipients By Yuda & Lee
RIETI-JER Conference Dec 13, 2014
Limitations • The JSTAR does not include detailed information on the
parents’ care utilization nor on expenditures for it. • The JSTAR also does not have information on who is the
primary caregiver nor on how much care each provider gives. • Several previous studies have shown that different types of
long-term care services have different impacts on the health of those receiving care.
• Information on use of health care by elderly parents is unavailable in JSTAR. • Such information can help identify opportunities for
cooperation in health and long-term care systems.
• Results from the JSTAR may not be generalized because the sample is not nationally representative.
34 How Informal Caregivers' Health Affects Recipients By Yuda & Lee
RIETI-JER Conference Dec 13, 2014