right-of-way acquisition and bridge construction …
TRANSCRIPT

RIGHT-OF-WAY ACQUISITION AND BRIDGE CONSTRUCTION BONDS
CUSIP Numbers
Maturity Date
Series 2011A
Refunding
Dated 05/12/2011
Series 2011B
New & Refunding
Dated 02/02/2012
Series 2012A
Refunding
Dated 05/17/2012
Series 2012B
Refunding
Dated 5/17/2012
Series 2015A
Refunding
Dated 09/01/2015
7/01/21 341150C24 341150F96 341150M49 341150P95 341150S43
7/01/22 341150C32 341150G20 341150M56 341150Q29 341150S50
7/01/23 - 341150G38 341150M64 341150Q37 341150S68
7/01/24 - 341150G46 341150M72 341150Q45 341150S76
7/01/25 - 341150G53 341150M80 341150Q52 341150S84
7/01/26 - 341150G61 341150M98 341150Q60 341150S92
7/01/27 - 341150G79 341150N22 341150Q78 -
7/01/28 - 341150G87 341150N30 341150Q86 -
7/01/29 - 341150G95 341150N48 341150Q94 -
7/01/30 - 341150H29 341150N55 341150R28 -
7/01/31 - 341150H37 341150N63 341150R36 -
7/01/32 - 341150H45 - 341150R44 -
7/01/33 - 341150H52 341150N89 341150R51 -
7/01/34 - 341150H60 - 341150R69 -
7/01/35 - 341150H78 - - -
7/01/36 - 341150H86 - - -
7/01/37 - 341150H94 - - -
7/01/41 - 341150J50 - -

RIGHT-OF-WAY ACQUISITION AND BRIDGE CONSTRUCTION BONDS (CONT.)
CUSIP Numbers
Maturity Date
Series 2016A
Refunding
Dated 5/05/2016
Series 2016B
Dated 07/21/2016
Series 2017A
Dated 07/27/2017
Series 2018A
Dated 06/07/2018
Series 2018B
Dated 07/19/2018
7/01/21 341150T67 341150W30 341150Z86 3411503D0 3411504J6
7/01/22 341150T75 341150W48 341150Z94 3411503E8 3411504K3
7/01/23 341150T83 341150W55 3411502A7 3411503F5 3411504L1
7/01/24 341150T91 341150W63 3411502B5 3411503G3 3411504M9
7/01/25 341150U24 341150W71 3411502C3 3411503H1 3411504N7
7/01/26 341150U32 341150W89 3411502D1 3411503J7 3411504P2
7/01/27 341150U40 341150W97 3411502E9 3411503K4 3411504Q0
7/01/28 341150U57 341150X21 3411502F6 3411503L2 3411504R8
7/01/29 341150U65 341150X39 3411502G4 3411503M0 3411504S6
7/01/30 341150U73 341150X47 3411502H2 3411503N8 3411504T4
7/01/31 341150U81 341150X54 3411502J8 3411503P3 3411504U1
7/01/32 341150U99 341150X62 3411502K5 3411503Q1 3411504V9
7/01/33 341150V23 341150X70 3411502L3 3411503R9 3411504W7
7/01/34 341150V31 341150X88 3411502M1 3411503S7 3411504X5
7/01/35 341150V49 341150X96 3411502N9 3411503T5 3411504Y3
7/01/36 341150V56 341150Y20 3411502P4 3411503U2 3411504Z0
7/01/37 341150V64 341150Y38 3411502Q2 3411503V0 3411505A4
7/01/38 - 341150Y46 3411502R0 3411503W8 3411505B2
7/01/39 - - 3411502S8 3411503X6 3411505C0
7/01/40 - - 3411502T6 3411503Y4 3411505D8
7/01/41 - - 3411502U3 3411503Z1 -
7/01/42 - - 3411502V1 3411504A5 -
7/01/43 - - 3411502W9 3411504B3 3411505G1
7/01/44 - - 3411502X7 - -
7/01/45 - - 3411502Y5 - -
7/01/46 - 341150Z45 3411502Z2 - -
7/01/47 - - 3411503A6 3411504F4 -
7/01/48 - - - - 3411505M8

RIGHT-OF-WAY ACQUISITION AND BRIDGE CONSTRUCTION BONDS (CONT.)
CUSIP Numbers
Maturity Date
Series 2019A
Refunding
Dated 04/04/2019
Series 2019B
Dated 08/22/2019
Series 2020A
Dated 12/08/2020
7/01/21 3411505Q9 3411506L9 3411507R5
7/01/22 3411505R7 3411506M7 3411507S3
7/01/23 3411505S5 3411506N5 3411507T1
7/01/24 3411505T3 3411506P0 3411507U8
7/01/25 3411505U0 3411506Q8 3411507V6
7/01/26 3411505V8 3411506R6 3411507W4
7/01/27 3411505W6 3411506S4 3411507X2
7/01/28 3411505X4 3411506T2 3411507Y0
7/01/29 3411505Y2 3411506U9 3411507Z7
7/01/30 3411505Z9 3411506V7 3411508A1
7/01/31 3411506A3 3411506W5 3411508B9
7/01/32 3411506B1 3411506X3 3411508C7
7/01/33 3411506C9 3411506Y1 3411508D5
7/01/34 3411506D7 3411506Z8 3411508E3
7/01/35 3411506E5 3411507A2 3411508F0
7/01/36 3411506F2 3411507B0 3411508G8
7/01/37 3411506G0 3411507C8 3411508H6
7/01/38 3411506H8 3411507D6 3411508J2
7/01/39 3411506J4 3411507E4 3411508K9
7/01/40 - 3411507F1 3411508L7
7/01/41 - 3411507G9 3411508M5
7/01/42 - 3411507H7 3411508N3
7/01/43 - 3411507J3 3411508P8
7/01/44 - 3411507K0 3411508Q6
7/01/45 - 3411507L8 -
7/01/46 - 3411507M6 -
7/01/49 - 3411507Q7 -
7/01/50 - - 3411508W3

ANNUAL FINANCIAL INFORMATION
AND OPERATING DATA
SUBMITTED PURSUANT TO RULE 15c2-12
OF THE SECURITIES AND EXCHANGE COMMISSION
FOR THE
STATE OF FLORIDA FULL FAITH AND CREDIT
DEPARTMENT OF TRANSPORTATION
RIGHT-OF-WAY ACQUISITION AND BRIDGE CONSTRUCTION BONDS
Series 2011A (Refunding)
Series 2011B (New & Refunding)
Series 2012A (Refunding)
Series 2012B (Refunding)
Series 2015A (Refunding)
Series 2016A (Refunding)
Series 2016B
Series 2017A
Series 2018A
Series 2018B
Series 2019A (Refunding)
Series 2019B
Series 2020A
for Fiscal Year ending June 30, 2020

TABLE OF CONTENTS
Official Statement dated November 10, 2020
Page in Official Statement
I. Historical Motor Fuel and Diesel Fuel Tax Collections ....................................................................................... 9
II. Debt Service Coverage ....................................................................................................................................... 10
III. Investment of Funds ...................................................................................................................................... 17-18
IV. History of Legislative Appropriations (Operating and Fixed Capital Outlay Budget by Program Area) ....... A-22
Sources and Amounts of State Funds (Five Year History of Trust Fund and General Revenues) ............. ATTACHED
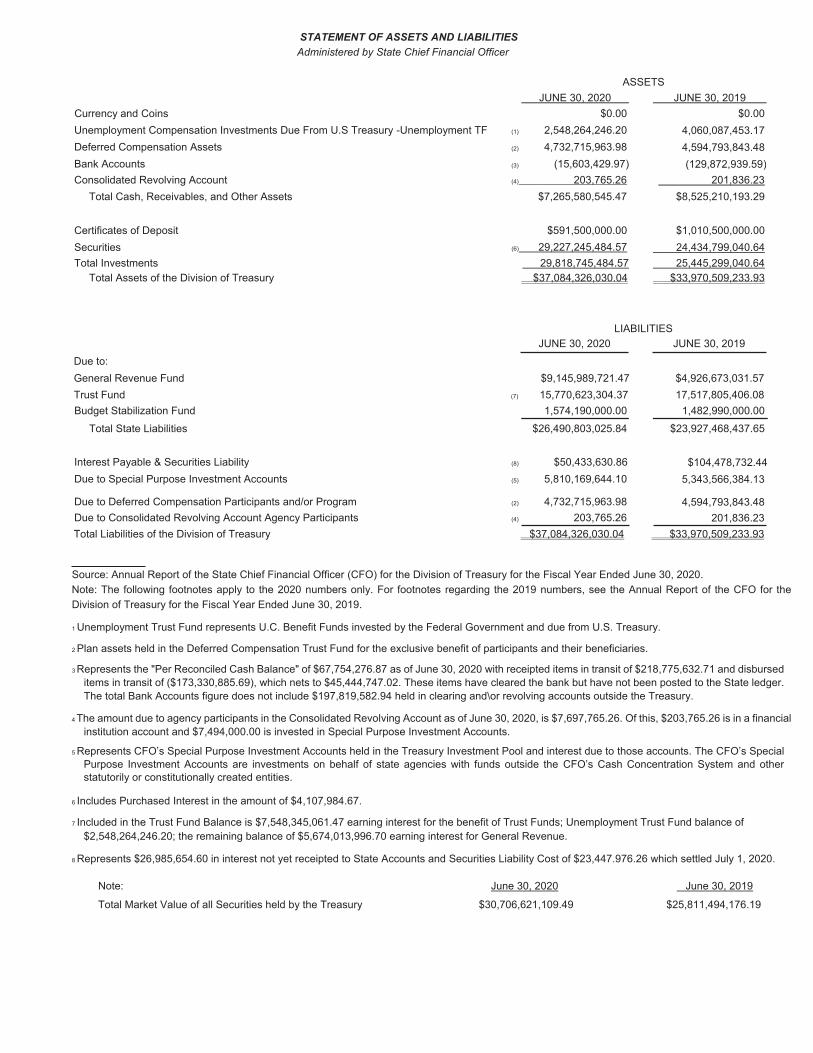
Statement of Assets and Liabilities ............................................................................................................ ATTACHED
Schedule of Outstanding Bonds (Debt Outstanding by Type and Program and
Total State Debt Outstanding) ......................................................................................................... ATTACHED
Florida Comprehensive Annual Financial Report (“CAFR”) for Fiscal Year Ended June 30, 2020*…….ATTACHED
* Includes Litigation information

9
The table below shows historical net deposits to the STTF of motor and diesel fuel sales tax collections after the deductions described above.
Historical Motor Fuel and Diesel Fuel Sales Tax Collections and Distributions1
Fiscal Year
Motor & Diesel Fuel Sales Tax Collections Deductions
Total Transferred to the STTF
Percentage Change
2010-11 $1,176,565,161 $68,992,198 $1,107,572,964 0.30% 2011-12 1,188,859,111 65,860,564 1,122,998,547 1.39 2012-13 1,234,094,070 64,898,233 1,169,195,836 4.11 2013-14 1,291,968,740 72,395,050 1,219,573,690 4.31 2014-15 1,358,355,656 73,011,343 1,285,344,312 5.39 2015-16 1,431,989,830 79,167,624 1,352,822,206 5.25 2016-17 1,470,382,607 71,705,353 1,398,677,254 3.39 2017-18 1,516,440,526 75,980,194 1,440,460,332 2.99 2018-19 1,586,048,211 68,198,170 1,517,850,041 5.37 2019-20 1,524,063,154 74,526,695 1,449,536,460 (4.50)
Source: State of Florida Department of Revenue 1 This table shows the motor fuel taxes collected pursuant to Section 206.41(1)(g), and the diesel fuel taxes collected pursuant to Section
206.87(1)(e), Florida Statutes, deposited into the Fuel Tax Collection Trust Fund and subsequently transferred to the STTF on an accrual basis. These figures represent actual distributions after all adjusting entries have been made at the end of each fiscal year.
Projected Collection and Distribution. Annual motor and diesel fuel consumption and tax collections are projected to
decrease during the current Fiscal Year, and then to increase over the next nine Fiscal Years. The current forecast, revised in August 2020, still projects long-term growth but has lower projections for motor and diesel fuel consumption and tax collections relative to the prior forecast from January 2020. This is a result of an expected decreased in consumption of motor and diesel fuel related to the effects of the COVID-19 outbreak, reflecting lower economic expectations going forward and lower projected increases of fuel tax rates, as well as technological advancements in fuel efficiency and the implementation of new fuel economy standards for vehicles.
The table below shows the latest projections of motor fuel and diesel fuel sales tax rates and the gallons of motor fuel
and diesel fuel expected to be sold in Florida for the current and next nine years. These forecasts are revised at least semiannually by the Florida Consensus Estimating Conference. The projections were based upon the economic information and assumptions developed and adopted by the Conference at that time. See “STATE FINANCIAL OPERATIONS – Budgetary Process” in Appendix A for a description of the Conference. The projections are based on the best information available when the estimates are made, which is believed to be accurate. Projections are statements of opinion and are subject to future events which may cause the actual results to differ materially from those set forth herein. Undue reliance should not be placed on these projections. No representation is made that the amounts of motor fuel and diesel fuel shown will be consumed or that the sales taxes on such fuels will be collected in any projected Fiscal Year.
Projected Motor Fuel and Diesel Fuel Sales Tax Rates and Consumption
Fiscal Fuel Sales Tax Rate1,2 Consumption
(gallons in millions) Year (cents per gallon) Motor Fuel Diesel Fuel Total % Change
2020-21 14.3 & 14.5 8,418.5 1,809.6 10,228.1 (4.26%) 2021-22 14.5 & 14.7 9,077.1 1,867.7 10,944.8 7.01 2022-23 14.7 & 15.0 9,357.3 1,888.0 11,245.3 2.75 2023-24 15.0 & 15.2 9,477.9 1,908.1 11,386.0 1.25 2024-25 15.2 & 15.5 9,545.6 1,928.3 11,473.8 0.77 2025-26 15.5 & 15.8 9,595.5 1,948.6 11,544.1 0.61 2026-27 15.8 & 16.2 9,633.1 1,968.2 11,601.3 0.50 2027-28 16.2 & 16.5 9,658.3 1,987.9 11,646.2 0.39 2028-29 16.5 & 16.9 9,672.6 2,007.8 11,680.3 0.29 2029-30 16.9 & 17.3 9,683.8 2,027.9 11,711.7 0.27
Source: Florida Consensus Estimating Conference on Transportation Revenues, August 7, 2020 1 This rate includes only the motor fuel and diesel fuel sales tax levied pursuant to Sections 206.41(1)(g) and 206.87(1)(e), Florida Statutes. 2 Two rates are shown for each Fiscal Year because the annual rate adjustment that is made to reflect the change in the Consumer Price
Index is made on January 1 of each year.

10
The table below shows the forecast of motor and diesel fuel sales taxes and other State revenues which fund the STTF as well as their respective percentage of total STTF State revenues. Total STTF State revenues are used in calculating the maximum transfer for debt service in accordance with Section 206.46(2), Florida Statutes. See “SECURITY FOR THE 2020A BONDS – Pledged Gas Taxes” for an explanation of the motor and diesel fuel sales taxes that secure the 2020A Bonds.
Projected Motor Fuel and Diesel Fuel Sales Tax and Other STTF State Revenues
(in millions)
Fiscal Year
Motor & Diesel Fuel Sales Tax1
% of STTF State Revenues
Other State Revenues2
% of STTF State Revenues
Total STTF State Revenues
2020-21 $1,398.4 35.02% $2,594.8 64.98% $3,993.2 2021-22 1,519.8 35.25 2,791.8 64.75 4,311.6 2022-23 1,587.9 35.48 2,887.8 64.52 4,475.7 2023-24 1,637.8 35.64 2,957.9 64.36 4,595.7 2024-25 1,676.7 35.75 3,012.9 64.25 4,689.6 2025-26 1,720.9 35.91 3,070.8 64.09 4,791.7 2026-27 1,767.2 36.13 3,124.4 63.87 4,891.6 2027-28 1,815.7 36.41 3,170.8 63.59 4,986.5 2028-29 1,859.0 36.64 3,214.4 63.36 5,073.4 2029-30 1,909.8 36.93 3,261.9 63.07 5,171.7
Sources: Florida Consensus Estimating Conference on Transportation Revenues, August 7, 2020, and Florida Consensus Estimating Conference on Documentary Stamp Tax Revenues, August 14, 2020. 1 These are the motor and diesel fuel tax collections which are transferred to the STTF. These collections are net of administrative costs,
refunds and other distributions as discussed above. 2 Includes all State revenues deposited into the STTF, except motor fuel and diesel fuel sales taxes levied pursuant to Sections 206.41(1)(g)
and 206.87(1)(e), Florida Statutes, including tax and fee revenues related to transportation and motor vehicle licenses, as well as documentary stamp tax revenues distributed to the STTF pursuant to Section 201.15(4)(a), Florida Statutes, net of the State Economic Enhancement Development Trust Fund transfers pursuant to Section 201.15, Florida Statutes. Such moneys are not pledged to pay debt service on the 2020A Bonds.
Historical and Projected Debt Service Coverage
Historical Debt Service Coverage. The following table shows the historical debt service coverage for all Outstanding
Right-of-Way Acquisition and Bridge Construction Bonds for each of the past five Fiscal Years.
Historical Debt Service Coverage
Fiscal Year Motor Fuel & Diesel Fuel
Sales Taxes1 Debt Service2 Debt Service
Coverage 2015-16 $1,352,822,206 $138,306,368 9.78x 2016-17 1,398,677,254 141,709,918 9.87x 2017-18 1,440,460,332 156,229,179 9.22x 2018-19 1,517,850,041 176,416,516 8.60x 2019-20 1,449,536,460 182,424,657 7.95x
1 These amounts indicate the distribution made to the STTF, as provided by the State of Florida Department of Revenue. 2 Includes accrued debt service on previously refunded Bonds of $6.2 million in Fiscal Year 2015-16 and $3.3 million in Fiscal Year
2018-19. Projected Debt Service Coverage. The estimated debt service coverage presented below is calculated using projected
motor fuel and diesel fuel sales tax revenues, which are revised at least semiannually by the Florida Consensus Estimating Conference most recently in August 2020. See “STATE FINANCIAL OPERATIONS – Budgetary Process” in Appendix A for a description of the Florida Consensus Estimating Conference. The projections are based on the best information available when the estimates are made, which is believed to be accurate. Projections are statements of opinion and are subject to future events which may cause the actual results to differ materially from those set forth herein. Undue reliance should not be placed on these projections.
The following table shows the projected debt service coverage for the current and next nine Fiscal Years for the
Outstanding Bonds and the 2020A Bonds, as well as the projected coverage on the currently allowed maximum amount of debt service.

17
State Taxes The 2020A Bonds and the income thereon are not subject to taxation under the laws of the State of Florida, except
estate taxes and taxes under Chapter 220, Florida Statutes, on interest, income, or profits on debt obligations owned by corporations, as defined therein.
Florida laws governing the imposition of estate taxes do not provide for an exclusion of state or local bonds from the
calculation of the value of the gross estate for tax purposes. Florida’s estate tax is generally calculated on the basis of the otherwise unused portion of the federal credit allowed for state estate taxes. Under Chapter 198, Florida Statutes, all values for state estate tax purposes are as finally determined for federal estate tax purposes. Since state and local bonds are included in the valuation of the gross estate for federal tax purposes, such obligations would be included in such calculation for Florida estate tax purposes. Prospective owners of the 2020A Bonds should consult their own attorneys and advisors for the treatment of the ownership of the 2020A Bonds for estate tax purposes.
The 2020A Bonds and the income thereon are subject to the tax imposed by Chapter 220, Florida Statutes, on interest,
income, or profits on debt obligations owned by corporations and other specified entities.
MISCELLANEOUS
Variable Rate Debt and Derivatives The Division does not generally issue variable rate debt or enter into derivative contracts in connection with its bond
issues. The Division does not have any outstanding variable rate debt and has not entered into any derivative transactions on behalf of the state or any of its agencies.
Investment of Funds
All State funds are invested by either the Chief Financial Officer or the Board of Administration. At closing, the
2020A Bond proceeds (net of issuance costs) will be deposited as described under the heading “PURPOSE OF THE ISSUE – Application of 2020A Bond Proceeds” above.
Funds Held Pursuant to the Resolution – After collection by the Department of Revenue, the Pledged Gas Taxes are
deposited into the Fuel Tax Collection Trust Fund and are then transferred to the STTF and then to the Trust Fund, all of which are in the State Treasury. Amounts required for debt service are transferred monthly to the Debt Service Fund held by the Board of Administration. Investment of Debt Service Fund moneys is controlled by Section 4.08 of the Resolution, which provides for temporary investment in the securities authorized by law; however, see “Investment by the Board of Administration” below for the Board of Administration’s investment policy with respect to sinking fund investments, which are applicable to the Debt Service Fund.
Investment by the Chief Financial Officer - Funds held in the State Treasury are invested by internal and external
investment managers. As of June 30, 2020, the ratio was approximately 53% internally managed funds, 39% externally managed funds, 2% Certificates of Deposit and 6% in an externally managed Security Lending program. The total portfolio market value on June 30, 2020, was approximately $32.505 billion.
Under State law, the Treasury is charged with investing funds of each State agency and the judicial branch. As of June
30, 2020, approximately $24.009 billion of the investments in the Treasury consisted of accounts held by State agencies that are required by law to maintain their investments in the Treasury; additionally, approximately $5.811 billion as of this date consisted of moneys held by certain boards, associations, or entities created by the State Constitution or by State law that are not required to maintain their investments with the Treasury and are permitted to withdraw these funds from the Treasury.
As provided by State law, the Treasury must be able to timely meet all disbursement needs of the State. Accordingly,
the Treasury allocates its investments to provide for estimated disbursements plus a cushion for liquidity in instances of greater-than-expected disbursement demand.
To this end, a portion of Treasury’s investments are managed for short-term liquidity and preservation of principal.
The remainder is managed to obtain maximum yield, given the safety parameters of State law and Treasury’s Comprehensive Investment Policy. Investments managed for short-term liquidity and preservation of principal are managed “internally” by Treasury personnel. The majority of investments managed for a maximum return are managed by “external” investment companies hired by the State.

18
The Externally Managed Investment Program provides long-term value while limiting risk appropriately and provides a backup source of liquidity. External investment strategy focuses on medium-term and long-term fixed income securities, rather than money market instruments, in order to take advantage of higher returns historically achieved by such securities. Portfolio managers are hired to actively manage funds. These funds may be invested in U.S. Treasury government agency obligations, investment grade corporate debt, municipal debt, mortgage backed securities, asset backed securities, and U.S. dollar denominated investment-grade foreign bonds that are registered with the Securities and Exchange Commission. The managers may also use leveraging techniques such as forward purchase commitments, and interest rate futures.
Investment by the Board of Administration – The Board of Administration manages investment of assets on behalf of
the members of the Florida Retirement System (the “FRS”) Defined Benefit Plan. It also acts as sinking fund trustee for most State bond issues and oversees the management of FRS Investment Plan investment options, Florida Hurricane Catastrophe Fund moneys, a short-term investment pool for local governments, and smaller trust accounts on behalf of third party beneficiaries.
The Board of Administration adopts specific investment policy guidelines for the management of its funds which
reflect the long-term risk, yield, and diversification requirements necessary to meet its fiduciary obligations. As of June 30, 2020 the Board of Administration directed the investment/administration of 28 funds.
As of June 30, 2020 the total market value of the FRS (Defined Benefit) Trust Fund was approximately $160.714
billion. The Board of Administration pursues an investment strategy which allocates assets to different investment types. The long-term objective is to meet liability needs as determined by actuarial assumptions. Asset allocation levels are determined by the liquidity and cash flow requirements of the FRS, absolute and relative valuations of the asset class investments, and opportunities within those asset classes. Funds are invested internally and externally under a Defined Benefit Plan Investment Policy Statement.
The Board of Administration uses a variety of derivative products as part of its overall investment strategy. These
products are used to manage risk or to execute strategies more efficiently or more cost effectively than could be done in the cash markets. They are not used to speculate in the expectation of earning extremely high returns. Any of the products used must be within investment policy guidelines designed to control the overall risk of the portfolio.
The Board of Administration invests assets in 27 designated funds other than the FRS (Defined Benefit) Trust Fund.
As of June 30, 2020, the total market value of these funds equaled approximately $43.033 billion. Each fund is independently managed by the Board of Administration in accordance with the applicable documents, legal requirements and investment plans. Liquidity and preservation of capital are preeminent investment objectives for most of these funds, so investments for these are restricted to high quality money market instruments (e.g., cash, short-term treasury securities, certificates of deposit, banker’s acceptances, and commercial paper). The term of these investments is generally short, but may vary depending upon the requirements of each trust and its investment plan.
Bond Ratings
Fitch Ratings, Moody’s Investors Service, and S&P Global Ratings (herein referred to collectively as “Rating
Agencies”), have assigned their municipal bond ratings of AAA (stable outlook), Aaa (stable outlook), and AAA (stable outlook), respectively, to the 2020A Bonds. Such ratings reflect only the respective views of such Rating Agencies at the time such ratings were issued, and an explanation of the significance of such ratings may be obtained from any of the respective rating agencies.
The State furnished to such Rating Agencies certain information and material in respect to the State and the 2020A
Bonds. Generally, Rating Agencies base their ratings on such information and materials and on investigations, studies and assumptions made by the Rating Agencies. There is no assurance that such ratings will be maintained for any given period of time or that they may not be lowered, suspended or withdrawn entirely by the Rating Agencies, or any of them, if in their or its judgment, circumstances warrant. Any such downward change in, suspension of or withdrawal of such ratings may have an adverse effect on the market price of the 2020A Bonds.
Information Technology Security
Similar to other large organizations, the State relies on electronic systems and information technologies (“IT”) to
conduct operations. Protecting the State’s IT infrastructure and data is essential to delivering government services. The State maintains a security posture designed to protect its data and deter attacks on its IT infrastructure and respond
to such attacks to minimize their impact on operations. In addition, the State has historically maintained reserve funds and a liquidity position that provide the ability to respond to potential attacks. In 2019, the State Legislature reorganized and

A-22
Operating and Fixed Capital Outlay Budget By Program Area1
Fiscal Years 2016-17 through 2020-21
(in million of dollars)
2016-17 2017-18 2018-19 2019-20 2020-21
General Revenue Operating FCO Operating FCO Operating FCO Operating FCO Operating FCO
Administered Funds $32.3 - $47.8 - $86.3 - $292.0 - $234.5 -
Education 15,577.1 $29.0 16,628.3 $143.8 16,955.7 $245.9 17,422.1 $96.4 17,855.8 $45.0
Environmental 193.4 172.2 197.1 166.2 351.1 99.1 217.4 335.1 209.9 282.5
General Government 515.2 36.0 504.7 26.4 566.3 41.3 531.7 39.2 520.8 64.5
Human Services 9,488.3 8.4 9,361.2 12.2 9,833.5 6.8 10,223.7 11.2 10,602.4 3.9
Public Safety 4,008.5 99.0 4,152.8 74.9 4,290.7 68.5 4,510.0 74.2 4,710.6 68.9
Transportation and
Economic Development 124.8 39.7 162.9 18.1 227.6 13.7 202.7 43.5 136.1 15.2
Total General Revenue $29,939.4 $384.3 $31,054.8 $441.5 $32,311.3 $475.2 $33,399.6 $599.7 $34,270.1 $480.1
Trust Funds
Administered Funds $39.1 - $41.9 - $41.9 - $40.2 - $43.0 -
Education 6,291.4 $2,007.2 6,564.1 $1,699.7 6,949.0 $1,654.4 7,011.3 $1,538.0 7,332.4 $1,542.1
Environmental 2,463.2 1,096.1 2,370.1 931.3 2,400.6 1,197.5 2,391.7 1,098.5 2,402.5 1,548.3
General Government 1,637.3 45.4 1,674.9 42.3 1,718.6 50.2 1,721.7 44.2 1,772.1 43.8
Human Services 25,095.9 20.2 26,686.5 57.1 27,553.7 10.3 27,881.9 14.1 28,688.5 21.8
Public Safety 899.4 - 900.8 - 947.3 5.3 871.1 0.6 847.6 3.4 Transportation and
Economic Development 2,646.7 10,001.2 2,720.6 10,071.3 4,161.2 10,061.0 4,898.5 10,004.1 3,746.4 9,525.4
Total All Trust Funds $39,072.9 $13,170.1 $40,958.9 $12,801.6 $43,772.3 $12,978.8 $44,816.4 $12,699.5 $44,832.6 $12,684.6
Total All Funds
Administered Funds $71.3 - $89.6 - $128.2 - $332.2 - $277.5 -
Education 21,868.5 $2,036.3 23,192.3 $1,843.4 23,904.7 $1,900.3 24,433.5 $1,634.5 25,188.2 $1,587.1
Environmental 2,656.6 1,268.4 2,567.2 1,097.4 2,751.7 1,296.7 2,609.1 1,433.5 2,612.5 1,830.8
General Government 2,152.4 81.4 2,179.7 68.7 2,285.0 91.5 2,253.4 83.4 2,292.9 108.3
Human Services 34,584.2 28.6 36,047.8 69.4 37,387.2 17.0 38,105.6 25.3 39,290.8 25.7
Public Safety 4,907.8 99.0 5,053.6 74.9 5,238.0 73.8 5,381.0 74.8 5,558.2 72.2
Transportation and
Economic Development 2,771.5 10,040.9 2,883.5 10,089.4 4,388.8 10,074.7 5,101.2 10,047.6 3,882.5 9,540.7
Total All Funds $69,012.3 $13,554.5 $72,013.7 $13,243.1 $76,083.6 $13,454.0 $78,215.9 $13,299.2 $79,102.7 $13,164.9
1 Source: Executive Office of the Governor. Fiscal Years 2016-17 through 2020-21 appropriations in annual General Appropriations Bills and other legislation after Governor’s vetoes.

General Revenue Receipts1 2015-16 2016-17 2017-18 2018-19 2019-20
Total GR Collections and Transfers 28,312.0 29,557.7 31,110.7 33,353.9 37,676.4
Net GR Collections and Transfers 28,325.4 29,694.5 31,218.2 33,440.5 37,248.6
Trust Fund Revenues1

2015-16 2016-17 2017-18 2018-19 2019-20
Total Trust Fund Revenue for State Use 21,142.3 21,432.4 22,633.7 23,616.9 23,835.3
Revenues Shared With Local Governmentsand School Districts___________________
Total Local Government 4,689.7 5,058.4 4,956.7 5,206.1 4,995.0
Federal and Local Assistance
Total Federal and Local Assistance 25,160.8 25,645.6 27,090.2 28,164.8 36,123.4
Summary of Trust Fund and General Revenue
Total Direct Revenues $79,318.2 $81,830.90 $85,898.8 $90,428.3 $102,202.3

Direct Debt Outstanding by Type and Program As of June 30, 2020(In Millions Dollars)
Debt Type Amount
Total State Debt Outstanding $19,204.4
Net Tax-Supported Debt
Total Net Tax-Supported Debt Outstanding $15,620.6
Self-Supporting Debt
Total Self-Supported Debt Outstanding $3,583.8
Per Capita Tax Supported Debt

State of FloridaTotal Debt Outstanding
As of June 30, 2020
Fiscal Net Tax-Supported Debt Outstanding Self-Supporting Debt Outstanding Total Debt OutstandingYear Principal* Interest Total Principal Interest Total Principal Interest Total
*Department of Transportation's long-term Public/Private Partnership (''P3") obligations are included in net tax-supported debt at the total annual payment obligation. Although certain payments are expected to be made from non- taxsources, they have not been considered in showing net tax-supported payments. Short-term P3 obligations are excluded.
Source: State of Florida Division of Bond Finance, 2020 debt analysis.


ACKNOWLEDGEMENTS
The Florida Comprehensive Annual Financial Report (CAFR) for the fiscal year ended June 30, 2020,was prepared by:
DIVISION OF ACCOUNTING AND AUDITING
J. Paul Whitfield, Jr., DirectorMark A. Merry, CPA, Assistant Director
BUREAU OF FINANCIAL REPORTING
Ryan D. Nolan, CPA, Bureau Chief
STATEWIDE FINANCIAL REPORTING SECTION
Tammy A. Eastman, CPAChunping Y. Lin, CPAPamela J. BarksdaleJanine A. KnightTiffany M. MillsappSherif A. NessimLyna Ty
SPECIAL APPRECIATION
Special appreciation is given to all fiscal and accounting personnel throughout the State of Floridawho contributed financial information for their agencies and component units.
The report cover was designed by the Publications Unit, Division of Administration, Departmentof Financial Services.
STATE OF FLORIDA
COMPREHENSIVEANNUAL
FINANCIAL REPORT
Fiscal Year Ended June 30, 2020
Ron DeSantisGOVERNOR
Jimmy PatronisCHIEF FINANCIAL OFFICER
FLORIDA DEPARTMENT OF FINANCIAL SERVICES
This document and related information is available via the Florida Department of Financial Services’ homepage at: www.myfloridacfo.com

COMPREHENSIVE ANNUAL FINANCIAL REPORTFISCAL YEAR ENDED JUNE 30, 2020
TABLE OF CONTENTSPAGE
INTRODUCTORY SECTIONLetter of Transmittal................................................................................................................................................. 6Organizational Chart and Principal Officials............................................................................................................ 9
FINANCIAL SECTIONINDEPENDENT AUDITOR’S REPORT............................................................................................................ 13
MANAGEMENT’S DISCUSSION AND ANALYSIS........................................................................................ 19
BASIC FINANCIAL STATEMENTS
Government-wide Financial StatementsStatement of Net Position............................................................................................................................... 28Statement of Activities.................................................................................................................................... 29
Governmental Fund Financial StatementsFund Descriptions........................................................................................................................................... 31Balance Sheet.................................................................................................................................................. 32Reconciliation of the Balance Sheet of Governmental Funds to the Statement of Net Position.................... 34Statement of Revenues, Expenditures, and Changes in Fund Balances......................................................... 36Reconciliation of the Statement of Revenues, Expenditures, and Changes in Fund Balances of Governmental Funds to the Statement of Activities.................................................... 38
Proprietary Fund Financial StatementsFund Descriptions........................................................................................................................................... 40Statement of Net Position .............................................................................................................................. 42Statement of Revenues, Expenses, and Changes in Fund Net Position.......................................................... 44Statement of Cash Flows................................................................................................................................ 46
Fiduciary Fund Financial StatementsFund Descriptions........................................................................................................................................... 50Statement of Fiduciary Net Position............................................................................................................... 51Statement of Changes in Fiduciary Net Position............................................................................................ 52
Component Unit Financial StatementsComponent Unit Descriptions........................................................................................................................ 54Statement of Net Position............................................................................................................................... 56Statement of Activities.................................................................................................................................... 58
Notes to the Financial StatementsTable of Contents............................................................................................................................................ 60Note 1 - Summary of Significant Accounting Policies................................................................................... 61Note 2 - Deposits and Investments................................................................................................................. 73Note 3 - Receivables and Payables................................................................................................................. 115Note 4 - Taxes and Tax Abatements............................................................................................................... 119Note 5 - Capital Assets................................................................................................................................... 127Note 6 - Pensions and Other Postemployment Benefits................................................................................. 130Note 7 - Commitments and Operating Leases................................................................................................ 145Note 8 - Bonds Payable and Certificates of Participation............................................................................... 147Note 9 - Installment Purchases, Capital Leases, and Public-Private Partnerships.......................................... 158Note 10 - Changes in Long-term Liabilities................................................................................................... 161
2020 STATE OF FLORIDA CAFR
2

Note 11 - Interfund Balances and Transfers................................................................................................... 165Note 12 - Risk Management........................................................................................................................... 170Note 13 - Florida Prepaid College Program................................................................................................... 172Note 14 - Insurance Enterprises...................................................................................................................... 173Note 15 - Contingencies................................................................................................................................. 177Note 16 - Litigation......................................................................................................................................... 179Note 17 - Deficit Fund Balance and Net Position.......................................................................................... 181Note 18 - Subsequent Events.......................................................................................................................... 182
OTHER REQUIRED SUPPLEMENTARY INFORMATIONBudgetary Comparison Schedules - General and Major Special Revenue Funds............................................... 184Budget to GAAP Reconciliation – General and Major Special Revenue Funds................................................. 189Budgetary Reporting............................................................................................................................................ 190Schedule of Proportionate Share and Schedule of State Contributions – Florida Retirement System - Pension................................................................................................................ 192Schedule of Proportionate Share and Schedule of State Contributions – Retiree Health Insurance Subsidy Program - Pension...................................................................................... 194Schedule of Changes in Net Pension Liability and Schedule of State Contributions – Florida National Guard Supplemental Retirement Benefit Plan....................................................................... 197Schedule of Changes in Other Postemployment Benefits Liability..................................................................... 198Information About Infrastructure Assets Reported Using the Modified Approach............................................. 199
COMBINING AND INDIVIDUAL FUND STATEMENTS AND SCHEDULES - NONMAJOR FUNDS
Governmental FundsFund Descriptions........................................................................................................................................... 204Combining Balance Sheet............................................................................................................................... 206Combining Statement of Revenues, Expenditures, and Changes in Fund Balances...................................... 207
Special Revenue FundsFund Descriptions........................................................................................................................................... 208Combining Balance Sheet .............................................................................................................................. 210Combining Statement of Revenues, Expenditures, and Changes in Fund Balances...................................... 216Budgetary Comparison Schedules.................................................................................................................. 221
Capital Projects FundsFund Descriptions........................................................................................................................................... 237Combining Balance Sheet............................................................................................................................... 238Combining Statement of Revenues, Expenditures, and Changes in Fund Balances...................................... 239
Debt Service FundsFund Descriptions........................................................................................................................................... 241Combining Balance Sheet............................................................................................................................... 242Combining Statement of Revenues, Expenditures, and Changes in Fund Balances...................................... 243
Proprietary Funds
Enterprise FundsFund Descriptions........................................................................................................................................... 245Combining Statement of Net Position............................................................................................................ 246Combining Statement of Revenues, Expenses, and Changes in Fund Net Position....................................... 247Combining Statement of Cash Flows............................................................................................................. 248
Internal Service FundsFund Descriptions........................................................................................................................................... 251Combining Statement of Net Position............................................................................................................ 252Combining Statement of Revenues, Expenses, and Changes in Fund Net Position....................................... 253Combining Statement of Cash Flows............................................................................................................. 254
2020 STATE OF FLORIDA CAFR
3

Fiduciary Funds
Private-purpose Trust FundsFund Descriptions........................................................................................................................................... 259Combining Statement of Fiduciary Net Position............................................................................................ 260Combining Statement of Changes in Fiduciary Net Position......................................................................... 262
Pension and Other Employee Benefits Trust FundsFund Descriptions........................................................................................................................................... 265Combining Statement of Fiduciary Net Position............................................................................................ 266Combining Statement of Changes in Fiduciary Net Position......................................................................... 268
Investment Trust FundsFund Descriptions........................................................................................................................................... 271Combining Statement of Fiduciary Net Position............................................................................................ 272Combining Statement of Changes in Fiduciary Net Position......................................................................... 273
Agency FundsFund Descriptions........................................................................................................................................... 275Combining Statement of Fiduciary Net Position............................................................................................ 277Combining Statement of Changes in Assets and Liabilities........................................................................... 278
Component UnitsComponent Unit Descriptions........................................................................................................................ 281Combining Statement of Net Position............................................................................................................ 283Combining Statement of Activities................................................................................................................. 284
STATISTICAL SECTIONTable of Contents...................................................................................................................................................... 289Schedule A-1 Net Position by Component............................................................................................................ 290Schedule A-2 Changes in Net Position.................................................................................................................. 292Schedule A-3 Fund Balances - Governmental Funds............................................................................................ 296Schedule A-4 Changes in Fund Balances - Governmental Funds......................................................................... 298Schedule B-1 Revenue Base/Rate......................................................................................................................... 300Schedule B-2 Principal Sales Tax Payers by Industry........................................................................................... 302Schedule C-1 Ratios of Outstanding Debt by Type............................................................................................... 304Schedule C-2 Ratios of Net General Bonded Debt Outstanding........................................................................... 306Schedule C-3 Legal Debt Margin.......................................................................................................................... 307Schedule C-4 Pledged-Revenue Coverage............................................................................................................ 308Schedule D-1 Demographic and Economic Statistics........................................................................................... 314Schedule D-2 Industry Sector Employment.......................................................................................................... 316Schedule E-1 Full-Time Equivalent State Employees by Function...................................................................... 318Schedule E-2 Operating Indicators by Function.................................................................................................... 320Schedule E-3 Capital Assets by Function.............................................................................................................. 322
2020 STATE OF FLORIDA CAFR
4

INTRODUCTORYSECTION

February 26, 2021
Citizens of the State of FloridaThe Honorable Ron DeSantis, GovernorThe Honorable Wilton Simpson, President of the SenateThe Honorable Chris Sprowls, Speaker of the House of Representatives
To the Citizens of Florida, Governor DeSantis, President Simpson, and Speaker Sprowls:
I am pleased to submit the State of Florida’s Comprehensive Annual Financial Report (CAFR) for the fiscal year ended June 30, 2020, in accordance with Section 216.102(3), Florida Statutes (F.S.). This report is prepared in accordance with generally accepted accounting principles as prescribed by the Governmental Accounting Standards Board.
Management assumes full responsibility for the completeness and reliability of the information contained in this report based upon a comprehensive framework of internal control. The objective of internal control is to provide reasonable, rather than absolute, assurance that the financial statements are free of material misstatements. The concept of reasonable assurance ensures that the costs do not exceed the benefits derived.
The Auditor General has issued an opinion on the state’s financial statements for the fiscal year ended June 30, 2020. The independent auditor’s report is located at the front of the financial section of this report.
Management’s Discussion and Analysis (MD&A) immediately follows the independent auditor’s report and provides a narrative introduction, overview, and analysis of the basic financial statements. The MD&A complements this letter of transmittal and should be read in conjunction with it.
PROFILE OF THE STATE
Florida’s Constitution divides the governmental structure of the state into three independent branches. The Legislative Branch has exclusive lawmaking power for the state. The Executive Branch, consisting of the Governor, Cabinet, and their agencies, administers the laws made by the Legislature. The Governor shares executive power and responsibility with the Cabinet, which is composed of the Attorney General, Chief Financial Officer, and Commissioner of Agriculture. The Judicial Branch interprets the law and applies the Constitution. The organizational chart following this letter provides an overview of the state’s structure. Florida’s government provides a range of services to its citizens including education, health and family services, transportation, public safety, law and corrections, natural resources and environmental protection.
The financial reporting entity of the state includes the primary government as well as component units for which the state is either financially accountable or a relationship exists with the state such that exclusion would cause the financial statements to be misleading. Refer to Note 1 to the financial statements for a listing of Florida’s component units and the Financial Section of the report to obtain an overview of their financial positions.
Florida’s budget is prepared using the processes set forth in Chapter 216, F.S. The major phases of the budget process are detailed in the Other Required Supplementary Information Section of this report. Florida law strictly prohibits overspending and requires budgetary control to be maintained at the individual appropriation account level.
DEPARTMENT OF FINANCIAL SERVICESTHE CAPITOL, TALLAHASSEE, FLORIDA 32399-0301 • (850) 413-2850 • FAX (850) 413-2950

February 26, 2021Page Two
ECONOMIC CONDITION
After recording nine consecutive years of positive growth in General Fund collections, Florida moved significantly into negative territory as the state’s fiscal year ended on June 30, 2020. By coincidence, the National Bureau of Economic Research (NBER) announced in the same month that the peak in the current business cycle occurred in February 2020, marking the end of the longest economic expansion on record and placing the United States into a declared recession. While all Florida industries have been impacted in the near term by the pandemic-induced economic contraction, Florida’s leisure and hospitality industry has borne the brunt of the longer-term consequences. The key drivers underlying the Florida-specific forecasts are discussed in greater detail below and show the sharp delineation between pre-pandemic and post-onset conditions.
Fluctuations in the state’s Real Gross Domestic Product (GDP) data provide the best evidence of Florida’s economic turmoil. Prior to the onset of the pandemic, the state’s GDP for the 2019 calendar year showed positive growth that had slowed slightly from the prior year, but remained above the national average for the seventh consecutive year. With the beginning of the new year, circumstances changed. Even though the state’s first two cases were not officially confirmed by the Department of Health until March 2nd, Florida’s GDP declined by 4.3 percent at a seasonally adjusted annual rate in the first quarter of the 2020 calendar year (January, February and March 2020) as the virus spread throughout the rest of the United States. During the second quarter (April, May and June 2020), state and local governments undertook stringent protective measures, causing the state’s GDP to plunge 30.1 percent, nearly matching the rate for the nation as a whole. Newly released GDP data for the third quarter of 2020 (July, August and September), when the reopening began in earnest, came in at +33.4 percent, exactly matching the rate for the United States. Even so, given the overall soaring numbers among states during this quarter, Florida’s real growth at a seasonally adjusted annual rate only ranked 27th in the country. The latest Economic Estimating Conference projections are for -0.5 percent growth for the just completed 2019-20 fiscal year and +0.5 percent for the current fiscal year. The latest forecast then shows a 2.0 percent increase for the 2021-22 fiscal year and a subsequent return to the positive 2.2 to 2.8 percent range more typically found in Florida.
State employment conditions reveal a similar story. The job market in Florida experienced an unprecedented contraction in the second quarter of 2020 when many businesses either shut down or sent workers home to slow the spread of the coronavirus. Prior to that quarter, Florida’s unemployment rate had dropped to 2.8 percent in January and February 2020, which, together with November 2019, became the months with the lowest recorded unemployment rates since the series began in 1976. With the onset of the pandemic, the unemployment rate spiked to 13.8 percent in April 2020, handily surpassing the prior peak rate of 11.3 percent experienced in January 2010 during the Great Recession. The change was breathtaking. Over the space of two months, the unemployment rate shifted from a near 50-year low to a near 50-year high. The Economic Estimating Conference believes that the unemployment rate peaked in the last quarter of the state’s 2019-20 fiscal year at 13.8 percent and expects it to drop gradually to 5.8 percent by the last quarter of this fiscal year. Thereafter, the rate continues its slow downward drift until it plateaus at 3.7 percent from fiscal year 2025-26 through fiscal year 2027-28, moving in unison with the national rate and near the full-employment level of about 4 percent. In a related manner, employment dropped by nearly 1.2 million jobs from February 2020 to April 2020, a decline of 13.0 percent. As of November, Florida had regained 694,700 jobs out of the 1,178,100 million lost, or about 59 percent. After a 1.0 percent decline in the 2019-20 fiscal year, the Conference expects total non-farm employment to decline by 0.8 percent in the 2020-21 fiscal year and then rebound by 4.3 percent in the 2021-22 fiscal year. Given the unique circumstances wrought by the pandemic, jobs in leisure and hospitality are not expected to reach pre-pandemic levels until the 2023-24 fiscal year.
Prior to the confirmation of Florida’s first cases, key state analysts had begun to develop potential scenarios for the possible course of the disease and its economic impact to the state. Over the summer months, the state’s official estimating conferences met for the first time as collegial bodies to formally adopt forecasts based on the most likely path offered by those scenarios. After adopting new economic and population forecasts, the Revenue Estimating Conference convened in August 2020 to make substantial adjustments to the pre-pandemic forecast adopted in January 2020. Anticipated revenues were revised downward by $3.4 billion for the 2020-21 fiscal year and by $2.0 billion for the upcoming 2021-22 fiscal year, for a two-year combined decrease of $5.4 billion. Shortly after the adoption of that forecast, consumers escalated the redirection of spending from the hard-hit service sector to purchases of goods, with some consumers also spending down the atypically large savings that built up during the pandemic. In addition, record low interest rates resulting from the Federal Reserve’s actions to stem the severity of the pandemic’s economic disruption triggered a surge in home buying and

February 26, 2021Page Three
refinancing. Reflecting these rapidly evolving events, revenue collections gained slightly over $1.0 billion to the Conference expectations through November.
The Conference met again in December. Because the continuing risk to the forecast was still high due to the pandemic-induced economic effects on Florida’s tourism-sensitive economy, it largely banked the year-to-date overage and assumed that the rest of the year would perform in accordance with the prior forecast. Anticipated revenues were revised upward by nearly $1.5 billion in the 2020-21 fiscal year and by $623 million in the 2021-22 fiscal year, for a two-year combined increase of $2.1 billion—restoring 39.0 percent of the $5.4 billion reduction taken in August. Overshadowing the positive aspects of the new forecast, the Conference was aware that the outbreak had recently intensified and, in so doing, introduced new risks to the forecast.
These risks are most acute for the sales tax forecast. As the pandemic took hold, sales tax collections plunged, falling by just over $1.6 billion from the estimate for the last quarter of the state’s 2019-20 fiscal year. A large part of the loss was related to declines in the tourism and hospitality-related industries. This is because Florida’s tourism-sensitive economy is particularly vulnerable to the longer-term effects of the pandemic. Previous economic studies of disease outbreaks have shown that it can take as much as twelve to fifteen months after the outbreak ends for tourism to return to pre-disease levels. The magnitude of this event is greater. The total number of tourists declined 60.3 percent from the prior year in the second quarter of 2020. After that historic decline, tourism in the third quarter managed to recover to 35.4 percent of the prior year’s level, buttressed by the stronger than anticipated number of domestic visitors travelling by car. Several industry groups have already predicted that it will take at least two years to reach recovery from this pandemic. Current expectations are that leisure driving vacations will recover first, and then—in order—business travel, domestic air travel, and international travel. The timing will be further influenced by the actual course of the disease and the recovery from the global recession. Bearing this in mind, the Economic Estimating Conference expects a continued contraction during the 2020-21 fiscal year, with a projected overall decline of 16.4 percent from the already suppressed 2019-20 level. Even nascent recovery in this industry is strongly linked to the widespread distribution of a vaccine. Since the Conference expects an effective vaccine to be widely deployed by the end of the 2020-21 fiscal year, the annual growth rate surges thereafter, albeit from an extremely low level. The new forecast levels never exceed pre-pandemic forecast levels, but come close towards the end of the ten-year forecast horizon.
According to the state’s Long-Range Financial Outlook adopted in September 2020, the state is anticipating a large budget gap for the upcoming 2021-22 fiscal year, meaning the projected revenues will not meet all anticipated needs. At the time the report was adopted by the state’s Legislative Budget Commission, the gap was projected to be as large as $2,977.4 million, but with certain specified revenue adjustments could be reduced to $2,749.9 million. Since the release of that document, a new round of estimating conferences has been held which generally improved the revenue outlook, but substantially increased the expected expenditures for programs such as Medicaid. In addition, the Long-Range Financial Outlook identifies potential future obligations of the Florida Hurricane Catastrophe Fund and Citizens Property Insurance Corporation as significant risks to the forecast. Refer to Note 14 to the financial statements for additional information related to the state’s insurance enterprises.
ACKNOWLEDGEMENTS
Preparation of the CAFR requires a significant investment of time and resources of fiscal and accounting personnel throughout the state. We appreciate all the contributions made to this effort.
Sincerely,
Jimmy PatronisChief Financial Officer
JP:pjb

ORGANIZATION AT JUNE 30, 2020
THE ELECTORATE OF FLORIDA
Legislative Branch Executive Branch Judicial BranchSenate Supreme CourtHouse of Representatives District Courts of Appeal - 5 Districts
Circuit Courts - 20 CircuitsPublic Service Commission County Courts - 67 CountiesAuditor GeneralOffice of Public CounselOffice of Program Policy Analysis and Justice Administrative Commission Government Accountability Capital Collateral Regional CounselLegislative Support Services: Criminal Conflict and Civil Regional Counsel Office of Legislative Services Guardian ad Litem Program Office of Legislative Information State Attorneys (elected officials) Technology Services Public Defenders (elected officials) Office of Economic and Demographic Research Judicial Qualifications CommissionCommission on Ethics
Governor Cabinet Agencies and Commissions ofLieutenant Governor Attorney General the Governor and CabinetExecutive Office of the Governor Department of Legal Affairs Department of Highway Safety and Motor VehiclesAgencies and Commissions of the Governor Chief Financial Officer Department of Law Enforcement Agency for Health Care Administration Department of Financial Services Department of Revenue Agency for Persons with Disabilities Commissioner of Agriculture Department of Veterans' Affairs Department of Business and Department of Agriculture and Financial Services Commission Professional Regulation Consumer Services Office of Insurance Regulation Department of Children and Families Office of Financial Regulation Department of Citrus Florida Commission on Offender Review Department of Corrections Department of Economic Opportunity Department of Elder Affairs Department of Environmental Protection Other Agencies, Boards, Department of Health and Commissions Department of Juvenile Justice Board of Governors of the State University System Department of the Lottery State Board of Education - Department of Education Department of Management Services Fish and Wildlife Conservation Commission Department of Military Affairs State Board of Administration Department of State Department of Transportation
PRINCIPAL OFFICIALS AT JUNE 30, 2020Legislative Branch Executive Branch Judicial BranchSenate Ron DeSantis, Governor Charles T. Canady, Chief Justice Bill Galvano, President Jeanette Nuñez, Lieutenant GovernorHouse of Representatives Cabinet Jose R. Oliva, Speaker Ashley Moody, Attorney General
Jimmy Patronis, Chief Financial Officer Nicole "Nikki" Fried, Commissioner of Agriculture
2020 STATE OF FLORIDA CAFR
9

THIS PAGE INTENTIONALLY LEFT BLANK
10

FINANCIALSECTION
11

THIS PAGE INTENTIONALLY LEFT BLANK
12

Phone: (850) 412-2722 Fax: (850) 488-6975
Sherrill F. Norman, CPA Auditor General
AUDITOR GENERAL
STATE OF FLORIDA Claude Denson Pepper Building, Suite G74
111 West Madison Street Tallahassee, Florida 32399-1450
The President of the Senate, the Speaker of the House of Representatives, and the Legislative Auditing Committee
INDEPENDENT AUDITOR’S REPORT
Report on the Financial Statements
We have audited the accompanying financial statements of the governmental activities, the business-type activities, the aggregate discretely presented component units, each major fund, and the aggregate remaining fund information of the State of Florida, as of and for the fiscal year ended June 30, 2020, and the related notes to the financial statements, which collectively comprise the State’s basic financial statements as listed in the table of contents.
Management’s Responsibility for the Financial Statements Management is responsible for the preparation and fair presentation of these financial statements in accordance with accounting principles generally accepted in the United States of America; this includes the design, implementation, and maintenance of internal control relevant to the preparation and fair presentation of financial statements that are free from material misstatement, whether due to fraud or error.
Auditor’s Responsibility Our responsibility is to express opinions on these financial statements based on our audit. We did not audit the financial statements of:
• The Prepaid College Program Fund, which is a major enterprise fund and represents 34 percent and 9 percent, respectively, of the assets and revenues of the business-type activities.
• The Florida Turnpike System, which represents 80 percent and 89 percent, respectively, of the assets and revenues of the Transportation major enterprise fund.
• The Hurricane Catastrophe Fund, which is a major enterprise fund and represents 28 percent and 9 percent, respectively, of the assets and revenues of the business-type activities.
• The College Savings Plan and the trust fund maintained by the State Board of Administration to account for the investments of the Public Employee Optional Retirement Program, which collectively represent 6 percent of the assets and 3 percent of the revenues/additions of the aggregate remaining fund information.

• The Florida Retirement System Trust Fund maintained by the State Board of Administration to account for the assets and investment income of the Florida Retirement System Defined Benefit Pension Plan which represent 91 percent and 48 percent, respectively, of the assets and additions of the Pension and Other Employee Benefits Trust Funds.
• The Florida Housing Finance Corporation, Citizens Property Insurance Corporation, component units related to the State’s universities and colleges, and certain other funds and entities that, in the aggregate, represent 63 percent and 36 percent, respectively, of the assets and revenues of the discretely presented component units.
The financial statements for the above-listed funds and entities were audited by other auditors whose reports have been furnished to us, and our opinions, insofar as they relate to the amounts included for these funds and entities, are based solely on the reports of the other auditors. We conducted our audit in accordance with auditing standards generally accepted in the United States of America and the standards applicable to financial audits contained in Government Auditing Standards, issued by the Comptroller General of the United States. Those standards require that we plan and perform the audit to obtain reasonable assurance about whether the financial statements are free from material misstatement.
An audit involves performing procedures to obtain audit evidence about the amounts and disclosures in the financial statements. The procedures selected depend on the auditor’s judgment, including the assessment of the risks of material misstatement of the financial statements, whether due to fraud or error. In making those risk assessments, the auditor considers internal control relevant to the entity’s preparation and fair presentation of the financial statements in order to design audit procedures that are appropriate in the circumstances, but not for the purpose of expressing an opinion on the effectiveness of the entity’s internal control. Accordingly, we express no such opinion. An audit also includes evaluating the appropriateness of accounting policies used and the reasonableness of significant accounting estimates made by management, as well as evaluating the overall presentation of the financial statements.
We believe that the audit evidence we have obtained is sufficient and appropriate to provide a basis for our unmodified and qualified audit opinions.

Summary of Opinions
Opinion Unit Type of Opinion
Governmental Activities Unmodified
Business-Type Activities Qualified
Aggregate Discretely Presented Component Units Unmodified
General Fund Unmodified
Natural Resources, Environment, and Growth Management Fund Unmodified
Public Education Fund Unmodified
Health and Family Services Fund Unmodified
Governmental - Transportation Fund Unmodified
Proprietary - Transportation Fund Unmodified
Lottery Fund Unmodified
Hurricane Catastrophe Fund Unmodified
Prepaid College Program Fund Unmodified
Reemployment Assistance Fund Qualified
Aggregate Remaining Fund Information Unmodified
Basis for Qualified Opinions on Business-Type Activities and Reemployment Assistance Fund
During the fourth quarter of the 2019-20 fiscal year, Florida Department of Economic Opportunity (FDEO) management bypassed a key Reemployment Assistance Claims and Benefits Information System (RA System) internal control to expedite unemployment insurance (UI) benefit payments, thereby increasing the risk of improper UI benefit payments and undetected material misstatements. According to FDEO records, 2,365,513 initial UI benefit claims were processed through the key RA System internal control and benefit payments totaling $8,921,910,565 were recorded during the period March 16, 2020, through June 30, 2020. However, despite the surge in UI benefit claims and RA System processing limitations that necessitated the bypass, FDEO records indicated that only 137,195 UI benefit claims, with associated payments totaling $623,028,301, bypassed the key internal control during the period March 16, 2020, through June 30, 2020. Because of this, we were unable to obtain sufficient appropriate audit evidence to conclude that the Receivables, net, Operating Revenues – Other, and Net Position – Restricted for Reemployment Assistance in the Reemployment Assistance Fund were free from material misstatement. Accounting principles generally accepted in the United States of America (GAAP) require that an asset and a revenue be recognized for the amount of UI benefit payments expected to be reclaimed when eligibility requirements are no longer met and that net position be restricted when constraints on use are either imposed by laws or regulations of other governments or imposed by law through constitutional provisions or enabling legislation. The amount by which these GAAP departures would affect the Reemployment Assistance Fund’s Receivables, net, Operating Revenues – Other, and Net Position – Restricted for Reemployment Assistance and, consequently, the Business-Type Activities has not been determined.

Qualified Opinions In our opinion, except for the effects of the matters described in the “Basis for Qualified Opinions on Business-Type Activities and Reemployment Assistance Fund” paragraph, the financial statements referred to above present fairly, in all material respects, the respective financial position of the Business-Type Activities and Reemployment Assistance Fund of the State of Florida, as of June 30, 2020, and the respective changes in financial position and, where applicable, cash flows thereof for the year then ended in accordance with accounting principles generally accepted in the United States of America.
Unmodified Opinions In our opinion, based on our audit and the reports of other auditors, the financial statements referred to above present fairly, in all material respects, the respective financial position of the governmental activities; the aggregate discretely presented component units; the General Fund; Natural Resources, Environment, and Growth Management Fund; Public Education Fund; Health and Family Services Fund; Transportation Governmental Fund; Transportation Proprietary Fund; Lottery Fund; Hurricane Catastrophe Fund; Prepaid College Program Fund; and the aggregate remaining fund information of the State of Florida, as of June 30, 2020, and the respective changes in financial position and, where applicable, cash flows thereof for the fiscal year then ended in accordance with accounting principles generally accepted in the United States of America.
Other Matters Required Supplementary Information
Accounting principles generally accepted in the United States of America require that management’s discussion and analysis on pages 19 through 25 and the budgetary information, funding and contribution information for pension and other postemployment benefits, and information on infrastructure using the modified approach on pages 184 through 200 be presented to supplement the basic financial statements. Such information, although not a part of the basic financial statements, is required by the Governmental Accounting Standards Board who considers it to be an essential part of financial reporting for placing the basic financial statements in an appropriate operational, economic, or historical context. We and other auditors have applied certain limited procedures to the required supplementary information in accordance with auditing standards generally accepted in the United States of America, which consisted of inquiries of management about the methods of preparing the information and comparing the information for consistency with management’s responses to our inquiries, the basic financial statements, and other knowledge we obtained during our audit of the basic financial statements. We do not express an opinion or provide any assurance on the information because the limited procedures do not provide us with sufficient evidence to express an opinion or provide any assurance.
Supplementary and Other Information
Our audit was conducted for the purpose of forming opinions on the financial statements that collectively comprise the State’s basic financial statements. The Introductory Section on pages 6 through 9 and the combining and individual fund statements, related budgetary comparison schedules, and Statistical Section on pages 204 through 323 are presented for purposes of additional analysis and are not a required part of the basic financial statements.
The combining and individual fund statements and related budgetary comparison schedules are the responsibility of management and were derived from and relate directly to the underlying accounting and

other records used to prepare the basic financial statements. The combining and individual fund statements and related budgetary comparison schedules have been subjected to the auditing procedures applied in the audit of the basic financial statements and certain additional procedures, including comparing and reconciling such information directly to the underlying accounting and other records used to prepare the basic financial statements or to the basic financial statements themselves, and other additional procedures in accordance with auditing standards generally accepted in the United States of America by us and other auditors. In our opinion, based on our audit, the procedures performed as described above, and the reports of the other auditors, the combining and individual fund statements and related budgetary comparison schedules are fairly stated, in all material respects, in relation to the basic financial statements as a whole.
The Introductory Section and the Statistical Section have not been subjected to the auditing procedures applied in the audit of the basic financial statements and accordingly, we do not express an opinion or provide any assurance on them.
Other Reporting Required by Government Auditing Standards
In accordance with Government Auditing Standards, we have also issued our report dated February 26, 2021, on our consideration of the State’s internal control over financial reporting and on our tests of its compliance with certain provisions of laws, administrative rules, regulations, contracts, and grant agreements and other matters. The purpose of that report is solely to describe the scope of our testing of internal control over financial reporting and compliance and the results of that testing, and not to provide an opinion on the effectiveness of the State’s internal control over financial reporting or on compliance. That report is an integral part of an audit performed in accordance with Government Auditing
Standards in considering the State’s internal control over financial reporting and compliance. That report will be included as part of our separately issued report entitled State of Florida Compliance and Internal
Controls Over Financial Reporting and Federal Awards.
Respectfully submitted,
Sherrill F. Norman, CPA Tallahassee, Florida February 26, 2021

THIS PAGE INTENTIONALLY LEFT BLANK
18

MANAGEMENT’S DISCUSSION AND ANALYSIS
The information contained in the Management’s Discussion and Analysis (MD&A) introduces the basic financial statements and provides an analytical overview of the State of Florida’s (the state’s) financial activities and performance for the fiscal year ended June 30, 2020 (fiscal year 2019-20). Please read the MD&A in conjunction with the state’s financial statements that are presented in the Financial Section of this Comprehensive Annual Financial Report (CAFR).
Financial Statements Overview
The state’s basic financial statements are comprised of the following elements:
Government-wide Financial StatementsGovernment-wide financial statements provide both long-term and short-term information about the state's overall financial condition. Changes in the state’s financial position may be measured over time by increases and decreases in the Statement of Net Position. Information on how the state’s net position changed during the fiscal year is presented in the Statement of Activities. Financial information for the state’s component units is also presented.
Fund Financial StatementsFund financial statements for governmental and proprietary funds focus on individual parts of the state, reporting the state's operations in more detail than the government-wide financial statements. Fund financial statements for fiduciary funds are also included to provide financial information related to the state’s fiduciary activities.
Notes to the Financial StatementsNotes to the financial statements provide additional information that is essential to the full understanding of the government-wide and fund financial statements. Refer to Note 1 to the financial statements for more information on the elements of the financial statements. Table 1 below summarizes the major features of the basic financial statements.
Table 1: Major Features of the Basic Financial Statements
Government-wide Fund Financial StatementsFinancial Statements Governmental Funds Proprietary Funds Fiduciary Funds
Scope Entire state government (except fiduciary funds) and the state’s component units
Activities of the state that are not proprietary or fiduciary
Activities of the state that are operated similar to private businesses
Instances in which the state is the trustee or agent for someone else’s resources
Required financial statements
• Statement of net position• Statement of activities
• Balance sheet• Statement of revenues,
expenditures, and changes in fund balances
• Statement of net position• Statement of revenues,
expenses, and changes in net position
• Statement of cash flows
• Statement of fiduciary net position
• Statement of changes in fiduciary net position
Accounting basis and measurement focus
Accrual accounting and economic resources focus
Modified accrual accounting and current financial resources focus
Accrual accounting and economic resources focus
Accrual accounting and economic resources focus
Type of asset, liability, and deferred outflow/inflow information
• All assets and liabilities, both financial and capital, and short-term and long-term
• All deferred outflows and deferred inflows of resources
• Only assets expected to be used up and liabilities that come due during the year or soon thereafter; no capital assets included
• All deferred outflows and deferred inflows of resources
• All assets and liabilities, both financial and capital, and short-term and long-term
• All deferred outflows and deferred inflows of resources
• All assets and liabilities, both financial and capital, and short-term and long-term
• All deferred outflows and deferred inflows of resources
Type of inflow/outflow information
All revenues and expenses during the year, regardless of when cash is received or paid
• Revenues for which cash is received during or soon after the end of the year
• Expenditures when goods or services have been received and payment is due during the year or soon thereafter
All revenues and expenses during the year, regardless of when cash is received or paid
All revenues and expenses during the year, regardless of when cash is received or paid
2020 STATE OF FLORIDA CAFR
19

Condensed Government-wide Financial Statements and Overall Financial Analysis
Statement of Net Position
Table 2 below presents the state’s Condensed Statement of Net Position as of June 30, 2020, and 2019, derived from the government-wide Statement of Net Position. The state’s net position at the close of the fiscal year was $69.7 billion for governmental activities and $29.5 billion for business-type activities which was a combined total of $99.2 billion for the primary government. The three components of net position include net investments in capital assets; restricted; and unrestricted. The largest component, totaling $87 billion as of June 30, 2020, reflects net investments in capital assets. The state uses these capital assets to provide services to the citizens and businesses in the state; consequently, this component of net position is not available for future spending. Restricted net position is the next largest component, totaling $26.7 billion as of June 30, 2020. Restricted net position represents resources that are subject to external restrictions, constitutional provisions, or enabling legislation on how they can be used.
Governmental activities reflect a negative or deficit fund balance in unrestricted net position of $15.5 billion at June 30, 2020. This deficit primarily results from education-related bonds for which the state is responsible for the liability while the related assets are owned by local school districts and are therefore not included in the state’s financial statements. Refer to Note 8 to the financial statements, Governmental Activities – Unrestricted Net Position Deficit, for more information.
Business-type activities reflect a restricted net position of $16.6 billion at June 30, 2020, a decrease of $2.1 billion over the prior year. The decrease in the restricted net position over that reported in prior years is explained in the Major Fund Analysis, Proprietary Funds section that follows.
Table 2: Condensed Statement of Net PositionAs of June 30(in millions)
GovernmentalActivities
Business-typeActivities
Total PrimaryGovernment
2020 2019 2020 2019 2020 2019Current and other assets $ 34,148 $ 29,069 $ 39,440 $ 41,489 $ 73,588 $ 70,558 Capital assets, net 81,110 78,538 15,236 14,141 96,346 92,679 Total assets 115,258 107,607 54,676 55,630 169,934 163,237 Total deferred outflows of resources 5,023 4,115 122 103 5,145 4,218 Other liabilities 8,712 3,889 9,450 3,764 18,162 7,653 Noncurrent liabilities 39,060 38,156 15,639 20,975 54,699 59,131 Total liabilities 47,772 42,045 25,089 24,739 72,861 66,784 Total deferred inflows of resources 2,839 2,854 215 220 3,054 3,074 Net position Net investments in capital assets 75,163 72,832 12,022 10,934 87,185 83,766 Restricted 10,057 10,232 16,627 18,702 26,684 28,934 Unrestricted (15,550) (16,241) 845 1,138 (14,705) (15,103) Total net position $ 69,670 $ 66,823 $ 29,494 $ 30,774 $ 99,164 $ 97,597
2020 STATE OF FLORIDA CAFR
20

Statement of Activities
Table 3 presents the state’s Condensed Statement of Activities for fiscal year 2019-20 and fiscal year 2018-19, as derived from the government-wide Statement of Activities. Over time, increases and decreases in the net position measure whether the state’s financial position is improving or deteriorating. The state’s total net position increased during the fiscal year by $1.6 billion. The net position of governmental activities increased by $2.8 billion, and the net position of business-type activities decreased by $1.3 billion. The majority of the increase in total program expenses for governmental activities relates to a $1.7 billion increase in General Government expense after $2.8 billion increase in Human Services expenses, while the largest increase in business-type activities expenses is the $8.8 billion increase in Reemployment Assistance program expenses. Refer to the Major Fund Analysis section for information regarding the overall increase in revenues from governmental activities.
Table 3: Condensed Statement of ActivitiesFor the Fiscal Year Ended June 30
(in millions)Governmental
ActivitiesBusiness-type
ActivitiesTotal PrimaryGovernment
2020 2019 2020 2019 2020 2019RevenuesProgram revenues
Charges for services $ 8,184 $ 8,571 $ 12,141 $ 12,973 $ 20,325 $ 21,544 Operating grants and contributions 34,671 29,280 6,847 5 41,518 29,285 Capital grants and contributions 2,077 2,310 14 13 2,091 2,323
Total program revenues 44,932 40,161 19,002 12,991 63,934 53,152 General revenues and payments
Sales and use tax 26,936 27,999 — — 26,936 27,999 Other taxes 14,064 14,678 — — 14,064 14,678 Investment earnings (loss) 887 662 11 13 898 675 Miscellaneous — — 3 3 3 3
Total general revenues and payments 41,887 43,339 14 16 41,901 43,355 Total revenues 86,819 83,500 19,016 13,007 105,835 96,507 Program expenses
General government 9,615 7,881 — — 9,615 7,881 Education 23,297 23,157 — — 23,297 23,157 Human services 39,400 36,579 — — 39,400 36,579 Criminal justice and corrections 5,179 4,829 — — 5,179 4,829 Natural resources and environment 3,187 3,291 — — 3,187 3,291 Transportation 4,301 4,394 843 774 5,144 5,168 Judicial branch 695 621 — — 695 621 Lottery — — 5,653 5,234 5,653 5,234 Hurricane Catastrophe Fund — — 1,556 4,019 1,556 4,019 Prepaid College Program — — 899 1,016 899 1,016 Reemployment Assistance — — 9,191 386 9,191 386 Nonmajor enterprise funds — — 389 407 389 407 Indirect interest on long term debt 67 38 — — 67 38
Total program expenses 85,741 80,790 18,531 11,836 104,272 92,626 Excess (deficiency) before gain (loss) and transfers 1,078 2,710 485 1,171 1,563 3,881 Gain (loss) on sale of capital assets 5 (290) (1) (2) 4 (292) Transfers 1,763 1,865 (1,763) (1,865) — — Change in net position 2,846 4,285 (1,279) (696) 1,567 3,589 Beginning net position, as restated (Note 1) 66,824 62,538 30,773 31,470 97,597 94,008 Ending net position $ 69,670 $ 66,823 $ 29,494 $ 30,774 $ 99,164 $ 97,597
2020 STATE OF FLORIDA CAFR
21

Major Fund Analysis
Governmental Funds
The state’s governmental funds reported a combined ending fund balance of $20.6 billion at June 30, 2020, a $458 million or 2.3 percent increase from the prior year. Revenues increased by $3.6 billion or 4.3 percent, other financing sources and uses decreased by $109 million or 3.5 percent, and expenditures increased by $4.9 billion or 5.8 percent. Overall increases in revenues and expenditures were primarily attributable to a rise in grants and donations.
Proprietary Funds
The state’s proprietary funds report combined ending net position of $29.5 billion at June 30, 2020, of which $12.0 billion is the net investment in capital assets, and $16.6 billion is restricted for specific purposes. The remaining $845 million was unrestricted and available for purposes of the various funds. Information is provided below regarding major funds with significant variances relative to the prior year.
Lottery – This fund reported a net position of $89 million at June 30, 2020, an increase of $4 million or 4.8 percent. Assets increased $189.7 million or 28.1 percent while liabilities increased $185.7 million or 31.4 percent. Assets increased primarily due to increases in receivables and pooled investments with State Treasury. Liabilities increased primarily due to increases in amounts owed to prizewinners and the Education Enhancement Trust Fund.
Reemployment Assistance – This fund reported a net position of $2.3 billion at June 30, 2020, a decrease of $1.8 billion or 44.1 percent. Revenues increased by $6.8 billion or 1,148.7 percent while expenses and operating transfers out increased by $8.8 billion or 2,210.6 percent. Revenues increased as result of the COVID-19 pandemic during the fiscal year. The increase in expenses and operating transfers out were due to higher reemployment assistance during the COVID-19 pandemic.
Hurricane Catastrophe Fund – The net position at June 30, 2020, totaled $10.4 billion, an increase of $64 million or 0.6 percent. Liabilities decreased $1.5 billion or 23 percent while expenditures decreased by $2.5 billion or 62 percent due to no additional hurricane loss events attributable to the Fund occurring in fiscal year ending 2020 and the estimate of the ultimate loss for Hurricane Irma not increasing as much as in prior fiscal years.
Prepaid College Program – The net position at June 30, 2020, totaled $3.6 billion, a decrease of $134 million or 3.6 percent. Revenues decreased by $998.5 million or 56.6 percent. The decrease in revenues and net position was primarily due to the $719 million rollback refund in January 2020 and the impacts of COVID-19 related decisions, one of which was the extension and deferment of all contract payments for three months.
General Fund Budget Variances
Budgeted expenditures are based on revenues estimated by the Revenue Estimating Conference and other sources. Original expenditures are budgeted for less than total expected available resources. There was a $26 million decrease between the original and final estimated revenues. Final budgeted total expenditures increased by $1 billion from the original budget. Variances between the original and final budget or between the final budgeted and actual amounts are not expected to significantly affect future services or liquidity. For additional information on the budget variances, refer to the Budgetary Comparison Schedule for the General Fund in the Other Required Supplementary Information section of the CAFR.
Capital Asset and Long-term Debt Activity
Capital Asset Activity
At June 30, 2020, the state reported $81.1 billion in net capital assets for governmental activities and $15.2 billion in net capital assets for business-type activities. Net capital assets for governmental and business-type activities increased from fiscal year 2018-19 to fiscal year 2019-20 by approximately 4.0 percent. The increase is primarily due to the capitalization of construction costs for infrastructure projects. Capitalized infrastructure projects include additions to and/or enhancements of roadways and bridges on the state’s highway system. Construction commitments by the Florida Department of Transportation were approximately $12.8 billion. Construction commitments by other state agencies for major projects including office buildings and correctional facilities decreased by $81 million compared to the prior year. Refer to Note 5 to the financial statements for information on capital assets and Note 7 to the financial statements for information on construction commitments.
Long-term Debt Activity
Total bonded debt outstanding decreased by $1.6 billion, or approximately 8.5 percent, from the prior fiscal year to a total of $17.1 billion at June 30, 2020 due to new debt issued being less than scheduled amortization and debt service payments. The
2020 STATE OF FLORIDA CAFR
22

majority of the outstanding bonded debt serves to finance educational facilities ($8.9 billion), the Florida Hurricane Catastrophe Fund ($1.7 billion) and transportation ($5 billion). New and refinanced bonded debt issues for 2020 totaled $2.0 billion. Public-Private Partnership (PPP) contracts outstanding increased from the prior year by $84 million or 2.9 percent to a total of $2.8 billion. The annual debt service requirements increased from $2 billion in 2019 to $2.3 billion in 2020. The increase in debt service in Fiscal Year 2020 reflected the impact of PPP payments. The annual debt service is projected to decrease to approximately $2.3 billion though Fiscal Year 2022, then continue to decrease to approximately $1.8 billion in Fiscal Year 2023, reflecting the payment obligations for the PPP I-395 and I-4 Projects.
Pursuant to the provisions of Governmental Accounting Standards Board (GASB) Statement No. 68 – Accounting and Financial Reporting for Pensions – an amendment of GASB Statement No. 27, the State of Florida recorded $8.8 billion in pension liabilities for the defined benefit plans it administers for the fiscal year ended June 30, 2020. The $8.8 billion includes the State’s proportionate share of the liability for the Florida Retirement System Pension Plan, the Retiree Health Insurance Subsidy Program, and the Florida National Guard Supplemental Retirement Benefit Plan. (See Note 6 to the Financial Statements for further information.)
Pursuant to the provisions of GASB Statement No. 75 - Accounting and Financial Reporting for Postemployment Benefits Other Than Pensions, the State of Florida recorded $9.2 billion in other postemployment benefits liabilities for the fiscal year ended June 30, 2020. This resulted in a increase of $1.4 billion or 17.4 percent. (See Note 6 to the Financial Statements for further information.)
The state maintained its credit ratings during the past year. During the fiscal year ended June 30, 2020, all three major rating agencies (Standard & Poor’s Rating Services, Fitch Ratings and Moody's Investors Services) rated the state in the highest rating category and have affirmed the State’s AAA general obligation rating and Stable outlooks. The state’s benchmark debt ratio increased in Fiscal Year 2020 to 5.49 percent and is projected to remain below the 6 percent policy target for the foreseeable future.
Section 11 of Article VII of the State Constitution authorizes the state to issue general obligation bonds or revenue bonds to finance or refinance fixed capital outlay projects authorized by law. General obligation bonds are secured by the full faith and credit of the state and payable from specified taxes. Revenue bonds are payable solely from specified revenues. The responsibility to issue most state bonds rests with the Division of Bond Finance of the State Board of Administration. However, certain quasi-governmental entities also incur debt and are reported as part of the primary government. See the State of Florida 2020 Debt Report for more detailed information about the state’s debt position. The report can be found at www.sbafla.com/bondfinance or by contacting the Division of Bond Finance, 1801 Hermitage Boulevard, Suite 200, Tallahassee, Florida 32308, (850) 488-4782. Additional information on long-term debt is also found in Notes 6, 8, 9, and 10 to the financial statements and the Statistical Section of this report.
Infrastructure Accounted for Using the Modified Approach
The state elected to use the modified approach to account for roadways, bridges, and other infrastructure assets of the State Highway System. Under this approach, the Florida Department of Transportation (FDOT) committed to maintain these assets at levels established by FDOT and approved by the Florida Legislature. No depreciation expense is reported for these assets, nor are amounts capitalized in connection with improvements that lengthen the lives of such assets, unless the improvements also increase their service potential. FDOT maintains an inventory of these assets and performs periodic assessments to establish that predetermined condition levels are being maintained. The condition assessments performed during fiscal year 2019-20 show that the roadways and bridges of the State Highway System are being maintained at or near FDOT standards. These condition assessments were consistent with condition assessments conducted during past years. In addition, FDOT makes annual estimates of the amounts that must be expended to maintain the roadways and bridges included on the State Highway System at the predetermined condition levels. These estimates are based on the FDOT five-year plan that is revised as projects are added, deleted, adjusted, or postponed. Refer to the Other Required Supplementary Information of the CAFR for information on FDOT’s established condition standards, recent condition assessments, and other information on infrastructure reported on the modified approach.
Economic Factors
The national economy contracted at its greatest rate in postwar history during the second quarter of the calendar year (April, May and June 2020) as unprecedented shutdowns closed businesses and left millions of Americans out of work during the pandemic. As a result of the pandemic-induced economic contraction, General Fund tax collections for the state’s fiscal year ended June 30, 2020, came in 6.1 percent lower than the prior fiscal year, the largest year-over-year decline since the worst years of the Great Recession (the 2007-08 and 2008-09 fiscal years). Prior to the pandemic, the state had been expecting a 0.5 percent decline in final collections that was related to the known loss of the Indian Gaming revenue share payment. The last payment from the Seminole Tribe was received in April 2019. Because formal stay-at-home orders were in place statewide for a significant part of the last quarter of the state’s fiscal year and are not anticipated to be reinstated, the negative growth rate for fiscal year 2019-20 is not projected to continue into future years. The state’s official forecast contains elevated annual growth rates after the expected widespread distribution of a vaccine early in the 2021-22 fiscal year that gradually drop back to the 3.5 percent annual growth projected for the long run.
2020 STATE OF FLORIDA CAFR
23

A significant portion (38.8 percent) of the year-over-year net decline in General Fund receipts (total revenue minus refunds) came from the loss in sales tax collections. Over the past 15 years, this revenue source’s share of the fund has grown from 70.6 percent in fiscal year 2004-05 to 78.4 percent in fiscal year 2019-20, which means that even a modest reduction in collections from the prior year translates into a nontrivial dollar loss. As the economy faltered during the pandemic, total sales tax liability declined 3.2 percent from fiscal year 2018-19 to fiscal year 2019-20, with four of the state’s six sales tax categories used for reporting purposes (nondurables, tourism and recreation, autos and accessories, and other durables) showing negative growth over the prior year. This equates to an $888.7 million retreat from the prior year’s level for this source, of which $794.0 million impacted the General Fund. Because the state’s Revenue Estimating Conference had previously expected sales tax growth of 3.2 percent, the loss from that estimate was even greater—nearly $1.6 billion or 6.1 percent from the anticipated level.
In addition to sales tax, collections of three other general fund sources were materially affected by the state’s Safer at Home orders or other limitations on activity: article V fees and transfers; beverage taxes; and pari-mutuel taxes. The loss in article V fees was largely related to the closure of courts and various other state and local government offices, as well as federal and state actions to provide forbearance on delinquent payments and foreclosures. Reduced collections of beverage taxes were caused by activity limitations on bars and restaurants, while reduced collections of pari-mutuel taxes were caused by the temporary closure of those facilities.
Altogether, nearly two-thirds of the state’s general fund sources posted losses over the prior year, with four of those sources (corporate income tax; highway safety fees; corporate filing fees; and other taxes, licenses and fees) affected by formal state orders delaying payment of the applicable taxes or fees until June 2020 or later. Prior to the onset of the pandemic, each of these revenue sources had been coming in close to or over the monthly estimates adopted by the state’s Revenue Estimating Conference. While a portion of the induced losses had begun to be recaptured in June 2020, final recoupment spilled over into the next fiscal year.
Rather than harmed, several revenue sources performed better than expected or benefited from government actions to provide relief and support during the first crucial stage of the pandemic. Among these sources, collections of both the documentary stamp and intangibles taxes rely predominantly on activity in the state’s real estate market. To provide an important firewall between the turmoil in the economy at-large and the financial system, the Federal Reserve aggressively instituted rate cuts to near-zero percent, backstopped credit markets and created new facilities to buy corporate debt. One result was record low interest rates that set off a surge of home buying and refinancing. This market environment enabled total documentary stamp tax collections to experience 8.4 percent growth in fiscal year 2019-20 over fiscal year 2018-19, despite dampened activity after the imposition of the first Safer at Home order. Total collections from this source finally ended the year at 70.8 percent of the peak level in fiscal year 2005-06, an improvement over prior years. Reflecting a slightly different aspect of the market, intangibles tax collections, which entirely benefit the General Fund, strengthened as refinancing activity surged in response to the low interest rates, ultimately posting a 28.0 percent gain over the prior year.
Similarly, Earnings on Investments benefited from the enactment of federal legislation to provide relief during the pandemic. One such law, the Coronavirus Aid, Relief, and Economic Security [CARES] Act, provided substantial federal government support to individuals, businesses, hospitals, and specific industries dealing with the pandemic and its associated economic consequences. [Public Law No: 116-136; enacted 03/27/2020] Among other things, the legislation created the Coronavirus Relief Fund within the U.S. Department of the Treasury to fund necessary state and local government expenditures incurred due to the COVID-19 public health emergency. Florida’s total allocation was $8,328.2 million, of which $2,472.4 million was distributed by the U.S. Department of the Treasury directly to Florida local governments with populations greater than 500,000. The remaining $5,855.8 million was transferred to the State of Florida and deposited in the state treasury. The large cash infusion into the General Fund and the resulting temporary increase in the state’s daily balance produced unanticipated opportunities for investment earnings that contributed to a 65.2 percent gain over the prior year.
The remaining revenue sources were either only marginally affected by the negative effects of the Coronavirus outbreak or behaved as forecast by the state’s Revenue Estimating Conference prior to the pandemic. At the end of the 2019-20 state fiscal year, net General Fund collections ended with a loss from the estimate for the General Revenue Fund of nearly $1.9 billion, down 5.7 percent from the estimate adopted in January 2020 when the last pre-pandemic forecast was made.
The Revenue Estimating Conference met in December 2020 to revise the General Fund forecast for fiscal years 2020-21 and 2021-22. Through November, revenue collections had gained slightly over $1.0 billion to the Conference expectations at its prior meeting, with reason to believe that December collections would add to the overage. Because the continuing risk to the forecast is still high due to the pandemic-induced economic effects on Florida’s tourism-sensitive economy, the Revenue Estimating Conference largely banked the year-to-date overage and assumed that the rest of the year would perform in accordance with the prior forecast. As a result, the Conference made sizeable adjustments to the forecast adopted in
2020 STATE OF FLORIDA CAFR
24

August 2020. Anticipated revenues were revised upward by nearly $1.5 billion in fiscal year 2020-21 and by $623 million in fiscal year 2021-22, for a two-year combined increase of $2.1 billion—restoring 39.0 percent of the $5.4 billion reduction taken in August. These changes reflect increases over the previous estimates of 4.8 percent in fiscal year 2020-21 and 1.8 percent in fiscal year 2021-22.
As a buffer against the ongoing financial shock wrought by the pandemic, the latest General Revenue Outlook shows that there will be $1,947.0 million in unallocated general revenue remaining at the end of the current fiscal year. In addition, the state’s major reserve for emergencies, the Budget Stabilization Fund, has a planned balance of $1,674.2 million. The fund cash balance is now at the highest recorded level in its history. The other source most frequently mentioned as part of the state’s informal reserve system is the Lawton Chiles Endowment Fund (LCEF). The LCEF had an estimated market value of $862.0 million as of September 30, 2020, bringing the total of all reserves to $4,483.2 million or 13.8 percent of the state’s estimated General Fund tax collections for the current year (after payment of refunds). According to the state’s Long-Range Financial Outlook adopted in September 2020, the state is anticipating a large budget gap for the upcoming fiscal year (2021-22), meaning the projected revenues will not meet all anticipated needs. At the time the report was adopted by the state’s Legislative Budget Commission, the gap was projected to be as large as $2,977.4 million, but with certain specified revenue adjustments could be reduced to $2,749.9 million. Since the release of that document, a new round of estimating conferences has been held which generally improved the revenue outlook but substantially increased the expected expenditures for programs such as Medicaid.
Contact the State’s Financial Management
Questions about this report or requests for additional financial information may be addressed to:
Department of Financial ServicesBureau of Financial ReportingStatewide Financial Reporting Section200 East Gaines StreetTallahassee, Florida 32399-0364(850) 413-5511
2020 STATE OF FLORIDA CAFR
25

THIS PAGE INTENTIONALLY LEFT BLANK
26

FINANCIAL SECTION:
BASIC FINANCIAL STATEMENTS

STATEMENT OF NET POSITIONFOR THE FISCAL YEAR ENDED JUNE 30, 2020 (in thousands)
Primary Government
GovernmentalActivities
Business-typeActivities Totals
ComponentUnits
ASSETSCash and cash equivalents $ 72,169 $ 46,156 $ 118,325 $ 2,315,239 Pooled investments with State Treasury 22,778,300 4,048,567 26,826,867 3,648,571 Other investments 1,388,044 30,848,848 32,236,892 17,358,197 Receivables, net 5,612,678 2,119,581 7,732,259 2,094,123 Internal balances 368,802 (368,802) — — Due from component units/primary 13,050 500 13,550 558,699 Inventories 45,750 11,793 57,543 117,437 Restricted cash and cash equivalents — 156 156 558,049 Restricted pooled investments with State Treasury — 204,890 204,890 879,036 Restricted investments — 571,833 571,833 7,021,147 Advances to other entities 792,217 — 792,217 — Other loans and notes receivable, net 3,074,129 1,913,677 4,987,806 2,323,901 Other assets 2,294 42,413 44,707 719,516 Capital assets, net 81,110,399 15,236,069 96,346,468 26,645,952
Total assets 115,257,832 54,675,681 169,933,513 64,239,867 DEFERRED OUTFLOWS OF RESOURCES
Accum. decrease in fair value - hedging derivatives — — — 73,571 Grants paid in advance — — — 15 Amount deferred on refunding of debt 88,979 25,304 114,283 56,032 Pension-related items 3,506,810 57,279 3,564,089 1,586,666 Other postemployment benefits 1,426,951 39,760 1,466,711 658,289 Asset retirement obligations — — — 8,883
Total deferred outflows of resources 5,022,740 122,343 5,145,083 2,383,456 LIABILITIES
Accounts payable and accrued liabilities 3,030,724 2,124,850 5,155,574 2,663,336 Due to other governments — 11,552 11,552 — Due to component units/primary 70,080 431 70,511 76,386 Obligations under security lending agreements 1,602,500 2,529,535 4,132,035 — Long-term liabilities
Due within one year 4,008,740 4,783,717 8,792,457 2,256,992 Due in more than one year 39,059,709 15,638,479 54,698,188 17,539,201
Total liabilities 47,771,753 25,088,564 72,860,317 22,535,915 DEFERRED INFLOWS OF RESOURCES
Deferred service concession arrangement receipts — 134,632 134,632 114,186 Grants received in advance — — — 1,535 Amount deferred on refunding of debt 99,647 16,625 116,272 2,361 Pension-related items 878,419 16,003 894,422 403,043 Other postemployment benefits liability 1,860,536 48,029 1,908,565 595,704 Irrevocable split-interest agreements — — — 57,815
Total deferred inflows of resources 2,838,602 215,289 3,053,891 1,174,644 NET POSITION
Net investments in capital assets 75,163,014 12,022,039 87,185,053 22,316,177 Restricted for
Natural resources, environment, and growth management 4,170,683 — 4,170,683 — Public Education 405,676 — 405,676 — Health and Family Services 1,781,785 — 1,781,785 — Transportation 1,698,367 249,847 1,948,214 — Nonmajor governmental funds 1,269,395 — 1,269,395 — Debt service 30,391 — 30,391 42,874 Lottery — 139,270 139,270 — Prepaid College Program — 3,566,380 3,566,380 — Hurricane Catastrophe Fund — 10,351,755 10,351,755 — Reemployment Assistance — 2,318,051 2,318,051 — Other 700,498 2,132 702,630 8,073,842
Funds held for permanent endowmentExpendable — — — 1,030,666 Nonexpendable — — — 3,687,250
Unrestricted (15,549,592) 844,697 (14,704,895) 7,761,955 Total net position $ 69,670,217 $ 29,494,171 $ 99,164,388 $ 42,912,764
The notes to the financial statements are an integral part of this statement.
2020 STATE OF FLORIDA CAFR
28

STATEMENT OF ACTIVITIESFOR THE FISCAL YEAR ENDED JUNE 30, 2020 (in thousands)
Program Revenues
Functions/Programs Expenses Charges for
Services
OperatingGrants and
Contributions
CapitalGrants and
Contributions
Net(Expense)Revenue
Primary governmentGovernmental activities:
General government $ 9,614,755 $ 4,631,524 $ 4,203,924 $ 9,953 $ (769,354) Education 23,297,022 293,948 2,438,758 93 (20,564,223) Human services 39,400,204 2,186,607 26,438,632 28,461 (10,746,504) Criminal justice and corrections 5,178,908 272,613 157,720 615 (4,747,960) Natural resources and environment 3,187,110 387,081 1,336,635 — (1,463,394) Transportation 4,301,255 318,386 94,037 2,037,737 (1,851,095) Judicial branch 694,616 93,555 1,791 — (599,270) Indirect interest on long-term debt 66,581 — — — (66,581)
Total governmental activities 85,740,451 8,183,714 34,671,497 2,076,859 (40,808,381) Business-type activities:
Transportation 842,859 1,189,112 — — 346,253 Lottery 5,653,279 7,570,838 — — 1,917,559 Hurricane Catastrophe Fund 1,556,717 1,631,661 — — 74,944 Prepaid College Program 898,935 764,072 — — (134,863) Reemployment Assistance 9,191,215 526,593 6,846,162 — (1,818,460) Nonmajor enterprise funds 388,942 459,066 646 14,170 84,940
Total business-type activities 18,531,947 12,141,342 6,846,808 14,170 470,373
Total primary government $ 104,272,398 $ 20,325,056 $ 41,518,305 $ 2,091,029 $ (40,338,008) Component units
Florida Housing Finance Corporation $ 194,772 $ 259,819 $ — $ — $ 65,047 University of Florida 6,464,824 4,225,924 1,073,015 60,688 (1,105,197) Citizens Property Insurance Corporation 764,734 617,888 — — (146,846) Nonmajor component units 13,796,903 3,535,802 4,263,283 572,683 (5,425,135)
Total component units $ 21,221,233 $ 8,639,433 $ 5,336,298 $ 633,371 $ (6,612,131)
Primary GovernmentGovernmental
ActivitiesBusiness-type
Activities TotalComponent
UnitsNet (expense) revenue $ (40,808,381) $ 470,373 $ (40,338,008) $ (6,612,131)
General revenues:Taxes
Sales and use tax 26,936,491 — 26,936,491 — Fuel taxes 3,048,047 — 3,048,047 — Corporate income tax 2,509,887 — 2,509,887 — Documentary stamp tax 2,829,050 — 2,829,050 — Intangible personal property tax 488,765 — 488,765 — Communications service tax 927,396 — 927,396 — Beverage and tobacco taxes 1,398,145 — 1,398,145 — Insurance premium tax 1,225,176 — 1,225,176 — Gross receipts utilities tax 732,663 — 732,663 — Property taxes — — — 498,201 Other taxes 904,529 — 904,529 —
Investment earning (loss) 886,544 11,173 897,717 1,245,236 Gain (loss) on sale of capital assets 5,111 (998) 4,113 (22,113) Payments from the State of Florida — — — 4,764,824 Emergency assessments — — — — Miscellaneous 1 3,174 3,175 1,039,852
Transfers 1,762,981 (1,762,981) — — Contributions to permanent funds — — — 107,685
Total general revenues, transfers and contributions 43,654,786 (1,749,632) 41,905,154 7,633,685 Changes in net position 2,846,405 (1,279,259) 1,567,146 1,021,554
Net position - beginning, as restated (Note 1) 66,823,812 30,773,430 97,597,242 41,891,210
Net position - ending $ 69,670,217 $ 29,494,171 $ 99,164,388 $ 42,912,764
The notes to the financial statements are an integral part of this statement.
2020 STATE OF FLORIDA CAFR
29

THIS PAGE INTENTIONALLY LEFT BLANK
30

GOVERNMENTAL FUND FINANCIAL STATEMENTS
Major Funds
GENERAL FUNDThis fund is the State’s primary operating fund. It accounts for the financial resources and transactions not accounted for in other funds.
NATURAL RESOURCES, ENVIRONMENT, AND GROWTH MANAGEMENTThis fund accounts for operations of various programs, such as air pollution control, water quality assurance, ecosystem management, and marine resources conservation.
PUBLIC EDUCATIONThis fund includes internal reporting funds administered by the Department of Education to operate education-related programs.
HEALTH AND FAMILY SERVICESThis fund includes internal reporting funds used to operate various health and family service-related programs, such as health care, elder affairs, and public assistance.
TRANSPORTATIONThis fund includes the internal reporting special revenue funds used to account for the administration of the maintenance and development of the State highway system and other transportation-related projects.
Nonmajor Funds
Nonmajor governmental funds are presented, by fund type, beginning on page 204.
2020 STATE OF FLORIDA CAFR
31

BALANCE SHEETGOVERNMENTAL FUNDSFOR THE FISCAL YEAR ENDED JUNE 30, 2020 (in thousands)
GeneralFund
Natural Resources,
Environment, and Growth
ManagementPublic
Education
Health andFamily
ServicesASSETSCurrent assetsCash and cash equivalents $ 19,577 $ 9,783 $ — $ 5,699 Pooled investments with State Treasury 12,701,541 2,388,730 888,921 1,710,729 Other investments 1,099,784 — — — Receivables, net 1,961,384 236,874 28,241 2,199,130 Due from other funds 235,973 59,357 157,577 173,360 Due from component units/primary 344 432 10,905 — Inventories 7,725 748 — 27,068 Other 1,826 — — — Total current assets 16,028,154 2,695,924 1,085,644 4,115,986 Noncurrent assetsLong-term investments — — — — Advances to other funds 1,125 — — — Advances to other entities 3,759 736 747,012 — Other loans and notes receivable, net 5,365 1,759,394 1,268 32,782 Total noncurrent assets 10,249 1,760,130 748,280 32,782 Total assets 16,038,403 4,456,054 1,833,924 4,148,768 DEFERRED OUTFLOWS OF RESOURCESGrants paid in advance — — — — Total deferred outflows of resources — — — — Total assets and deferred outflows 16,038,403 4,456,054 1,833,924 4,148,768 LIABILITIESCurrent liabilitiesAccounts payable and accrued liabilities 708,196 55,086 26,542 693,351 Due to other funds 626,056 10,866 4,077 66,012 Due to component units/primary 16,264 36,540 179 14,888 Compensated absences 17,054 2,699 1 1,804 Claims payable 103,482 — — 610,442 Deposits 6,897 22,484 9,077 729 Obligations under security lending agreements 1,257,407 79,584 45,540 3,734 Total current liabilities 2,735,356 207,259 85,416 1,390,960 Noncurrent liabilitiesAdvances from other funds — — 986,684 — Deposits 3,896,767 — — — Total noncurrent liabilities 3,896,767 — 986,684 — Total liabilities 6,632,123 207,259 1,072,100 1,390,960 DEFERRED INFLOWS OF RESOURCESUnavailable revenue 163,250 2,334 — 932,203 Total deferred inflows of resources 163,250 2,334 — 932,203 FUND BALANCESNonspendable 11,959 748 — 27,068 Restricted 73,252 2,828,858 1,239,797 270,298 Committed 1,293,157 1,416,855 380,604 1,528,239 Unassigned 7,864,662 — (858,577) — Total fund balances 9,243,030 4,246,461 761,824 1,825,605 Total liabilities, deferred inflows and fund balances $ 16,038,403 $ 4,456,054 $ 1,833,924 $ 4,148,768
The notes to the financial statements are an integral part of this statement.
2020 STATE OF FLORIDA CAFR
32

Transportation
NonmajorGovernmental
Funds Totals 6/30/20
$ 784 $ 24,425 $ 60,268 2,243,914 2,024,988 21,958,823 — 206,039 1,305,823 339,826 655,970 5,421,425 253,708 157,424 1,037,399 — 1 11,682 7,777 2,432 45,750 8 460 2,294 2,846,017 3,071,739 29,843,464
— 37,926 37,926 116,795 — 117,920 40,710 — 792,217 493,032 782,288 3,074,129 650,537 820,214 4,022,192 3,496,554 3,891,953 33,865,656
— — — — — — 3,496,554 3,891,953 33,865,656
692,338 347,313 2,522,826 34,453 197,540 939,004 — 2,209 70,080 384 1,205 23,147 — 4,447 718,371 609,142 151,732 800,061 108,711 70,387 1,565,363 1,445,028 774,833 6,638,852
— 737 987,421 — 11,368 3,908,135 — 12,105 4,895,556 1,445,028 786,938 11,534,408
353,160 301,079 1,752,026 353,160 301,079 1,752,026
7,785 6,912 54,472 50 1,502,513 5,914,768 1,690,531 1,294,511 7,603,897 — — 7,006,085 1,698,366 2,803,936 20,579,222 $ 3,496,554 $ 3,891,953 $ 33,865,656
2020 STATE OF FLORIDA CAFR
33

RECONCILIATION OF THE BALANCE SHEET OF GOVERNMENTAL FUNDS TOTHE STATEMENT OF NET POSITION
FOR THE FISCAL YEAR ENDED JUNE 30, 2020 (in thousands)
Total fund balances for governmental funds $ 20,579,222
Amounts reported for governmental activities in the Statement of Net Position are different because:
Capital assets used in governmental activities reported in governmental funds are not financial resources and therefore are not reported in the funds.
Land and other nondepreciable assets 20,447,216 Nondepreciable infrastructure 52,713,027 Buildings, equipment and other depreciable assets 7,091,920 Accumulated depreciation (4,781,162) Construction work in progress 4,686,302
80,157,303
Long-term liabilities are not due and payable in the current period and therefore are not reported in the funds.
Compensated absences (743,726) Installment purchases/capital leases/public-private partnership agreements (2,801,520) Claims payable (1,751,030) Bonds payable (12,610,314) Certificates of participation payable (63,860) Pension liability (8,540,746) Other postemployment benefits (8,812,976) Due to other governments (358,529) Other (17,492)
(35,700,193)
Deferred amounts on refunding are reported in the Statement of Net Position as deferred outflows or deferred inflows of resources (to be amortized as interest expense) but are not reported in the funds. (6,829)
Deferred amounts for pension-related items are reported in the Statement of Net Position as deferred outflows or deferred inflows of resources (to be amortized as pension expense) but are not reported in the funds. 2,601,913
Deferred amounts for other postemployment items are reported in the Statement of Net Position as deferred outflows or deferred inflows of resources (to be amortized as pension expense) but are not reported in the funds. (424,588)
Accrued interest payable on bonds that is not recognized on the fund statements but is recognized on the Statement of Net Position. (29,181)
Assets (receivables) not available to provide current resources are offset with deferred inflows of resources in the fund statements. The reduction of the deferred inflow and recognition of revenue increases net position in the Statement of Net Position. 1,752,026
Internal service funds are used to report activities that provide goods and services to other funds or agencies within the state. Therefore, the excess of assets over liabilities of the internal service funds are included as governmental activities on the Statement of Net Position. 740,544
Net position of governmental activities $ 69,670,217
The notes to the financial statements are an integral part of this statement.
2020 STATE OF FLORIDA CAFR
34

THIS PAGE INTENTIONALLY LEFT BLANK
35

STATEMENT OF REVENUES, EXPENDITURES, AND CHANGES IN FUND BALANCESGOVERNMENTAL FUNDSFOR THE FISCAL YEAR ENDED JUNE 30, 2020 (in thousands)
GeneralFund
Natural Resources,
Environment, and Growth Management
PublicEducation
Health andFamily
ServicesREVENUES Taxes $ 35,915,086 $ 290,135 $ 1,062,063 $ 730,581 Licenses and permits 256,563 50,142 990 37,072 Fees and charges 1,417,351 151,024 61,415 1,427,941 Grants and donations 1,873,588 250,405 2,484,170 26,272,780 Investment earnings (losses) 787,493 93,965 77,035 10,067 Fines, forfeits, settlements and judgments 284,197 4,589 131,397 41,730 Other 65 17,181 17,548 595,660 Total revenues 40,534,343 857,441 3,834,618 29,115,831 EXPENDITURESCurrent: General government 5,353,432 21,015 — 183,391 Education 17,529,269 — 5,263,593 — Human services 8,875,809 — — 30,044,276 Criminal justice and corrections 3,940,581 — — — Natural resources and environment 599,169 1,215,455 — — Transportation 80,199 — — — Judicial branch 459,762 — — — Capital outlay 112,036 105,894 15 18,815 Debt service: Principal retirement 9,391 — — — Interest and fiscal charges 4,159 — — — Total expenditures 36,963,807 1,342,364 5,263,608 30,246,482 Excess (deficiency) of revenues over expenditures 3,570,536 (484,923) (1,428,990) (1,130,651) OTHER FINANCING SOURCES (USES)Proceeds of bond issues 2,958 — 43,206 — Proceeds of refunding bonds — — — — Proceeds of financing agreements 23,562 — — — Operating transfers in 856,514 1,109,710 2,402,509 1,639,982 Operating transfers out (4,032,832) (346,416) (1,179,269) (496,396) Payments to refunded bond agent — — — — Total other financing sources (uses) (3,149,798) 763,294 1,266,446 1,143,586 Net change in fund balances 420,738 278,371 (162,544) 12,935 Fund balances - beginning, as restated (Note 1) 8,822,292 3,968,090 924,368 1,812,670
Fund balances - ending $ 9,243,030 $ 4,246,461 $ 761,824 $ 1,825,605
The notes to the financial statements are an integral part of this statement.
2020 STATE OF FLORIDA CAFR
36

Transportation
NonmajorGovernmental
FundsTotals
6/30/20
$ 2,762,052 $ 220,924 $ 40,980,841 14,327 1,682,343 2,041,437 391,066 707,050 4,155,847 2,107,979 3,971,797 36,960,719 94,607 95,132 1,158,299 2,748 474,333 938,994 21,832 75,184 727,470 5,394,611 7,226,763 86,963,607
193,229 3,844,191 9,595,258 — 210,188 23,003,050 — 429,953 39,350,038 — 592,236 4,532,817 — 1,239,805 3,054,429 4,071,849 128 4,152,176 — 89,089 548,851 2,741,942 149,653 3,128,355
410,800 1,087,084 1,507,275 60,830 559,069 624,058 7,478,650 8,201,396 89,496,307
(2,084,039) (974,633) (2,532,700)
348,000 3,597 397,761 — 1,381,184 1,381,184 496,421 — 519,983 1,979,919 3,419,043 11,407,677 (784,515) (2,495,719) (9,335,147) — (1,381,184) (1,381,184) 2,039,825 926,921 2,990,274 (44,214) (47,712) 457,574 1,742,580 2,851,648 20,121,648
$ 1,698,366 $ 2,803,936 $ 20,579,222
2020 STATE OF FLORIDA CAFR
37

RECONCILIATION OF THE STATEMENT OF REVENUES, EXPENDITURES, AND CHANGESIN FUND BALANCES OF GOVERNMENTAL FUNDS TO THE STATEMENT OF ACTIVITIES
FOR THE FISCAL YEAR ENDED JUNE 30, 2020 (in thousands)
Net change in fund balance - total governmental funds $ 457,574
Internal service funds are used by management to charge the costs of goods or services to other funds and agencies within the state. Therefore, the net revenue (expense) of the internal service funds is reported with governmental activities. 190,695
Governmental funds report capital outlays as expenditures. However, in the Statement of Activities the cost of these assets is allocated over the estimated useful lives of the assets and reported as depreciation expense.This is the amount by which capital outlay expenditures exceeded depreciation in the current period.
Capital outlay expenditures 3,128,352 Capital asset transfers, net (302,371) Depreciation expense (285,170)
2,540,811
In the Statement of Activities, the gain or (loss) on the sale of assets is reported whereas in the governmental funds only the proceeds from the sale increase financial resources. Thus, the change in net position differs from the change in fund balances by the cost of the assets sold. 50,915
In the Statement of Activities, some revenues are recognized that do not provide current financial resources and are not recognized as revenues in the governmental funds until available, i.e., deferred inflows of resources, unavailable revenue. 26,748
Some expenses reported in the Statement of Activities do not require the use of current financial resources and, therefore, are not reported as expenditures in governmental funds.
Increase in compensated absences (23,892) Decrease in accrued interest 7,043 Decrease in claims payable 181,675 Increase in other postemployment benefits (350,448) Increase in net pension related items (1,008,912) Decrease in due to other governments 19,720 Increase in other liabilities (4,440)
(1,179,254)
The incurrence of long-term debt (e.g., bonds and leases) provides current financial resources to governmental funds, while the repayments of the principal of long-term debt consumes the current financial resources of governmental funds. Neither transaction has any effect on net position. Also, governmental funds report the effect of premiums, discounts, deferred amounts on refundings when debt is issued, whereas these amounts are deferred and amortized in the Statement of Activities.
Bond proceeds (397,761) Refunding bond proceeds (1,381,184) Financing agreement proceeds (519,983) Repayment of bonds 1,083,737 Repayment of capital leases/installment purchase contracts 423,537 Payment to refunded bond escrow agent 1,381,184 Amortization of bond premium 195,718 Amortization of amount deferred on refunding of debt (7,921) Accrued interest payable at refunding (18,411)
758,916
Change in net position of governmental activities $ 2,846,405
The notes to the financial statements are an integral part of this statement.
2020 STATE OF FLORIDA CAFR
38

THIS PAGE INTENTIONALLY LEFT BLANK
39

PROPRIETARY FUND FINANCIAL STATEMENTS
Major Funds
TRANSPORTATIONThis fund primarily accounts for operations of the Florida Turnpike Enterprise which includes the Florida Turnpike System.
LOTTERYThis fund accounts for state lottery operations, which include sale of lottery tickets, payment of lottery prizes, and transfers to the Education Enhancement Trust Fund.
FLORIDA HURRICANE CATASTROPHE FUNDThis fund, administered by the State Board of Administration, is used to help cover insurers’ losses in the event of a hurricane disaster.
PREPAID COLLEGE PROGRAMThis fund, administered by the State Board of Administration, is used to account for payments from purchasers of the Florida Prepaid College Program, a blended component unit. This program was created to provide a medium through which the cost of state post-secondary education may be paid in advance of enrollment at a rate lower than the projected corresponding costs at the time of enrollment.
REEMPLOYMENT ASSISTANCEThis fund accounts for the receipt of monies for and payment of unemployment compensation benefits.
Nonmajor Funds
Nonmajor enterprise funds are presented on page 245.
Internal Service Funds
Internal service funds are presented on page 251.
2020 STATE OF FLORIDA CAFR
40

THIS PAGE INTENTIONALLY LEFT BLANK
41
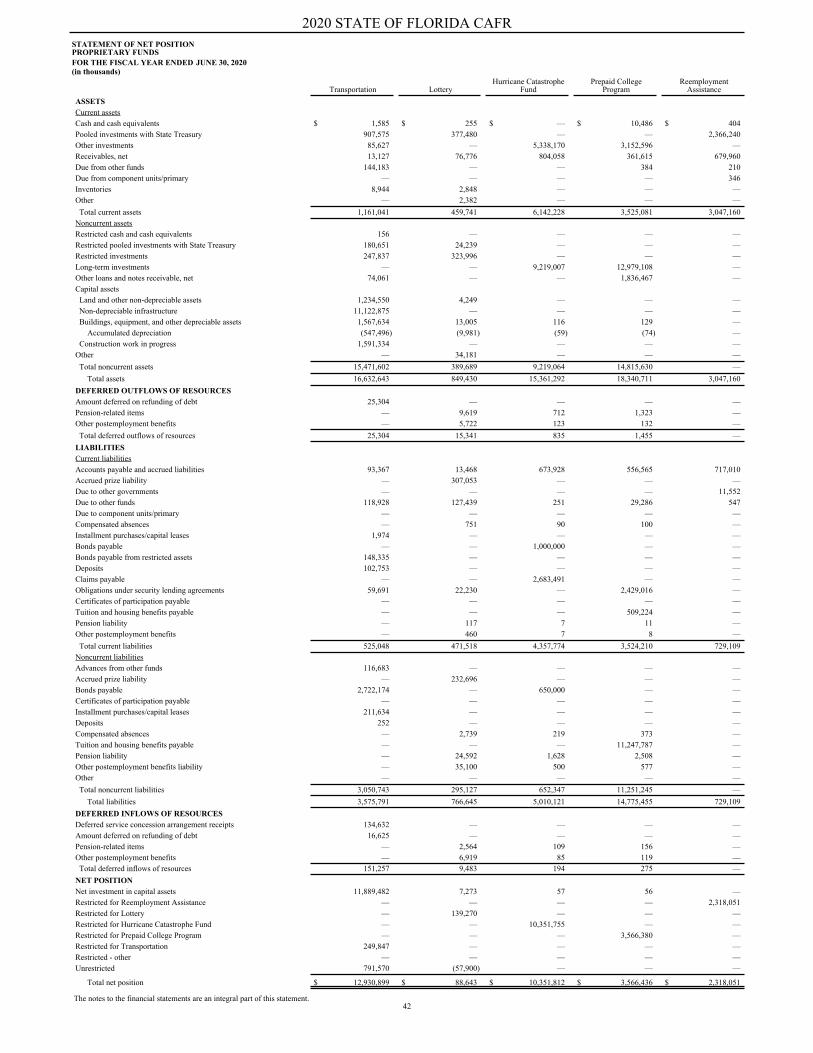
STATEMENT OF NET POSITIONPROPRIETARY FUNDSFOR THE FISCAL YEAR ENDED JUNE 30, 2020 (in thousands)
Transportation LotteryHurricane Catastrophe
FundPrepaid College
ProgramReemployment
AssistanceASSETSCurrent assetsCash and cash equivalents $ 1,585 $ 255 $ — $ 10,486 $ 404 Pooled investments with State Treasury 907,575 377,480 — — 2,366,240 Other investments 85,627 — 5,338,170 3,152,596 — Receivables, net 13,127 76,776 804,058 361,615 679,960 Due from other funds 144,183 — — 384 210 Due from component units/primary — — — — 346 Inventories 8,944 2,848 — — — Other — 2,382 — — — Total current assets 1,161,041 459,741 6,142,228 3,525,081 3,047,160 Noncurrent assetsRestricted cash and cash equivalents 156 — — — — Restricted pooled investments with State Treasury 180,651 24,239 — — — Restricted investments 247,837 323,996 — — — Long-term investments — — 9,219,007 12,979,108 — Other loans and notes receivable, net 74,061 — — 1,836,467 — Capital assets Land and other non-depreciable assets 1,234,550 4,249 — — — Non-depreciable infrastructure 11,122,875 — — — — Buildings, equipment, and other depreciable assets 1,567,634 13,005 116 129 — Accumulated depreciation (547,496) (9,981) (59) (74) — Construction work in progress 1,591,334 — — — — Other — 34,181 — — — Total noncurrent assets 15,471,602 389,689 9,219,064 14,815,630 — Total assets 16,632,643 849,430 15,361,292 18,340,711 3,047,160 DEFERRED OUTFLOWS OF RESOURCESAmount deferred on refunding of debt 25,304 — — — — Pension-related items — 9,619 712 1,323 — Other postemployment benefits — 5,722 123 132 — Total deferred outflows of resources 25,304 15,341 835 1,455 — LIABILITIESCurrent liabilitiesAccounts payable and accrued liabilities 93,367 13,468 673,928 556,565 717,010 Accrued prize liability — 307,053 — — — Due to other governments — — — — 11,552 Due to other funds 118,928 127,439 251 29,286 547 Due to component units/primary — — — — — Compensated absences — 751 90 100 — Installment purchases/capital leases 1,974 — — — — Bonds payable — — 1,000,000 — — Bonds payable from restricted assets 148,335 — — — — Deposits 102,753 — — — — Claims payable — — 2,683,491 — — Obligations under security lending agreements 59,691 22,230 — 2,429,016 — Certificates of participation payable — — — — — Tuition and housing benefits payable — — — 509,224 — Pension liability — 117 7 11 — Other postemployment benefits — 460 7 8 — Total current liabilities 525,048 471,518 4,357,774 3,524,210 729,109 Noncurrent liabilitiesAdvances from other funds 116,683 — — — — Accrued prize liability — 232,696 — — — Bonds payable 2,722,174 — 650,000 — — Certificates of participation payable — — — — — Installment purchases/capital leases 211,634 — — — — Deposits 252 — — — — Compensated absences — 2,739 219 373 — Tuition and housing benefits payable — — — 11,247,787 — Pension liability — 24,592 1,628 2,508 — Other postemployment benefits liability — 35,100 500 577 — Other — — — — — Total noncurrent liabilities 3,050,743 295,127 652,347 11,251,245 — Total liabilities 3,575,791 766,645 5,010,121 14,775,455 729,109 DEFERRED INFLOWS OF RESOURCESDeferred service concession arrangement receipts 134,632 — — — — Amount deferred on refunding of debt 16,625 — — — — Pension-related items — 2,564 109 156 — Other postemployment benefits — 6,919 85 119 — Total deferred inflows of resources 151,257 9,483 194 275 — NET POSITIONNet investment in capital assets 11,889,482 7,273 57 56 — Restricted for Reemployment Assistance — — — — 2,318,051 Restricted for Lottery — 139,270 — — — Restricted for Hurricane Catastrophe Fund — — 10,351,755 — — Restricted for Prepaid College Program — — — 3,566,380 — Restricted for Transportation 249,847 — — — — Restricted - other — — — — — Unrestricted 791,570 (57,900) — — —
Total net position $ 12,930,899 $ 88,643 $ 10,351,812 $ 3,566,436 $ 2,318,051
The notes to the financial statements are an integral part of this statement.
2020 STATE OF FLORIDA CAFR
42

SITIONPROPRIETARY FDSJ
Nonmajor EnterpriseFunds Totals 6/30/20
Internal ServiceFunds
$ 33,426 $ 46,156 $ 11,901 397,272 4,048,567 819,477 14,318 8,590,711 44,295 31,966 1,967,502 77,185 11,336 156,113 26,580 154 500 1,368 1 11,793 — 1,353 3,735 — 489,826 14,825,077 980,806
— 156 — — 204,890 — — 571,833 — 60,022 22,258,137 — 3,149 1,913,677 —
— 1,238,799 314 — 11,122,875 — 326,323 1,907,207 1,582,728 (81,412) (639,022) (656,383) 14,876 1,606,210 26,437 4,497 38,678 — 327,455 40,223,440 953,096 817,281 55,048,517 1,933,902
— 25,304 3,414 45,625 57,279 38,094 33,783 39,760 17,646 79,408 122,343 59,154
41,028 2,095,366 223,194 — 307,053 — — 11,552 — 9,186 285,637 14,311 431 431 — 6,040 6,981 2,248 773 2,747 2,344 — 1,000,000 15,710 — 148,335 — 19,300 122,053 220,036 — 2,683,491 — 18,598 2,529,535 37,137 — — 27,150 — 509,224 — 711 846 365 2,512 2,987 1,327 98,579 9,706,238 543,822
— 116,683 500 — 232,696 — — 3,372,174 158,838 — — 292,852 7,444 219,078 3,248 166,519 166,771 — 15,956 19,287 9,749 — 11,247,787 — 122,584 151,312 96,713 191,748 227,925 101,278 1,449 1,449 — 505,700 15,755,162 663,178 604,279 25,461,400 1,207,000
— 134,632 — — 16,625 7,253 13,174 16,003 11,616 40,906 48,029 26,643 54,080 215,289 45,512
125,171 12,022,039 454,707 — 2,318,051 — — 139,270 — — 10,351,755 — — 3,566,380 — — 249,847 — 2,132 2,132 53,538 111,027 844,697 232,299
$ 238,330 $ 29,494,171 $ 740,544
2020 STATE OF FLORIDA CAFR
43

STATEMENT OF REVENUES, EXPENSES, AND CHANGES IN FUND NET POSITIONPROPRIETARY FUNDSFOR THE FISCAL YEAR ENDED JUNE 30, 2020 (in thousands)
Transportation Lottery
HurricaneCatastrophe
FundPrepaid College
ProgramOPERATING REVENUESSales - nonstate $ 15,239 $ 7,510,911 $ 1,130,110 $ (265,597) Change in actuarial value of contract premiums — — — (305,864) Fees 1,096,977 — — 1,481 Sales - state — — 43 225 Rents and royalties - nonstate 8,773 560 — — Rents - state — — — — Fines, forfeits, settlements and judgments 433 156 — — Other — — — — Total operating revenues 1,121,422 7,511,627 1,130,153 (569,755)
OPERATING EXPENSESBenefit payments — — — — Payment of lottery winnings — 5,030,240 — — Commissions on lottery sales — 420,843 — — Contractual services 592,156 150,843 3,940 394,899 Change in actuarial value of contract benefit payments — — 1,499,999 464,118 Insurance claims expense — — — — Personal services 19,341 33,047 2,046 2,823 Depreciation 100,334 857 13 24 Materials and supplies 20,774 571 20 71 Repairs and maintenance — 679 — — Basic services — 4,616 163 185 Interest and fiscal charges — — — 51 Total operating expenses 732,605 5,641,696 1,506,181 862,171 Operating income (loss) 388,817 1,869,931 (376,028) (1,431,926)
NONOPERATING REVENUES (EXPENSES)Grants and donations — — — — Investment earnings (losses) 68,227 59,700 501,508 1,333,827 Interest and fiscal charges (113,607) (11,584) (50,536) (33,119) Fines, forfeits, judgments and settlements 563 — 2,130 479 Property disposition gain (loss) 1,034 (16) — — Grant expense and client benefits — — — — Other — — — — Total nonoperating revenues (expenses) (43,783) 48,100 453,102 1,301,187 Income (loss) before transfers and contributions 345,034 1,918,031 77,074 (130,739) Operating transfers in 84,704 — — — Operating transfers out (101,008) (1,913,951) (13,500) (3,644) Capital contributions 302,342 — — — Change in net position 631,072 4,080 63,574 (134,383) Total net position - beginning, as restated (Note 1) 12,299,827 84,563 10,288,238 3,700,819 Total net position - ending $ 12,930,899 $ 88,643 $ 10,351,812 $ 3,566,436
The notes to the financial statements are an integral part of this statement.
2020 STATE OF FLORIDA CAFR
44
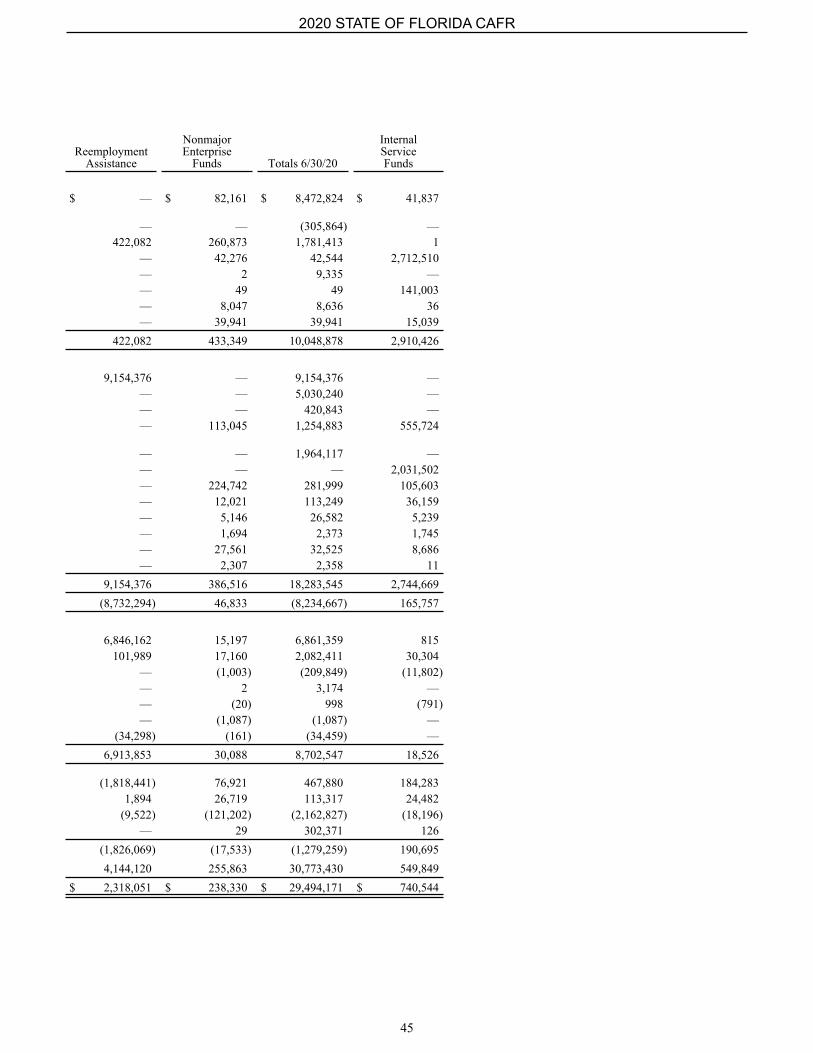
ReemploymentAssistance
NonmajorEnterprise
Funds Totals 6/30/20
InternalServiceFunds
$ — $ 82,161 $ 8,472,824 $ 41,837
— — (305,864) — 422,082 260,873 1,781,413 1 — 42,276 42,544 2,712,510 — 2 9,335 — — 49 49 141,003 — 8,047 8,636 36 — 39,941 39,941 15,039 422,082 433,349 10,048,878 2,910,426
9,154,376 — 9,154,376 — — — 5,030,240 — — — 420,843 — — 113,045 1,254,883 555,724
— — 1,964,117 — — — — 2,031,502 — 224,742 281,999 105,603 — 12,021 113,249 36,159 — 5,146 26,582 5,239 — 1,694 2,373 1,745 — 27,561 32,525 8,686 — 2,307 2,358 11 9,154,376 386,516 18,283,545 2,744,669 (8,732,294) 46,833 (8,234,667) 165,757
6,846,162 15,197 6,861,359 815 101,989 17,160 2,082,411 30,304 — (1,003) (209,849) (11,802) — 2 3,174 — — (20) 998 (791) — (1,087) (1,087) — (34,298) (161) (34,459) — 6,913,853 30,088 8,702,547 18,526
(1,818,441) 76,921 467,880 184,283 1,894 26,719 113,317 24,482 (9,522) (121,202) (2,162,827) (18,196) — 29 302,371 126 (1,826,069) (17,533) (1,279,259) 190,695 4,144,120 255,863 30,773,430 549,849 $ 2,318,051 $ 238,330 $ 29,494,171 $ 740,544
2020 STATE OF FLORIDA CAFR
45

STATEMENT OF CASH FLOWSPROPRIETARY FUNDSFOR THE FISCAL YEAR ENDED JUNE 30, 2020 (in thousands)
Transportation Lottery
HurricaneCatastrophe
FundCASH FLOWS FROM OPERATING ACTIVITIES Cash received from customers $ 1,165,148 $ 7,490,092 $ 1,122,282 Cash paid to vendors (579,483) (575,701) (4,206) Cash paid to employees (20,162) (28,313) (1,730) Cash received/(paid) for grants — — — Lottery prizes — (4,914,226) — Cash paid for insurance claims — — (2,266,595) Reemployment assistance — — — Net cash provided (used) by operating activities 565,503 1,971,852 (1,150,249)
CASH FLOWS FROM NONCAPITAL FINANCING ACTIVITIESTransfers in (out) (14,989) (1,862,023) (13,500) Advances from or repayment from other funds 16,823 — — Advances, grants or loans (to) from or repayment from others (69,073) — (24) Payment of bonds or loans (principal and interest) — — (603,045) Cash received from noncapital grants or donations — — —
Net cash provided (used) by noncapital financing activities (67,239) (1,862,023) (616,569)
CASH FLOWS FROM CAPITAL AND RELATED FINANCING ACTIVITIESCash received from sale or lease of capital assets — — — Cash received from the issuance of debt 190,386 — — Cash received from capital grants and donations — — — Payment of bond principal (140,245) — — Payment of interest on bonds/installment purchase/capital lease (132,260) — — Purchase or construction of capital assets (701,157) (739) (12) Line of credit draws/(payments) — — —
Net cash provided (used) by capital and related financing activities (783,276) (739) (12) CASH FLOWS FROM INVESTING ACTIVITIES Security lending 1,360 22,230 — Proceeds from the sale or maturity of investments 3,376,327 22,297 44,190,659 Cash paid to grand prize winners upon maturity of grand prize investments — (22,297) — Investment earnings 69,711 20,767 267,893 Purchase of investments (3,404,587) (11,770) (42,691,722) Net cash provided (used) by investing activities 42,811 31,227 1,766,830 Net increase (decrease) in cash and cash equivalents (242,201) 140,317 — Cash and cash equivalents - beginning 1,332,168 261,657 — Cash and cash equivalents - ending $ 1,089,967 $ 401,974 $ —
The notes to the financial statements are an integral part of this statement.
2020 STATE OF FLORIDA CAFR
46

(in thousands)
Prepaid CollegeProgram
ReemploymentAssistance
NonmajorEnterprise
Funds Totals 6/30/20
InternalServiceFunds
$ 462,708 $ 400,195 $ 392,572 $ 11,032,997 $ 2,927,565 (807,723) — (156,148) (2,123,261) (576,493) (2,339) — (195,834) (248,378) (91,159) — — 31,074 31,074 — — — — (4,914,226) — — — — (2,266,595) (2,032,153) — (9,051,763) — (9,051,763) — (347,354) (8,651,568) 71,664 (7,540,152) 227,760
(3,644) (7,609) (95,671) (1,997,436) 5,664 — — (1,111) 15,712 (25,315) — — — (69,097) — — — — (603,045) — — 6,846,162 646 6,846,808 —
(3,644) 6,838,553 (96,136) 4,192,942 (19,651)
— — — — 434 — — — 190,386 — — — 6,725 6,725 — — — (7,113) (147,358) (51,965) — — — (132,260) (10,857) (8) — (9,128) (711,044) (23,421) — — (1,574) (1,574) —
(8) — (11,090) (795,125) (85,809)
6,019 — 3,570 33,179 13,605 20,391,954 — 128,479 68,109,716 —
— — — (22,297) — 175,202 101,989 16,904 652,466 29,725 (20,219,851) — (126,834) (66,454,764) — 353,324 101,989 22,119 2,318,300 43,330 2,318 (1,711,026) (13,443) (1,824,035) 165,630 8,168 4,077,670 444,141 6,123,804 665,748 $ 10,486 $ 2,366,644 $ 430,698 $ 4,299,769 $ 831,378
2020 STATE OF FLORIDA CAFR
47

STATEMENT OF CASH FLOWSPROPRIETARY FUNDSFOR THE FISCAL YEAR ENDED JUNE 30, 2020 (in thousands)Reconciliation of operating income (loss) to net cash
provided (used) by operating activities
Transportation Lottery
HurricaneCatastrophe
FundOperating income (loss) $ 388,817 $ 1,869,931 $ (376,028)
Adjustment to reconcile operating income (loss) to net cash provided (used) by operating activities: Depreciation and amortization expense 100,334 857 13
Changes in assets and liabilities: (Increase) decrease in accounts receivable 29,738 (22,831) (2,003) (Increase) decrease in due from other funds (3,145) — — Increase (decrease) in allowance for uncollectibles — 1,296 (562) (Increase) decrease in inventories (2,643) (1,639) — (Increase) decrease in future contract premiums and other receivables — — — (Increase) decrease in other noncurrent assets — (435) — Increase (decrease) in accounts payable 19,657 3,490 (5,348) Increase (decrease) in compensated absences — (124) 51 Increase (decrease) in due to other funds 31,664 — — Increase (decrease) in tuition and housing benefits payable — — — Increase (decrease) in other noncurrent liability — — — (Increase) decrease in deposits and prepaid items — — 6 Increase (decrease) in unearned revenue 1,081 — — Increase (decrease) in prize liability — 116,449 — Increase (decrease) in pension liability and deferrals — — 237 Increase (decrease) in OPEB liability and deferrals — 1,511 27 Increase (decrease) in claims payable — 3,347 (766,642)
Net cash provided (used) by operating activities $ 565,503 $ 1,971,852 $ (1,150,249)
Noncash investing, capital, and financing activities Borrowing under capital lease or installment purchase $ 36,058 $ — $ — Change in fair value of investments 14,620 39,324 79,835 Contribution of capital assets 6,062 — — Other noncash items 71,174 — —
The notes to the financial statements are an integral part of this statement.
2020 STATE OF FLORIDA CAFR
48

STATEMENT OF CASH FLOWSPROPRIETARY FUNDSFOR THE FISCAL YEAR ENDED JUNE 30, 2020 (in thousands)Reconciliation of operating income (loss) to net cash
provided (used) by operating activities
Prepaid CollegeProgram
ReemploymentAssistance
NonmajorEnterprise
FundsTotals
6/30/20
InternalServiceFunds
$ (1,431,926) $ (8,732,294) $ 46,833 $ (8,234,667) $ 165,757
24 — 12,021 113,249 36,159
17,531 (626,320) 23,103 (580,782) (26,129) 2,772 — (8,642) (9,015) (569) — 5,142 (22,938) (17,062) 338 — — 1 (4,281) — 305,864 — 22 305,886 — — — 527 92 — 268,418 701,824 (1,831) 986,210 (8,343) 72 — 2,101 2,100 (299) 25,312 80 (217) 56,839 601 464,118 — — 464,118 — — — 276 276 — — — (113) (107) — — — (3,283) (2,202) 42,691 — — — 116,449 — 435 — 15,840 16,512 14,113 26 — 7,964 9,528 3,441 — — — (763,295) — $ (347,354) $ (8,651,568) $ 71,664 $ (7,540,152) $ 227,760
$ — $ — $ — $ 36,058 $ — 490,259 — (128) 623,910 11,912 — — 135,927 141,989 — — — — 71,174 —
2020 STATE OF FLORIDA CAFR
49

FIDUCIARY FUND FINANCIAL STATEMENTS
PRIVATE-PURPOSE TRUST FUNDSIndividual fund descriptions and financial statements begin on page 259.
PENSION AND OTHER EMPLOYEE BENEFITS TRUST FUNDSIndividual fund descriptions and financial statements begin on page 265.
INVESTMENT TRUST FUNDSIndividual fund descriptions and financial statements begin on page 271.
AGENCY FUNDSIndividual fund descriptions and financial statements begin on page 275.
2020 STATE OF FLORIDA CAFR
50

STATEMENT OF FIDUCIARY NET POSITIONFIDUCIARY FUNDSFOR THE FISCAL YEAR ENDED JUNE 30, 2020 (in thousands)
Private-Purpose
Trust Funds
Pension andOther Employee
BenefitsTrust Funds
InvestmentTrust Funds
AgencyFunds
Totals 6/30/20
ASSETSCash and cash equivalents $ 5,955 $ 93,021 $ 1,776,700 $ 66,388 $ 1,942,064 Pooled investments with State Treasury 689,305 184,902 827,544 945,719 2,647,470 Total cash and cash equivalents 695,260 277,923 2,604,244 1,012,107 4,589,534 InvestmentsCertificates of deposit — — 2,671,483 — 2,671,483 U.S. government & federally guaranteed obligations 35,465 14,927,086 1,250,934 37,414 16,250,899 Federal agencies 62,477 8,293,660 — — 8,356,137 Commercial paper — 1,127,836 5,580,276 — 6,708,112 Repurchase agreements — 800,000 1,447,681 — 2,247,681 Bonds and notes 119,630 11,169,224 31,257 — 11,320,111 International bonds and notes 13,185 2,474,291 — — 2,487,476 Real estate contracts — 11,996,483 — — 11,996,483 Mutual fund investments 403,311 11,387,389 — — 11,790,700 Money market and short-term investments 122,568 1,680,114 715,976 — 2,518,658 Domestic equity 100,861 48,832,803 — — 48,933,664 Alternative investments — 28,780,594 — — 28,780,594 International equity 8,977 31,158,211 — — 31,167,188 International equity commingled — 7,089,845 — — 7,089,845 Deferred compensation annuities — 14,270 — — 14,270 Self-directed brokerage investments — 817,186 — — 817,186 Other investments — 15,838 — 200 16,038 Total investments 866,474 180,564,830 11,697,607 37,614 193,166,525 ReceivablesAccounts receivable 11,533 22,075 — 713,204 746,812 State contributions receivable — 666 — — 666 Nonstate contributions receivable — 337,082 — — 337,082 Interest receivable 4,989 138,402 4,354 955 148,700 Dividends receivable 363 209,099 — — 209,462 Pending investment sales 8,954 1,127,239 — — 1,136,193 Foreign currency contracts receivable — 97,986 — — 97,986 Due from state funds 29,496 68,263 — 254,481 352,240 Due from other governments 4,970 — — — 4,970 Total receivables 60,305 2,000,812 4,354 968,640 3,034,111 Security lending collateral — 1,830,474 — — 1,830,474 Advances to other funds 986,684 — — — 986,684 Advances to other entities 41,296 — — — 41,296 Capital assets 12,450 1,337 — — 13,787 Accumulated depreciation (256) (711) — — (967) Other assets 2,080 5,346 21 — 7,447 Total assets 2,664,293 184,680,011 14,306,226 2,018,361 203,668,891 DEFERRED OUTFLOWS OF RESOURCESPension-related items 2,058 134 — — 2,192 Other postemployment benefits 980 2,664 — — 3,644 Total deferred outflows of resources 3,038 2,798 — — 5,836 LIABILITIESAccounts payable and accrued liabilities 42,572 183,781 745 757,086 984,184 Due to other funds 1,238 77,231 110 254,801 333,380 DROP — 298,096 — — 298,096 Pending investment purchases 38,962 3,756,587 176,328 — 3,971,877 Short sell obligations — 64,604 — — 64,604 Foreign currency contracts payable — 98,021 — — 98,021 Broker rebate fees — 58 — — 58 Due to other governments 1,447 — — 714,629 716,076 Obligations under security lending agreements 35,799 1,848,298 46,272 15,979 1,946,348 Claims payable — — — 17,212 17,212 Deposits payable 35,202 42,177 — 258,494 335,873 Compensated absences 673 1,137 — — 1,810 Other liabilities — — — 160 160 Pension liability 2,848 364 — — 3,212 Other postemployment benefits liability 5,580 15,123 — — 20,703 Total liabilities 164,321 6,385,477 223,455 2,018,361 8,791,614 DEFERRED INFLOWS OF RESOURCESPension-related items 238 211 — — 449 Other postemployment benefits 1,111 3,659 — — 4,770 Total deferred inflows of resources 1,349 3,870 — — 5,219 NET POSITION
Restricted for pension benefits and other purposes $ 2,501,661 $ 178,293,462 $ 14,082,771 $ — $ 194,877,894
The notes to the financial statements are an integral part of this statement.
2020 STATE OF FLORIDA CAFR
51

STATEMENT OF CHANGES IN FIDUCIARY NET POSITIONFIDUCIARY FUNDSFOR THE FISCAL YEAR ENDED JUNE 30, 2020 (in thousands)
Private-Purpose
Trust Funds
Pension andOther Employee
BenefitsTrust Funds
InvestmentsTrust Funds
Totals 6/30/20
ADDITIONSContributions and other depositsPension fund employer contributions - state $ — $ 735,927 $ — $ 735,927 Pension fund employer contributions - nonstate — 3,664,610 — 3,664,610 Pension fund employee contributions — 1,082,588 — 1,082,588 Other contributions — 185,725 — 185,725 Purchase of time by employees — 4,341 — 4,341 Fees 1,400 1,874 — 3,274 Grants and contributions 151,866 — — 151,866 Flexible benefits contributions — 264,973 — 264,973 Fines, forfeits, settlements and judgments 264 6 291 561 Unclaimed property remittances 503,173 — — 503,173 Receivership assets acquired 110,150 — — 110,150 Transfers in from state funds 5,038 665,247 — 670,285 Total contributions and other deposits 771,891 6,605,291 291 7,377,473 Investment incomeInterest income 37,888 1,449,426 248,905 1,736,219 Dividends 8,053 1,767,095 — 1,775,148 Other investment income (loss) — 2,292,632 — 2,292,632 Net increase (decrease) in fair market value 9,294 950,823 362 960,479 Total investment income (loss) 55,235 6,459,976 249,267 6,764,478 Investment activity expense (3,126) (619,673) (4,774) (627,573) Net income (loss) from investing activity 52,109 5,840,303 244,493 6,136,905 Security lending activitySecurity lending income — 38,259 — 38,259 Security lending expense — (10,684) — (10,684) Net income from security lending — 27,575 — 27,575 Total net investment income (loss) 52,109 5,867,878 244,493 6,164,480 Other additions 3,018 20,721 — 23,739 Total additions 827,018 12,493,890 244,784 13,565,692 DEDUCTIONSBenefit payments — 12,900,838 — 12,900,838 Insurance claims expense 6,368 7,436 — 13,804 Supplemental insurance payments — 92,997 — 92,997 Flexible reimbursement payments — 26,395 — 26,395 Life insurance premium payments — 33,902 — 33,902 Remittances to annuity companies — 212,447 — 212,447 Program contribution refunds — 18,888 — 18,888 Interest expense 703 2 — 705 Student loan default payments 53,464 — — 53,464 Payments to unclaimed property claimants 321,914 — — 321,914 Distribution to State School Fund 130,289 — — 130,289 Administrative expense 23,930 27,138 51 51,119 Transfers out to state funds 2,814 696,777 — 699,591 Other deductions 55,369 13 — 55,382 Total deductions 594,851 14,016,833 51 14,611,735 Depositor activityDeposits 196,845 — 26,864,146 27,060,991 Withdrawals (46,706) — (24,925,127) (24,971,833) Excess (deficiency) of deposits over withdrawals 150,139 — 1,939,019 2,089,158 Change in net position 382,306 (1,522,943) 2,183,752 1,043,115 Net position - beginning 2,119,355 179,816,405 11,899,019 193,834,779 Net position - ending $ 2,501,661 $ 178,293,462 $ 14,082,771 $ 194,877,894
The notes to the financial statements are an integral part of this statement.
2020 STATE OF FLORIDA CAFR
52

THIS PAGE INTENTIONALLY LEFT BLANK
53

COMPONENT UNIT FINANCIAL STATEMENTS
Major Component Units
FLORIDA HOUSING FINANCE CORPORATIONPursuant to Section 420.504, Florida Statutes, this corporation was created as an entrepreneurial public corporation organized to provide and promote public welfare by administering the governmental function of financing or refinancing housing and related facilities in Florida.
UNIVERSITY OF FLORIDAUniversity of Florida is a major, public, comprehensive, land-grant, research university with a main campus location in Gainesville, Florida.
CITIZENS PROPERTY INSURANCE CORPORATIONPursuant to Section 627.351(6), Florida Statutes, this corporation was created to provide certain residential property, non-residential property, and casualty insurance coverage to qualified risks in the State of Florida under specified circumstances.
Nonmajor Component UnitsNonmajor component units are presented beginning on page 281.
2020 STATE OF FLORIDA CAFR
54

THIS PAGE INTENTIONALLY LEFT BLANK
55

STATEMENT OF NET POSITIONCOMPONENT UNITSFOR THE FISCAL YEAR ENDED JUNE 30, 2020 (in thousands)
FloridaHousingFinance
Corporation
Universityof
Florida
CitizensPropertyInsurance
Corporation
NonmajorComponent
Units Totals 6/30/20ASSETSCash and cash equivalents $ 201,360 $ 537,318 $ 503,327 $ 1,073,234 $ 2,315,239 Pooled investments with State Treasury 983,742 888,897 — 1,775,932 3,648,571 Other investments 1,795,800 1,637,415 8,538,881 5,386,101 17,358,197 Receivables, net 188,552 715,354 230,628 959,589 2,094,123 Due from component units/primary — 106,881 — 451,818 558,699 Inventories — 80,178 — 37,259 117,437 Restricted cash and cash equivalents — 54,131 8,534 495,384 558,049 Restricted pooled investments with State Treasury — 211,567 — 667,469 879,036 Restricted investments — 2,833,104 — 4,188,043 7,021,147 Other loans and notes receivable, net 2,202,197 23,486 — 98,218 2,323,901 Other assets 1,878 295,796 31,241 390,601 719,516 Capital assets, net — 4,147,670 3,854 22,494,428 26,645,952 Total assets 5,373,529 11,531,797 9,316,465 38,018,076 64,239,867 DEFERRED OUTFLOWS OF RESOURCESAccum. decrease in fair value-hedging derivatives — 52,395 — 21,176 73,571 Grants paid in advance — — — 15 15 Amount deferred on refunding of debt — 27,175 — 28,857 56,032 Pension-related items — 323,933 — 1,262,733 1,586,666 Other postemployment benefits — 172,648 — 485,641 658,289 Asset retirement obligations — 8,883 — — 8,883 Total deferred outflows of resources — 585,034 — 1,798,422 2,383,456 LIABILITIESAccounts payable and accrued liabilities 32,024 901,390 772,279 957,643 2,663,336 Due to component units/primary — 33,546 — 42,840 76,386 Long-term liabilities Due within one year 325,129 231,831 1,014,502 685,530 2,256,992 Due in more than one year 2,168,367 3,993,584 1,005,809 10,371,441 17,539,201 Total liabilities 2,525,520 5,160,351 2,792,590 12,057,454 22,535,915 DEFERRED INFLOWS OF RESOURCESDeferred service concession arrangement receipts — — — 114,186 114,186 Grants received in advance — — — 1,535 1,535 Amount deferred on refunding of debt — 2,121 — 240 2,361 Pension-related items — 125,490 — 277,553 403,043 Other postemployment benefits — 226,520 — 369,184 595,704 Irrevocable split-interest agreements — 17,077 — 40,738 57,815 Total deferred inflows of resources — 371,208 — 803,436 1,174,644 NET POSITIONNet investment in capital assets — 2,450,640 3,854 19,861,683 22,316,177 Restricted for Debt service — 4,536 — 38,338 42,874 Other 2,674,469 577,810 8,534 4,813,029 8,073,842 Funds held for permanent endowment Expendable — 542,562 — 488,104 1,030,666 Nonexpendable — 1,425,766 — 2,261,484 3,687,250 Unrestricted 173,540 1,583,958 6,511,487 (507,030) 7,761,955 Total net position $ 2,848,009 $ 6,585,272 $ 6,523,875 $ 26,955,608 $ 42,912,764
The notes to the financial statements are an integral part of this statement.
2020 STATE OF FLORIDA CAFR
56

THIS PAGE INTENTIONALLY LEFT BLANK
57

STATEMENT OF ACTIVITIESCOMPONENT UNITSFOR THE FISCAL YEAR ENDED JUNE 30, 2020 (in thousands)
Program Revenues
Functions/Programs Expenses Charges for
Services
OperatingGrants and
Contributions
CapitalGrants and
Contributions
FloridaHousingFinance
Corporation
Florida Housing Finance Corporation
$ 194,772 $ 259,819 $ — $ — $ 65,047
University of Florida 6,464,824 4,225,924 1,073,015 60,688 — Citizens Property Insurance
Corporation 764,734 617,888 — — — Nonmajor component units 13,796,903 3,535,802 4,263,283 572,683 — Total component units $ 21,221,233 $ 8,639,433 $ 5,336,298 $ 633,371 65,047
General revenuesProperty taxes — Investment earnings (losses) — Gain (loss) on sale of capital assets — Payments from the State of Florida — Miscellaneous 159,900 Contributions to permanent funds — Total general revenues and contributions 159,900 Change in net position 224,947 Net position - beginning, as restated (Note 1) 2,623,062 Net position - ending $ 2,848,009
The notes to the financial statements are an integral part of this statement.
2020 STATE OF FLORIDA CAFR
58

STATEMENT OF ACTIVITIESCOMPONENT UNITSFOR THE FISCAL YEAR ENDED (in thousands)
Net (Expense) Revenue and Changes in Net Position
Universityof
Florida
CitizensPropertyInsurance
Corporation
NonmajorComponent
UnitsTotals
6/30/20
$ — $ — $ — $ 65,047
(1,105,197) — — (1,105,197)
— (146,846) — (146,846) — — (5,425,135) (5,425,135) (1,105,197) (146,846) (5,425,135) (6,612,131)
— — 498,201 498,201 179,817 608,488 456,931 1,245,236 (3,099) — (19,014) (22,113) 803,311 — 3,961,513 4,764,824 226,362 — 653,590 1,039,852 61,457 — 46,228 107,685 1,267,848 608,488 5,597,449 7,633,685 162,651 461,642 172,314 1,021,554 6,422,621 6,062,233 26,783,294 41,891,210 $ 6,585,272 $ 6,523,875 $ 26,955,608 $ 42,912,764
2020 STATE OF FLORIDA CAFR
59

NOTES TO THE FINANCIAL STATEMENTSFOR THE FISCAL YEAR ENDED JUNE 30, 2020
TABLE OF CONTENTS
NOTE PAGE
1 SUMMARY OF SIGNIFICANT ACCOUNTING POLICIES................................................................ 61
2 DEPOSITS AND INVESTMENTS......................................................................................................... 73
3 RECEIVABLES AND PAYABLES........................................................................................................ 115
4 TAXES AND TAX ABATEMENTS....................................................................................................... 119
5 CAPITAL ASSETS.................................................................................................................................. 127
6 PENSIONS AND OTHER POSTEMPLOYMENT BENEFITS............................................................. 130
7 COMMITMENTS AND OPERATING LEASES.................................................................................... 145
8 BONDS PAYABLE AND CERTIFICATES OF PARTICIPATION...................................................... 147
9 INSTALLMENT PURCHASES, CAPITAL LEASES, AND PUBLIC-PRIVATE PARTNERSHIPS.. 158
10 CHANGES IN LONG-TERM LIABILITIES.......................................................................................... 161
11 INTERFUND BALANCES AND TRANSFERS.................................................................................... 165
12 RISK MANAGEMENT............................................................................................................................ 170
13 FLORIDA PREPAID COLLEGE PROGRAM........................................................................................ 172
14 INSURANCE ENTERPRISES................................................................................................................. 173
15 CONTINGENCIES .................................................................................................................................. 177
16 LITIGATION ........................................................................................................................................... 179
17 DEFICIT FUND BALANCE AND NET POSITION.............................................................................. 181
18 SUBSEQUENT EVENTS........................................................................................................................ 182
2020 STATE OF FLORIDA CAFR
60

NOTE 1 - SUMMARY OF SIGNIFICANT ACCOUNTING POLICIES
A. Reporting Entity
The State of Florida’s (the state’s) financial reporting entity includes the primary government (i.e., legislative agencies, the Governor and Cabinet, departments and agencies, commissions and boards of the Executive Branch, and various offices relating to the Judicial Branch) and its component units.
Component units, as defined in Governmental Accounting Standards Board (GASB) Codification Section 2100, Defining the Financial Reporting Entity, and Section 2600, Reporting Entity and Component Unit Presentation and Disclosure, are legally separate organizations for which the elected officials of the state are financially accountable. Financial accountability is the ability of the state to appoint a voting majority of an organization’s governing board and to impose its will upon the organization. When the state does not appoint a voting majority of an organization’s governing body, GASB standards require inclusion in the financial reporting entity if: (1) an organization is fiscally dependent upon the state because its resources are held for the direct benefit of the state or can be accessed by the state and (2) the potential exists for the organization to provide specific financial benefits to, or impose specific financial burdens on the state. In addition, component units can be other organizations for which the nature and significance of their relationship with the state are such that exclusion would cause the state’s financial statements to be misleading.
Blended Component Units
A component unit is reported as blended when either (1) the component unit’s governing body is substantively the same as the governing body of the state, and (a) there is a financial benefit or burden relationship between the governing body of the state and the component unit, or (b) management of the governing body of the state has operational responsibility for the component unit, or (2) the component unit provides services entirely, or almost entirely, to the state or otherwise exclusively, or almost exclusively, benefits the state, or (3) the component unit’s outstanding debt is expected to be repaid entirely or almost entirely with resources of the state.
The following component units provide services entirely or almost entirely to the primary government, or have outstanding debt that is expected to be paid entirely or almost entirely with state resources:
• Career Source Florida, Inc.• Corrections Foundation, Inc.• Florida Board of Governors• Florida Citrus Commission (Department of Citrus)• Florida Clerks of Court Operations Corporation• Florida Commission on Community Service (Volunteer Florida)• Florida Department of Transportation Financing Corporation• Florida Engineers Management Corporation• Florida Intergovernmental Relations Foundation*• Florida Prepaid College Board • Florida School for the Deaf and the Blind• Florida Surplus Lines Service Office• Florida Water Pollution Control Financing Corporation• Inland Protection Financing Corporation• Prescription Drug Monitoring Program Foundation*• Scripps Florida Funding Corporation• Space Florida • State Board of Administration (SBA)• State Board of Education (SBE)• Wireless Emergency Telephone System
Blended component units that are considered major funds are reported in separate columns in the fund financial statements. Other blended component units that are considered non-major funds are reported with other funds in the appropriate columns in the fund financial statements. In addition, the financial data for some blended component units are reported in more than one fund type, some of which are considered major and others that are considered non-major. Refer to Section D of this note for more information on the determination criteria for major funds and a list of major funds and fund types.
* The state’s financial statements do not include amounts relating to these component units. The assets of these component units at June 30, 2020, are approximately $1,481,355.
2020 STATE OF FLORIDA CAFR
61

Discretely Presented Component Units
Component units that are not blended are discretely presented. In the government-wide financial statements, discrete presentation entails reporting component unit financial data in a column separate from the financial data of the state.
In addition, financial data for discretely presented component units that are considered major are reported in separate columns in the basic financial statements for component units. Discretely presented component units that are considered non-major are combined and reported in one column in the component unit financial statements and are aggregated by type in the combining statements. The state’s financial statements are reported for the fiscal year ended June 30, 2020. The state’s component units’ financial statements are reported for the most recent fiscal year for which an audit report is available. Some component units have a fiscal year other than June 30. Accordingly, amounts reported by the state as due from and to component units on the statement of net position may not agree with amounts reported by the component units as due from and to the state. Refer to Section D of this note for more information on major fund determination and presentation. The state’s discretely presented component units are grouped into the following categories:
State Universities and Colleges. State universities and colleges receive funding from the state. The State University System is governed by the Florida Board of Governors. The Florida College System is governed by the State Board of Education. Each university and college is administered by a local board of trustees. All state universities and colleges have a June 30 year-end. Component units included in this category are:
State UniversitiesMajor:
• University of Florida1
Non-major:• Florida Agricultural and Mechanical University• Florida Atlantic University• Florida Gulf Coast University• Florida International University • Florida Polytechnic University • Florida State University• New College of Florida• University of Central Florida• University of North Florida• University of South Florida• University of West Florida
Florida College System Institutions Non-major:• Broward College• Chipola College• College of Central Florida• Daytona State College• Eastern Florida State College• Florida Gateway College• The College of the Florida Keys• Florida State College at Jacksonville• Florida SouthWestern State College• Gulf Coast State College• Hillsborough Community College• Indian River State College• Lake-Sumter State College• Miami Dade College• North Florida College• Northwest Florida State College• Palm Beach State College• Pasco-Hernando State College• Pensacola State College• Polk State College
2020 STATE OF FLORIDA CAFR
62

• Santa Fe College• Seminole State College of Florida• South Florida State College• St. Johns River State College• St. Petersburg College• State College of Florida, Manatee-Sarasota• Tallahassee Community College• Valencia College
1 Significant transactions occurring during the 2019-20 fiscal year between the University of Florida and the state totaled $849 million. These funds represent state appropriated funds to the University of Florida.
Florida Housing Finance Corporation (Major). Pursuant to Section 420.504, Florida Statutes (F.S.), this corporation was created as an entrepreneurial public corporation organized to provide and promote public welfare by administering the governmental function of financing or refinancing housing and related facilities in Florida. This entity has a December 31 year-end. Significant transactions occurring during the 2019-20 fiscal year between the Florida Housing Finance Corporation and the state included revenues of state documentary stamp taxes totaling $340.2 million and transfers to state agencies of $182 million.
Citizens Property Insurance Corporation (Major). Pursuant to Section 627.351(6), F.S., this corporation was created to provide certain residential property and casualty insurance coverage to qualified risks in the state under specified circumstances. This entity has a December 31 year-end. For additional information, refer to Note 14B.
Water Management Districts. Pursuant to Section 373.069, F.S., these districts were created to provide for the management and conservation of water and related land resources. In addition, the general regulatory and administrative functions of these districts are either fully or in part financed by general appropriations. Water management districts have a September 30 year-end. Component units included in this category are:
Non-major:• Northwest Florida Water Management District• St. Johns River Water Management District• South Florida Water Management District• Southwest Florida Water Management District• Suwannee River Water Management District
Other. Additional discretely presented component units of the state include various foundations and not-for-profit organizations. The fiscal year-ends of these component units may vary. Component units included in this category are:
Non-major:• Commission for Florida Law Enforcement Accreditation, Inc.*• Enterprise Florida, Inc.• Florida Agricultural Museum*• Florida Agriculture Center and Horse Park Authority*• Florida Agriculture in the Classroom, Inc.*• Florida Alliance to End Human Trafficking*• Florida Birth-Related Neurological Injury Compensation Plan• Florida Board of Governors Foundation, Inc.*• Florida Concrete Masonry Education Council*• Florida Corrections Accreditation Commission, Inc.*• Florida Education Foundation, Inc.*• Florida Education Fund, Inc.• Florida Fund for Minority Teachers, Inc.*• Florida Healthy Kids Corporation• Florida Is For Veterans, Inc.*• Florida Mobile Home Relocation Corporation*• Florida Patient’s Compensation Fund• Florida State Fair Authority• Florida Telecommunications Relay, Inc.*• Florida Tourism Industry Marketing Corporation, Inc.
2020 STATE OF FLORIDA CAFR
63

• Florida Veterans Foundation, Inc.*• Florida Virtual School• Forestry Arson Alert Association, Inc.*• Friends of Florida State Forests, Inc.*• Higher Educational Facilities Financing Authority• Prison Rehabilitative Industries and Diversified Enterprises, Inc. (PRIDE)• South Florida Regional Transportation Authority• The Florida College System Foundation, Inc.*• The Florida Endowment Foundation for Vocational Rehabilitation, Inc.• Triumph Gulf Coast, Inc.• Wildlife Alert Reward Association*• Wildlife Foundation of Florida, Inc.*
* The state’s financial statements do not include amounts relating to several component units. The assets and revenues relating to these component units totaled $112 million and $31 million, respectively. These amounts represent less than one percent of total aggregate component unit assets and revenues.
Joint Ventures
A joint venture is an organization that results from a contractual arrangement and that is owned, operated, or governed by two or more participants as a separate and specific activity subject to joint control, in which the participants retain (1) an ongoing financial interest or (2) an ongoing financial responsibility. Financial data for the state’s joint ventures are not included in its statements. The state’s joint ventures include the following:
Apalachicola-Chattahoochee-Flint River Basin (ACFRB) Commission. Section 373.69, F.S., provides for the creation of an interstate administrative agency to promote interstate comity, remove causes of present and future controversies, equitably apportion the surface waters of the ACFRB, and engage in water planning. Operational funding required by the Commission is equally shared among the party states.
Board of Control for Southern Regional Education. Section 1000.32, F.S., promotes the development and maintenance of regional education services and facilities in the southern states to provide greater educational advantages and facilities for the citizens in the region. The states established a joint agency called the Board of Control for Southern Regional Education to submit plans and recommendations to the states from time to time for their approval and adoption by appropriate legislative action for the development, establishment, acquisition, operation, and maintenance of educational facilities in the region.
Regional Planning Councils. Sections 186.501 through 186.513, F.S., the “Florida Regional Planning Council Act,” provide for the creation of regional planning agencies to assist local governments in resolving their common problems. The regional planning councils are designated as the primary organizations to address problems and plan solutions that are of greater-than-local concern or scope. Participants in these councils are required by statutes to contribute to the support of these programs.
Southern States Energy Compact. Section 377.711, F.S., enacted this compact into law joining the State of Florida and other states to recognize that the proper employment and conservation of energy, and the employment of energy-related facilities, materials, and products can assist substantially in the industrialization of the South and the development of a balanced economy in the region. The State of Florida appropriates funds to support Florida’s participation in the compact.
Interstate Commission of Nurse Licensure Compact Administrators. Section 464.0095, F.S., enacted this compact into law joining the State of Florida and other states with the general purpose to facilitate the states' responsibility to protect the public's health and safety with regard to nurse licensure and regulation. This compact is additionally purposed with facilitating the exchange of information among party states in the areas of nurse regulation, investigation, and adverse actions, promote compliance with the laws governing the practice of nursing, and decrease redundancies in the consideration and issuance of nurse licenses.
2020 STATE OF FLORIDA CAFR
64

Related Organizations
Organizations for which the state is accountable because the state appoints a voting majority of the board, but for which the state is not financially accountable, are deemed “related organizations.” The state’s related organizations include certain transportation authorities, hospital districts, port authorities, aviation authorities and a financing corporation. The state is not financially accountable for any of these organizations; therefore, applicable financial data is not included in the state’s financial statements.
Contact
Financial statements of the component units that issue separate statements and other financial statement-related information may be obtained from:
Department of Financial Services Bureau of Financial Reporting Statewide Financial Reporting Section200 East Gaines StreetTallahassee, Florida 32399-0364Telephone: (850) 413-5511Department Website: http://www.myfloridacfo.com
Joint ventures may be contacted directly for their financial statements.
B. Basic Financial Statements
The state’s financial statements have been prepared in accordance with generally accepted accounting principles as prescribed by GASB. The basic financial statements of the state, including its component units, are presented in the required format discussed below.
Government-wide Financial Statements
The government-wide financial statements (i.e., the statement of net position and the statement of activities) report information on all of the non-fiduciary activities of the primary government and its component units. Governmental activities, which normally are supported by taxes and intergovernmental revenues, are reported separately from business-type activities, which rely to a significant extent on fees and charges for support. Likewise, the primary government is reported separately from its discretely presented component units.
The statement of activities demonstrates the degree to which the direct expenses of a given function are offset by program revenues. Direct expenses are those that are clearly identifiable to a specific function. Some functions may include administrative overhead that is essentially indirect expenses of other functions. The state currently does not allocate those indirect expenses to other functions. Program revenues include: (1) charges to customers or applicants who purchase, use, or directly benefit from goods, services, or privileges provided by a given function; (2) grants and contributions that are restricted to meeting the operational requirements of a particular function; and (3) grants and contributions that are restricted to meeting the capital requirements of a particular function. Taxes and other items not included in program revenues are reported in general revenues.
Fund Financial Statements
Separate fund financial statements are provided for governmental funds, proprietary funds, and fiduciary funds, even though the latter are excluded from the government-wide financial statements.
C. Basis of Accounting
The government-wide financial statements are reported using the economic resources measurement focus and the accrual basis of accounting, as are the proprietary fund and fiduciary fund financial statements. Revenues are recorded when earned, while expenses are recorded when a liability is incurred, regardless of the timing of related cash flows.
Governmental fund financial statements are reported using the current financial resources measurement focus and the modified accrual basis of accounting. Revenues are recognized as they become susceptible to accrual, generally when they are both measurable and available. Revenues collected within 60 days of the end of the current fiscal year are considered available, with the exception of certain tax revenues, which are considered available when collected within 30 days of year-end. For governmental funds, certain long-term liabilities, such as compensated absences, due within 60 days of the end of the current fiscal year are expected to be liquidated with expendable financial resources and are recognized within the applicable
2020 STATE OF FLORIDA CAFR
65

governmental fund. Expenditures generally are recorded when a liability is incurred, as under accrual accounting. However, expenditures for insurance and similar services extending over more than one fiscal year generally are accounted for as expenditures of the fiscal year of acquisition. Further, principal and interest on general long-term debt are recognized when due.
D. Basis of Presentation
Major Funds
GASB Codification Section 2200, Comprehensive Annual Financial Report, sets forth minimum criteria (percentage of the total assets and deferred outflows of resources, total liabilities and deferred inflows of resources, revenues, or expenditures/expenses for either fund category or the governmental and enterprise funds combined) for the determination of major funds. GASB Codification Section 2200 further requires that the reporting government’s main operating fund (the General Fund) always be reported as a major fund. Major individual governmental funds and major individual enterprise funds are reported as separate columns in the fund financial statements. The non-major funds are combined in a column in the fund financial statements and detailed in the combining statements. The state reports the following major funds:
Major Governmental Funds
General Fund – a fund that accounts for the financial resources of the state, except those required to be accounted for in another fund. This is the state’s primary operating fund.
Natural Resources, Environment, and Growth Management – a special revenue fund that accounts for the operations of various programs such as air pollution control, water quality assurance, ecosystem management, and marine resources conservation. Transfers from other funds, pollutant tax collections, and federal grants are its major sources of revenue. Prior to 6/30/2018, this fund was reported as the Environment, Recreation, and Conservation Fund.
Public Education – a special revenue fund that includes funds used to operate education-related programs. Significant sources of revenue for this fund are federal grants, transfers from the Florida Lottery, and utility taxes.
Health and Family Services – a special revenue fund that includes funds used to operate various health and family service-related programs such as health care, elder affairs, and public assistance. Federal grants are the predominant sources of revenue for this fund.
Transportation – a special revenue fund that accounts for the maintenance and development of the state highway system and other transportation-related projects. It accounts for federal grants, motor fuel and aviation fuel taxes, automobile registration fees, and other revenues that are used for transportation purposes.
Major Business-type Funds
Transportation – an enterprise fund that primarily accounts for operations of Florida’s Turnpike System.
Lottery – an enterprise fund that accounts for state lottery operations, which include sale of lottery tickets, payment of lottery prizes, and transfers to the Educational Enhancement Trust Fund.
Florida Hurricane Catastrophe Fund – an enterprise fund that accounts for operations of the Florida Hurricane Catastrophe Fund, which was created to help cover insurers’ losses in the event of a hurricane disaster.
Prepaid College Program – an enterprise fund that accounts for payments from purchasers of the Florida Prepaid College Program. This program was created to provide a medium through which the cost of state post-secondary education may be paid in advance of enrollment at a rate lower than the projected corresponding costs at the time of enrollment.
Reemployment Assistance – an enterprise fund that accounts for contributions, benefit payments, grants, loans, and investments for the Unemployment Compensation Fund, which was created to pay reemployment assistance benefits to eligible individuals.
2020 STATE OF FLORIDA CAFR
66

Fund Types
Additionally, the state reports the following fund types:
Internal Service Funds
These proprietary-type funds are primarily used to report activities that provide goods or services to other funds or agencies within the state, rather than to the general public. Internal service funds are classified into the following categories:
• Employee Health and Disability – includes funds that account for state employees’ health and disability plans.• Data Centers – includes funds that account for services provided by data processing centers operated by various
agencies.• Communications and Facilities – includes funds that primarily account for services provided by the Department of
Management Services such as those related to the construction, operation, and maintenance of public facilities, and management and operation of the SUNCOM (state communication) Network.
• Other – includes funds that account for services provided to other state agencies such as legal services, records management, and community services (inmate work squads).
Fiduciary Fund Types
Fiduciary funds are used to report assets held in a trustee or agency capacity for others and, therefore, cannot be used to support the state’s own programs.
Private-Purpose Trust Funds – funds that are used to report trust arrangements under which principal and income benefit individuals, private organizations, or other governments including funds accounting for unclaimed property, federally guaranteed higher education loans, contributions to a college savings plan, and various others.
Pension and Other Employee Benefits Trust Funds – funds that are used to report resources that are required to be held in trust for the members and beneficiaries of the state’s pension plans and other employee benefit plans.
Agency Funds – funds that are used to report resources held by the state in a purely custodial capacity. For example, these funds account for asset and liability balances related to retiree health care, taxes collected and held by the Department of Revenue for other entities, and student funds held by the Florida School for the Deaf and the Blind.
Investment Trust Funds – funds that are used to report the external portion of investment pools reported by the state.
E. Assets, Deferred Outflows of Resources, Liabilities, Deferred Inflows of Resources, and Net Position/Fund Balance
Cash and Cash Equivalents
The state’s cash includes cash on hand and on deposit in banks, including demand deposits, certificates of deposit, and time deposits. Most deposits are held by financial institutions qualified as public depositories under Florida law. Cash equivalents are short-term, highly liquid investments. For the purposes of GASB Codification Section 2450, Cash Flows Statements, pooled investments with the State Treasury are considered cash equivalents. Details of deposits are included in Note 2.
Investments
Florida Statutes authorize the state to invest in various instruments. The state reports investments in accordance with GASB Codification Section I50, Investments.
Investments with the State Treasury are reported at fair value which is obtained from independent pricing service providers. Independent pricing service providers use quoted market prices when available and employ various, sometimes proprietary, multifactor models for determining a security’s fair value if it is not available from quoted market prices. Some securities, including U.S. government, municipal bonds, and mortgage-backed and asset-backed securities, are priced using evaluated bid prices. Evaluated bid prices are determined by taking bid prices and adjusting them by an evaluated adjustment factor derived from the independent pricing service’s multifactor model. If values are not available using the above methods, secondary methods such as non-evaluated mid-price and bid price are used. If no source of values is available, cost or last available price from any source is used, or other pricing methodology as directed by the State Treasury.
Investments managed by the State Board of Administration (SBA) are reported in various funds. Investments of the Debt Service Escrowed Fund, which meet the requirements of a legal or in-substance defeasance, are reported at cost. Investments of the Local Government Surplus Funds Trust Fund are reported based on amortized cost. Other investments managed by the
2020 STATE OF FLORIDA CAFR
67

SBA, including those related to the state’s defined benefit and defined contribution pension plans, are reported at fair value at the reporting date.
For SBA-managed investments, fair values are obtained or estimated in accordance with the Global Pricing Guidelines established with the SBA’s custodian, BNY Mellon Bank. BNY Mellon Bank uses a variety of independent pricing vendors and designates certain vendors as the primary source based on asset type, class or issue. BNY Mellon Bank monitors prices supplied by primary sources and may use a supplemental price source or change the primary price source if any of the following occurs:
• The price of a security is not received from the primary price source.• The primary price source no longer prices a particular asset type, class or issue.• The SBA or its portfolio investment manager challenges a price and BNY Mellon Bank reviews the price with the
vendor, who agrees that the price provided by that vendor may not be appropriate.• The price from the primary source exceeds BNY Mellon Bank’s price tolerance checkpoints and results in a vendor
comparison review where another source is deemed to be more appropriate by the BNY Mellon Bank.
When a portfolio includes securities or instruments for which BNY Mellon Bank does not receive fair value information from its vendor price sources, BNY Mellon Bank uses a “non-vendor price source.” Examples include, but are not limited to, limited partnerships or similar private investment vehicles that do not actively trade through established exchange mechanisms; other private placements where there is limited or no information in the market place; and unique fixed income and equity instruments. The SBA does not provide direction regarding the substitution of prices in such instances where securities or instruments are in the portfolio of an investment manager appointed by the SBA. In such cases where the SBA directed the purchase of such securities or instruments, BNY Mellon may obtain the non-vendor prices by contacting the SBA only if it is not commercially reasonable to directly obtain the non-vendor price information from the broker of record, as identified by the SBA.
For private market investments, where no readily ascertainable market value exists (including limited partnerships, hedge funds, directly-owned real estate, and real estate pooled funds), fair values for the individual investments are based on the net asset value (capital account balance) at the closest available reporting period, as communicated by the general partner and/or investment manager, adjusted for subsequent contributions and distributions. The valuation techniques vary based upon investment type and involve a certain degree of judgment. The most significant input into the net asset value of an entity is the value of its investment holdings. The net asset value is provided by the general partner and/or investment manager and reviewed by management.
Annually, the financial statements of all private market investments are audited by independent auditors. Private market investments in which the SBA has a controlling interest are also required to be valued annually by independent, licensed external appraisers selected by an appraisal management company retained by the SBA.
All derivative financial instruments are reported at fair value in the statements of net position. The instruments are adjusted to fair value at least monthly, with valuation changes recognized in investment earnings. Gains and losses are recorded in the statements of changes in net position as “net increase (decrease) in fair market value” during the period.
Because of the inherent uncertainty of the valuation using pricing methodologies other than the quoted market prices, the estimated fair values may differ from the values that would have been used had a ready market existed.
Investment detail is included in Note 2.
Inventories
Inventories primarily consist of expendable supplies. Inventories are recorded according to the consumption method as expenditures when consumed. At the end of the fiscal year, inventory is reported as an asset and identified in fund balance as non-spendable. The method used to determine the cost of inventories varies by agency responsible for the inventories.
Capital Assets
Capital assets are real, personal, and intangible property that have a cost equal to or greater than an established capitalization threshold and have an estimated useful life extending beyond one year. For additional information, refer to Note 5.
Deferred Outflows of Resources
A consumption of net assets by the government that is applicable to a future reporting period is presented as a deferred outflow of resources.
2020 STATE OF FLORIDA CAFR
68

Long-term Liabilities
Refer to Note 6 for information on pension and other postemployment benefit (OPEB) liabilities; Note 8 for information on bonds payable and certificates of participation; Note 9 for information on installment purchases, capital leases, and public-private partnership agreements; and Note 10 for changes in long-term liabilities.
Compensated Absences Liability
Employees earn the right to be compensated during absences for vacation and illness, as well as, for unused special compensatory leave earned for hours worked on legal holidays and other specifically authorized overtime. Compensated absences for annual leave are recorded as a liability when the benefits are earned. Compensated absences for sick leave are calculated based on the vesting method. Within the limits established by law or rule, the value of unused leave benefits will be paid to employees upon separation from state service. The amounts reported for compensated absences are based on current year-end salary rates and include employer Social Security and Medicare tax and pension contributions at current rates.
Deferred Inflows of Resources
A deferred inflow of resources is an acquisition of net assets by the government that is applicable to a future reporting period.
Components of Net Position
The government-wide statement of net position classifies net position into the following categories: (1) net investment in capital assets, (2) restricted, and (3) unrestricted. The “net investment in capital assets” component of net position consists of capital assets, including restricted capital assets, net of accumulated depreciation and reduced by the outstanding balances of any bonds, mortgages, notes, or other borrowings that are attributable to the acquisition, construction, or improvement of those assets. “Restricted” net position is reported when constraints are placed on net position that are either (a) externally imposed by creditors, grantors, contributors, or laws or regulations of other governments, or (b) imposed by law through constitutional provisions or enabling legislation. “Unrestricted” net position consists of net position that does not meet the definition of “restricted” or “net investment in capital assets.” When both restricted and unrestricted resources are to be used for the same purpose, the agency responsible for administering the resources determines the flow assumption used to identify the portion of expenses paid from restricted resources. At June 30, 2020, the government-wide statement of net position reported a restricted net position of $26.7 billion, of which $17.1 billion is restricted by enabling legislation.
Components of Fund Balance
Nonspendable fund balance includes amounts that cannot be spent. This includes activity that is not in a spendable form such as inventories, prepaid amounts, and long-term portion of loans and notes receivable, net, unless the proceeds are restricted, committed or assigned. Additionally, activity that is legally or contractually required to remain intact, such as a principal balance in a permanent fund, is considered to be nonspendable.
Restricted fund balance has constraints placed upon the use of the resources either by an external party, such as the Federal Government, or imposed by law through a constitutional provision or enabling legislation.
Committed fund balance includes amounts that can be used only for the specific purposes determined by a formal action of the state’s highest level of decision-making authority, the Legislature and the Governor, i.e. through legislation passed into law. Commitments may only be modified or rescinded by equivalent formal, highest-level action.
Unassigned fund balance is the residual amount of the General Fund not included in the three categories described above. Also, any remaining deficit fund balances within the other governmental fund types are reported as unassigned.
When an expenditure is incurred for purposes for which both restricted and unrestricted resources are available, it is the state’s general policy to use restricted resources first. When expenditures are incurred for which unrestricted (committed or unassigned) resources are available, and amounts in any of these unrestricted classifications could be used, it is the state’s general policy to spend committed resources first. However, the agency responsible for administering the resources determines the flow assumption used to identify the portion of expenses paid from restricted resources.
2020 STATE OF FLORIDA CAFR
69

Fund Balances Classifications and Special Revenue by Purpose – GASB Codification Section 2200, Comprehensive Annual Financial Report, requires presentation of governmental fund balances and special revenue fund revenues by specific purpose. In the basic financial statements, the fund balance classifications are presented in the aggregate. The table presented below displays further detail of nonspendable fund balance and appropriation of resources existing at June 30, 2020 (in thousands).
GeneralFund
Natural Resources,
Environment,and Growth Management
PublicEducation
Health andFamily
Services Transportation
NonmajorGovernmental
Funds TotalFund balances:Nonspendable:
Inventory and Prepaid Items $ 9,550 $ 748 $ — $ 27,068 $ 7,785 $ 2,884 $ 48,035 Long-term Receivables and Advances 2,409 — — — — — 2,409 Permanent Fund Principal — — — — — 4,028 4,028
Total 11,959 748 — 27,068 7,785 6,912 54,472 Restricted:
Grantors/Contributors 611 54,885 — 48,494 — 34,420 138,410 Enabling Legislation 35,871 10,611 100,111 68,345 50 297,101 512,089 Constitutional Provision — 76,100 382,227 — — 61 458,388 Creditors 10,268 3,490 737,952 — — 1,092,128 1,843,838 Federal Government 26,502 2,683,772 19,507 153,459 — 78,803 2,962,043
Total 73,252 2,828,858 1,239,797 270,298 50 1,502,513 5,914,768 Committed: 1,293,157 1,416,855 380,604 1,528,239 1,690,531 1,294,511 7,603,897 Unassigned: 7,864,662 — (858,577) — — — 7,006,085
Total Fund Balances $ 9,243,030 $ 4,246,461 $ 761,824 $ 1,825,605 $ 1,698,366 $ 2,803,936 $ 20,579,222
Section 215.32(2)(b)4.a., F.S., provides that the unappropriated cash balances from selected trust funds may be authorized by the Legislature for transfer to the Budget Stabilization Fund and the General Revenue Fund through the General Appropriation Act. The amounts indicated below were identified in the State's 2020 General Appropriations Act as being unappropriated June 30, 2020, cash balances that are to be transferred to and from the funds indicated during the 2020-21 fiscal year (in thousands).
General Fund
Natural Resources,
Environment, and Growth Management
PublicEducation
Health and Family
Services Transportation
Nonmajor Governmental
Funds Total
Transfer to (from) Fund $ 139,500 $ (86,500) $ — $ (45,000) $ — $ (8,000) $ —
Transfer from Non-Governmental Funds 31,500 — — — — — 31,500 Total $ 171,000 $ (86,500) $ — $ (45,000) $ — $ (8,000) $ 31,500
F. Interfund Activity and Balances
The effect of interfund activities, except those between funds reported as governmental activities and funds reported as business-type activities, has been eliminated from the government-wide statements. In the fund financial statements, transfers represent flows of assets without equivalent flows of assets in return or a requirement for repayment. Transfers are recorded when a fund receiving revenue provides it to the fund which expends the resources. Transfers between funds are made to accomplish various provisions of law.
Interfund receivables and payables have been eliminated from the statement of net position, except for the residual amounts due between governmental and business-type activities.
For additional information, refer to Note 11.
G. Nonmonetary Transactions
The state participates in various activities that are, in part, represented by nonmonetary transactions. Examples include nonmonetary assistance in the form of Federal grants, such as vaccines, Electronic Benefit Transfer cards for food assistance, and donated food commodities. The state also acts as an agent for the United States Department of Agriculture in the distribution of donated food commodities to qualifying organizations outside the state’s reporting entity. The fair value of these items is reported in the governmental fund financial statements.
2020 STATE OF FLORIDA CAFR
70

State Attorneys and Public Defenders of the State of Florida are furnished certain office space and other services by counties under the provisions of Chapter 29, F.S. Some counties also provide certain facilities and services to other officers and staff of the judicial branch. The value of the facilities and services provided by the counties is not reported as revenue.
H. Operating and Non-Operating Revenues
Proprietary funds distinguish operating from non-operating revenues. Operating revenues are typically derived from providing goods or services, and include all transactions involved in delivering those goods or services. These revenues are a direct result of exchange-type transactions associated with the principal activity of the fund. Cash flow resulting from capital and related financing, noncapital financing and investment activities are considered non-operating for reporting purposes.
I. Accounting and Reporting Changes
The state implemented GASB Statement No. 95, Postponement of the Effective Dates of Certain Authoritative Guidance. This Statement postponed the effective dates of certain provisions in Statements and Implementation Guides that first became effective or are scheduled to become effective for periods beginning after June 15, 2018, and later.
The effective dates of certain provisions contained in the following pronouncements are postponed by one year:• Statement No. 83, Certain Asset Retirement Obligations*• Statement No. 84, Fiduciary Activities• Statement No. 88, Certain Disclosures Related to Debt, including Direct Borrowings and Direct Placements*• Statement No. 89, Accounting for Interest Cost Incurred before the End of a Construction Period• Statement No. 90, Majority Equity Interests• Statement No. 91, Conduit Debt Obligations• Statement No. 92, Omnibus 2020• Statement No. 93, Replacement of Interbank Offered Rates• Implementation Guide No. 2017-3, Accounting and Financial Reporting for Postemployment Benefits Other Than
Pensions (and Certain Issues Related to OPEB Plan Reporting)• Implementation Guide No. 2018-1, Implementation Guidance Update—2018• Implementation Guide No. 2019-1, Implementation Guidance Update—2019• Implementation Guide No. 2019-2, Fiduciary Activities.
The effective dates of the following pronouncements are postponed by 18 months:• Statement No. 87, Leases• Implementation Guide No. 2019-3, Leases.
* The State of Florida implemented GASB Statements No. 83 and 88 during the fiscal year ended June 30, 2019.
2020 STATE OF FLORIDA CAFR
71

J. Net Position Reclassifications and Restatements
Net position at June 30, 2019 have been adjusted as follows (in thousands):
Governmental Activities
Transportation Proprietary Fund
Pension andOther Employee
BenefitsTrust Funds
Net Position, June 30, 2019, as previously reported $ 66,823,327 $ 12,299,986 $ 179,816,405
To decrease fund balance to correct accounting errors. (159) (941) To increase net position as result of change in accounting principle.To increase fund balance to correct accounting errors. 485 941To increase fund balance due to the acquisition of Central Florida Health.Net Position, June 30, 2019, as restated $ 66,823,812 $ 12,299,827 $ 179,816,405
(Continued Below)
Component UnitsUniversity of Florida
Nonmajor Component Units
Net Position, June 30, 2019, as previously reported $ 6,026,542 $ 26,781,915 To decrease fund balance to correct accounting errors. (33,077) To increase net position as result of change in accounting principle. 6,000 To increase fund balance to correct accounting errors. 28,456 To increase fund balance due to the acquisition of Central Florida Health. 396,079 Net Position, June 30, 2019, as restated $ 6,422,621 $ 26,783,294
K. Budget Stabilization Fund
The State Constitution mandates the creation and maintenance of a Budget Stabilization Fund, in an amount not less than 5 percent nor more than 10 percent of the last complete fiscal year’s net revenue collections for the General Revenue Fund. Monies in the Budget Stabilization Fund may be transferred to the General Revenue Fund to offset a deficit therein or to provide emergency funding, including payment of up to $38 million with respect to certain uninsured losses to state property. Monies in this fund are constitutionally prohibited from being obligated or otherwise committed for any other purposes, in accordance with Section 216.222, F.S. Any withdrawals from the Budget Stabilization Fund must be restored from general revenues in five equal annual installments, commencing in the third fiscal year after the expenditure, unless the Legislature establishes a different restoration schedule, in accordance with Section 215.32, F.S.
The Budget Stabilization Fund had $1.57 billion in cash at June 30, 2020. During fiscal year 2019-20, the General Revenue Fund was authorized to transfer $91.2 million to the Budget Stabilization Fund. There were no disbursements made from the fund.
2020 STATE OF FLORIDA CAFR
72

NOTE 2 - DEPOSITS AND INVESTMENTS
A. Deposits
At June 30, 2020, the state’s deposits in financial institutions totaled approximately $2.7 billion for primary government and $2.9 billion for discretely presented component units.
1. Custodial Credit Risk
The custodial credit risk for deposits is the risk that, in the event of the failure of a depository financial institution, the state will not be able to recover deposits or will not be able to recover collateral securities that are in the possession of an outside party. The state mitigates custodial credit risk by generally requiring public funds to be deposited in a bank or savings association that is designated by the Chief Financial Officer (CFO) as authorized to receive deposits in the state and meets the collateral requirements as set forth in Chapter 280, Florida Statutes (F.S.). The CFO determines the collateral requirements and collateral pledging level for each Qualified Public Depository (QPD) following guidelines outlined in Section 280.04, F.S., and Department of Financial Services Rules, Chapter 69C-2, Florida Administrative Code. Collateral pledging levels include 25, 50, 110, and 150 percent of a QPD’s average daily deposit balance, or, if needed, an amount as prescribed by the CFO. Section 280.13, F.S., outlines eligible types of collateral including direct obligations of the United States (U.S.) Government, federal agency obligations fully guaranteed by the U.S. Government, certain federal agency obligations, state and local government obligations, corporate bonds, and letters of credit issued by a Federal Home Loan Bank. Also, with the CFO’s permission, eligible collateral includes collateralized mortgage obligations, real estate mortgage investment conduits and securities or other interests in any open-end management investment company registered under the Investment Company Act of 1940. However, the portfolio of the investment company must be limited to direct obligations of the U.S. Government and to repurchase agreements fully collateralized by such direct obligations of the U.S. Government, and the investment company must take delivery of such collateral either directly or through an authorized custodian.
In accordance with Section 280.08, F.S., if a QPD defaults, losses to public depositors are first satisfied with any applicable depository insurance, followed by demands of payment under any letters of credit or sale of the defaulting QPD’s collateral. If necessary, any remaining losses are to be satisfied by assessments against the other participating QPDs according to a statutory based ratio.
At June 30, 2020, the following deposits were not secured pursuant to Chapter 280, F.S., and were exposed to custodial credit risk because they were uninsured and (1) uncollateralized, (2) collateralized with securities held by the pledging financial institution, or (3) collateralized with securities held by the pledging financial institution’s trust department or agent but not in the state’s name (in thousands).
Schedule of Deposits with State TreasuryExposed to Custodial Credit Risk
As of June 30, 2020
Bank Statement Balance (in U.S. $)Custodial Credit Risk Primary Government Component Units
(1) $ 106,930 $ 710,949 (2) 10 225,755 (3) — —
Total deposits subject tocustodial credit risk $ 106,940 $ 936,704
2. Foreign Currency Risk
Foreign currency risk is the risk that changes in exchange rates will adversely affect the fair value of a deposit. Under Section 215.47, F.S., and subject to the limitations and conditions of the State Constitution or of the trust agreement relating to a trust fund, moneys available for investment by the State Board of Administration (SBA) may be invested in fixed income obligations or stocks denominated in foreign currency. The SBA has developed total fund investment policies for the investment of assets in the Florida Retirement System (FRS) Pension Trust Fund and the Lawton Chiles Endowment Fund (LCEF) that set ranges on investments by asset class in each fund. Under the FRS Pension Trust Fund and LCEF investment policy statements approved
2020 STATE OF FLORIDA CAFR
73

by SBA Trustees effective July 1, 2018, and June 17, 2014, respectively, foreign and domestic equity securities are included in the global equity asset class. The FRS Pension Trust Fund and LCEF have target allocations to global equities of 53% and 71%, respectively, with policy ranges from 45-70% for FRS and 61-81% for LCEF, but within these ranges there are no limits on the amount of foreign equity securities that are denominated in foreign currency. The FRS Pension Trust Fund is not limited to holding securities in foreign currency only in the global equity asset class. All asset classes may hold non-U.S. securities, depending on portfolio guidelines. The Florida Prepaid Program’s comprehensive investment plan limits investment in foreign equities to 25% of total equities, with the target for total equities to be 70% of the actuarial reserve. In all cases, Florida law limits the exposure to foreign securities held outside of commingled funds to 50% of the total fund. The investment plans may be modified in the future if the SBA or Florida Prepaid adopts changes. This investment activity in foreign investments resulted in deposits in foreign currency as of June 30, 2020, as illustrated in the following schedule (in thousands):
Schedule of Investments with State Board of AdministrationForeign Currency Deposits Held As of June 30, 2020
Bank Statement Balance (in U.S. $)
CurrencyFRS PensionTrust Fund LCEF
Florida PrepaidProgram and
Investment Plan Total Australian dollar $ 760 $ 163 $ — $ 923 Brazilian real 920 18 — 938 British pound sterling 3,980 74 72 4,126 Canadian dollar 1,855 48 — 1,903 Chilean peso 260 — — 260 Chinese yuan renminbi 3,378 14 — 3,392 Czech koruna 16 — — 16 Danish krone 373 — — 373 Egyptian pound 22 22 — 44 Euro 26,969 3 7 26,979 Hong Kong dollar 7,021 13 1 7,035 Hungarian forint 79 185 — 264 Indian rupee 3,271 — — 3,271 Indonesian rupiah 298 12 — 310 Israeli shekel 332 — 2 334 Japanese yen 17,767 233 573 18,573 Kenyan shilling 321 — — 321 Kuwaiti dinar 1,137 — — 1,137 Malaysian ringgit 269 88 — 357 Mexican peso 391 167 — 558 Moroccan dirham 8 — — 8 New Taiwan dollar 7,035 80 — 7,115 New Zealand dollar 340 310 — 650 New Zimbabwe dollar 35 — — 35 Nigerian naira 1,118 — — 1,118 Norwegian krone 411 139 — 550 Pakistan rupee 206 — — 206 Philippines peso 140 93 — 233 Polish zloty 146 11 — 157 Qatari riyal 120 — — 120 Russian ruble 1,174 — — 1,174 Saudi Arabian riyal 411 — — 411 Singapore dollar 2,680 — — 2,680 South African rand 587 39 — 626 South Korean won 2,273 — — 2,273 Sri Lanka rupee — — — — Swedish krona 603 12 — 615 Swiss franc 4,506 — — 4,506 Thailand baht 8 2 — 10 Turkish lira 259 13 — 272 United Arab Emirates dirham 298 — — 298 Vietnam dong 894 — — 894
Total deposits subject toforeign currency risk $ 92,671 $ 1,739 $ 655 $ 95,065
2020 STATE OF FLORIDA CAFR
74

B. Investments At June 30, 2020, the state’s investments reported in governmental and business-type activities and fiduciary funds totaled $257.4 billion, consisting of pooled investments with the State Treasury in the amount of $29.7 billion and other investments in the amount of $227.7 billion. The State Treasury also had holdings at June 30, 2020, of $4.3 billion for discretely presented component units in total. These investments are not reported as part of the primary government and may be different from the amounts reported by some component units due to different reporting periods. Other investments for discretely presented component units, excluding those investments held by SBA, totaled $23.8 billion.
Pooled Investments with the State Treasury
Unless specifically exempted by statute, all cash of the state must be deposited in the State Treasury. The State Treasury, in turn, keeps the funds fully invested to maximize earnings. In addition, the State Treasury may invest funds of any board, association, or entity created by the State Constitution, or by law. As a result, pooled investments with the State Treasury contains deposits from funds and component units of the reporting entity (internal portion) as well as deposits from certain legally separate organizations outside the reporting entity (external portion). The external portion of pooled investments with the State Treasury is reported in a governmental external investment pool.
Pooled investments with the State Treasury are not registered with the Securities and Exchange Commission. Oversight of the pooled investments with the State Treasury is provided by the Treasury Investment Council per Section 17.575, F.S. The authorized investment types are set forth in Section 17.57, F.S.
Redemptions are on a dollar in/dollar out basis adjusted for distributed income. The fair value of the pooled investments with the State Treasury is determined at fiscal year-end for financial reporting purposes. See Note 1E, Investments, for further detail on fair value.
The State Treasury does not contract with an outside insurer in order to guarantee the value of the portfolio, or the price of shares redeemed.
Per Section 17.61(1), F.S., the State Treasury shall invest all general revenue funds, trust funds, all agency funds of each state agency, and of the judicial branch. As a result, state agencies and the judicial branch are considered involuntary participants in pooled investments with the State Treasury. The total involuntary participation as of June 30, 2020, was $31.2 billion or 89% of the pool.
2020 STATE OF FLORIDA CAFR
75

At year-end, the condensed financial statements for the Investment Pool maintained by the State Treasury were as follows (dollars in thousands):
Schedule of Pooled Investments with State TreasuryCondensed Statement of Fiduciary Net Position
June 30, 2020
ASSETS
Current and Other Assets $ 35,379,603
Total Assets 35,379,603
LIABILITIES
Other Liabilities 3,028,319
Total Liabilities 3,028,319
NET POSITION
Net position held for Internal Pool Participants 31,568,569
Net position held for External Pool Participants 782,715
Total net position, ending $ 32,351,284
Condensed Statement of Changes of Fiduciary Net PositionJune 30, 2020
ADDITIONS
Net income (loss) from investing activity $ 1,413,644
DEDUCTIONS
Distributions paid and payable (1,413,644)
DEPOSITOR ACTIVITY
Deposits 129,772,189
Withdrawals (126,623,484)
Excess (deficiency) of deposits over withdrawals 3,148,705
Change in net position 3,148,705
Net position, beginning 29,202,579
Net position, ending $ 32,351,284
2020 STATE OF FLORIDA CAFR
76

The following table provides a summary of the fair value, the number of shares or the principal amount, ranges of interest rates, and maturity dates of each major investment classification (dollars in thousands):
Schedule of Pooled Investments with State TreasurySummary of Investment Holdings
Par Fair ValueRange of Interest
Rates* Range of Maturity Dates
Commercial paper $ 50,000 $ 49,995 0.14% 7/29/2020
Money market funds 1,566,294 1,566,294 0.162% N/A
Repurchase agreements 2,511,885 2,511,885 0.070% - 0.130% 7/1/2020 - 7/24/2020
U.S. guaranteed obligations 7,334,493 7,485,897 0.125% - 8.500% 7/21/2020 - 4/1/2065
Federal agencies 6,038,422 5,949,986 0.070% - 18.001% 7/9/2020 - 8/25/2059
Bonds and notes - domestic 6,595,234 6,848,265 0.001% - 9.455% 7/1/2020 - 9/15/2119
Bonds and notes - international 1,010,010 1,061,090 0.250% - 9.625% 7/13/2020 - 4/20/2055
Federal agencies discounted securities 1,809,009 1,805,569 0.095% - 1.900% 7/2/2020 - 3/25/2042
U.S. guaranteed obligations discounted securities 4,183,476 4,170,219 0.092% - 2.511% 7/2/2020 - 11/15/2044
Commingled STIF 715,386 715,386 N/A N/A
Unemployment compensation 2,548,264 2,548,264 N/A N/A
Totals $ 34,362,473 $ 34,712,850
* The coupon rate in effect at June 30, 2020, is reported. If a security is discounted, the purchase yield is reported.
The State Treasury records, as an investment, funds credited to the state’s account in the Federal Unemployment Compensation Trust Fund pursuant to Section 904 of the Social Security Act. The fund is drawn upon primarily to pay reemployment assistance benefits. This money is pooled with deposits from other states and is managed by the Federal Government. No disclosures can be made of specific securities owned.
2020 STATE OF FLORIDA CAFR
77

The schedule below discloses the detail of the State Treasury holdings at fair value at June 30, 2020, as well as reconciliation to the basic financial statements (in thousands):
Schedule of Pooled Investments with State TreasuryAs of June 30, 2020
Investment type Fair Value
Commercial paper $ 49,995 Money market funds 1,461,359 U.S. guaranteed obligations 11,656,116 Federal agencies 7,306,148 Bonds and notes - domestic 6,781,188 Bonds and notes - international 996,547 Repurchase agreements 1,400,000 Commingled STIF 715,386 Unemployment compensation funds pooled with U. S. Treasury 2,548,264 Total investments excluding security lending collateral** 32,915,003 Lending collateral investments:
Commercial paper — Repurchase agreements 1,111,885 Money market funds 104,935 Federal agencies 449,407 Bonds and notes - domestic 67,077 Bonds and notes - international 64,543
Total lending collateral investments 1,797,847 Total investments 34,712,850 Cash on deposit 664,594 Total State Treasury holdings 35,377,444 Adjustments:
Outstanding warrants (907,968) Deposits in transit 2,159 SPIA Revolving Account* (7,494) Unsettled securities liability (315,010)
Reconciled balance, June 30, 2020 $ 34,149,131
Reconciliation to the basic financial statements (in thousands):Unrestricted Pooled investments with State Treasury
Governmental activities $ 22,778,300 Business-type activities 4,048,567 Fiduciary funds 2,647,470 Component units 3,648,571 Component units timing difference (57,703)
Total unrestricted pooled investments with State Treasury 33,065,205 Restricted Pooled investments with State Treasury
Business-type activities 204,890 Component units 879,036
Total restricted pooled investments with State Treasury 1,083,926 Total pooled investments with State Treasury $ 34,149,131
* The SPIA Revolving Account is included as cash and cash equivalent by the agencies.
** This amount excludes the Florida Birth-Related Neurological Injury Compensation Association's (NICA) participation in Treasury's Short Term Investment Fund (STIF). NICA's portion represents less than a tenth of a percent of the total investments held at Treasury.
2020 STATE OF FLORIDA CAFR
78

Other Investments
Other investments in various funds of the state are primarily managed by the SBA. The largest of these funds managed by the SBA is the FRS Pension Trust Fund (Defined Benefit Pension Fund), whose total investments represented 73.0% of total other investments at June 30, 2020. Investments in the FRS Investment Plan Trust Fund (Defined Contribution Pension Fund) represents 5.1% of total other investment, while investments in the Florida Hurricane Catastrophe Fund and the Florida Prepaid College Trust Fund represented another 6.4% and 7.1%, respectively, of total other investments. Section 215.47, F.S., allows the SBA to invest funds in a range of instruments, including security lending agreements, reverse repurchase agreements, and alternative investments (including limited partnerships and hedge funds).
The schedule below discloses other investments at fair value at June 30, 2020, as well as reconciliation to the basic financial statements (in thousands):
Schedule of Other InvestmentsAs of June 30, 2020
Carrying Value1
Other funds
Investment typesFRS PensionTrust Fund
Managedby SBA
Not managedby SBA Total
Certificates of deposit $ — $ 3,044,834 $ 1,733 $ 3,046,567 Commercial paper 1,127,836 6,380,134 — 7,507,970 Money market funds 238,806 3,481,223 — 3,720,029 Repurchase agreements 800,000 1,650,000 — 2,450,000 U.S. guaranteed obligations 14,837,162 18,439,864 8,946 33,285,972 Federal agencies 8,169,761 1,292,402 4,369 9,466,532 Domestic bonds and notes 9,023,625 8,067,121 2,017,589 19,108,335 Commingled domestic bonds and notes funds/mutual funds — — — — International bonds and notes 2,448,364 1,828,950 557 4,277,871 International bonds and notes mutual fund — — — — Domestic stocks 48,275,740 2,644,778 88,804 51,009,322 Commingled domestic equity funds/mutual funds — 4,095,043 — 4,095,043 International stocks 31,129,943 761,864 6,114 31,897,921 Commingled international equity funds/mutual funds 7,089,845 2,318,559 — 9,408,404 Commingled real asset funds — 769,608 — 769,608 Alternative investments 28,780,594 — — 28,780,594 Real estate investments (directly owned) 9,752,973 — 720 9,753,693 Commingled real estate investments funds 2,243,510 — — 2,243,510 Self-Directed brokerage accounts — 817,186 — 817,186 Derivative instruments, net:2
Forward currency contracts (4,800) — — (4,800) Futures (debt and equity) 21,583 — — 21,583 Option contracts — — 2,434 2,434 Swap contracts (946) — — (946) Mutual funds — — 2,719,307 2,719,307 Deferred compensation annuities — — 14,720 14,720
Total investments excluding lending collateral 163,933,996 55,591,566 4,865,293 224,390,855
Lending collateral investments:Certificates of deposit — 671,418 — 671,418 Commercial paper — 677,994 — 677,994 Money market funds 1,785,715 4,925 1,031 1,791,671 Repurchase agreements — 1,021,000 — 1,021,000 Federal agencies — 50,025 — 50,025 Domestic bonds and notes 44,759 — — 44,759 International bonds and notes — — — — Total lending collateral investments 1,830,474 2,425,362 1,031 4,256,867
Total investments for all types $ 165,764,470 $ 58,016,928 $ 4,866,324 $ 228,647,722
% of total other investments 73 % 25 % 2 %
1 Investments of the Local Government Surplus Funds Trust Fund are reported based on amortized cost which approximates fair value. See the Local Government Surplus Funds Trust Fund disclosure on page 81 to obtain investment details of the Local Government Surplus Funds Trust Fund. In addition, investments of the Debt Service Escrowed Fund, which meet the requirements of a legal or in-substance defeasance, are reported at cost. 2 Refer to Note 2.B.6. for detailed information regarding derivatives.
2020 STATE OF FLORIDA CAFR
79

Reconciliation to the basic financial statements (in thousands):Governmental
activitiesBusiness-type
activitiesFiduciary
fundsComponent
Units1 TotalOther investments $ 1,350,118 $ 8,590,711 $ — $ 551,680 $ 10,492,509 Restricted investments — 571,833 — — 571,833 Long-term investments 37,926 22,258,137 193,166,525 — 215,462,588 Security lending collateral2 — — 1,830,474 — 1,830,474 Timing and other differences3 (35,982) (10,732) (48,530) 385,562 290,318
Total other investments $ 1,352,062 $ 31,409,949 $ 194,948,469 $ 937,242 $ 228,647,722
1 The column for Component Units presents investments managed by SBA for Component Units. For presentation of all other investments for Component Units, see the Schedule of Other Investments For Discretely Presented Component Units.2 Other investments and Restricted investments for Governmental and Business-type activities include security lending collateral. Refer to Note 2 B Schedule of Other Investments and B(5) Schedule of Other Investments on Loan Under Security Lending Agreements for additional information.3 Differences between participant balances posted and actual investments. Some Component Units have fiscal year ends other than the state's year end of June 30, 2020.
Certain investments included in the above schedule were pledged as collateral with the SBA’s futures and swaps clearing counterparties. These investments are presented below (in thousands):
FRS Pension Trust FundSecurities Pledged as Collateral for Futures and Swaps Contracts
As of June 30, 2020
Investment Type Fair ValueU.S. guaranteed obligations $ 118,767 Federal agencies 1,101
Total $ 119,868
In addition, cash and foreign currency required to open futures and swap contracts (i.e. initial margin) in the FRS Pension Trust Fund may be pledged as collateral with the SBA’s futures and swap counterparties. Pursuant to these types of contracts, and also pending foreign currency contracts and commitments to purchase (TBAs), the FRS Pension Trust Fund agrees to receive or pay to the counterparties an amount of cash equal to the daily fluctuation in the value of the contract. Such receivables and payables are known as variation margin. All initial and variation margin amounts held by counterparties, and the variation margins held by the FRS Pension Trust Fund as of June 30, 2020, are included in “Accounts receivable” and in “Accounts payable and accrued liabilities”, respectively, on the Statement of Fiduciary Net Position. These amounts are presented in the table below (in thousands):
FRS Pension Trust FundCash and Foreign Currency Pledged as Collateral for Futures and Swaps Contracts
As of June 30, 2020 Fair Value
Margin receivable from counterparties:Futures contracts $ 6,654 Swap contracts 5,187 Foreign currency contracts 2,092 Total margin receivable $ 13,933
Margin payable to counterparties:Futures contracts $ 14,327 Swap contracts 224 Commitments to purchase (TBAs) 1,354 Total margin payable $ 15,905
2020 STATE OF FLORIDA CAFR
80

The FRS Pension Trust Fund also held short positions in investments at June 30, 2020. Short investment positions are reported as liabilities on the Statement of Fiduciary Net Position. The schedule below presents the short investment positions at fair value at June 30, 2020 (in thousands):
FRS Pension Trust FundShort Investment Position
As of June 30, 2020
Investment Type Fair ValueU.S. guaranteed obligations $ (27,400) Federal agencies (37,204)
Total $ (64,604)
The SBA issued a separate report (financial statements and notes) pertaining to the Local Government Surplus Funds Trust Fund (an external investment pool) within the state’s Investment Trust Fund for the period ended June 30, 2020. This report may be obtained from the Chief Operating & Financial Officer, State Board of Administration of Florida, 1801 Hermitage Boulevard, Suite 101, Tallahassee, Florida 32308, (850) 488-4406.
Component Units
The schedule below discloses other investments reported at fair value, as of June 30, 2020, for discretely presented component units and a reconciliation to the basic financial statements (in thousands). Those investments held with the State Treasury as of June 30, 2020, are excluded.
Schedule of Other InvestmentsFor Discretely Presented Component Units
As of June 30, 2020
Investment type Fair ValueCertificates of deposit $ 33,713 Commercial paper 12,202 Money market funds 261,910 U.S. guaranteed obligations 3,821,705 Federal agencies 1,493,358 Domestic bonds & notes 7,469,505 International bonds & notes 699,284 Domestic stocks 1,469,211 International stocks 920,445 Real estate investments 162,650 Mutual funds 2,530,362 Investment agreements 4,953,319
Total other investments for all types $ 23,827,664
Reconciliation of fair value to the basic financial statements:Other investments $ 17,358,197 Restricted investments 7,021,147 Less SBA Investments* (551,680) Total other investment for component units $ 23,827,664
.
* Investment types for component units with investments held by SBA are disclosed on the Schedule of Other Investments on page 79.
At June 30, 2020, 61.14% of total other investments for discretely presented component units belonged to the following major component units: Florida Housing Finance Corporation, University of Florida, and Citizens Property Insurance Corporation.
2020 STATE OF FLORIDA CAFR
81

1. Credit Risk and Concentration of Credit Risk of Debt Securities Credit risk is the risk that an issuer or other counterparty to an investment will not fulfill its obligations. Concentration of credit risk is the risk of loss attributed to the magnitude of the state’s investment in a single issuer.
Pooled Investments with the State Treasury
The State Treasury follows the investment guidelines set forth in Section 17.57, F.S., for reducing exposure to investment credit risk. The State Treasury’s rated debt investments as of June 30, 2020, were rated by the nationally recognized statistical rating organizations (NRSRO) Standard and Poor’s (S&P) and Moody’s. S&P ratings were primarily used. If S&P did not rate a security, or if the Moody's rating was lower for a security, then Moody's ratings were used. The ratings are presented below using the applicable rating scale (in thousands):
State TreasuryCredit Quality Ratings
As of June 30, 2020
S&P rating2
Moody'srating2 Total1
Commercialpaper
Federalagencies
Domestic bonds& notes
Internationalbonds &
notesRepurchaseagreements
Money Marketfunds
AAAm $ 1,461,359 $ — $ — $ — $ — $ — $ 1,461,359
AAA 1,018,121 — 9,252 802,428 101,506 — 104,935
AA 7,974,867 — 7,211,941 543,951 218,975 — —
A 3,165,041 — — 2,746,343 418,698 — —
A-1 196,356 49,995 146,361 — — — —
BBB 1,497,640 — — 1,355,396 142,244 — —
BB 29,132 — — 27,809 1,323 — —
B 11,075 — — 11,075 — — —
Below B 8 — — 8 — — —
Aaa 889,704 — 83,198 765,706 40,800 — —
Aa 112,314 — — 112,314 — — —
A 120,905 — — 119,584 1,321 — —
Baa 360,259 — — 307,877 52,382 — —
Ba 60,738 — — 39,965 20,773 — —
B 1,177 — — 1,177 — — —
Below B 28 — — 28 — — —
Not Rated Not Rated 2,403,417 — 304,803 14,604 63,068 2,020,942 —
19,302,141 $ 49,995 $ 7,755,555 $ 6,848,265 $ 1,061,090 $ 2,020,942 $ 1,566,294
Not rated3 Not rated3 11,656,116 U.S. guaranteed obligations
Not rated Not rated 715,386 Commingled STIF
Not rated3 Not rated3 490,943 Repurchase agreements
$ 32,164,586
1 The remaining $2,548,264 (in thousands) reported for Pooled Investments with State Treasury is comprised primarily of investments with the U.S. Treasury Unemployment Compensation Funds Pool.
2 Long-term ratings are presented except for "A-1," which is a short-term rating for S&P.3 U.S. guaranteed obligations and collateral for repurchase agreements which are explicitly guaranteed by the U.S. government do not require disclosure of credit quality.
2020 STATE OF FLORIDA CAFR
82

The State Treasury’s investment policies allow for unlimited investments in U.S. obligations and certain Federal Agency obligations. For other investments, the investment policies address concentration of credit risk by placing limits on amounts invested per issuer (taking into account the maturity date and duration of the investment). In addition, the policies also address limits on certain investments by credit ratings. Limits on amounts invested are expressed in dollar amounts per issuer and also in total amounts per investment type as a percentage of the investment pool’s market value. As of June 30, 2020, more than five percent of the State Treasury’s investment pool is invested in the Federal National Mortgage Association (FNMA), Federal Home Loan Bank System (FHLB), and the Federal Home Loan Mortgage Corporation (FHLMC). These investments are approximately 8 percent, 6 percent, and 5 percent of the of the State Treasury’s investments pool, respectively.
Other Investments
The SBA, in compliance with Section 215.47, F.S., has adopted certain investment policies with regard to credit risk of debt securities. Investment policies vary by fund or portfolio. Below are the investment policies and credit risk disclosures for the FRS Pension Trust Fund, which constitutes the primary portion of other investments.
FRS Pension Trust Fund – Investments are generally managed through individual portfolios within various asset classes, as listed below. Some of the individual portfolios have slightly different restrictions on credit quality.
Short-term Portfolio – Securities must be high quality at the time of purchase. For short-term investment ratings, this is defined as the highest applicable rating from one of the NRSROs. For long-term investment ratings, this is defined as a minimum A rating from one of the NRSROs. Securities of a single issuer are generally limited to 5% of the market value of the portfolio (excluding U.S. Treasuries and Agencies).
Generally, securities in other major portfolios, such as the Mortgage Index Portfolio, Intermediate Aggregate Less MBS Index Portfolio and the Core Portfolio, should be rated investment grade by at least one of the NRSROs at the time of purchase allowing a very small allocation to below investment grade (down to BB-/Ba3) for the Core Portfolio. Securities for a single issuer are generally limited to 5% of the fair value of the portfolio (excluding U.S. Treasuries and Agencies).
Mortgage Index Portfolio – Securities are generally limited to those issued by the Government National Mortgage Association (GNMA), FNMA, and FHLMC. No specific credit rating criteria are listed.
Intermediate Aggregate Less MBS Index Portfolio and the Core Portfolio – These portfolios allow U.S. Treasuries, U.S. Government agencies, corporates, mortgage and asset backed securities, foreign sovereign debt, and municipals.
Lending Portfolios – Under investment policy guidelines in effect for the FRS Pension Trust Fund, eligible cash collateral investments are:
• Tri-party qualified repurchase agreement transactions collateralized by U.S. Treasury bills, notes, bonds, and/or strips, U.S. Government Agency securities, U.S. Government Agency mortgage-backed securities, and U.S. equity securities. Collateral consisting of U.S. Treasury and Government Agencies must maintain a market value of at least 102% of the market value of the securities subject to being repurchased. Collateral consisting of U.S. equities must maintain a market value of at least 110% of the market value of the securities subject to being repurchased,
• Money market mutual funds regulated by SEC rule 2a-7 and rated the highest applicable rating by at least one NRSRO and
• U.S. Treasury bills, notes, and bonds.
Security lending investments that were purchased prior to the policy guidelines established in December 2008 are being held to maturity in existing lending portfolios.
Lawton Chiles Endowment Fund – Policy guidelines allow cash collateral to be invested only in tri-party repurchase agreements and certain government money market funds, similar to those allowed for the FRS Pension Fund.
Florida Prepaid College Program Lending Program – Short-term obligations should be limited to obligations rated in the highest rating category by at least two NRSROs or, if only rated by one NRSRO, rated at the time of purchase in the highest rating category by that NRSRO (S&P A-1, Moody’s P-1, Fitch F1 or equivalent). A “short-term obligation” means any eligible security or instrument (other than a repurchase agreement) which has an original maturity of 397 days or less at the time of purchase or has a put that entitles the holder to receive the principal amount at specified intervals not exceeding 397 days. With respect to bonds and other long-term obligations, investment is limited to obligations backed by the United States Government
2020 STATE OF FLORIDA CAFR
83

and have a maximum maturity of 762 days. A “long-term obligation” means any eligible security or instrument (other than a repurchase agreement) which has a remaining maturity of greater than 397 days at the time of purchase and is not subject to a demand feature in 397 days or less.
The FRS Pension Trust Fund did not hold any investments with a single issuer representing 5% or more of the fund’s fair market value at June 30, 2020. The schedule below discloses credit quality ratings on investments held in the FRS Pension Trust Fund at June 30, 2020 (in thousands):
FRS Pension Trust FundCredit Quality Ratings
As of June 30, 2020 Credit Rating1
Total2Commercial
paperMoney market
fundsRepurchase agreements
Federalagencies4
Domesticbonds & notes
International bonds & notesS&P Moody's
A-1/AAAm $ 2,773,649 $ 749,128 $ 2,024,521 $ — $ — $ — $ — A-2 290,928 290,928 — — — — — A-3 19,881 19,881 — — — — —
AAA 1,042,586 — — — — 596,606 445,980 AA 1,064,635 — — 50,024 411,964 426,338 176,309 A 2,596,413 — — — — 2,008,854 587,559
BBB 4,285,977 — — — — 3,658,002 627,975 BB 240,024 — — — — 190,578 49,446 B 93,218 16,110 — — — 64,186 12,922
CCC 18,207 — — — — 9,292 8,915 CC 12,416 — — — — 10,865 1,551 C 456 — — — — 456 — D 3,948 — — — — 1,479 2,469
P-2 49,998 49,998 — — — — — P-3 1,791 1,791 — — — — — Aaa 1,081,531 — — — 4,193 881,644 195,694 Aa 75,775 — — — — 56,182 19,593 A 179,897 — — — — 141,579 38,318
Baa 571,008 — — — — 446,380 124,628 Ba 200,702 — — — — 153,189 47,513 B 33,019 — — — — 29,909 3,110
Caa 7,680 — — — — 7,083 597 Not rated Not rated 8,535,571 — — 290,420 7,753,604 385,762 105,785
Total ratable investments 23,179,310 $ 1,127,836 $ 2,024,521 $ 340,444 $ 8,169,761 $ 9,068,384 $ 2,448,364
Ratings not Applicable:Repurchase agreements3 459,556 U.S. guaranteed obligations3 14,837,162 Domestic stocks 48,275,740 International stocks 31,129,943
Commingled internationalequity funds 7,089,845 Alternative investments 28,780,594 Real estate (directly owned) 9,752,973
Real estate commingled 2,243,510
Derivative instruments, net:
Forward currency contracts (4,800) Futures (debt and equity) 21,583 Swaps (946)
Total investments $ 165,764,470
1 S&P ratings were primarily used. If S&P did not provide a rating or did not provide the rating with the greatest degree of credit risk, then Moody's ratings were used. If neither rating agency issued a rating, the security was listed as "Not rated." Long-term ratings are presented except for the ratings presented for commercial paper and money market funds.2 All FRS investments are included in this schedule, including security lending collateral investments.3 U.S. guaranteed obligations and repurchase agreements collateralized by securities explicitly guaranteed by the U.S. Government do not require disclosure of credit quality.4 Federal agency TBAs and mortgage-backed securities are classified as "Not Rated" because they do not have explicit credit ratings on individual securities.
2020 STATE OF FLORIDA CAFR
84

All futures, options, and swaps contracts held by the FRS Pension Trust Fund at June 30, 2020, were exchange traded, therefore minimizing counterparty credit risk through the use of futures and swaps clearing merchants and clearing houses. The FRS Pension Trust Fund may enter into contracts that allow for close-out netting with certain counterparties. In the event of default or early termination, the contract permits the non-defaulting party the right to close-out all transactions in a single net settlement to one net amount payable by one counterparty to the other. The aggregate fair value of non-exchange traded derivatives subject to close-out netting totaled $(4.1) million as of June 30, 2020. Counterparty credit ratings related to credit risk for forward foreign currency exchange contracts held in the FRS Pension Trust Fund at June 30, 2020, are listed below (in thousands):
FRS Pension Trust FundForward Foreign Currency Exchange Contract Counterparty Credit Ratings
As of June 30, 2020
Counterparty Credit Rating (Long /Short)1ReceivableFair Value
PayableFair Value
Net UnrealizedGain (Loss)2S&P Moody's
A/A-1 $ 29,226 $ (33,448) $ (4,222)
NR/P-1 27 (605) (578) Total $ 29,253 $ (34,053) $ (4,800)
1 S&P ratings were primarily used. If S&P did not provide a rating or did not provide the rating with the
greatest degree of credit risk, then Moody’s ratings were used. If neither rating agency issued a rating, the security was listed as "NR" (not rated). 2 Forward currency exchange contracts are reported net, as an investment derivative on the Statement of
Fiduciary Net Position.
Counterparty credit ratings related to credit risk for spot currency exchange contracts held in the FRS Pension Trust Fund at June 30, 2020, are listed below (in thousands):
FRS Pension Trust FundSpot Foreign Currency Exchange Contract Counterparty Credit Ratings
As of June 30, 2020
Counterparty Credit Rating (Long /Short)1
ReceivableFair Value
PayableFair Value
Net UnrealizedGain (Loss)S&P Moody's
AA/A-1 $ 6,600 $ (6,597) $ 3
A/A-1 40,160 (40,189) (29)
BBB/A-2 30 (30) —
A/P-1 202 (202) —
NR NR 50,994 (51,003) (9)
Total $ 97,986 $ (98,021) $ (35)
1 S&P or Moody ratings were primarily used. If S&P did not provide a rating or did not provide the rating with the greatest degree of credit risk, then Moody’s ratings were used. If neither rating agency
issued a rating, the security was listed as "NR" (not rated).
2020 STATE OF FLORIDA CAFR
85

The schedule below discloses credit quality ratings on investments held in all funds managed by the SBA (except the FRS Pension Trust Fund) at June 30, 2020, (in thousands):
All SBA Managed Funds (except FRS Pension Trust Fund)Credit Quality Ratings
As of June 30, 2020
Credit Rating1
Total2Certificates of deposit
Commercial paper
Money marketfunds
Repurchase agreements
Federal agencies
Domesticbonds and
notes3
Internationalbonds and
notes S&P Moody'sAAAm $ 2,370,018 $ — $ — $ 2,370,018 $ — $ — $ — $ —
A-1 7,015,767 — 7,015,767 — — — — — AAA 429,302 — — — — — 413,749 15,553 AA 2,640,860 — — — 54,858 170,576 1,505,565 909,861 A 2,234,936 — — — 131,287 — 1,477,011 626,638
BBB 1,655,773 — — — 71,483 — 1,402,524 181,766 BB 14,237 — — — — — 8,587 5,650 B 1,246 — — — — — 1,246 —
P-2 — Aaa 293,894 — — — 967 27,648 245,089 20,190 Aa 24,433 — — — — — 24,166 267 A 446,544 — — — 925 — 424,562 21,057
Baa 197,219 — — — 6,305 — 181,647 9,267 Ba 73,859 — — — — — 65,737 8,122
Note rated Not rated 8,924,718 3,718,903 49,989 1,116,619 547,186 1,144,202 2,317,239 30,580
Total ratable investments 26,322,806 $ 3,718,903 $ 7,065,756 $ 3,486,637 $ 813,011 $ 1,342,426 $ 8,067,122 $ 1,828,951
Ratings not applicableRepurchase agreements4 1,857,989
U.S. guaranteedobligations4 18,439,929 Domestic stocks 2,644,778
Domestic equity commingled/mutual funds 4,095,043 International stocks 761,864
International equity commingled/mutual funds 2,318,560
Commingled real assetfunds 769,608
Self-directed brokerageaccounts 817,186
Total investments $ 58,027,763
1 S&P ratings were primarily used. If S&P did not provide a rating or did not provide the rating with the greatest degree of credit risk, then Moody's ratings were used. If neither rating agency issued a rating, the security was listed as "Not rated." Long-term ratings are presented except for the ratings presented for commercial paper and money market funds.2 All investments are included in this schedule, including security lending collateral investments. Fair value is presented for all investments, except for repurchase agreements and money market funds, which are presented at cost.3 These columns include several domestic bonds and notes commingled/mutual funds and one international bonds and notes mutual fund with fair values of approximately $2.2 billion and $16.3 million, respectively, that do not carry credit ratings.4 U.S. guaranteed obligations and collateral for repurchase agreements which are explicitly guaranteed by the U.S. government, do not require disclosure of credit quality.
2020 STATE OF FLORIDA CAFR
86

The Florida Prepaid Investment Plan held investments with the FNMA (8.66%) in excess of 5% of the Florida Prepaid Investment Plan’s fair value.
Component Units
Investment policies with regard to credit risk of debt securities vary from component unit to component unit. In addition, investment policies vary among Universities’ direct support organizations. Investment policies may be obtained separately from component units. Presented below are reported credit quality ratings for debt securities of major component units (in thousands). Amounts shown below represent only that portion of debt investments required to be disclosed by component units reporting under the GASB reporting model.
Major Component UnitsCredit Quality Ratings
As of June 30, 2020
Component Unit* Federal agencies
Bonds & notes
Money market funds
Bond Mutual funds
U.S. guaranteed obligations
Other Investments Total S&P rating
Florida Housing Finance Corporation (FHFC) $ — $ 22,601 $ — $ — $ — $ 5,638 $ 28,239 AAA-AA+
FHFC (continued) — 69,393 — — — — 69,393 AAA-AA
FHFC (continued) — 2,311 — — — — 2,311 AAA-BBB+
FHFC (continued) — 108,974 — — — — 108,974 AAA-BBB-
FHFC (continued) — — — — — — — AAA-D
FHFC (continued) 32,366 — — — 153,455 — 185,821 AA+
FHFC (continued) — — — — — — — A 1
FHFC (continued) — — — — — — —
University of Florida (UF) — 5,381 4,903 62,465 — — 72,749 AAA
UF (continued) 19,190 6,163 — 63,510 — — 88,863 AA
UF (continued) — 7,729 — 32,327 — — 40,056 A
UF (continued) 940 95,736 17,974 27,738 — — 142,388 Less than A
Citizens Property Insurance Corporation (CPIC) 791,482 — — — 1,836,762 — 2,628,244 AA+
CPIC (continued) — 641,540 — — — 641,540 A+
CPIC (continued) — 5,269,097 — — — — 5,269,097 A
Total Investments $ 843,978 $ 6,228,925 $ 22,877 $ 186,040 $ 1,990,217 $ 5,638 $ 9,277,675
* State of Florida major component units do not have any investments subject to concentration of credit risk.
2020 STATE OF FLORIDA CAFR
87

2. Custodial Credit Risk
Custodial credit risk for investments is the risk that, in the event of the failure of the counterparty to a transaction, the state will not be able to recover the value of investment or collateral securities that are in the possession of an outside party.
Pooled Investments with the State Treasury The State Treasury’s custodial risk policy states that securities must be held in an account in the state’s name. As required by negotiated trust and custody contracts, many of the state’s investments were held in the state’s name by the Treasury’s custodial financial institution at June 30, 2020. Investments that were uninsured and unregistered, and held by the counterparty, or by its trust department but not in the State’s name, included the following (in thousands):
State Treasury
Custodial Credit RiskAs of June 30, 2020
Fair value Invested security lending collateral:
Repurchase agreements $ 1,111,885 Federal agencies 449,407 Bonds and notes - domestic 67,077 Bonds and notes - international 64,543 Total $ 1,692,912
Other Investments
The SBA’s custodial credit risk policy states that custodial credit risk will be minimized through the use of trust accounts maintained at top tier third party custodian banks. To the extent possible, negotiated trust and custody contracts shall require that all deposits, investments, and collateral be held in accounts in the SBA’s name, or in the case of certain foreign investments, in an omnibus client account, but separate and apart from the assets of the custodian banks. This policy applies to investments evidenced by cash or securities, and does not apply to investments evidenced by contractual agreements such as alternative or real estate investments, cleared derivative instruments (futures, options and swaps), external investment pools or open-ended mutual funds. These types of investments are not exposed to custodial credit risk because their existence is not evidenced by securities that exist in physical or book entry form. As required by negotiated trust and custody contracts, many of the state’s investments were held in the state’s name or in the case of certain foreign investments, in an omnibus client account, by the SBA’s custodial financial institutions at June 30, 2020. Investments that were uninsured and unregistered, with securities held by the counterparty, or by its trust department, but not in the SBA’s name, included the following (in thousands):
Other Investments with SBACustodial Credit Risk
As of June 30, 2020 FRS PensionTrust Fund Other funds
Invested security lending collateral:Certificates of deposit $ — $ 671,418 Commercial paper — 677,994 Repurchase agreements — 1,021,000
Federal agencies — 50,024 Domestic bonds and notes 44,759 — Total $ 44,759 $ 2,420,436
2020 STATE OF FLORIDA CAFR
88

Component Units
Component units manage their exposure to custodial credit risk through various investment policies. These policies may be obtained separately from component units. Presented below is the applicable custodial credit risk information for a major component unit (in thousands):
Major Component UnitCustodial Credit Risk
As of June 30, 2020 Component unit / Investment type Fair value University of Florida
Federal agencies $ 20,130 Bonds and notes 16,838 Total $ 36,968
3. Interest Rate Risk
Interest rate risk is the risk that changes in interest rates will adversely affect the fair value of debt investments.
Pooled Investments with the State Treasury
Through its investment policy, the State Treasury manages its exposure to interest rate risk by limiting either the maturities or durations of the various investment strategies used for the investment pool. The maximum effective weighted duration allowed is in the Long Duration portfolio: six (6) years or the benchmark’s effective duration if higher. In addition, the security lending portfolio manages exposure to interest rate risk by limiting the maximum weighted average maturity gap. The maximum weighted average maturity gap is defined as the difference between the weighted average days to maturity of the portfolio minus the weighted average days to maturity of the liabilities (loans). The maximum weighted average maturity gap for security lending portfolios is 30 days.
2020 STATE OF FLORIDA CAFR
89

Presented below is the interest rate risk table for the debt investments with the State Treasury (in thousands). Investment types related to debt portfolios are presented using effective weighted duration. Investment types related to the security lending collateral portfolio are presented using weighted average maturity.
Debt InvestmentsAs of June 30, 2020
Investment type Fair value
Effectiveweightedduration(in years)
Security Lending
Market Value
Weightedaveragematurity(in days)
Commercial paper $ 49,995 0.08 $ — N/AMoney market funds 1,461,359 0.33 104,935 1 Repurchase agreements 1,400,000 0.03 1,111,885 1 U.S. guaranteed obligations:
U.S. Treasury bonds and notes 6,981,398 3.27 — N/AU.S. Treasury strips 413,385 2.55 — N/AU.S. Treasury bills 3,756,834 0.20 — N/AGNMA mortgage-backed pass-through 312,091 3.01 — N/AGNMA TBA pass-through 316 3.15 — N/AGNMA collateralized mortgage obligations (CMO's) 17,096 2.76 — N/AGNMA CMO's - interest only 12,714 2.81 — N/ANCUA - CMO's 1,839 0.10 — N/ASBA asset-backed 160,443 4.07 — N/A
Federal agencies:Discount notes 1,805,492 0.25 — N/AUnsecured bonds & notes 1,898,987 0.86 449,407 5 Mortgage-backed pass-through 2,831,504 2.26 — N/ATBA mortgage-backed pass-through 207,228 1.34 — N/AMortgage-backed CMO's 552,294 3.60 — N/AMortgage-backed CMO's - principal only 77 3.50 — N/AMortgage-backed CMO's - interest only 10,566 3.90 — N/A
Bonds and notes - domestic:Corporate 4,826,569 6.40 67,077 31 Corporate asset-backed 615,143 1.48 — N/ANon-government backed CMO's & CMBS* 871,862 4.16 — N/A
Non-government backed CMO's & CMBS* - interest only 11,120 3.24 — N/A
Municipal/provincial 456,494 7.19 — N/ABonds and notes - international:
Government & Agency 201,013 3.71 — N/A
Corporate 795,534 3.90 64,543 41
Commingled STIF 715,386 — — N/A
Futures contracts - long*** — 5.42 — N/A
Futures contracts - short*** — 5.99 — N/ATotal portfolio effective duration and weighted average maturity — 2.64 — 5Total debt investments** $ 30,366,739 $ 1,797,847
* Commercial Mortgage-Backed Securities (CMBS).** The remaining $2,548,264 (in thousands) reported for Pooled Investments with State Treasury is comprised of investments with the U.S. Treasury Unemployment Compensation Funds Pool.***The futures contracts effective weighted duration was calculated using notional values rather than fair values.
2020 STATE OF FLORIDA CAFR
90

Other Investments
The SBA manages its exposure to interest rate risk through various investment policies. Policies and interest rate risk disclosures for debt investments within the FRS Pension Trust Fund are presented below.
Investments authorized by Section 215.47, F.S., are managed through individual portfolios within various asset classes. The individual portfolios may have different policies regarding interest rate risk. Major types of debt portfolios are listed below.
Short-term Portfolio – Weighted average maturity to final maturity date (WAL) is limited to 120 days and weighted average time to coupon reset (WAM) is limited to 60 days. For securities without a fixed interest rate, the next coupon reset date is used as the maturity for the reset WAM calculation. No individual security shall have a final maturity date longer than 397 days except for U.S. Treasury and Agency securities, which shall not exceed five years.
Mortgage Index Portfolio – Portfolio duration should be similar to the duration of the mortgage-related fixed income market and should remain within plus or minus 0.25 years of the Barclays Capital U.S. MBS Index duration. Swaps and/or Agency debentures may contribute no more than 25% of the portfolio’s total duration.
Intermediate Aggregate Less MBS Index Portfolio – Portfolio duration should remain within plus or minus 0.25 years of the Barclays Capital U.S. Intermediate Aggregate Bond Index duration less the MBS Index component. Interest rate swaps and interest rate futures, on a net basis, may contribute no more than 25% of the portfolio’s total duration.
Core Portfolios – Portfolio duration should remain within plus or minus 0.50 years of the Barclays Capital U.S. Intermediate Aggregate Bond Index duration. Interest rate swaps and interest rate futures may contribute no more than 25% of the portfolio’s total duration.
The Core Portfolio contains certain investments, known as collateralized mortgage obligations (CMOs), which are more sensitive to interest rate changes than others. Examples of CMO securities that qualify as “highly interest rate sensitive” include interest-only (IOs), principal-only (POs), and inverse floaters (INVs). IO and PO securities are transactions that involve the separation of the interest and principal components of a security. They are highly sensitive to prepayments by mortgagors, which increase the value of a PO and decrease the value of an IO. INVs have an inverse relationship to a benchmark rate, and the coupon payment is adjusted as the interest rate changes. If the benchmark interest rate decreases, the coupon rate increases and vice versa, which allows the bondholder to benefit from declining interest rates. Similar to an IO, an interest-only inverse floater’s value increases as interest rates rise.
Security Lending Portfolios – Investment policy guidelines in effect for the FRS Pension Trust Fund allow investment in: • Tri-party qualified repurchase obligations, with a term to repurchase not to exceed 45 calendar days that are fully
collateralized by U.S. Treasury bills, notes, bonds and/or strips, U.S. Government Agency securities, U.S. Government Agency mortgage-backed securities, and U.S. equity securities,
• Money market mutual funds regulated by SEC rule 2a-7, and• U.S. Treasury bills, notes, and bonds maturing within 92 days or less.
Security lending investments that were purchased prior to the investment policy guidelines established in December 2008, are still held in the FRS Pension Trust Fund lending programs, but are slowly paying down. For investments that had floating interest rates, interest rate reset dates were used to calculate the WAM.
The LCEF policy allows cash collateral to be invested only in tri-party repurchase agreements, certain government money market funds and U.S. government securities similar to those allowed for the FRS Pension Fund.
For the Florida Prepaid lending program, investment policy guidelines state that the maximum rate sensitivity is 60 days. The “rate sensitivity” of a security or instrument shall mean (a) in the case of a fixed rate security or instrument (i) the date on which final payment is due or (ii) the principal amount can be recovered through demand (if applicable) or (b) in the case of a floating or variable rate security or instrument, the shorter of the period of time remaining until either (i) the next readjustment of the interest rate or (ii) the principal amount can be recovered through demand (if applicable).
Presented in the following schedule is the interest rate risk table for the FRS Pension Trust Fund (in thousands). Investment types related to debt portfolios are presented using effective weighted duration. Investment types related to short-term and securities lending collateral portfolios are presented using weighted average maturity.
2020 STATE OF FLORIDA CAFR
91

FRS Pension Trust FundDebt Investments
As of June 30, 2020
Investment typeFair value(duration)
Effectiveweightedduration(in years)
Fair value (WAM)
Weightedaveragematurity(in days)
Commercial paper $ — N/A $ 1,127,836 7 Money market funds — N/A 2,024,521 1 Repurchase agreements — N/A 800,000 9 U.S. guaranteed obligations:
U.S. Treasury bills 6,011,490 0.20 — N/AU.S. Treasury bonds and notes 6,833,478 4.61 — N/AU.S. Treasury strips 34,916 16.92 — Index linked government bonds 194,178 11.13 — N/AU.S. government guaranteed bonds and notes 79,647 0.97 — N/AAsset-backed 88,619 4.01 — N/AGNMA mortgage-backed pass-through 1,317,483 1.92 — N/AGNMA TBA mortgage-backed pass-through 97,783 1.64 — N/AGNMA CMO's and CMBS1 179,568 3.42 — N/A
Federal agencies:Unsecured bonds and notes 416,157 4.17 — N/AAgency strips 13,597 6.58 — N/AMortgage-backed pass-through 4,667,096 2.20 — N/AFNMA, FHLMC TBA mortgage-backed pass-through 1,806,956 1.55 — N/AMortgage-backed CMO's and CMBS1 1,265,955 1.72 — N/A
Domestic bonds and notes:Corporate 6,767,555 4.98 — N/ANon-government asset and mortgage-backed 660,294 2.10 38,485 27 Non-government backed CMO's and CMBS1 1,558,072 3.76 1,282 27 Municipal/provincial 42,696 7.17 — N/A
International bonds and notes:Government and agency 780,628 3.36 — N/ACorporate 1,371,367 3.95 — N/ANon-government asset and mortgage-backed 271,410 0.13 — N/ANon-government backed CMO's and CMBS1 24,959 (0.05) — N/A
Futures contracts - long (debt)2 6,697 3.84 — N/AFutures contracts - short (debt)2 (6,857) 7.73 — N/ACredit default swaps2 (978) — — N/AInterest rate swap contracts2 32 6.47 — N/A Total debt investments $ 34,482,798 $ 3,992,124
1 Includes investments in IOs, POs, and INVs totaling $73 million at June 30, 2020.2 The futures and swap contracts effective weighted duration was calculated using notional values (in U.S. $) rather than fair values.
2020 STATE OF FLORIDA CAFR
92

Interest rate risk information for debt investments sold short is presented below (in thousands).
FRS Pension Trust FundSold Short1 Debt Investment Positions
As of June 30, 2020
Investment typeFair value(duration)
Effective weightedduration (in years)
GNMA commitments to sell (TBAs) $ (27,400) 1.07
FNMA, FHLMC commitments to sell (TBAs) (37,204) 1.83
Total debt investments sold short1 $ (64,604)
¹ Investments sold short are reported as liabilities on the Statement of Fiduciary Net Position.
Presented below are interest rate risk schedules for all debt-related investments managed by the SBA (excluding the FRS Pension Trust Fund), as of June 30, 2020 (in thousands). Certain investment types may be presented using two or more interest rate risk methods if the investment types are managed using different techniques. For example, if investments are purchased to match scheduled debt payments, to coincide with Lottery prize payouts, or are entirely client directed investments, the investments are presented using the segmented time distribution method. If investments are in a portfolio that contains weighted average maturity restrictions, the investments are presented using this method. If investments are subject to certain restrictions on duration, then that method is used. Individual investments are only included in one of the following three methods scheduled below.
Debt Investments Managed by SBA (except FRS Pension Trust Fund)That Use Segmented Time Distribution Method
As of June 30, 2020 Investment maturities (in years)
Investment typeTotal fair
value Less than or
equal to 1 > 1 to 3 > 3 to 5 > 5 to 10 >10 to 15 > 15 to 20 > 20 U.S. guaranteed obligations:
U.S. Treasury bills $ 373,355 $ 373,355 $ — $ — $ — $ — $ — $ — U.S. Treasury bonds, notes, and SLGS* 58,528 26,146 32,382 — — — — —
U.S. Treasury strips 323,997 22,599 45,066 46,160 124,289 36,672 26,514 22,697 Total debt investments $ 755,880 $ 422,100 $ 77,448 $ 46,160 $ 124,289 $ 36,672 $ 26,514 $ 22,697
* Special U.S. Treasury securities for State and Local Governments.
2020 STATE OF FLORIDA CAFR
93

Debt Investments Managed by SBA (except FRS Pension Trust Fund)That Use Weighted Average Maturity Method or Duration Method
As of June 30, 2020
Investment typeFair value(duration)
Effectiveweightedduration(in years)
Fair value (WAM)
Weightedaveragematurity(in days)
Certificates of deposit $ — N/A $ 3,718,903 71 Commercial paper — N/A 7,065,756 80 Money market funds 1,116,372 0.08 2,370,265 1 Repurchase agreements — N/A 2,671,000 1 U.S. guaranteed obligations:
U.S. Treasury bills — N/A 4,679,003 100 U.S. Treasury bonds and notes 752,663 7.71 6,487,913 645 U.S. Treasury strips 5,573,006 3.47 — N/AIndex linked government bonds 55,145 12.64 — N/AU.S. government guaranteed 608 4.82 — N/AU.S. guaranteed (SBA) asset-backed 12,890 6.55 — N/AGNMA mortgage-backed pass through 24,656 1.48 — N/AGNMA commitments to purchase (TBAs) 84,232 4.66 — N/AGNMA CMO's1 13,933 0.85 — N/A
Federal agencies:Discount notes — N/A 27,984 124 Unsecured bonds and notes 44,985 11.93 100,442 78 Agency strips 685,185 8.06 — N/AMortgage-backed (FNMA, FHLMC) 224,750 2.25 — N/AFNMA, FHLMC commitments to purchase (TBAs) 141,015 3.04 — N/AMortgage-backed CMO's and CMBS1 118,065 3.77 — N/A
Domestic bonds and notes:Corporate 2,869,082 9.65 2,266,814 735 Non-government asset and mortgage-backed 256,110 1.83 — N/ANon-government backed CMO's and CMBS1 381,276 4.46 — N/AMunicipal/provincial 44,377 9.2 13,980 8 Commingled/mutual funds 2,235,483 5.40 — N/A
International bonds and notes:Government and agency 72,917 6.1 20,751 515 Corporate 300,968 9.61 1,383,161 652 Non-government asset and mortgage-backed 33,826 1.19 — N/A
Non-government backed CMO's 1,065 0.4 — N/A Mutual fund 16,263 7.92 — N/A
Total debt investments $ 15,058,872 $ 30,805,972
1 Includes Investments in IO's and INV IO's totaling $18.9 million and $570 thousand, respectively, at June 30, 2020, in the Florida Prepaid College Program, and $1.9 million in IO's in the Florida Prepaid Investment Plan.
2020 STATE OF FLORIDA CAFR
94

Component Units
Component units manage their exposure to interest rate risk through various investment policies. These policies may be obtained separately from component units. Presented below is the applicable interest rate risk information for major component units (in thousands). Amounts shown below represent only that portion of debt investments required to be disclosed by component units reporting under the GASB reporting model.
Major Component UnitsDebt Investments
That Use Segmented Time Distribution MethodAs of June 30, 2020
Investment maturities (in years)
Component unit / Investment type Total fair
value Less than
or equal to 1 > 1 to 5 > 5 to 10 > 10 University of Florida
U.S. guaranteed obligations $ 322 $ — $ 322 $ — $ — Federal agencies 20,130 20,130 — — — Bonds & notes 115,009 11,810 55,476 37,915 9,808 Bond Mutual funds 186,040 4,176 161,366 20,498 —
Total debt investments $ 321,501 $ 36,116 $ 217,164 $ 58,413 $ 9,808
Major Component UnitsDebt Investments
That Use Duration or Weighted Average Maturity MethodAs of June 30, 2020
Component unit / Investment typeFair value(duration)
Effectiveweightedduration(in years)
Fair value (WAM)
Weightedaveragematurity(in days)
Florida Housing Finance Corporation U.S. guaranteed obligations $ 153,455 2.08 $ — N/A Federal agencies 32,366 1.02 — N/A Bonds & notes 203,279 1.26 — N/A Others 5,638 2.62 — N/ACitizens Property Insurance Corporation
U.S. guaranteed obligations — N/A 1,836,762 3.67 Federal agencies — N/A 791,482 5.79 Bonds & notes — N/A 5,269,097 6.08 International bonds and notes — N/A 641,540 4.24 Total debt investments $ 394,738 $ 8,538,881
2020 STATE OF FLORIDA CAFR
95

4. Foreign Currency Risk
Foreign currency risk is the risk that changes in exchange rates that will adversely affect the fair value of an investment.
Pooled Investments with the State Treasury The State Treasury does not have any investments in foreign currency. State law and investment policy do not authorize investments in foreign currency related to State Treasury investment operations.
Other Investments
The FRS Pension Trust Fund, the LCEF, and the Florida Prepaid College Program had exposure to foreign currency risk at June 30, 2020. These funds are managed primarily by the use of “asset classes”.
The FRS Pension Trust Fund investment policy, approved on June 13, 2018 (effective July 1, 2018), by the Trustees, limits the global equity asset class (including domestic and foreign equities) to a policy range of 45-70% and a target allocation of 53%. All asset classes may hold non-U.S. securities, depending on portfolio guidelines. Within the global equity asset class, the FRS Pension Trust Fund also holds units in international equity commingled funds. The FRS Pension Trust Fund owns only a portion of the overall investment in the funds, which are also owned by other investors. Exchange-traded funds (ETFS) are investment funds that hold assets such as stocks or bonds and are traded on the stock exchanges. Participatory notes (P-notes) allow the FRS Pension Trust Fund to participate in certain foreign equity markets where direct participation is not possible due to local government regulations, tax policies, or other reasons. The FRS Pension Trust Fund’s unit holdings in the overall investments or notes themselves may be valued in U.S. dollars, but a portion of the underlying assets are exposed to foreign currency risk in various currencies. Within the alternative investment asset class, the FRS Pension Trust owns an interest in several alternative investment commingled funds (primarily limited partnerships) with other investors and, therefore, owns only a portion of the overall investment in the funds. The alternative investment funds denominated in foreign currency are presented in the foreign currency risk table below by currency. For the alternative investment funds denominated in U.S. dollars, some of the underlying investments may be exposed to foreign currency risk in various currencies. Alternative investments with potential exposure to foreign currency risk totaled approximately $27.9 billion as of June 30, 2020.
For the LCEF, Trustees approved an investment policy on June 17, 2014, that set the global equity asset class with a policy range of 61-81% and a target allocation of 71%. Other asset classes in the LCEF may hold non-U.S. securities as well, depending on portfolio guidelines.
The Florida Prepaid Program’s comprehensive investment plan limits investment in foreign equities to 25% of total equities, with the target for total equities to be 70% of actuarial reserve.
In all cases, Florida law limits the total exposure to foreign securities outside of commingled funds to 50% of the total fund. There is no requirement that this exposure to foreign currency be hedged through forward currency contracts, although some investment managers use them in many cases.
2020 STATE OF FLORIDA CAFR
96

Presented below in U.S. dollars are the FRS Pension Trust Fund investments exposed to foreign currency risk as of June 30, 2020, listed in total, by currency (in thousands).
FRS Pension Trust FundInvestments Exposed to Foreign Currency Risk (fair values in U.S.$, in thousands)
As of June 30, 2020Investment Type
Currency EquityAlternative Investments
Fixed Income Other Spot Contracts, Net
Australian dollar $ 769,883 $ — $ — $ (76,296) $ 46 Bangladesh taka 12,821 — — — — Brazilian real 420,570 — — 1,827 164 British pound sterling 2,629,332 78,753 990 — (68,462) (3,857) Canadian dollar 1,041,161 — — 26,469 1,671 Chilean peso 21,020 — — 9,347 — Chinese yuan renminbi 890,417 — — 4,794 (520) Colombian peso 4,691 — — 9,394 — Costa rican colon 1,646 — — — — Czech koruna 932 — — 4,851 — Danish krone 670,302 — — — 243 Egyptian pound 18,806 — — — — Euro 6,196,449 1,136,111 5,999 (225,288) (14,842) Ghanaian cedi 1,265 — — — — Hong Kong dollar 3,303,132 — — (23,940) 1,937 Hungarian forint 28,531 — — 14,095 — Indian rupee 638,669 — — 67,289 — Indonesian rupiah 87,304 — — 76,834 229 Israeli shekel 86,018 — — (13,952) (45) Japanese yen 3,784,549 — — 7,480 (2,144) Kenyan shilling 12,875 — — — — Kuwaiti dinar 16,111 — — — — Malaysian ringgit 58,716 — — — (786) Mauritius rupee 1,431 — — — — Mexican peso 124,785 — — 60,926 58 Moroccan dirham 5,881 — — — 17 New Taiwan dollar 1,135,386 — — (12,563) (6,251) New Zealand dollar 32,643 — — (37,846) — New Zimbabwe dollar 4,426 — — — Nigerian naira 13,028 — — — — Norwegian krone 201,833 — — (16,123) (28) Pakistani rupee 11,658 — — — — Peruvian sol 3,518 — — 15,396 — Philippines peso 57,613 — — 20,900 454 Polish zloty 48,821 — — 32,532 (110) Qatari riyal 25,622 — — — — Romanian new leu 13,092 — — 20,745 — Russian ruble 405 — — 70,027 — Saudi Arabian riyal 16,086 — — — — Singapore dollar 363,335 — — — 3,513 3,361 South African rand 204,639 — — 7,180 (11) South Korean won 1,121,823 — — 9,102 2,679 Sri Lankan rupee 4,590 — — — — Swedish krona 557,433 9,843 — 47,428 (1,118) Swiss franc 1,750,075 — — (69,629) 491 Thailand baht 88,234 — — (50,308) 349 Turkish lira 110,607 — — 9,288 44 United Arab Emirates dirham 48,768 — — — — Vietnam dong 32,610 — — — —
Total foreign currency investments 26,673,542 1,224,707 6,989 (74,990) (17,969)
Other investments with potential exposure to foreign currency risk:Alternative investments — 27,555,887 — — — P-notes and ETFs 240,589 — — — — Commingled international equity funds 7,089,845 — — — —
Total investments subject to foreign currency risk $ 34,003,976 $ 28,780,594 $ 6,989 $ (74,990) $ (17,969)
2020 STATE OF FLORIDA CAFR
97

In addition to the investments presented above, the FRS Pension Trust Fund holds positions in futures contracts that are subject to foreign currency risk. A futures contract is an agreement between two parties, a buyer and a seller, to exchange a particular good for a particular price at a particular date in the future, all of which are specified in a contract common to all participants in a market on an organized futures exchange. Upon entering into a futures contract, collateral is deposited with the counterparty, in the SBA’s name, in accordance with the initial margin requirements of the counterparty. Futures contracts are marked to market daily by the board of trade or exchange on which they are traded. The resulting gain/loss is received/paid the following day until the contract expires. The frequency of cash flows depends upon specified collateral and margin limits mutually agreed upon by the SBA and the third-party counterparty. The margin payments are exposed to foreign currency risk. The FRS Pension Trust Fund’s futures contract positions at June 30, 2020, that have exposure to foreign currency risk are presented below (values in thousands):
FRS Pension Trust FundFutures Positions Exposed to Foreign Currency Risk
As of June 30, 2020 In Local Currency
CurrencyNumber ofContracts
NotionalTraded
Exposure
NotionalMarket
ExposureUnrealizedGain/(Loss)
UnrealizedGain/(Loss)(in U.S. $)
Stock Index Futures:GBP FT SE 100 Index British pound sterling 36 2,227 2,213 (14) $ (17) Canada S&P/T SE 60 Index Canadian dollar 15 2,755 2,785 30 22 DJ Euro STOXX 50 Euro currency unit 122 3,897 3,932 35 39 TOPIX Index Future Japanese yen 24 383,908 374,040 (9,868) (91) MSCI EAFE1 U. S. dollar 1,125 99,197 100,035 838 838 MSCI Emerging markets Index1 U. S. dollar 210 10,209 10,350 141 141
1 Futures denominated in U.S. dollars are based on an index that converts the foreign issues to U.S. dollar equivalents at currency market exchange rates.
The FRS Pension Trust Fund also held positions in option contracts during the fiscal year that were subject to foreign currency risk, although no option contracts were held at June 30, 2020. An option gives the buyer a stipulated privilege of buying or selling a stated property, security, or commodity at a given price (strike price) within a specified time (for an American-style option, at any time prior to or on the expiration date). A securities option is a negotiable contract in which the seller (writer), for a certain sum of money called the option premium, gives the buyer the right to demand within a specified time the purchase (call) from or sale (put) to the option seller of a specified number of bonds, currency units, index units, or shares of stock, at a fixed price or rate, called the strike price.
The FRS Pension Trust Fund did not hold any positions in swap contracts that were exposed to foreign currency risk at June 30, 2020.
The FRS Pension Trust Fund, LCEF, and the Florida Prepaid Program and Investment Plan also enter into foreign currency exchange contracts which are agreements to exchange the currency of one country for the currency of another country at an agreed-upon price and settlement date. Currently, there are two types of foreign currency contracts being utilized by the FRS Pension Trust Fund. Spot currency contracts are used primarily for trade settlement and currency repatriation and are valued at spot (traded) currency rates. Forward currency contracts are valued at interpolated forward rates and may be used to mitigate currency risk for changes in value associated with foreign holdings, payables and/or receivables. On the Statement of Fiduciary Net Position, individual forward currency contract positions are recorded as net in Other investments, and spot currency contracts are recorded as receivables and payables. In addition, such contracts may be used to seek additional value independent of underlying equity assets. The LCEF and Florida Prepaid Plans currently utilize only spot currency contracts. All of the contracts are subject to foreign currency risk. A schedule of the FRS Pension Trust Fund’s foreign currency exchange contracts outstanding at June 30, 2020, is presented below, by currency (in thousands):
2020 STATE OF FLORIDA CAFR
98

FRS Pension Trust FundForeign Currency Exchange Contracts
As of June 30, 2020
Forward Currency Contracts Spot Currency Contracts
CurrencyReceivableNotional
PayableNotional
NetInvestment Fair Value
UnrealizedGain/(Loss)
ReceivableFair Value
PayableFair
Value
NetReceivables/
Payables
UnrealizedGain/(Loss)
Australian dollar $ 161,237 $ 237,067 $ (76,296) $ (466) $ 253 $ (207) $ 46 $ 1 Brazilian real 31,370 29,462 1,827 (81) 1,142 (978) 164 — British pound sterling 119,372 189,136 (68,445) 1,320 — (3,857) (3,857) — Canadian dollar 196,124 167,637 26,447 (2,040) 1,710 (39) 1,671 (3) Chilean peso 21,923 12,539 9,347 (37) — — — — Chinese yuan renminbi 4,752 — 4,794 42 — (520) (520) — Columbian peso 9,737 — 9,394 (343) — — — — Czech koruna 4,917 — 4,851 (67) — — — — Danish krone 2,212 2,111 — (101) 243 — 243 — Euro currency unit 251,994 474,706 (225,327) (2,614) 10,857 (25,699) (14,842) (21) Hong Kong dollar — 23,919 (23,940) (21) 4,140 (2,203) 1,937 16 Hungarian forint 14,648 — 14,095 (553) — — — — Indian rupee 77,328 9,975 67,289 (64) — — — — Indonesian rupiah 78,669 — 76,834 (1,835) 229 — 229 3 Israeli shekel — 14,055 (13,952) 102 — (45) (45) — Japanese yen 185,824 178,055 7,571 (198) 9,253 (11,397) (2,144) (24) Malaysian ringgit — — — — 275 (1,061) (786) — Mexican peso 61,873 3,000 60,926 2,053 108 (50) 58 — Moroccan dirham — — — — 17 — 17 — New Taiwan dollar 9,631 22,200 (12,563) 5 — (6,251) (6,251) 13 New Zealand dollar 119,873 155,638 (37,846) (2,081) — — — — Norwegian krone 68,045 88,182 (16,123) 4,015 — (28) (28) — Peruvian sol 27,610 11,908 15,396 (306) — — — — Philippines peso 20,821 — 20,900 79 481 (27) 454 — Polish zloty 56,261 23,394 32,532 (334) 4 (114) (110) — Romanian new leu 20,908 — 20,745 (164) — — — — Russian ruble 68,805 — 70,027 1,222 — — — — Singapore dollar 3,538 — 3,513 (25) 4,572 (1,211) 3,361 — South African rand 9,628 2,407 7,180 (41) 1,046 (1,057) (11) (3) South Korean won 34,576 25,696 9,102 222 3,646 (967) 2,679 (15) Swedish krona 116,900 69,356 47,428 (116) 281 (1,399) (1,118) — Swiss franc 152,530 221,624 (69,629) (536) 754 (263) 491 (1) Thailand baht 18,261 66,815 (50,308) (1,754) 888 (539) 349 (1) Turkish lira 9,372 — 9,288 (83) 90 (46) 44 — U.S. dollar 1,307,593 1,237,450 70,143 — 57,997 (40,063) 17,934 — Total $ 3,266,332 $ 3,266,332 $ (4,800) $ (4,800) $ 97,986 $ (98,021) $ (35) $ (35)
2020 STATE OF FLORIDA CAFR
99

A schedule of the Lawton Chiles Endowment Fund and Florida Prepaid College Fund investments exposed to foreign currency risk as of June 30, 2020, is presented below, by currency (in thousands):
Lawton Chiles Endowment Fund (LCEF) and Florida Prepaid College ProgramInvestments Exposed to Foreign Currency Risk (fair values in U.S.$, in thousands)
As of June 30, 2020
LCEFInvestment Type
Florida Prepaid Programand Investment Plan
Investment type
Currency Equity
Spot Foreign Currency
Contracts, Net Equity
Spot Foreign Currency
Contracts, NetAustralian dollar $ 11,226 $ — $ 32,459 $ — Brazilian real 3,732 — — — British pound sterling 20,263 — 60,985 (71) Canadian dollar 14,962 — — — Chinese yuan renminbi 2,677 (14) — — Czech koruna 476 — — — Danish krone 3,342 — 15,989 — Egyptian pound 136 — — — Euro currency unit 50,790 — 132,074 — Hong Kong dollar 22,855 — 12,523 — Hungarian forint 908 — — — Indonesian rupiah 1,243 (7) — — Israeli shekel 974 — — — Japanese yen 40,757 (178) 105,281 — Malaysian ringgit 1,036 (3) — — Mexican peso 2,290 — — — New Taiwan dollar 11,505 (128) — — New Zealand dollar 1,197 — 1,519 — Norwegian krone 821 — — — Philippines peso 969 — — — Polish zloty 1,009 — — — Singapore dollar 229 — 2,261 — South African rand 2,490 — — — South Korean won 10,206 — — — Swedish krona 6,629 — 8,901 — Swiss franc 19,349 — 41,679 — Thailand baht 2,534 — — — Turkish lira 938 — — —
Total investments subject to foreign currency risk $ 235,543 $ (330) $ 413,671 $ (71)
2020 STATE OF FLORIDA CAFR
100

A Schedule of the Lawton Chiles Endowment Fund’s and Florida Prepaid Program’s foreign currency exchange contracts outstanding at June 30, 2020, is presented below, by currency (in thousands):
Lawton Chiles Endowment Fund and Florida Prepaid Program Foreign Currency Exchange Contracts
As of June 30, 2020
Spot Currency Contracts
Currency Receivables Payables
Net Receivables/
Payables
Net Unrealized Gain/(Loss)
Lawton Chiles Endowment Fund:Chinese yuan renminbi $ — $ (14) $ (14) $ — Indonesian rupia — (7) (7) — Japanese yen — (178) (178) — Malaysian ringgit — (3) (3) — New Taiwan dollar — (128) (128) — U.S. dollar 330 — 330 —
Total Lawton Chiles Endowment Fund $ 330 $ (330) $ — $ —
Florida Prepaid Program:British pound sterling $ — $ (71) $ (71) — U.S. dollar 71 — 71 —
Total Florida Prepaid Program $ 71 $ (71) $ — $ —
Component Units
Component unit information regarding foreign currency risk was not readily available.
5. Security Lending
Pooled Investments with the State Treasury
Section 17.61(1), F.S., authorizes the State Treasury to participate in a security lending program. Agents of the State Treasury loan securities, including U.S. government and federally guaranteed obligations, bonds, and notes to broker/dealers for collateral with a simultaneous agreement to return the collateral for the same securities in the future. Collateral for loaned securities cannot be less than 100 percent of the fair value of the underlying security plus accrued interest. Such collateral may consist of cash or government securities. Cash collateral is invested by the agent in investments authorized by Section 17.57, F.S. Maturities of investments made with cash collateral generally are not matched to maturities of the securities loaned because security loan agreements are generally open-ended with no fixed expiration date. The collateral under security lending agreements (including accrued interest) exceeded the fair value of the securities underlying those agreements (including accrued interest) on June 30, 2020. If a situation occurs where an agent does not receive collateral sufficient to offset the fair value of any securities lent, or the borrowers fail to return the securities or fail to pay the State Treasury for income distributions by the securities’ issuers while the securities are on loan, the agent is required to indemnify the State Treasury for any losses that might occur. The State Treasury received $ 1,797,962,450 cash collateral and $3,836,638,090 non-cash collateral for securities loaned to others. Since the State Treasury does not have the ability to pledge or sell non-cash collateral securities, any non-cash portion of the collateral is not reported on the balance sheet. Securities held with others under security lending agreements with cash collateral totaled $1,751,326,801. Securities held with others under security lending agreements with non-cash collateral totaled $3,744,977,127. Security lending asset and liability balances are allocated at fiscal year-end and reported among all participating funds of the primary government.
2020 STATE OF FLORIDA CAFR
101

The securities held with others under security lending agreements as of June 30, 2020, are as follows (in thousands):
State Treasury Investments on Loan Under Security Lending AgreementsAs of June 30, 2020
Securities on Loan for Cash Collateral,by Security Type
Fair Value of Securities on Loan*
U.S. guaranteed obligations $ 1,112,742 Federal agencies 23,436 Bonds and notes - domestic 543,865 Bonds and notes - international 71,284
Total securities on loan for cash collateral 1,751,327
Securities on Loan for Non-Cash Collateral,by Security TypeU.S. guaranteed obligations 3,743,941 Bonds and notes - domestic 258 Bonds and notes - international 778
Total securities on loan for non-cash collateral 3,744,977 Total securities on loan $ 5,496,304
* The fair value equals the carrying value of the investments on loan.
Other Investments
Through the SBA, various funds, including the FRS Pension Trust Fund, the LCEF, and the Florida Prepaid College Program participate in security lending programs during the fiscal year ended June 30, 2020. Initial collateral requirements for securities on loan range from 100% to 105%, depending on the lending agent, the type of security lent and the type of collateral received. The SBA had received and invested approximately $4.3 billion in cash and $13.9 billion in U.S. government and federal agency securities as collateral for the lending programs as of June 30, 2020. At June 30, 2020, the collateral held for the security lending transactions exceeded the fair value of the securities underlying the agreements (including accrued interest) except with two borrowers in the LCEF and one borrower in the Florida Prepaid College Program totaling approximately $3 thousand in each fund. Most security lending programs have indemnity clauses requiring the lending agent to assume borrower’s risk from default. The FRS Pension Trust Fund also participated indirectly in security lending through investments in four commingled funds that do not offer borrower indemnification. The Fund receives a proportionate share of the security lending income generated from these activities. The SBA does not have the ability to pledge or sell the non-cash collateral securities, so the non-cash portion is not reported on the balance sheet or the Statement of (Fiduciary) Net Position. Maturities of investments made with cash collateral generally are not matched to maturities of the securities loaned because security loan agreements are generally open-ended with no fixed expiration date. As such, investments made with cash collateral are primarily in short-term investments. However, investments purchased for some security lending programs included investments with final maturities of six months or more representing a range of approximately 10% to 47% of total collateral invested. There are no restrictions on the amount of securities that can be loaned at one time to one borrower for most funds.
At June 30, 2020, the collateral re-investment portfolios for the FRS Pension Trust Fund and the LCEF were primarily reinvested in repurchase agreements (repos) or selected money market funds in order to maximize earnings and reduce risk. The portfolios contain some legacy non-repo securities that will remain until they are either sold or mature. At June 30, 2020, there were four lending agents, including the two master custodians and two third-party agents.
2020 STATE OF FLORIDA CAFR
102

The schedule below discloses the fair value and carrying value of investments on loan at June 30, 2020 (in thousands):
Schedule of Other Investments on Loan Under Security Lending Agreements As of June 30, 2020
Fair value of Securities on Loan1
Securities on Loan for Cash Collateral, by Security type
FRS Pension Trust Fund
Other fundsManaged by SBA Total
U.S. guaranteed obligations $ 903,219 $ 2,109,093 $ 3,012,312 Federal agencies 25,752 7,032 32,784 Domestic bonds and notes 47,583 85,268 132,851 International bonds and notes 51,916 17,624 69,540 Domestic stocks 50,807 151,942 202,749 International Stocks 700,415 14,304 714,719
Total Securities on loan for cash collateral 1,779,692 2,385,263 4,164,955
Securities on Loan for Non-Cash Collateral,by Security typeU.S. guaranteed obligations $ 2,211,585 $ 271,148 $ 2,482,733 Federal agencies — 27,060 27,060 Domestic bonds and notes 46,038 1,910 47,948 International bonds and notes 12,290 781 13,071 Domestic stocks 9,695,003 37,573 9,732,576 International stocks 1,323,527 9,114 1,332,641
Total securities on loan for non-cash collateral 13,288,443 347,586 13,636,029 Total securities on loan $ 15,068,135 $ 2,732,849 $ 17,800,984
1 The fair value of debt securities on loan includes accrued interest.
6. Derivatives
A derivative instrument is defined as a financial instrument or other contract that has all of the following characteristics:
a. Settlement factors – It has (1) one or more reference rates and (2) one or more notional amounts or payment provisions or both. These terms determine the amount of the settlement or settlements and, in some cases, whether or not a settlement is required.
b. Leverage – It requires no initial net investment or an initial net investment that is smaller than would be required for other types of contracts that would be expected to have a similar response to changes in market factors.
c. Net Settlement – Its terms require or permit net settlement, it can readily be settled net by a means outside the contract, or it provides for delivery of an asset that puts the recipient in a position not substantially different from net settlement.
Derivative instruments consisted of futures, options, forward currency contracts, and swaps.
Pooled Investments with the State Treasury
Pursuant to the State Treasury’s established investment policy guidelines, interest rate futures are used as part of the investment strategy related to interest rate risk, duration adjustments, and yield curve strategies. Although put and call options on any security are permitted under the State Treasury’s investment guidelines, interest rate futures were the only type of derivative held as of June 30, 2020. The State Treasury did not utilize derivatives for hedging activities during the fiscal year ending June 30, 2020. All of the State Treasury investment derivatives were reported at fair value in the accompanying financial statements as of June 30, 2020.
2020 STATE OF FLORIDA CAFR
103

A summary of investment derivatives traded in the State Treasury is presented below (in thousands):
Changes in Fair Value Fair Value at June 30, 2020Notional
(in U.S. $) Classification Amount Classification AmountState TreasuryInvestment derivative instruments:Futures $ (202,400) Investment Income $ (7,734) Receivable/(Payable) $ (809)
This schedule includes both long and short positions.
See section 1E of Note 1 to these financial statements regarding State Treasury’s securities pricing policies and independent pricing services methodologies related to securities not available on quoted market pricing exchanges.
Other Investments
The SBA has established investment policy guidelines for each investment portfolio. Pursuant to these guidelines, derivative investment instruments are authorized to be used as tools for managing risk or executing investment strategies more efficiently than could otherwise be done in cash markets, and may only be used as part of a prudent investment process. Various derivative investment instruments are used as part of the investment strategy to hedge against interest rate risk, currency risk in foreign markets, default risk, and mortgaged-backed security prepayment risk, and to effectively manage exposure to domestic and international equities, bonds, and real estate markets.
A futures contract is an agreement between a buyer and a seller to exchange a particular good for a particular price at a particular date in the future, all of which are specified in a contract common to all members in a market on an organized futures exchange. Upon entering into a futures contract, collateral (cash and/or securities) is deposited with the counterparty, in SBA’s name, in accordance with the initial margin requirements of the counterparty. Futures contracts are marked to market daily by the board of trade or exchange on which they are traded. The resulting gain/loss is received/paid the following day until the contract expires. The frequency of cash flows depends on specified collateral and margin limits mutually agreed upon by the SBA and third-party counterparty. Future contracts involve, to varying degrees, risk of loss in excess of the variation margin disclosed in the Statement of Fiduciary Net Position. Losses may arise from future changes in the value of the underlying instrument.
An option gives the buyer a stipulated privilege of buying or selling a stated property, security, or commodity at a given price (strike price) within a specified time (for an American-style option, at any time prior to or on the expiration date). A securities option is a negotiable contract in which the seller (writer), for a certain sum of money called the option premium, gives the buyer the right to demand within a specified time the purchase (call) from or sale (put) to the option seller of a specified number of bonds, currency units, index units, or shares of stock, at a fixed price or rate, called the strike price.
A forward currency contract is a contractual obligation, typically over-the-counter, traded between two parties to exchange a particular good or instrument (i.e., currency) at a set price on a future date. The buyer of the forward agrees to pay the price and take delivery of the good or instrument and is said to be “long” the forward contract, while the seller of the forward, or “short”, agrees to deliver the good or instrument at the agreed price on the agreed date.
A swap is a contractual agreement to exchange a stream of periodic payments utilizing a central clearing house, whereby, each party in the transaction enters into a contract with the central counterparty. These agreements may be over-the-counter or exchange-traded. Upon entering into a swap contract through a clearing house, collateral is deposited with the counterparty, in SBA’s name, in accordance with the initial margin requirements of the counterparty. Swaps are available in and between all active financial markets. Examples include:
Interest rate swap – An agreement between two parties where one stream of future interest payments is exchanged for another based on a specified principal amount. Interest rate swaps often exchange a fixed payment for a floating payment that is linked to an interest rate.
Credit default swap – An agreement that allows one party to “buy” protection from another party for losses that might be incurred as a result of default by a specified reference credit (or credits). The “buyer” of protection pays a premium for the protection, and the “seller” of protection agrees to make a payment to compensate the buyer for losses incurred if a defined credit event occurs.
2020 STATE OF FLORIDA CAFR
104

A summary of investment derivatives traded in the FRS Pension Trust Fund is presented below. As of June 30, 2020, all of the SBA investment derivatives were reported at fair value (in thousands).
Increase/(Decrease) in Fair Value Fair Value at June 30, 2020Notional
(in U.S. $) ClassificationAmount
(in U.S. $) ClassificationAmount
(in U.S. $)Fiduciary funds (FRS Pension Trust Fund)Investment derivative instruments:Futures1
Futures (debt) $ 5,499,791 Investment Income $ 34,278 Investment $ (160) Futures (equity) $ 1,074,704 Investment Income 39,186 Investment 21,743
Total futures $ 73,464 $ 21,583
Forward currency contracts $ 3,266,332 Investment Income $ 30,744 Investment $ (4,800)
OptionsOptions purchased $ — Investment Income $ (3,650) Investment $ — Options sold $ — Investment Income 3,680 Investment —
Total options $ 30 $ —
SwapsInterest rate swaps $ 216,000 Investment Income $ (11,865) Investment $ (978) Credit default swaps $ 33,925 Investment Income (13,226) Investment 32
Total swaps $ (25,091) $ (946)
1The total notional values of long and short fixed income futures positions were $3.6 billion and $1.9 billion, respectively. The total notional value of long equity futures positions was $1.1 billion.
During the fiscal year ended June 30, 2020, both the Florida Prepaid College Program and the Florida Prepaid Investment Plan traded investment derivative equity futures, incurring an overall decrease in fair value of approximately $362 thousand and $1 thousand, respectively, but neither fund held any open equity futures positions at June 30, 2020.
Increase/(Decrease) in Fair Value Fair Value at June 30, 2020Notional
(in U.S. $) ClassificationAmount
(in U.S. $) ClassificationAmount
(in U.S. $)
Investment derivative instruments:
Enterprise funds (Florida Prepaid Program)
Futures (equity) $ — Investment Income $ (362) Investment $ —
Fiduciary funds (Florida Prepaid Investment Plan)
Futures (equity) $ — Investment Income $ (1) Investment $ —
7. Commitments
Each year the FRS Pension Trust Fund enters into a number of agreements that commit the Fund, upon request, to make additional investment purchases (i.e., capital commitments) up to predetermined amounts over certain investment time periods. The unfunded capital commitments for private equity, real estate and strategic investments not reported on the FRS Pension Trust Fund Statement of Fiduciary Net Position totaled $13.5 billion as of June 30, 2020.
2020 STATE OF FLORIDA CAFR
105

8. Fair Value Hierarchy
The state categorizes its fair value measurements within the fair value hierarchy established by generally accepted accounting principles. The hierarchy is based on the valuation inputs used to measure the fair value of the asset. Level 1 inputs are unadjusted quoted prices in active markets for identical assets. Level 2 inputs are either directly or indirectly observable for an asset (including quoted prices for similar assets), which may include inputs in markets that are not considered to be active. Level 3 inputs are significant unobservable inputs.
The categorization of investments within the hierarchy is based upon the pricing transparency of the instrument and should not be perceived as the particular investment's risk.
Pooled Investments with the State Treasury
Securities classified in Level 1 are valued using quoted prices from the custodian bank’s primary external pricing vendors.
Securities classified in Level 2 are evaluated prices from the custodian bank’s primary external pricing vendors. The pricing methodology involves the use of evaluation models such as matrix pricing, which is based on the securities’ relationship to benchmark quoted prices. Other evaluation models use actual trade data, collateral attributes, broker bids, new issue pricings and other observable market information.
Debt and equity securities classified as Level 3 are valued with prices from the custodian bank’s external pricing vendors or an alternative pricing source, utilizing inputs such as stale prices, cash flow models, broker bids, or cost. Cost or book value may be used as an estimate of fair value when there is a lack of an independent pricing source.
Certain investments, such as money market funds and repurchase agreements, are not included in the table, because they are carried at cost and not priced at fair value. Unemployment compensation funds are not included in the table, because this money is pooled with deposits from other states and is managed by the Federal Government. No disclosures can be made of specific securities owned.
At June 30, 2020, the State Treasury had the following recurring fair value measurements (in thousands):
Investments and Derivative Instruments Measured at Fair ValueAs of June 30, 2020
Investments by fair value level Total Level 1 Level 2 Level 3Commercial paper $ 49,995 $ — $ 49,995 $ — U.S. guaranteed obligations 11,656,116 11,134,322 521,794 — Federal agencies 7,306,148 — 7,306,148 — Bonds and notes - domestic 6,781,188 — 6,781,188 — Bonds and notes - international 996,547 — 996,547 — Commingled STIF 715,386 — — 715,386 Lending collateral investments:
Federal agencies 449,407 — 449,407 — Bonds and notes - domestic 67,077 — 67,077 — Bonds and notes - international 64,543 — 64,543 —
Total investments by fair value level $ 28,086,407 $ 11,134,322 $ 16,236,699 $ 715,386
Investment derivative instrumentsFutures contracts $ (809) $ (809) $ — $ — Total investment derivative $ (809) $ (809) $ — $ —
2020 STATE OF FLORIDA CAFR
106

Other Investments
Debt and equity securities classified in Level 1 of the fair value hierarchy are valued using quoted prices at June 30 (or the most recent market close date if the markets are closed on June 30) in active markets from the custodian bank’s primary external pricing vendors, which utilize primary exchanges.
Debt securities classified in Level 2 are valued using evaluated prices from the custodian bank’s external pricing vendors. The pricing methodology involves the use of evaluation models such as matrix pricing, which is based on the securities’ relationship to benchmark quoted prices. Other evaluation models use actual trade data, collateral attributes, broker bids, new issue pricings and other observable market information.
Equity securities classified as Level 2 are valued using evaluated prices provided by the custodial bank’s external pricing vendors, or alternative pricing source, such as investment managers, if information is not available from the primary vendors.
Debt and equity securities classified as Level 3 are valued with prices from the custodian bank’s external pricing vendors or an alternative pricing source, utilizing inputs such as stale prices, cash flow models, or broker bids. Cost or book value may be used as an estimate of fair value when there is a lack of an independent pricing source.
Derivative instruments classified in Level 1 of the fair value hierarchy are exchange traded prices as provided by the custodian bank’s external pricing vendors. Derivative instruments classified as Level 2 receive clearing house prices, which are based on models that reflect the contractual terms of the derivatives.
Private equity funds and real estate direct investments classified as Level 3 are valued using the methodology as described in the footnotes for the Additional GASB 72 Required Disclosures table, footnotes 11 and 13, respectively. Other private equity funds are measured at net asset value (NAV).
Certain investments, such as money market funds, repurchase agreements and U.S. guaranteed State and Local Government Series (SLGS) securities are not reported at fair value in the tables below because they are carried at cost and not priced at fair value. Additionally, U.S. guaranteed securities in the Debt Service Escrowed Fund and all investments of the Local Government Surplus Funds Trust Fund are not included at fair value in the tables below because they are carried at cost and amortized cost, respectively. See page 78 for information to obtain the Local Government Surplus Funds Trust Fund investment detail. Commingled investments are measured at the NAV per share (or its equivalent).
2020 STATE OF FLORIDA CAFR
107

The FRS Pension Trust Fund had the following fair value measurements as of June 30, 2020 (in thousand):
FRS Pension Trust FundAs of June 30, 2020
Fair Value Measurement UsingInvestments by fair value level Total Fair Value Level 1 Level 2 Level 3
Debt securitiesCommercial paper $ 1,127,836 $ — $ 1,127,836 $ — U.S. guaranteed obligations 14,837,162 — 14,837,162 — Federal agencies 8,169,761 — 8,169,761 — Domestic bonds and notes 9,023,625 — 8,978,225 45,400 International bonds and notes 2,448,364 — 2,163,023 285,341
Total debt securities 35,606,748 — 35,276,007 330,741 Equity securities
Domestic 48,275,740 48,275,721 — 19 International 31,129,943 31,087,078 — 42,865 Commingled international equity funds 252,943 — 252,943 —
Total equity securities 79,658,626 79,362,799 252,943 42,884 Alternative Investments
Private equity fund 302,200 — — 302,200
Real Estate direct investments 9,752,973 — — 9,752,973 Derivative Instruments, net
Forward currency contracts (4,800) — (4,800) — Futures contracts 21,583 21,583 — — Option contracts — — — — Swap contracts (946) — (946) —
Total Investment derivative instruments 15,837 21,583 (5,746) — Securities lending collateral investments
Domestic bonds and notes 44,759 — 39,767 4,992 Total investments by fair value level 125,381,143 $ 79,384,382 $ 35,562,971 $ 10,433,790
Investments Measured at the Net Asset Value (NAV)Commingled international equity funds 6,836,902 Commingled real estate investment funds 2,243,510 Activist equity funds 896,488 Hedge funds 4,463,590 Insurance funds 838,728 Private debt/credit opportunities funds 3,016,671 Private equity funds 14,392,939 Private real asset funds 4,869,978
Total investments measured at the NAV 37,558,806 Total investments measured at fair value 162,939,949
Other investments carried at amortized costMoney market funds 238,806 Money market funds - security lending collateral 1,785,715 Repurchase agreements 800,000
Total investments carried at amortized cost 2,824,521 Total investments $ 165,764,470
Investments sold short (Liabilities) measured at fair valueU.S. guaranteed obligations $ (27,400) $ — $ (27,400) $ — Federal agencies (37,204) — (37,204) —
Total investments sold short $ (64,604) $ — $ (64,604) $ —
2020 STATE OF FLORIDA CAFR
108

The valuation method for investments measured at the net asset value (NAV) per share (or its equivalent) as of June 30, 2020, is presented in the footnotes to the table below (in thousands):
FRS Pension Trust FundAdditional GASB 72 Required Disclosures
Fair Value6/30/2020
UnfundedCommitments
RedemptionFrequency (If
Currently Eligible)Redemption
Notice Period
Investments Measured at the NAV:
Commingled international equity funds1 $ 6,836,902 $ — Daily, Monthly 2 - 120 days
Commingled real estate investment funds2 2,243,510 — Quarterly 15 - 90 days
Activist equity funds3 896,488 — Monthly, Annually 65 - 90 days
Hedge funds
Diversifying strategies (managed futures)4 1,398,836 — Daily, Monthly 10 - 35 days
Equity long/short5 457,935 — Monthly, Quarterly 30 - 60 days
Event driven6 143,980 — Biennially 90 days
Global macro7 711,353 — Monthly, Quarterly 5 - 45 days
Multi-strategy8 930,263 — Quarterly, Annually,
Biennially 60 - 90 days
Opportunistic debt9 397,819 — Quarterly, Annually 60 - 90 days
Relative value10 423,404 — Quarterly 45 - 90 days
Insurance funds11 838,728 103,793 Monthly, Quarterly,
Biannually 30 - 90 days
Private debt/credit opportunity funds12 3,016,671 2,776,955
Private equity funds13 14,392,939 7,180,992
Private real asset funds14 4,869,978 3,289,595
Total Investments Measured at the NAV $ 37,558,806 $ 13,351,335
Investments Measured at Level 3:
Private equity funds13 $ 302,200 $ —
Real estate direct investment15 $ 9,752,973 $ 125,556
1 Commingled International Equity Funds. The six funds in this group are primarily invested in publicly traded international equity securities. Three of these funds focus on emerging markets. Each are valued at the NAV of units held at the end of the period based upon the fair value of the underlying investments. Four funds within this strategy are redeemable daily and two funds are redeemable monthly.2 Commingled Real Estate Investment Funds. The eight funds in this group consist primarily of real estate investments owned directly or through partnership interests located in the United States. These investments include multi-family, industrial, retail, office, apartments and mortgage loans on income producing property. Each are valued at the NAV of units held at the end of the period based upon the fair value of the underlying investments. All funds within this strategy are eligible for redemption quarterly.3Activist Equity Funds. The three funds in this group invest in public companies with the intent to effect positive change through influencing management. The funds may be structured with a focus on specific domestic or foreign geographic regions. These investments are valued at the NAV per share. One fund (approximately 42% of this strategy) is currently eligible for redemption monthly. Another fund (approximately 34% of this strategy) is eligible for redemption in six months due to annual lock-up restrictions. The remaining fund (approximately 24% of this strategy) is eligible for redemption in nine months due to contractual lock-up restrictions.4Diversifying Strategies (Managed Futures) Hedge Funds. The three funds that make up this group primarily trade equity and commodity futures, but can also participate in indexes, rates and currencies in markets across global markets. These funds use a systematic approach and focus on trends in price and other market signals. These investments are valued at the NAV per share. All funds within this strategy are redeemable within a month or less, as they are not subject to lock-up restrictions.5Equity Long/Short Hedge Funds. Consisting of four funds, this strategy invests both long and short, primarily in U.S. and global stocks that are mispriced by the markets. These managers vary in their use of short selling, leverage and definitions of growth or value. These funds are valued at the NAV per share. Two funds (approximately 32% of the value of this strategy) are currently eligible for redemption monthly, while the remaining two funds (approximately 68% of this strategy) are redeemable in three months or less due to quarterly redemption restrictions.6Event Driven Hedge Funds. The two funds in this group seek to gain an advantage from pricing inefficiencies that may occur in the onset or aftermath of a corporate action or related event. These investments are valued at the NAV per share. The funds in this strategy are no longer under contractual lockup, but due to exit restrictions, the redemption period ranges from three to six months. 7Global Macro Hedge Funds. Consisting of six funds, which base their holdings (such as long and short positions in various equity, fixed income, currency, and futures markets) primarily on overall economic and political view of various countries. These funds are valued at the NAV per share. All funds in this strategy are no longer subject to contractual lock-up, and are redeemable in three months or less due to monthly and quarterly redemption restrictions.8Multi-Strategy Hedge Funds. The three funds in this group aim to diversify risks and reduce volatility by combining other strategies. These strategies are usually a mix of Equity Long/Short, Event-Driven, or Opportunistic Debt and Relative Value. These funds are valued at the NAV per share. One fund (approximately 30% of this strategy) is eligible for redemption in six months or less due to annual redemption restrictions. Another fund (approximately 44% of this strategy) is eligible for redemption biennially with the next redemption date in five months. The remaining fund (approximately 26% of this strategy) is eligible for redemption quarterly with the next redemption in three months.9Opportunistic Debt Hedge Funds. Consisting of four funds that pursue various strategies and asset classes, with an emphasis on mispriced debt or equity of companies in distress. These managers vary in their focus on early versus late stage situations, senior versus subordinated levels on the capital structure and
2020 STATE OF FLORIDA CAFR
109

non-traditional areas including high yield bonds and Emerging Markets debt, and may also pursue relative value and arbitrage strategies with various debt instruments. These funds are valued at the NAV per share. One fund (approximately 29% of this strategy) is eligible for redemption in six months due to annual redemption restrictions. Three funds (approximately 71% of this strategy) are currently eligible for redemption in three months due to quarterly redemption restrictions.10Relative Value Hedge Funds. Consisting of three funds, this strategy focuses on benefiting from valuation discrepancies that may be present in related financial instruments by simultaneously purchasing (long) or selling (short) these instruments. These investments are valued at the NAV per share. All funds in this strategy are no longer subject to contractual lock-up, and are redeemable in three months or less due to quarterly redemption restrictions.11Insurance funds. The five funds in this group invest primarily in reinsurance contracts and insurance-linked securities. These investments are valued at NAV per share. Two funds (approximately 39%) are eligible for redemption in seven months or less due to biannual redemptions restrictions. One fund (approximately 26%) is eligible for redemption in six months, subject to exit restrictions. One fund (approximately 29%) has varying restrictions due to underlying investment funds and redeemable within one to three months. The remaining fund (approximately 6%) is not eligible for redemption due to contractual lock-up restrictions.12Private Debt/Credit Opportunity Funds. There are 54 private debt/credit funds investing primarily in Distressed, Mezzanine and Loans with some exposure to Special Situations. The fair value of these funds has been determined using the NAV at June 30, 2020 or one quarter in arrears adjusted for current quarter cash flows. These funds are not eligible for redemption. Distributions are received as underlying investments within the funds are liquidated, which on average can occur over the span of five to ten years.13Private Equity funds. There are 210 private equity funds investing primarily in Leveraged Buyouts funds, Venture Capital funds, Secondary funds and Growth funds with some exposure to Special Situations, Diversifying Strategies and GP Investments. The fair value of 208 funds has been determined using the NAV at June 30, 2019, or one quarter in arrears adjusted for current quarter cash flows. The fair value of the remaining two funds (approximately 2% of the value of these investments) was based on external appraisals at June 30, 2019, and classified as Level 3. These funds are not eligible for redemption. Distributions are received as underlying investments within the funds are liquidated, which on average can occur over the span of five to ten years.14Private Real Asset Funds. There are 74 real asset funds, 52 of which invest in real estate assets such as commercial office buildings, retail properties, multi-family residential properties, developments or hotels. In addition, the funds may be structured with a focus on specific geographic domestic or foreign regions. The remaining 22 funds invest in infrastructure, timberland, transportation and commodities. The fair value of these funds has been determined using the NAV at June 30, 2019, or one quarter in arrears adjusted for current quarter cash flows. These funds are not eligible for redemption. Distributions are received as underlying investments within the funds are liquidated, which on average can occur over the span of five to ten years.15Direct Real Estate Investments. There are 69 direct owned/joint venture real estate assets that are valued based on annual external and/or quarterly internal appraisals and are classified as Level 3.
2020 STATE OF FLORIDA CAFR
110

The schedule below discloses the fair value measurements for all other funds managed by the SBA (excluding the FRS Pension Trust Fund) at June 30, 2020, (in thousands):
All SBA Managed Funds (except FRS Pension Trust Fund)As of June 30, 2020
Fair Value Measurement Using
Investments by fair value level Total Fair Value Level 1 Level 2 Level 3Debt securities
Commercial paper $ 19,992 $ — $ 19,992 $ — U.S. guaranteed obligations 16,976,693 — 16,976,693 — Federal agencies 1,292,401 — 1,291,406 995 Domestic bonds and notes 5,796,014 — 5,793,918 2,096 International bonds and notes 1,812,688 — 1,812,688 —
Total debt securities 25,897,788 — 25,894,697 3,091 Equity securities
Domestic 2,644,778 2,644,778 — — International 761,864 761,864 — —
Total equity securities 3,406,642 3,406,642 — — Other investments
Domestic bonds and notes mutual funds 176,726 176,726 — — International bonds and notes mutual funds 16,263 16,263 Domestic equity mutual funds 594,072 594,072 — — International equity mutual funds 633,523 633,523 — — Self-directed brokerage account 817,186 — 817,186 —
Total other investments 2,237,770 1,420,584 817,186 — Securities lending collateral investments
Certificates of deposit 671,418 — 671,418 — Commercial paper 677,994 — 677,994 — Federal agencies 50,025 50,025
Total securities lending collateral investments 1,399,437 — 1,399,437 — Total investments by fair value level 32,941,637 $ 4,827,226 $ 28,111,320 $ 3,091
Investments Measured at the Net Asset Value (NAV)Commingled domestic bonds and notes funds 2,058,757 Commingled domestic equity funds 3,500,971 Commingled international equity fund 1,685,037 Commingled real asset fund 769,608
Total investments measured at the NAV 8,014,373 Total investments measured at fair value 40,956,010
Other investments carried at cost or amortized costMoney market funds 3,481,223 Money market funds - security lending collateral 4,924 Certificates of deposit 3,044,834 Commercial paper 6,360,142 Repurchase agreements 1,650,000
Repurchase agreements - security lending collateral 1,021,000 U.S. guaranteed obligations 1,463,171 Domestic bonds and notes 35,625
Total investments carried at cost or amortized cost 17,060,919 Total investments $ 58,016,929
2020 STATE OF FLORIDA CAFR
111

The valuation method for investments measured at the net asset value (NAV) per share (or its equivalent) as of June 30, 2020, is presented in the footnotes to the table below (in thousands):
All SBA Managed Funds (except FRS Pension Trust Fund)Additional GASB 72 Disclosures
6/30/2020Unfunded
Commitments
Redemption Frequency
(If Currently Eligible)
Redemption Notice Period
Investments Measured at the NAV
Commingled domestic bonds and notes funds1 $ 2,058,757 $ — Daily 2 - 15 Days
Commingled domestic equity funds2 3,500,971 — Daily 1 - 5 Days
Commingled international equity fund3 1,685,037 — Daily 2 Days
Commingled real asset funds4 769,608 — Daily 1 - 15 Days
Total investments measured at the NAV $ 8,014,373
1Commingled Domestic Bonds and Notes Funds: Two Treasury Inflation-Protected Securities (TIPS) funds and six domestic bonds and notes funds are considered to be commingled in nature. The TIPS funds seek long-term real total return and is designed to keep pace with inflation. The six domestic bonds and notes funds utilize various investment strategies such as short/intermediate duration, index/benchmark tracking, high-yield, and corporate/government investment grade debt. Each fund is valued at the NAV of units held at the end of the period, based upon the fair value of the underlying investments. There were no unfunded commitments related to this investment type. 2Commingled Domestic Equity Funds: Seven domestic equity funds are considered to be commingled in nature. The domestic equity funds utilize various investment strategies such as index/benchmark tracking, small/mid cap, and large cap growth/value seeking appreciation and income. Each fund is valued at the NAV of units held at the end of the period, based upon the fair value of the underlying investments. There were no unfunded commitments related to this investment type. 3Commingled International Equity Fund: One international equity fund is considered to be commingled in nature. The fund invests in a portfolio of international equity securities whose total rates of return will approximate as closely as practicable the capitalization weighted total rates of return of the markets in certain countries for equity securities traded outside the United States. The fund is valued at the NAV of units held at the end of the period, based upon the fair value of the underlying investments. There were no unfunded commitments related to this investment type. 4Commingled Real Asset Funds: These two funds consist of various investments such as commodities, real estate, floating rate loans, energy industry Master Limited Partnerships, global infrastructure and agriculture. These funds are valued at the NAV of units held at the end of the period, based upon the fair value of the underlying investments. There were no unfunded commitments related to this investment type.
Component Units
Securities classified in Level 1 of the fair value hierarchy are valued using quoted prices in active markets from the custodian bank’s primary external pricing vendors.
Securities classified in Level 2 are evaluated prices from the custodian bank’s primary external pricing vendors, or alternative pricing source, such as investment managers, if information is not available from the primary vendors. The pricing methodology involves the use of evaluation models such as matrix pricing, which is based on the securities’ relationship to benchmark quoted prices. Other evaluation models use actual trade data for similar securities, collateral attributes, broker bids, new issue pricings and other observable market information.
Securities classified as Level 3 are valued with prices from the custodian bank’s external pricing vendors or an alternative pricing source, utilizing cash flow models.
Certain investments, such as commercial paper, repurchase agreements, money market funds, and various investment agreements, are not included in the table, because they are carried at cost and not priced at fair value.
2020 STATE OF FLORIDA CAFR
112

The schedule below discloses the fair value measurements for major component units at June 30, 2020, (in thousands):
Major Component UnitsAs of June 30, 2020
Fair Value Measurement Using
Investment by fair value level Total Fair Value Level 1 Level 2 Level 3
Florida Housing Finance Corporation (FHFC)Debt securities
U.S. guaranteed obligations $ 1,525,140 $ — $ 1,525,140 $ — Federal agencies 6,508 — 6,508 — Domestic bonds and notes 250,503 — 250,503 —
Total debt securities 1,782,151 — 1,782,151 —
Other investments 13,115 — 13,115 — Total FHFC investments by fair value level $ 1,795,266 $ — $ 1,795,266 $ —
Citizens Property Insurance Corporation (CPIC)Debt securities
U.S. guaranteed obligations $ 1,836,762 $ 1,836,762 $ — $ — Federal agencies 791,482 1,894 789,588 — Domestic bonds and notes 5,269,097 — 5,269,097 — International bonds and notes 641,540 — 641,540 —
Total CPIC investments by fair value level $ 8,538,881 $ 1,838,656 $ 6,700,225 $ —
University of Florida (UF)Debt securities
U.S. guaranteed obligations $ 322 $ — $ 322 $ — Federal agencies 20,129 15,998 4,131 — Domestic bonds and notes 114,008 41,372 72,636 — International bonds and notes 1,001 — 1,001 —
Total debt securities 135,460 57,370 78,090 — Equity securities
Domestic 129,898 128,476 29 1,393 Total equity securities 129,898 128,476 29 1,393
Mutual funds 333,115 228,525 104,590 — Real estate investments 3,054 3,054 — — Other investments 31,841 13,871 15,678 2,292
Total UF investments by fair value level 633,368 $ 431,296 $ 198,387 $ 3,685
Investments Measured at the Net Asset Value (NAV)Unfunded
Commitments
RedemptionFrequency (If
CurrentlyEligible)
RedemptionNotice :Period
University of FloridaInternational equity commingled funds1 $ 89 $ — Illiquid N/AReal estate investments2 6,635 — Illiquid N/AHedge funds - Multi-strategy3 5,646 — Quarterly 45 DaysPrivate equity funds4 3,756,975 271,263 Monthly 30 - 45 daysTotal investments measured at the NAV 3,769,345 Total investments measured at fair value $ 4,402,713
1 International equity: This category included an investment in a foreign-based publicly-traded company focused on providing law enforcement with new tools and technology.2 Real estate investments: This category includes contributions in the form of real estate with donor restrictions that the properties are to be sold and the proceeds to benefit the University or University of Florida Foundation The real estate is held at fair value less estimated costs to sell.3 Hedge Funds: This category includes an investment in a hedge fund in which the fund manager is authorized to invest in a broad spectrum of securities that include, but are not limited to the following: equity and debt securities, currency, commodities, foreign debt, options, futures and swaps.4 Private Equity Funds: This category includes investments in several limited partnership funds that invest in equity securities and debt of private companies.
2020 STATE OF FLORIDA CAFR
113

THIS PAGE INTENTIONALLY LEFT BLANK
114

NOTE 3 - RECEIVABLES AND PAYABLES
“Receivables, net” and “Other loans and notes receivable, net,” as presented on the Government-wide Statement of Net Position and the applicable balance sheets and statements of net position in the fund financial statements, consist of the following (in thousands):
GOVERNMENTAL ACTIVITIES
General Fund
Natural Resources, Environment, and
Growth Management
Public Education
Health andFamily
Services TransportationAccounts receivable $ 170,285 $ 12,282 $ 106 $ 1,166,286 $ 12,276 Contracts & grants receivable 291 554 60 — 2,510 Due from Federal government 3,544 22,896 26,060 1,079,316 55,572 Due from other governmental units 468 3,344 — 1,237 28,274 Interest & dividends receivable 58,374 2,242 1,784 286 11,092 Loans & notes receivable 145,374 179,406 — — 11,304 Fees receivable 116,336 11 — — — Taxes receivable 3,412,643 21,917 255 — 240,043 Allowance for uncollectibles (1,945,931) (5,778) (24) (47,995) (21,245) Receivables, net $ 1,961,384 $ 236,874 $ 28,241 $ 2,199,130 $ 339,826
Loans & notes receivablefrom other governments $ — $ 1,759,394 $ — $ — $ 465,443
Long-term interest receivable — — — — 390 Other loans & notes receivable 5,405 — 3,537 346,060 66,475 Allowance for uncollectibles (40) — (2,269) (313,279) (39,275) Other loans & notes receivable, net $ 5,365 $ 1,759,394 $ 1,268 $ 32,781 $ 493,033
(Continued below)
NonmajorGovernmental
Funds
TotalGovernmental
Funds
InternalServiceFunds
Government-wideReconciling
Balances
Total Governmental
ActivitiesAccounts receivable $ 480,399 $ 1,841,634 $ 71,100 $ 114,068 $ 2,026,803 Contracts & grants receivable 28,179 31,594 — — 31,594 Due from Federal government 195,667 1,383,055 — — 1,383,055 Due from other governmental units 39,738 73,061 6,343 — 79,404 Interest & dividends receivable 2,382 76,160 1,398 — 77,558 Loans & notes receivable 123,616 459,700 — — 459,700 Fees receivable 355 116,702 — — 116,702 Taxes receivable 9,610 3,684,468 — — 3,684,468 Allowance for uncollectibles (223,976) (2,244,949) (1,656) — (2,246,605) Receivables, net $ 655,970 $ 5,421,426 $ 77,185 $ 114,068 $ 5,612,679
Loans & notes receivablefrom other governments $ 746,537 $ 2,971,374 $ — $ — $ 2,971,374
Long-term interest receivable — 390 — — 390 Other loans & notes receivable 50,943 472,420 — — 472,420 Allowance for uncollectibles (15,192) (370,055) — — (370,055) Other loans & notes receivable, net $ 782,288 $ 3,074,129 $ — $ — $ 3,074,129
2020 STATE OF FLORIDA CAFR
115

BUSINESS-TYPE ACTIVITIES
Transportation Lottery
HurricaneCatastrophe
FundPrepaid College
ProgramReemployment
AssistanceAccounts receivable $ 5,643 $ 81,186 $ 754,961 $ 80,102 $ 231,097 Due from Federal government — — — — 599,274 Due from other governmental units 133 — — — 562 Interest & dividends receivable 2,974 1,011 49,097 36,101 54,547 Loans & notes receivable — — — 245,412 — Fees receivable 4,377 — — — 1,293 Taxes receivable — — — — 127,103 Allowance for uncollectibles — (5,421) — — (333,916) Receivables, net $ 13,127 $ 76,776 $ 804,058 $ 361,615 $ 679,960
Loans & notes receivable $ 74,061 $ — $ — $ 1,836,467 $ — Allowance for uncollectibles — — — — — Other loans & notes receivable, net $ 74,061 $ — $ — $ 1,836,467 $ —
(Continued below)
NonmajorEnterprise
Funds
TotalEnterprise
Funds
Government-wideReconciling
Balances
TotalBusiness-type
ActivitiesAccounts receivable $ 51,443 $ 1,204,432 $ 152,078 $ 1,356,510 Due from Federal government — 599,274 — 599,274 Due from other governmental units 28,441 29,136 — 29,136 Interest & dividends receivable 615 144,345 — 144,345 Loans & notes receivable 102 245,514 — 245,514 Fees receivable 109 5,779 — 5,779 Taxes receivable — 127,103 — 127,103 Allowance for uncollectibles (48,744) (388,081) — (388,081) Receivables, net $ 31,966 $ 1,967,502 $ 152,078 $ 2,119,580
Loans & notes receivable $ 4,896 $ 1,915,424 $ — $ 1,915,424 Allowance for uncollectibles (1,748) (1,748) — (1,748) Other loans & notes receivable, net $ 3,148 $ 1,913,676 $ — $ 1,913,676
COMPONENT UNITS
Accounts receivable $ 1,718,833 Contracts & grants receivable 241,401 Due from Federal government 10,538 Due from other governmental units 247,970 Interest & dividends receivable 94,145 Loans & notes receivable 204,125 Allowance for uncollectibles (422,889) Receivables, net $ 2,094,123
Other loans & notes receivable $ 2,541,743 Allowance for uncollectibles (217,842) Other loans & notes receivable, net $ 2,323,901
2020 STATE OF FLORIDA CAFR
116

“Accounts payable and accrued liabilities,” as presented on the Government-wide Statement of Net Position and the applicable balance sheets and statements of net position in the fund financial statements, consist of the following (in thousands):
GOVERNMENTAL ACTIVITIES
GeneralFund
Natural Resources, Environment, and
Growth Management
Public Education
Health andFamily Services Transportation
Accounts payable $ 622,468 $ 39,291 $ 25,732 $ 476,941 $ 368,424 Accrued salaries & wages 45,222 3,178 75 14,579 5,862 Accrued interest payable — — — — — Claims payable — — — — — Construction contracts 403 — — — 302,274 Deposits payable 189 735 — 10 9,619 Due to Federal government — — — 195,842 — Due to other governmental units 39,914 11,881 736 5,979 6,159 Other payables — — — — — Accounts payable andaccrued liabilities $ 708,196 $ 55,086 $ 26,542 $ 693,351 $ 692,338
(Continued below)
NonmajorGovernmental
Funds
TotalGovernmental
Funds
InternalServiceFunds
Government-wideReconciling
Balances
TotalGovernmental
ActivitiesAccounts payable $ 292,814 $ 1,825,670 $ 39,046 $ 284,704 $ 2,149,420 Accrued salaries & wages 4,323 73,239 1,311 — 74,550 Accrued interest payable — — — — — Claims payable — — 177,322 — 177,322 Construction contracts 201 302,878 — — 302,878 Deposits payable 113 10,666 — — 10,666 Due to Federal government 1,200 197,042 — — 197,042 Due to other governmental units 48,662 113,331 — — 113,331 Other payables — — 5,515 — 5,515 Accounts payable andaccrued liabilities $ 347,313 $ 2,522,826 $ 223,194 $ 284,704 $ 3,030,724
2020 STATE OF FLORIDA CAFR
117

BUSINESS-TYPE ACTIVITIES
Transportation Lottery
HurricaneCatastrophe
FundPrepaid College
ProgramReemployment
AssistanceAccounts payable $ 2,308 $ 11,498 $ 650,380 $ 556,566 $ 704,871 Accrued interest payable — — 23,549 — — Accrued salaries & wages — 120 — — — Construction contracts 90,811 — — — — Deposits payable 248 1,850 — — — Due to Federal government — — — — 12,139 Accounts payable andaccrued liabilities $ 93,367 $ 13,468 $ 673,929 $ 556,566 $ 717,010
(Continued below)
NonmajorEnterprise
Funds
TotalEnterprise
Funds
Government-wideReconciling
Balances
TotalBusiness-type
ActivitiesAccounts payable $ 38,393 $ 1,964,016 $ 29,484 $ 1,993,500 Accrued interest payable — 23,549 — 23,549 Accrued salaries & wages 1,368 1,488 — 1,488 Construction contracts — 90,811 — 90,811 Deposits payable 1,267 3,365 — 3,365 Due to Federal government — 12,139 — 12,139 Accounts payable andaccrued liabilities $ 41,028 $ 2,095,368 $ 29,484 $ 2,124,852
COMPONENT UNITS
Accounts payable $ 1,147,156 Accrued interest payable 27,183 Accrued salaries & wages 392,258 Claims payable 787,178 Construction contracts 68,196 Deposits payable 226,707 Due to Federal government 4 Due to other governmental units 9,367 Vouchers payable 5,287 Accounts payable andaccrued liabilities $ 2,663,336
2020 STATE OF FLORIDA CAFR
118

NOTE 4 – TAXES AND TAX ABATEMENTS
A. Taxes
Florida levies neither a personal income tax nor an ad valorem tax on real or tangible personal property. Taxes are, however, one of the principal sources of financing state operations. A schedule of tax revenues by major tax type for each applicable major governmental fund, and for nonmajor governmental funds in the aggregate, is presented below (in thousands):
GeneralFund
Natural Resources,
Environment, and Growth Management
PublicEducation
Health and
FamilyServices Transportation
NonmajorGovernmental
Funds TotalSales and use tax $ 26,917,183 $ — $ — $ — $ — $ — $ 26,917,183 Fuel taxes:
Motor fuel tax — — — — 2,758,125 — 2,758,125 Pollutant tax — 257,317 — — — — 257,317 Aviation fuel tax — — — — 3,927 — 3,927 Solid minerals severance tax — 27,090 — — — — 27,090 Oil and gas production tax 1,588 — — — — — 1,588 Total fuel taxes 1,588 284,407 — — 2,762,052 — 3,048,047
Corporate income tax 2,509,887 — — — — — 2,509,887 Documentary stamp tax 2,829,050 — — — — — 2,829,050 Intangible personal property tax 488,765 — — — — — 488,765 Communications service tax 592,268 — 335,128 — — — 927,396 Estate tax — — — — — — — Gross receipts utilities tax — 5,728 726,935 — — — 732,663 Beverage and tobacco taxes:
Alcoholic beverage tax 286,371 — — — — 14,008 300,379 Cigarette tax 1,061,411 — — — — — 1,061,411 Smokeless tobacco tax 36,355 — — — — — 36,355 Total beverage andtobacco taxes 1,384,137 — — — — 14,008 1,398,145
Other taxes:Insurance premium tax 1,184,213 — — — — 40,963 1,225,176 Hospital public assistance tax — — — 730,581 — — 730,581 Citrus excise tax — — — — — 6,100 6,100 Pari-mutuel wagering tax 7,995 — — — — 159,853 167,848 Total other taxes 1,192,208 — — 730,581 — 206,916 2,129,705
Total $ 35,915,086 $ 290,135 $ 1,062,063 $ 730,581 $ 2,762,052 $ 220,924 $ 40,980,841
Sales andUse Tax
Governmental fund statements $ 26,917,183 Government-wide accruals 19,308 Government-wide statements $ 26,936,491
2020 STATE OF FLORIDA CAFR
119

B. Tax Abatements
For financial reporting purposes, a tax abatement is defined as an agreement between the government and an individual or entity through which the government promises to forgo tax revenues and the individual or entity promises to take a specific action after the agreement has been entered into that contributes to economic development or otherwise benefits the government or its citizens. As of June 30, 2020, tax abatement programs are as follows:
Program Name Entertainment Industry Credit New Markets Tax Credit
Program Purpose The purpose of this program is to encourage the use of this state as a site for filming, for the digital production of films, and to develop and sustain the workforce and infrastructure for film, digital media, and entertainment production.
To promote capital investment in rural and urban low-income communities by allowing taxpayers to earn credits against specified taxes by investing in qualified community development entities that make qualified low-income community investments in qualified active low-income community businesses to create and retain jobs.
Taxes being abated Corporate Income Tax; Sales and Use Tax
Corporate Income Tax and insurance Premium Tax
Authority under which abatements are entered into
s. 288.1254, F.S. s. 288.9916, F.S.
Criteria to be eligible to receive abatements and commitment of the taxpayer
Applicants must meet minimum required Florida qualified expenditures, meet minimum requirements for Florida employees, meet requirements for production type, provide proof of financing, and must not be considered obscene under chapter 847.
Qualified Community Development Entities (CDSa) apply to Department of Economic Opportuntiy to have investments approved as qualified investments for tax credits. Taxpayers then earn credits by investing in CDEs that make investments in active low-income community businesses.
How taxes are reduced Tax Credit Tax Credit
How amount of abatement is determined Statutorily defined allocation determines the amount available for award to applicants. Applicants present estimated eligible costs and a total estimated tax credit is awarded. Awardees present actual expenditures to use of the credit and an actual credit is certified.
Credit equals to 39 percent of the purchase price of the qualified investment.
Provisions for recapturing abated taxes Revocation of certificate and any taxes exempted are due with interest and penalty.
If erroneous credits are discovered during an audit of the taxpayer's books and records the amount of tax offset by the credit will be assessed.
Type of commitments other than taxes N/A N/A
Total tax revenues reduced during fiscal year (in thousands) $ 20,931 $ 28,453
2020 STATE OF FLORIDA CAFR
120

Tax abatement programs, continued:
Program Name Scholarship Funding Organizations Capital Investment Credit
Program Purpose To encourage taxpayers to make private, voluntary contributions to nonprofit scholarship-funding organizations and receive dollar for dollar tax credit against specific Florida taxes.
Attract and grow capital-intensive industries in the state
Taxes being abated Sales and Use Tax; Corporate Income Tax; Severance Taxes; Insurance Premium Tax
Corporate Income Tax; Premium Tax arising from the project
Authority under which abatements are entered into s. 1002.395, F.S. s. 220.191, F.S.
Criteria to be eligible to receive abatements and commitment of the taxpayer
Qualifying business entity shall apply to the department for approval of an allocation of statewide cap to ensure credits do not exceed the cap. Taxpayer must make the contribution to the Scholarship Funding Organization by the end of the tax year to earn the credit on the return.
Applicants must establish a qualified project certified by the State and meet minimum capital investment, job creation and wage requirements.
How taxes are reduced Tax Credit Tax Credit
How amount of abatement is determined Monetary contribution is made to qualifying Scholarship Funding Organization.
An annual credit may be claimed for up to 20 years in an annual amount up to 5 percent of the eligible capital costs generated by a qualifying project. The annual tax credit shall not exceed speficied percentages of the annual tax liability.
Provisions for recapturing abated taxes If erroneous credits are discovered during an audit of the taxpayer's books and records the amount of tax offset by the credit will be assessed.
If erroneous credits are discovered during an audit of the taxpayer's books and records the amount of tax offset by the credit will be assessed.
Type of commitments other than taxes N/A N/A
Total tax revenues reduced during fiscal year (in thousands) $ 426,719 $ 77,875
2020 STATE OF FLORIDA CAFR
121

Tax abatement programs, continued:
Program Name Contaminated Site Credit Florida Renew Prod Credit
Program Purpose To promote voluntarily rehabilitation of brownfield sites or sites contaminated with dry-cleaning solvent.
This credit is available for the production of renewable energy.
Taxes being abated Corporate Income Tax Corporate Income Tax
Authority under which abatements are entered into s. 220.1845 and s. 376.30781, F.S. s. 220.193, F.S.
Criteria to be eligible to receive abatements and commitment of the taxpayer
Participants must meet applicable eligibility criteria and enter either a Voluntary Cleanup Agreement or a Brownfield Site Rehabilitation Agreement.
Florida Renewable Energy Production Credit Program provides an annual corporate tax credit equal to $0.01/kWh of electricity produced and sold by the taxpayer to an unrelated party during a given tax year. The credit may be claimed for electricity produced and sold on or after January 1, 2013, through June 30, 2016. The combined total amount of tax credits which may be granted for all taxpayers under this section is limited to $5 million in state fiscal year 2012-2013 and $10 million per state fiscal year in state fiscal years 2013-2014 through 2016-2017.
How taxes are reduced Tax Credit Tax Credit
How amount of abatement is determined The credit is 50 percent of rehabilitation costs, up to $500,000 per site, per year. To encourage completion of site rehabilitation the applicant may claim an additional 25 percent of the total site rehabilitation costs, not to exceed $500,000, in the final year of cleanup. To encourage the construction of affordable housing an applicant meeting applicable requirements may claim an additional 25 percent of the total site rehabilitation costs, not to exceed $500,000.
The Florida Renewable Energy Production Credit, which provided $5 million for the first fiscal year of the program and $10 million for subsequent years for an annual corporate tax credit equal to $0.01/kWh of renewable electricity produced.
Provisions for recapturing abated taxes If erroneous credits are discovered during an audit of the taxpayer's books and records the amount of tax offset by the crwedit will be assessed.
If erroneous credits are discovered during an audit of the taxpayer's books and records the amount of tax offset by the credit will be assessed.
Type of commitments other than taxes N/A N/A
Total tax revenues reduced during fiscal year (in thousands) $ 28,276 $ 21,269
2020 STATE OF FLORIDA CAFR
122

Tax abatement programs, continued:
Program Name Florida Renew Tech Credit Enterprise Zone Jobs Credit
Program Purpose Provides an annual corporate tax credit equal to 75 percent of all capital costs, operation and maintenance costs, and research and development costs in connection with an investment in the production, storage and distribution of biodiesel (B10-B100), ethanol (E10- E100) and other renewable fuel in the state.
The Florida Enterprise Zone Program offers corporate and sales tax credits to businesses located within an enterprise zone for hiring residents of the zones.
Taxes being abated Corporate Income Tax Corporate Income Tax
Authority under which abatements are entered into
s. 220.192, F.S. s. 220.181, F.S.
Criteria to be eligible to receive abatements and commitment of the taxpayer
Eligible costs must be incurred between July 1, 2012, and June 30, 2016. This program allows $1 million per state fiscal year for each taxpayer with a limit of $10 million per state fiscal year.
Businesses granted an enterprise zone jobs credit against corporate income tax prior to the expiration of the program may continue to claim the credit for the same period of time it would have been available had the Enterprise Zone Program not expired. Carryovers of unused amounts of enterprise zone jobs credits may also be claimed for the same period of time they would have been available had the Enterprise Zone Program not expired. No new enterprise zone jobs credits against corporate income tax will be approved after December 31, 2015, with the exception of those under Department of Economic Opportunity Contract and with their approval.
How taxes are reduced Tax Credit Credit against tax due on the tax return
How amount of abatement is determined Applicants to the Renewable Energy Technologies Investment Tax Credit were required to provide the capital costs, operation and maintenance costs, and research and development costs incurred in connection with an investment in the production, storage and distribution of renewable fuels for transportation in the state. The sum of these costs represents the investment in renewable fuels production that was directly supported by the program.
Hiring of eligible employees within the enterprise zone
Provisions for recapturing abated taxes If erroneous credits are discovered during an audit of the taxpayer's books and records the amount of tax offset by the crwedit will be assessed.
If erroneous credits are discovered during an audit of the taxpayer's books and records the amount of tax offset by the credit will be assessed.
Type of commitments other than taxes N/A N/A
Total tax revenues reduced during fiscal year (in thousands) $ 10,935 $ 9,193
2020 STATE OF FLORIDA CAFR
123

Tax abatement programs, continued:
Program Name Hope Scholarship Credit Research and Development Tax Credit
Program Purpose The Hope Scholarship Program provides a public-school student who was subjected to an incident of violence or bullying at school the opportunity to apply for a scholarship to attend an eligible private school rather than remain in an unsafe school environment.
To encourage target industry business in the State.
Taxes being abated Sales and Use Tax Corporate Income Tax
Authority under which abatements are entered into
s. 212.1832 and s. 1002.40, F.S. s. 220.196, F.S.
Criteria to be eligible to receive abatements and commitment of the taxpayer
Applicants must purchase or register a motor vehicle qualifying for the Hope Scholarship Program in Florida may designate $105 of the state sales tax due at the time of purchase or registration to an eligible nonprofit scholarship-funding organization (SFO) participating in the Program. If the state sales tax due is less than $105, the designated amount would be the state sales tax due. Motor vehicle dealers, private tag agencies, and county tax collectors receiving contributions must remit the contributions directly to the designated nonprofit scholarship-funding organization and tax a credit on their sales and use tax return for the amount of the contributions.
Taxpayer must claim and be allowed a research credit against federal income tax for qualified research expenses under Section 41, Internal Revenue Code, and also meet the definition of a target industry business as defined in Section 288.106, F.S.
How taxes are reduced Tax Credit Tax Credit
How amount of abatement is determined Contribution is paid to a qualifying scholarship-funding organization for use in the Hope Scholarship Program.
The Florida credit is equal to 10 percent of the amount of qualified research expenses incurred in Florida and allowed under s. 41, IRC, which exceeds the base amount, defined as the average of the qualified research expenses incurred in Florida for the four tax years prior to the calendar year for which the credit is determined. The Florida credit may be prorated if the total credits applied for by all applicants exceed the credit cap (currently $9 million)
Provisions for recapturing abated taxes If erroneous credits are discovered during an audit of the taxpayer's books and records the amount of tax offset by the credit will be assessed.
If erroneous credits are discovered during an audit of the taxpayer's books and records the amount of tax offset by the credit will be assessed.
Type of commitments other than taxes N/A N/A
Total tax revenues reduced during fiscal year (in thousands) $ 68,690 $ 17,234
2020 STATE OF FLORIDA CAFR
124

Tax abatement programs, continued:
Program Name Entertainment Industry Sales Tax Exemption Program
Qualified Target Industry Tax Refund Program
Program Purpose The purpose of this program is to encourage the use of this state as a site for filming, for the digital production of films, and to develop and sustain the workforce and infrastructure for film, digital media, and entertainment production.
To encourage the growth of higher-wage jobs and a diverse economic base by providing state tax refunds to qualified target industry businesses that originate or expand in the state or that relocate to the state.
Taxes being abated Sales and Use Tax Sales and Use Tax; Corporate Income Tax; Intangible Personal Property Tax; Excise Tax; Ad Valorem Tax; Insurance premium tax; Communication services tax.
Authority under which abatements are entered into
s. 288.1258, F.S. s. 288.106, F.S.
Criteria to be eligible to receive abatements and commitment of the taxpayer
Applicants must be a production company producing specified types of content in Florida. For the purposes of this section, “qualified production company” means any production company that has submitted a properly completed application to the Department of Revenue and that is subsequently qualified by the Office of Film and Entertainment.
Applicants must be a new or expanding business in Florida, create a minimum number of new full-time jobs within one or more of Florida's designated targeted industries and meet minimum wage requirements.
How taxes are reduced Tax Exemption Tax Credit or Refund
How amount of abatement is determined Point of sale exemption on items used as an integral part of the production process in Florida, including production equipment, set design and construction, props, wardrobe, and real estate rental.
Demonstrate minimum Florida job creation, maintenance and wages paid.
Provisions for recapturing abated taxes Revocation of certificate and any taxes exempted are due with interest and penalty.
Revocation of certification and interest, penalties, attorneys' fees and expenses. A qualified target industry business that fraudulently claims a refund under this section commits a felony of the third degree and is liable for repayment of the amount of the refund plus a mandatory penalty.
Type of commitments other than taxes N/A N/A
Total tax revenues reduced during fiscal year (in thousands) $ 16,070 $ 19,338
2020 STATE OF FLORIDA CAFR
125

Tax abatement programs, continued:
Program Name Community Contribution Tax Credit Program
Program Purpose Encourage donations and local private support of projects that provide housing opportunities for persons with special needs or home ownership opportunities for low-income or very low income families.
Taxes being abated Corporate Income Tax; Insurance Premium Tax; Sales and Use Tax Refund
Authority under which abatements are entered into
s. 212.08(5)(p); s. 220.183; and s. 624.5105, F.S.
Criteria to be eligible to receive abatements and commitment of the taxpayer
A taxpayer must apply for approval and be issued an approval letter by the State. A community contribution by a person must be in the following form: (a) Cash or other liquid assets; (b) Real property, including 100 percent ownership of a real property holding company; (c) Goods or inventory; or (d) Other physical resources identified by the State.
How taxes are reduced Tax credit against corporate income or insurance premium tax; sales tax refund
How amount of abatement is determined The credit is equal to 50 percent of the value of the donation, with a limit of $200,000 per year.
Provisions for recapturing abated taxes If erroneous credits are discovered during an audit of the taxpayer's books and records the amount of tax offset by the credit will be assessed.
Type of commitments other than taxes N/A
Total tax revenues reduced during fiscal year (in thousands) $ 14,000
The state had additional tax abatement programs, each amounting to less than $9 million in revenue and estimated to be reduced in fiscal year 2019-20. In total, these programs resulted in $16.8 million in estimated tax abatements and include the Florida AMT Credit, Enterprise Zone Property Credit, State Housing Credit, Rural Job Tax Credit Program, Hazardous Waste Facility Credit, Emergency Excise Tax Credit, Brownfield Redevelopment Bonus Tax Refund, ROA Building Materials Sales Tax Refund, Semi-Conductor Defense and Space Technology Tax Exemption, and the Urban High-Crime Area Job Tax Credit Program.
2020 STATE OF FLORIDA CAFR
126

NOTE 5 - CAPITAL ASSETS
Capital assets are recorded at historical cost or estimated historical cost if purchased or constructed. Donated capital assets are recorded at acquisition value at the date of donation. The costs of normal maintenance and repairs that do not add to the value of the assets or materially extend the assets’ lives are not capitalized.
For financial statement purposes, the state reports capital assets under the following categories and has established a reporting capitalization threshold for each category. Applicable capital assets are depreciated over the appropriate estimated useful lives using the straight-line method.
Capital Asset CategoryFinancial StatementCapitalizing Threshold
Estimated UsefulLife (in Years)
Land and other nondepreciable assets Capitalize all Not depreciableNondepreciable infrastructure Capitalize all Not depreciableConstruction work in progress $100,000 when work is completed Not depreciableBuildings, equipment, and other depreciable assets
Buildings and building improvements $100,000 5 - 50Infrastructure and infrastructure improvements(depreciable)
$100,000 3 - 50
Leasehold improvements $100,000 2 - 15Intangible assets $4,000,000 2 - 30Property under capital lease Threshold correlates to asset category 2 - 20Furniture and equipment $1,000 and $250 for non-circulated
books2 - 25
Works of art and historical treasures Items capitalized as of June 30, 1999,remain capitalized; capitalize unlessconsidered a collection
5 - 50
Library resources $25 5 - 50Other capital assets $1,000 3 - 20
The state has elected to use the modified approach for accounting for its roadways, bridges and other infrastructure assets included in the State Highway System. Under this approach, the Department of Transportation has made the commitment to maintain these assets at levels established by the Department of Transportation and approved by the Florida Legislature. No depreciation expense is reported for such assets, nor are amounts capitalized in connection with improvements that lengthen the lives of such assets, unless the improvements also increase their service potential. The Department of Transportation maintains an inventory of these assets and performs periodic condition assessments to establish that the predetermined condition level is being maintained. In addition, the Department of Transportation makes annual estimates of the amounts that must be expended to maintain these assets at the predetermined condition levels. Refer to the Other Required Supplementary Information for additional information on infrastructure using the modified approach.
Not included in the reported capital assets are the irreplaceable collections at various historic sites and museums throughout the state. For example, the Museum of Florida History, located in Tallahassee, currently has artifacts illustrating the history of Florida since the arrival of human beings on the peninsula. It also has access to collections that include Florida upland and underwater archaeology, Florida archives, and Florida and Spanish colonial numismatics.
Depreciation expense charged to functions of governmental activities for the year ended June 30, 2020, is as follows (in thousands):
General Government $ 90,285 Education 8,921 Human Services 28,575 Criminal Justice & Corrections 84,767 Natural Resources & Environment 62,034 Transportation 43,195 Judicial Branch 3,551 Total depreciation expense (governmental activities) $ 321,328
2020 STATE OF FLORIDA CAFR
127

Primary government capital asset activities for the fiscal year ended June 30, 2020, are as follows (in thousands):GOVERNMENTAL ACTIVITIES
Balance July 1, 2019 Increases Decreases
Balance June 30, 2020
Capital assets, not being depreciated:Land and other nondepreciable assets $ 20,101,679 $ 358,501 $ 12,650 $ 20,447,530 Infrastructure and infrastructure improvements - nondepreciable 51,084,214 1,628,813 — 52,713,027 Construction work in progress 4,059,344 689,526 36,131 4,712,739
Total capital assets, not being depreciated 75,245,237 2,676,840 48,781 77,873,296 Capital assets, being depreciated:
Buildings and building improvements 5,567,109 185,658 106,304 5,646,463 Infrastructure and infrastructure improvements 829,089 33,244 20,049 842,284 Leasehold improvements 8,354 — — 8,354 Property under capital lease 174,869 6,440 5,123 176,186 Furniture and equipment 1,819,175 199,699 147,625 1,871,249 Works of art and historical treasures 1,918 39 40 1,917 Library resources 26,200 165 1,042 25,323 Other 77,582 27,947 2,657 102,872
Total capital assets, being depreciated 8,504,296 453,192 282,840 8,674,648 Less accumulated depreciation for:
Buildings and building improvements 3,098,664 142,509 72 3,241,101 Infrastructure and infrastructure improvements 533,127 29,270 730 561,667 Leasehold improvements 5,231 488 — 5,719 Property under capital lease 115,795 7,760 4,610 118,945 Furniture and equipment 1,375,847 136,648 89,147 1,423,348 Works of art and historical treasures 1,235 93 34 1,294 Library resources 17,697 581 405 17,873 Other 63,752 3,979 133 67,598
Total accumulated depreciation 5,211,348 321,328 95,131 5,437,545 Total capital assets, being depreciated, net 3,292,948 131,864 187,709 3,237,103 Governmental activities capital assets, net $ 78,538,185 $ 2,808,704 $ 236,490 $ 81,110,399
BUSINESS-TYPE ACTIVITIES
Balance July 1, 2019 Increases Decreases
Balance June 30, 2020
Capital assets, not being depreciated:Land and other nondepreciable assets $ 1,223,141 $ 15,658 $ — 1,238,799 Infrastructure and infrastructure improvements - nondepreciable 10,326,312 796,563 — 11,122,875 Construction work in progress 1,418,135 298,352 110,277 1,606,210
Total capital assets, not being depreciated 12,967,588 1,110,573 110,277 13,967,884 Capital assets, being depreciated:
Buildings and building improvements 535,325 186,550 18,160 703,715 Infrastructure and infrastructure improvements 616,630 20,552 1,279 635,903 Leasehold improvements 59 — — 59 Furniture and equipment 391,276 22,516 18,740 395,052 Library resources 15 3 — 18 Other 172,461 — 1 172,460
Total capital assets, being depreciated 1,715,766 229,621 38,180 1,907,207 Less accumulated depreciation for:
Buildings and building improvements 192,602 16,986 48 209,540 Infrastructure and infrastructure improvements 29,077 31,064 — 60,141 Leasehold improvements 25 — — 25 Furniture and equipment 244,574 44,402 16,462 272,514 Library resources 8 1 — 9 Other 75,996 20,797 — 96,793
Total accumulated depreciation 542,282 113,250 16,510 639,022 Total capital assets, being depreciated, net 1,173,484 116,371 21,670 1,268,185 Business-type activities capital assets, net $ 14,141,072 $ 1,226,944 $ 131,947 $ 15,236,069
2020 STATE OF FLORIDA CAFR
128

Component units’ capital asset activities for the fiscal year ended June 30, 2020, are as follows (in thousands):COMPONENT UNITS
Balance July 1, 2019 Increases Decreases
Balance June 30, 2020
Capital assets, not being depreciated:Land and other non-depreciable assets $ 6,898,737 $ 5,766,554 $ 5,686,361 $ 6,978,930 Construction work in progress 1,966,574 1,632,629 1,645,092 1,954,111
Total capital assets, not being depreciated 8,865,311 7,399,183 7,331,453 8,933,041 Capital assets, being depreciated:
Buildings and building improvements 20,826,571 1,614,549 336,503 22,104,617 Infrastructure and infrastructure improvements 3,847,802 2,263,379 2,066,869 4,044,312 Leasehold improvements 565,150 50,974 3,052 613,072 Property under capital lease 289,968 32,756 1,938 320,786 Furniture and equipment 3,952,578 863,035 324,794 4,490,819 Works of art and historical treasures 3,806 45 — 3,851 Library resources 1,030,683 36,998 2,153 1,065,528 Other 505,617 58,922 64,169 500,370
Total capital assets, being depreciated 31,022,175 4,920,658 2,799,478 33,143,355 Less accumulated depreciation for:
Buildings and building improvements 8,128,070 830,087 141,476 8,816,681 Infrastructure and infrastructure improvements 1,540,239 502,063 483,830 1,558,472 Leasehold improvements 207,844 25,766 1,405 232,205 Property under capital lease 103,400 20,434 1,886 121,948 Furniture and equipment 2,858,100 775,675 215,181 3,418,594 Works of art and historical treasures 2,200 145 — 2,345 Library resources 868,435 33,809 1,199 901,045 Other 362,735 108,913 92,494 379,154
Total accumulated depreciation 14,071,023 2,296,892 937,471 15,430,444 Total capital assets, being depreciated, net 16,951,152 2,623,766 1,862,007 17,712,911 Component units capital assets, net $ 25,816,463 $ 10,022,949 $ 9,193,460 $ 26,645,952
2020 STATE OF FLORIDA CAFR
129

NOTE 6 - PENSIONS AND OTHER POSTEMPLOYMENT BENEFITS
A. Pensions
The Florida Department of Management Services (Department) is part of the primary government of the State of Florida and is responsible for administering the Florida Retirement System (FRS) Pension Plan and Other State-Administered Systems. For the fiscal year ended June 30, 2020, the Department administered three defined benefit plans, two defined contribution plans, a supplemental funding of defined benefit plans for municipal police officers and firefighters, and various general revenue funded pension programs. Beginning with the fiscal year ended June 30, 2014, the Department issued a publicly-available, audited comprehensive annual financial report (CAFR) that includes financial statements, notes and required supplementary information for each of the pension plans which it administers. Detailed information about the plans is provided in the FRS CAFR which is available online or by contacting the Department.
Copies for this report, as well as the plans’ actuarial valuations, can be obtained from the Department of Management Services, Division of Retirement (Division), Research and Education Section, P.O. Box 9000, Tallahassee, Florida 32315-90000; by telephone toll free at 877-377-1737 or 850-488-5706; by email at [email protected]; or at the Division’s website (www.frs.myflorida.com).
1. Defined Benefit Plans
The Florida Retirement System
The FRS is a cost-sharing multiple-employer public-employee retirement system with two primary plans – the FRS defined benefit pension plan (Pension Plan) and the FRS Investment Plan. The FRS Pension Plan was created in Chapter 121, Florida Statutes (F.S.), effective December 1, 1970, by consolidating and closing these existing plans to new members: the Teachers’ Retirement System (Chapter 238, F.S.), the State and County Officers and Employees’ Retirement System (Chapter 122, F.S.), and the Highway Patrol Pension Trust Fund (Chapter 321, F.S.). In 1972, the Judicial Retirement System (Chapter 123, F.S.) was closed and consolidated into the FRS. The FRS was created to provide a defined benefit pension plan for participating public employees. The FRS was amended in 1998 to add the Deferred Retirement Option Program (DROP) under the defined benefit plan and amended in 2000 to provide the Investment Plan as a defined contribution plan alternative to the defined benefit plan for FRS members effective July 1, 2002. The FRS Investment Plan is an integrated defined contribution plan administered by the State Board of Administration (SBA). Effective July 1, 2007, the Institute of Food and Agricultural Sciences (IFAS) Supplemental Retirement Program, established under Section 121.40, F.S., was consolidated under the FRS Pension Plan as a closed retirement plan. Participation in the IFAS Supplemental Retirement Program does not constitute membership in the FRS.
Chapter 121, F.S., also provides for nonintegrated, optional retirement programs in lieu of the FRS to certain members of the Senior Management Service Class (SMSC) employed by the state, state elected officials who chose SMSC membership in lieu of Elected Officers’ Class membership (EOC), and faculty and other specified positions in the State University System and Florida College System institutions. Provisions relating to the FRS are also contained in Chapter 112, F.S.
Membership
FRS membership is compulsory for eligible employees filling a regularly established position in a state agency, county agency, state university, state college, or district school board, unless restricted from FRS membership under Sections 121.053 or 121.122, F.S., or allowed to participate in a non-integrated defined contribution plan in lieu of FRS membership. Participation by cities, municipalities, special districts, charter schools, and metropolitan planning organizations, although optional, is generally irrevocable after election to participate is made. Members hired into certain positions may be eligible to withdraw from the FRS altogether or elect to participate in the non-integrated optional retirement programs in lieu of the FRS except faculty of a medical college in a state university who must participate in the State University System Optional Retirement Program (SUSORP). Retirees initially reemployed in regularly established positions on or after July 1, 2010, may not participate in the FRS except for defined contribution plan retirees employed in a regularly established position on or after July 1, 2017. FRS Pension Plan retirees remain ineligible for renewed membership.
Retirees of the FRS Investment Plan, the SUSORP, the State Community College System Option Retirement Program (SCCSORP), and the Senior Management Service Optional Annuity Program who are initially reemployed on or after July 1, 2010, and who are employed in a regularly established position on or after July 1, 2017, will be enrolled in the FRS Investment Plan, SUSORP, or SCCSORP based upon the position held as renewed members on or after July 1, 2017.
2020 STATE OF FLORIDA CAFR
130

There are five general classes of membership, as follows:
• Regular Class – Members of the FRS who do not qualify for membership in the other classes.
• Senior Management Service Class – Members in senior management level positions in state and local governments as well as assistant state attorneys, assistant statewide prosecutors, assistant public defenders, assistant attorneys general, deputy court administrators, and assistant capital collateral representatives. Members of the EOC may elect to withdraw from the FRS or participate in the SMSC in lieu of the EOC.
• Special Risk Class – Members who are employed as law enforcement officers, firefighters, firefighter trainers, fire prevention officers, state fixed-wing pilots for aerial firefighting surveillance, correctional officers, emergency medical technicians, paramedics, community-based correctional probation officers, youth custody officers (from July 1, 2001, through June 30, 2014), certain health-care related positions within state forensic or correctional facilities, or specified forensic employees of a medical examiner’s office or a law enforcement agency, and meet the criteria to qualify for this class.
• Special Risk Administrative Support Class – Former Special Risk Class members who are transferred or reassigned to nonspecial risk law enforcement, firefighting, emergency medical care, or correctional administrative support positions within an FRS special risk-employing agency.
• Elected Officers’ Class – Members who are elected state or county officers and the elected officers of cities and special districts that choose to place their elected officials in this class.
Beginning July 1, 2001, through June 30, 2011, the FRS Pension Plan provided for vesting of benefits after six years of creditable service for members working on or after July 1, 2001, and initially enrolled before July 1, 2011. Members not actively working in a position covered by the FRS Pension Plan on July 1, 2001, must return to covered employment for up to one work year to be eligible to vest with less service than was required under the law in effect before July 1, 2001. Members initially enrolled on or after July 1, 2011, vest after eight years of creditable service. Members are eligible for normal retirement when they have met the requirements listed below. Early retirement may be taken any time after vesting within 20 years of normal retirement age; however, there is a 5% benefit reduction for each year prior to the normal retirement age.
• Regular Class, Senior Management Service Class, and Elected Officers' Class Members – For members initially enrolled in the FRS Pension Plan before July 1, 2011, six or more years of creditable service and age 62, or the age after completing six years of creditable service if after age 62. Thirty years of creditable service regardless of age before age 62.
For members initially enrolled in the FRS Pension Plan on or after July 1, 2011, eight or more years of creditable service and age 65, or the age after completing eight years of creditable service if after age 65. Thirty-three years of creditable service regardless of age before age 65.
• Special Risk Class and Special Risk Administrative Support Class Members – For members initially enrolled in the FRS Pension Plan before July 1, 2011, six or more years of Special Risk Class service and age 55, or the age after completing six years of Special Risk Class service if after age 55. Twenty-five years of special risk service regardless of age before age 55. A total of 25 years of service including special risk service and up to four years of active duty wartime service and age 52. Without six years of Special Risk Class service, members of the Special Risk Administrative Support Class must meet the requirements of the Regular Class.
For members initially enrolled in the FRS Pension Plan on or after July 1, 2011, eight or more years of Special Risk Class service and age 60, or the age after completing eight years of Special Risk Class service if after age 60. Thirty years of special risk service regardless of age before age 60. Without eight years of Special Risk Class service, members of the Special Risk Administrative Support Class must meet the requirements of the Regular Class.
Benefits
The Florida Legislature establishes and amends the benefit terms of the FRS Pension Plan. Benefits under the FRS Pension Plan are computed on the basis of age, average final compensation, creditable years of service, and accrual value per year by membership class. Members are also provided in-line-of-duty or regular disability and survivors’ benefits. Pension benefits of eligible retirees and annuitants are increased each July 1 by a cost-of-living adjustment. If the member is initially enrolled in the FRS Pension Plan before July 1, 2011, and all service credit was accrued before July 1, 2011, the annual cost-of-living adjustment is 3% per year. If the member is initially enrolled before July 1, 2011, and has service credit on or after
2020 STATE OF FLORIDA CAFR
131

July 1, 2011, there is an individually calculated cost-of-living adjustment. This individually calculated annual cost-of-living adjustment is a proportion of 3% determined by dividing the sum of the pre‑July 2011 service credit by the total service credit at retirement multiplied by 3%. FRS Pension Plan members initially enrolled on or after July 1, 2011, will not have a cost-of-living adjustment after retirement.
The DROP became effective July 1, 1998, subject to provisions of Section 121.091(13), F.S. FRS Pension Plan members who reach normal retirement are eligible to defer receipt of monthly benefit payments while continuing employment with an FRS employer. An employee may participate in the DROP for a maximum of 60 months. Authorized instructional personnel may participate in the DROP for up to 36 additional months beyond their initial 60-month participation period. Monthly retirement benefits remain in the FRS Trust Fund during DROP participation and accrue interest until the member terminates to finalize retirement. As of June 30, 2020, the FRS Trust Fund held in trust $2,673,751,676 in accumulated benefits for 36,181 DROP participants. Of these 36,181 DROP participants, 34,141 were active in the DROP with balances totaling $2,375,655,885. The remaining participants were no longer active in the DROP and had balances totaling $298,095,791 to be processed after June 30, 2020.
Administration
The Division administers the FRS Pension Plan. The SBA invests the assets of the FRS Pension Plan held in the FRS Trust Fund. Costs of administering the FRS Pension Plan are funded from earnings on investments of the FRS Trust Fund. Reporting of the FRS Pension Plan is on the accrual basis of accounting. Revenues are recognized when earned and expenses are recognized when the obligation is incurred.
Contributions
All participating employers must comply with statutory contribution requirements. Section 121.031(3), F.S., requires an annual actuarial valuation of the FRS Pension Plan, which is provided to the Legislature as guidance for funding decisions. Employer and employee contribution rates are established in Section 121.71, F.S. Employer contribution rates under the uniform rate structure (a blending of both the FRS Pension Plan and Investment Plan rates) are recommended by the actuary but set by the Legislature. Statutes require that any unfunded actuarial liability (UAL) be amortized within 30 plan years. Pursuant to Section 121.031(3)(f), F.S., any surplus actuarial amounts available to offset total retirement system costs are to be amortized over a 10‑year rolling period on a level-dollar basis. The balance of legally required reserves for the FRS Pension Plan at June 30, 2020, was $161,568,265,280. These funds were reserved to provide for total current and future benefits, refunds, and administration of the FRS Pension Plan.
The table below presents FRS employer contribution rates. Rates indicated are uniform rates for all FRS members and include UAL contribution rates. These rates do not include a 1.66% contribution rate for the Retiree Health Insurance Subsidy (HIS) Program and a 0.06% assessment for the administration of the FRS Investment Plan and the educational program available to all FRS members. In addition, the July 1, 2019, statutory employer rates do not include the 3.00% mandatory employee contribution for all membership classes except for members in the DROP.
Membership Class
Uniform Employer RatesRecommended by Actuarial
Valuation as of July 1, 2018 forFiscal Year 2019-2020
July 1, 2019Statutory Rates(Ch. 121, F.S.)
Regular 6.75% 6.75%Senior Management Service 23.69% 23.69%Special Risk 23.76% 23.76%Special Risk Administrative Support 36.87% 36.87%Elected Officers - Judges 40.28% 40.28%Elected Officers - Legislators/Attorneys/Cabinet 54.31% 54.31%Elected Officers - County 47.10% 47.10%DROP - applicable to members from all of the above classes or plans 12.94% 12.94%
Employee eligibility, benefits, and contributions by class are as previously described. Employees not filling regular established positions and working under the other personal services or temporary status are not covered by the FRS.
2020 STATE OF FLORIDA CAFR
132

Retiree Health Insurance Subsidy Program
The HIS Program is a non-qualified cost-sharing multiple-employer defined benefit pension plan established under Section 112.363, F.S. The Florida Legislature establishes and amends the contribution requirements and benefit terms of the HIS Program. The benefit is a monthly payment to assist retirees of state-administered retirement systems in paying their health insurance costs and is administered by the Division. For the fiscal year ended June 30, 2020, eligible retirees and beneficiaries received a monthly HIS payment equal to the number of years of creditable service completed at the time of retirement multiplied by $5. The payments are at least $30 but not more than $150 per month, pursuant to Section 112.363, F.S. To be eligible to receive a HIS benefit, a retiree under a state-administered retirement system must provide proof of eligible health insurance coverage, which can include Medicare.
The HIS Program is funded by required contributions from FRS participating employers as set by the Legislature. Employer contributions are a percentage of gross compensation for all active FRS members. For the fiscal year ended June 30, 2020, the contribution rate was 1.66% of payroll pursuant to Section 112.363, F.S. The state contributed 100% of its statutorily required contributions for the current and preceding two years. HIS contributions are deposited in a separate trust fund from which HIS payments are authorized. HIS benefits are not guaranteed and are subject to annual legislative appropriation. In the event the legislative appropriation or available funds fail to provide full subsidy benefits to all participants, the legislature may reduce or cancel HIS payments.
The Florida National Guard Supplemental Retirement Benefit Plan
The Florida National Guard Supplemental Retirement Benefit Plan (National Guard Benefit) is a single-employer, non-qualified defined benefit pension plan established under Section 250.22, F.S., and is administered by the Division. The Florida Legislature establishes and amends the plan. Florida National Guard retirees must have at least 30 years of Florida National Guard service. Normal retirement is at age 62 with early retirement available beginning at age 60. The monthly benefit is equal to 50% of the federal military pay table for the highest rank held while in the Florida National Guard less the benefit received from the Federal Government for military service. The benefit amount is recalculated whenever the federal military pay table is increased or the federal benefit is increased by a cost of living adjustment. The benefit is payable for the lifetime of the retiree without a survivor benefit option. The table below shows the number of employees covered by the benefit terms.
Active Members 11,525 Retirees 745 Terminated Vested Members 532 Total 12,802
The National Guard Benefit is funded by an annual appropriation from General Revenue by the Legislature. Any appropriated funds not obligated for benefit payments owed at June 30 each year revert to the General Revenue Fund.
Pension Amounts for Defined Benefit Pension Plans
Net Pension Liability
At June 30, 2020, the State reported a total liability of $8,790,430,999 for its proportionate share of the net pension liabilities of the defined benefit, multiple-employer cost-sharing pension plans and its single-employer, non-qualified pension plan. The table below presents the fiduciary net position for the FRS and HIS plans as well as the State’s proportion and proportionate share as of the measurement date of June 30, 2019, and the fiduciary net position of the National Guard Benefit as of the measurement date of June 30, 2020:
FRS Pension Plan HISNational Guard
Benefit Total
Plan total pension liability (A) $ 198,012,334,000 $ 11,491,043,673 $ 1,142,129,836
Plan fiduciary net position (B) (163,573,726,217) (302,044,388) —
Plan net pension liability (A-B) 34,438,607,783 11,188,999,285 1,142,129,836
State's proportion 17.524776601 % 14.416053158 % 100.00 %
State's proportionate share $ 6,035,289,078 $ 1,613,012,085 $ 1,142,129,836 $ 8,790,430,999
2020 STATE OF FLORIDA CAFR
133

The State’s proportion of the net pension liability for FRS Pension Plan and HIS was based on contributions paid to the plans by the State relative to the contributions paid by all participating employers. The table below shows the change in proportion since the prior measurement date:
FRS HISState's proportion at prior measurement date, June 30, 2018 17.733845390% 14.641028104%
State's proportion at measurement date, June 30, 2019 17.524776601% 14.416053158%
Increase / (decrease) in proportion -0.209068789% -0.224974946%
The table below shows the changes in National Guard Benefit net pension liability for the fiscal year ended June 30, 2020:
National Guard Benefit
Changes in Net Pension LiabilityTotal Pension Liability
(a)
Increase (Decrease) Plan Fiduciary Net
Position (b)
Net Pension Liability (a) - (b)
Balances as of June 30, 2019 $ 818,492,864 $ — $ 818,492,864 Changes for the year:
Service Cost 13,967,283 — 13,967,283 Interest on total pension liability 28,873,760 — 28,873,760 Effect of economic/demographic gains or losses 24,814,991 — 24,814,991 Effect of assumptions changes or inputs 271,102,097 — 271,102,097 Benefit payments (15,121,159) (15,121,159) — Employer contributions — 15,128,959 (15,128,959) Administrative expenses — (7,800) 7,800
Balances as of June 30, 2020 $ 1,142,129,836 $ — $ 1,142,129,836
Actuarial Methods and Assumptions
The FRS Actuarial Assumption Conference is responsible for setting the assumptions used in the funding valuations of the defined benefit pension plan pursuant to section 216.136(10), Florida Statutes. The Department determines the assumptions in the valuations for GASB Statement No. 67 reporting purposes. The FRS Pension Plan's GASB Statement No. 67 valuation is performed annually. The HIS program has a valuation performed biennially that is updated for GASB reporting in the year a valuation is not performed. The most recent experience study for the FRS Pension Plan was completed in 2019 for the period July 1, 2013, through June 30, 2018. Because the HIS Program is funded on a pay-as-you-go basis, no experience study has been completed for that program. The actuarial assumptions that determined the total pension liability for the HIS Program were based on certain results of the most recent experience study for the FRS Pension Plan.
The total pension liability for each of the defined benefit plans was determined by an actuarial valuation as of the measurement date of July 1, 2019, using the entry age normal actuarial cost method. Inflation increases for the FRS Pension Plan and the HIS is assumed at 2.60%. Payroll growth for both plans is assumed at 3.25%.
Both the discount rate and the long-term expected rate of return used for FRS Pension Plan investments is 6.90%. The projection of cash flows used to determine the discount rate assumed that employee contributions will be made at the current contribution rate and that contributions from participating employers will be made at the statutorily required rates. Based on these assumptions, the plan’s fiduciary net position was projected to be available to make all projected future benefit payments of current active and inactive employees. Therefore, the discount rate for calculating the total pension liability is equal to the long-term expected rate of return and was applied to all periods of projected benefit payments to determine the total pension liability.
2020 STATE OF FLORIDA CAFR
134

Because the HIS Program uses a pay-as-you-go funding structure, a municipal bond rate of 3.50% was used to determine the total pension liability for the program. Mortality assumptions for both plans were based on the Generational RP-2000 with Projection Scale BB tables.
There were no changes in benefit terms for FRS that affected the total pension liability since the prior measurement date. There were no changes in benefit terms for HIS that affected the total pension liability since the prior measurement date. There were no changes between the measurement date and the reporting date which significantly impact the State’s proportionate share of the net pension liability, deferred outflows, deferred inflows and pension expense for either FRS Pension Plan or HIS.
The following changes in actuarial assumptions occurred in 2019:
• FRS Pension Plan: The long-term expected rate of return was reduced from 7.00% to 6.90%.
• HIS: The municipal rate used to determine total pension liability decreased from 3.87% to 3.50%.
The long-term expected rate of return on FRS Pension Plan investments was determined using a forward-looking capital market economic model, which includes an adjustment for the inflation assumption. The target allocation and best estimates of arithmetic real rates of return for each major asset class are summarized in the following table:
Asset ClassTarget
AllocationLong-Term Expected Real Rate of Return
Cash 1.0% 3.3%Fixed income 18.0% 4.1%Global equity 54.0% 8.0%Real estate (property) 10.0% 6.7%Private equity 11.0% 11.2%Strategic investments 6.0% 5.9%
100.0%
The National Guard Benefit has not had a formal actuarial experience study performed. Due to the pay-as-you-go nature of the program, full actuarial valuations will be conducted in even-numbered years. Liabilities for odd-numbered years will be developed based on the results of a full actuarial valuation using standard actuarial roll-forward techniques. The total pension liability was determined by an actuarial valuation as of the valuation date, July 1, 2020, using the individual entry age normal actuarial cost method. The inflation rate was assumed at 2.40%, the annual increase in Federal Military Pay tables is assumed at 2.00%, and the Cost-of-Living adjustments are assumed at 2.80%.
Because the National Guard Benefit uses a pay-as-you-go funding structure, a municipal bond rate of 2.21% was used to determine the total pension liability for the program. Mortality assumptions for the plan was based on the Generational PUB-2010 with Projection Scale MP-2018 tables.
There were no changes in benefit terms to the National Guard Benefit that affected the total pension liability since the prior measurement date.
The following change in actuarial assumptions occurred in 2020 for the National Guard Benefit:
• The municipal bond rate used to determine total pension liability decreased from 3.50% to 2.21%.
2020 STATE OF FLORIDA CAFR
135

Sensitivity Analysis
The following tables demonstrate the sensitivity of the net pension liability to changes in the discount rate. The sensitivity analysis shows the impact to the State’s proportionate share of the FRS and HIS plan’s net pension liability and the National Guard Benefit net pension liability if the discount rate was 1.00% higher or 1.00% lower than the current discount rate.
FRS Pension Plan HIS1% Decrease
5.90%Current Discount
Rate 6.90%1% Increase
7.90%1% Decrease
2.50%Current Discount
Rate 3.50%1% Increase
4.50% $10,433,005,062 $6,035,289,078 $2,362,452,357 $1,841,335,985 $1,613,012,085 $1,422,844,126
National Guard Benefit1% Decrease
1.21%Current Discount Rate
2.21%1% Increase
3.21%$1,455,402,003 $1,142,129,836 $912,841,905
Pension Expense and Deferred Outflows / (Inflows) of Resources
In accordance with GASB Statement No. 68, paragraphs 54 and 71, changes in the net pension liability are recognized in pension expense in the current measurement period, except as indicated below. For each of the following, a portion is recognized in pension expense in the current measurement period, and the balance is amortized as deferred outflows or deferred inflows of resources using a systematic and rational method over a closed period, as defined below:
• Differences between expected and actual experience with regard to economic and demographic factors – amortized over the average expected remaining service life of all employees that are provided with pensions through the pension plan (active and inactive employees).
• Changes of assumptions or other inputs – amortized over the average expected remaining service life of all employees that are provided with pensions through the pension plan (active and inactive employees).
• Changes in proportion and differences between contributions and proportionate share of contributions – amortized over the average expected remaining service life of all employees that are provided with pensions through the pension plan (active and inactive employee).
• Differences between expected and actual earnings on pension plan investments – amortized over five years.
The average expected remaining service life of all employees provided with pensions through the pension plans at June 30, 2019, was 6.4 years for FRS Pension Plan and 7.2 years for HIS.
2020 STATE OF FLORIDA CAFR
136

The State’s proportionate share of the components of collective pension expense and deferred outflows and inflows of resources reported in the pension allocation schedules for the measurement date year ended June 30, 2019, are presented below for each plan.
FRS Pension Plan
Recognized in Expense Reporting Period Ending
June 30, 2020Recognition
PeriodDeferred Outflows of
ResourcesDeferred Inflows of
ResourcesService cost $ 442,162,459 Current $ — $ — Interest cost 2,312,377,055 Current — — Effect of plan changes 1,998,526 Current — — Effect of economic/demographic gains or losses (difference between expected and actual experience) 120,088,435 6.4 years 357,970,252 (3,745,447) Effect of assumptions changes or inputs 452,530,096 6.4 years 1,550,121,915 — Member contributions (131,928,890) Current — — Projected investment earnings (1,935,045,423) Current — — Changes in proportion and differences between contributions and proportionate share of contributions 20,492,670 6.4 years 190,959,848 (231,404,926) Net difference between projected and actual investment earnings 211,957,868 5 years — (333,903,690) Contributions subsequent to the measurement date — 1 year 564,233,393 — Administrative expenses 3,431,436 Current — —
Total $ 1,498,064,232 $ 2,663,285,408 $ (569,054,063)
Health Insurance Subsidy
Recognized in Expense Reporting Period Ending
June 30, 2020Recognition
PeriodDeferred Outflows of
ResourcesDeferred Inflows of
ResourcesService cost $ 33,462,261 Current $ — $ — Interest cost 60,281,696 Current — — Effect of plan changes — Current — — Effect of economic/demographic gains or losses (difference between expected and actual experience) 3,150,447 7.2 years 19,591,834 (1,975,082) Effect of assumptions changes or inputs 27,829,230 7.2 years 186,771,563 (131,834,462) Member contributions (28,072) Current — — Projected investment earnings (1,472,092) Current — — Changes in proportion and differences between contributions and proportionate share of contributions (14,487,656) 7.2 years 79,963,286 (129,416,029) Net difference between projected and actual investment earnings 461,202 5 years 1,040,853 — Contributions subsequent to the measurement date — 1 year 79,916,731 — Administrative expenses 28,155 Current — —
Total $ 109,225,171 $ 367,284,267 $ (263,225,573)
2020 STATE OF FLORIDA CAFR
137

The average expected remaining service life of all employees provided with pensions through the National Guard defined benefit single-employer plan at June 30, 2020, was 11.9 years. The State’s pension expense and deferred outflows and deferred inflows of resources reported for the fiscal year ended June 30, 2020, are presented below for the plan.
National Guard Benefit Plan
Recognized in Expense Reporting
Period Ending June 30, 2020
Recognition Period
Deferred Outflows of Resources
Deferred Inflows of Resources
Service cost $ 13,967,283 Current $ — $ — Interest cost 28,873,760 Current — — Effect of economic/demographic gains or losses (difference between expected and actual experience) 7,840,195 11.9 years 67,207,115 —
Effect of assumptions changes or inputs 44,147,375 11.9 years 467,216,349 (62,338,182) Administrative expenses 7,800 Current — —
Total $ 94,836,413 $ 534,423,464 $ (62,338,182)
Deferred outflows of resources related to contributions paid subsequent to the measurement date as shown in the tables above will be recognized as a reduction of the net pension liability in the reporting period ended June 30, 2020. Other amounts reported as deferred outflows of resources and deferred inflows of resources related to pension expense will be recognized as follows:
Reporting Period Ending June 30,
FRS Pension Plan Expense HIS Expense
National Guard Benefit Expense
2021 $ 570,051,069 $ 16,875,578 $ 51,987,570 2022 161,000,150 12,871,235 51,987,570 2023 400,622,139 3,494,581 51,987,570 2024 305,115,119 (17,092,131) 51,987,570 2025 75,764,000 (151,024) 51,514,241
Thereafter 17,445,474 8,143,724 212,620,761 Total $ 1,529,997,951 $ 24,141,963 $ 472,085,282
Payables to the Pension Plans
The State reported payables of $327 thousand to the FRS Pension Plan, and $16 thousand to the HIS Program as of June 30, 2020, for legally required contributions to the plans.
2020 STATE OF FLORIDA CAFR
138

2. Defined Contribution Programs
FRS Investment Plan
The SBA administers the defined contribution plan officially titled the FRS Investment Plan. The Florida Legislature establishes and amends the contribution requirements and benefit terms of the plan. Retirement benefits are based upon the value of the member’s account upon retirement. The FRS Investment Plan provides vesting after one year of service regardless of membership class. If an accumulated benefit obligation for service credit originally earned under the FRS Pension Plan is transferred to the FRS Investment Plan, the years of service required for vesting under the Pension Plan (including the service credit represented by the transferred funds) is required to be vested for these funds and the earnings on the funds. The employer pays a contribution as a percentage of salary that is deposited into the individual member’s account. Effective July 1, 2011, there is a mandatory employee contribution of 3.00%. The FRS Investment Plan member directs the investment from the options offered under the plan. Costs of administering the plan, including the FRS Financial Guidance Program, are funded through an employer assessment of 0.06% of payroll and by forfeited benefits of plan members. After termination and applying to receive benefits, the member may rollover vested funds to another qualified plan, structure a periodic payment under the FRS Investment Plan, receive a lump-sum distribution, or leave the funds invested for future distribution. Upon receiving a distribution, other than a de minimis distribution or required minimum distribution, the member is a retiree. Disability coverage is provided for total and permanent disability (non-duty or line of duty); the employer pays an employer contribution to fund the disability benefit which is deposited in the FRS Trust Fund. The member may either transfer the account balance to the FRS Pension Plan when approved for disability retirement to receive guaranteed lifetime monthly benefits under the FRS Pension Plan, or remain in the FRS Investment Plan and rely upon that account balance for retirement income. Survivor benefit coverage is provided to the surviving spouse or dependent children of members who die in line of duty; the employer pays an employer contribution to fund the survivor benefit which is deposited in the FRS Trust Fund. The member’s account balance must be transferred to the FRS Pension Plan when approved for survivor benefits to receive guaranteed lifetime monthly benefits under the FRS Pension Plan for the surviving spouse or on behalf of the dependent children until the youngest unmarried dependent child reaches age 18, or up to age 25 if unmarried and enrolled as a fulltime student.
State University System Optional Retirement Program
Section 121.35, F.S., created the SUSORP for eligible State University System faculty, administrators, and administrative and professional staff. The Florida Legislature establishes and amends the contribution requirements and benefit terms of the program. This program is designed to aid universities in recruiting employees who may not remain in the FRS long enough to vest. The SUSORP is a defined contribution plan that, upon signing an investment contract, provides full and immediate vesting of all contributions paid on behalf of the participants to the participating provider companies to invest as directed by the participant to provide retirement and death benefits. Employees in eligible positions are compulsory participants in the SUSORP unless they elect FRS membership. Faculty in a college of medicine with a faculty practice plan are mandatory SUSORP participants and cannot elect FRS membership.
The employing universities were statutorily required to contribute 5.15% of the participants’ gross monthly compensation from July 2019, through June 2020. In accordance with Chapter 60U-2, Florida Administrative Code, 0.01% of the employer contribution rate was used for the administration of the SUSORP program and 5.14% was distributed to the provider companies designated by the participant. SUSORP members are not eligible to receive HIS Payments from the HIS Trust Fund. There is a HIS component included in the employer's contribution deposited in the members' accounts. Effective July 1, 2011, there is a mandatory employee contribution of 3.00%. A participant may contribute by salary reduction an amount not to exceed the percentage contributed by the university. In addition to the employer funding to the participants’ accounts, the employing universities are required to make a contribution as a percent of covered payroll that is transferred to the FRS Trust Fund to help amortize any UAL. The required UAL contribution rate for fiscal year 2019-20 was 3.56%.
Senior Management Service Optional Annuity Program (SMSOAP)
Section 121.055, F.S., created the SMSOAP as an optional retirement program alternative for state members of the SMSC. Employees in eligible state positions may make an irrevocable election to participate in the SMSOAP in lieu of the SMSC. The Florida Legislature establishes and amends the contribution requirements and benefit terms of the program, and closed the program to new members effective July 1, 2017.
The SMSOAP is a defined contribution plan that, upon signing an investment contract, provides full and immediate vesting of all contributions paid on behalf of the participants to the participating provider companies. Participants direct the investment of contributions to provide retirement and death benefits. Employers were required to contribute 6.27% of covered payroll from
2020 STATE OF FLORIDA CAFR
139

July 2019 through June 2020. The employers’ contributions were paid to the provider companies designated by the participant. Effective July 1, 2011, there is a mandatory employee contribution of 3%. A participant may contribute by salary reduction or deduction an amount not to exceed the percentage contributed by the employer. In addition to the employer funding to the participants’ accounts, the state agencies are required to make a contribution as a percent of covered payroll that is transferred to the FRS Trust Fund to help amortize the UAL. The required UAL contribution rate for fiscal year 2019-20 was 19.09%.
Pension Amounts for Defined Contribution Plans
As of June 30, 2020, the State reported the following pension amounts related to the defined contribution plans:
Reporting Period Ended
June 30, 2020FRS
Investment PlanOptional Retirement
PlanOptional
Annuity ProgramPension Expense1,2 $ 77,280,549 $ 14,436,884 $ 59,547
Forfeitures 4,089,567 — —
Pension Liability 318,805 — —
1 Pension expense excludes the required UAL which is recognized in the Defined Benefit Pension Plan as contributions.2 The amount of forfeitures is not reflected in pension expense recognized by the State and is used to offset administrative costs.
B. Other Postemployment Benefits (OPEB)
The Division of State Group Insurance (DSGI) within the Department is responsible for administering the State Employees' Group Health Insurance Program. The program covers retired employees and is considered an other postemployment benefits plan.
Plan Description
The DSGI Other Postemployment Benefits Plan (OPEB Plan) is a multiple-employer defined benefit plan which provides healthcare benefits to retired state and university employees in accordance with Section 110.123, Florida Statutes (F.S.). Pursuant to the provisions of Section 112.0801, F.S., all public employers that offer benefits through a group insurance plan shall allow their retirees and their eligible dependents the option to continue participation in the plan during retirement. As a part of normal retirement, a retiree has 60 days after separation to elect post-retirement health coverage. After 60 days, they are no longer entitled to benefits. A retiree is defined as any officer or employee who retires under a State retirement system or State optional annuity or retirement program or is placed on disability retirement and who begins receiving retirement benefits immediately after retirement from employment. In addition, any officer or employee who retires under the Florida Retirement System Investment Plan is considered a “retiree” if he or she meets the age and service requirements to qualify for normal retirement or has attained the age of 59.5 years and has the years of service required for vesting. The law also requires the claims experience of the retirees under 65 group to be combined with the claims experience of active employees for premium determination and the premium offered to retired employees to be no more than the premium applicable to active employees. As a result, the state implicitly subsidizes the premium rates paid by retirees due to increasing health care costs with age and the commingling of the claims experience in a single risk pool with a single premium determination for active employees and retirees under age 65.
There are six participating employers including, the primary government of the state and 14 discretely presented component units which are reported as one employer in the valuation, along with five other governmental entities. No assets are accumulated in a trust that meets the criteria in paragraph 4 of GASB Statement No. 75. Benefit provisions as described by Section 110.123, F.S., and contributions, can be amended by the Florida Legislature. The Governor’s recommended budget and the General Appropriations Act provide for a premium level necessary for funding the program each year on a pay-as-you-go basis.
2020 STATE OF FLORIDA CAFR
140

Benefits Provided
The benefits provided are the same as those provided for active employees. Spouses and dependents of eligible retirees are also eligible for medical coverage. All non-OPS employees of the State are eligible to receive postemployment health care benefits. Four types of health plans are offered to eligible participants:
• Standard statewide Preferred Provider Organization (PPO) Plan. • High Deductible PPO Plan. • Standard Health Maintenance Organization (HMO) Plan. • High Deductible HMO Plan.
HMO coverage is available only to those retirees who live or work in the HMO’s service area. The four PPO and HMO options are considered managed-care plans and have specific provider networks.
Employees covered by benefit terms
At valuation date of July 1, 2019, there were 196,951employees covered by the OPEB Plan, as shown in the following table:
Active members 138,415
No coverage active members 23,080
Retired and inactive members 35,456
Total employees 196,951
There are currently zero inactive plan members entitled to but not yet receiving benefits because the OPEB Plan does not provide a vested termination benefit.
Contributions
Retirees participating in the group insurance plans offered by the State of Florida are required to contribute 100% of the premiums. The State of Florida implicitly subsidizes the healthcare premium rates paid by retirees by allowing them to participate in the same health plan offered to active employees. Retirees under age 65 pay the same premium amounts as applicable to the active employees. Retirees over age 65 are included in the overall risk pool but pay a lesser premium amount than is applicable to active employees because Medicare is the primary payer. Retirees are required to enroll in the Federal Medicare (Medicare) program for their primary coverage as soon as they are eligible.
Note that the projected post-65 employee contributions for the fully-insured HMO plan are assumed to cover the entire cost of the program.
Total OPEB Liability
As of June 30, 2020, the State reported a total OPEB liability of $12,658,249,434 of which the State (primary government) and its component units reported $9,167,196,186 and $3,491,053,248, respectively, for its proportionate share of the total OPEB liability measured as of June 30, 2019. The table below presents the State and its component units proportion change since the prior measurement date:
State Component UnitsProportion at prior measurement date, June 30, 20181 73.993100599986 % 26.006899400014 %
Proportion at measurement date, June 30, 2019 72.420726371349 % 27.579273628651 %
Increase / (Decrease) in proportion (1.572374228637) % 1.572374228637 %1 The proportion of the State and its component units at prior measurement date, June 30, 2018 were modified from 73.99% and 26.01% to 73.993100599986% and 26.00689940014% respectively in GASB 75 Disclosure Information for the Fiscal Year Ending June 30, 2020.
2020 STATE OF FLORIDA CAFR
141

Actuarial Assumptions and Other Inputs
The total OPEB liability was determined using the following actuarial assumptions and other inputs, applied to all periods included in the measurement, unless otherwise specified:
Valuation date July 1, 2019Measurement date June 30, 2019Actuarial cost method Entry age normalAmortization method The recognition period for the changes in assumption and proportionate share is 8
yearsActuarial value of assets N/AInflation 2.60%Salary Increases Varies by FRS ClassDiscount rate 2.79%Healthcare cost trend rates 6.7% for PPO and 5.2% for HMO for 2019, increasing to 8.3% and 6.3% by 2022,
then decreasing to 5.6% for PPO and HMO by 2070. Afterward, decreasing to 5.4% for PPO and HMO thereafter
Retirees' share of benefit-related costs 100% of projected health insurance premiums for retireesMedical aging factors 4% per year prior to age 65
3% per year between ages 65 and 752% per year between ages 75 and 850% per year thereafter
Marital status 80% assumed married, with male spouses 3 years older than female spousesHealth care participation (HMO) 50% participation assumed, with 25% electing spouse coverage. Members who
elected no coverage as actives are assumed to elect coverage in the same proportion as active members with coverage
Health care participation (PPO) 50% participation assumed, with 35% electing spouse coverage. Members who elected no coverage as actives are assumed to elect coverage in the same proportion as active members with coverage
The discount rate of 2.79% was based on the Bond Buyer General Obligation 20-year Municipal Bond Index. The discount rate changed from 3.87% for the opening balance as of June 30, 2018 to 2.79% as of June 30, 2019 actually resulting in an overall increase in total OPEB liability.
Mortality rates were based on the Generational RP-2000 with Projected Improvement Scale BB. Disabled mortality has not adjusted for mortality improvements.
The same demographic assumptions that were used for the Florida Retirement System July 1, 2018 Actuarial Valuation were used in the June 30, 2019 Actuarial Valuation. The demographic assumptions were based on the 2014 Experience Study prepared by Milliman on September 8, 2014. Updated Assumptions for the FRS July 1, 2018 Actuarial Valuation were approved by the 2018 FRS Actuarial Assumptions Conference. The assumptions are reasonable for valuing the retiree health costs of the Program since the covered populations of both plans are similar. Additionally, the 2016 mortality tables reflect improvements in mortality using the Society of Actuaries most recently published projection scale BB.
The healthcare trends used in this valuation are based on long term healthcare trends generated by the Getzen Model. The Getzen Model is the result of research sponsored by the Society of Actuaries and completed by a committee of economists and actuaries. Medical trend rates consistent with the August 2019 Report on the Financial Outlook of the Plan along with information from the Getzen Model and actuarial judgment were used in the June 30, 2019 Actuarial Valuation. The trend rates for the HMO self-insured and fully insured option were blended to create a single trend assumption for retirees electing HMO coverage. The first five trend rates were developed using the claims and administrative cost information from the August 2019 Report on the Financial Outlook of the Plan.
2020 STATE OF FLORIDA CAFR
142

Retirees participating in the group insurance plans offered by the State of Florida are required to contribute 100% of the premiums. Retiree contributions were not as high as expected based on the expected increases from July 1, 2015, to July 1, 2017. As such, the net implicit subsidy gap further widened and costs increased.
Changes in Total OPEB Liability (in thousands)
See chart below for details.
Changes in Total OPEB Liability StateComponent
Units Total
Reporting period ending June 30, 2019 $ 7,807,420 $ 2,744,132 $ 10,551,552 Changes for the year: Service cost 326,632 124,388 451,020 Interest 294,818 112,272 407,090 Changes of benefit terms — — — Differences between expected and actual experience (269,732) (102,719) (372,451) Changes of assumptions or other inputs 1,313,594 500,244 1,813,838 Benefit payments (142,659) (50,141) (192,800) Changes of proportionate shares to the total OPEB liability and difference between the actual benefit payments and expected benefit payments (162,877) 162,877 — Other changes — — — Net changes 1,359,776 746,921 2,106,697
Reporting period ending June 30, 2020 $ 9,167,196 $ 3,491,053 $ 12,658,249
Sensitivity of the Total OPEB Liability to Changes in the Discount Rate
The following table demonstrates the sensitivity of the total OPEB liability to changes in the discount rate. The sensitivity analysis shows the impact to the state's proportionate share of the total OPEB liability if the discount rate was 1.00% higher or 1.00% lower than the current discount rate (expressed in thousands):
1% Decrease1.79%
Current Discount Rate 2.79%
1% Increase3.79%
State $ 11,472,438 $ 9,167,196 $ 7,416,610 Component Units 4,394,520 3,491,053 2,806,831 Total $ 15,866,958 $ 12,658,249 $ 10,223,441
Sensitivity of the Total OPEB Liability to Changes in the Healthcare Cost Trend Rates
The following table demonstrates the sensitivity of the total OPEB liability to changes in the healthcare cost trend rates. The sensitivity analysis shows the impact to the state's proportionate share of the total OPEB liability if the healthcare cost trend rates were 1.00% higher or 1.00% lower than the current healthcare cost trend rate (expressed in thousands):
1% DecreaseCurrent
Healthcare Cost Trend Rate
1% Increase
State $ 7,223,318 $ 9,167,196 $ 11,860,682 Component Units 2,719,060 3,491,053 4,570,826 Total $ 9,942,378 $ 12,658,249 $ 16,431,508
2020 STATE OF FLORIDA CAFR
143

OPEB Expense and Deferred Outflows/Inflows of Resources Related to OPEB
For the fiscal year ended June 30, 2020, the State of Florida recognized OPEB expense of $512,385,000 and $195,126,000 for primary governments and the component units respectively. At June 30, 2020, the State of Florida reported deferred outflows of resources and deferred inflows of resources related to OPEB for state primary governments and component units from the following sources (expressed in thousands):
State Component Units
Deferred Outflows
Deferred Inflows
Deferred Outflows
Deferred Inflows
Differences between expected and actual experience $ — $ (236,016) $ — $ (89,879)
Changes of assumptions or other inputs 1,149,396 (1,296,347) 437,712 (493,674)
Changes of proportionate shares and difference between the actual benefit payments and expected benefit payments 3,837 (185,432) 185,432 (3,837) Transactions subsequent to the measurement date 121,576 46,298 Total $ 1,274,809 $ (1,717,795) $ 669,442 $ (587,390)
Amounts reported as deferred outflows of resources related to OPEB resulting from transactions subsequent to the measurement date as shown in the table above will be recognized as a reduction of the total OPEB liability in the reporting period ending June 30, 2021. Other amounts reported as deferred outflows of resources and deferred inflows of resources related to OPEB will be recognized in OPEB expense as follows (expressed in thousands):
Year Ending June 30, State Components
Units Total
2021 $ (138,556) $ (15,990) $ (154,546) 2022 (138,556) (15,990) (154,546) 2023 (138,556) (15,990) (154,546) 2024 (138,556) (15,990) (154,546) 2025 (138,553) (15,994) (154,547) Thereafter 128,215 115,708 243,923 Total $ (564,562) $ 35,754 $ (528,808)
2020 STATE OF FLORIDA CAFR
144

NOTE 7 - COMMITMENTS AND OPERATING LEASES
A. Construction Commitments
Road and bridge construction projects, supervised by the Department of Transportation, are included in the Department of Transportation work program, which is updated during each budget cycle. As of June 30, 2020, the Department had available approximately $12.8 billion in budget authority committed on executed contracts arising from both current and prior year projects. Other major construction commitments of the State of Florida at June 30, 2020, totaled $388 million. Refer to Note 5 for additional disclosures relating to construction in progress. Construction commitments for component units totaled $2.6 billion.
B. Florida Ports Financing Commission Revenue Bonds
Section 320.20, Florida Statutes, obligates the state to remit annually $25 million to a designated trustee for the purpose of repaying the debt on certain Florida Ports Financing Commission revenue bonds. The Florida Ports Financing Commission is not part of the state’s reporting entity. These revenue bonds do not create or constitute a legal obligation or debt of the state. Funding for the annual remittance comes from the State of Florida, Department of Transportation’s portion of motor vehicle registration fees, which was $679,279,025 for the fiscal year ended June 30, 2020. The table below represents the Florida Ports Financing Commission revenue bonds outstanding as of June 30, 2020:
Series Amount 2011A $ 5,620,000 2011B 75,685,000 2011A (Intermodal) 45,800,000 2011B (Intermodal) 32,365,000 Total $ 159,470,000
C. Operating Leases
Operating leases are not recorded on the balance sheets or statements of net assets; however, operating lease payments are recorded as expenditures/expenses when incurred. Total operating lease payments for the state’s governmental activities, business-type activities, and major component units were $132.4 million, $9.4 million, and $51.9 million, respectively, for the year ended June 30, 2020. The following is a schedule of future non-cancelable operating lease payments for the primary government and component units at June 30, 2020 (in thousands):
Primary Government
GovernmentalActivities
Business-typeActivities
Major Component
Units2021 $ 128,992 $ 10,732 $ 41,720 2022 116,868 10,240 35,722 2023 103,631 8,922 31,113 2024 93,880 7,584 28,292 2025 85,130 7,192 25,521 2026-2030 225,666 19,317 79,301 2031-2035 86,855 3,552 21,004 2036-2040 70,765 1,246 12,427 2041-2045 64,469 44 5,610 2046-2050 64,469 — 5,713 2051-2055 64,352 — — Total $ 1,105,077 $ 68,829 $ 286,423
2020 STATE OF FLORIDA CAFR
145

D. Encumbrances
As of June 30, 2020, encumbrances for major and nonmajor governmental funds were (in thousands):
GeneralFund
Natural Resources,
Environment, and Growth Management
PublicEducation
Health and
FamilyServices Transportation
NonmajorGovernmental
Funds TotalEncumbrances: $ 353,753 $ 13,299 $ 1,010,006 $ 163,202 $ 56,742 $ 631,630 $ 2,228,632
2020 STATE OF FLORIDA CAFR
146

NOTE 8 - BONDS PAYABLE AND CERTIFICATES OF PARTICIPATION
A. Bonds Payable
1. Outstanding Bonds
Bonds payable at June 30, 2020, are as follows (in thousands):
Bond TypeOriginalAmount
AmountOutstanding
InterestRates
AnnualMaturity To
Governmental Activities:Road and Bridge Bonds $ 2,391,785 $ 1,994,760 2.500%-5.000% 2049DOT Financing Corporation Bonds 164,005 146,900 4.000%-5.000% 2033SBE Capital Outlay Bonds 143,235 81,940 2.000%-5.000% 2048Lottery Education Bonds 1,452,895 801,295 3.000%-5.000% 2032Public Education Bonds 9,327,890 6,724,235 2.000%-6.000% 2048State University System Bonds 119,845 86,565 3.000%-5.000% 2033University Auxiliary Bonds 996,046 747,012 1.216%-7.500% 2045Inland Protection Bonds 24,820 21,575 5.000%-5.000% 2024Florida Forever Bonds 1,096,985 567,550 2.000%-5.000% 2029Water Pollution Control Bonds 214,220 214,220 3.500%-5.250% 2043Florida Facilities Pool Bonds 190,835 161,610 3.000%-5.000% 2039State Infrastructure Bank Bonds 123,615 10,565 4.250%-5.000% 2027Seaport Investment Bonds 138,145 117,360 4.000%-5.000% 2043Everglades Restoration Bonds 197,440 157,415 3.000%-5.000% 2035Federal Highway Reimbursement Bonds 123,225 117,995 5.000%-5.000% 2031
16,704,986 11,950,997 Unamortized premiums (discounts) on bonds payable 833,859 Total Bonds Payable $ 16,704,986 $ 12,784,856
Business-type Activities:Road and Bridge Bonds $ 3,336,340 $ 2,686,860 2.500%-5.250% 2049Florida Hurricane Catastrophe Fund Bonds 3,200,000 1,650,000 2.638%-2.995% 2021
6,536,340 4,336,860 Unamortized premiums (discounts) on bonds payable 183,649 Total Bonds Payable $ 6,536,340 $ 4,520,509
2020 STATE OF FLORIDA CAFR
147

2. Types of Bonds
Capital Outlay Bonds are issued to finance capital outlay projects of school districts and community colleges. The bonds mature serially and are secured by a pledge of a portion of the state-assessed motor vehicle license tax and by a pledge of the full faith and credit of the state.
Public Education Capital Outlay Bonds are issued to finance capital outlay projects of local school districts, community colleges, vocational technical schools, and state universities. The bonds, serial and term, are secured by a pledge of the state's gross receipts tax revenues and by a pledge of the full faith and credit of the state.
Road and Bridge Bonds are issued to finance the cost of acquiring real property, or the rights to real property for state roads, or to finance the cost of state bridge construction. The bonds, serial and term, are secured by a pledge of a portion of the state-assessed motor fuel tax revenues, and by a pledge of the full faith and credit of the state.
Lottery Education Bonds are issued to finance the costs of various local school district educational facilities. The bonds mature serially and are secured by a pledge of a portion of the lottery revenues transferred to the Educational Enhancement Trust Fund. State University System Bonds are issued to construct university student life facilities. The bonds mature serially and are secured by a system pledge of Capital Improvement Fee revenues.
University Auxiliary Bonds are issued to construct university facilities, including primarily parking and student housing. The bonds, serial and term, are secured by university pledges of certain housing system revenues, parking system revenues, student fee assessments and indirect costs grant revenues.
Everglades Restoration Bonds are revenue bonds issued to finance the costs of acquisition and improvement of lands, water areas, and related property interests and resources for the purpose of implementing the Comprehensive Everglades Restoration Plan and to fund the Florida Keys Area of Critical State Concern protection program. The bonds mature serially and are secured by a pledge of documentary stamp tax revenues. Florida Forever Bonds are issued to finance the cost of acquisition and improvements of lands, water areas, and related property interests and resources in the State of Florida for the purposes of restoration, conservation, recreation, water resource development, or historical preservation. The bonds mature serially and are secured by a pledge of documentary stamp tax collections.
Florida Facilities Pool Bonds are issued to provide funds for the acquisition and construction of facilities to be leased to state agencies. The bonds mature serially and are secured by a pledge of the revenues derived from the leasing and operations of these facilities.
Federal Highway Reimbursement Bonds are issued to finance projects eligible for federal-aid highway funds. The bonds mature serially and are secured by a pledge of all revenues received pursuant to Federal Aid Authorization that are legally available for the reimbursement of costs of Eligible Projects under Title 23 of the U.S. Code.
Seaport Investment Program Bonds are issued primarily to finance improvements at various seaports within the State of Florida. The bonds, serial and term, are secured by a first lien on the annual allocation of certain fees derived from motor vehicle title certificates to the Seaport Investment Program. State Infrastructure Bank Bonds are issued primarily to finance loans made for the purpose of financing qualified transportation projects. The bonds mature serially and are secured by a pledge of repayments on pledged loans and moneys and investments held in reserve accounts.
Toll Facilities Bonds are issued to provide construction funds for roads and bridges. Toll bonds, serial and term, are secured by a pledge of toll facility revenues.
Inland Protection Bonds are issued by the Inland Protection Financing Corporation (a blended component unit) for the purpose of financing the rehabilitation of petroleum contaminated sites. The bonds mature serially and are secured by a pledge of moneys derived from a wholesale excise tax primarily on petroleum products. Department of Transportation Financing Corporation Bonds are issued by the Florida Department of Transportation Financing Corporation (a blended component unit) to finance the cost of certain projects within the Department of Transportation’s adopted Work Program. The bonds mature serially and are secured by a pledge of moneys deposited in the State Transportation Trust Fund, consisting primarily of revenues derived from fuel taxes, federal aid and motor vehicle fees.
2020 STATE OF FLORIDA CAFR
148

Florida Water Pollution Control Bonds are issued by the Florida Water Pollution Control Financing Corporation (a blended component unit) to fund loans to local governments to finance or refinance the cost of wastewater treatment and storm water management projects. The bonds, serial and term, are secured by a pledge of the loan payments from local governments.
Florida Hurricane Catastrophe Fund Bonds are issued by the State Board of Administration Finance Corporation. Post-event bonds are issued to maximize the Florida Hurricane Catastrophe Fund’s (FHCF) ability to make payments to participating insurers for losses resulting from covered events (hurricanes). The bonds mature serially and are secured by emergency assessments and reimbursement premiums. Pre-event bonds are also issued to provide the FHFC with a source of funds to reimburse participating insurers for losses relating to future covered events and are secured by reimbursement premiums and emergency assessments.
2020 STATE OF FLORIDA CAFR
149

3. Pledged Revenues
The table below contains information regarding revenues pledged to repay debt obligations (dollars in thousands). For each Bond Type, the table discloses Gross Revenue, Operating Expenses, Net Revenue Available for Debt Service, Principal, Interest, Coverage Ratio, Final Maturity, Remaining Debt Service, and Revenue Ratio. The Bond Types with Operating Expenses are considered self-supporting debt and are paid from the associated facilities being financed. If Operating Expenses are not shown, the bond type is considered to be Net Tax Supported debt and serviced by dedicated tax or fee revenues.
Debt Service
Bond Type Revenue2
Less Operating Expenses
Net Available for Debt Service Principal Interest3
Total Debt Service
Coverage Ratio
Final Maturity
Remaining Debt
ServiceRevenue
Ratio4
Florida Turnpike (Toll Facility) $ 995,849 $ 242,882 $ 752,967 $ 135,870 $ 116,025 $ 251,895 2.99 2049 3,763,338 75.61%
Florida Forever/Everglades1 2,874,900 — 2,874,900 116,703 40,943 157,646 18.24 2035 870,846 100.00%
Lottery Education1,2 1,913,799 — 1,913,799 170,170 47,385 217,555 8.80 2032 956,675 100.00%
Alligator Alley (Toll Facility) 31,290 10,135 21,155 1,895 903 2,798 7.56 2027 19,560 67.61%
Sunshine Skyway 26,348 7,814 18,534 2,480 4,391 6,871 2.70 2038 123,694 70.34%
State Infrastructure Bank1 29,607 — 29,607 6,400 808 7,208 4.11 2027 11,887 100.00%
Florida Hurricane Catastrophe5 1,187,643 80,576 1,107,067 — 6,778 6,778 163.33 2021 667,147 93.22%
State University System Bonds1 58,796 — 58,796 10,295 4,093 14,388 4.09 2033 105,928 100.00%
University Auxiliary Bonds
Parking System Revenue Bonds
Florida International University 13,759 6,963 6,796 2,785 2,487 5,272 1.29 2043 80,888 49.39%
University of South Florida 13,066 8,571 4,495 2,610 330 2,940 1.53 2026 13,216 34.40%
University of Florida 12,660 6,893 5,767 1,810 1,761 3,571 1.61 2028 52,159 45.55%
Florida Atlantic University 7,085 2,131 4,954 1,600 482 2,082 2.38 2032 13,717 69.92%
University of Central Florida 20,278 4,224 16,054 2,776 740 3,516 4.57 2032 19,052 79.17%
Florida State University 12,577 2,881 9,696 3,651 1,091 4,742 2.04 2031 27,250 77.09%
Housing System Revenue Bonds
Florida Agricultural & Mechanical University 14,953 11,004 3,949 2,998 1,459 4,457 0.89 2045 130,984 26.41%
Florida International University 21,378 10,890 10,488 4,275 3,138 7,413 1.41 2041 106,016 49.06%
University of Florida 47,776 35,057 12,719 4,560 2,332 6,892 1.85 2033 67,620 26.62%
Florida Atlantic University 16,724 7,287 9,437 3,210 2,182 5,392 1.75 2036 57,561 56.43%
University of Central Florida 26,231 18,880 7,351 5,030 3,307 8,337 0.88 2042 102,166 28.02%
Florida State University 45,691 22,824 22,867 8,310 6,990 15,300 1.49 2040 206,112 50.04%
Student Health and Wellness Center Revenue Bonds
University of Central Florida1,6 N/A — N/A N/A N/A N/A N/A N/A — N/A
Florida State University1 15,452 — 15,452 1,470 908 2,378 6.50 2030 23,803 100.00%
University of North Florida1 4,496 — 4,496 505 539 1,044 4.31 2036 19,031 100.00%
Student Services Center Revenue Bonds
University of Florida1 29,504 — 29,504 1,715 1,520 3,235 9.12 2033 42,027 100.00%
DOT Financing Corporation1 4,520,651 — 4,520,651 7,900 7,591 15,491 291.82 2033 201,363 100.00%
Federal Highway Reimbursement Bonds1,7 1,993,118 — 1,993,118 5,230 4,005 9,235 215.83 2031 156,258 100.00%
Water Pollution Control Bonds1 93,421 — 93,421 27,790 13,268 41,058 2.28 2043 238,392 100.00%
Inland Protection Bonds1 214,563 — 214,563 3,245 4,095 7,340 29.23 2024 24,338 100.00%
Seaport Investment Program1 200,000 — 200,000 2,740 5,844 8,584 23.30 2043 197,396 100.00%1Operating Expenses are not listed for various programs. For these programs, either no operating expenses reduce revenues available for debt service, or, in the case of the Lottery, include expenses unrelated to the operation of the program, such as payment of lottery prizes. Instead, for these programs, the revenue shown is the amount available to pay debt service. 2 Refer to Note 8A.2. for information on the sources of pledged revenues.3 Debt service interest is shown net of interest subsidy payments received from the Federal Government for Build America Bonds.4 Revenue Ratio is calculated as Net Available for Debt Service divided by Revenue.5 Florida Hurricane Catastrophe Bonds debt service is reduced by interest earnings on bond proceeds and bond proceeds used to repay principal.6 The UCF Mandatory Fee Bonds were cash defeased on October 30, 2019. As a result, revenue, expense, debt service and coverage information is omitted.7 GARVEE Program issued the first series of Federal Highway Reimbursement Bonds in Fiscal Year 2020.
2020 STATE OF FLORIDA CAFR
150

4. State Debt Limitations
Section 215.98, F.S., establishes the ratio of tax-supported debt service to tax-supported revenues as the benchmark debt ratio for purposes of setting the state’s legal debt margin. Under the policy, if the ratio exceeds 6%, additional tax-supported debt may be authorized only if the Legislature determines the additional debt is in the best interest of the state. If the ratio exceeds 7%, additional tax-supported debt may be authorized only if the Legislature determines it is necessary to address a critical state emergency. During the fiscal year 2019-20, the ratio remained below 6%.
5. Debt Service Requirements
Annual debt service requirements to amortize bonds at June 30, 2020, are as follows (in thousands):Primary Government
Governmental ActivitiesDirect Borrowings
Year Ending General and Direct PlacementsJune 30 Principal Interest Principal Interest Total
2021 $ 1,045,180 $ 510,602 $ 6,105 $ 2,385 $ 1,564,272 2022 1,057,120 462,387 6,404 3,158 1,529,069 2023 1,032,410 412,372 6,605 2,976 1,454,363 2024 949,530 362,905 6,834 2,758 1,322,027 2025 898,105 316,638 7,068 2,556 1,224,367 2026-2030 3,199,100 1,060,345 29,721 9,772 4,298,938 2031-2035 2,138,955 493,094 17,916 6,095 2,656,060 2036-2040 1,028,035 179,158 23,654 3,594 1,234,441 2041-2045 318,200 61,955 25,445 937 406,537 2046-2050 154,610 10,681 — — 165,291 Bonds payable and interest 11,821,245 3,870,137 129,752 34,231 15,855,365 Unamortized premiums (discounts) 833,859 — — — 833,859 Total bonds payable and interest $ 12,655,104 $ 3,870,137 $ 129,752 $ 34,231 $ 16,689,224
Primary GovernmentBusiness-type Activities
Year Ending Bonds
June 30 Principal Interest Total
2021 $ 1,148,335 $ 146,880 $ 1,295,215
2022 787,305 115,915 903,220
2023 135,770 100,524 236,294
2024 142,660 93,735 236,395
2025 149,345 87,068 236,413
2026-2030 620,810 346,721 967,531
2031-2035 602,760 217,780 820,540
2036-2040 437,270 105,687 542,957
2041-2045 226,875 39,343 266,218
2046-2050 85,730 6,773 92,503
Bonds payable and interest 4,336,860 1,260,426 5,597,286
Unamortized premiums (discounts) 183,649 — 183,649
Total bonds payable and interest $ 4,520,509 $ 1,260,426 $ 5,780,935
2020 STATE OF FLORIDA CAFR
151

Component UnitsDirect Borrowings
Year Ending General and Direct Placements
June 30 Principal Interest Principal Interest Total
2021* $ 1,091,269 $ 275,468 $ 58,161 $ 36,294 $ 1,461,192
2022 513,649 155,417 35,037 22,270 726,373
2023 149,829 143,131 33,728 21,264 347,952
2024 142,100 138,604 34,424 20,237 335,365
2025 304,775 93,446 139,867 52,609 590,697
2026-2030 679,725 538,820 144,275 68,160 1,430,980
2031-2035 823,349 411,773 120,612 46,121 1,401,855
2036-2040 597,405 270,648 107,658 22,885 998,596
2041-2045 694,712 147,711 25,260 6,852 874,535
2046-2050 351,123 35,494 18,855 2,449 407,921
2051-2055 15,621 3,625 — — 19,246
2056-2060 8,658 576 — — 9,234
Bonds payable and interest 5,372,215 2,214,713 717,877 299,141 8,603,946
Unamortized premiums (discounts) 169,921 — — — 169,921
Total bonds payable and interest $ 5,542,136 $ 2,214,713 $ 717,877 $ 299,141 $ 8,773,867
* Some component units have a fiscal year other than June 30 and as a result, June 30, 2021, principal amounts reported will not reconcile with Note 10.
Annual debt service requirements for university capital improvement debt payable at June 30, 2020, are as follows (in thousands):
Universities
Direct Borrowings
Year Ending and Direct Placements
June 30 Principal Interest Principal Interest Total2021 $ 41,525 $ 22,471 $ 11,481 $ 6,242 $ 81,719 2022 92,631 20,811 11,995 5,739 131,176 2023 38,983 19,139 12,548 5,211 75,881 2024 37,561 17,578 12,229 4,672 72,040 2025 37,343 16,421 12,746 4,172 70,682 2026-2030 176,218 58,101 59,051 13,250 306,620 2031-2035 117,399 27,441 23,160 3,670 171,670 2036-2040 53,629 9,857 7,945 651 72,082 2041-2045 17,597 1,096 — — 18,693 2046-2050 — — — — — 2051-2055 — — — — — 2056-2060 — — — — — Total capital improvement debt payable and interest 612,886 192,915 151,155 43,607 1,000,563 Unamortized premiums (discounts) 2,194 — 7,189 — 9,383 Total capital improvement debt payable and interest $ 615,080 $ 192,915 $ 158,344 $ 43,607 $ 1,009,946
2020 STATE OF FLORIDA CAFR
152

6. Advance Refundings and Current Refundings
During the fiscal year ended June 30, 2020, the state took advantage of favorable conditions and issued bonds for the purpose of refunding previously issued bonds. The refundings of these bond series were made in order to obtain lower interest rates and the resulting savings in debt service payments over the life of the bonds. The economic gains obtained by these refundings are the differences between the present value of old debt service and new debt service requirements.
The proceeds of the current refundings were used to immediately call the refunded bonds or deposited in Special Purpose Investment Accounts with the State Treasury and used to call refunded bonds within 90 days of the issuance of the refunding bonds. The proceeds of the advance refundings were deposited into irrevocable trusts and invested in direct obligations of the Federal government and/or obligations guaranteed by the Federal government. The funds deposited along with the interest to be earned will be sufficient to meet the future principal and interest payments on the refunded bonds as they become due.
Bonds legally defeased through the consummation of refunding transactions are not included in Florida’s outstanding debt. Irrevocable escrow accounts held by the State Board of Administration to service the refunded bonds are reported as agency funds. The following refundings occurred during the fiscal year.
Advance Refundings
Governmental Activities
Florida Water Pollution Control Financing Corporation Water Pollution Control Revenue Refunding Bonds, Taxable Series 2019A in the amount of $214,220,000, in part, along with additional funds of $18,749,957, were used to advance refund $125,295,000 of the Florida Water Pollution Control Financing Corporation Water Pollution Control Revenue Bonds, Series 2010A maturing in the years 2020 through 2030. The refunding resulted in debt savings of $14,895,546, an economic gain of $11,742,075, and a deferred gain on refunding of $1,371,707.
Business-type Activities
None.
Current Refundings
Governmental Activities
State of Florida, Department of Environmental Protection Everglades Restoration Revenue Refunding Bonds, Series 2019B, in the amount of $42,220,000, along with additional funds of $898,333, were used to refund $50,270,000 of the State of Florida, Department of Environmental Protection Everglades Restoration Revenue Bonds, Series 2007A-B (Multi-Modal), variable debt obligations maturing in the years 2020 through 2027.
State of Florida, Full Faith and Credit, State Board of Education Public Education Capital Outlay Refunding Bonds, 2019 Series B in the amount of $135,465,000, along with additional funds of $789,796, were used to refund $158,505,000 of the State of Florida, Full Faith and Credit, State Board of Education Public Education Capital Outlay Bonds, 2008 Series D Build America Bonds (Federally Taxable-Issuer Subsidy) maturing in the years 2020 through 2039. The refunding resulted in debt savings of $24,804,625, an economic gain of $19,267,088, and a deferred loss on refunding of $794,066.
State of Florida, Full Faith and Credit, State Board of Education Public Education Capital Outlay Refunding Bonds, 2019 Series C in the amount of $234,155,000, along with additional funds of $4,509,278, were used to refund $144,520,000 of the State of Florida, Full Faith and Credit, State Board of Education Public Education Capital Outlay Bonds, 2006 Series G Build America Bonds (Federally Taxable-Issuer Subsidy) maturing in the years 2020 through 2039 and $120,460,000 of the State of Florida, Full Faith and Credit, State Board of Education Public Education Capital Outlay Bonds, 2009 Series F Build America Bonds (Federally Taxable-Issuer Subsidy) maturing in the years 2020 through 2039. The refunding resulted in debt savings of $43,715,261, an economic gain of $34,698,560, and a deferred loss on refunding of $779,832.
State of Florida, Full Faith and Credit, State Board of Education Public Education Capital Outlay Refunding Bonds, 2019 Series D in the amount of $168,825,000, along with additional funds of $5,036,186, were used to refund $197,310,000 of the State of Florida, Full Faith and Credit, State Board of Education Public Education Capital Outlay Bonds, 2007 Series G Build
2020 STATE OF FLORIDA CAFR
153

America Bonds (Federally Taxable-Issuer Subsidy) maturing in the years 2020 through 2039. The refunding resulted in debt savings of $38,805,233, an economic gain of $31,607,455, and a deferred loss on refunding of $1,048,183.
State of Florida, Full Faith and Credit, State Board of Education Capital Outlay Refunding Bonds, 2020 Series A in the amount of $20,530,000, along with additional funds of $36,938, were used to refund $23,720,000 of the State of Florida, Full Faith and Credit, State Board of Education Capital Outlay Bonds, 2010 Series A maturing in the years 2021 through 2030. The refunding resulted in debt savings of $3,047,678, an economic gain of $2,837,695, and a deferred gain on refunding of $302,277.
State of Florida, Full Faith and Credit, State Board of Education Public Education Capital Outlay Refunding Bonds, 2020 Series A in the amount of $257,730,000, along with additional funds of $3,745,105 were used to refund $135,865,000 of the State of Florida, Full Faith and Credit, State Board of Education Public Education Capital Outlay Bonds, 2007 Series H maturing in the years 2021 through 2040 and $162,680,000 of the State of Florida, Full Faith and Credit, State Board of Education Public Education Capital Outlay Bonds, 2008 Series E maturing in the years 2021 through 2040. The refunding resulted in debt savings of $105,061,250, an economic gain of $85,435,118, and a deferred gain on refunding of $9,364,350.
State of Florida, Full Faith and Credit, State Board of Education Public Education Capital Outlay Refunding Bonds, 2020 Series B in the amount of $95,125,000, along with additional funds of $1,454,715 were used to refund $114,805,000 of the State of Florida, Full Faith and Credit, State Board of Education Public Education Capital Outlay Refunding Bonds, 2010 Series A maturing in the years 2021 through 2031. The refunding resulted in debt savings of $25,275,069, an economic gain of $23,724,282, and a deferred gain on refunding of $2,079,086.
State of Florida, Inland Protection Financing Corporation Revenue Refunding Bonds, Series 2019A in the amount of $24,820,000, along with additional funds of $12,998,752 were used to refund $39,600,000 of the State of Florida, Inland Protection Financing Corporation Revenue Bonds, Series 2010B Build America Bonds (Federally Taxable-Issuer Subsidy) maturing in the years 2020 through 2024. The refunding resulted in debt savings of $2,639,247, an economic gain of $2,126,224, and no deferred gain or loss on refunding.
State of Florida, Board of Governors, Florida International University Parking Facility Revenue Refunding Bonds, Series 2019A in the amount of $19,805,000, along with additional funds of $2,564,373, were used to refund $25,110,000 of the State of Florida, Board of Governors, Florida International University Parking Facility Revenue Bonds, Series 2009B Build America Bonds (Federally Taxable-Issuer Subsidy) maturing in the years 2020 through 2039. The refunding resulted in debt savings of $6,193,599 an economic gain of $4,122,977, and no deferred gain or loss on refunding.
State of Florida, Board of Governors, University of Central Florida Parking Facility Revenue Refunding Bonds, Series 2019A in the amount of $6,120,000, along with additional funds of $1,777,412, were used to refund $8,980,000 of the State of Florida, Board of Governors, University of Central Florida Parking Facility Revenue Bonds, Series 2010B Build America Bonds (Federally Taxable-Issuer Subsidy) maturing in the years 2020 through 2029. The refunding resulted in debt savings of $1,274,454 an economic gain of $1,089,273, and no deferred gain or loss on refunding.
Florida Water Pollution Control Financing Corporation Water Pollution Control Revenue Refunding Bonds, Taxable Series 2019A in the amount of $214,220,000, in part, along with additional funds of $19,548,693, were used to refund $10,945,000 of the Florida Water Pollution Control Financing Corporation Water Pollution Control Revenue Bonds, Series 2003 maturing in the years 2021 through 2023 and $112,545,000 of the Florida Water Pollution Control Financing Corporation Water Pollution Control Revenue Bonds, Series 2008A maturing in the years 2021 through 2029. The refunding resulted in debt savings of $17,406,343, an economic gain of $13,960,809, and a deferred gain on refunding of $58,397.
Business-type Activities
State of Florida, Department of Transportation Turnpike Revenue Refunding Bonds, Series 2020A in the amount of $190,745,000, along with additional funds of $11,731,783, were used to refund $23,525,000 of the State of Florida, Department of Transportation Turnpike Revenue Bonds, Series 2006A maturing in the years 2028 and 2029 and $203,115,000 of the State of Florida, Department of Transportation Turnpike Revenue Bonds, Series 2010B maturing in the years 2021 through 2040. The refunding resulted in debt savings of $81,546,253 an economic gain of $68,390,187, and a deferred loss on refunding of $2,558,111.
2020 STATE OF FLORIDA CAFR
154

Cash In-substance Defeasance
Governmental Activities
The State of Florida, Florida Education System, University of Central Florida Student Health Center Revenue Bonds, Series 2004A (the “Series 2004A Bonds”) in the amount of $2,685,000 maturing in the years 2020 through 2024 were in-substance defeased on September 27, 2019, when a cash deposit of $2,727,290 was made to the Sinking Fund. These funds were subsequently held and not invested and used, along with other funds of $820 held within the Sinking Fund, to redeem the Series 2004A Bonds on October 30, 2019.
7. Prior-year Defeased Bonds
In prior years, the state has deposited with escrow agents in irrevocable trusts amounts sufficient to meet the debt service requirements of certain bonds. These defeased bonds are not reported as outstanding debt. Irrevocable trusts established with the State Board of Administration are reported in an agency fund. Debt considered defeased consists of the following (in thousands):
Principal at
June 30, 2020
Governmental Activities
University Auxiliary Bonds $ 31,614
Total $ 31,614
8. Arbitrage Regulations
The state complies with federal arbitrage regulations.
2020 STATE OF FLORIDA CAFR
155

9. Direct Interest
The state's bonds are issued for the creation or continuing existence of various programs. Interest is reported at June 30, 2020, in the following governmental activities as direct expenses on the Statement of Activities (in thousands):
Governmental Activities InterestEducation:
SBE Capital Outlay Bonds $ 2,657
Lottery Education Bonds 23,754
Public Education Bonds 222,628
State University System Bonds 2,647
University Auxiliary Bonds 24,856
Total Education 276,542
Natural Resources and Environment:
Inland Protection Bonds 935
Everglades Restoration Bonds 4,203
Water Pollution Control Bonds 8,538
Florida Forever Bonds 15,755
Total Natural Resources and Environment 29,431
Transportation:
Road and Bridge Bonds (Right of Way) 63,872
State Infrastructure Bank Bonds 773
Seaport Investment Bonds 5,068
FDOT Financing Corporation Bonds 4,419
DOT Federal Highway Reimbursement Bonds 1,599
Total Transportation 75,731
Total Direct Interest $ 381,704
10. Governmental Activities – Unrestricted Net Position Deficit
Governmental activities reflect a negative unrestricted net position balance of $15.5 billion at June 30, 2020. This deficit is primarily the result of education-related bonds in which the state is responsible for the debt, but the state colleges, state universities, or the local school districts own the capital assets. Because the state does not own these capital assets, the bonded debt is not netted on the line item “Net investment in capital assets.” Instead, this bonded debt is netted with unrestricted net position. Education-related bonds include SBE Capital Outlay Bonds; PECO Bonds; State University System Improvement Bonds; and Lottery Education Bonds; which have a total ending balance at June 30, 2020, of $9.1 billion. The state has an additional $0.7 billion in other bonds, including Florida Forever bonds in which the state does not own the related capital assets. The resources related to the payment of this debt will be provided from future revenue sources. If these bonds were removed, the adjusted unrestricted net position for governmental activities would be a negative $5.7 billion.
2020 STATE OF FLORIDA CAFR
156

B. Certificates of Participation
1. Primary Government
The state has issued certificates of participation (original amount of $462,240,000) to finance privately operated detention and mental health facilities. The certificates of participation’s interest rates range from 4.500% - 5.000% and the last maturity date is July 1, 2030. The following is a schedule of future minimum principal and interest payments for certificates of participation for governmental activities at June 30, 2020 (in thousands):
Year Ending GeneralJune 30 Principal Interest Total
2021 $ 32,675 $ 17,234 $ 49,909 2022 34,325 15,583 49,908 2023 36,885 13,835 50,720 2024 38,775 11,978 50,753 2025 40,705 10,019 50,724 2026-2030 169,570 22,494 192,064 Total 352,935 91,143 444,078 Unamortized premiums (discounts) 30,927 — 30,927
Total certificates of participation payable $ 383,862 $ 91,143 $ 475,005
2. Component Units
Component units (universities and a water management district) have issued certificates of participation (original amount of $845,225,000) primarily to finance academic and student facilities, and construction projects for Everglades restoration. The certificates of participation’s interest rates range from 1.903% to 5.250% and the last maturity date is July 1, 2048. The following is a schedule of future minimum principal and interest payments for certificates of participation for component units at June 30, 2020 (in thousands):
Year Ending GeneralDirect Borrowings and
Direct Placements
June 30 Principal Interest Principal Interest Total
2021* $ 46,274 $ 57,718 $ 5,490 $ 4,084 $ 113,566
2022 21,244 22,539 5,695 3,872 53,350
2023 22,208 21,302 5,880 3,652 53,042
2024 23,290 20,194 5,000 3,456 51,940
2025 103,051 61,409 5,140 3,265 172,865
2026-2030 161,535 53,753 28,360 13,209 256,857
2031-2035 107,065 17,020 33,225 7,332 164,642
2036-2040 23,930 4,770 20,300 1,172 50,172
2041-2045 8,295 2,186 — — 10,481
2046-2050 6,900 565 — — 7,465
Total 523,792 261,456 109,090 40,042 934,380
Unamortized premiums (discounts) 54,489 — — — 54,489
Total certificates of participation payable $ 578,281 $ 261,456 $ 109,090 $ 40,042 $ 988,869
* Some component units have a fiscal year other than June 30 and as a result, June 30, 2021, principal amounts reported will not reconcile with Note 10.
2020 STATE OF FLORIDA CAFR
157

NOTE 9 - INSTALLMENT PURCHASES, CAPITAL LEASES, AND PUBLIC-PRIVATE PARTNERSHIPS
A. Installment Purchases
The state has a number of installment purchase contracts primarily providing for the acquisition of buildings, furniture, and equipment. At June 30, 2020, 79% of the state’s installment purchase contracts for primary governmental activities were for furniture and equipment, and the remaining 21% for buildings. Installment purchase contracts for component units consisted of 100% of furniture and equipment. The following is a schedule of future minimum installment purchase contract payments for the primary government and component units at June 30, 2020 (in thousands):
Primary GovernmentGovernmental
ActivitiesBusiness-type
Activities
Year EndingJune 30 General
Direct Borrowings and Placements General Totals
2021 $ 1,772 $ 4,791 $ 1,122 $ 7,685 2022 1,426 2,978 1,216 5,620 2023 1,288 2,263 1,216 4,767 2024 1,288 2,263 1,216 4,767 2025 1,288 2,158 1,216 4,662 2026-2030 6,439 1,817 3,208 11,464 2031-2035 6,438 — — 6,438 Total 19,939 16,270 9,194 45,403 Less: Interest (4,596) (1,724) (1,209) (7,529)
Present value of future minimum payments $ 15,343 $ 14,546 $ 7,985 $ 37,874
ComponentUnits
Year EndingJune 30 General
Direct Borrowings
and Placements Totals
2021 $ 1,853 $ 871 $ 2,724
2022 1,171 112 1,283
2023 1,286 73 1,359
2024 1,001 73 1,074
2025 478 — 478 Total 5,789 1,129 6,918
Less: Interest (54) (159) (213)
Present value of future minimum payments $ 5,735 $ 970 $ 6,705
2020 STATE OF FLORIDA CAFR
158

B. Capital Leases
The state has a number of capital leases providing for the acquisition of land, buildings, and furniture and equipment. At June 30, 2020, 100.00% of the state’s capital leases for governmental activities were for furniture and equipment. Capital leases for component units consisted of 50.16% for buildings, 48.69% for furniture and equipment, and the remaining 1% for land. The following is a schedule of future minimum capital lease payments for the primary government and component units at June 30, 2020 (in thousands):
Primary Government
Governmental ActivitiesBusiness-type
ActivitiesYear Ending
June 30 GeneralDirect Borrowings
and Placements General Totals
2021 $ 710 $ 2,359 $ 66 $ 3,135 2022 707 2,407 66 $ 3,180 2023 710 2,407 66 $ 3,183 2024 446 367 67 $ 880 2025 359 317 — $ 676 2026-2030 565 — — $ 565 Total 3,497 7,857 265 $ 11,619 Less: Interest (374) — (34) (408) Present value of future minimum payments $ 3,123 $ 7,857 $ 231 $ 11,211
Component UnitsYear Ending
June 30 GeneralDirect Borrowings
and Placements Totals2021 $ 11,095 $ 4,822 $ 15,917 2022 10,079 4,827 14,906 2023 7,193 4,935 12,128 2024 5,055 6,726 11,781 2025 2,824 7,726 10,550 2026-2030 22,938 19,160 42,098 2031-2035 14,583 1,045 15,628 2036-2040 6,720 — 6,720 2041-2045 4,723 — 4,723 2046-2050 4,929 — 4,929 2051-2055 5,135 — 5,135 2056-2060 4,803 — 4,803 2061-2065 2,282 — 2,282 2066-2070 2,282 — 2,282 2071-2075 1,826 — 1,826 Total 106,467 1
0 49,241 155,708
Less: Interest (37,243) (6,912) (44,155) Present value of future minimum payments $ 69,224 $ 42,329 $ 111,553
2020 STATE OF FLORIDA CAFR
159

C. Public-Private Partnerships
Pursuant to Section 334.30, Florida Statutes, the Department of Transportation (Department) executed two 35-year, Public‑Private Partnership concession agreements in March and October of 2009 for the design, build, finance, operation and maintenance of the Interstate 595 Corridor and the PortMiami Tunnel. PortMiami payments consist of construction-period payments, lump-sum final acceptance payments upon completion of construction, and annual performance-based availability payments to be made during the 30-year operations and maintenance period. Interstate 595 did not receive any payments during construction, only final acceptance payments. The Department executed a 40-year concession agreement in September 2014 for the design, build, finance, operation and maintenance of 21 miles of the Interstate 4 Corridor in Seminole and Orange Counties. Annual availability payments are all-inclusive payments consisting of unpaid portions of construction costs, annual operations costs, and maintenance expenses. The payment schedule below includes the full amount of the estimated payments for the Interstate 595 Corridor and the PortMiami Tunnel and is an estimate of unpaid construction payments during the term of the agreements based on the percentage of completion of the projects at June 30, 2020, for the Interstate 4 Corridor. The annual availability payments for Interstate 595 Corridor and the PortMiami Tunnel are performance-based and are subject to change based on a fixed percentage as defined in the agreement and on the Consumer Price Index, which could impact the payment schedule. In October 2015, the Department executed a supplemental agreement with the I-595 concessionaire reflecting overall cost reductions for this project as a result of the concessionaire’s debt refinancing. The annual availability payments for the Interstate 4 Corridor are performance-based with a portion of the payment that is level and another portion that is indexed based on the Consumer Price Index, which could impact the payment schedule. The lanes were open to traffic on Interstate 595 and PortMiami Tunnel in March and August 2014, respectively. Construction for the Interstate 4 Corridor is expected to be completed during fiscal year 2021. The following is a schedule of future maximum payments for the primary government at June 30, 2020 (in thousands):
PrimaryGovernment
Year EndingJune 30
Governmental Activities
Business-typeActivities Totals
2021 $ 412,494 $ 16,691 $ 429,185 2022 434,493 14,682 449,175 2023 134,192 16,844 151,036 2024 129,239 17,347 146,586 2025 132,288 17,874 150,162 2026-2030 700,731 96,521 797,252 2031-2035 717,200 98,720 815,920 2036-2040 821,454 124,970 946,424 2041-2045 700,291 89,009 789,300 2046-2050 204,760 — 204,760 2051-2055 180,306 — 180,306 2056-2060 — — — Total 4,567,448 492,658 5,060,106 Less: Interest (1,801,205) (279,051) (2,080,257)
Present value of future maximum payments $ 2,766,243 $ 213,607 $ 2,979,849
2020 STATE OF FLORIDA CAFR
160

NOTE 10 - CHANGES IN LONG-TERM LIABILITIES
Changes in long-term liabilities for governmental activities during the fiscal year ended June 30, 2020, are as follows (in thousands):
Balance July 1, 2019 Additions Deletions
Balance June 30, 2020
Due WithinOne Year(Current)
Due Beyond One Year
(Non-current)
Governmental ActivitiesBonds payable:
Road and Bridge Bonds $ 1,906,500 $ 184,500 $ 96,240 $ 1,994,760 $ 101,460 $ 1,893,300 FL DOT Financing Corporation 154,800 — 7,900 146,900 8,295 138,605 SBE Capital Outlay Bonds 101,430 20,530 40,020 81,940 13,600 68,340 Lottery Education Bonds 971,465 — 170,170 801,295 136,960 664,335 Public Education Bonds 7,367,140 891,300 1,534,205 6,724,235 544,780 6,179,455 State University System Bonds 96,860 — 10,295 86,565 10,760 75,805 University Auxiliary Bonds 671,710 25,925 80,375 617,260 45,280 571,980 Inland Protection Bonds 39,600 24,820 42,845 21,575 5,005 16,570 Florida Forever Bonds 669,285 — 101,735 567,550 106,830 460,720 Water Pollution Control Bonds 276,575 214,220 276,575 214,220 26,165 188,055 Florida Facilities Pool Bonds 176,670 — 15,060 161,610 15,710 145,900 State Infrastructure Bank Bonds 16,965 — 6,400 10,565 3,560 7,005 Seaport Investment Bonds 120,100 — 2,740 117,360 2,875 114,485 Everglades Restoration Bonds 179,535 42,220 64,340 157,415 15,595 141,820
Federal Reimbursement Bonds — 123.225 5,230 117,995 8,305 109,690
Bonds from direct borrowings and direct placements1 92,451 43,206 5,905 129,752 3,023 126,729
12,841,086 1,569,946 2,460,035 11,950,997 1,048,203 10,902,794
Unamortized bond premiums(discounts) 840,637 208,999 215,777 833,859 — 833,859
Total bonds payable 13,681,723 1,778,945 2,675,812 12,784,856 1,048,203 11,736,653
Certificates of participation payable 421,621 — 37,759 383,862 32,675 351,187 Deposits 929,844 4,341,820 343,433 4,928,231 1,020,096 3,908,135 Compensated absences 748,455 274,622 244,199 778,878 184,310 594,568 Claims payable 3,138,726 1,405,401 2,074,726 2,469,401 1,231,716 1,237,685 Installment purchases/capital leases 27,340 — 8,874 18,466 1,546 16,920 Public-private partnership agreements 2,680,621 496,422 410,800 2,766,243 321,114 2,445,129 Advances - Due to Unclaimed Prop. TF 972,968 13,716 — 986,684 — 986,684 Due to other governments 378,248 — 19,719 358,529 — 358,529 Other postemployment benefits 7,592,021 1,361,414 37,853 8,915,582 115,295 8,800,287 Pension liability 7,571,417 1,088,428 22,023 8,637,822 47,179 8,590,643 Other liabilities 13,052 5,889 1,449 17,492 — 17,492 Federal Arbitrage Liability — — — — — —
Notes from Direct Borrowings and Direct Placements - Excludes Bonds2 — 23,504 1,101 22,403 6,606 15,797
Total Governmental Activities $ 38,156,036 $ 10,790,161 $ 5,877,748 $ 43,068,449 $ 4,008,740 $ 39,059,709
1Direct borrowings and direct placements have been separately identified due to the implementation of GASB Statement No. 88. Direct borrowings and direct placements for Governmental Activities includes bond issuances from University Auxiliary Bonds.2Direct borrowings and direct placements includes installment purchase contracts and capital leases.
Long-term liabilities for governmental activities are generally liquidated by the applicable governmental funds and/or internal service funds. Specifically, the special revenue funds, capital projects funds, and/or internal service funds will liquidate the certificates of participation payable, installment purchase contracts, and capital lease obligations. The applicable special revenue funds and internal service funds will reduce deposits when such monies are earned. The governmental and internal services funds that account for employees’ salaries and wages will liquidate the compensated absences liabilities. The General Fund, Health and Family Services Fund, and the non-major special revenue fund will generally liquidate claims payable. The
2020 STATE OF FLORIDA CAFR
161

Public Education Fund will liquidate the advances due to the Unclaimed Property Trust Fund to the extent that the Unclaimed Property Trust Fund does not have sufficient assets to pay claimants requesting payment of unclaimed funds. The nonmajor special revenue funds will generally liquidate other liabilities. The Transportation-Governmental Fund will liquidate the public-private partnership agreements and due to other governments liabilities from annual appropriations. Refer to Note 9 for additional information on the public-private partnership agreements. The pension liability and the Other postemployment benefits (OPEB) related to all governmental funds are reported above. The pension liability is adjusted each year based upon investment performance and contributions received. The state does not currently fund the OPEB liability so it is non-liquidating. Refer to Note 6 for additional information on the pension liability and OPEB.
The Department of Management Services’ outstanding $161.6 million Florida Facilities Pool Bonds provide for acceleration in an event of a payment default, subject to request of the Trustee or the holders of not less than 25% of the outstanding bonds.
The outstanding $102.1 million Board of Governors, Florida Agricultural and Mechanical University Dormitory Revenue and Revenue Refunding Bonds from direct borrowings provide that, upon any event of default the lender may: (1) declare the principal of, and interest on, the bonds immediately due and payable; (2) exercise any of its rights under the loan agreement; (3) apply for the appointment of receiver, trustee, liquidator, or conservator; or (4) at the request of the Secretary of the United States Department of Education, terminate the loan agreement and declare all amounts advanced to the University, and interest thereon, immediately due and payable. Should the Secretary request the lender to pursue option (4), such funds, including costs of collection, may be collected by administrative offset against payments due to the University from the Federal Government for grants and contracts.
The Department of Management Services’ outstanding $289.1 million certificates of participation provide for acceleration and the surrender of the financed public and private correctional facilities (the projects) in the event of a default. Upon an event of default or an event of non-appropriation, the Corporation may terminate the lease, take possession of the projects, and accelerate the rent payments due for the current fiscal year. If the Corporation elects not to terminate the lease upon an event of default, it may exclude the Department, sell or lease certain equipment, and hold the Department liable for monetary damages. Additionally, following an event of non-appropriation, the lease automatically terminates, and the Department must immediately surrender all projects to the Trustee, who may then liquidate, rent, or lease the projects. The Trustee may also exercise all remedies available to the Corporation or cause the Corporation to pursue such remedies.
The Department of Children and Families’ outstanding $63.9 million certificates of participation provide for acceleration and the surrender of the financed forensic mental health and civil commitment facilities (the projects) in the event of a default. Upon an event of default or event of non-appropriation, the principal of all outstanding certificates may be accelerated at the request of the Trustee or the owners of a majority of the outstanding certificates. Upon an event of default or an event of nonappropriation, the Corporation may terminate the lease and require the Department to vacate, surrender, and transfer possession of the projects to the Corporation. Additionally, upon an event of default, without terminating the lease, it may take possession of the project, exclude the Department, and sublet the project. In each case the Department is liable for monetary damages. The Trustee may exercise all remedies available to the Corporation, and may take possession of the projects, or any portions thereof, and dispose of the Corporation’s interest therein for the benefit of the owners of the outstanding certificates.
The State of Florida's governmental and business-type activities also have an unused line of credit in the amount of $88,439,262 as of June 30, 2020.
2020 STATE OF FLORIDA CAFR
162

Changes in long-term liabilities for business-type activities and component units during the fiscal year ended June 30, 2020, are as follows (in thousands):
Balance July 1, 2019 Additions Deletions
Balance June 30, 2020
Due WithinOne Year(Current)
Due Beyond One Year
(Non-current)
Business-type ActivitiesBonds payable:
Toll Facility Bonds $ 2,685,070 $ 368,675 $ 366,885 $ 2,686,860 $ 148,335 $ 2,538,525 Florida Hurricane Catastrophe Fund
Bonds 2,200,000 — 550,000 1,650,000 1,000,000 650,000 4,885,070 368,675 916,885 4,336,860 1,148,335 3,188,525
Unamortized bond premiums(discounts) 159,848 55,036 31,235 183,649 — 183,649
Total bonds payable 5,044,918 423,711 948,120 4,520,509 1,148,335 3,372,174
Accrued prize liability 428,433 2,028,604 1,917,288 539,749 307,053 232,696 Deposits 168,488 132,813 12,477 288,824 122,053 166,771 Compensated absences 24,134 10,237 8,103 26,268 6,981 19,287 Tuition and housing benefits payable 11,292,893 1,513,991 1,049,873 11,757,011 509,224 11,247,787 Installment purchases/capital leases 15,536 — 7,318 8,218 773 7,445 Claims payable 3,450,132 1,500,000 2,266,641 2,683,491 2,683,491 — Public-private partnership agreements1 215,241 — 1,634 213,607 1,974 211,633 Other postemployment benefits 196,922 34,680 690 230,912 2,987 227,925 Pension liability 137,528 15,185 555 152,158 846 151,312 Other liabilities 1,173 1,449 1,173 1,449 — 1,449
Total Business-type Activities $ 20,975,398 $ 5,660,670 $ 6,213,872 $ 20,422,196 $ 4,783,717 $ 15,638,479
1Public-private partnerships are included in the Installment purchases/capital leases lines of the Proprietary Funds Statement of Net Position.
As of June 30, 2020, the Florida Hurricane Catastrophe Fund's outstanding debt was secured with collateral of $650 million. This debt contains provisions that, in an event of default, the Trustee may, and upon written request of the holders of a majority of the aggregate principal amount of all outstanding parity obligations shall, declare the principal of all outstanding parity obligations to be due and payable immediately.
2020 STATE OF FLORIDA CAFR
163

Balance July 1, 2019 Additions Deletions
Balance June 30, 2020
Due WithinOne Year(Current)
Due Beyond One Year
(Non-current)
Component UnitsBonds payable $ 5,444,168 $ 567,152 $ 686,241 $ 5,325,079 $ 845,471 $ 4,479,608
Bonds from direct borrowings and direct placements1 628,082 313,119 6,267 934,934 45,033 889,901 Deposits 1,192,442 805,833 838,915 1,159,360 865,118 294,242 Compensated absences 732,278 132,522 78,682 786,118 93,587 692,531 Installment purchases/capital leases 79,158 26,930 11,081 95,007 15,399 79,608 Claims payable 1,181,007 151,956 50,744 1,282,219 38,461 1,243,758 Certificates of participation payable 573,069 — 23,395 549,674 24,363 525,311 Due to other governments/primary 790,206 83,325 90,918 782,613 53,007 729,606 Other postemployment benefits 2,929,194 1,348,863 610,456 3,667,601 49,548 3,618,053 Pension liability 3,599,143 1,924,305 1,475,126 4,048,322 20,529 4,027,793 Asset retirement obligations 9,482 500 502 9,480 — 9,480 Other liabilities 711,378 981,813 968,636 724,555 169,380 555,175
Notes from direct borrowings and direct placements - Excludes Bonds1 379,341 61,345 9,455 431,231 37,096 394,135
Total Component Units $ 18,248,948 $ 6,397,663 $ 4,850,418 $ 19,796,193 $ 2,256,992 $ 17,539,201
1Direct borrowings and direct placements have been separately identified due to the implementation of GASB Statement No. 88.
The outstanding $101.8 million Board of Governors, Florida Agricultural and Mechanical University Dormitory Revenue and Revenue Refunding Bonds from direct borrowings provide that, upon any event of default the lender may: (1) declare the principal of, and interest on, the bonds immediately due and payable; (2) exercise any of its rights under the loan agreement; (3) apply for the appointment of receiver, trustee, liquidator, or conservator; or (4) at the request of the Secretary of the United States Department of Education, terminate the loan agreement and declare all amounts advanced to the University, and interest thereon, immediately due and payable. Should the Secretary request the lender to pursue option (4), such funds, including costs of collection, may be collected by administrative offset against payments due to the University from the Federal Government for grants and contracts.
The University of Florida Shands Teaching Hospital and Clinic’s outstanding $155.1 million direct placement bonds provide that the principal of all outstanding direct placement bonds may be accelerated upon an event of default.
The University of South Florida Finance Corporation’s $242.9 million certificates of participation, including $109.1 million of direct placements, provide that the outstanding principal may be accelerated upon an event of default.
The University of Central Florida Foundation, Inc.’s outstanding $71.5 million long-term debt from direct placements are secured with collateral of capital assets used in operations and provide that in the event of default, all outstanding amounts may be accelerated.
The State’s colleges and universities also have unused lines of credit of $35,100,000 as of June 30, 2020.
2020 STATE OF FLORIDA CAFR
164

NOTE 11 - INTERFUND BALANCES AND TRANSFERS
At June 30, 2020, amounts to be received or paid with current available resources are reported as due from or due to other funds, whereas the noncurrent portion is reported as advances to or advances from other funds. Interfund balances at June 30, 2020, consist of the following (in thousands):
Due from Other Funds (in thousands)Governmental Activities
Due to Other Funds (in thousands) General
Fund
Natural Resources, Environment, and
Growth ManagementPublic
Education
Health andFamily
Services Transportation
Governmental Activities
General Fund $ — $ 52,895 $ 18,609 $ 160,304 $ 26,892 Natural Resources, Environment, and Growth Management 5,690 — — 657 3,689 Public Education 97 — — 2,853 — Health and Family Services 49,896 6 — — — Transportation 5,104 2,693 — — — Nonmajor Governmental Funds 75,781 3,763 8,889 6,905 91,003 Internal Service Funds 793 — — — —
Business-type Activities Transportation 120 — — — 118,808 Lottery 55 — 127,299 — — Hurricane Catastrophe Fund — — — — — Prepaid College Program — — — — — Reemployment Assistance 16 — — — — Nonmajor Enterprise Funds 7,490 — — 258 —
Fiduciary FundsPrivate-purpose Trust Funds 183 — 307 — — Pension and Other Employee Benefits Trust Funds 4 — — — — Agency Funds 90,744 — 2,473 2,383 13,316 Investment Trust Funds — — — — —
Total $ 235,973 $ 59,357 $ 157,577 $ 173,360 $ 253,708
(Continued Below)
Due from Other Funds (in thousands)Governmental Activities
Due to Other Funds (in thousands)
NonmajorGovernmental
Funds
InternalServiceFunds
Governmental ActivitiesGeneral Fund $ 117,566 $ 10,619 Natural Resources, Environment, and Growth Management 536 274 Public Education 823 103 Health and Family Services 11,691 4,208 Transportation 17,572 2,135 Nonmajor Governmental Funds 5,078 5,814 Internal Service Funds 578 500
Business-type ActivitiesTransportation — — Lottery 4 46 Hurricane Catastrophe Fund — — Prepaid College Program — — Reemployment Assistance 362 — Nonmajor Enterprise Funds 748 689
Fiduciary FundsPrivate-purpose Trust Funds 362 2 Pension and Other Employee Benefits Trust Funds 1 2,190 Agency Funds 2,103 — Investment Trust Funds — —
Total $ 157,424 $ 26,580
(Continued next page)
2020 STATE OF FLORIDA CAFR
165

Due from Other Funds (in thousands)Business-type Activities
Due to Other Funds (in thousands) Transportation Prepaid
College ProgramReemployment
Assistance
NonmajorEnterprise
Funds Governmental Activities
General Fund $ — $ — $ 138 $ 3,062 Natural Resources, Environment, and Growth Management — — 3 17 Public Education — — — — Health and Family Services — — 30 45 Transportation 404 — 15 — Nonmajor Governmental Funds — — 20 43 Internal Service Funds — — — —
Business-type Activities Transportation — — — — Lottery — — 3 3 Hurricane Catastrophe Fund — — — 251 Prepaid College Program — — — — Reemployment Assistance — — — — Nonmajor Enterprise Funds — — 1 —
Fiduciary Funds Private-purpose Trust Funds — 384 — — Pension and Other Employee Benefits Trust Funds — — — 7,802 Agency Funds 143,779 — — 3 Investment Trust Funds — — — 110
Total $ 144,183 $ 384 $ 210 $ 11,336 (Continued below)
Due from Other Funds (in thousands)Fiduciary Funds
Due to Other Funds (in thousands)Private-purpose
Trust Funds
Pension and OtherEmployee Benefits
Trust Funds AgencyFunds Total
Governmental ActivitiesGeneral Fund $ 9 $ 999 $ 234,963 $ 626,056 Natural Resources, Environment, and Growth Management — — — 10,866 Public Education 201 — — 4,077 Health and Family Services — — 136 66,012 Transportation — — 6,530 34,453 Nonmajor Governmental Funds — — 244 197,540 Internal Service Funds — 1 12,439 14,311
Business-type ActivitiesTransportation — — — 118,928 Lottery — 29 — 127,439 Hurricane Catastrophe Fund — — — 251 Prepaid College Program 29,286 — — 29,286 Reemployment Assistance — — 169 547 Nonmajor Enterprise Funds — — — 9,186
Fiduciary FundsPrivate-purpose Trust Funds — — — 1,238 Pension and Other Employee Benefits Trust Funds — 67,234 — 77,231 Agency Funds — — — 254,801 Investment Trust Funds — — — 110 Total $ 29,496 $ 68,263 $ 254,481 $ 1,572,332
2020 STATE OF FLORIDA CAFR
166

Advances to Other Funds(in thousands)
Governmental Activities
Advances from Other Funds (in thousands)General
Fund Transportation
Governmental ActivitiesPublic Education $ — $ — Nonmajor Governmental Funds 625 112 Internal Service Funds 500 —
Business-type Activities
Transportation — 116,683 Total $ 1,125 $ 116,795
(Continued below)
Advances to Other Funds(in thousands)
FiduciaryFunds
Advances from Other Funds (in thousands)Private-purpose
Trust Funds Total
Governmental ActivitiesPublic Education $ 986,684 $ 986,684
Nonmajor Governmental Funds — 737 Internal Service Funds — 500
Business-type Activities Transportation — 116,683
Total $ 986,684 $ 1,104,604
2020 STATE OF FLORIDA CAFR
167
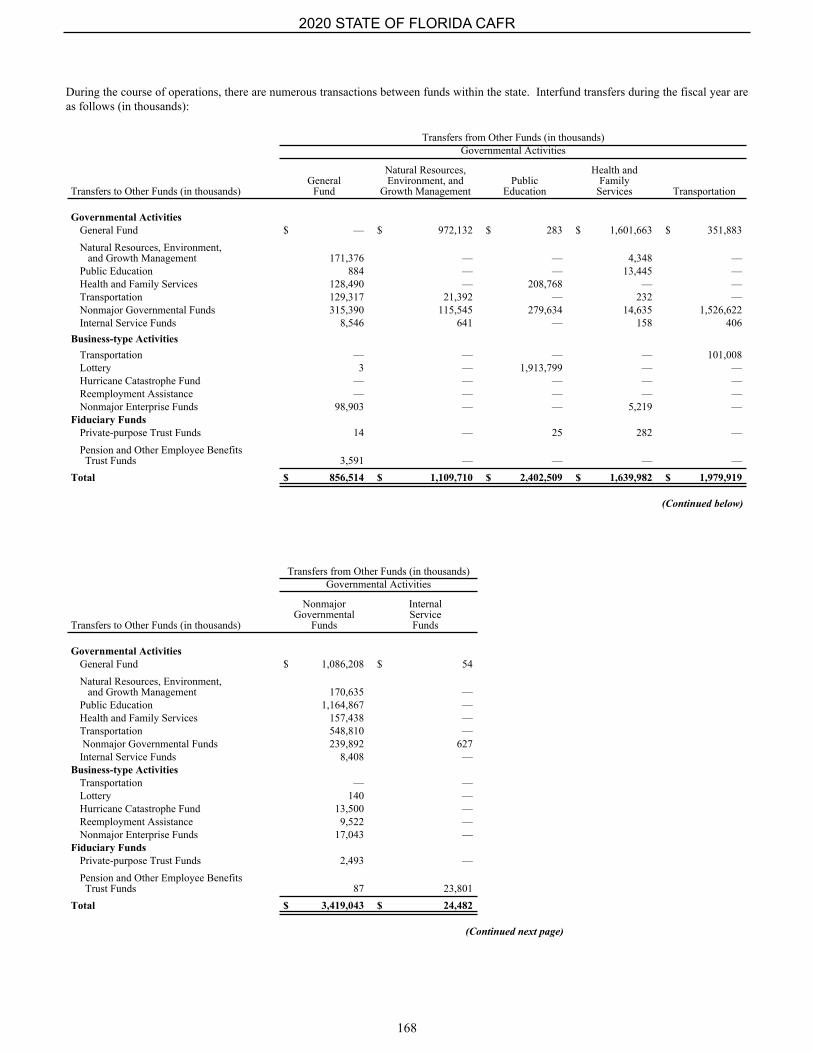
During the course of operations, there are numerous transactions between funds within the state. Interfund transfers during the fiscal year are as follows (in thousands):
Transfers from Other Funds (in thousands)Governmental Activities
Transfers to Other Funds (in thousands)General
Fund
Natural Resources, Environment, and
Growth ManagementPublic
Education
Health andFamily
Services Transportation
Governmental ActivitiesGeneral Fund $ — $ 972,132 $ 283 $ 1,601,663 $ 351,883 Natural Resources, Environment, and Growth Management 171,376 — — 4,348 — Public Education 884 — — 13,445 — Health and Family Services 128,490 — 208,768 — — Transportation 129,317 21,392 — 232 — Nonmajor Governmental Funds 315,390 115,545 279,634 14,635 1,526,622 Internal Service Funds 8,546 641 — 158 406
Business-type ActivitiesTransportation — — — — 101,008 Lottery 3 — 1,913,799 — — Hurricane Catastrophe Fund — — — — — Reemployment Assistance — — — — — Nonmajor Enterprise Funds 98,903 — — 5,219 —
Fiduciary FundsPrivate-purpose Trust Funds 14 — 25 282 — Pension and Other Employee Benefits Trust Funds 3,591 — — — —
Total $ 856,514 $ 1,109,710 $ 2,402,509 $ 1,639,982 $ 1,979,919
(Continued below)
Transfers from Other Funds (in thousands)Governmental Activities
Transfers to Other Funds (in thousands)
NonmajorGovernmental
Funds
InternalServiceFunds
Governmental ActivitiesGeneral Fund $ 1,086,208 $ 54 Natural Resources, Environment, and Growth Management 170,635 — Public Education 1,164,867 — Health and Family Services 157,438 — Transportation 548,810 — Nonmajor Governmental Funds 239,892 627 Internal Service Funds 8,408 —
Business-type ActivitiesTransportation — — Lottery 140 — Hurricane Catastrophe Fund 13,500 — Reemployment Assistance 9,522 — Nonmajor Enterprise Funds 17,043 —
Fiduciary FundsPrivate-purpose Trust Funds 2,493 — Pension and Other Employee Benefits Trust Funds 87 23,801
Total $ 3,419,043 $ 24,482
(Continued next page)
2020 STATE OF FLORIDA CAFR
168

During the course of operations, there are numerous transactions between funds within the state. Interfund transfers during the fiscal year are as follows (in thousands):
Transfers from Other Funds (in thousands)Business-type Activities
Transfers to Other Funds (in thousands) TransportationReemployment
Assistance
Nonmajor Enterprise
Funds
Governmental Activities
General Fund $ — $ 1,030 $ 3,122 Natural Resources, Environment, and Growth Management — 56 1
Public Education — 7 — Health and Family Services — 465 1,235 Transportation 84,704 60 — Nonmajor Governmental Funds — 215 3,159 Internal Service Funds — 11 26
Business-type Activities
Transportation — — — Lottery — 9 — Hurricane Catastrophe Fund — — —
Reemployment Assistance — — —
Nonmajor Enterprise Funds — 37 —
Fiduciary FundsPrivate-purpose Trust Funds — — — Pension and Other Employee Benefits Trust Funds — 4 19,176
Total $ 84,704 $ 1,894 $ 26,719
(Continued below)
Transfers from Other Funds (in thousands)Fiduciary Funds
Transfers to Other Funds (in thousands)Private-purpose
Trust Funds
Pension and Other
Employee Benefits
Trust Funds Total
Governmental Activities
General Fund $ 1,328 $ 15,129 $ 4,032,832 Natural Resources, Environment, and Growth Management — — 346,416 Public Education 66 — 1,179,269 Health and Family Services — — 496,396 Transportation — — 784,515 Nonmajor Governmental Funds — — 2,495,719 Internal Service Funds — — 18,196
Business-type Activities
Transportation — — 101,008
Lottery — — 1,913,951 Hurricane Catastrophe Fund — — 13,500
Prepaid College Program 3,644 — 3,644 Reemployment Assistance — — 9,522 Nonmajor Enterprise Funds — — 121,202
Fiduciary Funds
Private-purpose Trust Funds — — 2,814 Pension and Other Employee Benefits Trust Funds — 650,118 696,777
Total $ 5,038 $ 665,247 $ 12,215,761
2020 STATE OF FLORIDA CAFR
169

NOTE 12 - RISK MANAGEMENT A. State Risk Management Trust Fund
The State Risk Management Trust Fund (Fund) provides property insurance coverage for state buildings and contents against loss from fire, lightning, sinkholes, flood, and other hazards customarily insured by extended coverage. The property insurance program has a self-insured retention of $2 million per occurrence for losses arising from all perils listed above except named windstorm and flood. The property insurance program also has a self-insured retention of $2 million per occurrence for losses arising from named windstorm and flood, but with an additional annual aggregate self-insured retention of $40 million. Commercial reinsurance is purchased for losses over the self-insured retention up to $62.75 million per occurrence for named windstorm and flood losses through February 15, 2021, and $225 million per occurrence for covered perils other than named wind and flood.
The Fund’s estimated liability for unpaid property insurance claims at the fiscal year-end is determined by an actuarial method and includes an amount for losses incurred but not yet reported. The amount paid for property claim losses did not exceed the self-insured retentions for the last two fiscal years. Changes in the Fund’s property insurance claims liability amount for the fiscal years ended June 30, 2019, and June 30, 2020, were as follows (in thousands):
Fiscal YearEnded
Beginning of Fiscal Year
Liability
Current YearClaims andChanges inEstimate
ClaimPayments
Balance atFiscal
Year-end
June 30, 2019 $ 1,080 $ 519 $ (511) $ 1,088
June 30, 2020 $ 1,088 $ 2,516 $ (2,569) $ 1,035
The estimated liability for unpaid property insurance claims for the fiscal year ended June 30, 2020, does not include outstanding property claim loss payments resulting from Hurricane Sally that made landfall near Gulf Shores, Alabama and impacted Northwest Florida in September of 2020. Estimated loss payments for Hurricane Sally total $6 million, which will not exceed the aggregate self-insurance retention for named windstorms and flooding.
The Fund also provides casualty insurance coverage for the risks of loss related to federal civil rights and employment actions, workers' compensation, court-awarded attorney fees, automobile liability, and general liability. The state is self-insured for all claims associated with liability risks and in-state workers' compensation coverage. The state purchases an insurance policy for out-of-state workers’ compensation coverage.
The estimated liability for unpaid casualty insurance claims at June 30, 2020, was $1.15 billion. This amount was determined through an actuarial method based on historical paid and incurred losses and includes an amount for losses incurred, but not yet reported. In addition, this amount includes the present value of workers' compensation indemnity claims liability of $252.0 million, discounted using a 4 percent annual percentage rate per Section 625.091, Florida Statutes. The undiscounted workers’ compensation indemnity claims liability is $352.8 million.
Changes in the Fund’s casualty insurance claims liability for the fiscal years ended June 30, 2019, and June 30, 2020, were as follows (in thousands):
Fiscal YearEnded
Beginning of Fiscal Year
Liability
Current YearClaims andChanges inEstimate
ClaimPayments
Balance atFiscal
Year-end
June 30, 2019 $ 1,143,451 $ 134,258 $ (130,233) $ 1,147,476
June 30, 2020 $ 1,147,476 $ 144,799 $ (141,457) $ 1,150,818
Actual current year claims and changes in estimate for casualty lines of coverage for the fiscal year ended June 30, 2020, increased by $10.5 million as compared to the previous fiscal year.
2020 STATE OF FLORIDA CAFR
170

B. Employee and Retiree Health Insurance Funds
Employees and retirees may obtain health care services through participation in the state’s group health insurance plan or through membership in a health maintenance organization plan under contract with the state. The state’s risk financing activities associated with state group health insurance, such as the risks of loss related to medical and prescription drug claims, are administered through the State Employees Group Health Insurance Trust Fund, an internal service fund. It is the practice of the state not to purchase commercial coverage for the risks of losses covered by this program.
The program’s estimated fiscal year-end liability includes an amount for claims that have been incurred but not reported, which is based on analyses of historical data performed by both the state and its contractors. Changes in claims liability amounts for the fiscal years ended June 30, 2019, and June 30, 2020, were as follows (in thousands):
Fiscal YearEnded
Beginning of Fiscal Year
Liability
Current YearClaims andChanges inEstimate
ClaimPayments
Balance atFiscal
Year-end
June 30, 2019 $ 167,298 $ 2,118,454 $ (2,088,265) $ 197,487
June 30, 2020 $ 197,487 $ 2,028,133 $ (2,031,086) $ 194,534
During the year, for program operations, both employee and retiree participation in the state group health insurance program are accounted for in the State Employees Group Health Insurance Trust Fund. Retiree participation in the program is considered an Other Postemployment Benefit (OPEB) for purposes of this report. See Note 6, Section B regarding OPEB for additional information. Asset and liability balances related to retiree participation in the program as of June 30, 2020, were transferred from the State Employees Group Health Insurance Trust Fund and reported in Other Agency Funds in accordance with the requirements of GASB Codification Section P53, Reporting Assets Accumulated for Defined Postemployment Benefits Other Than Pensions not Provided Through Trusts that Meet Specified Criteria.
2020 STATE OF FLORIDA CAFR
171

NOTE 13 - FLORIDA PREPAID COLLEGE PROGRAM
The Stanley G. Tate Florida Prepaid College Program (Program) was created in 1987 to provide a medium through which the costs of tuition, tuition differential fee, local fees, and dormitory residence may be paid in advance of enrollment in a state postsecondary institution at a rate lower than the projected corresponding cost at the time of actual enrollment. The Florida Prepaid College Board (Board) administers the Program, and the State of Florida guarantees the obligations of the Board to qualified beneficiaries if moneys in the Program are insufficient. The Program is accounted for in an enterprise fund. An actuarial study is performed to determine the Program’s funding status. The actuarial present value of future contract benefits reflects the present value of estimated future contract benefits and expenses and is adjusted for the effects of projected tuition and fees increases, dormitory housing fees increases, and termination of contracts. Additional information as of June 30, 2020, is as follows:
Actuarial present value of futurecontract benefits and expensespayable $ 11,757,011,225
Net position available (net of outstanding refund payments and unrealized gain/losson securities lending portfolio) $ 15,348,000,000
Net position as a percentage offuture contract benefits and expensesobligation 130.5 %
2020 STATE OF FLORIDA CAFR
172

NOTE 14 -INSURANCE ENTERPRISES
The State of Florida has established multiple enterprises that provide insurance, reinsurance, and guarantee services. The primary risk exposures to the state relate to catastrophic hurricane losses, access to liquidity from credit markets, and ultimate dependence on public assessments.
A. FLORIDA HURRICANE CATASTROPHE FUND
The Florida Hurricane Catastrophe Fund (FHCF) was created in 1993 by the Florida Legislature, as a state fund administered by the State Board of Administration (SBA) to provide a source of reimbursement to most residential property insurers for catastrophic hurricane losses, thereby creating additional insurance capacity. Most admitted residential property insurers writing FHCF covered policies are required to purchase reimbursement coverage with the FHCF.
The reimbursement coverage covers a portion of hurricane losses in excess of an insurer’s share of an industry wide retention, up to the lesser of either the statutory limit or the actual claims-paying capacity of the FHCF. For the contract year ended May 31, 2020, the industry retention for determining each insurer’s retention was $7.422 billion per hurricane for the two hurricanes with the largest losses and $2.474 billion for each additional hurricane in the contract year. The aggregate coverage capacity for the contract year (in excess of retention) was $17.0 billion. The statute requires that an actuarially indicated formula developed by an independent actuary be used to calculate the reimbursement premiums collected for the coverage.
The SBA is required to contract with each insurer writing covered policies in the state to reimburse the insurer for a specified percentage of losses from covered events in excess of the insurer’s retention. The total obligation of the SBA with respect to all contracts covering a particular contract year is statutorily capped at the “actual claims-paying capacity” of the FHCF, defined by law as the sum of the balance of the fund as of December 31 of the contract year, plus any reinsurance purchased by the fund, plus the amount the SBA is able to raise through the issuance of revenue bonds. This amount is determined by the FHCF based on reports of its financial advisors and bond underwriters and is reviewed by the FHCF Advisory Council. The FHCF has a fiscal year end of June 30 and its reimbursement contracts expire on May 31. As of June 30, 2020, the FHCF had a net position of $10.35 billion, including the net position of the State Board of Administration Finance Corporation.
If available resources and pre-catastrophe debenture financing are not adequate to satisfy reimbursement claims, the State Board of Administration Finance Corporation may issue revenue bonds secured by emergency assessments. The SBA has the sole authority to direct the Florida Office of Insurance Regulation to levy assessments on most property and casualty insurance policy premiums on behalf of the FHCF. Aggregate assessments may not exceed 10% and assessments in relation to losses in one contract year may not exceed 6%. This assessment authority is neither related to nor restricted by the assessments levied by either Citizens Property Insurance Corporation (Citizens), a discretely presented component unit, or the Florida Insurance Guaranty Association, Inc. (FIGA). As of June 30, 2020, the FHCF is not levying assessments.
Hurricane losses represent the estimated ultimate cost of all reported and unreported claims during the year that exceed the participating insurers’ individual company retention levels. The estimates for current year and prior year losses are continually reviewed and adjusted as experience develops or new information becomes known and such adjustments are included in current operations. During the 2018 hurricane season, the State of Florida experienced Hurricane Michael, which made landfall as a major Category 5 storm on October 10, 2018. As of June 30, 2020, the estimated ultimate loss to the FHCF for this hurricane was $1.45 billion. Hurricane Irma, which occurred during the 2017 hurricane season, had an estimated ultimate loss as of June 30, 2020 of $6.5 billion. The estimated ultimate losses from these events are reflected in the FHCF’s net position as of June 30, 2020.
In April 2013, pre-event Series 2013A Revenue Bonds were issued in the amount of $2.0 billion to maximize the ability of the FHCF to meet future obligations. The proceeds from these bonds may be used to pay for losses incurred from future covered events. Investment earnings on these funds were used to pay the debt service requirements of these bonds. The final maturity of these bonds occurred on July 1, 2020.
In March 2016, pre-event Series 2016A Revenue Bonds were issued in the amount of $1.2 billion to provide funds, together with other available funds, to maximize the ability of the FHCF to meet future obligations. The proceeds from these bonds may be used to pay for losses incurred from future covered events. Investment earnings on these funds, as well as reimbursement premiums, if necessary, are used to pay the debt service requirements of these bonds. $550 million matured on July 1, 2019, and $650 million will mature on July 1, 2021.
On May 28, 2020, SBA Trustees authorized the SBA to pursue the issuance of up to $5.0 billion in pre-event revenue bonds to provide additional funds to maximize the ability of the FHCF to meet future obligations.
In addition to the issuance of bonds, the FHCF has the authority to procure reinsurance for the purpose of maximizing the capacity of the fund. No reinsurance products were purchased for the contract year beginning June 1, 2020, but the FHCF did
2020 STATE OF FLORIDA CAFR
173

purchase aggregate excess catastrophe reinsurance providing coverage to the FHCF for 92% of $1.0 billion of losses in excess of $10.5 billion of FHCF losses, effective June 1, 2019 through May 31, 2020.
B. CITIZENS PROPERTY INSURANCE CORPORATION
Citizens Property Insurance Corporation (Citizens) was established on August 1, 2002, pursuant to Section 627.351(6), Florida Statutes (the Act), to provide certain residential and non-residential property insurance coverage to qualified risks in the State of Florida under circumstances specified in the Act. This legislation was enacted such that property insurance be provided through Citizens to applicants who are in good faith entitled to procure insurance through the voluntary market, but are unable to do so. Citizens results from a combination of the Florida Residential Property and Casualty Joint Underwriting Association (the FRPCJUA) and the Florida Windstorm Underwriting Association (the FWUA). The FRPCJUA was renamed Citizens and the FWUA’s rights, obligations, assets, liabilities and all insurance policies were transferred to Citizens. Unlike private insurers offering coverage through the admitted market, Citizens is not required to obtain or to hold a certificate of authority issued by the Florida Department of Financial Services, Office of Insurance Regulation (the Office). Likewise, Citizens is not subject to Risk-Based Capital (RBC) requirements or required to have a pledged deposit on file with the State of Florida. For purposes of its tax-exempt status, Citizens is considered a political subdivision and an integral part of the State of Florida. As such, Citizens’ operations may be affected by the legislative process.
Citizens operates pursuant to a Plan of Operation (the Plan), under the Act, approved by the Financial Services Commission (the Commission) of the State of Florida. The Commission is composed of the Governor, the Chief Financial Officer, the Attorney General and the Commissioner of Agriculture of the State of Florida.
Citizens is supervised by a Board of Governors (the Board) which consists of nine individuals who reside in the State of Florida. The Governor appoints three members, and the Chief Financial Officer, the President of the Senate and the Speaker of the House of Representatives each appoint two members of the Board. At least one of the two members appointed by each appointing officer must have a demonstrated expertise in the insurance industry. The Chief Financial Officer designates one of the appointees as the Board’s chair. All Board members serve at the pleasure of their appointing officers.
Citizens’ President and Chief Executive Officer (Executive Director) and senior managers are engaged by and serve at the pleasure of the Board. The Executive Director is subject to confirmation by the Florida Senate.
Pursuant to the Act, all revenues, expenses, assets and liabilities of Citizens shall remain divided into three separate accounts: the Personal Lines Account, the Commercial Lines Account and the Coastal Account (collectively, the Accounts). A brief history of each account follows:
• Personal Lines Account History - The FRPCJUA began operations on January 21, 1993, after Hurricane Andrew, pursuant to Section 627.351(6), Florida Statutes, to provide certain residential property insurance coverage to qualified risks in the State of Florida for applicants who were in good faith entitled to procure insurance through the private market, but were unable to do so. Residential property coverage consists of the types of coverage provided to homeowners, mobile homeowners, tenants, condominium unit owners, and similar policies.
The policies provide coverage for all perils covered under a standard residential policy, subject to certain underwriting requirements. Such policies may exclude windstorm coverage on property within eligible areas. This portion of the FRPCJUA's activities became the Personal Lines Account (PLA) under Citizens.
• Commercial Lines Account History - The Florida Property and Casualty Joint Underwriting Association (FPCJUA) was activated in early 1994 to provide commercial residential coverage (i.e., coverage for condominium associations, apartment buildings and homeowner associations) to organizations unable to obtain such coverage from a private insurer. During 1995, legislation was enacted to transfer all obligations, rights, assets, and liabilities related to commercial residential coverage from the FPCJUA to the FRPCJUA. The legislation required that the premiums, losses, assets and liabilities be accounted for separately from the FRPCJUA's personal residential business. This portion of the FRPCJUA's activities became the Commercial Lines Account (CLA) under Citizens. In 2006, the FPCJUA was re-activated to provide commercial non-residential wind-only coverage. In 2007, legislation was enacted which resulted in the transfer and assumption of the FPCJUA’s commercial non-residential policies by Citizens. These policies were added to the CLA.
• Coastal Account History - The FWUA, which was a residual market mechanism for windstorm and hail coverage in select areas of the State of Florida, was created by an act of the Florida Legislature in 1970 codified as Section 627.351(2), Florida Statutes. FWUA was a Florida unincorporated association, the members of which were all
2020 STATE OF FLORIDA CAFR
174

property insurance companies holding a certificate of authority to provide property insurance coverage in the State of Florida. FWUA provided policies of windstorm insurance for property owners within the eligible areas who were unable to obtain such coverage from private insurers. Insured properties include personal residential, commercial residential and commercial non-residential properties. This portion of the FWUA’s activities became the High-Risk Account under Citizens. In 2007, Citizens received authority to issue multi-peril policies in the High-Risk Account. Pursuant to legislative changes during 2011, the High-Risk Account was renamed the Coastal Account.
Criteria for defining the reporting entity are identified and described in the Governmental Accounting Standards Board’s Codification of Governmental Accounting and Financial Reporting Standards, Sections 2100 and 2600. Application of these criteria determines potential component units for which the primary government is financially accountable and other organizations for which the nature and significance of their relationship with the primary government are such that exclusion would cause the primary government’s financial statements to be misleading or incomplete. Based on the application of these criteria, Citizens is a component unit of the State of Florida, and its financial activity is reported in the state’s Comprehensive Annual Financial Report by discrete presentation.
The financial statements presented herein relate solely to the financial position and results of operations of Citizens and are not intended to present the financial position of the State of Florida or the results of its operations or its cash flows.
Citizens has determined that it has no component units that should be included in its separately reported financial statements. However, the Florida Market Assistance Plan (FMAP) is a financially related entity. FMAP is a 501(c)(6) entity created by Section 627.3515, Florida Statutes. FMAP was created for the purpose of assisting in the placement of applicants who are unable to procure property or casualty insurance coverage from authorized insurers when such insurance is otherwise generally available. As provided in FMAP’s enabling legislation, each person serving on the Board of Citizens also serves on the Board of FMAP. In addition, Citizens is required to fund any deficit incurred by FMAP in performing its statutory purpose. No such funding has taken place from FMAP inception through December 31, 2019.
C. FLORIDA INSURANCE GUARANTY ASSOCIATION, INC.
The Florida Insurance Guaranty Association, Inc. (FIGA), a not-for-profit corporation, was established by the Florida Legislature through the Florida Insurance Guaranty Association Act of 1970 (the Act). FIGA was created to provide a mechanism for the payment of covered claims of insolvent insurers and to assist in the detection and prevention of insurers’ insolvencies. FIGA operates under the supervision and approval of a board of directors, comprised of five to nine persons, recommended by the member insurers pursuant to Section 631.56, F.S., and subsequently appointed by the Department of Financial Services.
The members of FIGA are all insurers that hold a certificate of authority to provide property and casualty coverage in the State of Florida.
The funding of FIGA’s activities is provided by distributions from the estates of insolvent insurers and assessments of members. The assessments are calculated and, as considered necessary, levied against member insurers on the basis of net direct written premiums in the State of Florida in the classes protected by the Act. FIGA obtains the amount of the net direct written premiums, by company and by class of protection, to use as the basis for assessment calculations. The maximum regular assessment rate is 2%. In addition to the regular assessment, FIGA has the authority to levy an emergency assessment up to an additional 2% of net direct written premiums for the account specified in Section 631.55(2)(b), F.S., to pay covered claims of insurers rendered insolvent by the effects of a hurricane. FIGA also has the authority to work with an affected municipality, county, or financing conduit organization under Chapter 163, F.S., to issue tax-exempt bonds should the funding need arise for the account specified in Section 631.55(2)(b), F.S. As of June 30, 2020, FIGA has not needed to utilize this bonding authority and no tax-exempt bonds have been issued.
D. FLORIDA WORKERS’ COMPENSATION INSURANCE GUARANTY ASSOCIATION, INC.
The Florida Workers’ Compensation Insurance Guaranty Association, Inc. (FWCIGA), a not-for-profit corporation, was established by the Florida Legislature in 1997 as a merger of the workers’ compensation account of the Florida Insurance Guaranty Association, Inc., and the Florida Self-Insurance Fund Guaranty Association. FWCIGA was created to provide a mechanism for the payment of covered claims of insolvent workers’ compensation insurers and to assist in the detection and prevention of insurers’ insolvencies. FWCIGA operates under the supervision and approval of a board of directors, comprised of eleven persons. Eight directors are recommended by member insurers pursuant to Section 631.912, F.S., and subsequently appointed by the Florida Department of Financial Services. The remaining three directors are the Florida Insurance Consumer Advocate, designee of the state’s Chief Financial Officer, and one person with commercial insurance experience appointed by the Governor.
2020 STATE OF FLORIDA CAFR
175

The members of FWCIGA are all insurers that hold a certificate of authority to provide workers’ compensation coverage in the State of Florida.
The funding of FWCIGA’s activities is provided by distributions from the estates of insolvent insurers and assessments of members. The assessments are calculated and, as considered necessary, levied against member insurers on the basis of workers’ compensation net direct written premiums in the State of Florida without taking into account any applicable discounts or credits for deductibles. FWCIGA obtains the amount of the net direct written premiums, by company, to use as the basis for assessment calculations. The maximum assessment rate is 2% for insurance companies and self-insurance funds. In addition to the regular assessment, the Florida Legislature granted FWCIGA the authority to levy an up to an additional 1.5% of net direct written premiums if the 2% assessment is insufficient to make payments for the calendar year.
FWCIGA's Board of Directors certified the need for a 1% assessment on its member insurers. The 1% assessment was levied on all new and existing renewal policies with effective dates beginning January 1, 2020 through December 31, 2020.
2020 STATE OF FLORIDA CAFR
176

NOTE 15 - CONTINGENCIES
A. Federal Family Education Loan Program
The Florida Department of Education (FDOE) administers the Federal Family Education Loan Program (FFELP), 20 USC s. 1071 et. seq. The primary purpose is to guarantee the repayment of principal and accrued interest of eligible student loans made by participating lenders under the FFELP.
The Higher Education Amendments of 1998 (the Amendments) were enacted on October 7, 1998, with a retroactive date of October 1, 1998, for most provisions. The Amendments changed the financial and reporting structure of guaranty agencies. Pursuant to the amendments, the FDOE established a Federal Student Loan Reserve Fund (Federal Fund) and a Guaranty Agency Operating Fund, as required, to account for the FFELP activities, 20 USC s. 1072a and s. 1072b.
The regulations for administering the program are found in Title 34 of the Code of Federal Regulations, Part 682. Student loans are issued by participating financial institutions to eligible students and their parents under FFELP. If a student loan guaranteed by FDOE defaults, the Federal Fund pays the lender for the defaulted student loan. The United States Department of Education (USDOE) is the program’s reinsurer. Reinsurance amounts received from the USDOE to replenish the Federal Fund are currently 100%. Once the loan has defaulted, the FDOE begins collection activities with the borrower.
The passage of the Health Care and Education Reconciliation Act of 2010 ended the guarantor portion of the program after June 30, 2010. FDOE still maintains administrative and collection activities for the loans guaranteed by FDOE prior to July 1, 2010, as required by FFELP. The Federal Fund is used to account for assets held by FDOE as an agent for the Federal government and therefore is custodial in nature and is the property of USDOE. At June 30, 2020, approximately $61 million of Program loans were still outstanding from loans that had been made prior to the Program ending on June 30, 2010. The amount of potential liability to the federal fund is indeterminable.
B. Federally Assisted Grant Programs
Medicaid Program - The United States Department of Health and Human Services, Centers for Medicare and Medicaid Services (CMS) is requesting state reimbursement of amounts determined unallowable under the Florida Medicaid Reform Section 1115 Demonstration Waiver Special Terms and Conditions for state fiscal years ended June 30, 2006, through June 30, 2014. The CMS alleged the State of Florida submitted Low Income Pool (LIP) cost limit reconciliations showing LIP payments in excess of allowable costs for LIP providers. The disallowance notice was issued on September 28, 2016, and the Agency for Health Care Administration (AHCA) filed its Request for Reconsideration with the CMS on November 21, 2016. On January 19, 2017, AHCA’s Request for Reconsideration was denied by CMS. AHCA has filed an appeal with the Department Appeals Board (DAB). At this time, the briefing has concluded and a decision is expected to be issued. If AHCA is ultimately unsuccessful in its challenges, it may be required to return $97,570,183 to the Federal Government.
Medicaid Program - CMS is requesting state reimbursement of the federal share paid for claimed Medicaid expenditures associated with LIP payments made under Florida’s Medicaid Reform Section 1115 Demonstration covering the period from July 1, 2006, through June 30, 2009. The disallowance notices were issued on September 28, 2016, and AHCA filed its Request for Reconsideration with the CMS on November 21, 2016. On January 19, 2017, AHCA’s Request for Reconsideration was denied by CMS. AHCA has filed an appeal with the DAB. At this time the briefing has concluded, and a decision is expected to be issued. If AHCA is ultimately unsuccessful in its challenges, it may be required to return $63,233,036 to the Federal Government.
Medicaid Program - On July 29, 2016, AHCA posted amended outpatient Medicaid rates for state fiscal year 2016-2017 to its website. Those Medicaid reimbursement rate change forms were dated July 29, 2016 ("July 29 Rate Letters"). The Public Health Trust of Miami-Dade County, Florida filed its Petition for Formal Administrative Determination of Invalidity of Agency Statements and Existing Rule 59G-6.030 on October 31, 2016. The petition was then consolidated with other petitions that challenged the same issue. Petitioners alleged the July 29 Rate Letters and the methodology by which AHCA used to calculate the outpatient Medicaid rates are statements that constitute an unadopted rule. On February 13, 2017, the Division of Administrative Hearings (DOAH) issued an Order Extending Stay of Unadopted Rule Challenge and Rescheduling Final Hearing in Existing Rule Challenge. On February 23, 2017, the final hearing was held at DOAH. The Petitioners were unsuccessful and the Agency prevailed. The hospitals filed an appeal. The appeal concluded and the
2020 STATE OF FLORIDA CAFR
177

Court entered an Order in favor of the Hospitals. At this time the Agency is attempting to calculate the impact of this challenge which could result in a net fiscal impact in excess of $25 million.
Medicaid Program - This is a statewide class action lawsuit filed in 2005 related to children’s access to medical and dental services. After a protracted trial, the court issued findings of fact and conclusions of law in 2014 that were unfavorable to the AHCA, without regard to the fact that in the meantime Florida's Medicaid program had been entirely transformed by the implementation of Statewide Medicaid Managed Care. In 2015, the State entered into a settlement agreement with the Plaintiffs requiring ongoing meetings and performance measures over the next four years. The measures reached in 2019 place AHCA out of compliance with the terms of the settlement agreement. The parties are currently negotiating next steps, including weighing the utility of a corrective action plan versus other means of resolution. The outcome of these negotiations will determine whether the case will conclude or potentially go back to trial. If the parties move forward with a corrective action plan the State may be required to seek an appropriation from the legislature in order to pay all pediatric physicians 100 percent of the Medicare rate. Depending on the outcome of the ongoing settlement negotiations, the cost of this case could reasonably exceed $25 million going forward.
Supplemental Nutrition Assistance Program (SNAP) - The DHHS has alleged that the State of Florida owes them approximately $49 million in overpaid SNAP Quality Control bonus money. The State of Florida is not the only state and many other states have already settled with DHHS and the United States Department of Justice. It is reasonably possible that the State of Florida will pay, as all other states sued for this claim have settled. Depending on the outcome of the ongoing settlement negotiations, the cost of this case could reasonably exceed $25 million.
C. Other
Disability Rights Florida Inc. v. Julie Jones, Secretary, Florida Department of Corrections, Case No. 3:18-cv-179-J-25JRK (U.S. District Court, Middle District of Florida) - Plaintiffs alleged that the Florida Department of Corrections (DOC) denied mental health care to mentally ill inmates confined in the inpatient mental health units, in violation of the Eighth Amendment of the U.S. Constitution, Title II of the Americans with Disabilities Act, and the Rehabilitation Act. In February 2018, the Court approved a consent decree under which DOC agreed to implement widespread changes to its psychiatric treatment system. The parties filed a joint motion to extend jurisdiction and the court issued an order extending the jurisdiction to June 30, 2022. Potential costs to implement this agreement could exceed $25 million.
Inpatient/Outpatient hospital rate challenges - Approximately 60 petitioner hospitals challenged Notice of Agency Action letters issued by the AHCA in February 2015 regarding inpatient and outpatient hospital rates. The hospitals filed petitions with the Agency Clerk, which were forwarded to the Division of Administrative Hearings. By mutual agreement between AHCA and the petitioners, the cases were relinquished back to AHCA in March 2015 for settlement negotiations, which continue. Approximately half of these petitions have been resolved by final order. An adjustment to inpatient and outpatient reimbursement rates could result in a net fiscal impact exceeding $25 million.
Disability Rights Florida Inc. (DRF) v. Julie Jones, Florida Department of Corrections; Case No. 4:16cv47 (U.S. District Court, Northern District Florida) – The Plaintiff alleges that DOC consistently violated the laws protecting incarcerated people with disabilities. The parties entered into a settlement agreement and DOC is currently implementing the terms of the settlement agreement. On or about December 4, 2019, DRF filed a breach of contract lawsuit in state court and that case is still pending. Potential costs to implement the suit could exceed $25 million.
2020 STATE OF FLORIDA CAFR
178

NOTE 16 - LITIGATION
Due to its size and broad range of activities, the State is involved in various, though sometimes routine, legal actions. The following are the significant loss contingencies associated with legal proceedings:
A. Dellaselva, et al., v. Florida Department of Agriculture and Consumer Services, et al., Case No. 03-CA-1947 (20th Cir. Lee County); Ayers, et al., v. Florida Department of Agriculture and Consumer Services, Case No. 05-CA-4120 (9th Cir. Orange County); In re Citrus Canker Litigation, Case No. 03-CA-8255 (11th Cir. Miami-Dade County) (on appeal as Lopez-Brignoni v. Florida Department of Agriculture and Consumer Services, Case No. 3D17-2077 (Fla. 3d DCA)); Gary M. Mahon d/b/a/ Pokey’s Lake Gem Citrus Nursery v. Florida Department of Agriculture and Consumer Services, Case No. 08-CA-30736 (9th Cir. Orange County); John L. and Shelby Mahon d/b/a John’s Citrus Trees v. Florida Department of Agriculture and Consumer Services, Case No. 11-CA-3036 (5th Cir. Lake County); Dooley Groves, Inc. v. Florida Department of Agriculture and Consumer Services, et. al, Case No. 09-CA-12839 (13th Cir. Hillsborough County).
Plaintiffs in these actions are homeowners certified as a class or entities seeking compensation for the removal of their canker-exposed citrus trees by the Florida Department of Agriculture and Consumer Services (DACS) after January 1, 2000.
Dellaselva, Case No. 03-CA-1947, concerns homeowners in Lee County. Judgments against DACS were paid by a July 2020 appropriation from the Florida Legislature.
Ayers, Case No. 05-CA-4120, concerns homeowners in Orange County. Plaintiffs were awarded judgments of $31,534,722 for compensation, and $614,112 for attorneys' fees and costs, plus interest. These judgments remain unpaid, while accruing post-judgment interest.
ln re Citrus Canker Litigation, Case No. 03-CA-8255, concerns homeowners in Miami-Dade County. The circuit court found no liability on behalf of DACS. The Third District Court of Appeal reversed the decision and ordered the case to go to a compensation trial. DACS moved in the appellate court for rehearing en banc or for certification of a question of great public importance to the Florida Supreme Court.
In Gary M. Mahon, Case No. 08-CA-30736, a nursery owner sued in inverse condemnation for the destruction of nursery citrus plants. The circuit court found no liability as to 400,000 plants and liability as to 152,871 plants. A compensation trial is not currently scheduled.
In John L. and Shelby Mahon, Case No. 11-CA-3036, nursery owners sued in inverse condemnation for the destruction of nursery citrus plants. The circuit court found no liability as to 7,200 plants and liability as to 7,700 plants. A compensation trial has not been scheduled.
In Dooley Grove, Inc., Case No. 09-CA-12839, a grove owner sued in inverse condemnation for the destruction of approximately 6,000 citrus trees. The circuit court found liability as to the trees. A compensation trial is not currently scheduled.
B. Hoffer, et al., v. Secretary, Florida Department of Corrections, Case No. 19-11921 (U.S. Court of Appeals, 11th Cir.); Hoffer, et al., v. Secretary, Department of Corrections, Case No. 4:17-cv-214-MW-CAS (U.S. District Court, Northern District of Florida)
Plaintiffs allege that the Florida Department of Corrections (DOC) failed to provide proper medical treatment to inmates with chronic Hepatitis C (HCV), thus violating the Eighth Amendment of the U.S. Constitution, Title II of the Americans with Disabilities Act, and the Rehabilitation Act. In November 2017, the U.S. District Court certified the class and in December 2017 issued a preliminary injunction ordering DOC to provide certain treatment. In April 2019, the District Court issued a final order and permanent injunction requiring DOC to treat all inmates with Hepatitis C and, among other requirements, to improve its identification of people with the disease. In August 2020, the Eleventh Circuit Court of Appeals reversed the District Court’s order and vacated the permanent injunction to the extent they mandated treatment of inmates in the early stages of HCV. The Eleventh Circuit also vacated the remainder of the order and injunction and remanded the case for further proceedings. The case is currently pending in the District Court. The claim potentially represents future costs exceeding $25 million for testing, treatment, and staffing.
C. Geffin, et al., v. DeSantis, et al., Case No. SC20-27 (Fla. Supreme Court); DeSantis, et al., v. Geffin, et al., Case No. 1D19-928 (Fla. 1st DCA); Geffin, et al., v. DeSantis, et al., No. 2017-CA-1364 (2nd Cir. Leon County) and Villacorta, et al., v. DeSantis, et al., No. 2017-CA-1526 (2nd Cir. Leon County). These two cases have been consolidated under Case No. 2017-CA-1364.
2020 STATE OF FLORIDA CAFR
179

Plaintiffs alleged that the State of Florida Governor, Board of Governors, Board of Education, Department of Education, and Commissioner of Education were liable for failure to match private donations to public colleges, universities, and their students pursuant to four statutory programs. Plaintiffs alleged breach and impairment of contract and sought declaratory relief and damages of over $1 billion. The First District Court of Appeal reversed the trial court’s denial of Defendants’ motions to dismiss on sovereign immunity grounds and the Florida Supreme Court denied review. Plaintiffs voluntarily dismissed the case on October 21, 2020.
D. C&S Wholesale Grocers, Inc. v. Florida Department of Business and Professional Regulation, Division of Alcoholic Beverages and Tobacco, Case No. 2020-CA-565 (2nd Cir., Leon County)
C&S Wholesale Grocers, Inc., a wholesale dealer of cigarette and tobacco products, challenges the Department of Business and Professional Regulation’s denial of a refund request for certain excise taxes and surcharges the Plaintiff paid on cigarettes for the period November 2016 through November 2019. Plaintiff alleges that these excise taxes and surcharges violate the Commerce Clause and the Equal Protection Clause of the U.S. Constitution by taxing different kinds of tobacco products disparately, without taxing or levying surcharges on cigars. Plaintiff seeks declaratory and monetary relief, including a refund totaling $34,482,204.Discovery is ongoing in advance of a trial on the merits of the claim.
E. Florida Education Association, et al., v. Department of Education, et al., Case No. 4-17-cv-414-RH/CAS (U.S. District Court, Northern District of Florida)
Plaintiffs, including the Florida Education Association and seven individual teachers, sought to maintain a class action against the Department of Education and certain school districts. Plaintiffs alleged violations of Title VII of the Civil Rights Act and the Florida Civil Rights Act based on claims of racial and age discrimination related to the application of the Best and Brightest Teacher Scholarship Program. The parties reached a settlement for which the 2019 Florida Legislature appropriated $15.5 million. The Court approved the settlement agreement, settlement funds have been paid out, and this case has been closed.
F. Christopher Alianiello, et. al, v. State of Florida, Department of Education, et. al, Case No. 2019-CA-1674 (2nd Cir. Leon County)
Plaintiffs, including current and former individual teachers, seek to maintain a class action suit against the Department of Education (DOE) and certain school districts. Plaintiffs allege DOE improperly authorized districts to withhold payroll taxes from awards under the Best and Brightest Teacher Scholarship Program. Plaintiffs raise several contract and tort claims, request declaratory relief, and seek damages of the difference between what they received and the full statutory scholarship amount. In April 2020, the court granted in part DOE’s motion to dismiss, dismissing without prejudice the federal taxation claims on federal preemption grounds, and reserved ruling on the remaining issues. The case is currently stayed, pending Plaintiffs’ resolution of issues with the Internal Revenue Service related to the federal tax claims. Damages potentially amount to $35 million.
G. UMB Bank, National Association, v. Florida Department of Transportation, Case No. 2018-CA-2677 (2d Cir., Leon County); Case No. 1D20-3665 (Fla. 1st DCA)
Plaintiff, as successor trustee of the bonds sold to fund construction of the Garcon Point Bridge, filed suit against the Florida Department of Transportation (DOT), which insures, operates, and maintains the bridge pursuant to a Lease Purchase Agreement with the Santa Rosa Bay Bridge Authority. Plaintiff alleges that a toll increase is necessary to facilitate debt service and seeks damages of $75 million for failing to increase tolls when initially requested by Plaintiff. In December 2019, the trial court granted Plaintiff’s motion for summary judgment as to DOT’s counterclaim and ordered DOT to implement the toll recommendations of its independent traffic consultant. DOT raised tolls in March 2020. In November 2020, the trial court entered a final judgment in favor of DOT on the damages claim. This aspect of the judgment is pending before the First District Court of Appeal. Plaintiff’s amended claim seeking a declaratory judgment related to the prolonged suspension of tolls remains pending in circuit court.
2020 STATE OF FLORIDA CAFR
180

NOTE 17 - DEFICIT FUND BALANCE AND NET POSITION
A. Governmental Funds
The Public Education Fund has a deficit unassigned fund balance of approximately $858.6 million. The deficit is primarily the result of establishing an advance (long-term liability) on potential future claims by the Department of Financial Services' Unclaimed Property Trust Fund. The Department of Financial Services pays claims as they are due from current remittances. If sufficient funds are not available to pay claims, requests are made by the Department of Financial Services to the Department of Education to return the amount of funds necessary to pay claims or funds are borrowed from the Department of Financial Services' Trust Funds Control Fund and repaid prior to year-end.
B. Proprietary Funds
The Lottery has a deficit unrestricted net position of approximately $57.9 million. This deficit is the result of certain liabilities being recorded for reporting purposes only and being excluded from the calculation of transfers to the Educational Enhancement Trust Fund. This deficit does not affect the Lottery's ability to pay prizes or provide services.
The Internal Service Fund, Data Centers, has a deficit net position of approximately $14.7 million. This deficit is primarily due to long-term obligations, consisting mainly of a compensated absences liability and an accrual of pension and other post-employment benefit (OPEB) liabilities. The compensated absences liability will be liquidated on a pay-as-you-go basis. The pension and OPEB liabilities do not require cash flows and have no effect on the ability to provide services.
The Internal Service Fund, Other, has a deficit net position of approximately $113.8 million. This deficit is primarily due to long-term obligations, consisting mainly of a compensated absences liability and an accrual of pension and OPEB liabilities. The compensated absences liability will be liquidated on a pay-as-you-go basis. The pension and OPEB liabilities do not require cash flows and have no effect on the ability to provide services.
C. Component Units
The Component Units, Florida Colleges and Other State Universities, have deficit unrestricted net positions of approximately $486.0 million and $911.9 million, respectively. Those deficits are primarily due to long-term obligations, consisting mainly of a compensated absences liability and an accrual of pension and OPEB liabilities. The compensated absences liability will be liquidated on a pay-as-you-go basis. The pension and OPEB liabilities do not require cash flows and have no effect on the ability to provide services.
2020 STATE OF FLORIDA CAFR
181

NOTE 18 - SUBSEQUENT EVENTS
A. Bonds
The following bonds for governmental activities and business-type activities of the primary government were issued or sold subsequent to June 30, 2020:
Agency/Bond Series Amount Matures Interest Rate
Governmental Activities:
Board of Governors, Florida International University 2020A $ 71,800,000 07/01/2023-07/01/2050 3.000% - 5.000%
Dormitory Revenue Bonds
Full Faith and Credit, State Board of Education, 2020 Series C $ 111,545,000 06/01/2021-06/01/2023 5.000% - 5.000%
Public Education Capital Outlay Refunding Bonds
Full Faith and Credit, State Board of Education, 2020 Series D $ 397,440,000 06/01/2021-06/01/2025 0.150% - 0.550%
Public Education Capital Outlay Refunding Bonds (Taxable)
Full Faith and Credit, Department of Transportation, 2020A $ 187,550,000 07/01/2021-07/01/2050 2.000% - 5.000%
Right-of-Way Acquisition and Bridge Construction Bonds
Board of Governors, University of Florida 2020A $ 19,025,000 01/01/2021-07/01/2030 1.540% - 1.540%Clinical Translational Research Building Revenue Refunding Bonds (Taxable)
Department of Children and Families, 2021A $ 12,945,000 10/01/2021-10/01/2025 5.000% - 5.000%
Refunding Certificates of Participation
Department of Children and Families, 2021B $ 28,520,000 10/01/2021-10/01/2029 5.000% - 5.000%
Refunding Certificates of Participation
Department of Transportation, 2020 $ 155,600,000 07/01/2021-07/01/2035 3.000%-5.000%Financing Corporation Revenue Bonds
Business-type Activities:
State Board of Administration Finance Corporation Revenue Bonds 2020A $ 3,500,000,000 07/01/2025-07/01/2030 1.258% - 2.154%
Department of Transportation, Turnpike Revenue Bonds 2020B $ 194,350,000 07/01/2021-07/01/2050 2.000% - 5.000%
B. Department of Economic Opportunity Lost Wages Assistance Program
In July 2020, President Donald Trump issued an executive order providing Lost Wages Assistance to unemployed Floridians. This program resulted in the Florida Department of Economic Opportunity receiving a grant of $1.2 billion.
2020 STATE OF FLORIDA CAFR
182

OTHER REQUIREDSUPPLEMENTARY
INFORMATION

BUDGETARY COMPARISON SCHEDULESGENERAL AND MAJOR SPECIAL REVENUE FUNDSFOR THE FISCAL YEAR ENDED JUNE 30, 2020 (in thousands)
General Fund
OriginalBudget
FinalBudget Actual
Variance with
Final BudgetPositive (Negative)
Fund Balances, July 1, 2019 $ 5,720,478 $ 5,720,478 $ 5,720,478 $ — Reversions 132,090 132,090 132,090 — Fund Balances, July 1, 2019, restated 5,852,568 5,852,568 5,852,568 — REVENUES
Fees and charges 1,300,381 1,336,981 1,125,692 (211,289) Licenses 954,868 552,468 249,871 (302,597) Taxes 37,588,100 38,129,900 36,844,841 (1,285,059) Miscellaneous 66 66 31,213 31,147 Interest 237,887 237,887 387,691 149,804 Grants 19,535 19,535 5,875,864 5,856,329 Refunds 11,343 11,343 338,161 326,818 Transfers and distributions 3,392,406 3,184,406 3,472,064 287,658 Other 340,322 345,922 428,495 82,573
Total Revenues 43,844,908 43,818,508 48,753,892 4,935,384 Total Available Resources 49,697,476 49,671,076 54,606,460 4,935,384 EXPENDITURES
Operating expenditures: Salaries and benefits 3,956,952 4,102,743 4,044,214 58,529 Other personal services 61,723 72,078 67,601 4,477 Expenses 366,392 406,275 391,829 14,446 Grants and aids 16,143,854 16,219,183 16,166,578 52,605 Operating capital outlay 14,046 15,581 13,352 2,229 Food products 67,483 68,265 67,954 311 Fixed capital outlay 191,516 191,516 191,516 — Lump sum 624,976 11,698 11,698 — Special categories 12,494,497 13,082,629 12,936,083 146,546 Financial assistance payments 360,950 363,386 361,841 1,545 Continuing Appropriations — 768,777 768,777 — Grants/aids to local governments 230,489 230,489 230,489 — Data processing services 57,995 62,358 54,448 7,910 Pensions and benefits 2,472 2,472 1,161 1,311 Claim bills and relief acts — 4,150 4,150 —
Total Operating Expenditures 34,573,345 35,601,600 35,311,691 289,909 Nonoperating expenditures: Transfers 5,899,205 5,899,205 5,899,205 — Refunds 947,098 947,098 947,098 — Other 2,662,996 2,662,996 2,662,996 —
Total Nonoperating Expenditures 9,509,299 9,509,299 9,509,299 — Total Expenditures 44,082,644 45,110,899 44,820,990 289,909 Fund Balances, June 30, 2020 $ 5,614,832 $ 4,560,177 $ 9,785,470 $ 5,225,293
The notes to required supplementary information are an integral part of this schedule.
2020 STATE OF FLORIDA CAFR
184

BUDGETARY COMPARISON SCHEDULESGENERAL AND MAJOR SPECIAL REVENUE FUNDSFOR THE FISCAL YEAR ENDED JUNE 30, 2020 (in thousands)
Natural Resources, Environment, and Growth Management
OriginalBudget
FinalBudget Actual
Variance withFinal Budget
Positive (Negative)Fund Balances, July 1, 2019 $ 2,183,287 $ 2,183,287 $ 2,183,287 $ — Reversions 4,355 4,355 4,355 — Fund Balances, July 1, 2019, restated 2,187,642 2,187,642 2,187,642 — REVENUES
Fees and charges 134,485 189,509 148,729 (40,780) Licenses 43,077 47,385 51,798 4,413 Taxes 5,343 294,000 298,931 4,931 Miscellaneous 230 600 549 (51) Interest 33,225 71,012 45,145 (25,867) Grants 258,771 245,677 246,730 1,053 Refunds 2,256 9,990 1,701 (8,289) Bond proceeds 183 — — — Transfers and distributions 1,702,686 1,627,819 1,736,835 109,016 Other 146,047 25,250 180,978 155,728
Total Revenues 2,326,303 2,511,242 2,711,396 200,154 Total Available Resources 4,513,945 4,698,884 4,899,038 200,154 EXPENDITURES
Operating expenditures: Salaries and benefits 350,350 359,526 345,469 14,057 Other personal services 26,096 26,244 23,308 2,936 Expenses 59,047 59,008 54,820 4,188 Grants and aids 14,710 14,710 14,710 — Operating capital outlay 2,104 1,954 1,542 412 Fixed capital outlay 470,648 470,648 470,648 — Lump sum 500 — — — Special categories 333,791 346,282 310,369 35,913 Grants/aids to local governments 613,768 613,768 613,768 — Data processing services 892 734 734 —
Total Operating Expenditures 1,871,906 1,892,874 1,835,368 57,506 Nonoperating expenditures:
Transfers 450,377 450,377 450,377 — Refunds 31,845 31,845 31,845 — Other 338,908 338,908 338,908 —
Total Nonoperating Expenditures 821,130 821,130 821,130 — Total Expenditures 2,693,036 2,714,004 2,656,498 57,506 Fund Balances, June 30, 2020 $ 1,820,909 $ 1,984,880 $ 2,242,540 $ 257,660
The notes to required supplementary information are an integral part of this schedule.
2020 STATE OF FLORIDA CAFR
185

BUDGETARY COMPARISON SCHEDULESGENERAL AND MAJOR SPECIAL REVENUE FUNDSFOR THE FISCAL YEAR ENDED JUNE 30, 2020 (in thousands)
Public EducationVariance withFinal Budget
Positive (Negative)OriginalBudget
FinalBudget Actual
Fund Balances, July 1, 2019 $ 862,951 $ 862,951 $ 862,951 $ — Reversions 45,471 45,471 45,471 —
Fund Balances, July 1, 2019, restated 908,422 908,422 908,422 — REVENUES
Fees and charges 71,223 61,408 62,296 888 Licenses 954 990 990 — Taxes 806,051 583,193 638,213 55,020 Miscellaneous 606 5 5 — Interest 34,760 43,740 44,167 427 Grants 2,433,973 2,460,591 2,438,366 (22,225) Refunds 2,621 16,891 17,250 359 Bond proceeds — — — — Transfers and distributions 2,943,002 3,066,299 3,066,299 — Other 142,644 138,022 152,628 14,606 Total Revenues 6,435,834 6,371,139 6,420,214 49,075 Total Available Resources 7,344,256 7,279,561 7,328,636 49,075
EXPENDITURES Operating expenditures: Salaries and benefits 37,201 36,877 31,014 5,863 Other personal services 854 855 381 474 Expenses 7,058 6,998 3,542 3,456 Grants and aids 3,292,153 3,307,808 3,292,153 15,655 Operating capital outlay 489 489 23 466 Fixed capital outlay 1,616,991 1,616,991 1,616,991 — Special categories 1,309,909 1,284,558 1,284,558 — Financial assistance payments 64,853 64,853 64,821 32 Payments to U.S. Treasury 970 4,422 4,422 — Data processing services 9,288 9,942 9,255 687
Total Operating Expenditures 6,339,766 6,333,793 6,307,160 26,633
Nonoperating expenditures: Transfers 241,433 241,433 241,433 — Refunds 800 800 800 — Other 3,300 3,300 3,300 —
Total Nonoperating Expenditures 245,533 245,533 245,533 — Total Expenditures 6,585,299 6,579,326 6,552,693 26,633 Fund Balances, June 30, 2020 $ 758,957 $ 700,235 $ 775,943 $ 75,708
The notes to required supplementary information are an integral part of this schedule.
2020 STATE OF FLORIDA CAFR
186

BUDGETARY COMPARISON SCHEDULESGENERAL AND MAJOR SPECIAL REVENUE FUNDSFOR THE FISCAL YEAR ENDED JUNE 30, 2020 (in thousands)
Health and Family Services
OriginalBudget
FinalBudget Actual
Variance with Final Budget Positive
(Negative)Fund Balances, July 1, 2019 $ 1,391,201 $ 1,391,201 $ 1,391,201 $ — Reversions — — — — Fund Balances, July 1, 2019, restated 1,391,201 1,391,201 1,391,201 — REVENUES
Fees and charges 1,857,987 1,774,738 1,410,882 (363,856) Licenses 22,171 22,187 22,093 (94) Taxes 634,448 634,448 721,797 87,349 Interest 1,886 3,101 4,339 1,238 Grants 20,471,936 20,847,146 20,736,124 (111,022) Refunds 2,165,010 2,243,640 2,414,062 170,422 Bond proceeds — — — — Transfers and distributions 3,013,347 2,465,707 2,915,316 449,609 Other 37,281 37,763 44,560 6,797
Total Revenues 28,204,066 28,028,730 28,269,173 240,443 Total Available Resources 29,595,267 29,419,931 29,660,374 240,443
EXPENDITURES Operating expenditures: Salaries and benefits 1,309,391 1,319,635 1,220,531 99,104 Other personal services 121,454 122,800 104,486 18,314 Expenses 287,851 287,579 235,618 51,961 Grants and aids 120,420 120,420 112,100 8,320 Operating capital outlay 16,482 17,225 10,726 6,499 Food products 1,110 1,110 1,064 46 Fixed capital outlay 15,379 15,379 15,379 — Lump sum 5,000 — — — Special categories 25,123,198 25,123,198 25,123,198 — Financial assistance payments 30,390 30,390 23,403 6,987 Grants/aids to local governments 1,516 1,516 1,516 — Data processing services 22,163 21,370 21,370 — Claim bills and relief acts — — — —
Total Operating Expenditures 27,054,354 27,060,622 26,869,391 191,231 Nonoperating expenditures: Continuing Appropriations 37,619 37,619 37,619 — Transfers 1,680,427 1,680,427 1,680,427 — Refunds 61,585 61,585 61,585 — Other 330,409 330,409 330,409 —
Total Nonoperating Expenditures 2,110,040 2,110,040 2,110,040 — Total Expenditures 29,164,394 29,170,662 28,979,431 191,231 Fund Balances, June 30, 2020 $ 430,873 $ 249,269 $ 680,943 $ 431,674
The notes to required supplementary information are an integral part of this schedule.
2020 STATE OF FLORIDA CAFR
187

BUDGETARY COMPARISON SCHEDULESGENERAL AND MAJOR SPECIAL REVENUE FUNDSFOR THE FISCAL YEAR ENDED JUNE 30, 2020 (in thousands)
Transportation
OriginalBudget
FinalBudget Actual
Variance with Final Budget Positive
(Negative)Fund Balances, July 1, 2019 $ 286,617 $ 286,617 $ 286,617 $ — Reversions 2,771 2,771 2,771 — Fund Balances, July 1, 2019, restated 289,388 289,388 289,388 — REVENUES
Fees and charges 162,139 170,000 162,139 (7,861) Taxes 2,850,605 2,773,500 2,850,603 77,103 Miscellaneous 808,315 — — — Interest 1,572 1,572 3,316 1,744 Grants — — — — Refunds 16,346 16,347 16,347 — Bond proceeds 198,000 198,000 198,000 — Transfers and distributions 432,791 416,444 383,283 (33,161) Other 19,830 20,394 13,264 (7,130)
Total Revenues 4,489,598 3,596,257 3,626,952 30,695 Total Available Resources 4,778,986 3,885,645 3,916,340 30,695
EXPENDITURES Operating expenditures: Salaries and benefits 4,292 4,251 3,974 277 Other personal services 18 71 14 57 Expenses 2,771 2,791 1,881 910 Operating capital outlay 5 5 — 5 Fixed capital outlay 255,348 255,348 255,348 — Special categories 57,764 67,757 65,177 2,580
Total Operating Expenditures 320,198 330,223 326,394 3,829 Nonoperating expenditures: Transfers 216,319 216,319 216,319 — Refunds 77,947 77,947 77,947 — Other 3,012,665 3,012,665 3,012,665 —
Total Nonoperating Expenditures 3,306,931 3,306,931 3,306,931 — Total Expenditures 3,627,129 3,637,154 3,633,325 3,829 Fund Balances, June 30, 2020 $ 1,151,857 $ 248,491 $ 283,015 $ 34,524
The notes to required supplementary information are an integral part of this schedule.
2020 STATE OF FLORIDA CAFR
188

BUDGET TO GAAP RECONCILIATIONGENERAL AND MAJOR SPECIAL REVENUE FUNDSFOR THE FISCAL YEAR ENDED JUNE 30, 2020 (in thousands)
General Fund
Natural Resources,
Environment, and Growth Management
Public Education
Health and Family
Services TransportationBudgetary basis fund balances $ 9,785,470 2,242,540 $ 775,943 $ 680,943 $ 283,015 Items not included in budgetary basis fund balances:Security lending investments within the State Treasury 1,252,482 79,584 45,540 3,734 108,711 Fair value adjustments to investments within the State Treasury 461,360 36,663 20,979 1,720 50,081 Special investments within the State Treasury 20,718 — — 23,641 — Non-State Treasury cash and investments 1,127,392 10,119 — 72,109 1,383,884 Adjustment for State Transportation Trust Fund elimination — — — — 343,075 Adjusted budgetary basis fund balances 12,647,422 2,368,906 842,462 782,147 2,168,766
Adjustments (basis differences):Net receivables/(payables) not carried forward (3,604,446) 1,865,842 (1,090,644) 1,785,391 (181,767) Net deferred outflows/(inflows) of resources (163,250) (2,334) — (932,203) (353,160) Inventories, prepaid items and deferred charges 9,551 748 — 27,068 7,785 Encumbrances 353,753 13,299 1,010,006 163,202 56,742 GAAP basis fund balances $ 9,243,030 $ 4,246,461 $ 761,824 $ 1,825,605 $ 1,698,366
The notes to required supplementary information are an integral part of this schedule.
2020 STATE OF FLORIDA CAFR
189

OTHER REQUIRED SUPPLEMENTARY INFORMATION
BUDGETARY REPORTING
Budget Process
Chapter 216, Florida Statutes (F.S.), promulgates the process used to develop the budget for the State of Florida. Each year, the head of each state agency and the Chief Justice of the Supreme Court for the Judicial Branch submit a final annual legislative budget request to the Governor and Legislature by October 15 as required in Section 216.023(1), F.S. Then, at least 30 days before the scheduled annual legislative session in each year, the Governor, as Chief Budget Officer, submits his recommended budget to each legislator.
The Governor also provides estimates of revenues sufficient to fund the recommended appropriations. Revenue estimates for the General Fund and selected trust funds are made by the Revenue Estimating Conference. This group includes members of the Executive and Legislative branches with forecasting experience who develop official information regarding anticipated state and local government revenues as needed for the state budgeting process. Revenue estimates for trust funds not projected by the Revenue Estimating Conference (consisting mainly of special revenue funds) are provided by state agencies. These estimates may be revised during the course of the Legislature’s consideration and adoption of a final budget. These estimates, together with known available cash balances, are further considered by the Governor and the Chief Justice of the Florida Supreme Court during the preparation of annual release (spending) plans. Further adjustments to the original budget’s trust fund revenue estimates may be made to conform agency revenue estimates to actual and projected revenue streams.
The Governor’s recommended budget is considered and amended by the Legislature and a final appropriations bill is then approved by the Legislature (subject to the line-item veto power of the Governor and override authority of the Legislature); this bill then becomes the General Appropriations Act. The Governor and the Chief Justice of the Supreme Court may, under certain conditions and subject to the review and objection procedures set forth in Section 216.177, F.S., establish appropriations and corresponding releases for amounts not appropriated by the Legislature to agencies and the Judicial Branch, respectively. This includes appropriations for non-operating disbursements, such as the purchase of investments and the transfer of money between state funds.
If circumstances warrant, the head of a department or the Chief Justice of the Supreme Court may transfer appropriations (other than fixed capital outlay appropriations) but only to the extent of 5 percent of the original appropriation or $250,000, whichever is greater, or within certain programs and between identical funding sources and specific appropriation categories. Transfers of general revenue appropriations in excess of 5 percent or $250,000, whichever is greater, or for fixed capital outlay, or for transfers of general revenue appropriations not allowed within the departments’ program flexibility may be approved by the Legislative Budget Commission. The Governor and the Chief Justice of the Supreme Court may approve changes of expenditure authority within any trust fund for agencies and the Judicial Branch, respectively, if the changes are less than $1 million. The Legislative Budget Commission may approve trust fund changes in excess of $1 million. At the end of the fiscal year, any balance of an operating appropriation which has not been disbursed but is expended (recorded as a payable) or contracted to be expended (recorded as a reserve for encumbrances in governmental fund types), may be carried forward into the next fiscal year. If these appropriations, however, have not been disbursed by September 30 they will revert pursuant to Section 216.301(1), F.S.
The Chief Financial Officer approves disbursements in accordance with legislative authorizations. The budget is controlled at the account code level, which is defined as an appropriation category (e.g., salaries and benefits), and funded within a budget entity. The Governor and the Chief Financial Officer are responsible for detecting conditions which could lead to a deficit in any agency’s funds and reporting that fact to the Legislative Budget Commission and the Chief Justice of the Supreme Court. The Constitution of the State, Article VII, Section 1(d), states, “Provision shall be made by law for raising sufficient revenue to defray the expenses of the state for each fiscal period.”
2020 STATE OF FLORIDA CAFR
190

Budgetary Basis of Accounting
The budgetary basis of accounting required by state law differs materially from the basis used to report revenues and expenditures in accordance with generally accepted accounting principles (GAAP). Appropriations are made from funds that are prescribed by law. These legal basis fund types (known as state funds) are the General Revenue Fund, numerous trust funds, and the Budget Stabilization Fund. Certain moneys maintained outside of the State Treasury, known as local funds, are available to agencies for their operations. Because the funds are located in banks outside of the State Treasury, budgetary authority and the disbursement of these funds are not controlled by the Chief Financial Officer. For example, the State Board of Administration operates from such funds.
The state presents budgetary comparison schedules for the General Fund and major special revenue funds as part of the other required supplementary information. In addition, budgetary comparison schedules for non-major special revenue funds which have legally adopted annual budgets are presented with other combining and individual fund statements and schedules.
Budgetary basis revenues are essentially reported on a cash basis and include amounts classified by GAAP as other financing sources. Budgetary basis expenditures include disbursements, except those for prior year carry/certified forwards, plus current year payables and encumbrances which are carried/certified forward into the next fiscal year. They also include amounts classified by GAAP as other financing uses. State law requires prior year payables and encumbrances not carried/certified forward to be paid from the current year budget. The Lump Sum expenditure category presented in the budgetary comparison schedules is used as a budgetary tool to track moneys appropriated to a particular fund until subsequent allocations are made to other expenditure categories.
The presentation of budgetary comparison information for the major governmental fund for transportation excludes the State Transportation Trust Fund within the Department of Transportation because it accounts for projects of a multi-year nature, and comparison of actual annual expenditures to a multi-year appropriated amount is not meaningful. Appropriations are made in total the first year of a project even though they are released and expended over the period of construction for a project. For the fiscal year ended June 30, 2020, State Transportation Trust fund revenues and expenditures totaled $2.42 billion and $7.11 billion, respectively, with $4.60 billion of net other financing sources.
Budget to GAAP Reconciliation
The budgetary comparison schedules for the General Fund and the major special revenue funds present comparisons of the original budget and final budget with actual revenues and expenditures on a budgetary basis. A budget to GAAP reconciliation is presented following the budgetary comparison schedules because accounting principles for budgetary basis differ significantly from those used to present financial statements in conformity with GAAP.
2020 STATE OF FLORIDA CAFR
191

OTHER REQUIRED SUPPLEMENTARY INFORMATION
SCHEDULE OF PROPORTIONATE SHARE OF THE NET PENSION LIABILITYFLORIDA RETIREMENT SYSTEM
LAST 10 FISCAL YEARS*(in thousands)
2014 2015 2016 2017 2018
Proportion of the net pension liability 17.802202632 % 17.961696240 % 18.150587866 % 17.591496280 % 17.733845390 %Proportionate share of the net pension liability $ 1,086,196 $ 2,319,994 $ 4,583,038 $ 5,203,447 $ 5,341,526 Covered payroll $ 4,538,946 $ 4,591,628 $ 4,596,099 $ 4,621,442 $ 4,791,286 Proportionate share of the net pension liability as percentage of covered payroll 23.93 % 50.53 % 99.72 % 112.59 % 111.48 %Plan fiduciary net position as a percentage of the total pension liability 96.09 % 92.00 % 84.88 % 83.89 % 84.26 %
Notes to Schedule:
Changes in actuarial assumptions: The long-term expected rate of return was decreased from 7.00% to 6.90%, and the mortality assumption was changed from the Generational RP-2000 with Projection Scale BB tables to the PUB-2010 base table, projected generationally with Scale MP-2018.
* Fiscal year 2015 was the first year of GASB Statement No. 68 implementation; therefore, information was not available for a full 10-year presentation.
SCHEDULE OF STATE CONTRIBUTIONS TO PENSION PLANFLORIDA RETIREMENT SYSTEM
LAST 10 FISCAL YEARS*(in thousands)
2015 2016 2017 2018 2019Statutorily required contributions $ 437,921 $ 442,631 $ 457,950 $ 505,400 $ 543,395 Contributions recognized by the plan 437,921 442,631 457,950 505,400 543,395 Contribution deficiency (excess) $ — $ — $ — $ — $ — Covered payroll $ 4,591,628 $ 4,596,099 $ 4,621,442 $ 4,791,286 $ 4,829,858 Contributions recognized by the plan as a percentage of covered payroll 9.54 % 9.63 % 9.91 % 10.55 % 11.25 %
* Fiscal year 2015 was the first year of GASB Statement No. 68 implementation; therefore, information was not available for a full 10-year presentation.
2020 STATE OF FLORIDA CAFR
192

2019
17.524776601 %
$ 6,035,289 $ 4,829,858
124.96 %
82.61 %
2020$ 564,233 564,233 $ — $ 4,826,392
11.69 %
2020 STATE OF FLORIDA CAFR
193

OTHER REQUIRED SUPPLEMENTARY INFORMATION
SCHEDULE OF PROPORTIONATE SHARE OF THE NET PENSION LIABILITYRETIREE HEALTH INSURANCE SUBSIDY PROGRAM
LAST 10 FISCAL YEARS*(in thousands)
2014 2015 2016 2017 2018
Proportion of the net pension liability 15.286183318% 15.144426318 % 14.878355474 % 14.470956524 % 14.641028104 %Proportionate share of the net pension liability $ 1,429,295 $ 1,544,493 $ 1,734,011 $ 1,547,301 $ 1,549,623
Covered payroll $ 4,534,435 $ 4,588,003 $ 4,593,175 $ 4,619,123 $ 4,789,207
Proportionate share of the net pension liability as percentage of covered payroll 31.52 % 33.66 % 37.75 % 33.50 % 32.36 %Plan fiduciary net position as a percentage of the total pension liability 0.99 % 0.50 % 0.97 % 1.64 % 2.15 %
Notes to Schedule:
Changes in actuarial assumptions: The municipal bond rate used to determine total pension liability was decreased from 3.87% to 3.50%.
* Fiscal year 2015 was the first year of GASB Statement No. 68 implementation; therefore, information was not available for a full 10-year presentation.
SCHEDULE OF STATE CONTRIBUTIONS TO PENSION PLANRETIREE HEALTH INSURANCE SUBSIDY PROGRAM
LAST 10 FISCAL YEARS*(in thousands)
2015 2016 2017 2018 2019Statutorily required contributions $ 57,891 $ 76,261 $ 76,584 $ 79,399 $ 80,051 Contributions recognized by the plan 57,891 76,261 76,584 79,399 80,051 Contribution deficiency (excess) — — $ — $ — $ — $ — Covered payroll $ 4,588,003 $ 4,593,175 $ 4,619,123 $ 4,789,207 $ 4,828,290 Contributions recognized by the plan as a percentage of covered payroll 1.26 % 1.66 % 1.66 % 1.66 % 1.66 %
* Fiscal year 2015 was the first year of GASB Statement No. 68 implementation; therefore, information was not available for a full 10-year presentation.
2020 STATE OF FLORIDA CAFR
194

2019
14.416053158 %
$ 1,613,012
$ 4,828,290
33.41 %
2.63 %
2020$ 79,916 79,916
0$ 4,826,392
1.66 %
2020 STATE OF FLORIDA CAFR
195

THIS PAGE INTENTIONALLY LEFT BLANK
196

OTHER REQUIRED SUPPLEMENTARY INFORMATION
SCHEDULE OF CHANGES IN NET PENSION LIABILITY AND RELATED RATIOSFLORIDA NATIONAL GUARD SUPPLEMENTAL RETIREMENT BENEFIT PLAN
LAST 10 FISCAL YEARS*(in thousands)
2014 2015 2016 2017 2018 2019 2020Total Pension liabilityService cost $ 5,979 $ 7,161 $ 9,044 $ 12,904 $ 9,925 $ 11,581 $ 13,967 Interest on total pension liability 18,852 19,164 19,259 19,100 21,080 28,506 28,874 Effect of plan changes — — — — — — — Effect of economic/demographic (gains) or losses — — 27,462 — 39,056 — 24,815 Effects of assumption changes or inputs 27,926 46,330 118,280 (95,586) 90,989 60,964 271,102 Benefit payments (14,366) (14,423) (14,413) (14,677) (14,897) (14,999) (15,121) Net changes in total pension liability 38,391 58,232 159,632 (78,259) 146,153 86,052 323,637 Total pension liability, beginning 408,292 446,683 504,915 664,547 586,288 732,441 818,493 Total pension liability, ending $ 446,683 $ 504,915 $ 664,547 $ 586,288 $ 732,441 $ 818,493 $ 1,142,130 Fiduciary Net Position Employer contributions $ 14,366 $ 14,495 $ 14,423 $ 14,720 $ 14,905 $ 15,044 $ 15,129 Member contributions — — — — — — — Investment income net of investment expenses — — — — — — — Benefit payments (14,366) (14,423) (14,413) (14,677) (14,897) (14,999) (15,121) Administrative expenses — (72) (10) (43) (8) (45) (8) Net change in fiduciary position — — — — — — — Fiduciary net position-beginning — — — — — Fiduciary net position-ending $ — $ — $ — $ — $ — $ — $ — Net pension liability-ending $ 446,683 $ 504,915 $ 664,547 $ 586,288 $ 732,441 $ 818,493 $ 1,142,130 Fiduciary net position as a % of the total pension liability 0.00 0.00 % 0.00 % 0.00 % 0.00 % 0.00 % 0.00 %Covered payroll $ 466,939 $ 476,278 $ 477,549 $ 487,100 $ 485,666 $ 495,379 $ 508,895 Net pension liability as a % of covered-payroll 95.66 % 106.01 % 139.16 % 120.36 % 150.81 % 165.23 % 224.43 %
Notes to Schedule:
Changes of assumptions or input: The municipal bond rate used to determine total pension liability decreased from 3.50% to 2.21%.
* Fiscal year 2015 was the first year of GASB Statement No. 68 implementation; therefore, information was not available for a full 10-year presentation.
SCHEDULE OF STATE CONTRIBUTIONS TO PENSION PLAN
FLORIDA NATIONAL GUARD SUPPLEMENTAL RETIREMENT BENEFIT PLANLAST 10 FISCAL YEARS*
(in thousands)2014 2015 2016 2017 2018 2019 2020
Statutorily required State contribution $ 14,366 $ 14,495 $ 14,423 $ 14,720 $ 14,905 $ 15,044 $ 15,129 Contributions recognized by the plan 14,366 14,495 14,423 14,720 14,905 15,044 15,129 Contribution deficiency (excess) $ — $ — $ — $ — $ — $ — $ — Covered payroll $ 466,939 $ 476,278 $ 477,549 $ 487,100 $ 485,666 $ 495,379 $ 508,895 Contributions as a percentage of covered-employee payroll 3.08 % 3.04 % 3.02 % 3.02 % 3.07 % 3.04 % 2.97 %
* Fiscal year 2015 was the first year of GASB Statement No. 68 implementation; therefore, information was not available for a full 10-year presentation.
2020 STATE OF FLORIDA CAFR
197

OTHER REQUIRED SUPPLEMENTARY INFORMATION
SCHEDULE OF CHANGES IN OTHER POSTEMPLOYMENT BENEFITS LIABILITY
LAST 10 FISCAL YEARS*
(in thousands)
2017 2018 2019Total OPEB LiabilityService cost $ 558,284 $ 450,512 $ 451,020 Interest 350,228 399,969 407,090 Changes of Benefit Terms — — — Difference between expected and actual experience — — (372,451) Changes of assumptions or other inputs (1,746,361) (931,395) 1,813,838 Benefit payments (162,902) (178,619) (192,800) Other changes — — — Net Changes in Total OPEB Liability (1,000,751) (259,533) 2,106,697
Total OPEB Liability - Beginning 11,811,836 10,811,085 10,551,552 Total OPEB Liability - Ending $ 10,811,085 $ 10,551,552 $ 12,658,249
Covered-employee payroll1 $ 7,312,101 $ 7,636,541 $ 7,644,299 Total OPEB liability as a percentage of covered-employee payroll 147.85 % 138.17 % 165.59 %
*The State of Florida implemented GASB Statement No. 75 in Fiscal Year 2018; therefore, 10-year presentation is not available.1 For fiscal year 2017 and 2018, an error noted in the selection criteria for covered-employee payroll data previously presented for compliance with GASB 75 was noted and corrected.
Note to Required Supplementary Information
The Division of State Group Insurance's Other Postemployment Benefits Plan (OPEB) does not have assets accumulated in a trust that meets the criteria in Paragraph 4 of GASB Statement No. 75 to pay related benefits.
Potential factors that may significantly decrease/increase State’s total OPEB liability reported as of June 30, 2019, include discount rate, inflation rate, salary increases, payroll growth, healthcare inflation, retiree contribution increase rate, medical aging factors, healthcare participation, healthcare cost trends, mortality rates, and other demographic assumptions.
The discount rate changed from 3.87% for the opening balance as of June 30, 2018, to the discount rate of 2.79% as of June 30, 2019. This change resulted in an increase in total OPEB liability.
2020 STATE OF FLORIDA CAFR
198

OTHER REQUIRED SUPPLEMENTARY INFORMATION
INFORMATION ABOUT INFRASTRUCTURE ASSETS REPORTED USING THE MODIFIED APPROACH
Pursuant to GASB Statement No. 34, Basic Financial Statements - and Management’s Discussion and Analysis - for State and Local Governments, the state has adopted an alternative process to record depreciation expense on selected infrastructure assets. Under this alternative method, referred to as the modified approach, the state expenses certain maintenance and preservation costs and does not report depreciation expense. Assets accounted for under the modified approach include approximately 12,128 centerline miles of roads and 7,081 bridges that the state is responsible for maintaining.
In order to utilize the modified approach, the state is required to:
• Maintain an asset management system that includes an up-to-date inventory of eligible infrastructure assets.• Perform condition assessments of eligible assets and summarize the results using a measurement scale.• Estimate each year the annual amount to maintain and preserve the assets at the condition level established and
disclosed by the state.• Document that the assets are being preserved approximately at, or above, the established condition level.
Condition and Maintenance Programs
Resurfacing Program: Road pavements require periodic resurfacing. The frequency of resurfacing depends on the volume of traffic, type of traffic, pavement material variability, and weather conditions. Resurfacing preserves the structural integrity of highway pavements and includes pavement resurfacing, pavement rehabilitation, and minor reconstruction.
The Florida Department of Transportation (FDOT) conducts an annual Pavement Condition Survey. Pavements are rated on a scale of 0 to 10 (with 10 being the best) in each of three criteria: ride smoothness, pavement cracking, and wheel path rutting. Ride smoothness is what the motorist experiences. It directly affects motor vehicle operation costs. Pavement cracking refers to the structural deterioration of the pavement, which leads to loss of smoothness and deterioration of the road base by water seepage if not corrected. Wheel path rutting refers to depressions in pavement caused by heavy use. Ride smoothness and wheel path rutting are measured mechanically using lasers. Pavement cracking is determined through visual observation by experienced survey crews.
The condition rating scales were set by a statewide committee of pavement engineers, so that a pavement segment receiving a rating of six or less in any of the three rating criteria is designated a deficient pavement segment. In low-speed areas, the ride rating must drop to five or less before a pavement segment is considered deficient due to ride.
The FDOT standard is to ensure that 80% of the pavement on the State Highway System remains non-deficient.
Bridge Repair/Replacement Program: The FDOT Bridge Repair Program places primary emphasis on periodic maintenance and specified rehabilitation work activities on State Highway System bridge structures. The FDOT Bridge Replacement Program’s primary focus is on the replacement of structurally deficient or weight restricted bridges on the State Highway System. In addition, the Bridge Replacement Program addresses bridges that require structural repair but which are more cost effective to replace.
The FDOT conducts bridge condition surveys using the National Bridge Inspection Standards to determine condition ratings. Each bridge is inspected at least once every two years. During the inspection process, the major components such as deck, superstructure, and substructure are assigned a condition rating. The condition rating ranges from 0 to 9. By FDOT policy, a rating of 8 to 9 is excellent. A rating of 6 to 7 is good. A rating of 5 indicates fair condition. A rating of 4 or less identifies bridges in poor condition requiring major repairs or replacement per FDOT policy. A rating of 2 indicates a critical bridge condition, and a rating of 1 indicates imminent bridge failure and is used for a bridge that is closed, but with corrective action may be put back into light service. A rating of 0 indicates that the bridge is out of service and beyond corrective action. Per FDOT policy, bridges rated fair or poor do not meet performance standards.
The FDOT standard is to ensure that 90% of all department maintained bridges do not need major repairs or replacement.
Routine Maintenance Program: The FDOT is responsible for managing and performing routine maintenance on the State Highway System to help preserve the condition of the system. Routine maintenance includes many activities, such as repairing highways, keeping up roadsides, responding to emergencies, maintaining signs, striping roadways, and keeping
2020 STATE OF FLORIDA CAFR
199

storm drains clear and structurally sound.
The quality and effectiveness of the routine maintenance program is monitored by periodic surveys, using the Maintenance Rating Program (MRP), which results in an annual assessment. The MRP has been used since 1985 to evaluate routine maintenance of the transportation system in five broad categories or elements. The five rating elements are roadway, roadside, vegetation/aesthetics, traffic services, and drainage. The MRP provides a maintenance rating of 0 to 100 for each category and overall.
The FDOT standard is to achieve and maintain an overall maintenance rating of 80.
Condition Rating for the State Highway System
Percentage of pavement meeting FDOT standards 2020 2019 201887% 87% 91 %
Percentage of bridges meeting FDOT standards 2020 2019 201895% 95% 95 %
Maintenance Rating
2020 2019 201883 83 85
Comparison of Needed-to-Actual Maintenance Preservation(in millions)
Resurfacing Program2020 2019 2018 2017 2016
Needed $ 535.0 $ 555.6 $ 590.4 $ 530.8 $ 619.5 Actual 451.5 479.8 522.6 541.5 610.1
Bridge Repair/Replacement Program2020 2019 2018 2017 2016
Needed $ 980.8 $ 114.3 $ 239.6 $ 642.5 $ 191.4 Actual 1,036.1 104.6 240.3 567.2 199.3
Routine Maintenance Program2020 2019 2018 2017 2016
Needed $ 694.6 $ 690.1 $ 655.0 $ 661.3 $ 627.4 Actual 805.5 817.7 756.1 741.7 723.3
The FDOT determines its program needs based on a five-year plan. The needed amounts provided above are for estimated expenses and commitments relating to projects within the plan at the time of the budget request. The nature of a long-term plan is that it is continually changing. Projects are added, deleted, adjusted, or postponed. The differences between the needed and actual amounts above reflect these changes.
2020 STATE OF FLORIDA CAFR
200

THIS PAGE INTENTIONALLY LEFT BLANK
201

FINANCIAL SECTION:
COMBINING AND INDIVIDUAL FUND STATEMENTS AND
SCHEDULES
NONMAJOR FUNDS

THIS PAGE INTENTIONALLY LEFT BLANK
203

NONMAJOR GOVERNMENTAL FUNDS
SPECIAL REVENUE FUNDSIndividual fund descriptions and financial statements begin on page 208.
CAPITAL PROJECTS FUNDSIndividual fund descriptions and financial statements begin on page 237.
DEBT SERVICE FUNDSIndividual fund descriptions and financial statements begin on page 241.
PERMANENT FUNDSFunds in this category include those administered by the Fish and Wildlife Conservation Commission, used to support fish and wildlife conservation programs of the State, in accordance with Section 379.207, Florida Statutes. The primary source of the principal of the funds includes proceeds of gifts, grants, contributions, and the sale of lifetime licenses. Also included in this category are various private scholarship funds administered by the Department of Education and used to pay scholarship awards as specified by the contributors. Only the interest income received and accrued from the investments of these funds can be used. No disbursement is made from the principal of the funds.
2020 STATE OF FLORIDA CAFR
204

THIS PAGE INTENTIONALLY LEFT BLANK
205

COMBINING BALANCE SHEETNONMAJOR GOVERNMENTAL FUNDSFOR THE FISCAL YEAR ENDED JUNE 30, 2020 (in thousands)
Special Revenue
FundsCapital
Projects Funds
Debt Service Funds
Permanent Funds
Totals 6/30/20
ASSETSCurrent assetsCash and cash equivalents $ 22,085 $ — $ 1,497 $ 843 $ 24,425 Pooled investments with State Treasury 1,892,088 94,835 — 38,065 2,024,988 Other investments 171,928 — 30,098 4,013 206,039 Receivables, net 655,780 166 23 1 655,970 Due from other funds 89,608 67,816 — — 157,424 Due from component units/primary 1 — — — 1 Inventories 2,432 — — — 2,432 Other 460 — — — 460
Total current assets 2,834,382 162,817 31,618 42,922 3,071,739 Noncurrent assetsLong-term investments 32,265 — 5,661 — 37,926 Other loans and notes receivable, net 782,288 — — — 782,288
Total noncurrent assets 814,553 — 5,661 — 820,214
Total assets 3,648,935 162,817 37,279 42,922 3,891,953 LIABILITIESCurrent liabilitiesAccounts payable and accrued liabilities 346,535 778 — — 347,313 Due to other funds 191,442 5,776 — 322 197,540 Due to component units/primary 2,209 — — — 2,209 Compensated absences 1,205 — — — 1,205 Claims payable 4,447 — — — 4,447 Deposits 151,732 — — — 151,732 Obligations under security lending agreements 63,098 5,192 — 2,097 70,387
Total current liabilities 760,668 11,746 — 2,419 774,833
Noncurrent liabilitiesAdvances from other funds 737 — — — 737 Deposits 11,368 — — — 11,368
Total noncurrent liabilities 12,105 — — — 12,105 Total liabilities 772,773 11,746 — 2,419 786,938
DEFERRED INFLOWS OF RESOURCESUnavailable revenue 301,079 — — — 301,079
Total deferred inflows of resources 301,079 — — — 301,079 FUND BALANCESNonspendable 2,884 — — 4,028 6,912 Restricted 1,357,883 80,566 37,279 26,785 1,502,513 Committed 1,214,316 70,505 — 9,690 1,294,511
Total fund balances 2,575,083 151,071 37,279 40,503 2,803,936 Total liabilities, deferred inflows and fund balances $ 3,648,935 $ 162,817 $ 37,279 $ 42,922 $ 3,891,953
2020 STATE OF FLORIDA CAFR
206

COMBINING STATEMENT OF REVENUES, EXPENDITURES, AND CHANGES IN FUND BALANCESNONMAJOR GOVERNMENTAL FUNDSFOR THE FISCAL YEAR ENDED JUNE 30, 2020 (in thousands)
Special Revenue
Funds
Capital Projects Funds
Debt Service Funds
Permanent Funds
Totals 6/30/20
REVENUESTaxes $ 220,924 $ — $ — $ — $ 220,924 Licenses and permits 1,679,507 — — 2,836 1,682,343 Fees and charges 699,292 — 7,758 — 707,050 Grants and donations 3,971,797 — — — 3,971,797 Investment earnings (losses) 79,587 4,619 9,070 1,856 95,132 Fines, forfeits, settlements and judgments 474,333 — — — 474,333 Other 74,590 — 594 — 75,184
Total revenues 7,200,030 4,619 17,422 4,692 7,226,763 EXPENDITURESCurrent:
General government 3,790,943 51,867 1,381 — 3,844,191 Education 207,722 2,089 — 377 210,188 Human services 428,858 1,095 — — 429,953 Criminal justice and corrections 518,804 73,432 — — 592,236 Natural resources and environment 1,239,802 — — 3 1,239,805 Transportation — 128 — — 128 Judicial branch 89,089 — — — 89,089
Capital outlay 85,811 63,842 — — 149,653 Debt service:
Principal retirement 349 — 1,086,735 — 1,087,084 Interest and fiscal charges 41 — 559,028 — 559,069
Total expenditures 6,361,419 192,453 1,647,144 380 8,201,396 Excess (deficiency) of revenues over expenditures 838,611 (187,834) (1,629,722) 4,312 (974,633)
OTHER FINANCING SOURCES (USES)Proceeds of bond issues — — 3,597 — 3,597 Proceeds of refunding bonds — — 1,381,184 — 1,381,184 Operating transfers in 1,623,381 173,089 1,622,573 — 3,419,043 Operating transfers out (2,405,790) (45,373) (42,776) (1,780) (2,495,719) Payments to refunded bond agent — — (1,381,184) — (1,381,184)
Total other financing sources (uses) (782,409) 127,716 1,583,394 (1,780) 926,921
Net change in fund balances 56,202 (60,118) (46,328) 2,532 (47,712) Fund balances - beginning 2,518,881 211,189 83,607 37,971 2,851,648 Fund balances - ending $ 2,575,083 $ 151,071 $ 37,279 $ 40,503 $ 2,803,936
2020 STATE OF FLORIDA CAFR
207

NONMAJOR SPECIAL REVENUE FUNDSEMPLOYMENT SERVICESThis fund includes internal reporting funds used for employee-service related programs of an administrative nature (non risk-related), such as workers’ compensation, employment security, and labor market statistics.
GOVERNMENT ADMINISTRATIONThis fund includes internal reporting special revenue funds primarily administered by the Department of State, Department of Management Services, and Department of Financial Services.
BUSINESS AND COMMUNITY DEVELOPMENTThis fund includes internal reporting special revenue funds primarily administered by the Executive Office of the Governor and the Department of Economic Opportunity.
REGULATION AND LICENSINGThis fund includes internal reporting special revenue funds primarily administered by the Department of Business and Professional Regulation, Department of Highway Safety and Motor Vehicles, and Department of Financial Services.
TOBACCO SETTLEMENTThis fund includes internal reporting special revenue funds established to account for the settlement of State of Florida, et al., v. American Tobacco Company, et al., Case No. 95-1466 AH, filed in the Fifteenth Judicial Circuit, in and for Palm Beach County Florida.
PUBLIC SAFETYThis fund includes internal reporting special revenue funds primarily administered by the Department of Law Enforcement, Department of Highway Safety and Motor Vehicles, Department of Legal Affairs, and Department of Military Affairs.
CORRECTIONSThis fund includes internal reporting special revenue funds administered by the Department of Corrections.
CONSUMER PROTECTION AND SAFETYThis fund includes internal reporting special revenue funds primarily administered by the Executive Office of the Governor, Department of Legal Affairs, Department of Revenue, and Department of Financial Services.
AGRICULTUREThis fund includes internal reporting special revenue funds administered by the Department of Agriculture and Consumer Services.
JUVENILE JUSTICEThis fund includes internal reporting special revenue funds administered by the Department of Juvenile Justice.
JUDICIAL SERVICESThis fund includes internal reporting special revenue funds primarily administered by the Justice Administrative Commission and the State Courts System.
MILITARY AND VETERANS’ AFFAIRSThis fund includes internal reporting special revenue funds administered by the Department of Military Affairs and Department of Veterans’ Affairs.
BLENDED COMPONENT UNITSFLORIDA CLERKS OF COURT OPERATIONS CORPORATIONPursuant to Section 28.35, Florida Statutes, this entity was created to recommend legislative changes in various court related fines, fees, service charges, and court costs, establish a process for reviewing and certification of proposed court-related budgets submitted by the clerks of court and establishing a system of uniform performance measures and standards for the clerks.
FLORIDA CITRUS COMMISSIONAs authorized in Section 601.04, Florida Statutes, this entity was established to primarily promote the general welfare of the Florida citrus industry.
STATE BOARD OF ADMINISTRATIONThis entity includes the following internal reporting special revenue funds administered by the State Board of Administration: Gas Tax Clearing Accounts and the Insurance Capital Build-up Program.
FLORIDA SCHOOL FOR THE DEAF AND THE BLINDAs authorized in Section 1002.36, Florida Statutes, this entity is a State-supported residential school for hearing-impaired and visually impaired students in preschool through 12th grade.
WIRELESS EMERGENCY TELEPHONE SYSTEMAs authorized in Section 365.172, Florida Statutes, this entity was established to promote a comprehensive statewide emergency telephone number system that will provide wireless telephone users with rapid direct access to public safety agencies.
CAREERSOURCE FLORIDA, INC.This not-for-profit entity was created pursuant to Section 445.004, Florida Statutes, as the principal workforce policy organization for the State and the regional workforce boards.
FLORIDA WATER POLLUTION CONTROL FINANCING CORPORATIONPursuant to Section 403.1837, Florida Statutes, this entity was created to finance the costs of water pollution control projects and activities described in Sections 403.1835 and 403.8532, Florida Statutes.
INLAND PROTECTION FINANCING CORPORATIONPursuant to Section 376.3075, Florida Statutes, this entity was created to finance the rehabilitation of petroleum contamination sites pursuant to Sections 376.30-376.317, Florida Statutes, and the payment, purchase and settlement of reimbursement obligations of the Department of Environmental Protection pursuant to Section 376.3071(12), Florida Statutes.
FLORIDA SURPLUS LINES SERVICE OFFICEPursuant to Section 626.921, Florida Statutes, this entity was created to establish a system that would permit better access by consumers to approved unauthorized insurers.
CORRECTIONS FOUNDATION, INC.This entity was organized to initiate developmental projects; raise funds; request and receive grants, gifts, and bequests; acquire, receive, hold, invest and administer securities, funds, or other property as authorized by Section 944.802, Florida Statutes.
SCRIPPS FLORIDA FUNDING CORPORATIONPursuant to Section 288.955, Florida Statutes, this entity was created to facilitate the establishment and operation of a biomedical research institution for the purposes of enhancing education and research and promoting economic development and diversity.
2020 STATE OF FLORIDA CAFR
208

THIS PAGE INTENTIONALLY LEFT BLANK
209

COMBINING BALANCE SHEETNONMAJOR SPECIAL REVENUE FUNDSFOR THE FISCAL YEAR ENDED JUNE 30, 2020 (in thousands)
Employment Services
Government Administration
Business and Community
Development Regulation and
LicensingASSETSCurrent assetsCash and cash equivalents $ 263 $ 1 $ 185 $ 42 Pooled investments with State Treasury 331,163 94,640 260,556 424,194 Other investments 6,683 — — — Receivables, net 89,426 178 133,345 50,174 Due from other funds 8,033 1,570 3,835 18,201 Due from component units/primary — 1 — — Inventories — — — 207 Other — — — 61
Total current assets 435,568 96,390 397,921 492,879 Noncurrent assetsLong-term investments — — 50 — Other loans and notes receivable, net 4,500 — 29 —
Total noncurrent assets 4,500 — 79 — Total assets 440,068 96,390 398,000 492,879
LIABILITIESCurrent liabilitiesAccounts payable and accrued liabilities 22,924 6,206 78,468 3,121 Due to other funds 6,993 314 33,295 135,556 Due to component units/primary 6 — — — Compensated absences 140 21 22 167 Claims payable 4,447 — — — Deposits 2,592 — 19,956 128,737 Obligations under security lending agreements 17,888 4,687 12,736 11,360
Total current liabilities 54,990 11,228 144,477 278,941 Noncurrent liabilitiesAdvances from other funds — 112 — — Deposits — — — —
Total noncurrent liabilities — 112 — — Total liabilities 54,990 11,340 144,477 278,941
DEFERRED INFLOWS OF RESOURCESUnavailable revenue — — 112,497 181
Total deferred inflows of resources — — 112,497 181 FUND BALANCESNonspendable — — — 268 Restricted 99,977 6,422 71,276 8,618 Committed 285,101 78,628 69,750 204,871
Total fund balances 385,078 85,050 141,026 213,757 Total liabilities, deferred inflows and fund balances $ 440,068 $ 96,390 $ 398,000 $ 492,879
2020 STATE OF FLORIDA CAFR
210

)
Tobacco Settlement Public Safety Corrections
Consumer Protectionand Safety Agriculture
JuvenileJustice
$ — $ 122 $ — $ 165 $ 241 $ 11 61,662 69,710 20,081 208,392 59,408 60,399 — — — — — — 187,867 4,819 545 24,137 37,546 3,054 — 5,818 3,353 1,480 6,438 1,308 — — — — — — — — — — 1,720 — — — — — — — 249,529 80,469 23,979 234,174 105,353 64,772
— — — — — — — — — — — — — — — — — — 249,529 80,469 23,979 234,174 105,353 64,772
14,921 11,715 820 95,523 39,102 15,256 4 3,371 387 2,082 2,120 368 2,089 12 — — — — — 89 34 43 569 — — — — — — — — 381 — 56 10 — 2,345 1,229 469 484 2,709 — 19,359 16,797 1,710 98,188 44,510 15,624
— 625 — — — — — — — 68 — — — 625 — 68 — — 19,359 17,422 1,710 98,256 44,510 15,624
187,797 241 — 363 — — 187,797 241 — 363 — —
— — — — 1,720 — 38,960 7,667 6,783 37,236 8,873 40,817 3,413 55,139 15,486 98,319 50,250 8,331 42,373 62,806 22,269 135,555 60,843 49,148 $ 249,529 $ 80,469 $ 23,979 $ 234,174 $ 105,353 $ 64,772
2020 STATE OF FLORIDA CAFR
211

COMBINING BALANCE SHEETNONMAJOR SPECIAL REVENUE FUNDSJUNE 30, 2020 (in thousands)
Judicial Services
Military and Veterans' Affairs
Florida Clerks of Courts
Operations Corp
Florida Citrus
CommissionASSETSCurrent assetsCash and cash equivalents $ 4 $ 2,290 $ 1,233 $ — Pooled investments with State Treasury 124,220 56,136 — 12,213 Other investments — — — — Receivables, net 3,190 5,805 — 1,557 Due from other funds 5,120 17,486 — 132 Due from component units/primary — — — — Inventories — — — 500 Other — — 1 1 Total current assets 132,534 81,717 1,234 14,403 Noncurrent assetsLong-term investments — — — — Other loans and notes receivable, net — — — —
Total noncurrent assets — — — — Total assets 132,534 81,717 1,234 14,403 LIABILITIESCurrent liabilitiesAccounts payable and accrued liabilities 5,673 2,934 91 2,259 Due to other funds 2,358 480 — 96 Due to component units/primary — — — 102 Compensated absences 93 27 — — Claims payable — — — — Deposits — — — — Obligations under security lending agreements — 2,571 — 645 Total current liabilities 8,124 6,012 91 3,102 Noncurrent liabilitiesAdvances from other funds — — — — Deposits — — — — Total noncurrent liabilities — — — — Total liabilities 8,124 6,012 91 3,102 DEFERRED INFLOWS OF RESOURCESUnavailable revenue — — — — Total deferred inflows of resources — — — — FUND BALANCESNonspendable — — 1 501 Restricted 29,066 2,053 1,141 10,371 Committed 95,344 73,652 1 429 Total fund balances 124,410 75,705 1,143 11,301 Total liabilities, deferred inflows and fund balances $ 132,534 $ 81,717 $ 1,234 $ 14,403
2020 STATE OF FLORIDA CAFR
212

COMBINING BALANCE SHEETNONMAJOR SPECIAL REVENUE FUNDSJUNE 30, 2020 (in thousands)
Blended Component Units
State Boardof
Administration
School forthe Deaf
andthe Blind
Wireless Emergency
Telephone SystemCareerSource Florida, Inc.
FL Water Pollution Control Financing Corp
InlandProtection
Financing Corp
$ 1,474 $ 76 $ — $ 11,132 $ — $ — — 1,033 104,461 — 3,820 — 2,282 16,247 — — 140,604 2 13,800 372 13,237 2,996 83,693 — 14,597 211 2,026 — — — — — — — — — — — — — — — — — — 381 — — 32,153 17,939 119,724 14,509 228,117 2
— — — — — — 31,222 — — — 746,537 — 31,222 — — — 746,537 — 63,375 17,939 119,724 14,509 974,654 2
14,832 295 30,203 1,941 — — 4,007 — 11 — — — — — — — — — — — — — — — — — — — — — — — — — — — — — 5,763 — 212 — 18,839 295 35,977 1,941 212 —
— — — — — — — — — 11,300 — — — — — 11,300 — — 18,839 295 35,977 13,241 212 —
— — — — — — — — — — — —
— — — 381 — — — 14,216 — — 974,344 — 44,536 3,428 83,747 887 98 2 44,536 17,644 83,747 1,268 974,442 2 $ 63,375 $ 17,939 $ 119,724 $ 14,509 $ 974,654 $ 2
2020 STATE OF FLORIDA CAFR
213

COMBINING BALANCE SHEETNONMAJOR SPECIAL REVENUE FUNDSJUNE 30, 2020 (in thousands)
Blended Component Units
Surplus Lines
Corrections Foundation
Inc
Scripps Florida
Funding CorpTotals
6/30/20ASSETSCurrent assetsCash and cash equivalents $ 3,632 $ 1,176 $ 38 $ 22,085 Pooled investments with State Treasury — — — 1,892,088 Other investments 6,110 — — 171,928 Receivables, net 39 — — 655,780 Due from other funds — — — 89,608 Due from component units/primary — — — 1 Inventories — 5 — 2,432 Other 8 — 8 460 Total current assets 9,789 1,181 46 2,834,382 Noncurrent assetsLong-term investments 31,689 526 — 32,265 Other loans and notes receivable, net — — — 782,288 Total noncurrent assets 31,689 526 — 814,553 Total assets 41,478 1,707 46 3,648,935 LIABILITIESCurrent liabilitiesAccounts payable and accrued liabilities 240 11 — 346,535 Due to other funds — — — 191,442 Due to component units/primary — — — 2,209 Compensated absences — — — 1,205 Claims payable — — — 4,447 Deposits — — — 151,732 Obligations under security lending agreements — — — 63,098 Total current liabilities 240 11 — 760,668 Noncurrent liabilitiesAdvances from other funds — — — 737 Deposits — — — 11,368 Total noncurrent liabilities — — — 12,105 Total liabilities 240 11 — 772,773 DEFERRED INFLOWS OF RESOURCESUnavailable revenue — — — 301,079
Total deferred inflows of resources — — — 301,079 FUND BALANCESNonspendable — 5 8 2,884 Restricted — 63 — 1,357,883 Committed 41,238 1,628 38 1,214,316 Total fund balances 41,238 1,696 46 2,575,083 Total liabilities, deferred inflows and fund balances $ 41,478 $ 1,707 $ 46 $ 3,648,935
2020 STATE OF FLORIDA CAFR
214

THIS PAGE INTENTIONALLY LEFT BLANK
215

COMBINING STATEMENT OF REVENUES, EXPENDITURES, AND CHANGES IN FUND BALANCESNONMAJOR SPECIAL REVENUE FUNDSFOR THE FISCAL YEAR ENDED JUNE 30, 2020 (in thousands)
Employment Services
Government Administration
Business and Community
DevelopmentRegulation and
LicensingREVENUESTaxes $ — $ — $ — $ 214,823 Licenses and permits — — — 1,655,048 Fees and charges 78,446 28,310 2,453 110,564 Grants and donations 530,724 53,463 1,912,711 14,866 Investment earnings (losses) 15,336 3,322 19,193 8,862 Fines, forfeits, settlements and judgments 16,603 — — 14,303 Other 31,884 504 1,558 1,334 Total revenues 672,993 85,599 1,935,915 2,019,800 EXPENDITURESCurrent: General government 455,654 102,705 1,907,499 277,230 Education 201,501 — — — Human services — — — — Criminal justice and corrections — — — — Natural resources and environment — — — — Judicial branch — — — — Capital outlay 3,897 582 1,152 2,565 Debt service: Principal retirement — 25 — 324 Interest and fiscal charges — — 9 4 Total expenditures 661,052 103,312 1,908,660 280,123 Excess (deficiency) of revenues over expenditures 11,941 (17,713) 27,255 1,739,677 OTHER FINANCING SOURCES (USES)Operating transfers in 79,344 75,630 236,516 72,911 Operating transfers out (94,187) (13,865) (261,140) (1,796,203) Total other financing sources (uses) (14,843) 61,765 (24,624) (1,723,292) Net change in fund balances (2,902) 44,052 2,631 16,385 Fund balances - beginning 387,980 40,998 138,395 197,372 Fund balances - ending $ 385,078 $ 85,050 $ 141,026 $ 213,757
COMBINING STATEMENT OF REVENUES, EXPENDITURES, AND CHANGES IN FUND BALANCESNONMAJOR SPECIAL REVENUE FUNDSFO
2020 STATE OF FLORIDA CAFR
216

R THE FISCAL YEAR ENDED JUNE 30, 2019 (in thousands)
Tobacco Settlement Public Safety Corrections
Consumer Protectionand Safety Agriculture
JuvenileJustice
$ — $ — $ — $ — $ — $ 1 — — — — 23,970 — — 94,314 12,313 3,047 57,367 50,248 — 19,709 16,307 111,169 1,118,193 2,602 2,076 1,144 475 404 2,639 6 335,219 31,518 5 20,222 1,409 1,150 — 2,339 515 19,607 4,715 108 337,295 149,024 29,615 154,449 1,208,293 54,115
49 28,514 — 606,786 — — — — — — — — 331,003 — — — — — — 142,943 15,009 121,323 — 135,577 — — — — 1,239,802 — — — — — — — — 6,261 256 1,179 10,409 1,706
— — — — — — — — — 28 — — 331,052 177,718 15,265 729,316 1,250,211 137,283
6,243 (28,694) 14,350 (574,867) (41,918) (83,168)
8,002 38,012 27,851 669,815 61,773 76,796 (8,435) (12,928) (33,777) (80,771) (17,623) (2,324) (433) 25,084 (5,926) 589,044 44,150 74,472 5,810 (3,610) 8,424 14,177 2,232 (8,696) 36,563 66,416 13,845 121,378 58,611 57,844 $ 42,373 $ 62,806 $ 22,269 $ 135,555 $ 60,843 $ 49,148
2020 STATE OF FLORIDA CAFR
217

COMBINING STATEMENT OF REVENUES, EXPENDITURES, AND CHANGES IN FUND BALANCESNONMAJOR SPECIAL REVENUE FUNDSFOR THE FISCAL YEAR ENDED JUNE 30, 2020 (in thousands)
JudicialServices
Military andVeterans'Affairs
Florida Clerksof Court
OperationsCorp
Florida Citrus
CommissionREVENUESTaxes $ — $ — $ — $ 6,100 Licenses and permits 489 — — — Fees and charges 92,793 37,126 — 13 Grants and donations 14,313 152,105 1,722 3,750 Investment earnings (losses) — 2,179 1 548 Fines, forfeits, settlements and judgments 53,893 — — 10 Other 10,915 834 — 7 Total revenues 172,403 192,244 1,723 10,428 EXPENDITURESCurrent: General government 2,003 42,670 1,503 12,857 Education — — — — Human services — 97,855 — — Criminal justice and corrections 103,278 — — — Natural resources and environment — — — — Judicial branch 89,089 — — — Capital outlay 2,002 54,534 — 6 Debt service: Principal retirement — — — — Interest and fiscal charges — — — — Total expenditures 196,372 195,059 1,503 12,863 Excess (deficiency) of revenues over expenditures (23,969) (2,815) 220 (2,435) OTHER FINANCING SOURCES (USES)Operating transfers in 39,874 20,784 — — Operating transfers out (10,226) (19,053) — (274) Total other financing sources (uses) 29,648 1,731 — (274) Net change in fund balances 5,679 (1,084) 220 (2,709) Fund balances - beginning 118,731 76,789 923 14,010 Fund balances - ending $ 124,410 $ 75,705 $ 1,143 $ 11,301
2020 STATE OF FLORIDA CAFR
218

COMBINING STATEMENT OF REVENUES, EXPENDITURES, AND CHANGES IN FUND BALANCESNONMAJOR SPECIAL REVENUE FUNDSFOR THE FISCAL YEAR ENDED JUNE 30, 2020 (in thousands)
Blended Component Units
State Boardof
Administration
School forthe Deaf
andthe Blind
Wireless Emergency
Telephone System CareerSourceFlorida, Inc.
FL WaterPollution ControlFinancing Corp
InlandProtection
Financing Corp
$ — $ — $ — $ — $ — $ — — — — — — — — 2,411 122,107 — — — — 2,595 — 16,294 — — 1,035 403 4,826 — 13,180 — 1 — — — — — — 109 — 8 — — 1,036 5,518 126,933 16,302 13,180 —
214,722 — 117,346 16,304 4 — — 6,221 — — — — — — — — — — — — — — — — — — — — — — — — — — — — — 23 20 5 — —
— — — — — — — — — — — — 214,722 6,244 117,366 16,309 4 —
(213,686) (726) 9,567 (7) 13,176 —
214,524 1,549 — — — — (16,572) (44) (41) — (38,327) — 197,952 1,505 (41) — (38,327) — (15,734) 779 9,526 (7) (25,151) — 60,270 16,865 74,221 1,275 999,593 2 $ 44,536 $ 17,644 $ 83,747 $ 1,268 $ 974,442 $ 2
2020 STATE OF FLORIDA CAFR
219

COMBINING STATEMENT OF REVENUES, EXPENDITURES, AND CHANGES IN FUND BALANCESNONMAJOR SPECIAL REVENUE FUNDSFOR THE FISCAL YEAR ENDED JUNE 30, 2020 (in thousands)
Blended Component Units
SurplusLines
CorrectionsFoundation Inc
Scripps Florida
Funding Corp Totals
6/30/20REVENUESTaxes $ — $ — $ — $ 220,924 Licenses and permits — — — 1,679,507 Fees and charges 7,773 7 — 699,292 Grants and donations — 1,274 — 3,971,797 Investment earnings (losses) 3,945 13 — 79,587 Fines, forfeits, settlements and judgments — — — 474,333 Other 153 — — 74,590 Total revenues 11,871 1,294 — 7,200,030 EXPENDITURESCurrent: General government 5,045 — 52 3,790,943 Education — — — 207,722 Human services — — — 428,858 Criminal justice and corrections — 674 — 518,804 Natural resources and environment — — — 1,239,802 Judicial branch — — — 89,089 Capital outlay 1,214 — — 85,811 Debt service: Principal retirement — — — 349 Interest and fiscal charges — — — 41 Total expenditures 6,259 674 52 6,361,419 Excess (deficiency) of revenues over expenditures 5,612 620 (52) 838,611 OTHER FINANCING SOURCES (USES)Operating transfers in — — — 1,623,381 Operating transfers out — — — (2,405,790) Total other financing sources (uses) — — — (782,409) Net change in fund balances 5,612 620 (52) 56,202 Fund balances - beginning 35,626 1,076 98 2,518,881 Fund balances - ending $ 41,238 $ 1,696 $ 46 $ 2,575,083
2020 STATE OF FLORIDA CAFR
220

BUDGETARY COMPARISON SCHEDULESNONMAJOR SPECIAL REVENUE FUNDSFOR THE FISCAL YEAR ENDED JUNE 30, 2020 (in thousands)
Employment Services
Budget Actual
Variance withFinal Budget
Positive (Negative)Fund Balances, July 1, 2019 $ 190,081 $ 190,081 $ — Reversions 64,618 64,618 — Fund Balances, July 1, 2019, restated 254,699 254,699 — REVENUES
Fees and charges 72,999 75,915 2,916 Miscellaneous 3,588 3,664 76 Interest 6,853 9,791 2,938 Grants 510,385 508,231 (2,154) Refunds 20,211 30,531 10,320 Transfers and distributions 83,142 79,632 (3,510) Other 21,474 16,933 (4,541)
Total Revenues 718,652 724,697 6,045 Total Available Resources 973,351 979,396 6,045 EXPENDITURESOperating expenditures:
Salaries and benefits 137,367 121,203 16,164 Other personal services 24,390 8,259 16,131 Expenses 33,125 31,060 2,065 Grants and aids 4,101 3,871 230 Operating capital outlay 2,580 2,121 459 Food products 200 62 138
Special categories 550,608 543,039 7,569 Data processing services 4,595 4,367 228
Total Operating Expenditures 756,966 713,982 42,984 Nonoperating expenditures:
Transfers 64,544 64,544 — Refunds 449 449 — Other 45,898 45,898 —
Total Nonoperating Expenditures 110,891 110,891 — Total Expenditures 867,857 824,873 42,984
Fund Balances, June 30, 2020 $ 105,494 $ 154,523 $ 49,029
2020 STATE OF FLORIDA CAFR
221

BUDGETARY COMPARISON SCHEDULESNONMAJOR SPECIAL REVENUE FUNDSFOR THE FISCAL YEAR ENDED JUNE 30, 2020 (in thousands)
Government Administration
Budget Actual
Variance withFinal Budget
Positive (Negative)Fund Balances, July 1, 2019 $ 37,317 $ 37,317 $ — Reversions 1,164 1,164 — Fund Balances, July 1, 2019, restated 38,481 38,481 — REVENUES
Fees and charges 48,057 29,447 (18,610) Interest 1,115 1,367 252 Grants 31,979 52,578 20,599 Refunds 9 498 489 Transfers and distributions 47,510 75,546 28,036 Other — 33 33
Total Revenues 128,670 159,469 30,799 Total Available Resources 167,151 197,950 30,799 EXPENDITURES
Operating expenditures:Salaries and benefits 34,199 32,960 1,239 Other personal services 1,031 890 141 Expenses 7,418 6,928 490 Grants and aids 3,125 3,120 5 Operating capital outlay 275 259 16 Fixed capital outlay 2,458 2,458 — Special categories 61,065 61,065 — Data processing services 270 270 —
Total Operating Expenditures 109,841 107,950 1,891 Nonoperating expenditures:
Payments to U.S. Treasury 1,224 1,224 — Transfers 10,058 10,058 — Refunds 314 314 — Other 2,465 2,465 —
Total Nonoperating Expenditures 14,061 14,061 — Total Expenditures 123,902 122,011 1,891
Fund Balances, June 30, 2020 $ 43,249 $ 75,939 $ 32,690
2020 STATE OF FLORIDA CAFR
222

BUDGETARY COMPARISON SCHEDULESNONMAJOR SPECIAL REVENUE FUNDSFOR THE FISCAL YEAR ENDED JUNE 30, 2020 (in thousands)
Business and Community Development
Budget Actual
Variance withFinal Budget
Positive (Negative)Fund Balances, July 1, 2019 $ 346,555 $ 346,555 $ — Reversions 9,409 9,409 — Fund Balances, July 1, 2019, restated 355,964 355,964 — REVENUES
Fees and charges 2,707 2,736 29 Interest 16,786 17,639 853 Grants 3,000,850 1,948,611 (1,052,239) Refunds 9,198 10,009 811 Employee/employer contributions 9 9 — Transfers and distributions 229,098 238,149 9,051 Other 117 520 403
Total Revenues 3,258,765 2,217,673 (1,041,092) Total Available Resources 3,614,729 2,573,637 (1,041,092) EXPENDITURES
Operating expenditures:Salaries and benefits 16,398 15,660 738 Other personal services 3,238 2,364 874 Expenses 4,512 3,811 701 Grants and aids 9,405 5,370 4,035 Operating capital outlay 128 41 87 Special categories 2,197,245 2,197,245 — Continuing appropriations 59,802 59,802 — Grants/aids to local governments 6,714 6,714 — Data processing services 44 44 —
Total Operating Expenditures 2,297,486 2,291,051 6,435 Nonoperating expenditures:
Transfers 95,997 95,997 — Refunds 10,530 10,530 — Other 798 798 —
Total Nonoperating Expenditures 107,325 107,325 — Total Expenditures 2,404,811 2,398,376 6,435
Fund Balances, June 30, 2020 $ 1,209,918 $ 175,261 $ (1,034,657)
2020 STATE OF FLORIDA CAFR
223

BUDGETARY COMPARISON SCHEDULESNONMAJOR SPECIAL REVENUE FUNDSFOR THE FISCAL YEAR ENDED JUNE 30, 2020 (in thousands)
Regulation and Licensing
Budget Actual
Variance withFinal Budget
Positive (Negative)Fund Balances, July 1, 2019 $ 352,096 $ 352,096 $ — Reversions 4,273 4,273 — Fund Balances, July 1, 2019, restated 356,369 356,369 — REVENUES
Fees and charges 128,176 144,845 16,669 Licenses 1,663,395 1,674,895 11,500 Taxes 208,302 223,026 14,724 Miscellaneous 2,516 963 (1,553) Interest 684 5,619 4,935 Grants 75 60 (15) Refunds 214 666 452 Transfers and distributions 16,149 53,011 36,862 Other 3,651 15,052 11,401
Total Revenues 2,023,162 2,118,137 94,975 Total Available Resources 2,379,531 2,474,506 94,975 EXPENDITURES
Operating expenditures:Salaries and benefits 140,617 137,109 3,508 Other personal services 3,888 2,511 1,377 Expenses 21,237 18,752 2,485 Grants and aids 3,819 3,819 — Operating capital outlay 2,568 2,439 129 Fixed capital outlay 486 486 — Special categories 81,163 65,411 15,752 Grants/aids to local governments 4,451 4,451 — Data processing services 3,450 2,114 1,336
Total Operating Expenditures 261,679 237,092 24,587 Nonoperating expenditures:
Transfers 1,786,321 1,786,321 — Refunds 3,449 3,449 — Other 85,851 85,851 —
Total Nonoperating Expenditures 1,875,621 1,875,621 — Total Expenditures 2,137,300 2,112,713 24,587
Fund Balances, June 30, 2020 $ 242,231 $ 361,793 $ 119,562
2020 STATE OF FLORIDA CAFR
224

BUDGETARY COMPARISON SCHEDULESNONMAJOR SPECIAL REVENUE FUNDSFOR THE FISCAL YEAR ENDED JUNE 30, 2020 (in thousands)
Tobacco Settlement
Budget Actual
Variance withFinal Budget
Positive (Negative)Fund Balances, July 1, 2019 $ 35,816 $ 35,816 $ — Reversions 430 430 — Fund Balances, July 1, 2019, restated 36,246 36,246 — REVENUES
Interest 800 1,328 528 Refunds 53 53 — Transfers and distributions 346,673 338,573 (8,100) Other 355,900 342,971 (12,929)
Total Revenues 703,426 682,925 (20,501) Total Available Resources 739,672 719,171 (20,501) EXPENDITURES
Operating expenditures:Salaries and benefits 336 296 40 Special categories 340,865 339,791 1,074
Total Operating Expenditures 341,201 340,087 1,114 Nonoperating expenditures:
Transfers 339,023 339,023 — Total Nonoperating Expenditures 339,023 339,023 —
Total Expenditures 680,224 679,110 1,114
Fund Balances, June 30, 2020 $ 59,448 $ 40,061 $ (19,387)
2020 STATE OF FLORIDA CAFR
225

BUDGETARY COMPARISON SCHEDULESNONMAJOR SPECIAL REVENUE FUNDSFOR THE FISCAL YEAR ENDED JUNE 30, 2020 (in thousands)
Public Safety
Budget Actual
Variance withFinal Budget
Positive (Negative)Fund Balances, July 1, 2019 $ 55,742 $ 55,742 $ — Reversions 7,867 7,867 — Fund Balances, July 1, 2019, restated 63,609 63,609 — REVENUES
Fees and charges 99,277 94,540 (4,737) Miscellaneous 14 14 — Interest 720 810 90 Grants 24,231 17,651 (6,580) Refunds 2,141 2,650 509 Transfers and distributions 42,614 38,358 (4,256) Other 35,337 35,444 107
Total Revenues 204,334 189,467 (14,867) Total Available Resources 267,943 253,076 (14,867) EXPENDITURES
Operating expenditures:Salaries and benefits 69,953 61,776 8,177 Other personal services 3,485 1,774 1,711 Expenses 29,927 21,857 8,070 Grants and aids 23,110 16,377 6,733 Operating capital outlay 6,782 4,382 2,400 Fixed capital outlay 744 744 — Special categories 77,109 77,109 — Data processing services 2 2 —
Total Operating Expenditures 211,112 184,021 27,091 Nonoperating expenditures:
Transfers 1,864 1,864 — Refunds 129 129 — Other 24,191 24,191 —
Total Nonoperating Expenditures 26,184 26,184 — Total Expenditures 237,296 210,205 27,091
Fund Balances, June 30, 2020 $ 30,647 $ 42,871 $ 12,224
2020 STATE OF FLORIDA CAFR
226

BUDGETARY COMPARISON SCHEDULESNONMAJOR SPECIAL REVENUE FUNDSFOR THE FISCAL YEAR ENDED JUNE 30, 2020 (in thousands)
Corrections
Budget Actual
Variance withFinal Budget
Positive (Negative)Fund Balances, July 1, 2019 $ 11,955 $ 11,955 $ — Reversions 273 273 — Fund Balances, July 1, 2019, restated 12,228 12,228 — REVENUES
Fees and charges 11,440 11,429 (11) Interest — 203 203 Grants 14,267 14,268 1 Refunds 450 450 — Transfers and distributions 21,965 21,960 (5) Other 6,770 6,766 (4)
Total Revenues 54,892 55,076 184 Total Available Resources 67,120 67,304 184 EXPENDITURES
Operating expenditures:Salaries and benefits 8,012 4,391 3,621 Other personal services 1,336 877 459 Expenses 7,648 4,869 2,779 Operating capital outlay 806 446 360 Food products 76 — 76 Special categories 19,426 19,426 — Data processing services 99 99 —
Total Operating Expenditures 37,403 30,108 7,295 Nonoperating expenditures:
Transfers 18,362 18,362 — Refunds 144 144 — Other 921 921 —
Total Nonoperating Expenditures 19,427 19,427 — Total Expenditures 56,830 49,535 7,295
Fund Balances, June 30, 2020 $ 10,290 $ 17,769 $ 7,479
2020 STATE OF FLORIDA CAFR
227

BUDGETARY COMPARISON SCHEDULESNONMAJOR SPECIAL REVENUE FUNDSFOR THE FISCAL YEAR ENDED JUNE 30, 2020 (in thousands)
Consumer Protection and Safety
Budget Actual
Variance withFinal Budget
Positive (Negative)Fund Balances, July 1, 2019 $ 13,283 $ 13,283 $ — Reversions 71,897 71,897 — Fund Balances, July 1, 2019, restated 85,180 85,180 — REVENUES
Fees and charges 3,622 2,898 (724) Interest 96 259 163 Grants 140,070 102,359 (37,711) Refunds 17,724 20,020 2,296 Transfers and distributions 832,335 672,600 (159,735) Other 18,884 20,230 1,346
Total Revenues 1,012,731 818,366 (194,365) Total Available Resources 1,097,911 903,546 (194,365) EXPENDITURES
Operating expenditures:Salaries and benefits 31,062 26,709 4,353 Other personal services 926 415 511 Expenses 4,526 2,774 1,752 Operating capital outlay 410 87 323 Special categories 904,008 782,181 121,827 Data processing services 36 — 36
Total Operating Expenditures 940,968 812,166 128,802 Nonoperating expenditures:
Transfers 69,432 69,432 — Refunds 1,890 1,890 — Other 3,771 3,771 —
Total Nonoperating Expenditures 75,093 75,093 — Total Expenditures 1,016,061 887,259 128,802
Fund Balances, June 30, 2020 $ 81,850 $ 16,287 $ (65,563)
2020 STATE OF FLORIDA CAFR
228

BUDGETARY COMPARISON SCHEDULESNONMAJOR SPECIAL REVENUE FUNDSFOR THE FISCAL YEAR ENDED JUNE 30, 2020 (in thousands)
Agriculture
Budget Actual
Variance withFinal Budget
Positive (Negative)Fund Balances, July 1, 2019 $ 18,162 $ 18,162 $ — Reversions 11,708 11,708 — Fund Balances, July 1, 2019, restated 29,870 29,870 — REVENUES
Fees and charges 53,963 53,861 (102) Licenses 24,746 23,481 (1,265) Miscellaneous — — — Interest 18 1,869 1,851 Grants 1,102,988 1,102,985 (3) Refunds 3,572 3,596 24 Transfers and distributions 127,133 128,418 1,285 Other 2,932 2,975 43
Total Revenues 1,315,352 1,317,185 1,833 Total Available Resources 1,345,222 1,347,055 1,833 EXPENDITURES
Operating expenditures:Salaries and benefits 93,520 85,797 7,723 Other personal services 6,076 4,695 1,381 Expenses 27,358 23,272 4,086 Grants and aids 1,060,354 1,060,354 — Operating capital outlay 2,783 2,674 109 Fixed capital outlay 3,889 3,889 — Special categories 84,059 84,059 — Grants/aids to local governments 1,979 1,979 —
Total Operating Expenditures 1,280,018 1,266,719 13,299 Nonoperating expenditures:
Payments to U.S. Treasury 3,966 3,966 — Transfers 22,901 22,901 — Refunds 3,281 3,281 — Other 9,908 9,908 —
Total Nonoperating Expenditures 40,056 40,056 — Total Expenditures 1,320,074 1,306,775 13,299
Fund Balances, June 30, 2020 $ 25,148 $ 40,280 $ 15,132
2020 STATE OF FLORIDA CAFR
229

BUDGETARY COMPARISON SCHEDULESNONMAJOR SPECIAL REVENUE FUNDSFOR THE FISCAL YEAR ENDED JUNE 30, 2020 (in thousands)
Juvenile Justice
Budget Actual
Variance withFinal Budget
Positive (Negative)Fund Balances, July 1, 2019 $ 54,325 $ 54,325 $ — Reversions 7,136 7,136 — Fund Balances, July 1, 2019, restated 61,461 61,461 — REVENUES
Fees and charges 57,809 50,060 (7,749) Interest — 6 6 Grants 2,876 2,483 (393) Refunds — 217 217 Transfers and distributions 77,231 75,515 (1,716) Other 1,363 1,160 (203)
Total Revenues 139,279 129,441 (9,838) Total Available Resources 200,740 190,902 (9,838) EXPENDITURES
Operating expenditures:Salaries and benefits 46,131 36,318 9,813 Other personal services 2,072 938 1,134 Expenses 8,416 5,949 2,467 Grants and aids 1,263 907 356 Operating capital outlay 417 367 50 Food products 2,194 1,324 870 Fixed capital outlay 2,172 2,172 — Special categories 95,401 95,401 —
Total Operating Expenditures 158,066 143,376 14,690 Nonoperating expenditures:
Transfers — — — Refunds 6 6 — Other 2,300 2,300 —
Total Nonoperating Expenditures 2,306 2,306 — Total Expenditures 160,372 145,682 14,690
Fund Balances, June 30, 2020 $ 40,368 $ 45,220 $ 4,852
2020 STATE OF FLORIDA CAFR
230

BUDGETARY COMPARISON SCHEDULESNONMAJOR SPECIAL REVENUE FUNDSFOR THE FISCAL YEAR ENDED JUNE 30, 2020 (in thousands)
Judicial Services
Budget Actual
Variance withFinal Budget
Positive (Negative)Fund Balances, July 1, 2019 $ 114,022 $ 114,022 $ — Reversions 3,524 3,524 — Fund Balances, July 1, 2019, restated 117,546 117,546 — REVENUES
Fees and charges 109,738 86,873 (22,865) Licenses 490 489 (1) Miscellaneous 1 1 — Grants 14,963 13,773 (1,190) Refunds 10,394 10,324 (70) Transfers and distributions 99,113 102,008 2,895 Other 59,028 54,017 (5,011)
Total Revenues 293,727 267,485 (26,242) Total Available Resources 411,273 385,031 (26,242) EXPENDITURES
Operating expenditures:Salaries and benefits 211,348 173,166 38,182 Other personal services 6,598 3,277 3,321 Expenses 3,572 2,721 851 Operating capital outlay 210 142 68 Fixed capital outlay 225 225 — Special categories 20,188 20,188 — Data processing services 981 687 294
Total Operating Expenditures 243,122 200,406 42,716 Nonoperating expenditures:
Transfers 57,376 57,376 — Refunds 42 42 — Other 10,628 10,628 —
Total Nonoperating Expenditures 68,046 68,046 — Total Expenditures 311,168 268,452 42,716
Fund Balances, June 30, 2020 $ 100,105 $ 116,579 $ 16,474
2020 STATE OF FLORIDA CAFR
231

BUDGETARY COMPARISON SCHEDULESNONMAJOR SPECIAL REVENUE FUNDSFOR THE FISCAL YEAR ENDED JUNE 30, 2020 (in thousands)
Military and Veterans' Affairs
Budget Actual
Variance withFinal Budget
Positive (Negative)Fund Balances, July 1, 2019 $ 58,585 $ 58,585 $ — Reversions 1,190 1,190 — Fund Balances, July 1, 2019, restated 59,775 59,775 — REVENUES
Fees and charges 36,889 36,605 (284) Miscellaneous 4 4 — Interest 1,476 1,463 (13) Grants 136,496 136,496 — Refunds 630 433 (197) Transfers and distributions 18,451 29,468 11,017 Other 1,162 1,153 (9)
Total Revenues 195,108 205,622 10,514 Total Available Resources 254,883 265,397 10,514 EXPENDITURES
Operating expenditures:Salaries and benefits 84,001 71,206 12,795 Other personal services 3,901 3,003 898 Expenses 31,532 27,056 4,476 Operating capital outlay 3,461 2,969 492 Food products 4,541 4,053 488 Fixed capital outlay 57,014 57,014 — Special categories 32,771 27,206 5,565
Total Operating Expenditures 217,221 192,507 24,714 Nonoperating expenditures:
Transfers 19,346 19,346 — Refunds 825 825 — Other 7,309 7,309 —
Total Nonoperating Expenditures 27,480 27,480 — Total Expenditures 244,701 219,987 24,714
Fund Balances, June 30, 2020 $ 10,182 $ 45,410 $ 35,228
2020 STATE OF FLORIDA CAFR
232

BUDGETARY COMPARISON SCHEDULESNONMAJOR SPECIAL REVENUE FUNDSFOR THE FISCAL YEAR ENDED JUNE 30, 2020 (in thousands)
Florida Citrus Commission
Budget Actual
Variance withFinal Budget
Positive (Negative)Fund Balances, July 1, 2019 $ 11,398 $ 11,398 $ — Reversions 767 767 — Fund Balances, July 1, 2019, restated 12,165 12,165 — REVENUES
Taxes 6,019 6,100 81 Miscellaneous 30 10 (20) Interest 275 (1,715) (1,990) Grants 3,950 3,857 (93) Refunds — 7 7 Transfers and distributions — — — Other — 22 22
Total Revenues 10,274 8,281 (1,993) Total Available Resources 22,439 20,446 (1,993) EXPENDITURES
Operating expenditures:Salaries and benefits 4,541 2,524 2,017 Other personal services 190 102 88 Expenses 1,156 440 716 Operating capital outlay 371 6 365 Special categories 8,396 8,396 — Data processing services 62 62 —
Total Operating Expenditures 14,716 11,530 3,186 Nonoperating expenditures:
Refunds 38 38 — Other 317 317 —
Total Nonoperating Expenditures 355 355 — Total Expenditures 15,071 11,885 3,186
Fund Balances, June 30, 2020 $ 7,368 $ 8,561 $ 1,193
2020 STATE OF FLORIDA CAFR
233

BUDGETARY COMPARISON SCHEDULESNONMAJOR SPECIAL REVENUE FUNDSFOR THE FISCAL YEAR ENDED JUNE 30, 2020 (in thousands)
School for the Deaf and the Blind
Budget Actual
Variance withFinal Budget
Positive (Negative)Fund Balances, July 1, 2019 $ 1,286 $ 1,286 $ — REVENUES
Grants 1,393 1,274 (119) Transfers and distributions 1,788 1,743 (45)
Total Revenues 3,181 3,017 (164)
Total Available Resources 4,467 4,303 (164) EXPENDITURES
Operating expenditures:Special categories 3,134 3,134 —
Total Operating Expenditures 3,134 3,134 — Nonoperating expenditures:
Transfers 136 136 — Total Nonoperating Expenditures 136 136 —
Total Expenditures 3,270 3,270 —
Fund Balances, June 30, 2020 $ 1,197 $ 1,033 $ (164)
2020 STATE OF FLORIDA CAFR
234

BUDGETARY COMPARISON SCHEDULESNONMAJOR SPECIAL REVENUE FUNDSFOR THE FISCAL YEAR ENDED JUNE 30, 2020 (in thousands)
Wireless Emergency Telephone System
Budget Actual
Variance withFinal Budget
Positive (Negative)Fund Balances, July 1, 2019 $ 57,410 $ 57,410 $ — Reversions 1,785 1,785 — Fund Balances, July 1, 2019, restated 59,195 59,195 — REVENUES
Interest 2,911 3,059 148 Other 122,379 122,539 160
Total Revenues 125,290 125,598 308 Total Available Resources 184,485 184,793 308 EXPENDITURES
Operating expenditures:Salaries and benefits 395 325 70 Other personal services 270 124 146 Expenses 205 105 100 Grants and aids 127,536 118,504 9,032 Operating capital outlay 4 1 3 Fixed capital outlay 663 663 — Special categories 1,615 292 1,323 Data processing services 3 3 —
Total Operating Expenditures 130,691 120,017 10,674 Nonoperating expenditures:
Transfers 40 40 — Refunds 2 2 —
Total Nonoperating Expenditures 42 42 — Total Expenditures 130,733 120,059 10,674
Fund Balances, June 30, 2020 $ 53,752 $ 64,734 $ 10,982
2020 STATE OF FLORIDA CAFR
235

THIS PAGE INTENTIONALLY LEFT BLANK
236
CAPITAL PROJECTS FUNDS
GENERAL GOVERNMENTThis fund includes various internal reporting capital projects funds administered by various agencies to account for resources used for the acquisition or construction of major capital facilities other than those financed by other funds.
TRANSPORTATION CAPITAL PROJECTS FUNDThis capital projects fund is administered by the Department of Transportation to account for resources used for eligible project costs.
OTHERThis fund includes various internal reporting capital projects funds administered by other agencies.
FLORIDA SCHOOL FOR THE DEAF AND THE BLINDThis capital projects fund is administered by the School for the Deaf and the Blind.
2020 STATE OF FLORIDA CAFR
237

COMBINING BALANCE SHEETCAPITAL PROJECTS FUNDSFOR THE FISCAL YEAR ENDED JUNE 30, 2020 (in thousands)
GeneralGovernment
Transportation Capital Projects
Fund Other
School forthe Deaf
andthe Blind
Totals6/30/20
ASSETSCurrent assetsPooled investments with State Treasury $ 207 $ 93,699 $ 381 $ 548 $ 94,835 Receivables, net — 166 — — 166 Due from other funds 67,653 — — 163 67,816 Total current assets 67,860 93,865 381 711 162,817 Total assets 67,860 93,865 381 711 162,817 LIABILITIESCurrent liabilitiesAccounts payable and accrued liabilities 577 — — 201 778 Due to other funds — 5,776 — — 5,776 Obligations under security lending agreements — 5,192 — — 5,192 Total current liabilities 577 10,968 — 201 11,746 Total liabilities 577 10,968 — 201 11,746 FUND BALANCESRestricted — 80,505 — 61 80,566 Committed 67,283 2,392 381 449 70,505 Total fund balances 67,283 82,897 381 510 151,071 Total liabilities and fund balances $ 67,860 $ 93,865 $ 381 $ 711 $ 162,817
2020 STATE OF FLORIDA CAFR
238

COMBINING STATEMENT OF REVENUES, EXPENDITURES, AND CHANGES IN FUND BALANCESCAPITAL PROJECTS FUNDSFOR THE FISCAL YEAR ENDED JUNE 30, 2020 (in thousands)
GeneralGovernment
Transportation Capital Projects
Fund Other
School forthe Deaf
andthe Blind
Totals 6/30/20
REVENUES Investment earnings (losses) $ — $ 4,619 $ — $ — $ 4,619 Total revenues — 4,619 — — 4,619 EXPENDITURESCurrent: General government 51,867 — — — 51,867 Education — — — 2,089 2,089 Human services 1,095 — — — 1,095 Criminal justice and corrections 73,432 — — — 73,432 Transportation — 128 — — 128 Capital outlay 63,668 — — 174 63,842 Total expenditures 190,062 128 — 2,263 192,453 Excess (deficiency) of revenues
over expenditures (190,062) 4,491 — (2,263) (187,834) OTHER FINANCING SOURCES (USES)Proceeds of bond issues — — — — — Operating transfers in 170,986 — — 2,103 173,089 Operating transfers out — (45,373) — — (45,373) Total other financing sources (uses) 170,986 (45,373) — 2,103 127,716 Net change in fund balances (19,076) (40,882) — (160) (60,118) Fund balances - beginning 86,359 123,779 381 670 211,189 Fund balances - ending $ 67,283 $ 82,897 $ 381 $ 510 $ 151,071
2020 STATE OF FLORIDA CAFR
239

THIS PAGE INTENTIONALLY LEFT BLANK
240

DEBT SERVICE FUNDS
DEBT SERVICE FUNDThis fund, administered by the State Board of Administration, a blended component unit, is used to account for resources earmarked to pay principal, interest, and service charges on general long-term debt of the State.
UNIVERSITY DEBT SERVICE FUNDThis fund is used to account for resources earmarked to pay principal, interest, and service charges on University long-term debt of the State.
2020 STATE OF FLORIDA CAFR
241

COMBINING BALANCE SHEETDEBT SERVICE FUNDSFOR THE FISCAL YEAR ENDED JUNE 30, 2020 (in thousands)
Debt Service Fund
UniversityDebt Service
FundTotals
6/30/20ASSETSCurrent assetsCash and cash equivalents $ — $ 1,497 $ 1,497 Other investments 24,832 5,266 30,098 Receivables, net 23 — 23 Total Current Assets 24,855 6,763 31,618
Noncurrent assetsLong-term investments 5,661 — 5,661 Total noncurrent assets 5,661 — 5,661 Total assets 30,516 6,763 37,279 LIABILITIESCurrent liabilitiesAccounts payable and accrued liabilities — — — Total current liabilities — — — Total liabilities — — — FUND BALANCESRestricted 30,516 6,763 37,279 Total fund balances 30,516 6,763 37,279 Total liabilities and fund balances $ 30,516 $ 6,763 $ 37,279
2020 STATE OF FLORIDA CAFR
242

COMBINING STATEMENT OF REVENUES, EXPENDITURES, AND CHANGES IN FUND BALANCESDEBT SERVICE FUNDSFOR THE FISCAL YEAR ENDED JUNE 30, 2020 (in thousands)
DebtServiceFund
UniversityDebt Service
FundTotals
6/30/20REVENUES Fees and charges $ 265 $ 7,493 $ 7,758 Investment earnings (losses) 9,047 23 $ 9,070 Other 594 — $ 594 Total revenues 9,906 7,516 17,422 EXPENDITURESCurrent: General government 1,381 — 1,381 Debt service: Principal retirement 1,083,737 2,998 1,086,735 Interest and fiscal charges 558,156 872 559,028 Total expenditures 1,643,274 3,870 1,647,144 Excess (deficiency) of revenues
over expenditures (1,633,368) 3,646 (1,629,722) OTHER FINANCING SOURCES (USES)Proceeds of bond issues 3,597 — 3,597 Proceeds of refunding bonds 1,381,184 — 1,381,184 Operating transfers in 1,622,573 — 1,622,573 Operating transfers out (42,776) — (42,776) Payments to refunded bond agent (1,381,184) — (1,381,184) Total other financing sources (uses) 1,583,394 — 1,583,394 Net change in fund balances (49,974) 3,646 (46,328) Fund balances - beginning 80,490 3,117 83,607 Fund balances - ending $ 30,516 $ 6,763 $ 37,279
2020 STATE OF FLORIDA CAFR
243

THIS PAGE INTENTIONALLY LEFT BLANK
244

NONMAJOR ENTERPRISE FUNDS
OTHERThis category includes various internal reporting enterprise funds, most of which regulate activities and are funded by the collection of fees.
FLORIDA ENGINEERS MANAGEMENTCORPORATIONThis blended component unit was created for the benefit of the Department of Business and Professional Regulation and the Board of Professional Engineers for the purpose of providing administrative, investigative, and prosecutorial services as provided in Section 471.038, Florida Statutes.
SPACE FLORIDAPursuant to Section 331.302, Florida Statutes, this entity was created to promote aerospace business development by facilitating business financing, spaceport operations, research and development, workforce development, and innovative education programs.
2020 STATE OF FLORIDA CAFR
245

COMBINING STATEMENT OF NET POSITIONNONMAJOR ENTERPRISE FUNDSFOR THE FISCAL YEAR ENDED JUNE 30, 2020(in thousands
Other
FL EngineersManagement
CorpSpaceFlorida
Totals 6/30/20
ASSETSCurrent assetsCash and cash equivalents $ 3,071 $ 335 $ 30,020 $ 33,426 Pooled investments with State Treasury 397,272 — — 397,272 Other investments 10,621 — 3,697 14,318 Receivables, net 3,318 26 28,622 31,966 Due from other funds 11,336 — — 11,336 Due from component units/primary 154 — — 154 Inventories 1 — — 1 Other 27 52 1,274 1,353
Total current assets 425,800 413 63,613 489,826 Noncurrent assetsLong-term investments 60,022 — — 60,022 Other loans and notes receivable, net — — 3,149 3,149 Capital assets
Buildings, equipment, and other depreciable assets 32,407 438 293,478 326,323 Accumulated depreciation (25,851) (355) (55,206) (81,412)
Construction work in progress 256 — 14,620 14,876 Other — — 4,497 4,497
Total noncurrent assets 66,834 83 260,538 327,455 Total assets 492,634 496 324,151 817,281
DEFERRED OUTFLOWS OF RESOURCESPension-related items 45,625 — — 45,625 Other postemployment benefits 33,783 — — 33,783
Total deferred outflows of resources 79,408 — — 79,408 LIABILITIESCurrent liabilitiesAccounts payable and accrued liabilities 5,504 207 35,317 41,028 Due to other funds 9,186 — — 9,186 Due to component units/primary 277 154 — 431 Compensated absences 5,881 — 159 6,040 Installment purchases/capital leases — — 773 773 Deposits 16,378 — 2,922 19,300 Obligations under security lending agreements 18,598 — — 18,598 Pension liability 711 — — 711 Other postemployment benefits liability 2,512 — — 2,512
Total current liabilities 59,047 361 39,171 98,579 Noncurrent liabilitiesDeposits 42,824 — 123,695 166,519 Installment purchases/capital leases — — 7,444 7,444 Compensated absences 15,831 — 125 15,956 Pension liability 122,584 — — 122,584 Other postemployment benefits liability 191,748 — — 191,748 Other — — 1,449 1,449
Total noncurrent liabilities 372,987 — 132,713 505,700 Total liabilities 432,034 361 171,884 604,279
DEFERRED INFLOWS OF RESOURCESPension-related items 13,174 — — 13,174 Other postemployment benefits 40,906 — — 40,906
Total deferred inflows of resources 54,080 — — 54,080 NET POSITIONNet investment in capital assets 6,812 83 118,276 125,171 Restricted - other — 52 2,080 2,132 Unrestricted 79,116 — 31,911 111,027
Total net position $ 85,928 $ 135 $ 152,267 $ 238,330
2020 STATE OF FLORIDA CAFR
246

COMBINING STATEMENT OF REVENUES, EXPENSES, AND CHANGES IN FUND NET POSITIONNONMAJOR ENTERPRISE FUNDSFOR THE FISCAL YEAR ENDED JUNE 30, 2020 (in thousands)
Other
FL EngineersManagement
CorpSpaceFlorida
Totals 6/30/20
OPERATING REVENUESSales - nonstate $ 73,844 $ — $ 8,317 $ 82,161 Fees 258,838 2,035 — 260,873 Sales - state 42,276 — — 42,276 Rents and royalties - nonstate 2 — — 2 Rents - state 49 — — 49 Fines, forfeits, settlements and judgments 8,047 — — 8,047 Other 37 — 39,904 39,941
Total operating revenues 383,093 2,035 48,221 433,349 OPERATING EXPENSESContractual services 80,911 368 31,766 113,045 Personal services 212,741 1,267 10,734 224,742 Depreciation 2,370 34 9,617 12,021 Materials and supplies 5,109 37 — 5,146 Repairs and maintenance 1,671 23 — 1,694 Basic services 27,228 333 — 27,561 Interest and fiscal charges 2,307 — — 2,307
Total operating expenses 332,337 2,062 52,117 386,516 Operating income (loss) 50,756 (27) (3,896) 46,833
NONOPERATING REVENUES (EXPENSES)Grants and donations 1,027 — 14,170 15,197 Investment earnings (losses) 16,938 — 222 17,160 Interest and fiscal charges (377) — (626) (1,003) Fines, forfeits, judgments and settlements 2 — — 2 Property disposition gain (loss) (20) — — (20) Grant expense and client benefits (1,087) — — (1,087) Other (161) — — (161)
Total nonoperating revenues (expenses) 16,322 — 13,766 30,088 Income (loss) before transfers
and contributions 67,078 (27) 9,870 76,921
Operating transfers in 26,719 — — 26,719 Operating transfers out (121,202) — — (121,202) Capital contributions 29 — — 29
Change in net position (27,376) (27) 9,870 (17,533)
Total net position - beginning 113,304 162 142,397 255,863 Total net position - ending $ 85,928 $ 135 $ 152,267 $ 238,330
2020 STATE OF FLORIDA CAFR
247

COMBINING STATEMENT OF CASH FLOWSNONMAJOR ENTERPRISE FUNDSFOR THE FISCAL YEAR ENDED JUNE 30, 2020 (in thousands)
Other
FL EngineersManagement
CorpSpaceFlorida
Totals 6/30/20
CASH FLOWS FROM OPERATING ACTIVITIESCash received from customers $ 382,029 $ 2,156 $ 8,387 $ 392,572 Cash paid to vendors (117,825) (884) (37,439) (156,148) Cash paid to employees (190,023) (1,252) (4,559) (195,834) Cash received/(paid) for grants — — 31,074 31,074
Net cash provided (used) by operating activities 74,181 20 (2,537) 71,664
CASH FLOWS FROM NONCAPITAL FINANCING ACTIVITIES
Transfers in (out) (95,671) — — (95,671) Advances from or repayment from other funds (1,111) — — (1,111) Cash received from noncapital grants or donations 646 — — 646
Net cash provided (used) by noncapital financing activities (96,136) — — (96,136)
CASH FLOWS FROM CAPITAL AND RELATED FINANCING ACTIVITIES
Cash received from capital grants and donations — — 6,725 6,725 Payment of bond principal — — (7,113) (7,113) Purchase or construction of capital assets (1,468) (28) (7,632) (9,128) Line of credit draws/(payments) — — (1,574) (1,574)
Net cash provided (used) by capital andrelated financing activities (1,468) (28) (9,594) (11,090)
CASH FLOWS FROM INVESTING ACTIVITIESSecurity lending 3,570 — — 3,570 Proceeds from the sale or maturity of investments 128,479 — — 128,479 Investment earnings 16,735 — 169 16,904 Purchase of investments (126,342) — (492) (126,834)
Net cash provided (used) by investing activities 22,442 — (323) 22,119
Net increase (decrease) in cash and cash equivalents (981) (8) (12,454) (13,443)
Cash and cash equivalents - beginning 401,324 343 42,474 444,141
Cash and cash equivalents - ending $ 400,343 $ 335 $ 30,020 $ 430,698
2020 STATE OF FLORIDA CAFR
248

COMBINING STATEMENT OF CASH FLOWSNONMAJOR ENTERPRISE FUNDSFOR THE FISCAL YEAR ENDED JUNE 30, 2020 (in thousands)Reconciliation of operating income (loss) to net cash
provided (used) by operating activities
Other
FL EngineersManagement
CorpSpace
FloridaTotals
6/30/20Operating income (loss) $ 50,756 $ (27) $ (3,896) $ 46,833
Adjustment to reconcile operating income (loss) to net cash provided (used) by operating activities:Depreciation and amortization expense 2,370 34 9,617 12,021
Changes in assets and liabilities:(Increase) decrease in accounts receivable 22,814 (13) 302 23,103 (Increase) decrease in due from other funds 59 — (8,701) (8,642) Increase (decrease) in allowance for uncollectibles (22,938) — — (22,938) (Increase) decrease in other non-current assets — — 527 527 (Increase) decrease in inventories 1 — — 1 (Increase) decrease in future contract premiums and other receivable — — 22 22 Increase (decrease) in accounts payable (3,158) 5 1,322 (1,831) Increase (decrease) in compensated absences 2,050 — 51 2,101 Increase (decrease) in due to other funds (217) — — (217) Increase (decrease) in other non-current liability — — 276 276 (Increase) decrease in deposits and prepaid items (6) 21 (128) (113) Increase (decrease) in unearned revenue (1,354) — (1,929) (3,283) Increase (decrease) in pension liability and deferrals 15,840 — — 15,840 Increase (decrease) in OPEB liability and deferrals 7,964 — — 7,964
Net cash provided (used) by operating activities $ 74,181 $ 20 $ (2,537) $ 71,664
Noncash investing, capital, and financing activities
Change in fair value of investments $ — $ — $ (128) $ (128) Contribution of capital assets $ — $ — $ 135,927 $ 135,927
2020 STATE OF FLORIDA CAFR
249

THIS PAGE INTENTIONALLY LEFT BLANK
250

INTERNAL SERVICE FUNDS
EMPLOYEE HEALTH AND DISABILITYThese funds are administered by the Department of Management Services and are used primarily to account for health and disability plans for employees of the state.
DATA CENTERSThese funds are used to account for services provided by data processing centers operated by various agencies.
COMMUNICATIONS AND FACILITIESThese funds are administered by the Department of Management Services primarily to account for services provided to other state agencies, such as those related to the construction, operation, and maintenance of public facilities, and management and operation of the SUNCOM (state communication) Network.
OTHERThese funds are administered by various agencies primarily to account for services provided to other state agencies, such as legal services, records management, and community services (inmate work squads).
2020 STATE OF FLORIDA CAFR
251

COMBINING STATEMENT OF NET POSITIONINTERNAL SERVICE FUNDSFOR THE FISCAL YEAR ENDED JUNE 30, 2020 (in thousands)
EmployeeHealth andDisability
DataCenters
Communicationsand
Facilities OtherTotals
6/30/20
ASSETS
Current assetsCash and cash equivalents $ — $ 126 $ 11,775 $ — $ 11,901 Pooled investments with State Treasury 719,266 13,173 81,775 5,263 819,477 Other investments — — 44,295 — 44,295 Receivables, net 67,444 23 9,666 52 77,185 Due from other funds 2,136 3,861 15,992 4,591 26,580 Due from component units/primary — — 1,368 — 1,368
Total current assets 788,846 17,183 164,871 9,906 980,806
Noncurrent assetsCapital assets
Land and other non-depreciable assets — — 313 1 314
Buildings, equipment, and other depreciable assets 38 36,613 1,542,115 3,962 1,582,728 Accumulated depreciation (28) (34,073) (618,892) (3,390) (656,383)
Construction work in progress — — 26,437 — 26,437 Total noncurrent assets 10 2,540 949,973 573 953,096
Total assets 788,856 19,723 1,114,844 10,479 1,933,902
DEFERRED OUTFLOWS OF RESOURCESAmount deferred on refunding of debt — — 3,414 — 3,414 Pension-related items 455 5,529 4,934 27,176 38,094 Other postemployment benefits 370 3,114 4,409 9,753 17,646
Total deferred outflows of resources 825 8,643 12,757 36,929 59,154
LIABILITIES
Current liabilitiesAccounts payable and accrued liabilities 183,203 3,584 35,035 1,372 223,194 Due to other funds 12,497 352 68 1,394 14,311 Compensated absences 62 385 587 1,214 2,248 Installment purchases/capital leases — 1,318 1,026 — 2,344 Bonds payable — — 15,710 — 15,710 Deposits 216,671 — 3,210 155 220,036 Obligations under security lending agreements 32,974 434 3,638 91 37,137 Certificates of participation payable — — 27,150 — 27,150 Pension liability 7 78 85 195 365 Other postemployment benefits liability 17 194 341 775 1,327
Total current liabilities 445,431 6,345 86,850 5,196 543,822
Noncurrent liabilitiesAdvances from other funds — — 500 — 500 Bonds payable — — 158,838 — 158,838 Certificates of participation payable — — 292,852 — 292,852 Installment purchases/capital leases — 28 3,220 — 3,248 Compensated absences 79 2,270 1,620 5,780 9,749 Pension liability 1,212 13,466 14,176 67,859 96,713 Other postemployment benefits liability 1,311 14,774 26,008 59,185 101,278
Total noncurrent liabilities 2,602 30,538 497,214 132,824 663,178 Total liabilities 448,033 36,883 584,064 138,020 1,207,000
DEFERRED INFLOWS OF RESOURCESAmount deferred on refunding of debt — — 7,253 — 7,253 Pension-related items 679 1,779 1,673 7,485 11,616 Other postemployment benefits 545 4,412 5,971 15,715 26,643
Total deferred inflows of resources 1,224 6,191 14,897 23,200 45,512
NET POSITIONNet investment in capital assets 10 2,540 451,584 573 454,707 Restricted - other — — 53,538 — 53,538 Unrestricted 340,414 (17,248) 23,518 (114,385) 232,299
Total net position $ 340,424 $ (14,708) $ 528,640 $ (113,812) $ 740,544
2020 STATE OF FLORIDA CAFR
252

COMBINING STATEMENT OF REVENUES, EXPENSES, AND CHANGES IN FUND NET POSITIONINTERNAL SERVICE FUNDSFOR THE FISCAL YEAR ENDED JUNE 30, 2020 (in thousands)
EmployeeHealth andDisability
DataCenters
Communicationsand
Facilities OtherTotals
6/30/20OPERATING REVENUESSales - nonstate $ — $ 149 $ 35,046 $ 6,642 $ 41,837 Fees — — 1 — 1 Sales - state 2,490,995 74,612 93,474 53,429 2,712,510 Rents - state — — 141,003 — 141,003 Fines, forfeits, settlements and judgments — — — 36 36 Other 15,039 — — — 15,039
Total operating revenues 2,506,034 74,761 269,524 60,107 2,910,426 OPERATING EXPENSESContractual services 360,672 44,220 140,684 10,148 555,724 Insurance claims expense 2,031,502 — — — 2,031,502 Personal services 1,588 23,781 24,896 55,338 105,603 Depreciation 4 3,234 32,647 274 36,159 Materials and supplies 111 387 707 4,034 5,239 Repairs and maintenance — 567 1,177 1 1,745 Basic services 127 1,732 3,188 3,639 8,686 Interest and fiscal charges — — 11 — 11
Total operating expenses 2,394,004 73,921 203,310 73,434 2,744,669 Operating income (loss) 112,030 840 66,214 (13,327) 165,757
NONOPERATING REVENUES/(EXPENSES)Grants and donations — 295 489 31 815 Investment earnings (losses) 25,766 436 4,036 66 30,304 Interest and fiscal charges (610) (9) (11,182) (1) (11,802) Property disposition gain (loss) — (38) (750) (3) (791)
Total nonoperating revenues (expenses) 25,156 684 (7,407) 93 18,526
Income (loss) before transfersand contributions 137,186 1,524 58,807 (13,234) 184,283
Operating transfers in 23,801 — 681 — 24,482 Operating transfers out (908) (663) (14,852) (1,773) (18,196) Capital contributions — — 39 87 126
Change in net position 160,079 861 44,675 (14,920) 190,695 Total net position - beginning 180,345 (15,569) 483,965 (98,892) 549,849 Total net position - ending $ 340,424 $ (14,708) $ 528,640 $ (113,812) $ 740,544
2020 STATE OF FLORIDA CAFR
253

COMBINING STATEMENT OF CASH FLOWSINTERNAL SERVICE FUNDSFOR THE FISCAL YEAR ENDED JUNE 30, 2020 (in thousands)
EmployeeHealth andDisability
DataCenters
Communicationsand
FacilitiesCASH FLOWS FROM OPERATING ACTIVITIESCash received from customers $ 2,520,136 $ 74,987 $ 270,955 Cash paid to vendors (377,020) (45,557) (136,686) Cash paid to employees (1,616) (22,009) (22,941) Cash paid for insurance claims (2,032,153) — —
Net cash provided (used) by operating activities 109,347 7,421 111,328 CASH FLOWS FROM NONCAPITAL FINANCING
ACTIVITIESTransfers in (out) 8,446 22,792 (24,287) Advances from or repayment from other funds — (25,315) —
Net cash provided (used) by noncapital financing activities 8,446 (2,523) (24,287) CASH FLOWS FROM CAPITAL AND RELATED
FINANCING ACTIVITIESCash received from sale or lease of capital assets — 434 — Payment of bond principal — — (51,965) Payment of interest on bonds/installment purchase/capital lease — — (10,857) Purchase or construction of capital assets (2) (2,788) (20,613)
Net cash provided (used) by capital and related financing activities (2) (2,354) (83,435)
CASH FLOWS FROM INVESTING ACTIVITIESSecurity lending 12,147 415 952 Investment earnings 26,125 420 3,116
Net cash provided (used) by investing activities 38,272 835 4,068 Net increase (decrease) in cash and cash equivalents 156,063 3,379 7,674
Cash and cash equivalents - beginning 563,203 9,920 85,876 Cash and cash equivalents - ending $ 719,266 $ 13,299 $ 93,550
2020 STATE OF FLORIDA CAFR
254

COMBINING STATEMENT OF CASH FLOWSINTERNAL SERVICE FUNDSFOR THE FISCAL YEAR ENDED JUNE 30, 2020 (in thousands)
OtherTotals
6/30/20
$ 61,487 $ 2,927,565 (17,230) (576,493) (44,593) (91,159) — (2,032,153) (336) 227,760
(1,287) 5,664 — (25,315) (1,287) (19,651)
— 434 — (51,965) — (10,857) (18) (23,421)
(18) (85,809)
91 13,605 64 29,725 155 43,330 (1,486) 165,630 6,749 665,748 $ 5,263 $ 831,378
2020 STATE OF FLORIDA CAFR
255

INTERNAL SERVICE FUNDSFOR THE FISCAL YEAR ENDED JUNE 30, 2020 (in thousands)Reconciliation of operating income (loss) to net cash
provided (used) by operating activities
EmployeeHealth andDisability
DataCenters
Communicationsand
Facilities
Operating income (loss) $ 112,030 $ 840 $ 66,214
Adjustment to reconcile operating income (loss) to net cash provided (used) by operating activities:Depreciation and amortization expense 4 3,234 32,647
Changes in assets and liabilities:(Increase) decrease in accounts receivable (31,262) (2) 3,359 (Increase) decrease in due from other funds — 224 — Increase (decrease) in allowance for uncollectibles 336 2 — Increase (decrease) in accounts payable (16,810) 342 8,342 Increase (decrease) in compensated absences 57 (180) 172 Increase (decrease) in due to other funds — 15 — Increase (decrease) in unearned revenue 45,031 — (1,930) Increase (decrease) in pension liability and deferrals (76) 2,397 1,498 Increase (decrease) in OPEB liability and deferrals 37 549 1,026
Net cash provided (used) by operating activities $ 109,347 $ 7,421 $ 111,328
Noncash investing, capital, and financing activities Change in fair value of investments $ 10,591 $ 196 $ 1,083
2020 STATE OF FLORIDA CAFR
256

INTERNAL SERVICE FUNDSFOR THE FISCAL YEAR ENDED JUNE 30, 2018(in thousands)Reconciliation of operating income (loss) to net cash
provided (used) by operating activities
OtherTotals
6/30/20
$ (13,327) $ 165,757
274 36,159
1,776 (26,129) (793) (569) — 338 (217) (8,343) (348) (299) 586 601 (410) 42,691 10,294 14,113 1,829 3,441
$ (336) $ 227,760
$ 42 $ 11,912
2020 STATE OF FLORIDA CAFR
257

THIS PAGE INTENTIONALLY LEFT BLANK
258

PRIVATE-PURPOSE TRUST FUNDS
TRUST ESCROW ADMINISTRATIONThese funds administered by the Department of Financial Services are used to account for trust arrangements under which principal and income benefit individuals, private organizations, or other governments.
UNCLAIMED PROPERTYThis fund includes the internal reporting funds administered by the Department of Financial Services that are used to account for unclaimed property pursuant to Section 717.123, Florida Statutes.
STUDENT LOAN GUARANTY RESERVEThis fund administered by the Department of Education is used to account for federally guaranteed loans to Florida citizens to pay for higher education.
COLLEGE SAVINGS PLANThis fund, administered by the State Board of Administration, is used to account for contributions from participants of the College Savings Plan as authorized by Section 1009.981, Florida Statutes. Participant contributions are collected and invested in accordance with the Plan provisions and participant direction.
OTHERThis category includes other internal reporting funds administered by various agencies that are used to account for trust arrangements under which principal and income benefit individuals, private organizations, or other governments.
2020 STATE OF FLORIDA CAFR
259

COMBINING STATEMENT OF FIDUCIARY NET POSITIONPRIVATE-PURPOSE TRUST FUNDSFOR THE FISCAL YEAR ENDED JUNE 30, 2020 (in thousands)
TrustEscrow
AdministrationUnclaimedProperty
StudentLoan Guaranty
Reserve OtherASSETSCash and cash equivalents $ 1,740 $ 1,181 $ — $ 2,246 Pooled investments with State Treasury 615,989 42,695 29,250 1,371
Total cash and cash equivalents 617,729 43,876 29,250 3,617 InvestmentsU.S. government & federally guaranteed obligations — — — — Federal agencies — — — — Bonds and notes — — — — International bonds and notes — — — — Mutual fund investments — — — 19,581 Money market and short-term investments 1,366 — — 7,878 Domestic equity — 40,317 — — International equity — — — —
Total investments 1,366 40,317 — 27,459 ReceivablesAccounts receivable 9,595 1,913 — 17 Interest receivable 3,778 5 51 — Dividends receivable — — — 12 Pending investment sales — — — 498 Due from state funds — 9 201 — Due from other governments — — 4,970 —
Total receivables 13,373 1,927 5,222 527 Advances to other funds — 986,684 — — Advances to other entities 41,296 — — — Capital assets 12,135 309 — —
Accumulated depreciation — (254) — — Other assets 2,080 — — —
Total assets 687,979 1,072,859 34,472 31,603 DEFERRED OUTFLOWS OF RESOURCESPension-related items — 2,058 — — Other postemployment benefits — 980 — —
Total deferred outflows of resources — 3,038 — — LIABILITIESAccounts payable and accrued liabilities 613 40,317 — 292 Due to other funds 538 6 310 58 Pending investment purchases — — — 448 Due to other governments — — 1,447 — Obligations under security lending agreements 34,102 143 1,554 — Deposits payable 330 — — — Compensated absences — 586 — — Pension liability — 2,848 — — Other postemployment benefits liability — 5,580 — —
Total liabilities 35,583 49,480 3,311 798 DEFERRED INFLOWS OF RESOURCESPension-related items — 238 — — Other postemployment benefits — 1,111 — —
Total deferred inflows of resources — 1,349 — — NET POSITION
Restricted for individuals, organizations, and other governments $ 652,396 $ 1,025,068 $ 31,161 $ 30,805
2020 STATE OF FLORIDA CAFR
260

(in thousands)College
Savings PlanTotals
6/30/20
$ 788 $ 5,955 — 689,305 788 695,260
35,465 35,465 62,477 62,477 119,630 119,630 13,185 13,185 383,730 403,311 113,324 122,568 60,544 100,861 8,977 8,977 797,332 866,474
8 11,533 1,155 4,989 351 363 8,456 8,954 29,286 29,496 — 4,970 39,256 60,305 — 986,684 — 41,296 6 12,450 (2) (256) — 2,080 837,380 2,664,293
— 2,058 — 980 — 3,038
1,350 42,572 326 1,238 38,514 38,962 — 1,447 — 35,799 34,872 35,202 87 673 — 2,848 — 5,580 75,149 164,321
— 238 — 1,111 — 1,349
$ 762,231 $ 2,501,661
2020 STATE OF FLORIDA CAFR
261

COMBINING STATEMENT OF CHANGES IN FIDUCIARY NET POSITIONPRIVATE-PURPOSE TRUST FUNDSFOR THE FISCAL YEAR ENDED JUNE 30, 2020 (in thousands)
TrustEscrow
AdministrationUnclaimedProperty
StudentLoan Guaranty
Reserve OtherADDITIONSContributions and other depositsFees $ — $ — $ — $ 40 Grants and contributions — 9 52,114 — Fines, forfeits, settlements and judgments — 260 — — Unclaimed property remittances — 503,173 — — Receivership assets acquired 110,150 — — — Transfers in from state funds — — 66 1,328
Total contributions and other deposits 110,150 503,442 52,180 1,368 Investment incomeInterest income 26,073 120 1,353 124 Dividends — — — 372 Net increase (decrease) in fair market value — — — 596 Total investment income (loss) 26,073 120 1,353 1,092 Investment activity expense (1,864) (369) — — Net income (loss) from investing activity 24,209 (249) 1,353 1,092
Total net investment income (loss) 24,209 (249) 1,353 1,092 Other additions — 883 2,135 —
Total additions 134,359 504,076 55,668 2,460 DEDUCTIONSInsurance claims expense 6,368 — — — Interest expense 667 3 33 — Student loan default payments — — 53,464 — Payments to unclaimed property claimants — 321,914 — — Distribution to State School Fund — 130,289 — — Administrative expense 13,160 4,902 — 1,575 Transfers out to state funds — 2,789 25 — Other deductions — 735 793 4,064
Total deductions 20,195 460,632 54,315 5,639 Depositor activityDeposits 183,123 — — 13,722 Withdrawals (46,706) — — —
Excess (deficiency) of deposits over withdrawals 136,417 — — 13,722
Change in net position 250,581 43,444 1,353 10,543
Net position - beginning 401,815 981,624 29,808 20,262 Net position - ending $ 652,396 $ 1,025,068 $ 31,161 $ 30,805
2020 STATE OF FLORIDA CAFR
262

CollegeSavings Plan
Totals 6/30/20
$ 1,360 $ 1,400 99,743 151,866 4 264 — 503,173 — 110,150 3,644 5,038 104,751 771,891
10,218 37,888 7,681 8,053 8,698 9,294 26,597 55,235 (893) (3,126) 25,704 52,109
25,704 52,109 — 3,018 130,455 827,018
— 6,368 — 703 — 53,464 — 321,914 — 130,289 4,293 23,930 — 2,814 49,777 55,369 54,070 594,851
— 196,845 — (46,706)
— 150,139 76,385 382,306
685,846 2,119,355 $ 762,231 $ 2,501,661
2020 STATE OF FLORIDA CAFR
263

THIS PAGE INTENTIONALLY LEFT BLANK
264

PENSION AND OTHER EMPLOYEE BENEFITS TRUST FUNDS
DEFINED BENEFIT PENSION PLANThis category includes those internal reporting funds primarily administered by the Department of Management Services, Division of Retirement, to account for operations of the Florida Retirement System’s defined benefit pension plan.
OTHER DEFINED CONTRIBUTION PLANSThis category includes those internal reporting funds administered by the Department of Management Services, Division of Retirement, to account for operations of the state’s other defined contribution plans.
DEFERRED COMPENSATION PLANThis category includes those internal reporting funds administered by the Department of Financial Services to account for operations of government employees' deferred compensation plan.
LIFE AND OTHER BENEFITSThis category includes those internal reporting funds primarily administered by the Department of Management Services to account for state employees' life and other plans.
RETIREE HEALTH INSURANCE SUBSIDYThis category includes internal reporting funds administered by the Department of Management Services, Division of Retirement, to hold and invest the contributions paid by employers on behalf of their employees who are members of a state-administered retirement plan, and to pay benefits to which such employees or their beneficiaries may become entitled.
DEFINED CONTRIBUTION PENSION PLANThis category includes those internal reporting funds administered by the Department of Management Services, Division of Retirement, and State Board of Administration to account for operations of the Florida Retirement System’s defined contribution pension plan.
NATIONAL GUARD SUPPLEMENTAL RETIREMENT BENEFIT PLANThis category includes the internal reporting fund, defined benefit plan, administered by the Department of Management Services, Division of Retirement, to account for operations of the National Guard supplemental retirement benefit plan.
2020 STATE OF FLORIDA CAFR
265

COMBINING STATEMENT OF FIDUCIARY NET POSITIONPENSION AND OTHER EMPLOYEE BENEFITS TRUST FUNDSFOR THE FISCAL YEAR ENDED JUNE 30, 2020 (in thousands)
DefinedBenefit
Pension Plan
Other DefinedContribution
Plans
DeferredCompensation
PlanLife and Other
BenefitsASSETSCash and cash equivalents $ 92,969 $ — $ — $ — Pooled investments with State Treasury 90,129 16,823 1,775 25,430
Total cash and cash equivalents 183,098 16,823 1,775 25,430 InvestmentsU.S. government & federally guaranteed obligations 14,837,162 — — — Federal agencies 8,169,761 — — — Commercial paper 1,127,836 — — — Repurchase agreements 800,000 — — — Bonds and notes 9,023,625 — 2,013,664 — International bonds and notes 2,448,364 — — — Real estate contracts 11,996,483 — — — Mutual fund investments — — 2,693,848 — Money market and short-term investments 238,806 — — — Domestic equity 48,275,740 — 35,967 — Alternative investments 28,780,594 — — — International equity 31,129,943 — 3,911 — International equity commingled 7,089,845 — — — Deferred compensation annuities — — 14,270 — Self-directed brokerage investments — — — — Other investments 15,838 — — —
Total investments 163,933,997 — 4,761,660 — ReceivablesAccounts receivable 18,686 — — 2,131 State contributions receivable 327 4 — — Nonstate contributions receivable 242,254 12 — — Interest receivable 137,050 17 3 53 Dividends receivable 207,825 — — — Pending investment sales 1,073,650 — — — Foreign currency contracts receivable 97,986 — — — Due from state funds 41,118 — — —
Total receivables 1,818,896 33 3 2,184 Security lending collateral 1,830,474 — — — Capital assets 1,315 — — 22 Accumulated depreciation (702) — — (9) Other assets 5,346 — — —
Total assets 167,772,424 16,856 4,763,438 27,627 DEFERRED OUTFLOWS OF RESOURCESPension-related items — 30 — 104 Other postemployment benefits 2,577 26 — 61
Total deferred outflows of resources 2,577 56 — 165 LIABILITIESAccounts payable and accrued liabilities 176,808 129 — 3,244 Due to other funds 26,413 1,388 — 2,146 DROP 298,096 — — — Pending investment purchases 3,657,896 — — — Short sell obligations 64,604 — — — Foreign currency contracts payable 98,021 — — — Broker rebate fees 58 — — — Obligations under security lending agreements 1,846,619 482 95 1,102 Deposits payable 19,101 8,118 — 14,958 Compensated absences 1,069 3 — 65 Pension liability — 83 — 281 Other postemployment benefits liability 14,503 177 — 443
Total liabilities 6,203,188 10,380 95 22,239 DEFERRED INFLOWS OF RESOURCESPension-related items — 47 — 164 Other postemployment benefits 3,548 32 — 79
Total deferred inflows of resources 3,548 79 — 243 NET POSITION
Restricted for pension benefits and other purposes $ 161,568,265 $ 6,453 $ 4,763,343 $ 5,310
2020 STATE OF FLORIDA CAFR
266

Retiree HealthInsuranceSubsidy
DefinedContributionPension Plan
National GuardSupplemental
Retirement BenefitTotals
6/30/20
$ 2 $ 50 $ — $ 93,021 53 50,692 — 184,902
55 50,742 — 277,923
— 89,924 — 14,927,086 — 123,899 — 8,293,660 — — — 1,127,836 — — — 800,000 — 131,935 — 11,169,224 — 25,927 — 2,474,291 — — — 11,996,483 — 8,693,541 — 11,387,389 324,936 1,116,372 — 1,680,114 — 521,096 — 48,832,803 — — — 28,780,594 — 24,357 — 31,158,211 — — — 7,089,845 — — — 14,270 — 817,186 — 817,186 — — — 15,838
324,936 11,544,237 — 180,564,830
28 1,230 — 22,075 16 319 — 666 41,026 53,790 — 337,082 — 1,279 — 138,402 — 1,274 — 209,099 — 53,589 — 1,127,239 — — — 97,986 12,205 14,940 — 68,263
53,275 126,421 — 2,000,812 — — — 1,830,474 — — — 1,337 — — — (711) — — — 5,346
378,266 11,721,400 — 184,680,011
— — — 134 — — — 2,664
— — — 2,798
5 3,595 — 183,781 — 47,284 — 77,231 — — — 298,096 — 98,691 — 3,756,587 — — — 64,604 — — — 98,021 — — — 58 — — — 1,848,298 — — — 42,177 — — — 1,137 — — — 364 — — — 15,123
5 149,570 — 6,385,477
— — — 211 — — — 3,659
— — — 3,870
$ 378,261 $ 11,571,830 $ — $ 178,293,462
2020 STATE OF FLORIDA CAFR
267
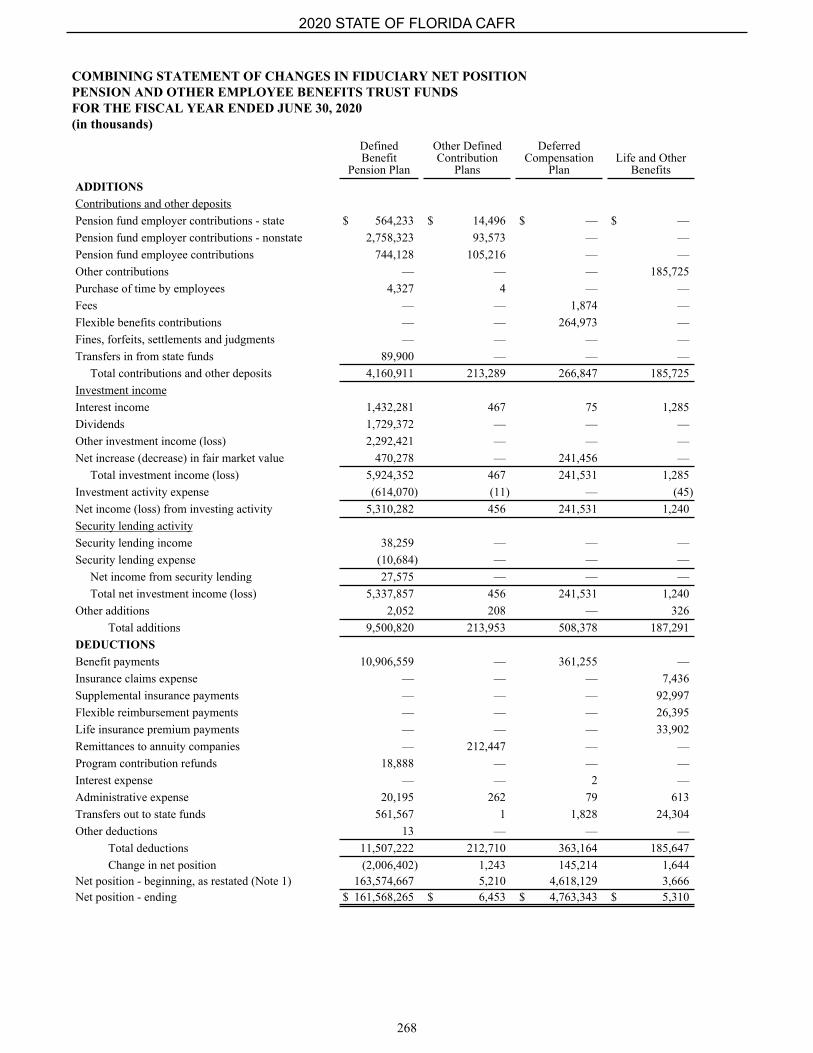
COMBINING STATEMENT OF CHANGES IN FIDUCIARY NET POSITIONPENSION AND OTHER EMPLOYEE BENEFITS TRUST FUNDSFOR THE FISCAL YEAR ENDED JUNE 30, 2020 (in thousands)
DefinedBenefit
Pension Plan
Other DefinedContribution
Plans
DeferredCompensation
PlanLife and Other
BenefitsADDITIONSContributions and other depositsPension fund employer contributions - state $ 564,233 $ 14,496 $ — $ — Pension fund employer contributions - nonstate 2,758,323 93,573 — — Pension fund employee contributions 744,128 105,216 — — Other contributions — — — 185,725 Purchase of time by employees 4,327 4 — — Fees — — 1,874 — Flexible benefits contributions — — 264,973 — Fines, forfeits, settlements and judgments — — — — Transfers in from state funds 89,900 — — —
Total contributions and other deposits 4,160,911 213,289 266,847 185,725 Investment incomeInterest income 1,432,281 467 75 1,285 Dividends 1,729,372 — — — Other investment income (loss) 2,292,421 — — — Net increase (decrease) in fair market value 470,278 — 241,456 —
Total investment income (loss) 5,924,352 467 241,531 1,285 Investment activity expense (614,070) (11) — (45) Net income (loss) from investing activity 5,310,282 456 241,531 1,240 Security lending activitySecurity lending income 38,259 — — — Security lending expense (10,684) — — —
Net income from security lending 27,575 — — — Total net investment income (loss) 5,337,857 456 241,531 1,240
Other additions 2,052 208 — 326 Total additions 9,500,820 213,953 508,378 187,291
DEDUCTIONSBenefit payments 10,906,559 — 361,255 — Insurance claims expense — — — 7,436 Supplemental insurance payments — — — 92,997 Flexible reimbursement payments — — — 26,395 Life insurance premium payments — — — 33,902 Remittances to annuity companies — 212,447 — — Program contribution refunds 18,888 — — — Interest expense — — 2 — Administrative expense 20,195 262 79 613 Transfers out to state funds 561,567 1 1,828 24,304 Other deductions 13 — — —
Total deductions 11,507,222 212,710 363,164 185,647 Change in net position (2,006,402) 1,243 145,214 1,644
Net position - beginning, as restated (Note 1) 163,574,667 5,210 4,618,129 3,666 Net position - ending $ 161,568,265 $ 6,453 $ 4,763,343 $ 5,310
2020 STATE OF FLORIDA CAFR
268

Retiree HealthInsuranceSubsidy
DefinedContributionPension Plan
National GuardSupplemental
Retirement BenefitTotals
6/30/20
$ 79,917 $ 77,281 $ — $ 735,927 496,336 316,378 — 3,664,610 370 232,874 — 1,082,588 — — — 185,725 — 10 — 4,341 — — — 1,874 — — — 264,973 — 6 — 6 — 560,218 15,129 665,247 576,623 1,186,767 15,129 6,605,291
5,054 10,264 — 1,449,426 — 37,723 — 1,767,095 81 130 — 2,292,632 5 239,084 — 950,823 5,140 287,201 — 6,459,976 — (5,547) — (619,673) 5,140 281,654 — 5,840,303
— — — 38,259 — — — (10,684) — — — 27,575 5,140 281,654 — 5,867,878 175 17,960 — 20,721 581,938 1,486,381 15,129 12,493,890
505,549 1,112,354 15,121 12,900,838 — — — 7,436 — — — 92,997 — — — 26,395 — — — 33,902 — — — 212,447 — — — 18,888 — — — 2 170 5,811 8 27,138 1 109,076 — 696,777 — — — 13 505,720 1,227,241 15,129 14,016,833 76,218 259,140 — (1,522,943) 302,043 11,312,690 — 179,816,405 $ 378,261 $ 11,571,830 $ — $ 178,293,462
2020 STATE OF FLORIDA CAFR
269

THIS PAGE INTENTIONALLY LEFT BLANK
270

INVESTMENT TRUST FUNDS
EXTERNAL TREASURY POOLThis fund, administered by the State Treasury, is used to account for the external portion of the State Treasurer’s Investment Pool.
INVESTMENT POOL AThis fund, administered by the State Board of Administration, is used to account for the external portion of the Local Government Surplus Funds Trust Fund (an investment pool) reported by the state.
2020 STATE OF FLORIDA CAFR
271

COMBINING STATEMENT OF FIDUCIARY NET POSITIONINVESTMENT TRUST FUNDSFOR THE FISCAL YEAR ENDED JUNE 30, 2020 (in thousands)
External Treasury Pool
Investment Pool A
Totals 6/30/20
ASSETSCash and cash equivalents $ — $ 1,776,700 $ 1,776,700 Pooled investments with State Treasury 827,544 — 827,544 Total cash and cash equivalents 827,544 1,776,700 2,604,244
InvestmentsCertificates of deposit — 2,671,483 2,671,483 U. S. government & federally guaranteed obligations — 1,250,934 1,250,934 Commercial paper — 5,580,276 5,580,276 Repurchase agreements — 1,447,681 1,447,681 Bonds and notes — 31,257 31,257 Money market and short-term investments — 715,976 715,976 Total investments — 11,697,607 11,697,607
ReceivablesInterest receivable 1,443 2,911 4,354 Total receivables 1,443 2,911 4,354 Other assets — 21 21 Total assets 828,987 13,477,239 14,306,226
LIABILITIESAccounts payable and accrued liabilities — 745 745 Due to other funds — 110 110 Pending investment purchases — 176,328 176,328 Obligations under security lending agreements 46,272 — 46,272 Total liabilities 46,272 177,183 223,455 NET POSITIONRestricted for pool participants $ 782,715 $ 13,300,056 $ 14,082,771
2020 STATE OF FLORIDA CAFR
272

COMBINING STATEMENT OF CHANGES IN FIDUCIARY NET POSITIONINVESTMENT TRUST FUNDSFOR THE FISCAL YEAR ENDED JUNE 30, 2020 (in thousands)
ExternalTreasury Pool
InvestmentPool A
Totals6/30/20
ADDITIONSContributions and other depositsFines, forfeits, settlements and judgments $ — $ 291 $ 291
Total contributions and other deposits — 291 291 Investment incomeInterest income 36,297 212,608 248,905 Net increase (decrease) in fair market value — 362 362
Total investment income (loss) 36,297 212,970 249,267 Investment activity expense (735) (4,039) (4,774) Net income (loss) from investing activity 35,562 208,931 244,493
Total net investment income (loss) 35,562 208,931 244,493 Total additions 35,562 209,222 244,784
DEDUCTIONSAdministrative expense — 51 51
Total deductions — 51 51 Depositor activityDeposits 465,780 26,398,366 26,864,146 Withdrawals (190,797) (24,734,330) (24,925,127)
Excess (deficiency) of deposits over withdrawals 274,983 1,664,036 1,939,019 Change in net position 310,545 1,873,207 2,183,752
Net position - beginning 472,170 11,426,849 11,899,019
Net position - ending $ 782,715 $ 13,300,056 $ 14,082,771
2020 STATE OF FLORIDA CAFR
273

THIS PAGE INTENTIONALLY LEFT BLANK
274

AGENCY FUNDS
TAX DISTRIBUTION AND ADMINISTRATIONThese agency funds, administered by the Department of Revenue, are primarily used to account for taxes collected by the Department that are held for other municipalities, local governments, or outside entities.
OTHERThese agency funds, administered by various agencies, are used to account for resources held in trust for entities outside of the State government and for the asset and liability balance related to retiree health care.
FLORIDA SCHOOL FOR THE DEAF AND THE BLINDThese agency funds, administered by the School for the Deaf and the Blind, are used to account for resources held for students.
STATE BOARD OF ADMINISTRATIONThese agency funds, administered by the State Board of Administration, are primarily used to account for escrowed bond funds.
2020 STATE OF FLORIDA CAFR
275

THIS PAGE INTENTIONALLY LEFT BLANK
276

COMBINING STATEMENT OF FIDUCIARY NET POSITIONAGENCY FUNDSFOR THE FISCAL YEAR ENDED JUNE 30, 2020 (in thousands)
TaxDistribution
andAdministration Other
School forthe Deafand theBlind
State Boardof
AdministrationTotals
6/30/20
ASSETSCash and cash equivalents $ 89 $ 66,257 $ 41 $ 1 $ 66,388 Pooled investments with State Treasury 638,515 307,204 — — 945,719
Total cash and cash equivalents 638,604 373,461 41 1 1,012,107 InvestmentsU.S. government & federally guaranteed obligations — — — 37,414 37,414
Other investments — 200 — — 200 Total investments — 200 — 37,414 37,614
ReceivablesAccounts receivable 622,843 90,361 — — 713,204 Interest receivable — 519 — 436 955 Due from state funds 241,695 12,786 — — 254,481
Total receivables 864,538 103,666 — 436 968,640 Total assets $ 1,503,142 $ 477,327 $ 41 $ 37,851 $ 2,018,361
LIABILITIESAccounts payable and accrued liabilities $ 709,772 $ 47,273 $ 41 $ — $ 757,086 Due to other funds 110,785 144,013 — 3 254,801 Due to other governments 682,585 32,044 — — 714,629 Obligations under security lending agreements — 15,979 — — 15,979 Claims payable — 17,212 — — 17,212 Deposits payable — 220,646 — 37,848 258,494 Other liabilities — 160 — — 160
Total liabilities $ 1,503,142 $ 477,327 $ 41 $ 37,851 $ 2,018,361
2020 STATE OF FLORIDA CAFR
277

COMBINING STATEMENT OF CHANGES IN ASSETS AND LIABILITIESAGENCY FUNDSFOR THE FISCAL YEAR ENDED JUNE 30, 2020 (in thousands)
Tax Distribution and Administration Balance
6/30/2019 Additions DeductionsBalance
6/30/2020ASSETSCash and cash equivalents $ 128 $ 3 $ 42 $ 89 Pooled investments with State Treasury 824,611 14,191,232 14,377,328 638,515 Accounts receivable 472,805 306,719 156,681 622,843 Due from state funds 132,547 112,832 3,684 241,695
Total assets $ 1,430,091 $ 14,610,786 $ 14,537,735 $ 1,503,142 LIABILITIESAccounts payable and accrued liabilities $ 570,746 $ 139,123 $ 97 $ 709,772 Due to other funds 83,056 29,442 1,713 110,785 Due to other governments 776,289 19,065 112,769 682,585
Total liabilities $ 1,430,091 $ 187,630 $ 114,579 $ 1,503,142 OtherASSETSCash and cash equivalents $ 77,679 $ 286,200 $ 297,622 $ 66,257 Pooled investments with State Treasury 277,793 6,877,270 6,847,859 307,204 Other investments 100 100 — 200 Accounts receivable 83,358 31,681 24,678 90,361 Interest receivable 631 536 648 519 Due from state funds 21,570 12,786 21,570 12,786
Total assets $ 461,131 $ 7,208,573 $ 7,192,377 $ 477,327 LIABILITIESAccounts payable and accrued liabilities $ 37,472 $ 390,418 $ 380,617 $ 47,273 Due to other funds 124,726 144,015 124,727 144,014 Due to other governments 32,739 32,044 32,739 32,044 Obligations under security lending agreements 10,240 5,739 — 15,979 Claims payable 19,511 17,212 19,511 17,212 Deposits payable 236,337 67,859 83,551 220,645 Other liabilities 106 54 — 160
Total liabilities $ 461,131 $ 657,341 $ 641,145 $ 477,327 School for the Deaf and the Blind ASSETSCash and cash equivalents $ 40 $ 65 $ 64 $ 41
Total assets $ 40 $ 65 $ 64 $ 41 LIABILITIESAccounts payable and accrued liabilities $ 40 $ 20 $ 19 $ 41
Total liabilities $ 40 $ 20 $ 19 $ 41
2020 STATE OF FLORIDA CAFR
278

COMBINING STATEMENT OF CHANGES IN ASSETS AND LIABILITIESAGENCY FUNDSFOR THE FISCAL YEAR ENDED JUNE 30, 2020 (in thousands)
State Board of Administration Balance
6/30/2019 Additions DeductionsBalance
6/30/2020ASSETSCash and cash equivalents $ 3 $ 2,997,521 $ 2,997,523 $ 1 U.S. government & federally guaranteed obligations 809,571 2,250 774,407 37,414 Interest receivable 5,653 8,336 13,553 436 Pending investment sales 92,676 1,460,386 1,553,062 —
Total assets $ 907,903 $ 4,468,493 $ 5,338,545 $ 37,851 LIABILITIESDue to other funds $ 33 $ 24 $ 54 $ 3 Deposits payable 907,870 1,441,490 2,311,512 37,848
Total liabilities $ 907,903 $ 1,441,514 $ 2,311,566 $ 37,851 Totals - All Agency Funds ASSETSCash and cash equivalents $ 77,850 $ 3,283,789 $ 3,295,251 $ 66,388 Pooled investments with State Treasury 1,102,404 21,068,502 21,225,187 945,719 U.S. government & federally guaranteed obligations 809,571 2,250 774,407 37,414 Other investments 100 100 — 200 Accounts receivable 556,163 338,400 181,359 713,204 Interest receivable 6,284 8,872 14,201 955 Pending investment sales 92,676 1,460,386 1,553,062 — Due from state funds 154,117 125,618 25,254 254,481
Total assets $ 2,799,165 $ 26,287,917 $ 27,068,721 $ 2,018,361 LIABILITIESAccounts payable and accrued liabilities $ 608,258 $ 529,561 $ 380,733 $ 757,086 Due to other funds 207,815 173,481 126,494 254,802 Due to other governments 809,028 51,109 145,508 714,629 Obligations under security lending agreements 10,240 5,739 — 15,979 Claims payable 19,511 17,212 19,511 17,212 Deposits payable 1,144,207 1,509,349 2,395,063 258,493 Other liabilities 106 54 — 160
Total liabilities $ 2,799,165 $ 2,286,505 $ 3,067,309 $ 2,018,361
2020 STATE OF FLORIDA CAFR
279

THIS PAGE INTENTIONALLY LEFT BLANK
280

NONMAJOR COMPONENT UNITS
WATER MANAGEMENT DISTRICTSThese districts were created in accordance with Section 373.069, Florida Statutes, to provide for the management and conservation of water and related land resources. Refer to Note 1 for additional information.
OTHER STATE UNIVERSITIESThis category includes 11 state universities. Refer to Note 1 for additional information.
FLORIDA COLLEGESThis category includes 28 Florida College System Institutions. Refer to Note 1 for additional information.
OTHER NONMAJOR COMPONENT UNITSOther nonmajor component units include various foundations and not-for-profit organizations. Refer to Note 1 for additional information.
2020 STATE OF FLORIDA CAFR
281

THIS PAGE INTENTIONALLY LEFT BLANK
282

COMBINING STATEMENT OF NET POSITIONNONMAJOR COMPONENT UNITSFOR THE FISCAL YEAR ENDED JUNE 30, 2020 (in thousands)
WaterManagement
Districts
OtherState
UniversitiesFlorida
Colleges
OtherNonmajor
ComponentUnits
Totals6/30/20
ASSETSCash and cash equivalents $ 72,721 $ 403,153 $ 76,810 $ 520,550 $ 1,073,234 Pooled investments with State Treasury 83,113 1,451,123 219,634 22,062 1,775,932 Other investments 705,653 1,965,679 995,654 1,719,115 5,386,101 Receivables, net 19,667 472,839 346,401 120,682 959,589 Due from component units/primary 72,743 327,095 36,540 15,440 451,818 Inventories 5,933 9,739 9,399 12,188 37,259 Restricted cash and cash equivalents — 108,030 284,849 102,505 495,384 Restricted pooled investments with State Treasury — 268,645 398,824 — 667,469 Restricted investments 433,508 2,550,061 1,103,697 100,777 4,188,043 Other loans and notes receivable, net — 97,374 — 844 98,218 Other assets 13,047 287,279 83,864 6,411 390,601 Capital assets, net 8,165,442 9,308,702 4,348,308 671,976 22,494,428
Total assets 9,571,827 17,249,719 7,903,980 3,292,550 38,018,076 DEFERRED OUTFLOWS OF RESOURCES
Accum. decrease in fair value-hedging derivatives — 21,176 — — 21,176 Grants paid in advance 15 — — — 15 Amount deferred on refunding of debt 1,120 27,737 — — 28,857 Pension-related items 53,308 714,366 438,418 56,641 1,262,733 Other postemployment benefits 3,388 458,466 20,971 2,816 485,641
Total deferred outflows of resources 57,831 1,221,745 459,389 59,457 1,798,422 LIABILITIES
Accounts payable and accrued liabilities 145,637 389,259 314,677 108,070 957,643 Due to component units/primary — 17,468 24,811 561 42,840 Long-term liabilities
Due within one year 72,950 439,561 137,767 35,252 685,530 Due in more than one year 647,901 6,746,488 1,713,081 1,263,971 10,371,441
Total liabilities 866,488 7,592,776 2,190,336 1,407,854 12,057,454 DEFERRED INFLOWS OF RESOURCES
Deferred service concession arrangement receipts — 113,943 — 243 114,186 Grants received in advance — 1,535 — — 1,535 Amount deferred on refunding of debt — 240 — — 240 Pension-related items 24,711 113,889 128,863 10,090 277,553 Other postemployment benefits 4,997 338,745 21,341 4,101 369,184 Irrevocable split-interest agreements — 38,586 1,406 746 40,738
Total deferred inflows of resources 29,708 606,938 151,610 15,180 803,436 NET POSITION
Net investment in capital assets 7,761,828 7,312,320 4,136,248 651,287 19,861,683 Restricted for
Debt service — 35,777 2,561 — 38,338 Other 593,234 1,821,767 1,635,894 762,134 4,813,029
Funds held for permanent endowmentExpendable — 258,273 229,831 — 488,104 Nonexpendable — 1,755,486 502,931 3,067 2,261,484
Unrestricted 378,400 (911,873) (486,042) 512,485 (507,030) Total net position $ 8,733,462 $ 10,271,750 $ 6,021,423 $ 1,928,973 $ 26,955,608
2020 STATE OF FLORIDA CAFR
283
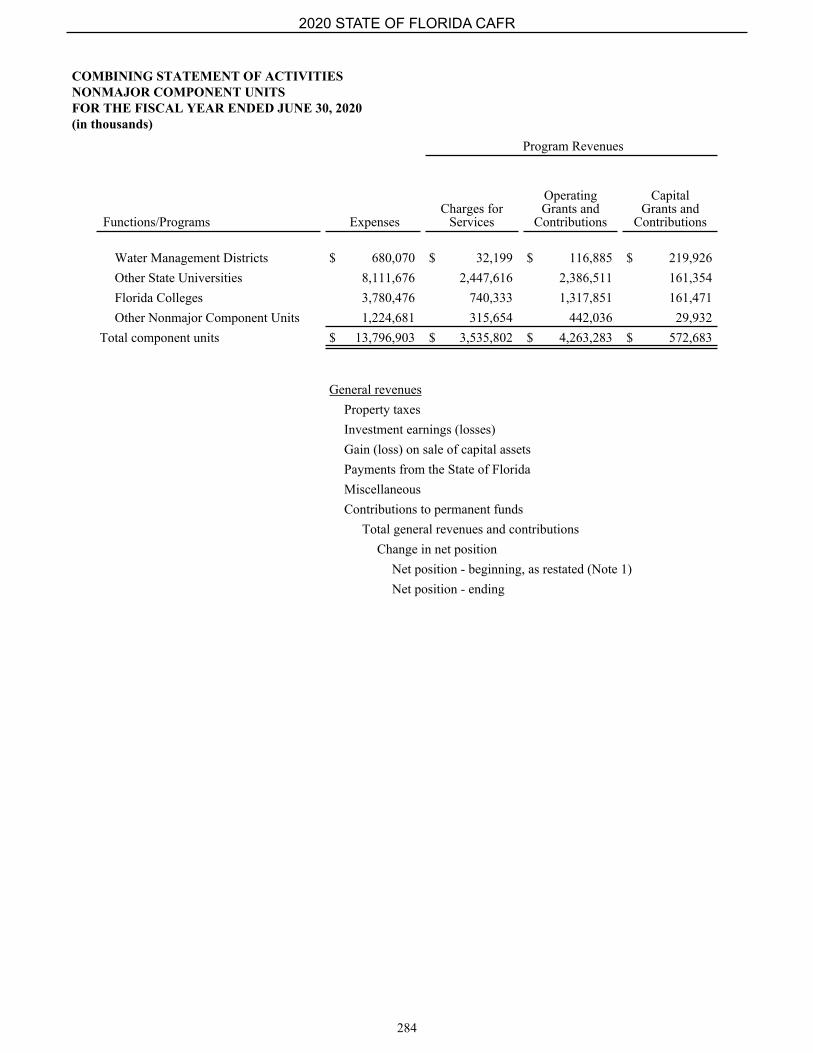
COMBINING STATEMENT OF ACTIVITIESNONMAJOR COMPONENT UNITSFOR THE FISCAL YEAR ENDED JUNE 30, 2020 (in thousands)
Program Revenues
Functions/Programs Expenses Charges for
Services
OperatingGrants and
Contributions
CapitalGrants and
Contributions
Water Management Districts $ 680,070 $ 32,199 $ 116,885 $ 219,926 Other State Universities 8,111,676 2,447,616 2,386,511 161,354 Florida Colleges 3,780,476 740,333 1,317,851 161,471 Other Nonmajor Component Units 1,224,681 315,654 442,036 29,932
Total component units $ 13,796,903 $ 3,535,802 $ 4,263,283 $ 572,683
General revenuesProperty taxesInvestment earnings (losses)Gain (loss) on sale of capital assetsPayments from the State of FloridaMiscellaneousContributions to permanent funds
Total general revenues and contributionsChange in net position
Net position - beginning, as restated (Note 1)Net position - ending
2020 STATE OF FLORIDA CAFR
284

Net (Expense) Revenue and Changes in Net Position
WaterManagement
Districts
OtherState
UniversitiesFlorida
Colleges
OtherNonmajor
ComponentUnits
Totals6/30/20
$ (311,060) $ — $ — $ — $ (311,060) — (3,116,195) — — (3,116,195) — — (1,560,821) — (1,560,821) — — — (437,059) (437,059) (311,060) (3,116,195) (1,560,821) (437,059) (5,425,135)
498,201 — — — 498,201 57,536 179,567 88,881 130,947 456,931 (1) (10,327) (8,686) — (19,014) — 2,372,319 1,260,595 328,599 3,961,513 8,915 427,337 129,509 87,829 653,590 — 35,267 10,961 — 46,228 564,651 3,004,163 1,481,260 547,375 5,597,449 253,591 (112,032) (79,561) 110,316 172,314 8,479,871 10,383,782 6,100,984 1,818,657 26,783,294 $ 8,733,462 $ 10,271,750 $ 6,021,423 $ 1,928,973 $ 26,955,608
2020 STATE OF FLORIDA CAFR
285

THIS PAGE INTENTIONALLY LEFT BLANK
286

STATISTICAL SECTION

THIS PAGE INTENTIONALLY LEFT BLANK
288

STATISTICAL SECTION
Table of Contents
This section of the State of Florida’s CAFR provides additional detailed information for use in assessing the financial condition of the government.
PAGEFinancial Trends - These schedules contain trend information to help assess how the state's financial position has
changed over time.
Schedule A-1 - Net Position by Component............................................................................................................ 290Schedule A-2 - Changes in Net Position.................................................................................................................. 292Schedule A-3 - Fund Balances - Governmental Funds............................................................................................ 296Schedule A-4 - Changes in Fund Balances - Governmental Funds......................................................................... 298
Revenue Capacity - These schedules present information on the state’s most significant revenue sources and can assist with evaluating the government’s ability to produce its own-source revenues.
Schedule B-1 - Revenue Base/Rate.......................................................................................................................... 300Schedule B-2 - Principal Sales Tax Payers by Industry........................................................................................... 302
Debt Capacity - These schedules may assist with an understanding of the state’s outstanding debt and its ability to issue new debt.
Schedule C-1 - Ratios of Outstanding Debt by Type............................................................................................... 304Schedule C-2 - Ratios of Net General Bonded Debt Outstanding........................................................................... 306Schedule C-3 - Legal Debt Margin.......................................................................................................................... 307Schedule C-4 - Pledged-Revenue Coverage............................................................................................................. 308
Demographic and Economic Information - These schedules include demographic and economic information to communicate the state’s socioeconomic environment. These schedules can assist with evaluating financial statement information in context with this historical data as well as among governments.
Schedule D-1 - Demographic and Economic Statistics............................................................................................ 314Schedule D-2 - Industry Sector Employment........................................................................................................... 316
Operating Information - These schedules include operating data to assist with understanding how information in the state’s financial reports relate to services provided or activities performed by the state.
Schedule E-1 - Full-time Equivalent State Employees by Function........................................................................ 318Schedule E-2 - Operating Indicators by Function.................................................................................................... 320Schedule E-3 - Capital Assets by Function.............................................................................................................. 322
2020 STATE OF FLORIDA CAFR
289

Net Position by Component SCHEDULE A-1For the Last Ten Fiscal Years(in thousands)(Accrual Basis of Accounting)
Fiscal Year2011 2012 2013 2014 2015
Governmental ActivitiesNet investment in capital assets $ 57,100,033 $ 58,403,581 $ 59,994,370 $ 61,727,674 $ 63,937,059 Restricted Natural resources, environment, and growth management 2,359,437 2,409,211 2,533,998 2,672,904 2,930,848
Public Education 700,343 593,657 390,829 502,820 778,229 Health and Family Services 2,117,546 1,042,253 1,562,739 1,771,369 1,258,290 Transportation 1,440,141 1,706,083 1,665,701 2,475,460 2,121,855 Nonmajor governmental funds 1,401,380 1,195,232 1,137,373 1,100,467 1,096,687 Debt service 286,787 289,922 280,048 263,030 248,102 Other 173,331 571,203 557,025 482,457 523,957
Unrestricted (15,117,243) (13,435,170) (10,774,051) (9,773,999) (12,370,358)
Total governmental activities net position $ 50,461,755 $ 52,775,972 $ 57,348,032 $ 61,222,182 60,524,669
Percent change from prior year 2.46 % 4.59 % 8.66 % 6.76 % -1.14 %
Business-type ActivitiesNet investment in capital assets $ 5,256,229 $ 5,365,538 $ 5,841,079 $ 6,789,610 $ 7,543,562 Restricted
Transportation — 283,979 168,934 316,989 312,992 Lottery 120,722 135,245 102,088 93,419 95,094 Prepaid College Program 591,401 565,037 829,845 1,792,466 1,507,552 Hurricane Catastrophe Fund 4,729,314 6,424,436 8,295,259 10,160,217 11,632,636 Reemployment Assistance (1,058,871) — 1,158,339 2,044,428 2,797,525 Other 279,983 90 4,165 9,144 2,658
Unrestricted 549,270 617,183 889,008 951,037 893,680
Total business-type activities net position $ 10,468,048 $ 13,391,508 $ 17,288,717 $ 22,157,310 $ 24,785,699
Percent change from prior year 19.81 % 27.93 % 29.10 % 28.16 % 11.86 %
Total Primary GovernmentNet investment in capital assets $ 62,356,262 $ 63,769,119 $ 65,835,449 $ 68,517,284 $ 71,480,621 Restricted Natural resources, environment, and growth management 2,359,437 2,409,211 2,533,998 2,672,904 2,930,848
Public Education 700,343 593,657 390,829 502,820 778,229 Health and Family Services 2,117,546 1,042,253 1,562,739 1,771,369 1,258,290 Transportation 1,440,141 1,990,062 1,834,635 2,792,449 2,434,847 Nonmajor governmental funds 1,401,380 1,195,232 1,137,373 1,100,467 1,096,687 Debt service 286,787 289,922 280,048 263,030 248,102 Lottery 120,722 135,245 102,088 93,419 95,094 Prepaid College Program 591,401 565,037 829,845 1,792,466 1,507,552 Hurricane Catastrophe Fund 4,729,314 6,424,436 8,295,259 10,160,217 11,632,636 Reemployment Assistance (1,058,871) — 1,158,339 2,044,428 2,797,525 Other 453,314 571,293 561,190 491,601 526,615
Unrestricted (14,567,973) (12,817,987) (9,885,043) (8,822,962) (11,476,678)
Total primary government net position $ 60,929,803 $ 66,167,480 $ 74,636,749 $ 83,379,492 $ 85,310,368
Percent change from prior year 5.08 % 8.60 % 12.80 % 11.71 % 2.32 %
Note: Reporting standards require that net position be reported in three components in the financial statements: net investment in capital assets; restricted; and unrestricted. See Schedule A-2 for changes in net position from year to year.
2020 STATE OF FLORIDA CAFR
290

Net Position by Component SCHEDULE A-1For the Last Ten Fiscal Years
(in thousands)(Accrual Basis of Accounting)
Fiscal Year2016 2017 2018 2019 2020
$ 66,196,839 $ 69,021,627 $ 70,555,222 $ 72,831,994 $ 75,163,014
3,188,567 3,354,846 3,477,284 3,895,031 4,170,683 742,292 701,059 597,870 533,623 405,676 1,592,259 1,796,164 1,850,079 1,759,456 1,781,785 1,942,833 1,630,744 1,701,574 1,742,579 1,698,367 1,132,748 1,182,019 1,197,583 1,451,488 1,269,395 252,056 217,884 162,511 80,368 30,391 635,617 678,388 639,860 769,906 700,498 (12,006,653) (12,401,193) (17,686,725) (16,241,118) (15,549,592)
$ 63,676,558 $ 66,181,538 $ 62,495,258 $ 66,823,327 $ 69,670,217
5.21 % 3.93 % -5.57 % 6.93 % 4.26 %
$ 7,766,815 $ 8,652,433 $ 10,521,410 $ 10,933,870 $ 12,022,039
317,355 298,572 250,887 432,848 249,847 121,932 95,499 91,991 130,558 139,270 1,657,880 2,367,619 2,954,127 3,700,748 3,566,380 12,771,922 13,980,584 12,700,446 10,288,180 10,351,755 3,337,397 3,737,155 3,951,714 4,144,120 2,318,051 1,296 467 12,286 5,744 2,132 1,282,592 1,274,131 987,199 1,137,521 844,697
$ 27,257,189 $ 30,406,460 $ 31,470,060 $ 30,773,589 $ 29,494,171
9.97 % 11.55 % 3.50 % -2.26 % -4.16 %
$ 73,963,654 $ 77,674,060 $ 81,076,632 $ 83,765,864 $ 87,185,053
3,188,567 3,354,846 3,477,284 3,895,031 4,170,683 742,292 701,059 597,870 533,623 405,676 1,592,259 1,796,164 1,850,079 1,759,456 1,781,785 2,260,188 1,929,316 1,952,461 2,175,427 1,948,214 1,132,748 1,182,019 1,197,583 1,451,488 1,269,395 252,056 217,884 162,511 80,368 30,391 121,932 95,499 91,991 130,558 139,270 1,657,880 2,367,619 2,954,127 3,700,748 3,566,380 12,771,922 13,980,584 12,700,446 10,288,180 10,351,755 3,337,397 3,737,155 3,951,714 4,144,120 2,318,051 636,913 678,855 652,146 775,650 702,630 (10,724,061) (11,127,062) (16,699,526) (15,103,597) (14,704,895)
$ 90,933,747 $ 96,587,998 $ 93,965,318 $ 97,596,916 $ 99,164,388
6.59 % 6.22 % -2.72 % 3.72 % 1.61 %
2020 STATE OF FLORIDA CAFR
291

Changes in Net Position SCHEDULE A-2For the Last Ten Fiscal Years(in thousands)(Accrual Basis of Accounting)
Fiscal Year2011 2012 2013 2014 2015
ExpensesGovernmental activities:
General government $ 6,830,398 $ 6,342,471 $ 6,430,345 $ 6,057,247 $ 6,451,450 Education 20,423,515 17,695,809 17,807,322 19,316,440 19,642,993 Human services 29,040,946 29,650,274 30,770,664 32,971,959 34,302,877 Criminal justice and corrections 4,534,992 4,245,923 4,186,869 3,847,359 3,863,258 Natural resources and environment 2,339,268 2,265,464 2,374,092 2,497,934 2,537,376 Transportation 3,613,936 3,614,062 3,543,133 3,851,085 4,031,701 Judicial branch 435,153 409,441 455,878 487,056 479,671 Indirect interest on long-term debt 6,751 6,257 5,904 5,814 140,676
Total governmental activities expenses 67,224,959 64,229,701 65,574,207 69,034,894 71,450,002
Business-type activities: Transportation 385,564 421,724 426,056 392,138 470,955 Lottery 2,864,709 3,188,011 3,619,597 3,904,940 4,116,009 Hurricane Catastrophe Fund 236,475 113,808 (95,313) (90,146) 91,173 Prepaid College Program 691,977 2,010,300 (149,009) (48,662) 760,234 Reemployment Assistance 5,743,471 3,407,135 2,389,913 1,448,606 663,660 Nonmajor enterprise funds 268,936 256,936 287,278 314,276 322,557
Total business-type activities expenses 10,191,132 9,397,914 6,478,522 5,921,152 6,424,588
Total primary government expenses $ 77,416,091 $ 73,627,615 $ 72,052,729 $ 74,956,046 $ 77,874,590
Program RevenuesGovernmental activities:Charges for services
General government $ 4,092,321 $ 4,680,250 $ 5,153,314 $ 4,804,016 $ 4,577,749 Education 152,217 156,917 243,580 235,756 216,000 Human services 1,491,338 1,901,175 1,363,570 2,443,730 2,271,823 Criminal justice and corrections 775,476 729,837 762,411 261,949 275,308 Natural resources and environment
382,261 352,007 336,560 342,489 363,976 Transportation 255,995 361,627 485,131 274,205 709,950 Judicial branch 232,771 247,645 105,006 99,211 85,598
Operating Grants and Contributions 27,920,491 23,925,002 25,852,502 26,960,994 26,000,382 Capital Grants and Contributions 2,058,453 2,036,464 2,022,429 2,470,890 2,229,337
Total governmental activities program revenues 37,361,323 34,390,924 36,324,503 37,893,240 36,730,123
Business-type activities:Charges for services Transportation 699,675 715,835 851,997 922,212 993,662 Lottery 4,044,597 4,524,446 5,012,842 5,392,735 5,607,354 Hurricane Catastrophe Fund 1,358,918 1,362,133 1,295,500 1,296,550 1,314,505 Prepaid College Program 799,886 1,983,897 115,727 913,778 475,406 Reemployment Assistance 1,722,484 2,200,841 2,235,316 1,911,442 1,416,939 Nonmajor enterprise funds 362,184 358,972 380,370 406,902 429,789 Operating Grants and Contributions 3,863,733 2,165,114 1,442,864 432,698 35,521 Capital Grants and Contributions 270 289 6,414 19,732 3,350
Total business-type activities program revenues 12,851,747 13,311,527 11,341,030 11,296,049 10,276,526
Total primary government program revenues $ 50,213,070 $ 47,702,451 $ 47,665,533 $ 49,189,289 $ 47,006,649
Net (Expense) Revenue (1)
Governmental activities $ (29,863,636) $ (29,838,777) $ (29,249,704) $ (31,141,654) $ (34,719,879) Business-type activities 2,660,615 3,913,613 4,862,508 5,374,897 3,851,938
Total primary government net (expense) $ (27,203,021) $ (25,925,164) $ (24,387,196) $ (25,766,757) $ (30,867,941)
(1) Net (Expense) Revenue is the difference between the expenses and program revenues. It indicates the degree to which a function or program is supported with its own fees and program-specific grants and its reliance upon funding from general revenues.
2020 STATE OF FLORIDA CAFR
292

Changes in Net Position SCHEDULE A-2F((counting)
Fiscal Year2016 2017 2018 2019 2020
$ 6,699,521 $ 6,920,055 $ 7,121,076 $ 7,880,707 $ 9,614,755 20,162,012 20,805,316 22,087,266 23,156,683 23,297,022 34,595,840 35,856,581 37,655,551 36,578,683 39,400,204 4,021,540 4,276,747 4,641,430 4,829,124 5,178,908 2,852,005 3,137,354 3,348,183 3,291,238 3,187,110 4,962,377 4,405,444 4,384,174 4,393,614 4,301,255 521,155 586,606 604,607 621,300 694,616 78,225 84,311 87,061 37,977 66,581
73,892,675 76,072,414 79,929,348 80,789,326 85,740,451
514,248 574,436 655,689 774,282 842,859 4,389,601 4,522,491 4,956,621 5,233,699 5,653,279 68,294 80,081 2,578,144 4,019,088 1,556,717 1,322,406 (251,749) 49,629 1,016,432 898,935 465,563 414,596 450,662 386,497 9,191,215 332,551 339,090 375,950 406,593 388,942
7,092,663 5,678,945 9,066,695 11,836,591 18,531,947
$ 80,985,338 $ 81,751,359 $ 88,996,043 $ 92,625,917 $ 104,272,398
$ 4,656,044 $ 5,182,354 $ 4,986,966 $ 5,150,621 $ 4,631,524 291,798 250,636 267,724 351,836 293,948 1,702,416 1,502,243 2,119,895 2,043,492 2,186,607 312,850 266,759 272,208 274,257 272,613 367,177 344,710 351,419 398,537 387,081 256,419 260,096 233,922 252,861 318,386 77,239 88,213 89,863 98,834 93,555 27,224,801 27,968,095 29,889,510 29,279,568 34,671,497 2,503,371 2,250,743 2,490,930 2,310,034 2,076,859
37,392,115 38,113,849 40,702,437 40,160,040 44,932,070
1,131,342 1,175,815 1,234,814 1,278,487 1,189,112 6,108,189 6,150,021 6,709,553 7,197,221 7,570,838 1,214,518 1,203,757 1,306,875 1,618,782 1,631,661 1,472,707 457,842 636,471 1,762,853 764,072 1,031,057 821,223 663,818 583,516 526,593 431,022 449,732 478,163 532,419 459,066 10,886 4,948 12,168 5,186 6,846,808 2,724 5,948 43,022 12,903 14,170
11,402,445 10,269,286 11,084,884 12,991,367 19,002,320
$ 48,794,560 $ 48,383,135 $ 51,787,321 $ 53,151,407 $ 63,934,390
$ (36,500,560) $ (37,958,565) $ (39,226,911) $ (40,629,286) $ (40,808,381) 4,309,782 4,590,341 2,018,189 1,154,776 470,373
$ (32,190,778) $ (33,368,224) $ (37,208,722) $ (39,474,510) $ (40,338,008)
2020 STATE OF FLORIDA CAFR
293

Changes in Net Position SCHEDULE A-2For the Last Ten Fiscal Years (Continued)(in thousands)(Accrual Basis of Accounting)General Revenues and Other Changes in
Net Position Fiscal Year2011 2012 2013 2014 2015
Governmental activities:Taxes
Sales and use tax $ 17,822,003 $ 18,632,812 $ 19,914,591 $ 21,255,958 $ 22,916,865 Fuel taxes 2,512,393 2,515,654 2,580,843 2,680,381 2,799,442 Corporate income tax 1,880,365 2,042,537 2,055,440 2,043,380 2,236,690 Documentary stamp tax 1,152,222 1,289,321 1,662,044 1,806,604 2,118,466 Intangible personal property tax 163,553 190,247 279,047 254,236 305,131 Communication service tax 1,427,851 1,389,752 1,422,775 1,317,185 1,261,598 Beverage and tobacco taxes 1,886,065 1,847,468 1,700,095 1,631,109 1,647,809 Insurance premium tax 876,744 884,180 907,004 917,693 914,710 Gross receipts utilities tax 647,558 611,534 588,765 614,337 779,056 Other taxes 1,022,728 1,068,535 1,142,373 1,187,566 1,241,641
Investment earnings (loss) 369,459 288,425 104,112 346,868 138,726 Gain (loss) on sale of capital assets (3,450) (21,408) (62,746) (36,506) (94,099) Miscellaneous 68 — — — — Transfers 1,318,180 1,452,437 1,534,368 996,993 1,568,396
Total governmental activities 31,075,739 32,191,494 33,828,711 35,015,804 37,834,431
Business-type activities:Investment earnings 4,353 5,148 496 3,957 2,212 Gain (loss) on sale of capital assets (2,732) (717) (4,679) (2,579) (13,238) Emergency assessments 386,676 456,797 490,011 498,560 256,884 Miscellaneous 127 1,056 740 1,050 4,223 Transfers (1,318,180) (1,452,437) (1,534,368) (996,993) (1,568,396)
Total business-type activities (929,756) (990,153) (1,047,800) (496,005) (1,318,315)
Total primary government $ 30,145,983 $ 31,201,341 $ 32,780,911 $ 34,519,799 $ 36,516,116
Change in Net PositionGovernmental activities $ 1,212,103 $ 2,352,717 $ 4,579,007 $ 3,874,150 $ 3,114,552 Business-type activities 1,730,859 2,923,460 3,814,708 4,878,892 2,533,623
Total primary government (2) $ 2,942,962 $ 5,276,177 $ 8,393,715 $ 8,753,042 $ 5,648,175
(2) See Schedule A-1 for ending net asset balances for reported years.
2020 STATE OF FLORIDA CAFR
294

Changes in Net Position SCHEDULE A-2For the Last Ten Fiscal Years (Continued)((unting)
Fiscal Year2016 2017 2018 2019 2020
$ 24,255,828 $ 25,333,464 $ 26,781,181 $ 27,999,274 $ 26,936,491 2,934,580 3,016,110 3,111,590 3,254,839 3,048,047 2,181,244 2,383,783 2,412,220 3,114,711 2,509,887 2,284,854 2,427,903 2,517,733 2,648,213 2,829,050 341,418 370,421 376,744 386,168 488,765 1,030,801 933,454 1,031,288 941,415 927,396 1,589,210 1,521,059 1,465,590 1,445,638 1,398,145 940,747 959,339 1,084,872 1,178,214 1,225,176 777,404 767,388 793,809 806,447 732,663 1,282,545 1,309,079 882,784 902,273 904,529 327,804 61,669 231,040 661,924 886,544 90,007 (166,526) (49,064) (289,470) 5,111 — — — — 1 1,671,350 1,540,720 1,087,452 1,864,750 1,762,981
39,707,792 40,457,863 41,727,239 44,914,396 43,654,786
6,594 (696) 4,400 13,106 11,173 (154,186) (799) (6,248) (2,494) (998) 3,064 300 192 81 — 555 1,018 2,973 2,810 3,174 (1,671,350) (1,540,720) (1,087,452) (1,864,750) (1,762,981)
(1,815,323) (1,540,897) (1,086,135) (1,851,247) (1,749,632)
$ 37,892,469 $ 38,916,966 $ 40,641,104 $ 43,063,149 $ 41,905,154
$ 3,207,232 $ 2,499,298 $ 2,500,328 $ 4,285,110 $ 2,846,405 2,494,459 3,049,444 932,055 (696,471) (1,279,259)
$ 5,701,691 $ 5,548,742 $ 3,432,383 $ 3,588,639 $ 1,567,146
2020 STATE OF FLORIDA CAFR
295

Fund BalancesGovernmental Funds Last Ten Fiscal Years (in thousands)(Modified Accrual Basis of Accounting)
SCHEDULE A-3
Fiscal Year2011 2012 2013 2014 2015
General Fund (Per GASB 54):Nonspendable $ 76,554 $ 33,323 $ 27,518 $ 36,142 $ 19,120 Restricted 52,767 49,739 60,359 90,396 89,190 Committed 887,891 982,189 746,914 903,183 921,750 Unassigned 2,609,956 3,735,358 5,322,056 5,444,736 5,878,552 Total general fund 3,627,168 4,800,609 6,156,847 6,474,457 6,908,612
Percent change from prior year -13.01 % 32.35 % 28.25 % 5.16 % 6.71 %Other Governmental Funds (Per GASB 54):Nonspendable 59,967 74,260 117,133 95,290 47,641 Restricted 4,565,723 4,651,214 5,301,861 5,553,343 5,906,581 Committed 5,598,547 4,389,415 4,880,459 5,920,057 5,350,800 Unassigned — — (743,777) (808,982) (883,674)
Total other governmental funds 10,224,237 9,114,889 9,555,676 10,759,708 10,421,348
Total Governmental Funds (1) $ 13,851,405 $ 13,915,498 $ 15,712,523 $ 17,234,165 $ 17,329,960
Percent change from prior year 1.42 % 0.46 % 12.91 % 9.68 % 0.56 %
(1) See Schedule A-4 for changes in fund balances from year to year.
2020 STATE OF FLORIDA CAFR
296

SCHEDULE A-3
Fiscal Year2016 2017 2018 2019 2020
$ 26,800 $ 20,932 $ 16,142 $ 15,768 $ 11,959 74,750 71,000 39,684 55,171 73,252 1,032,466 1,168,162 1,239,072 1,274,538 1,293,157 5,694,315 5,419,306 5,842,506 7,476,330 7,864,662 6,828,331 6,679,400 7,137,404 8,821,807 9,243,030
-1.16 % -2.18 % 6.86 % 23.60 % 4.77 %
74,129 88,324 73,629 51,906 42,513 5,986,279 5,973,257 5,734,273 5,992,712 5,841,516 5,926,436 5,976,254 6,116,770 6,075,788 6,310,740 (851,275) (904,334) (888,359) (821,050) (858,577)
11,135,569 11,133,501 11,036,313 11,299,356 11,336,192
$ 17,963,900 $ 17,812,901 $ 18,173,717 $ 20,121,163 $ 20,579,222
3.66 % -0.84 % 2.03 % 10.72 % 2.28 %
2020 STATE OF FLORIDA CAFR
297

Changes in Fund BalancesGovernmental FundsLast Ten Fiscal Years(in thousands)(Modified Accrual Basis of Accounting)
SCHEDULE A-4
Fiscal Year2011 2012 2013 2014 2015
RevenuesTaxes $ 29,355,780 $ 30,480,459 $ 32,173,233 $ 33,712,162 $ 36,289,996 Licenses and permits 1,462,002 1,519,256 1,851,362 1,903,517 1,897,328 Fees and charges 4,543,730 5,236,550 4,930,332 4,827,751 4,843,738 Grants and donations 30,231,722 25,891,493 27,596,477 28,886,209 28,744,814 Investment earnings (losses) 495,585 461,343 191,892 481,773 246,533 Fines, forfeits, settlements and judgments 1,183,431 1,234,008 1,537,935 866,209 797,391 Other 119,190 171,866 148,442 565,212 704,131
Total revenues 67,391,440 64,994,975 68,429,673 71,242,833 73,523,931
ExpendituresCurrent:
General government 6,750,211 6,363,177 6,416,211 6,177,769 6,551,304 Education 19,685,314 16,960,772 17,149,935 18,723,050 19,087,014 Human services 29,070,430 29,663,993 30,594,941 32,888,676 34,183,874 Criminal justice and corrections 4,436,318 4,106,400 4,025,052 3,673,356 3,829,083 Natural resources and environment 2,162,579 2,095,042 2,206,123 2,351,663 2,423,631 Transportation 3,504,054 3,183,656 3,730,419 3,726,115 3,910,663 Judicial branch 426,559 401,216 445,686 475,097 497,318
Capital outlay 1,239,097 2,276,467 2,424,648 2,105,023 2,448,442 Gain/(loss) on disposal of general fixed assets — — — — — Debt service:
Principal retirement 1,153,973 1,310,958 1,270,667 1,012,513 1,448,950 Interest and fiscal charges 1,054,036 1,019,426 960,974 894,496 958,558
Total expenditures 69,482,571 67,381,107 69,224,656 72,027,758 75,338,837
Excess (deficiency) of revenues
over expenditures (2,091,131) (2,386,132) (794,983) (784,925) (1,814,906)
Other Financing Sources (Uses)Proceeds of bond issues 962,333 317,936 229,511 298,118 45,165 Proceeds of refunding bonds 1,540,777 2,799,911 1,759,221 807,336 1,923,687 Operating transfers in 9,413,135 9,611,610 9,648,910 9,215,113 9,364,500 Operating transfers out (8,091,465) (8,141,874) (8,097,250) (7,590,188) (7,787,355) Proceeds of financing agreements 724 662,553 631,503 383,524 288,391 Payments to refunded bond agent (1,540,777) (2,799,911) (1,759,221) (807,336) (1,923,687)
Total other financing sources (uses) 2,284,727 2,450,225 2,412,674 2,306,567 1,910,701
Net change in fund balances $ 193,596 $ 64,093 $ 1,617,691 $ 1,521,642 $ 95,795
Debt Service as a Percentage of Noncapital Expenditures 3.2 % 3.5 % 3.3 % 2.7 % 3.3 %
2020 STATE OF FLORIDA CAFR
298

SCHEDULE A-4
Fiscal Year2016 2017 2018 2019 2020
$ 37,650,476 $ 39,034,702 $ 40,473,470 $ 42,684,416 $ 40,980,841 2,032,352 2,126,261 2,268,941 2,221,598 2,041,437 3,838,867 3,983,785 4,344,609 4,380,169 4,155,847 29,696,010 30,103,652 32,243,096 31,379,504 36,960,719 512,562 112,511 348,503 920,929 1,158,299 841,078 1,289,474 807,165 1,108,662 938,994 733,943 616,558 792,758 713,563 727,470
75,305,288 77,266,943 81,278,542 83,408,841 86,963,607
6,669,232 6,826,395 6,994,032 7,745,467 9,595,258 19,662,950 20,324,681 21,679,600 22,804,005 23,003,050 34,502,757 35,808,456 37,487,402 36,413,466 39,350,038 3,908,252 4,027,094 4,275,750 4,451,590 4,532,817 2,717,900 2,970,959 3,215,081 3,115,076 3,054,429 4,426,536 4,162,072 4,272,185 4,232,866 4,152,176 504,072 516,516 528,739 540,114 548,851 2,417,671 2,908,107 2,844,370 3,290,372 3,128,355 — — (319) — —
1,142,026 1,331,004 1,533,293 1,316,905 1,507,275 849,980 824,928 751,256 650,395 624,058
76,801,376 79,700,212 83,581,389 84,560,256 89,496,307
(1,496,088) (2,433,269) (2,302,847) (1,151,415) (2,532,700)
57,398 257,400 417,571 625,953 397,761 1,791,321 1,446,829 1,376,618 1,229,094 1,381,184 9,735,795 9,858,172 10,176,908 11,036,970 11,407,677 (7,977,382) (8,142,270) (8,296,488) (8,993,953) (9,335,147) 233,131 327,122 440,672 429,892 519,983 (1,791,321) (1,446,829) (1,376,618) (1,229,093) (1,381,184)
2,048,942 2,300,424 2,738,663 3,098,861 2,990,274
$ 552,854 $ (132,845) $ 435,816 $ 1,947,446 $ 457,574
2.7 % 2.8 % 2.8 % 2.4 % 2.4 %
2020 STATE OF FLORIDA CAFR
299

Revenue Base/RateTaxable Sales by IndustryLast Ten Calendar Years(in thousands)
SCHEDULE B-1
Calendar Year
Industry 2010 2011 2012 2013 2014Agriculture $ 569,646 $ 596,792 $ 593,296 $ 502,451 $ 683,513 Mining 285,963 298,240 331,665 316,989 424,416 Construction 2,824,617 2,842,128 3,126,150 2,649,600 3,777,419 Manufacturing 10,663,286 11,266,856 11,662,104 10,836,540 13,703,157 Transportation 8,674,983 8,856,974 8,634,841 7,396,529 9,357,588 Communications (1) 15,538,174 14,763,448 14,512,956 14,133,220 13,664,244 Wholesale 8,425,312 9,229,711 10,112,139 11,115,462 12,987,380 Retail trade 140,597,440 151,111,126 158,134,617 169,417,669 182,082,864 Finance and insurance 37,473,383 38,567,529 39,688,012 41,602,427 45,026,905 Services 69,136,252 73,627,822 77,920,525 80,461,679 89,269,937 Government 308,117 345,639 320,316 315,398 344,302 Other 2,834,740 782,997 3,032,508 1,525,473 3,276,640
Total $ 297,331,913 $ 312,289,262 $ 328,069,129 $ 340,273,437 $ 374,598,365
State direct sales tax rate(2) 6.0 % 6.0 % 6.0 % 6.0 % 6.0 %
Note: Taxable sales information is available for reporting on a calendar-year basis only. (1) Taxable sales associated with communications services tax. (2) The sales tax rate on non-residential electricity was 7.0% for utility service provided prior to July 1, 2014. For utility service on or after
July 1, 2014, the state sales tax rate is 4.35%. The sales tax rate on communication services (nonresidential phone and all cable) was 6.8% from October 1, 2001 until August 1, 2010 when it was reduced to 6.65%. It was further reduced to 4.92% effective July 1, 2015. The sales tax rate on amusement machines is 4.0%. Farm equipment is tax-exempt.
Source: Florida Department of Revenue
2020 STATE OF FLORIDA CAFR
300

SCHEDULE B-1
Calendar Year
2015 2016 2017 2018 2019$ 341,849 $ 368,630 $ 369,427 $ 422,984 $ 435,817 465,381 480,200 457,267 502,548 502,629 3,955,275 4,313,115 4,417,777 4,732,668 4,975,150 14,726,621 16,166,532 16,900,270 18,534,298 19,592,528 9,780,692 9,536,571 10,117,226 10,112,997 10,921,958 13,356,227 12,579,292 12,755,358 12,670,839 12,194,459 14,212,567 15,659,435 17,031,207 19,354,520 20,993,960 196,600,925 204,810,062 211,447,513 221,938,314 228,009,017 48,580,481 52,026,830 55,845,421 61,746,877 65,480,181 96,681,482 101,451,337 105,536,357 110,943,075 115,993,468 447,860 434,667 475,304 530,359 564,072 1,124,777 937,406 395,293 499,328 531,577
$ 400,274,137 $ 418,764,077 $ 435,748,420 $ 461,988,807 $ 480,194,816
6.0 % 6.0 % 6.0 % 6.0 % 6.0 %
2020 STATE OF FLORIDA CAFR
301

Principal Sales Tax Payers by IndustryFor Calendar Years 2019 and 2010(dollars are in thousands)
SCHEDULE B-2
Calendar Year 2019 Calendar Year 2010
IndustryNumberof filers
Sales Tax Liability
Percentage of Total
Number of filers
Sales Tax Liability
Percentage of Total
Agriculture 3,044 $ 30,316 0.09 % 4,878 $ 37,602 0.19 %Mining 680 33,912 0.10 % 821 18,552 0.09 %Construction 11,041 336,576 1.02 % 9,236 185,322 0.94 %Manufacturing 34,897 1,337,702 4.06 % 31,636 697,965 3.53 %Transportation and utilities 6,239 791,290 2.40 % 6,306 621,786 3.15 %Communications(1) 3,228 599,967 1.82 % 3,542 1,050,896 5.32 %Wholesale 48,212 1,446,114 4.39 % 39,751 557,117 2.82 %Retail trade 253,906 15,610,218 47.43 % 245,442 9,257,279 46.85 %Finance and insurance 221,284 4,520,958 13.75 % 189,291 2,491,894 12.61 %Services 176,147 8,133,556 24.71 % 148,287 4,631,149 23.44 %Government 289 38,217 0.12 % 165 21,720 0.11 %Other 2,007 36,202 0.11 % 5,700 188,546 0.95 %
Total 760,974 $ 32,915,028 100.00 % 685,055 $ 19,759,828 100.00 %
Note: Due to confidentiality issues, the names of the ten largest revenue payers are not available for reporting. The categories presented are intended to provide alternative information regarding the sources of the state's revenue. In addition, some of the categories from the revenue base/rate schedule have been combined in preparing this schedule.
Taxable sales information is available for reporting on a calendar-year basis only.
(1) Communication service tax rate was reduced from 6.65% to 4.92% starting July 2015.
Source: Florida Department of Revenue
2020 STATE OF FLORIDA CAFR
302

THIS PAGE INTENTIONALLY LEFT BLANK
303

Ratios of Outstanding Debt by TypeLast Ten Fiscal Years(dollars in millions, except per capita)
SCHEDULE C-1
Governmental Activities
FiscalYear
FullFaithand
CreditPledgedRevenue
InstallmentPurchases
and CapitalLeases
Public-Private
Partnerships(1)(2)
Certificatesof
ParticipationTotal
Governmental
2011 $ 14,067 $ 7,235 $ 53 $ — $ 807 $ 22,162 2012 13,405 6,760 60 1,649 766 22,6402013 12,656 6,014 69 2,280 723 21,7422014 11,816 6,104 69 2,308 676 20,9732015 11,080 5,395 62 2,202 615 19,3542016 10,712 5,099 63 2,388 573 18,8352017 9,984 4,395 56 2,396 533 17,3642018 9,693 3,778 40 2,457 492 16,4602019 9,375 3,466 24 2,681 422 15,9682020 9,406 3,379 40 2,766 384 15,975
Note: Details regarding the state's outstanding debt can be found in Notes 8 and 9 to the Financial Statements.
(1) This column accounts for Public-Private Partnership agreements initially recorded in fiscal year 2012, and each fiscal year thereafter.
(2) Refer to Notes 9 and 10 for further detail. (3) Tax-supported revenues are comprised of State General Revenue receipts, including primarily sales and use tax revenues,
and revenues generated from taxes specifically pledged for repayment of debt. See Schedule C-3 for a more complete description of tax-supported revenues.
(4) Population data used in calculation of this ratio can be found in Schedule D-1.
2020 STATE OF FLORIDA CAFR
304

SCHEDULE C-1
Business-type Activities
PledgedRevenue
Public-Private
Partnerships (1)( 2)
InstallmentPurchases
andCapitalLeases
TotalPrimary
Government
Debt as aPercentage ofTax-supportedRevenues (3)
Debt PerCapita (4)
$ 8,230 $ — $ — $ 30,392 102.83 % $ 1,607.61 7,990 — — 30,630 99.75 % 1,605.88 6,107 — 4 27,853 86.14 % 1,446.18 5,823 345 21 27,162 80.60 % 1,392.40 4,808 376 19 24,557 69.47 % 1,239.31 6,001 321 17 25,174 66.97 % 1,249.41 5,350 262 16 22,992 59.04 % 1,122.43 5,174 218 29 21,881 53.31 % 1,049.92 4,885 215 16 21,084 49.18 % 994.13 4,521 214 15 20,718 50.31 % 959.35
2020 STATE OF FLORIDA CAFR
305

Ratios of Net General Bonded Debt OutstandingLast Ten Fiscal Years(dollars in millions, except per capita)
SCHEDULE C-2
General Bonded Debt Outstanding
FiscalYear
Full Faithand
Credit
Certificatesof
Participation TotalRestricted Resources
Net GeneralBonded
DebtOutstanding
Debt as aPercentage ofTax-supported
Revenue (1)Debt PerCapita (2)
2011 $ 14,067 $ 807 $ 14,874 $ 287 $ 14,587 49.35 % $ 771.59 2012 13,405 766 14,171 290 13,881 45.20 % 727.76 2013 12,656 723 13,379 280 13,099 40.51 % 680.13 2014 11,816 676 12,492 263 12,229 36.29 % 626.89 2015 11,080 615 11,695 248 11,447 32.38 % 577.69 2016 10,712 573 11,285 252 11,033 29.35 % 547.58 2017 9,984 533 10,517 218 10,299 26.45 % 544.78 2018 9,693 492 10,185 163 10,022 24.42 % 480.89 2019 9,375 422 9,797 80 9,717 22.66 % 458.16 2020 9,406 384 9,790 30 9,760 23.70 % 451.92
Note: Details regarding the state's outstanding debt can be found in Notes 8 and 9 to the Financial Statements.
(1) Tax-supported revenues are comprised of State General Revenue receipts, including primarily sales and use tax revenues, and revenues generated from taxes specifically pledged for repayment of debt. See Schedule C-3 for a more complete description of tax-supported revenues.
(2) Population data used in calculation of this ratio can be found in Schedule D-1.
2020 STATE OF FLORIDA CAFR
306

Legal Debt MarginLast Ten Fiscal Years(dollars in millions)
SCHEDULE C-3
Legal debt margin calculated for fiscal year 2019-2020:
Tax-supported revenues (1) $ 41,181
Debt limit (2) 2,471 Debt applicable to limit:
Aggregate debt service ontax-supported debt 2,263
Legal debt margin $ 208
2011(3) 2012(3) 2013(3) 2014 2015 2016 2017 2018 2019 2020
Debt limit (2) $ 1,773 $ 1,843 $ 1,940 $ 2,022 $ 2,121 $ 2,255 $ 2,337 $ 2,463 $ 2,572 $ 2,471
Total debt applicable to limit 2,204 2,191 2,196 1,887 1,971 2,053 2,178 2,295 1,989 2,263
Legal debt margin $ (431) $ (348) $ (256) $ 135 $ 150 $ 202 $ 159 $ 168 $ 583 $ 208
Total net debt applicable to thelimit as a percentage of debtlimit. 124.31 % 118.88 % 113.20 % 93.32 % 92.93 % 91.03 % 93.20 % 93.18 % 77.33 % 91.58 %
(1) For purposes of this Schedule C-3, tax-supported revenues are comprised of the general revenues of the state, including primarily sales and use tax receipts, and the specific state tax revenues pledged for payment of debt service. Tax-supported debt is debt secured by the full faith and credit of the state or payable from general revenue or specified state tax sources. As of June 30, 2020, the total outstanding balance of tax-supported debt was approximately $15,620,600,000.
(2) The state debt fiscal responsibility policy, Section 215.98, Florida Statutes, establishes the ratio of tax-supported debt service to tax-supported revenues as the benchmark debt ratio for purposes of setting the state's legal debt margin. Under the present policy, if the ratio exceeds 6%, additional tax-supported debt may be authorized only if the legislature determines the additional debt is in the best interest of the state. If the ratio exceeds 7%, additional tax-supported debt may be authorized only if the legislature determines it is necessary to address a critical state emergency. The 6% ratio has been used to determine the debt limit in this schedule.
(3) In Fiscal Years 2011, 2012, and 2013 tax-supported debt service exceeded 7% of tax-supported revenues.
Source: Florida State Board of Administration, Division of Bond Finance
2020 STATE OF FLORIDA CAFR
307

Pledged-Revenue CoverageLast Ten Fiscal Years(dollars in thousands)
SCHEDULE C-4
The schedules below contain information regarding revenues pledged to repay debt obligations. For each bond type, the schedules disclose Gross Revenue, Operating Expenses, Net Revenue Available for Debt Service, Principal, Interest, and Coverage Ratio. The bond types with operating expenses are considered self-supporting debt and are paid from the associated facilities being financed. If operating expenses are not shown, the bond type is considered to be Net Tax Supported Debt and serviced by dedicated tax or fee revenues.
Debt Service
YearEnded6/30 Revenue(1)
LessOperatingExpenses
Net Availablefor DebtService
Debt ServicePrincipal Interest(2)
CoverageRatio
Florida Turnpike2011 611,946 180,060 431,886 99,000 144,061 1.78 2012 620,201 173,704 446,497 105,060 138,179 1.84 2013 767,985 157,388 610,597 111,680 133,549 2.49 2014 808,374 157,343 651,031 116,398 130,033 2.64 2015 894,589 177,160 717,429 120,990 132,991 2.82 2016 987,149 192,458 794,691 129,620 131,805 3.04 2017 1,044,530 208,198 836,332 133,590 123,804 3.25 2018 1,063,729 233,020 830,709 140,640 115,874 3.24 2019 1,078,094 238,344 839,750 143,680 115,300 3.24 2020 995,849 242,882 752,967 135,870 116,025 2.99
Florida Forever/Preservation 2000/Everglades2011 669,440 — 669,440 308,085 125,948 1.54 2012 729,901 — 729,901 321,675 104,460 1.71 2013 950,700 — 950,700 345,485 88,253 2.19 2014 1,049,500 — 1,049,500 97,960 72,963 6.14 2015 1,229,100 — 1,229,100 102,715 67,113 7.24 2016 2,276,900 — 2,276,900 106,415 63,456 13.40 2017 2,417,800 — 2,417,800 110,955 58,213 14.29 2018 2,510,000 — 2,510,000 112,810 51,784 15.25 2019 2,651,100 — 2,651,100 116,305 45,272 16.41 2020 2,874,900 — 2,874,900 116,703 40,943 18.24
Lottery Education (3)
2011 1,184,000 — 1,184,000 168,607 146,329 3.76 2012 1,321,663 — 1,321,663 176,845 134,745 4.24 2013 1,424,307 — 1,424,307 185,661 125,883 4.57 2014 1,495,409 — 1,495,409 194,105 118,649 4.78 2015 1,496,371 — 1,496,371 203,389 108,556 4.80 2016 1,692,551 — 1,692,551 211,921 98,398 5.45 2017 1,656,348 — 1,656,348 219,805 85,327 5.43 2018 1,758,329 — 1,758,329 244,688 71,054 5.57 2019 1,927,054 — 1,927,054 199,770 57,290 7.50 2020 1,913,799 — 1,913,799 170,170 47,385 8.80
Alligator Alley2011 19,737 7,059 12,678 1,525 1,923 3.68 2012 19,647 7,243 12,404 1,590 1,858 3.60 2013 25,115 7,409 17,706 1,660 1,790 5.13 2014 26,755 8,272 18,483 1,740 1,707 5.36 2015 28,601 8,525 20,076 1,830 1,620 5.82 2016 30,656 8,757 21,899 1,920 1,529 6.35 2017 32,383 8,594 23,789 2,015 1,433 6.90 2018 33,003 9,973 23,030 1,765 1,031 8.24 2019 34,749 10,416 24,333 1,805 994 8.70 2020 31,290 10,135 21,155 1,895 903 7.56
Sunshine Skyway2019 28,809 8,756 20,053 — — 2.92 (4)
2020 26,348 7,814 18,534 2,480 4,391 2.70
2020 STATE OF FLORIDA CAFR
308

SCHEDULE C-4(Continued)
Debt Service
YearEnded6/30 Revenue(1)
LessOperatingExpenses
Net Availablefor DebtService
Debt ServicePrincipal Interest(2)
CoverageRatio
State Infrastructure Bank2011 56,698 — 56,698 8,265 4,962 4.29 2012 76,531 — 76,531 11,200 4,548 4.86 2013 64,368 — 64,368 9,955 3,988 4.62 2014 69,407 — 69,407 10,710 3,491 4.89 2015 56,750 — 56,750 10,085 2,955 4.35 2016 51,131 — 51,131 8,845 2,451 4.53 2017 47,269 — 47,269 8,655 2,009 4.43 2018 43,041 — 43,041 8,160 1,576 4.42 2019 35,362 — 35,362 7,200 1,168 4.23 2020 29,607 — 29,607 6,400 808 4.11
Florida Hurricane Catastrophe Fund Finance Corporation (5)
2011 1,714,728 15,644 1,699,084 269,485 122,919 4.32 2012 1,791,238 14,642 1,776,596 282,660 121,597 4.38 2013 1,746,135 17,071 1,729,064 3,796,795 80,687 0.44 (6)
2014 1,789,748 17,650 1,772,098 300,000 83,746 4.61 2015 1,564,480 18,687 1,545,793 325,000 65,194 3.95 2016 1,205,500 18,774 1,186,726 — 44,052 26.93 2017 1,181,244 19,505 1,161,739 — 46,758 24.84 2018 1,252,540 19,548 1,232,992 — 34,590 35.64 2019 1,559,827 23,544 1,536,283 — — N/A2020 1,187,643 80,576 1,107,067 — 6,778 163,330
State University System Bonds2011 37,798 — 37,798 16,240 11,306 1.37 2012 40,055 — 40,055 16,495 10,766 1.47 2013 51,730 — 51,730 17,335 9,614 1.92 2014 55,766 — 55,766 12,835 8,796 2.58 2015 53,960 — 53,960 13,460 8,032 2.51 2016 55,768 — 55,768 14,010 7,352 2.61 2017 56,193 — 56,193 9,390 6,740 3.48 2018 58,324 — 58,324 9,525 5,765 3.81 2019 58,547 — 58,547 9,945 4,576 4.03 2020 58,796 — 58,796 10,295 4,093 4.09
University Auxiliary Bonds Parking System Revenue Bonds
Florida International University2011 10,009 3,212 6,797 2,230 2,165 1.55 2012 11,435 4,673 6,762 2,710 2,865 1.21 2013 12,663 4,062 8,601 2,815 2,151 1.73 2014 13,762 5,032 8,730 2,655 3,023 1.54 2015 13,845 4,863 8,982 2,875 3,457 1.42 2016 14,377 5,676 8,702 3,000 3,321 1.38 2017 15,651 6,202 9,449 3,135 3,192 1.49 2018 15,275 5,600 9,675 3,280 3,047 1.53 2019 15,601 6,296 9,304 3,430 2,893 1.47 2020 13,759 6,963 6,796 2,785 2,487 1.29
University of South Florida2011 12,544 7,277 5,267 1,990 1,570 1.48 2012 13,549 7,944 5,605 2,130 1,429 1.57 2013 13,187 7,799 5,388 2,205 1,354 1.51 2014 13,783 7,661 6,122 2,285 1,272 1.72 2015 13,905 7,942 5,964 2,380 1,179 1.68 2016 14,150 8,148 6,002 2,485 1,075 1.69 2017 13,977 7,880 6,097 2,340 717 1.99 2018 14,701 8,526 6,175 2,495 441 2.10 2019 15,111 8,327 6,784 2,550 386 2.31 2020 13,066 8,571 4,495 2,610 330 1.53
2020 STATE OF FLORIDA CAFR
309

Pledged-Revenue CoverageLast Ten Fiscal Years(dollars in thousands)
SCHEDULE C-4(Continued)
Debt Service
YearEnded6/30 Revenue(1)
LessOperatingExpenses
Net Availablefor DebtService
Debt ServicePrincipal Interest(2)
CoverageRatio
Florida Agricultural & Mechanical University2011 2,628 1,338 1,290 155 77 5.56 2012 2,708 1,261 1,447 160 70 6.29 2013 2,422 1,538 884 170 61 3.82 2014 2,216 1,501 715 180 53 3.07 2015 2,195 1,118 1,077 190 43 4.62 2016 1,942 1,039 903 200 33 3.87 2017 1,877 1,171 706 210 23 3.03 2018 1,922 1,597 325 220 12 1.40 (7)
University of Florida2011 12,276 7,388 4,888 1,905 1,225 1.56 2012 12,255 7,320 4,935 2,075 1,055 1.58 2013 11,988 7,545 4,443 2,165 965 1.42 2014 12,499 7,176 5,323 2,260 870 1.70 2015 12,530 7,294 5,236 1,510 791 2.28 2016 13,093 7,298 5,794 1,570 729 2.52 2017 13,920 7,811 6,109 1,640 662 2.63 2018 14,801 6,197 8,604 980 537 5.67 2019 15,744 6,330 9,414 1,020 820 5.12 2020 12,660 6,893 5,767 1,810 1,761 1.61
Florida Atlantic University2011 5,708 2,233 3,475 750 508 2.76 2012 6,962 3,486 3,476 805 456 2.76 2013 7,324 2,821 4,503 835 544 3.272014 7,161 3,164 3,997 1,300 779 1.922015 7,072 4,103 2,969 1,325 753 1.432016 7,277 4,208 3,069 1,365 713 1.482017 7,327 3,135 4,192 1,405 672 2.022018 7,230 2,977 4,253 1,460 616 2.052019 7,325 2,897 4,428 1,515 558 2.142020 7,085 2,131 4,954 1,600 482 2.38
University of Central Florida2011 16,181 3,379 12,801 2,235 1,567 3.37 2012 18,576 3,149 15,427 2,880 1,833 3.27 2013 19,199 3,545 15,654 3,065 1,674 3.30 2014 19,251 3,335 15,916 3,275 1,639 3.24 2015 21,248 3,445 17,803 3,410 1,505 3.62 2016 21,972 4,204 17,768 3,540 1,374 3.62 2017 22,189 3,962 18,227 3,150 1,218 4.17 2018 22,597 3,890 18,707 3,280 1,081 4.29 2019 25,185 4,214 20,971 2,765 973 5.61 2020 20,278 4,224 16,054 2,776 740 4.57
Florida State University2011 9,857 2,145 7,712 2,605 1,901 1.71 2012 11,104 2,347 8,757 3,395 2,223 1.56 2013 11,879 2,660 9,219 3,515 2,112 1.642014 11,045 3,027 8,018 3,620 1,994 1.43 2015 11,892 3,204 8,688 3,025 1,903 1.76 2016 11,669 3,298 8,371 3,050 1,771 1.74 2017 12,175 3,515 8,660 3,165 1,549 1.84 2018 12,241 3,248 8,993 3,389 1,351 1.90 2019 12,174 3,133 9,040 3,506 1,230 1.91 2020 12,577 2,881 9,696 3,651 1,091 2.04
2020 STATE OF FLORIDA CAFR
310

SCHEDULE C-4(Continued)
Debt Service
YearEnded6/30 Revenue(1)
LessOperatingExpenses
Net Availablefor DebtService
Debt ServicePrincipal Interest(2)
CoverageRatio
Housing System Revenue BondsFlorida Agricultural & Mechanical University
2013 11,600 6,856 4,744 1,216 3,145 1.09 2014 11,146 7,297 3,849 2,684 3,228 0.65 2015 14,068 7,499 6,569 2,820 3,096 1.11 2016 14,910 7,605 7,304 2,959 2,957 1.23 2017 14,524 6,608 7,916 3,110 2,811 1.34 2018 16,219 8,031 8,188 3,266 2,658 1.38 2019 16,047 9,707 6,340 815 1,731 2.49 2020 14,953 11,004 3,949 2,998 1,459 0.89
Florida International University2011 23,518 12,418 11,099 3,430 3,694 1.56 2012 25,069 14,049 11,020 3,765 3,395 1.54 2013 25,991 14,149 11,842 3,975 4,691 1.37 2014 30,469 16,622 13,847 5,175 4,521 1.43 2015 29,110 14,529 14,582 5,390 4,312 1.50 2016 30,611 13,141 17,469 5,465 3,840 1.88 2017 29,939 16,856 13,083 3,750 3,668 1.76 2018 31,280 17,720 13,560 3,915 3,503 1.83 2019 31,728 17,079 14,649 4,100 3,319 1.97 2020 21,378 10,890 10,488 4,275 3,138 1.41
University of Florida2011 44,885 27,209 17,676 2,235 2,625 3.64 2012 45,673 33,519 12,154 2,630 2,265 2.48 2013 48,964 32,770 16,194 3,680 3,125 2.38 2014 52,210 35,004 17,206 3,500 3,040 2.63 2015 54,588 35,076 19,512 4,580 3,509 2.41 2016 59,717 38,192 21,524 4,705 3,346 2.67 2017 57,787 39,120 18,667 4,800 3,058 2.38 2018 56,893 37,308 19,585 5,045 2,779 2.50 2019 56,544 39,483 17,061 5,255 2,553 2.19 2020 47,776 35,057 12,719 4,560 2,332 1.85
Florida Atlantic University2011 14,802 6,119 8,683 2,405 3,357 1.51 2012 16,299 6,419 9,880 2,585 3,177 1.71 2013 16,498 7,481 9,017 2,690 3,077 1.56 2014 15,898 7,153 8,745 2,795 2,971 1.52 2015 14,828 7,574 7,254 2,900 2,862 1.26 2016 16,665 8,136 8,529 3,020 2,746 1.48 2017 17,859 8,844 9,015 3,130 2,434 1.62 2018 18,072 7,676 10,396 2,935 2,452 1.93 2019 19,698 8,233 11,466 3,045 2,335 2.13 2020 16,724 7,287 9,437 3,210 2,182 1.75
University of Central Florida2011 22,872 11,509 11,363 2,740 3,766 1.75 2012 24,712 11,910 12,802 2,985 3,382 2.01 2013 25,577 14,208 11,369 3,125 5,117 1.38 2014 29,316 17,450 11,866 3,125 5,117 1.44 2015 29,455 14,831 14,624 4,225 4,565 1.66 2016 30,882 16,641 14,241 4,395 4,400 1.62 2017 31,063 16,274 14,789 4,580 4,210 1.68 2018 30,085 16,417 13,668 4,795 3,987 1.56 2019 32,299 18,720 13,579 5,040 3,593 1.57 2020 26,231 18,880 7,351 5,030 3,307 0.88
2020 STATE OF FLORIDA CAFR
311
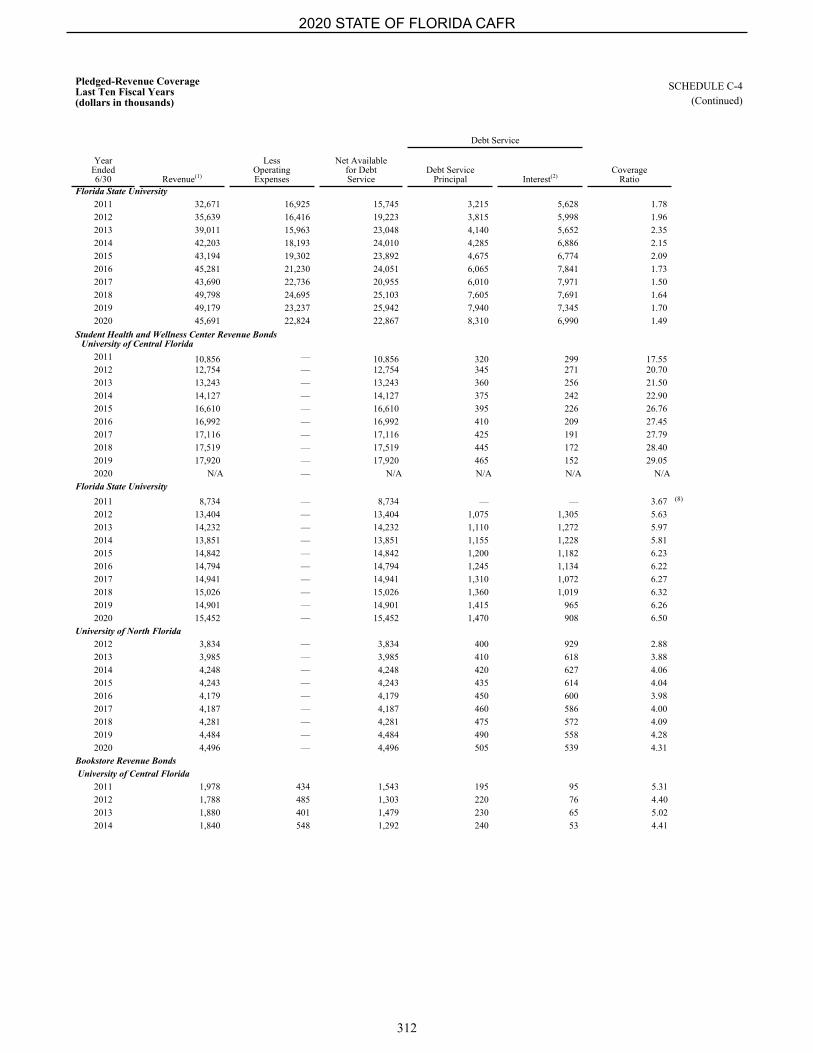
Pledged-Revenue CoverageLast Ten Fiscal Years(dollars in thousands)
SCHEDULE C-4(Continued)
Debt Service
YearEnded6/30 Revenue(1)
LessOperatingExpenses
Net Availablefor DebtService
Debt ServicePrincipal Interest(2)
CoverageRatio
Florida State University2011 32,671 16,925 15,745 3,215 5,628 1.78 2012 35,639 16,416 19,223 3,815 5,998 1.96 2013 39,011 15,963 23,048 4,140 5,652 2.35 2014 42,203 18,193 24,010 4,285 6,886 2.15 2015 43,194 19,302 23,892 4,675 6,774 2.09 2016 45,281 21,230 24,051 6,065 7,841 1.73 2017 43,690 22,736 20,955 6,010 7,971 1.50 2018 49,798 24,695 25,103 7,605 7,691 1.64 2019 49,179 23,237 25,942 7,940 7,345 1.70 2020 45,691 22,824 22,867 8,310 6,990 1.49
Student Health and Wellness Center Revenue BondsUniversity of Central Florida
2011 10,856 — 10,856 320 299 17.55 2012 12,754 — 12,754 345 271 20.70 2013 13,243 — 13,243 360 256 21.50 2014 14,127 — 14,127 375 242 22.90 2015 16,610 — 16,610 395 226 26.76 2016 16,992 — 16,992 410 209 27.45 2017 17,116 — 17,116 425 191 27.79 2018 17,519 — 17,519 445 172 28.40 2019 17,920 — 17,920 465 152 29.05 2020 N/A — N/A N/A N/A N/A
Florida State University2011 8,734 — 8,734 — — 3.67 (8)
2012 13,404 — 13,404 1,075 1,305 5.63 2013 14,232 — 14,232 1,110 1,272 5.97 2014 13,851 — 13,851 1,155 1,228 5.81 2015 14,842 — 14,842 1,200 1,182 6.23 2016 14,794 — 14,794 1,245 1,134 6.22 2017 14,941 — 14,941 1,310 1,072 6.27 2018 15,026 — 15,026 1,360 1,019 6.32 2019 14,901 — 14,901 1,415 965 6.26 2020 15,452 — 15,452 1,470 908 6.50
University of North Florida2012 3,834 — 3,834 400 929 2.88 2013 3,985 — 3,985 410 618 3.88 2014 4,248 — 4,248 420 627 4.06 2015 4,243 — 4,243 435 614 4.04 2016 4,179 — 4,179 450 600 3.98 2017 4,187 — 4,187 460 586 4.00 2018 4,281 — 4,281 475 572 4.09 2019 4,484 — 4,484 490 558 4.28 2020 4,496 — 4,496 505 539 4.31
Bookstore Revenue Bonds University of Central Florida
2011 1,978 434 1,543 195 95 5.312012 1,788 485 1,303 220 76 4.402013 1,880 401 1,479 230 65 5.022014 1,840 548 1,292 240 53 4.41
2020 STATE OF FLORIDA CAFR
312

SCHEDULE C-4
Debt Service
YearEnded6/30 Revenue(1)
LessOperatingExpenses
Net Availablefor DebtService
Debt ServicePrincipal Interest(2)
CoverageRatio
Student Services Center Revenue BondsUniversity of Florida
2014 21,347 — 21,347 1,045 1,571 8.16 2015 23,952 — 23,952 1,340 1,891 7.41 2016 25,861 — 25,861 1,410 1,824 8.00 2017 28,012 — 28,012 1,480 1,754 8.66 2018 28,504 — 28,504 1,555 1,680 8.81 2019 29,263 — 29,263 1,630 1,602 9.05 2020 29,504 — 29,504 1,715 1,520 9.12
DOT Financing Corporation Bonds2019 4,694,931 — 4,694,931 9,205 6,285 303.10 2020 4,520,651 — 4,520,651 7,900 7,591 291.82
Federal Highway Reimbursement Bonds2020 1,993,118 — 1,993,118 5,230 4,005 215.83
Water Pollution Control Bonds2011 96,063 — 96,063 21,285 19,019 2.38 2012 120,674 — 120,674 25,405 24,721 2.41 2013 87,796 — 87,796 34,155 23,514 1.52 2014 90,986 — 90,986 34,840 22,025 1.60 2015 96,548 — 96,548 34,875 20,534 1.74 2016 86,109 — 86,109 32,930 19,001 1.66 2017 79,218 — 79,218 31,700 17,500 1.61 2018 78,977 — 78,977 28,770 16,077 1.76 2019 84,834 — 84,834 28,030 14,664 1.99 2020 93,421 — 93,421 27,790 13,268 2.28
Inland Protection Bonds2011 211,533 — 211,533 5,080 4,695 21.64 2012 189,683 — 189,683 5,335 3,403 21.71 2013 188,346 — 188,346 5,605 3,181 21.44 2014 192,444 — 192,444 5,885 2,931 21.83 2015 198,432 — 198,432 6,180 2,637 22.50 2016 206,566 — 206,566 6,485 2,323 23.45 2017 212,852 — 212,852 6,810 2,000 24.16 2018 222,483 — 222,483 7,000 1,802 25.28 2019 235,565 — 235,565 7,205 1,586 26.80 2020 214,563 — 214,563 3,245 4,095 29.23
Seaport Investment Program2014 200,000 — 200,000 2,387 6,195 23.30 2015 200,000 — 200,000 2,145 6,436 23.31 2016 200,000 — 200,000 2,250 6,329 23.31 2017 200,000 — 200,000 2,365 6,217 23.31 2018 200,000 — 200,000 2,485 6,098 23.30 2019 200,000 — 200,000 2,605 5,974 23.31 2020 200,000 — 200,000 2,740 5,844 200,000,000 23.30
(1) Refer to Note 8A.2. for information on the sources of pledged revenues. (2) Debt service interest is shown net of interest subsidy payments received from the Federal Government for Build America Bonds. (3) Source: Department of Lottery, Audited Financial Statements. (4) Coverage shown based on maximum annual debt service of $6,874,250 for illustrative purposes. (5) Florida Hurricane Catastrophe Bonds debt service is reduced by interest earnings on bond proceeds and bond proceeds used to repay principal. (6) In Fiscal Year 2008, Florida Hurricane Catastrophe Fund executed a $3.5 billion liquidity bond issue. The proceeds of the issue were used to redeem the bonds at maturity in
Fiscal Year 2013. The coverage ratio shown is based only on the net revenue and does not include the bond proceeds used to redeem the bonds. Including the bond proceeds, the coverage ratio is 1.35.
(7) FAMU Parking Bonds, Series 1997 final payment was in Fiscal Year 2018. (8) Coverage shown based on maximum annual debt service of $2,382,950 for illustrative purposes.
2020 STATE OF FLORIDA CAFR
313

Demographic and Economic StatisticsFor the Last Ten Calendar Years
SCHEDULE D-1
Population Personal Income (in millions)
Year Florida - April 1
PercentChange
fromPrior Year U.S. - July 1
PercentChange
fromPrior Year Florida U.S.
2011 18,905,070 0.55% 311,556,874 0.50% $ 764,634 $ 13,326,770 2012 19,074,434 0.90% 313,830,990 0.73% 793,429 14,010,140 2013 19,259,543 0.97% 315,993,715 0.69% 795,425 14,181,095 2014 19,507,369 1.29% 318,301,008 0.73% 856,162 14,991,715 2015 19,815,183 1.58% 320,635,163 0.73% 914,928 15,724,240 2016 20,148,654 1.68% 322,941,311 0.72% 949,718 16,160,714 2017 20,484,142 1.67% 324,985,539 0.63% 1,016,819 16,948,592 2018 20,840,568 1.74% 326,687,501 0.52% 1,082,702 17,851,832 2019 21,208,589 1.77% 328,239,523 0.48% 1,125,984 18,551,503 2020 21,596,068 1.83% 329,877,505 0.50% 1,212,817 19,630,533
(1) Unemployment rates are annualized (average of monthly rates). (2) School enrollment is by state fiscal year and other data are by calendar year, April 1, or July 1.
Note: Historical data are from the U.S. Department of Commerce; University of Florida; U.S. Department of Labor; and Florida Department of Education. Forecast data are based on the Florida Demographic, National Economic, and Florida Economic Estimating Conferences (November 2020)
Sources: Florida Legislature, Florida Department of Education
State of FloridaPopulation by Age
Age Group 2000 Census Percent 2010 Census Percent 2021 Estimate Percent 0 - 14 3,034,656 18.99% 3,284,608 17.47% 3,642,832 16.87%15 - 24 1,942,430 12.15% 2,457,140 13.07% 2,587,000 11.98%25 - 44 4,569,515 28.59% 4,720,799 25.11% 5,365,241 24.84%45 - 64 3,628,573 22.70% 5,079,161 27.01% 5,588,566 25.88%
65 and Over 2,807,650 17.57% 3,259,602 17.34% 4,412,429 20.43%Total 15,982,824 100.00% 18,801,310 100.00% 21,596,068 100.00%
Source: 2020 total population estimate adjusted by age percentages from Florida Population Studies, Bulletin 187, June 2020, University of Florida, Bureau of Economic and Business Research. Year 2000 Census data incorporates adjustments for age misreporting prepared by the University of Florida, Bureau of Economic and Business Research.
2020 STATE OF FLORIDA CAFR
314

SCHEDULE D-1
Per Capita Personal Income Unemployment Rate (1)Median
AgePublic SchoolEnrollment(2)
Florida U.S. Florida U.S. Florida Florida$ 40,446 $ 42,775 10.0% 8.9% 40.9 2,643,396 41,596 44,642 8.5% 8.1% 41.0 2,667,830 41,300 44,878 7.2% 7.4% 41.1 2,691,322 43,889 47,099 6.3% 6.2% 41.3 2,720,074 46,173 49,041 5.5% 5.3% 41.5 2,756,127 47,136 50,042 4.8% 4.9% 41.6 2,791,244 49,639 52,152 4.2% 4.4% 41.6 2,817,076 51,952 54,645 3.6% 3.9% 41.7 2,833,115 53,091 56,518 3.1% 3.7% 41.7 2,846,857 56,159 59,509 7.9% 8.1% 41.8 2,858,949
2020 STATE OF FLORIDA CAFR
315

Industry Sector Employment SCHEDULE D-2For Calendar Years 2019 and 2010(in thousands)
Calendar Year 2019 Calendar Year 2010
Industry Employment
Percentage ofTotal
Employment (1) Employment
Percentage ofTotal
Employment (1)
Health Care and Social Assistance 1,167 12.94 % 936 12.90 % Retail Trade 1,109 12.29 % 934 12.87 % Accommodation and Food Services 1,015 11.25 % 746 10.28 % Local Government 722 8.00 % 724 9.98 % Administrative and Waste Services 683 7.57 % 494 6.81 % Professional and Technical Services 594 6.59 % 437 6.02 % Construction 566 6.27 % 351 4.84 % Finance and Insurance 395 4.38 % 328 4.52 % Manufacturing 385 4.27 % 309 4.26 %
Wholesale Trade 353 3.91 % 308 4.24 %
Total 6,989 77.48 % 5,567 76.71 %
Note: Privacy requirements prevent the state from obtaining and reporting specific information about the largest employers in the state's jurisdiction. Reporting by industry reveals the degree of concentration in the state's total employment base.
In December 2019, Florida’s seasonally adjusted total nonagricultural employment was 9,031,400, an increase of 167,200 jobs (+1.9 percent) over the year. Florida's annual job growth rate had been positive for 112 out of 113 months. The only month not positive was due to Hurricane Irma that hit the state in September 2017. Prior to August 2010, the state had been losing jobs for three years. In December 2019, eight of the ten major industries gained jobs over the year with education and health services (+36,600 jobs) gaining the most followed by trade, transportation, and utilities (+30,600 jobs).
(1) "Employment" is being calculated based on average total employment by industry for each calendar year. Percentages of "Total" employment are based on the following:
2019 2010
Total non-agricultural employment (in thousands) 8,953 7,175 Total agricultural employment (in thousands) 67 82
Total employment 9,020 7,257
Sources: Florida Department of Economic Opportunity, Bureau of Workforce Statistics and Economic Research, Quarterly Census of Employment and Wages Program (for agricultural employment) and the U.S. Bureau of Labor Statistics, Current Employment Statistics Program (for all other industry data)
2020 STATE OF FLORIDA CAFR
316

THIS PAGE INTENTIONALLY LEFT BLANK
317

Full-time Equivalent (FTE) State Employees by FunctionLast Ten Fiscal Years
SCHEDULE E-1
Fiscal Year
Function (state) (2) 2011 2012 2013 2014 2015 2016 2017
General Government — — — — — — —
Education — — — — — — —
Human Services — — — — — — —
Criminal Justice and Corrections — — — — — — —
Natural Resources and Environment — — — — — — —
Transportation — — — — — — —
Judicial Branch — — — — — — —
Total — — — — — — —
Function (federal)
Financial administration 15,212 16,778 25,974 25,856 25,596 25,713 25,906
Streets and highways 6,751 6,116 5,821 5,827 5,810 5,685 5,647
Public welfare 12,278 14,148 13,784 13,736 13,829 13,852 13,817
Police protection 4,981 5,201 5,181 5,314 5,395 5,306 5,384
Natural resources and environment 7,481 7,437 7,245 7,185 7,143 7,126 6,995
Health 16,303 15,437 14,957 14,414 13,448 13,418 13,104
Housing and community development(1) 31 39 87 44 42 78 73
Community development(1) 278 53 37 36 34 — —
Criminal justice and corrections 39,051 35,875 25,524 24,114 25,376 24,661 24,858
Utility and transportation 301 270 269 259 257 245 253
Employee security 1,481 1,563 1,384 1,446 1,346 1,295 1,279
Education 2,272 2,251 2,184 2,147 2,185 2,109 2,090
Judicial branch 4,009 4,042 4,097 4,112 4,055 4,098 4,098
Other 1,724 2,698 999 1,025 1,020 782 1,002
Total 112,153 111,908 107,543 105,515 105,536 104,368 104,506
Note: FTE's are calculated based on a 40 hours work week. A numerical designator is based on 100% for a full-time employee (i.e., 1.00 point for a FTE working 40 hours). All others are prorated accordingly.
(1) In fiscal year 2015-16 a Legislative Budget Request from Department of Economic Opportunity was approved to combine the functions of Community Development with Housing.
(2) In fiscal year 2018-19, reporting by federal function was changed to reporting by state function to mirror the primary government functions presented within the Government-Wide Statement of Activities financial statement of the State of Florida's Comprehensive Annual Financial Report.
Sources: Florida Legislature, Florida State Board of Administration, Florida Department of Management Services
2020 STATE OF FLORIDA CAFR
318

SCHEDULE E-1
Fiscal Year2018 2019 2020
— 31,692 32,235
— 2,624 2,626
— 22,743 22,557
— 30,495 30,443
— 5,000 5,891
— 5,333 5,223 — 3,305 3,173
— 101,192 102,148
25,869 — — 5,662 — — 13,998 — — 5,452 — — 7,094 — — 13,156 — — 79 — — — — — 25,174 — — 246 — — 1,265 — — 2,094 — — 4,142 — — 974 — —
105,205 — —
2020 STATE OF FLORIDA CAFR
319

Operating Indicators by FunctionLast Ten Fiscal Years
SCHEDULE E-2
Fiscal Year
2011 2012 2013 2014 2015General Government
Department of RevenueTotal administered taxes (in millions $) 31,391 31,989 34,659 41,095 43,589
Department of Management Services (1)
Number of retired members covered 318,881 333,870 347,147 362,216 377,671 Education
UniversitiesUniversity enrollments 321,503 329,737 334,989 337,750 341,044 Degrees awarded 76,021 79,323 81,260 83,001 84,445
Human ServicesDepartment of Health (2)
Number of live births 213,237 212,954 215,194 219,905 224,273 Number of deaths 172,856 175,849 180,014 185,038 191,488
Department of Children and FamiliesSupplemental Nutrition Assistance Program (SNAP) recipients 3,170,445 3,326,637 3,581,136 3,565,520 3,693,396 SNAP households 1,725,855 1,815,239 1,962,933 1,946,026 2,029,951
Criminal Justice and CorrectionsDepartment of Corrections
Inmate admissions 34,992 32,279 33,295 32,442 30,985 Community supervision admissions 92,258 90,880 88,819 86,369 83,064 Facility population 102,319 100,527 100,884 100,942 100,050
Natural Resources and EnvironmentDepartment of Environmental Protection
State park and trail visitations 20,442,212 24,983,179 25,575,794 27,170,451 31,108,245 Florida Fish and Wildlife Conservation Commission
Fishing and hunting licenses(3) 1,534,518 1,638,055 1,544,549 2,350,586 2,406,822 Transportation
Department of Highway Safety & Motor VehiclesRegistrations (4) 19,197,024 20,024,942 20,259,599 21,357,026 22,695,334 Titles issued (4) 5,361,258 5,039,215 5,362,575 6,014,150 6,615,964 Traffic crashes (2) (5) 227,998 281,340 316,943 344,170 374,342
Department of Transportation (2)
Daily vehicle miles traveled (in thousands) 288,007 284,051.8 287,977 288,398 307,532 Judicial Branch
Judicial Branch SystemNumber of cases filed/added:Circuit criminal defendants 196,453 188,669 186,117 176,768 171,414 County criminal 405,248 367,478 361,046 355,981 341,499 County civil 459,538 477,024 438,963 417,323 431,868 Traffic 483,644 472,662 383,776 280,102 285,716 Family court 349,222 322,854 289,752 281,154 284,629 Circuit civil 293,415 305,732 294,124 198,856 181,222 Probate 100,849 101,606 107,144 114,024 115,746
Note: Items denoted as unavailable have not been calculated for reporting as of the date of this CAFR.
(1) The Florida Retirement System includes retirees from the following employer groups: State Agencies, County Agencies, District School Boards, Universities, State Colleges, Cities, Special Districts, Hospitals, and Other. Refer to Note 6 and Other Required Supplementary Information for further details.
(2) Information for this agency and/or item is only reported by calendar year. Information reported in each column represents calendar year ended December 31.(3) Beginning in 2014, the count being included reports the number of actual licenses versus prior years that reported the count of license holders.(4) Includes motor vehicles, manufactured homes, and vessels.(5) Effective July 1, 2012, Section 316.066, F.S., was amended to require all law enforcement agencies to report additional crash data to the Department of
Highway Safety and Motor Vehicles. The 2012 data reflects six months of the reporting change in crashes and the 2013 data reflects a full year of the reporting change in crashes. The statutory change resulted in more crash reports being received for reporting.
Sources: Florida Department of Revenue, Florida Retirement System, Florida Board of Governors, Florida Department of Health, Florida Department of Children and Families, Florida Department of Corrections, Florida Department of Environmental Protection, Florida Department of Agriculture and Consumer Services, Department of Highway Safety and Motor Vehicles, Department of Transportation, Florida State Courts
2020 STATE OF FLORIDA CAFR
320

SCHEDULE E-2
Fiscal Year
2016 2017 2018 2019 2020
44,528 46,148 48,502 51,689 49,939
394,527 406,018 415,483 424,612 431,998
345,672 352,116 358,522 362,157 365,447 86,118 87,845 91,390 93,962 96,925
225,018 223,579 221,508 220,010 Unavailable 197,236 203,353 205,461 206,975 Unavailable
3,597,030 3,270,816 3,168,733 2,995,799 2,972,154 1,971,469 1,736,445 1,692,603 1,582,961 1,637,833
30,289 28,783 27,916 28,782 21,276 83,176 83,293 83,820 84,497 65,822 99,119 97,794 96,256 95,626 87,737
31,840,658 32,219,989 28,178,773 29,446,353 24,837,900
2,532,883 2,562,063 2,543,028 2,570,014 2,608,004
22,546,058 22,783,727 23,337,413 23,630,831 23,014,926 6,098,475 6,122,750 6,527,961 6,578,659 6,143,073 395,785 402,385 403,626 401,864 Unavailable
322,051 322,835 334,216 343,628 Unavailable
171,670 169,529 170,117 177,592 158,200 317,587 316,029 293,282 308,438 253,511 428,401 470,957 536,779 619,737 633,952 282,362 278,528 196,313 254,973 193,929 288,430 286,659 277,239 268,870 238,264 176,740 171,515 164,776 208,433 184,223 118,989 122,498 117,356 132,856 132,283
2020 STATE OF FLORIDA CAFR
321

Capital Assets by FunctionLast Ten Fiscal Years
SCHEDULE E-3
Fiscal Year
2011 2012 2013 2014 2015General Government
Department of Management ServicesBuildings(1) 84 86 88 88 90
EducationUniversities and colleges (2)
Assignable square feet (in thousands) 54,488 54,890 56,277 57,938 58,122
Human ServicesDepartment of Health
Buildings 57 73 36 38 38 Vehicles 328 323 315 378 353
Department of Children and FamiliesBuildings 530 296 211 211 211
Criminal Justice and Corrections Department of Corrections
Correctional institutions 61 63 55 56 55 Work camps, forestry camps 41 40 39 38 44 Work release centers 34 33 32 35 34 Other facilities 4 7 16 16 17
Natural Resources and EnvironmentDivision of Recreation and Parks
Number of state parks, greenways, and trails 160 171 171 171 201 Acres of land owned 704,139 788,982 789,059 788,619 792,999
Department of Environmental ProtectionAcres of land owned (3) 4,563,632 4,239,023 4,245,742 4,268,885 4,281,419
Florida Fish and Wildlife Conservation CommissionVehicles 1,637 1,876 1,637 1,800 1,835
Transportation Department of Transportation
Highway lane miles 42,883 43,138 43,337 43,514 43,665 Vehicles 4,683 4,607 4,703 4,406 4,188 Buildings (4) 1,745 391 385 383 417
Judicial BranchJudicial Branch System
Machinery and equipment (5) 9,697 9,199 10,495 10,656 12,295
(1) Beginning with fiscal year 2019, the count included state-owned buildings occupied by full-time equivalent State employees. Previously, the count included certain State-owned buildings not occupied by full-time equivalent employees.
(2) Universities and colleges are presented in the CAFR as discretely presented component units of the state.
(3) Acreage information includes a cumulative total of acres acquired through each program and by donations and exchanges. The Water Management Districts have acquired and hold title to lands through other programs that are not included in this schedule.
(4) Beginning with fiscal year 2020, the count included state-owned buildings occupied by full-time equivalent State employees. Previously, the count included State-owned buildings not occupied by full-time equivalent employees.
(5) In fiscal year 2020, the COVID-19 pandemic caused the purchase increase of machinery and equipment.
Sources: Florida Department of Management Services, Florida Department of Education, Florida Department of Health, Florida Department of Corrections, Florida Division of Recreation and Parks, Florida Department of Transportation, Florida Department of Financial Services, Division of Risk Management, Florida State Courts, Florida Fish and Wildlife Conservation Commission
2020 STATE OF FLORIDA CAFR
322

SCHEDULE E-3
Fiscal Year
2016 2017 2018 2019 2020
91 91 91 72 72
61,706 62,210 62,786 63,056 63,653
36 34 34 36 36 369 370 367 371 365
227 227 227 227 223
56 57 57 57 57 43 42 41 41 41 33 32 29 30 30 17 17 17 17 17
174 174 175 175 175 791,145 790,852 793,882 796,021 797,181
4,284,333 4,319,159 4,345,489 4,377,710 4,428,156
1,787 2,050 2,050 2,050 2,042
43,819 44,064 44,311 44,701 45,031 4,170 4,170 4,145 4,004 4,004 571 478 435 471 214
12,949 12,659 12,505 11,651 14,192
2020 STATE OF FLORIDA CAFR
323

THIS PAGE INTENTIONALLY LEFT BLANK
324

325
