right to buy sales statistical release in england u july ... · right to buy sales in england: july...
TRANSCRIPT

Introduction 2
Right to Buy sales 2
Right to Buy receipts
Starts on site and
acquisitions
7
8
Accompanying Tables 10
Definitions 10
Technical Notes 13
Enquiries 18
Housing Statistical Release 8 December 2016
u
s
i
n
g
R
e
s
e
a
r
c
h
S
u
m
m
a
r
Responsible Statistician:
Claire Gavin
Statistical enquiries:
Office hours:
0303 444 3922
housing.statistics@communities.
gsi.gov.uk
Media Enquiries:
030344 41201
v.uk
Date of next publication:
March 2017
Right to Buy Sales
in England:
July to September 2016 Sales
In July to September 2016-17 (Q2), local authorities sold an estimated 2,856 dwellings under the Right to Buy scheme. This is a decrease of 3% from the 2,941 sold in the same quarter of 2015-16 (see Table 1).
Local authorities in London sold an estimated 718 dwellings under the Right to Buy scheme in July to September 2016-17 (Q2). This is a decrease of 21% from the 912 sold in the same quarter of 2015-16.
Local authorities in London accounted for 25% of sales in 2016-17 Q2; 6 percentage points lower than the 31% recorded in the same quarter of 2015-16 (see Chart 1).
Receipts
In 2016-17 Q2 local authorities received approximately £244.4 million from Right to Buy sales, 6% higher than the £230.0 million in the same quarter of 2015-16 (see Table 2).
The average receipt per dwelling sold in 2016-17 Q2 was £86,000, this compares to £78,000 in the same quarter of 2015-16 (see Table 3).
2 Housing Statistical Release
Introduction
This statistical release presents Official Statistics on the number of sales of dwellings under the
Right to Buy scheme, as well as providing statistics on receipts resulting from those sales and
starts on site and acquisitions as part of the one-for-one additions policy. The Right to Buy scheme
allows eligible social housing tenants to buy their house at a reduced price and has been in place
since 1980 (see History of the Right to Buy scheme for more detail).
These statistics relate only to sales by local authorities under the Right to Buy scheme and
exclude sales by Private Registered Providers (PRPs) under preserved Right to Buy. Sales by
PRPs are recorded in Social Housing Sales, see Related Statistics. Figures are collected from
local authority returns to the Department for Communities and Local Government (DCLG).
Following the outcome of an on-going data improvement exercise and in line with the revisions
policy there are a number of revisions to historical data relating to starts on site in this release. Full
details of these revisions are provided in the revisions section of the technical note at the end of
this release (see Revisions in this release).
Right to Buy sales
There was a downward trend in Right to Buy sales in the late-2000s, and the number of sales
decreased greatly between 2006-07 and 2009-10 (caused mainly by the financial crisis). Right to
Buy sales were relatively stable between 2009-10 and 2011-12.
The increase in Right to Buy sales since 2011-12 is partly due to the increased discounts available
to local authority tenants from 1st April 2012 and the reduced effects of the financial crisis.
Additionally, in March 2013 the Government further increased the maximum discount available for
tenants living in London boroughs to £100,000 (see History of the Right to Buy scheme for further
details).

3 Housing Statistical Release
Table 1: Quarterly Right To Buy sales, England, 2007-08 Q1 to 2016-17 Q2
Q1 Q2 Q3 Q4 Total
2007-08 3,553 3,454 2,954 2,082 12,043
2008-09 1,286 851 455 277 2,869
2009-10 293 532 789 761 2,375
2010-11 657 689 714 698 2,758
2011-12 615 764 693 566 2,638
2012-13 442 1,041 2,011 2,450 5,944
2013-14 2,181 2,846 2,853 3,381 11,261
2014-15 2,849 2,847 3,288 3,321 12,304
2015-16 2,779 2,941 3,250 3,276 12,246
2016-17 3,368 2,856 6,224
For annual data back to 1980-81, refer to Live Table 671 at this link: https://www.gov.uk/government/statistical-data-sets/live-tables-on-social-housing-sales
In July to September 2016-17 (Q2), local authorities sold an estimated 2,856 dwellings
under the Right to Buy scheme. This is a decrease of 3% compared to the 2,941 dwellings
sold in the same quarter of 2015-16.
Local authorities in London sold an estimated 718 dwellings under the Right to Buy scheme in July to September 2016-17 (Q2). This is a decrease of 21% from the 912 sold in the same quarter of 2015-16.
Local authorities in London accounted for 25% of sales in 2016-17 Q2; 6 percentage points
lower than the 31% recorded in the same quarter of 2015-16.
Right to Buy sales are yet to reach the level they were before the financial crisis. Sales in
2016-17 Q2 were 61% of those in 2006-07 Q1.

4 Housing Statistical Release
Chart 1: Quarterly Right to Buy Sales by local authority type, England,
2006-07 Q1 to 2016-17 Q2
5 Housing Statistical Release
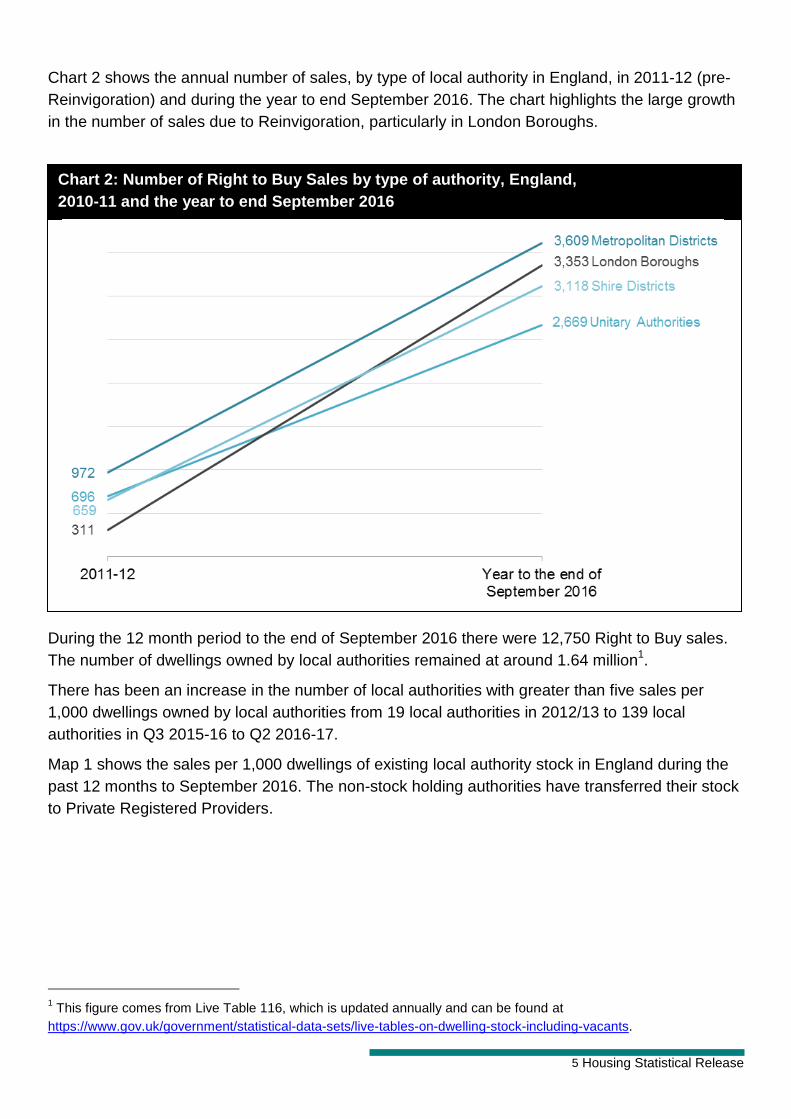
Chart 2 shows the annual number of sales, by type of local authority in England, in 2011-12 (pre-
Reinvigoration) and during the year to end September 2016. The chart highlights the large growth
in the number of sales due to Reinvigoration, particularly in London Boroughs.
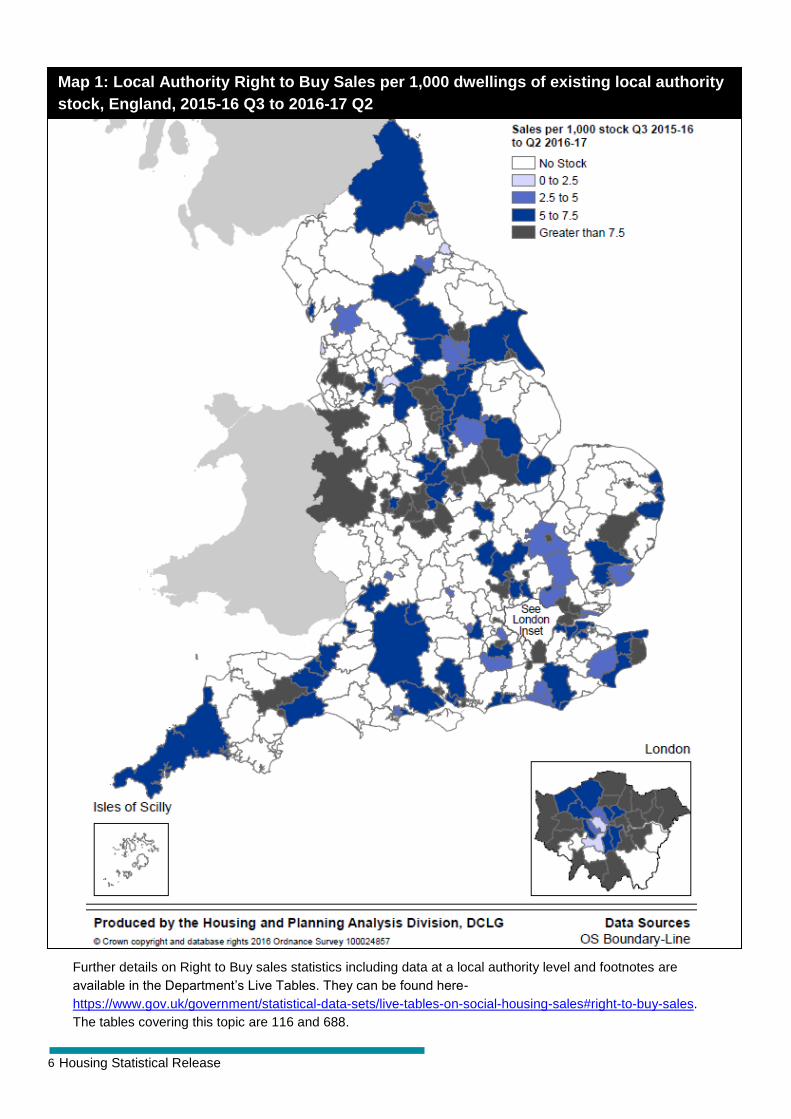
During the 12 month period to the end of September 2016 there were 12,750 Right to Buy sales.
The number of dwellings owned by local authorities remained at around 1.64 million1.
There has been an increase in the number of local authorities with greater than five sales per
1,000 dwellings owned by local authorities from 19 local authorities in 2012/13 to 139 local
authorities in Q3 2015-16 to Q2 2016-17.
Map 1 shows the sales per 1,000 dwellings of existing local authority stock in England during the
past 12 months to September 2016. The non-stock holding authorities have transferred their stock
to Private Registered Providers.
1 This figure comes from Live Table 116, which is updated annually and can be found at
https://www.gov.uk/government/statistical-data-sets/live-tables-on-dwelling-stock-including-vacants.
Chart 2: Number of Right to Buy Sales by type of authority, England, Chart 2: Number of Right to Buy Sales by type of authority, England,
2010-11 and the year to end September 2016
6 Housing Statistical Release
Further details on Right to Buy sales statistics including data at a local authority level and footnotes are
available in the Department’s Live Tables. They can be found here-
https://www.gov.uk/government/statistical-data-sets/live-tables-on-social-housing-sales#right-to-buy-sales.
The tables covering this topic are 116 and 688.
Map 1: Local Authority Right to Buy Sales per 1,000 dwellings of existing local authority
stock, England, 2015-16 Q3 to 2016-17 Q2

7 Housing Statistical Release
Right to Buy receipts
Statistics for receipts and starts on site are only available back to 2012-13 Q1.
Table 2: Quarterly Right To Buy receipts, England, 2012-13 Q1 to 2016-17 Q2, £ millions
Q1 Q2 Q3 Q4 Total
2012-13 24.0 61.2 125.0 157.6 367.9
2013-14 130.8 180.2 196.8 243.0 750.7
2014-15 212.4 210.5 247.5 260.6 930.9
2015-16 223.2 230.0 259.0 273.2 985.4
2016-17 284.0 244.4 528.4
In 2016-17 Q2 local authorities received approximately £244.4 million from Right to Buy
sales, 6% higher than the £230.0 million in the same quarter of 2015-16. This is due to the
increase in house prices.
Table 3: Quarterly average receipts per dwelling, England, 2012-13 Q1 to 2016-17 Q2, £ thousands
Q1 Q2 Q3 Q4 Year Average
2012-13 54 59 62 64 62
2013-14 60 63 69 72 67
2014-15 75 74 75 78 76
2015-16 80 78 80 83 80
2016-17 84 86 85
The average receipt per dwelling sold in 2016-17 Q2 was approximately £86,000,
compared to £78,000 in the same quarter of 2015-16.
Further details on Right to Buy receipts statistics including data at a local authority level and footnotes are
available in the Department’s Live Tables. They can be found here- https://www.gov.uk/government/statistical-
data-sets/live-tables-on-social-housing-sales#right-to-buy-sales.
The table covering this topic is 692.

8 Housing Statistical Release
Starts on site and Acquisitions
In April 2012, March 2013 and July 2014 the Government made changes to the Right to Buy
scheme, increasing the maximum discount caps. An estimate of the expected sales without
these increases to the discount cap was calculated using projections from Her Majesty’s
Treasury’s (HMT) self-financing model. Any Right to Buy sales above these projections are
considered ‘additional’ and are subject to the one-for-one additions policy, which is a
commitment to provide an affordable dwelling for each additional Right to Buy dwelling sold.
Under the Right to Buy one-for-one additions policy local authorities have three years from the
date of the sale of each additional home to provide an additional affordable property. If a local
authority does not provide an additional affordable property, a proportion of the receipt is
transferred to the Homes and Communities Agency (HCA) or Greater London authority (GLA),
who use these recycled Right to Buy receipts to deliver starts and acquisitions.
Table 4a shows the total quarterly Right to Buy starts and acquisitions that have been
delivered by local authorities, the HCA and GLA through the Right to Buy additions policy.
Table 4a: Total Quarterly Right To Buy Starts on Site and acquisitions, including those by the HCA and GLA, England, 2012-13 Q1 to 2016-17 Q2, dwellings2
Q1 Q2 Q3 Q4 Total
2012-13 24 136 77 322 559
2013-14 126 303 472 714 1,615
2014-15 614 672 597 1,233 3,116
2015-16 338 688 513 865 2,404
2016-17 530 1,236 1,766
Total 9,460
There were 1,236 dwellings started on site or acquired in total in 2016-17 Q2, 80% more
than the number started or acquired in the same quarter of 2015-16.
The HCA and GLA have used recycled Right to Buy receipts from local authorities to deliver
1,300 starts and acquisitions between 2012-13 Q1 and 2016-17 Q2. Adding these 1,300 to
the 8,160 delivered by local authorities gives 9,460 in total.
There were 6,389 additional sales between 2012-13 Q1 and 2013-14 Q2. There have been
9,460 additional affordable units started by local authorities, the HCA and GLA between
2012-13 Q1 and 2016-17 Q2, thereby exceeding the target for one-for-one additions.
2 Table 4a includes Starts on Site and acquisitions by the HCA and GLA using recycled receipts and therefore does
not match LT 693. Table 4b, however, includes Starts on Site and acquisitions by Local Authorities only and therefore
matches LT 693.

9 Housing Statistical Release
Table 4b shows the quarterly Right to Buy starts and acquisitions that have been delivered by
local authorities through the Right to Buy additions policy.
Table 4b: Quarterly Right To Buy Starts on Site and acquisitions by Local Authorities, England, 2012-13 Q1 to 2016-17 Q2, dwellings
Q1 Q2 Q3 Q4 Total
2012-13 24 136 77 322 559
2013-14 126 303 472 486 1,387
2014-15 522 481 486 771 2,260
2015-16 338 626 394 843 2,201
2016-17 530 1,223 1,753
Total 8,160
To ensure that the accuracy of starts on site and acquisitions figures the department contacts
local authorities with more starts on site and acquisitions than our validation threshold, for
confirmation of their figures.
There has been a recent initiative to improve the coverage and consistency of the starts on site
and acquisitions reported to DCLG by Local Authorities. More details on this can be found in the
technical note at the end of this release (see Revisions in this release).
Further details on Right to Buy starts and acquisitions statistics including data at a local authority level and
footnotes are available in the Department’s Live Tables. They can be found here-
https://www.gov.uk/government/statistical-data-sets/live-tables-on-social-housing-sales#right-to-buy-sales.
The table covering this topic is 693.
10 Housing Statistical Release
Accompanying Tables Accompanying tables are available to download alongside this release. These are:
Table 691 Quarterly Right to Buy sales by local authority
Table 692 Quarterly Right to Buy receipts by local authority
Table 693 Quarterly starts on site and acquisitions by local authority
These tables can be accessed at https://www.gov.uk/government/statistical-data-sets/live-tables-on-social-housing-sales These contain local authority level data on Right to Buy sales, receipts and starts on site.
Further information on other types of Social Housing Sales, such as sales by Private Registered
Providers (PRPs), often known as Housing Associations, are also available on this page. The
other statistics are annual rather than quarterly and collected from other sources: Local Authority
Housing Statistics (LAHS), the Homes and Communities Agency’s Statistical Data Return (SDR)
and COntinuous REcording of Lettings and Sales in Social Housing in England (CORE) - rather
than LOGASNet (see Data Collection).
The tables on stock may also be useful, for example the stock data used in the map in the
Right to Buy sales section can be found in Live Table 116 here:
https://www.gov.uk/government/statistical-data-sets/live-tables-on-dwelling-stock-including-vacants
Definitions
Right to Buy sale
The sales figures exclude Right to Buy (RTB) sales of dwellings which are not accounted for in a
local authority’s Housing Revenue Account, either because the authority, having disposed of
nearly all its dwellings to a PRP, has closed down its Housing Revenue Account or because the
dwelling was originally tied to a particular occupation, e.g. a school caretaker’s cottage or a park
keeper’s cottage. The figures also may exclude any Right to Buy sales of dwellings which,
although accounted for in the Housing Revenue Account, are the subject of an agreement made
either under section 80B of the Local Government and Housing Act 1989 (as inserted by section
313 of the Housing and Regeneration Act 2008 and now repealed) or under section 11(6) of the
Local Government Act 2003 (as inserted by section 174 of the Localism Act 2011). The figures
may include sales at less than market value of dwellings accounted for in the Housing Revenue
Account to secure tenants of a local authority, even when those sales are not strictly under Right
to Buy.

11 Housing Statistical Release
Proportions of dwellings
Some figures will include proportions of dwellings. This is because the figures also include sales of
a shared ownership lease of a dwelling accounted for in the Housing Revenue Account where
either the premium (i.e. a portion of the market value of the dwelling) paid by the purchaser
exceeded 50% of the market value of the dwelling or the sum of the premium paid by the
purchaser and all other premiums paid up to two years before the payment of the current
premium. Where a shared ownership disposal has been included, the figure corresponds to the
portion of the market value paid; for example the purchase of a 50% equity share will be
represented by 0.5.
Right to Buy receipts
The figures include receipts arising from all sales included in the sales figures. Figures for a
particular quarter may include receipts arising from a sale in another quarter, but do not include
receipts arising from sales before 1 April 2012. After a portion of these receipts are reserved for
costs incurred by authorities in administering the RTB scheme, paying off additional local authority
housing debt, an amount for authorities to use for general capital purposes, a share required by
HM Treasury, and (in a small number of cases) for buying back former council properties, the
remainder of the receipts are for the funding of additional homes for affordable or social rent.
A local authority may either return this portion of the receipts to the Homes and Communities
Agency (HCA) or Greater London Authority (GLA) for redistribution for funding these additional
homes, or, if it has signed an agreement with DCLG, retain part or all of this portion on the
condition that it spends, or ensures that another body spends on its behalf, an agreed amount for
this same purpose within three years.
Starts on site and acquisitions
The figures include all starts on site and acquisitions of dwellings for the provision of social
housing made by or on behalf of the authority, excluding those funded partially or wholly by grant
from the HCA or the GLA.
These figures form a proxy for the number of additional homes delivered using RTB receipts. In
some cases they may include some starts on site or acquisitions that are funded by other sources.
Provision was made for some local authorities to include HCA or GLA spending for starts on site
or acquisitions, where business decisions had already been made in 2012-13, before the
Department clarified that these should be excluded.

12 Housing Statistical Release
“Start on site” means the earlier of commencement of the following by a local authority or other
body to which the authority has paid all or part of the retained amount for the purpose of providing
homes for affordable or social rent:
(a) excavation for strip or trench foundations or for pad footings;
(b) digging out and preparation of ground for raft foundations;
(c) vibrofloatation, piling, boring for piles or pile driving; or
(d) drainage work specific to the buildings forming part of the scheme.
Market price
Most landlords contract a surveyor to determine the property value but some may use a local
estate agent, for example. If a tenant disagrees with the property value, they can appeal to the
district valuer (the VOA) who will survey the property and provide a final, binding decision.
History of the Right to Buy scheme
The Right to Buy scheme was introduced in 1980 and gives qualifying social tenants the
opportunity to buy their rented home at a discount. The scheme is open to secure tenants of local
authorities and non-charitable PRPs, and to those assured tenants of PRPs who have transferred
with their homes from a local authority as part of a stock transfer. In order to qualify for the Right to
Buy scheme, a social tenant must have accrued at least three years public sector tenancy. This
does not need to be continuous, nor does it need to have been accrued whilst living in the tenant's
current property.
In 1998 and 2003 Discount Orders reduced Right to Buy discounts across England to maximums
ranging from £16,000 to £38,000 (depending on the local authority where the property was
located). Prior to that, the discount cap had been £50,000 across England.
In April 2012 the DCLG changed the maximum cash discount available for Right to Buy sales to a
new higher level of £75,000 across England. In March 2013, in recognition of the increasing
property prices in London, the Government further increased the maximum discount available for
tenants living in London boroughs to £100,000. In July 2014 DCLG changed the maximum cash
discount available for the Right to Buy in order for it to increase annually in line with the Consumer
Price Index (CPI) rate of inflation. The discount is currently £77,900 in England and £103,900 in
London.
The Government’s aim is that for every additional property sold under Right to Buy, a new
affordable home for rent will be provided nationally under the one-for-one additions policy. Under
the reinvigorated Right to Buy, local authorities are now able to keep the receipts from additional
Right to Buy sales to pay off debt and fund additional affordable housing.

13 Housing Statistical Release
Technical notes
Data collection Data are collected from a quarterly local authority return to the DCLG called LOGASNet. Local
authorities with dwelling stock which receive poolable housing receipts supply these data to DCLG
on a quarterly basis.
Data quality The LOGASNet figures are audited annually by local authorities and continuously quality assured
by DCLG, both of which can result in revisions (see Revisions Policy). The figures are compared
against those supplied through the annual LAHS return for consistency, which again can result in
revisions. Every effort is made to collect data from every local authority but in occasional instances
estimates may be used. Care should be taken using data at a local authority level as the totals are
low and therefore can be volatile.
DCLG has imputed values for local authorities who did not submit data. In Q1 2016-17 sales,
receipts and starts-on-site were imputed as zero for 17 local authorities. We expect to revise these
figures in a future release, once the local authorities have submitted this data.
Starts on site and acquisitions
The starts on site and acquisitions data are particularly sensitive to reporting error as they are not
audited in the way that sales and receipts figures are and there are no comparable statistics
collected against which they can be assessed. Consultation has revealed that the question the
Department asks in its LOGASnet Return about starts on site and acquisitions has been
interpreted in different ways by different local authorities. For example, in the past some local
authorities may have reported all starts on site and acquisitions rather than excluding those that
were partially or fully funded by the HCA or GLA.
It is possible that interpretation of starts on site and acquisitions by local authorities may still not be
uniform. Whilst most local authorities should now be (correctly) reporting all starts on site or
acquisitions not funded by the HCA or GLA, there may be some others interpreting the question
more narrowly as only referring to delivery directly funded by RTB receipts. We will continue to
work with local authorities to improve the quality of the data and the way it is collected.
In some cases the quarter in which the start is reported may be later than the actual quarter when
the start actually occurred. This is caused by a delay between the start on site occurring and this
being reported to us via the local authority.

14 Housing Statistical Release
Revisions policy This policy has been developed in accordance with the UK Statistics Authority Code of Practice for
Official statistics and the Department for Communities and Local Government Revisions Policy
(found at https://www.gov.uk/government/publications/statistical-notice-dclg-revisions-policy).
There are two types of revisions that the policy covers:
Non-Scheduled Revisions
Where a substantial error has occurred as a result of the compilation, imputation or dissemination
process, the statistical release, live tables and other accompanying releases will be updated with a
correction notice as soon as is practical.
Scheduled Revisions
Revisions to imputed data (see Data Quality) will be made in the next release after this data is
submitted by the Local Authority.
Otherwise, revisions to previous quarters are only made in exceptional circumstances. Significant
revisions to previous years are made once a year in the Social Housing Sales Statistical release.
Figures are not published in these statistics with a provisional status (but imputed estimates may
be used) and the component data are reported as final annual figures. Revised figures are
highlighted in the live tables.
Revisions in this release
The data provided to the department by local authorities is regularly reviewed for monitoring
purposes. As part of this monitoring it was noted that there were a number of local authorities
reporting unusual and unexpected values. These values included cases where:
Local authorities reported a high number of received receipts but had reported a relatively low number, or zero associated replacement starts.
Local authorities reported a high amount of expenditure on replacements but had reported a relatively low number, or zero associated replacement starts.
Authorities which appeared to have been affected were contacted and as a result 34 authorities
have they needed to amend their historical figures.
A breakdown of the authorities that have revised their figures compared to what they had previ-ously reported is provided in the table below.

15 Housing Statistical Release
Table 5: Local Authorities with revised data in this quarter, including the number of starts now recorded in Live Table 693, the number previously reported in Live Table 693 and the difference
Total starts reported in this release from 2012-
13 Q1 to 2016-17 Q1
Total previously reported (2012-13 Q1 to 2016-17 Q1)
Net change in number of starts
Ashfield 52 2 50
Bournemouth 71 22 49
Castle Point 28 25 3
City of London 18 0 18
Dacorum 229 7 222
Dudley 63 28 35
Greenwich 98 0 98
Guildford 77 31 46
Hammersmith & Fulham 16 3 13
Haringey 1 0 1
Harrogate 0 16 -16
Harrow 24 1 23
Havering 11 40 -29
Kensington 27 22 5
Kingston upon Thames 34 0 34
Kirklees 45 6 39
Leicester 253 14 239
Lewisham 84 70 14
Newham 110 65 45
North Warwickshire 31 11 20
Redbridge 46 3 43
Rotherham 55 25 30
South Derbyshire 37 26 11
South Holland 4 0 4
Southampton 12 0 12
Stroud 49 0 49
Sutton 46 3 43
Thanet 17 2 15
Thurrock 81 12 69
Waltham Forest 34 21 13
Wigan 0 55 -55
Wiltshire 22 0 22
Woking 11 0 11
Wolverhampton 49 19 30
Total 1,206

16 Housing Statistical Release
Uses of the data These statistics are used to monitor local authority Right to Buy sales and analyse the
effectiveness of policy changes around Right to Buy and the housing sector.
User engagement
Users are encouraged to provide feedback on how these statistics are used and how well they
meet user needs. Comments on any issues relating to this statistical release are welcomed and
encouraged. Responses should be addressed to the "Public enquiries" contact given in the
"Enquiries" section below.
The Department’s engagement strategy to meet the needs of statistics users is published here:
https://www.gov.uk/government/publications/engagement-strategy-to-meet-the-needs-of-statistics-
users
Related statistics, England Social Housing Sales
DCLG publish annual statistics on Social Housing Sales. These statistics cover sales not only by
local authorities but by PRPs under preserved Right to Buy and by all schemes not solely Right to
Buy (for example Social Homebuy). The statistics are collected from DCLG’s Local Authority
Housing Statistics return.
https://www.gov.uk/government/organisations/department-for-communities-and-local-
government/series/social-housing-sales-including-right-to-buy-and-transfers
Private Registered Provider stock
The Homes and Communities Agency (HCA) publish annual statistics collected through its
Statistical Data Return (SDR) on stock size, location, type, provider characteristics and rents
relating to PRPs in England. Data from the SDR is the main source of PRP data used in the social
housing sales statistics.
https://www.gov.uk/government/collections/statistical-data-return-statistical-releases
HCA Housing Statistics
The HCA publish bi-annual statistics collected through its IMS and PCS returns detailing the
housing starts on site and housing completions delivered by the HCA.
https://www.gov.uk/government/collections/housing-statistics
GLA Housing Statistics
The Greater London Authority (GLA) publish monthly statistics detailing the housing start on site
and housing completions delivered by the GLA.
https://www.london.gov.uk/WHAT-WE-DO/housing-and-land/increasing-housing-
supply/affordable-housing-statistics
Dwelling stock estimates
DCLG also publish statistics showing the total dwelling stock in England each year and estimates
of stock by local authority district and tenure. They can be found at the following link:
www.gov.uk/government/statistical-data-sets/live-tables-on-dwelling-stock-including-vacants

17 Housing Statistical Release
Devolved administration statistics Data for Wales
The Welsh Government publish information on Social Housing sales, which does include
information on Right to Buy sales. The latest release can be found at the following link:
http://wales.gov.uk/statistics-and-research/social-housing-sales/?lang=en
Data for Scotland
The legislation in Scotland is different but the principals are similar. The Scottish Government
publish information on Social Housing sales, which does include information on Right to Buy sales.
The latest release can be found at the following link:
http://www.scotland.gov.uk/Topics/Statistics/Browse/Housing-Regeneration/HSfS/Sales
Data for Northern Ireland
In Northern Ireland social tenants have the right to a statutory house sale, which is similar to a
Right to Buy. The latest release can be found at the following link:
https://www.communities-ni.gov.uk/topics/housing-statistics
Official Statistics This Statistical Release is published at 9.30am on a date which has been pre-announced on the
DCLG Statistics Release Calendar
(https://www.gov.uk/government/statistics/announcements?utf8=%E2%9C%93&organisations%5B
%5D=department-for-communities-and-local-government).
A list of officials who have received pre-release access to this Statistical Release up to 24 hours in
advance of publication is available on the Department’s website
(https://www.gov.uk/government/organisations/department-for-communities-and-local-
government/about/statistics#pre-release-access-to-official-statistics).
Next Publication The next release, Right to Buy sales in England 2016-17 Q3, will be released in March 2017. The
precise date will be announced on the DCLG Statistics Release Calendar
(https://www.gov.uk/government/statistics/announcements?utf8=%E2%9C%93&organisations%5B
%5D=department-for-communities-and-local-government).

18 Housing Statistical Release
Enquiries
Media enquiries:
030344 41201
Email: [email protected]
Public enquiries and Responsible Statistician:
Claire Gavin
Email: [email protected]
Information on Official Statistics is available via the UK Statistics Authority website:
http://www.statisticsauthority.gov.uk/
Information about statistics at DCLG is available via the Department’s website:
www.gov.uk/government/organisations/department-for-communities-and-local-
government/about/statistics
© Crown copyright, 2016
Copyright in the typographical arrangement rests with the Crown.
You may re-use this information (not including logos) free of charge in any format or medium, under the terms of the Open Government Licence. To view this licence,http://www.nationalarchives.gov.uk/doc/open-government-licence/version/3/ or write to the Information Policy Team, The National Archives, Kew, London TW9 4DU, or email: [email protected].
This document/publication is also available on our website at www.gov.uk/dclg
If you have any enquiries regarding this document/publication, complete the form at http://forms.communities.gov.uk/ or write to us at:
Department for Communities and Local Government Fry Building 2 Marsham Street London SW1P 4DF Telephone: 030 3444 0000 December 2016
For all our latest news and updates follow us on Twitter: https://twitter.com/CommunitiesUK
ISBN: 978-1-4098-4959-9