rigid plastic packaging container recycling rate report · project manager pat schiavo ... and...
TRANSCRIPT
RIGID PLASTIC PACKAGING
CONTAINER RECYCLINGRATE REPORT
JUNE 1993 "
STATE OF CALIFORNIA
Pete Wilson,. GOVERNOR
.... James M. St~Ock .o.Secre:~ary for Environmental Protection
California Environmental Protecti0n-Agency
CALIFORNIA INTEGRATED,WASTE MANAGEMENT BOARD
Michael R. FrostCH~R~
Wesley ChesbroVICE CHAIRMAN
Sam A. Egigian
Jesse R. Huff
Kathy Neal
Paul Relis
Ralph E. ChandlerEXECUTIVE DIRECTOR
JUNE ! 993
California Integrated Waste Management Board8800 Cal Center Drive
Sacramento. CA 95826
Printed On Reo~:ted Paper
Acknowledgments
This report was written under the ,direction of the Local,~.,~sistance and Planning Committee.
Committee Members. "
~/e~ley Chesbro iChairman)Kathy NealPaul Reli$
Project ManagerPat Schiavo
Principal Au~orsBendan Blue
Kristina :L.oquist
The authors would like to express appreciation for support andcooperation received from other CIWMB staff, and from numerouslocal government and private sector representatives, ’
NOTE: Legislation (SB 63, Strickland, Chapter 21, Statutes of 2009) signed into law by Gov. Arnold Schwarzenegger eliminated the California Integrated Waste Management Board (CIWMB) and its six‐member governing board effective Dec. 31, 2009.
CIWMB programs and oversight responsibilities were retained and reorganized effective Jan. 1, 2010, and merged with the beverage container recycling program previously managed by the California Department of Conservation.
The new entity is known as the Department of Resources Recycling and Recovery (CalRecycle) and is part of the California Natural Resources Agency. It is no longer part of the California Environmental Protection Agency (Cal/EPA).
****
This document was originally produced in hard‐copy format. It was converted to electronic form in December 2011.
Publication # DRRR‐2011‐042
TABLE OF CONTENTS
Note to Reader ............. , ........................................... - "" .
1’- ..........................Introduction ........ : ........................ ’"’ ......’ ..........................’ ............
A, Rigid Plastic Packaging Containers . .,, .
¯ B. Report Scope
I1. Calculating Recycling Rates.. ............................................................. " ...............o
A. Recycling Rate Formula
B. Non-PETE Recycling Rates
C. PETE Recycling RatesD. Aggregate Recycling Rates (PETE + Non-PETE)
III. Future Directions .................................. , ............................................
APPENDIX
11Introduction ....................................................................’ .......................................
A. Rigid Plastic Packaging Containers (RPPCs)
B. Appendix ScopeC. Appendix Organization
13II. Calculating Recycling Rates ........... ,..~ ..... , ........-’ ......, .............................................
A. Statutory Standards and Definitions
B. Formula for Calculating Recycling Rates
C. Units for Calculating Recycling Rates
D. Status of Exempt Containers
III. Non-PETE RPPC Recycling Rates ..... : .......,. ........., ............
A. Numerator: Non-PETE RPPC Tonnage RecycledOption 1: Extrapolate U.S., EPA Diversion Data to California Based on Population
Option 2: Extrapolate SPI Recycling Data to California Based on Population
Option 3: Use AB 939 Reported Diversion Data
NOTE TO READER
Public Resources Code Section 42310mandates the
California Integrated Waste Management Board
(Boar,d) on January 1 of each year, commencing in
1993, to publish annual reports that document
recycling rates for polyethylene terephthalate (PETE)rigid plastic packaging containers (RPPCs) and. no~PETE RPPCs. 3"0 comply with that mandate, the
Board has Dublished the followingreport entitled
Rigid Plastic, Packaging Container Recycling Rate
Report (the Report), as prepared’ by Board staff.
As this was the initial effort in performing the annualrecycling rate study, Board staff had to rely on.,.
existing data sources that are commonly available to
the general public and government agencies, The
Board notes that use of these data sources wasproblemmatic in that categories and methc~ds for
extracting information did not align with the statutory
definition of an RPPC. In addition, availableinformation was not California-specific, nor, was it
considered highly accurate. Another problemencountered was that the statutory due date for the
report isJanuary first of each year; however, data
reiated to this subject are not available untilmid-year. "
In an attempt to provide a "readable" document, the
report briefly describes the methods used to
calculate recycling rates,and expresses the primary
concerns .with each of the methods, Because of
concerns regarding various data sources, the Reportexamines a range of different recycling rates,
estimates the most "reasonable rate." and presents
a recommended method for obtaining data for future
reports. The appendix provides a more thorough "
analysis of the recycling rates and offers complex
calculations and a complete analysis of the
implications of using existing data sources. In this
appendix, the specific shortcomings relating to
individual data sources and methods used to
extrapolate RPPC recycling rates are provided in
detail.
It should be emphasized that while the methodolo-gies u~ed tO obtain (he rate estimates are Uncertain.
the estimates arrived at are consistent with industry
estimates based nn rmtional data. For example, the
Report estimates that the 1991 recycling rate for allRPPCs regardless of resin type was between eight
and ten percent. In their 1992 Post-ConsumerPlastics Recycling Rate Study, the American Plastics.Council estimates that the 1991 bottle and rigid
container recycling rate was 11 percent.
Acknowledging the shortcomings with existing
available data sources, Board staff have initiated andintend to continue discussions witl~ industry
associations to arrive at a mutually acceptablemethodology for determining annual California-
specific RPPC recycling rates. In addition.because of
de~ays in obtaining data, the Board suggests that
current taw be amended (PI~C Section 42310) to
specify May 31 as an alternative publication date forthe report.
B, Denominator: Non-PETE RPPC Tonnage GeneratedOption 1: Extrapolate National Resin Sales to California Based on Population
Option 2: Use U,S, EPA Generation Data in Conjunction with Resin Sales Data
Option 3: Use AB 939 Plastic Generation Statistics in Conjunction with National
Resin Sales DataOption 4: Use Statistics Maintained by California State Agencies in Conjunction with
U,S, EPA Data
�, Range of N0~-PETE Recycling Rates’D, Non-PETE RPPC Recycling Rate Conclusion~
~ .... 31IV. PETE RPPC Recycling Rates ............................................ : ..........................~ .....
A, Numerator: PETE RPPC Tonnage RecycledOption 1: Extrapolate :National Diversion Rates to California. Based on Population
Option 2: Extrapolate SPI Recycling Data to California Based on Population
Option 3: Use AB 939 Reported Diversion DataOption 4: Integrate Statistics Maintained by California State Agencies with SPI
Recycling Data
B. Denominator: PETE RPPC Tonnage SoldOption 1: Extrapolate National Resin Sales to California Based on PopulationOption 2: Use U,S, EPA Generation Data in Conjunction with National Resin Sales Data
Option 3: Use AB 939 PETE Container Generation StatisticsOption 4: Integrate Statistics Maintained by California State Agencies in Conjunction
with National Resin Sales Data
C. Range of PETE RPPC Recycling Rates.-D, PETE RPPC Recycliqg Rate Conclusions . --
Aggregate Recycling Rates (PETE ÷ non-PETE) .............................................. = .... 43
Future Directions , . - . ........................... 45
A, Recommendations for Alternative Methods to Calculate Recycling Rates i ¯
B. Proposed ~Legislative Amendments to Current Statutory Language
ENDNOTES 51
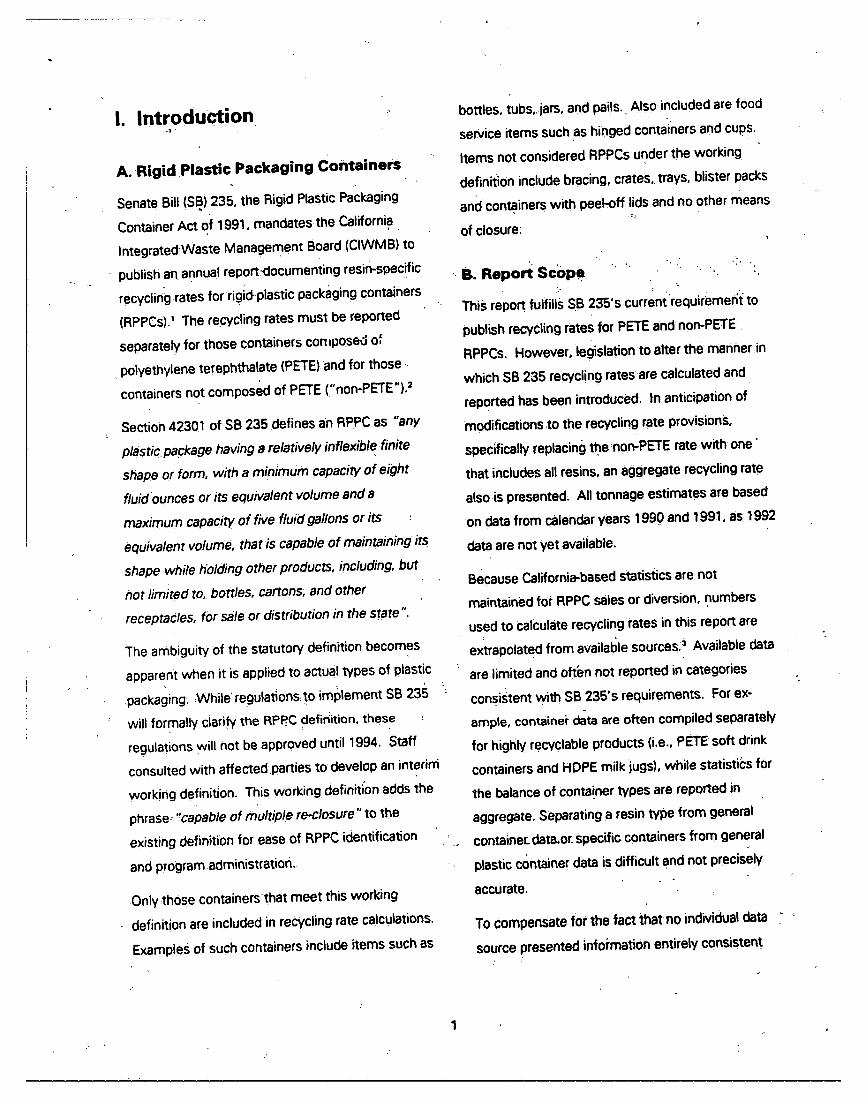
I. Introduction,
A. Rigid Plastic Packaging Containers
Senate Bill (SB,) 235, the Rigid Plastic Packaging
Container Act of 1991, mandates the CaliforniaIntegratedWaste Management Board (CIWMB) to
publish art annual report:documenting resi~specificrecycling rates for rigid, plastic packaging containers
(RPPCs).~ The recycling rates must be reportedseparately for those containers conLpose~ of
polyethylene terephthalate (PETE) and for those -.containers not composed of PETE ("non-PETE"),=
Section 42301 of SB 235 defines an RPPC as "any
p/astic.pa,ckage having a relatively inflexible finite
shape or form, with a minimum capacity of eightfluidounces or its equivalent volume and a
maximum capacity of five fluid gallons or its’ :equivalent volume, that is capable of maintaining its
shape while hb/ding other products, including, but
not limited to, bottles, cartons, and otherreceptacles, for sale or distribution in the state",
The ambiguity of the statutory definition becomes
apparent when it is applied to actual types of plastic
packaging. ,While regulations, to implement SB 235
will formally clarify the RPP..C definition, these
regulations will not be approved until 1994. Staff
consulted with affected parties to develop an inter~rri
working definition. This working definiti’on adds the
phrase; "capable of multiple re-closure" to the
existing definition for ease of RPPC identification
and program administration.
Only those containerSthat meet this workingdefinition are included in recycling rate calculations.
Example~ of such containers include items such as
bottles, tubs, jars, and pails. Also included are food
service items such as hinged containers and cups.
Items not considered RPPCs under the working
definition include bracing, crates, trays, blister packs
anti containers with peel-off lids and no other means
of closure:
S. Repod ScOpe.
Thi~ report fulfills SB 235’s currentrequiremer~ to
publish recycling rates for PETE and non-PETE
RPPCs, However. legislation to alter the manner inwhich SB 235 recycling rates are calculated and
reported has been introduced, In anticipation ofmodifications to the recycling rate prows~ons,
specifically replacing the non-PETE rate with one"
that includes all resins, an aggregate recycling rate
also is presented. All tonnage estimates are basedon data from calendar years 1990 and 1991. as 1992
data are not yet available.
Because California-based statistics are not
maintained for RPPC sales or diversion, numbersused to calculate recycling rates in this report areextrapolated from availal~le sources.~ Available data
are limited and often not reported in categories
consistent .with SB 235’s requirements. For ex-ample, containe~ data are often compiled separatelyfor highly recyclable products (i.e.. PETE soft drink
containers and HDPE milk jugs), while statistics for
the balance of conta!ner types are reported in
aggregate. Separating a resin type from generalcontainer-data~or, specific containers from general
plastic c~ntainer data is difficult and not precisely
accurate.
To compensate for the fact that no individual data
source presented information entirely consistent
with SB 235’s parameters, staff accessed multiple
data sources. This resulted in multiple estimates
for generation and recycling of PETE and non-PETE
RPPCs. To convey the variation between the
sources, a range of recycling rates is presented.
The limits associated with each data source and¯ extrapolation are discussed in the appendix.
.To comply wi~h SB 235’s mandate tO publish annual
recycling rates and due to insufficient information
regarding RPPC recycling and generation, a range of
rates was developed. It is critical that PETE and
non-PETE recycling rates contained in future reports
be as accurate as possible. Methods that may be
used in the future to obtain more accurateinformation are provided in Section III. FutureDirections. In the interim, in{ormation in this report
can be used by product m. anufactu. ,e!s ;to determ!ne.t~e d~gree:oP progress necessaryto,meet SB235’s
199~ recycling rate provisions.
2
II. Calculating Recycling Rates
A. Recycling Rate Formula
Sectio.n 42310 (b) and (c) establish the recycling
rates tl~at the CIWMB must publish for non-PETE
and PETE RPPCs respectively. To comply with SB
235 using recycling rates, non-PETE RPPCs must be
¯ ~ecy~led a~ a ;a~e of 25 percent an~ PETE RPPCs.
must be recycled ata rate of 55 percent. Given the
recycling rate definition provided in Section 42301,
staff have established the following mathematical
equation to be used in determining RPPC
recycling rates:
Recycling Rate~’s = _RPPC TonnaQe RecycledRPPC Tonnage Generated
The subsequent two subsections will provide
options for,estimating the numerator anddenominator of the PETE and non-PETE recycling
rates. All data are based on the stated source, but
have been manipulated to conform as closely as
possible to tt~e RPPC working definition. As stated
previously, derivations and assumptions associated
with all data sources are provided in a detailed back-
uP report; only the sources and tonnage estimates
Will be contained in the matrices found in this
document.
B. Non-PETE RPPC, Recycling Rates
The formula for calculating non-PETE RPPC
recycling rates is as follows:
Recycling Rate " ~Ion-pETE Tonnaae RecycledNon-PETE Tonnage Generated
Existing sources to estimate the nt~merator, non-
PETE RPPC tonnage recycled, include:
¯ E~rapolate U.S. EPA Diversion Data to
California Based on Population.
Extrapolate Recycling Data from the Society
of the Plastics Industry (sPI)to California Based
on Population.
Use AB 939 Reported Diversion.
Existing sources to estimate the denominator, non-
PETE RPPC tonnage generaiud, include:
¯ Extrapolate Modem Plastics Resin Sales to
California Based on Population.6
* Use U,S, EPA Generation Data in Conjunction ’
with ’Modem Plastics Resin Sales Data.
¯ Use AB 939 Plastic Generation Statistics inConjunction with Modem Plastics Resin Sales
Data.
¯ Use Statistics Maintained by the California
DePartment of Food and Agriculture.(CDFA) in
Conjunction with Modem Plastics, Sales Data.
The estimates of non-PETE recycling and generation
am,presented !n Table 1,, Summary of non-PETE
RPPC Diversion and Generation in 1990 and 1991.-In 1990 no~-PETE recycled estimates ranged from
5.904 tons to 18,345 tons. In 1991 only oneestimate of almost 18,989 tons recycled exists. In
terms of generation, 1990 non-PETE estimatesrange from 225,709 tons to 367,352 tons, In 1991
the range of.tonnage.generated estimates was
between 330,907 tons and 367,352 tons.
Table 2, Non-PETE RPPC Recycling Rate Range for
1990 and 1991, shows the range of recycling ratesbased on the estimates in Table 1. The high end of
the recycling rate range is obtained by coupling the
3
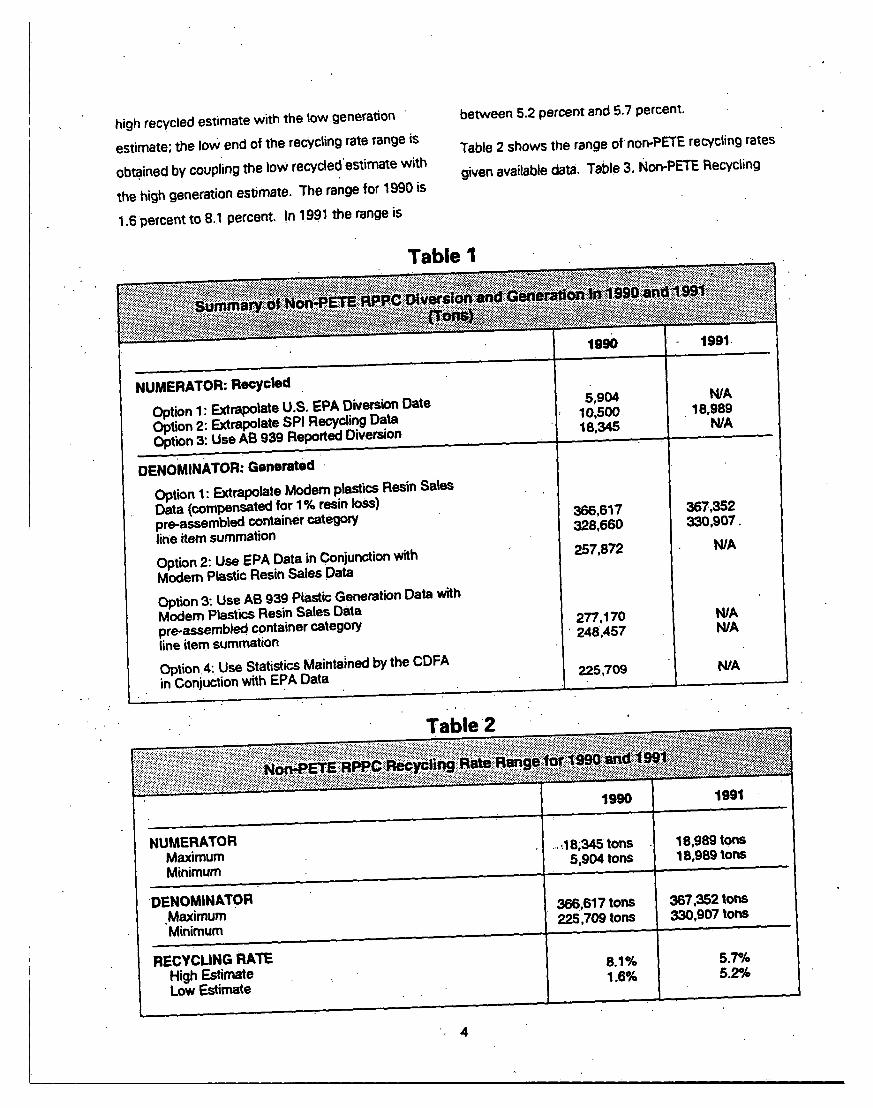
high recycled estimate with the low.generationestimate; the low end of the recycling rate range is
obta. ined by coupiing the low recycledestimate with
the high generation estimate. The range for 1990 is
1.6 percent to 8.1 percent. In 1991 the range is
between 5.2 percent and 5.7 percent.
Table 2 shows the range of non-PETE recycling rates
given available data, Table 3, Non-PETE Recycling
Table I
19 0 1991.
NUMERATOR: RecycledOption 1" Extrapolate U.S, EPA Diversion DateOption 2: Extrapolate SPI Recycling Dataoption 3: Use AB 939 Reported Diverdon
5,90410,50018,345
N/A18,989
N/A
DENOMINATOR: Generated ’option 1: Extrapolate Modem plastics Resin SalesData (compensated for 1% resin loss)pre-assembled container categoryline item summationOption 2: Use EPA Data in Conjunction with
366,617328,660
257,872
367,352330,907.
N/A
Modem Plastic Resin Sales DataOption 3: Use AB 939 Plastic Generation Data withModem Plastics Resin Sales Datapre-assembled container category
277,170~ 248,457
line item summationOption.4: Use Statistics Maintained by the CDFAin Conjuction with EPA Data
225,7 09
Table2
19 o 1991
NUMERATORMaximumMinimum
.... 18;345 tons5,904 tons
18,989 tons18,989 tons
¯ DENOMINATORMaximumMinimum
366,617 tons225,709 tons
367,352 tons330,907 tons
RECYCLING RATE 8.1% 5.7%High Estimate 1.6% 5.2%Low Estimate
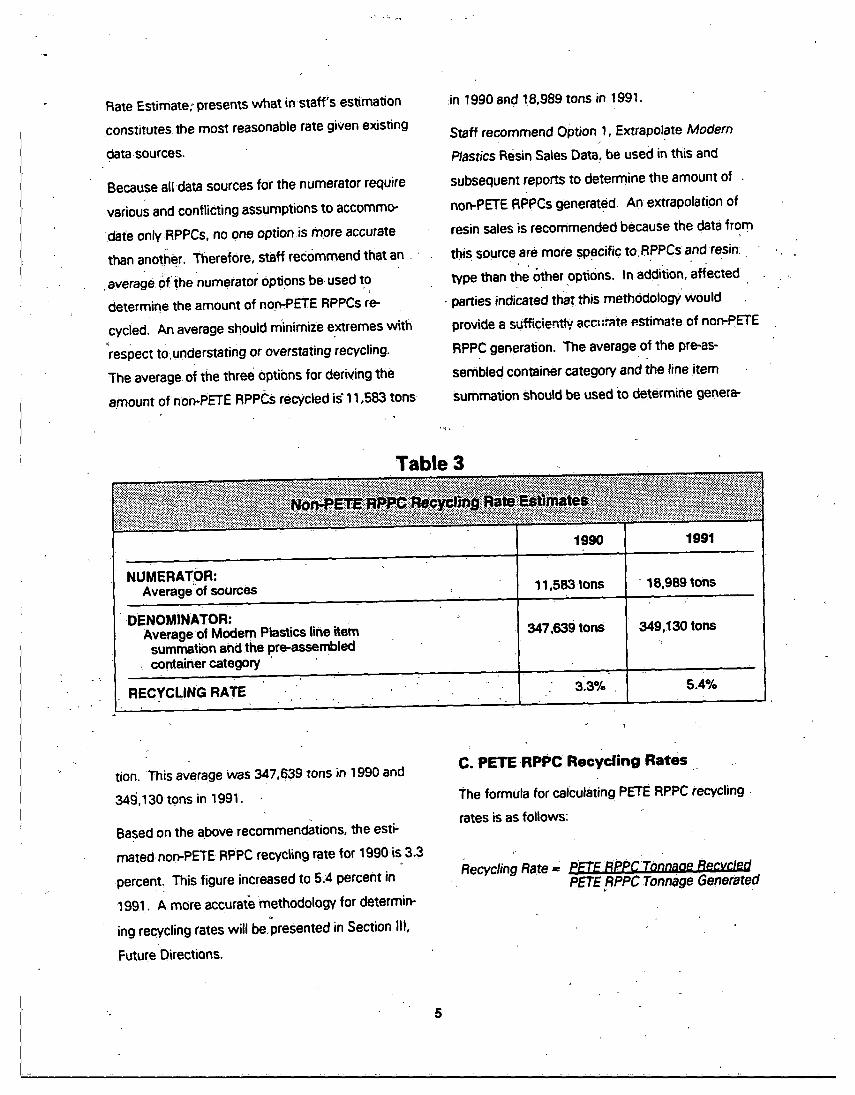
Rate Estimate; presents what in staff’s estimationconstitutes the most reasonable rate given exJsting
data sources.
Because all data sources for the numerator require
various and conflicting= assumptions to accommo-
’,date only RPPCs, no one option is more accurate
than anot.her. Therefore, staff recommend that an.
¯ average 0f~he numerato~ options be¯ used t.o.
determine the amount of non-PETE RPPCs re-
cycled. An average should minimize extremes with
respect to,understating or overstating recycling¯
The average of the three options for deri~.ing the
amount of non-PETE RPPCs recycled is" 11,583 tons
in 1990 and 18,989 tons in 1991.
Staff recommend OPtion 1, Extrapolate Modern
Plastics Resin Sales Data, be used in this and
subsequent reports to determine the amount of .
non-PETE RPPCs generated. An extrapolation of
resin sales is recommended because the data from
this source are more specific-toRpPcs and resin:
type than th~ ~ther options, In addition, affected
¯ parties indicated that this methodology would
provide 6 sufficiently, acc.~:r~tP, estimate, of non-PETE
RPPC generation. 1"he average of the pre-as-
sembled container category and the line item
summation should be used ~o determine genera-
Table 3
1990 1991
NUMERATOR:Average of sources 11,583 ,tons ’ 18,989 tons
¯ DENOMINATOR:Average of Modem Plastics line item 347,639 tons 349,130 tons
summatk)n and the pre-assembled. container category
RECYCLING RATE 5.4%
tion. This average was 347,639 tons in 1990 and
34~,130 tons in 1991.
Based on the above recommendations, the esti-mated, non-PETE RPPC recycling rate for 1990 is 3.3
percent: This figure increased to 5.4 percent in1991. A more accurat~ methodology for determin-
ing recycling rates will be~resented in Section III,
FutureDirections.
C. PETE RPPC Recycling Rates .. ..
The formula for calculating PETE RPPC recycling ¯
rates is as follows:
Recycling Rate = PETE RPPCTonnaoe RecycledPETE~RPPC Tonnage Generated
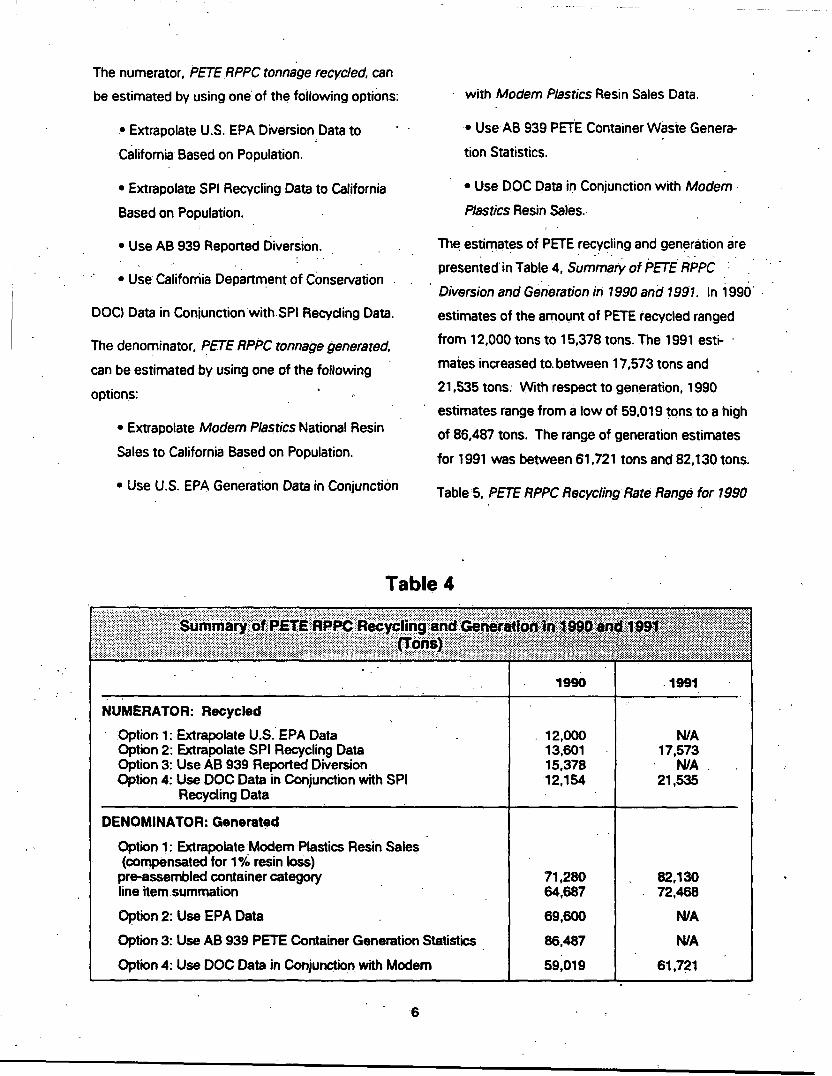
The numerator, PETE RPPC ~onnage recycled, can
be estimated by using one of the following options:
¯ Extrapolate U.S. EPA Diversion Data to
California Based on Population.
¯ Extrapolate SPI Recycling Data to California
Based on Population.
¯Use AB 939 Reported Diversion.
¯ Use California Department of Conservation .
DOC) Data in Conjunction with.SPI Recycling Data.
The denominator, PETE RPPC ~onnage genermed,
can be estimated by using one of the following
options:
¯ Extrapolate Modem Plastics National Resin
Sales to California Based on Population.
¯Use U.S. EPA Generation Data in Conjunction
with Modem Plastics Resin Sales Data.
¯ UseAB 939 PETE Container Waste Genera-
tion Statistics.
¯ Use DOC Data in Conjunction with Modem.
P/astics Resin Sales..
The estimates of PETE .rec.yc!ing and generation arepresentedin Table 4, Summa~, of PETE RPPC
Diversion and Genermion in 1990 and 1991. In i 990 ¯estimates’ of the amount of PETE recycled ranged
from 12,000 tons to 15,378 tons. The 1991 esti- ¯
mates increased to. between 17,573 tons and21,535 tons: With respect to generation, 1990
estimates range from a low of 59,019 tons to a high
of 86,487 tons. The range of generation estimates
for 1991 was between 61,721 tons and 82,130 tons.
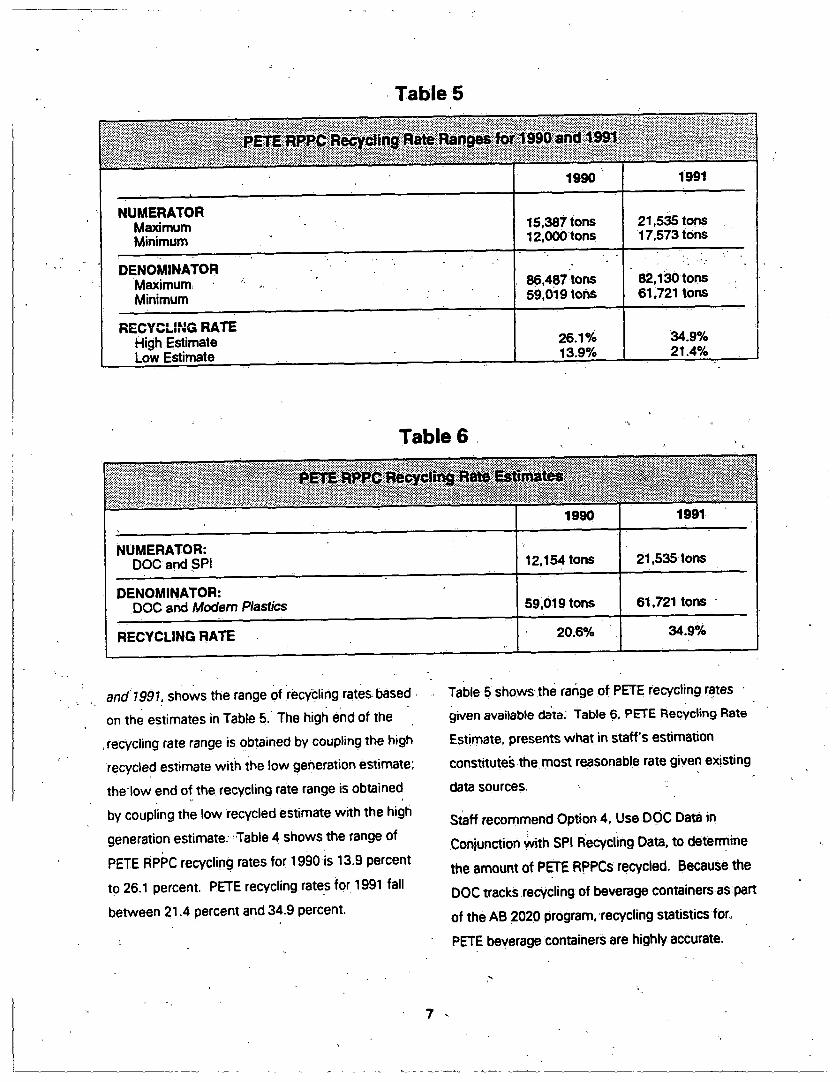
Table :5. PETE RPPC Recycling Ra~e Range for 1990
Table 4
19 0 ¯ 1991
NUMERATOR: Recycled
Option 1: Extrapolate U.S. EPA DataOption 2: Extrapolate SPI Recycling DataOption 3: Use AB 939 Repoded DiversionOption 4: Use DOC Data in Conjunction with SPI
Recycling Data
¯12,00013,60115,37812,154
N/A17,573
N/A.21,535
DENOMINATOR: Generated
Option 1: Extrapolate iModem Plastics Resin Sales(compensated for 1% resin loss)
pre-assembled container categon/line item summation
71,28064,687
82,13072,468
option2: use EPA Data 69,600 WA
Option 3: Use AB 939 PETE Container Generation Statistics 86,487 N/A
Option 4: Use DOC Data in Conjunction with Modem 59i019 61,721
¯ Table 5
", 1990 1991
NUMERATORMaximumMinimum
15,387 tons12,000:tons
21,535 tons17,573 tons
DENOMINATORMaximum=Minimum
86,4B. 7 tons59,019 tons
82,130 tons61,721 tons
RECYCLING RATEHigh EstimateLow Estimate
26.1%’13.9%
34.9%21.4%
Table 6,
1991
NUMERATOR:DOC and SPI 12,154 tons 21,535 tons
DENOMINATOR:DOC and Modem Plastics 59~019 tons 61,721 tons
RECYCLING RATE 20.6% 34.9%
and 1991, shows the range of recycling rates, based.on the estimates in Table 5. The high end of the
recycling rate range is obtained by coupling the highrecycled estimate with the low generation estimate;
the’low end of the recycling rate range is obtained
by coupling the low recycled estimate with the highgeneration estimate:-.Table 4 shows the range of
PETE RPI~C recycling rates for 1990 is 13.9 percent
tO 26.1 percent. PETE recycling rates for 1991 fall
between 21.4 percent and 34.9 percent.
7
Table 5 shows,the rar~ge of PETE recycling rates -given available data: Table 6, PETE Reck/cling Rate
Estimate, presents what in staff’s estimation
constitute~ .the most reasonable rate given existing
dam sources. ~
Staff recommend Option 4, Use DOC Data inConjunction ~ith SPI Recycling Data, to determine
the amount of PETE RPPCs recycled, Because the
DOC tracks recycling of beverage containers as par
of the AB 2020 program, recycling statistics for.
PETE beverage containers are highly accurate¯
t
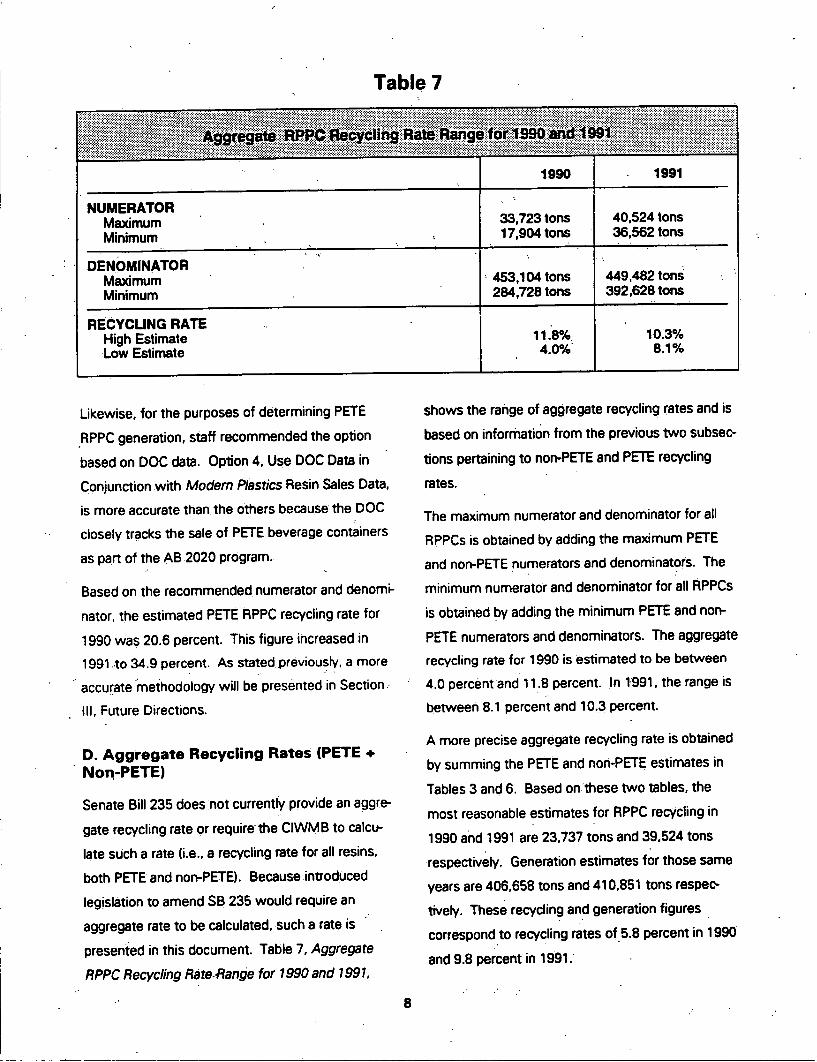
Table 7
1991
NUMERATORMaximumMinimum
33,723 tons17,904 tons
40.524 tons36,562 tons
DENOMINATORMaximumMinimum
453,104 tons284,728 tons
449,482 tons¯ 392,628 tons
..
RECYCLING RATEHigh EstimateLow Estimate
11:8o]0.4.0%
10,3%8.1%
Likewise, for the purposes of determining PETE
RPPC generation, staff recommended the option
based on DOC data. Opl~on 4, Use DOC Data in
Conjunction with Modem Plastics Resin Sales Data,
is more accurate than the others because the DOC
closely tracks the sale of PETE beverage containers
as part of the AB 2020 program.
Based on the recommended numerator and denomi-
nator, the estimated PETE RPPC recycling rate for
1990 was 20.6 percent. This figure increased in
1991 ..to 34.9 percent. As stated previous.lY, a moreaccurate methodology will be presented in Section ..
III, Future Directions.
D. Aggregate Recycling Rates (PETE +Non-PETE)
Senate Bill 235 does not currently provide an aggre-
gate recycling rate or require the CIWMB to calcu-
late such a rate (i.e., a recycling rate for all resins,
both PETE and non-PETE). Because introducedlegislation to amend SB 235 would require an
aggregate rate to be calculated, such a rate is
presented in this document. Table 7, Aggregate
RPPC Recycling Rate.Range for 1990 and 1991,
shows the range of aggregate recycling rates and isbased on information from the previous two subsec-
tions pertaining to non-PETE and PETE recycling
rates.
The maximum numerator and denominator for allRPPCs is obtained by adding the maximum PETE
and non-PETE numerators and denominators. The
minimum numerator and denominator for all RPPCsis obtained bY adding the minimum PETE and non-
PETE numerators and denominators. The aggregaterecycling rate for 1990 is estimated to be between4.0 percent and 11.8 percent. In 1.991, the range is
between 8.1 percent and 10.3 percent.
A more precise aggregate recycling rate is obtained
by summing the PETE and non-PETE estimates in
Tables 3 and 6. Based on these two tables, the
most reasonable estimates for RPPC recycling in
1990 and 1991 are 23,737 tons and 39,524 tonsrespectively. Generation estimates for those same
years are 406,658 tons and 410,851 tons respec-tively. These recycling and generation figures
correspond to recycling rates of 5.8 percent in 1990
and 9.8 percent in 1991 "
8
III. Future Directions
Due to time and resource constraints, it was.necessary to rely on existing data to develop PETE
and non-PETE recycling rate estimates. These
estimates address the 1990 and 1991 calendaryears. Entities that engage in annual updates of
recYcl.lng figures (i.e., SPI) are in the process of "
publishing their data for the 1992 calendar year.
Incorporating that information into this report woulhave resulted in delay. In addition to this time
factor, other issues must be addressed regardingthe methods presented for deriving recycling rates.
Estimates of recycling rates vary dramaticallydepending on the data source used to obtain the
estimate. To conform to the RPPC working defini-
tion, each of the cited sources were subiected tovarious assumptions of unknown validitY. Thus, tl~
resulting recycling rates are based on the best
available data. In the future more accurate datasources for recycling rate numerators and denomi-nators witt be developed. Future rate determina-
tions will require developing new methodologies
and additional resources. Generally, the moreaccurate the data:the more comptex and costty th
methodology. Staff’s objective~sto.recommend a
methodology of sufficient accuracy and minimal
cost.
In recognition of the limits associated with availabldata sources, a Iterna~ive options to bbtain data for
future reports are presented in this Section. Alter
natives are i~resented &nd staff’s recommendedoption is. briefly analyzed.
Staff identified the following alte matives for esti-
mating RPPC recycling in the future:
~
d
e
e
e
-
¯ Use Modified DOC Reporting Procedures._
¯Survey Califomia Plastic Processors.
¯ Use AB 2494 Reported Data.
Staff recommend the CIWMB consult with the D(DCto pursue modifying the DOC’s plastic processor
reporting procedures to obtain RPPC recycling data...If it is not feasible to modify DOC reporting, the.CIWMB should initiate an independent plastic
processor survey. Finally;-reporting methodologies
for AB 2494 should be developed in a manner sothat they may be utilized for SB.r235.purposes, as
well; However, because ~the AB 249~4 reporting
procedures are still being developed, it would be
premature to recommend their use.
Staff identified the following alternatives for estimat-
ing RPPC generabon in the future:
¯ Waste Sort Extrapolations.
¯ Sales Reports from Product Manufacturers or
Retailers. and
Retail Shelf Surveys.
Due to the substantial resources required to imple--ment any of the above alternatives, none were
:
" recommended. The U.S. EPA and AB 939 data used
for the estimates in the previous Section are not
recommended because they are not updated
annually as SB 235 requires.
It is reco~nmended that national. ~esin sales from the. publication Modem.Plastics be extrapolated to
determine RPPC generation in California. The
extrapolation should be performed on a per cap~a
basis, so the result will be proportiona~ to the
amount of the U.S. population that resides in the "
state. To improve the .accuracy of the estimates,
information maintained by the DOC for soft drink
bottles can be substituted for the Modem Plastics"
soft drink bottle estimate. The extrapolation of
Modem Plastics data can be performed using either
the pre~ggrebated container category or a line item
accounting method, neither of which is precisely
accurate. Because neither is clearly preferable, it is
recommended that an average, of the two be used
to estimate RPPC generation in California,
10
Appendix A
I. INTRODUCTION
A. Rigid Plastic Packaging Containers
- Senate Bill (SB) 235, .the Rigid Plastic Packaging
Container Act, requires rigid plastic packaging
containers (RPPCs) to achieve one of four
compliance options. One of these options is a resin-
specific recycling rate. The accuracy of~.these rates
is important because once these standards are met,
all RPPCs are in compliance with the law.
The California Integrated Waste Management Board
{Board} is roan’dated to publish an annual report
documenting these resin-specific recycling rates for
RPPCs.~ The recycling rates must be reported
separately for those containers composed of
polyethylene terephthalate [PETE) and for thosecontainers not composed of PETE ("non-PETE").2
Section 42301 of SB 235 defines an RPPC as "any
plastic package having a relatively inflexible finite
shape or form, with a minimum capacity of eight
fluid ounces or its equivalent volume and a maxi-
mum.capacity of five fluid gallons or its equivalent
volume, that is capable of maintaining its shape
while holding other products, including, but not
limited to, bottles, cartons, and other receptacles,
for sale or distribution in the state.’"
Before defining how RPPC recycling rates are
calculated, it is necessary to understand what an
RPPC is. The ambiguity of the statutory definition
becomes apparent when it is applied to actual types
" of plastic packaging. Although regulations toimplement SB 235 will refine the RPPC definition,
these regulations will not be drafted until 1994. In
the interim, it was necessary to develop a more
",focused working definition. To assist in establishing
this working definition, representatives of sectorsimpacted by SB 235 were consulted. Persons
representing the ~ol!owing constituencies attendedtwo meetings to discuss this and related issues:resin, containerand product manufacturers; distribu-
tors and retailers; local government officials; environ-mental gio~P$; and recyClers and reprocessors.
General consensus was reached at these meetings
to add the phrase "capable of multiple re-closure" to
the existing definition. This phrase eliminates
packaging items not capable of any closure such asbracing, crates, and trays, as well as items not
capable of multiple re-c!osure such as blister packag-ing. Examples of the containers for which recycling
rates are determined in this report include items
such as bottles, tubs, jars, and pails. Also included
in the RPPC working definition are food service
items such as hinged containers and cups.
B. Report Scope
This report fulfills the requirement in, Section 42310
to publish PETE and non-PEtE RPPC recycling
rates." Staff are aware, of proposed amendments to
SB 235 that would modify the manner in which
recycling rates are calculated. These amendments
would require the Board to calculate an aggregate
recycling rate that combines both PETE and non-PETE resins, As these amendments have not yet
been codified, ,this report addresses the current
requirements for non-PETE and PETE recycling
rates. However, in anticipation of an aggregate
recycling rate, such a rate is presented.. All esti-mates are based on data from calendar years 1990
and 1991, as 1992 data are not yet available.
11
Because California statistics are not maintainedfor
RPPC sales or diversion activities, most numbersused to calculate recycling rates in this report are
extrapolated from relevant, available sources, not
original research,a Available data are limited andoften not reported in categories consistent with the
requirements set forth in SB 235. For example, ,.
¯ container data are often compiled separately for
highly recyclable products (i.e.,. PETE soft drink
containers and HDPE milk jugs), while statistics for
the balance of container types are reported in
aggregate. Separating a resin type from generalcontainer data or containers from general plastic
product data is difficult and not precisely accurate.
Because no single data source addressed all
aspects of recycling rates as established in SB 235,
it was necessary to access multiple sources.
Because none of these sources provides data as
accurately as desired, a range of recycling rates
based on the various sources is presented. The full
range, of limits associated with each extrapolation
and its data source are discussed.
Since a definitive recycling rate cannot be deter-
mined based o..n. existing data, recommendations for
achie.ving a highe r level of accuracy in f.uture reportare made at the conclusion of this report.
C. Report Organization
Section II addresses specific statutory: requirement
related to this report, the formula used to determin
recycling rates, the units by which rates are calcu-
lated, and the status of exempt RPPCs.
Sections III and IV present options to determine
non-PETE and PETE RPPC recycling rates. Meth-
ods and sources to calculate both the numerator
and denominator for each recycling rate are dis-
s
cussed and the following specific points are ad-
dressed:
¯ Data source methodology,
¯ Differences between source categories and those
categories required for SB 235 recycling rates,
¯ Assumptions applied to source data to obtainCalifornia-specific RPPC estimates, and ’
¯ Estimated RPPC recycling or generation in
California based on that uuu~e.
Section V combines the PETE and non-PETE ratesto obtain an overall RPPC recycling rate. This report
concludes in Section VI with a review of recommen-dations to develop more accurate methods to
determine recycling rates and a discussion of
suggested Statutory amendments.
s
e
12
II. Calculating Recycling Rates
A. Statutory Standards and Definitions
Senate Bill 235 establishes both a recycling rateo.o
definition and a standard that must be met tocomply with the law using the recycling rate option.
The recY~.!ing rate standards,are established inSection¯ 42310 (b) and(c). For RPPCs to compJy
with the aggregate recycli.ng rate provisions, theymust achieve whichever of the following standards
is appropriate:
" ¯ Havea recycling rate of 25 percent if (the RPPC’s)
primary material is not PETE, based on annual
reports published by the Board on and aher January
1, 1993.
¯ Have a recycling rate of 55 percent if(the RPPC’s)
primary material is PETE, based on annual reports
published by the Board on and after January 1, 1993.
Aggregate recycling rates are defined by Public
Resources Code Section 42301 as one of the
following:
¯ The proportion, as measured by weight, volume,Or number, .that all rigid plastic packaging containers, .notwithstanding the size limitations, set forth in
subdivision (d), in the aggregate, sold, or offered for
sale in the state arebeing recycled in a given
calendar year.
¯ The p.roportion, as~measured by weight, volume,
or number, that a PETE rigid plastic packaging
container sold or offered for sale in the state is being
recycled in a given calendar year.
It is clear that inconsistencies exist between therecycling rate standards and the defini~ons. The
first definition refers to an aggregate RPPC recycling
rate regardless of resin type, but there is no recy-
cling rate standard for RPPCs regardless of-resin
type. Because the author’s office has stated that itwas their intent to include such a recycling rate, an
aggregate rate (regardless of resin otypei will be
der~ed in this document.
Additionally., unlike the.recy.cling rate definition.f.o.r allRPPCs, the recy~.lin~rate for PETE RPPCs does ndtinclude the reference ":regardless Of size." As a
result, it is unclear in the second definition whether
containers outside the RPPC size constraints of
eight ounces and five gallons should be included in
the PETE RPPC recycling rate calculations. Because
the recycling rate definition for all RPPCs states that
the_rate is regardless of size, and because it is not
possible to separate recycled PETE RPPCs by sizegiven current reporting methods, the PETE recyclin~
rate, too, will be calculated regardless of size. -
B. Formula for Calculating RecyclingRates
Th~ general formula for calculating recycling rates is
as follows:
. Recycling Rate =. RPPC Tonnaae RecycledRPPC Tonnage Generated
C. Units for Calculating Recycling Rates
Senate Bill 235 provides for recycling rates to be
calculated by either weight, volume, or number.Regardless of the unit used to calculate these rates,
they must be consistent and California based.
Using the volume or number of RPPCs to determine
recycling rates is not possible due to a lack ofr
available data, Also, to establish such rates in the
future would be problematic. The volume occupiedby plastic containers depends on the degree of their
13
compaction. Because compaction practices vary
within the recycling industry, the use of volumetric
units may ~e.ad to inconsistent recYcling rates. Using
the number of RPPCs as a unit for measuring
recycling rates is impractical because F~PPC genera-tion and diversion statistics are not reported in this
manner.
.To develoP"recycling rates using volume, the
CIWMB would need to mandate compaction
~lensl~Jes. To develop recycling rates using numberof RPPCs it would be necessary for product manu-
facturers to report to the CIWMB the number of
RPPCs sold in California, or the CIWMB would have
to obtain RPPC sales information from retailers,wholesalers, and distributors. Implementing eithermethodology would be complex and burdensome.
Because existing s~atistics for generation, recycling.
and landfilling of plastics are documented by weight,
recycling rates in this report will be based on ton-
nage. Weight-based calculations are consistent with
measurement methods used by the private sector
and AB 939 reporting requirements. Furthermore,
when industry representatives were consulted
regarding which units should be used, the.y.advised
that weight is the only practical unit for determining..
recycling rates.
D. Status of Exempt Containers
Language in SB 235 specifies RPPCs that are
exempt from all of the statute’s requirements.These include RPPCs that hold the following items:
drugs, medical food, medical devices, infant formula
and hazardous and toxic products regulated by the
Federal tnsecticide, Fungicide, and Rodenticide Act.
These containers are defined as RPPCs, but they are
exempt from compliance.
Senate Bill 235 does not state whether exempt "
RPPCs should be included or excluded from therecycling rate calculations. At present, excluding
exempt RPPCs from the calculation is not feasible
because generation and diversion statistics forthese types of containers are not maintained by any
public or private entity, No attempt was made toe~clude exempt RPPCsfr~m the ~ecyblir~g ratb ’
calculations because estimating the amoun~ of
these containers would be complex and costly. ’
Furthermore, as discussed earlier, SB 235 states
that all RPPCs, regardless of size, are included in
calculations of aggregate recycling rates. Thisinclusion of containers that by definition are not
considered RPPCs (because they are outside the
size parameters), lends credence to the notion thatcontainers exempt from statute, but defined as
RPPCs, also should be included in recycling rate
calculations.
14
III. Non-PETEr RPPCRecycling Rates
The formU!a for calculating non’PETE RPPC recy-
cling rates is as follows:
Recycling Ra~e = Non-PETE Tonna_ae RecycledNon-PETE Tonnage Generated
Options for deriving the numerator and denominator
are discussed below. These result~ aresummarized in Tabte A-4. Summary of non-PETE
RPPC Diversion and Generation in 1990 and 1991,and Table A-5, Non-PETE RPPc Recycling Rate
Range for 1990 and 1991. Both tables are tocated
at the end of this section. Analysis and conclusions
regarding the most accurate option for determiningthe non-PETE RPPC recycling rate is prbsented in ¯
Subsection D, Non-PETE RPPC Recycling Rate
Conclusions.
A. Numerator: Non-.PETE RPPC TonnageRecycled
The numerator, non-PETE RP~C tonnage recycled.
can be calculated by using one of the following
options:
¯ E.xvapola~e U.S. EPA Diversion Data to
California Based on Population.
¯ Extrapolate Recycling Data from the Society
of the Plastics Industry (SPI) to California Based
on Population.
¯ Use AB 939 Reported Diversion.
Numerator Option 1: Extrapolate U.S. EPA
Diversion Data to California Based on Population
The United States Environmental Protection Agency
(EPAl Conducts national waste generation’and
diversion studies with assistance from the consult-
ing firm Franklin Associates, Ltd. These studieshave occurred periodically over the past 20 years
and the rasults are regularly summarized in the
document "Characteristics of Municipal Solid Waste
in the United States." The most recent version ofthis study addresses the 1990 waste stream and issubtitled 1992 Update.
Data from this study can’be extrapolated to
California based On population. To perform this
extrapola~on, nat~onn~ diversion figures have been
multipliedby the proport!on of the U.S. population
that resides in California. In 1990 Californiansaccounted for 12.Opercentof the total U .S. popula-
tion ?
Generally, the EPAdiveisior; data is obtained from
industry sources, such as SPI. These sources track
diversion by material and/or product type. The data
is manipulated by the EPA to eliminate figures that
include’ recycling of in-house (postindustrial) scrap.
The EPA study divides plastic container data into thefollowing categories: soft drink bottles (PETE}. milk
bottles (HDPE), and other c0ntain, ers (all resins,including PETE and HDPE). These reporting catego-ries differ fr0mthose necessary for the resin-specific
rates required by SB 235. The EPA category "other
Containers" includes non-PETE containers other than
milk jugs and custom PETE RPPCs (i.e., P~ETE.RPPCs that are not Soft drink bottles). Also, retailfood service containers such as hinged containersand cups are considered RPPCs under the SB 235
working definition, but are classified under the non-
durable goods category, not as containers, according
to the EPA.
Several assumptions have been made to extrapolate
results from the EPA study to California. A discus-
sion and brief analysis Of these assumptions follows:
15
*.Per capita diversion of. non-PETE RPPCs in Califor-
nia is consistent with per capita diversion in the
nation.
This may or may not be accurate. Without perform-
ing research specific to California, there is no means
to know ff this assumption is accurate.
=. Diversion 0fRPPCs not included in EPAcontain’~r~igures (ietail food Service containers such as
hinged containers and Cups) is negligible.
Generally, this assumption is accurate. These food
service items are primarily made out of rigid and
foamed polystyrene. Secondary markets for
polystyrene are not stable or weft developed, nor is
polystyrene commonly coflected in California
recycfing programs.
¯ Diversion of custom PETE RPPCs included in the
EPA’s "other container" category is negligible;therefore, the "other container" category is attrib-
uted to non-PETE containers.
With respect to the year 1990, other sources .show
that nationwide and Califoynia custom PETE con-
tainer recycling was minimal8 However, over the
past few.years .it has becbme increasingly common
for California recycling programs to collect PETE
containers. Consequently, PETE container recycling
{both soft drink bottles and custom containers) has
increased at a rapid rate. Thus, while this assump-
tion holds for the year 1990, it may be less accurate
for subsequent years.
¯ Statistics reported in the EPA studY are for
"diversion," not "recycling." Using their data
unadjusted implies that diversion and recycling are
equivalent. ~
The EPA distinguishes between recycling and
diversion because some recycling processes result
in the generation of by-products that themselves
require disposal. For example, paper reprecessing
results in generation of a s/udgeqike material that
requires disposal Unlike paper recycling, plasticreprecessing typicai/Y does not result in the genera-
tion of by-Products that reqbire disposal .:Therefore;
with respec~ to RPPCs, the terms diversion, and
recycling can be used interchangeably with a
modicum of confidence.
Calculations:
Performing the required calculations yields a
recycling estimate for 1990 of 5,904 tons of non-
PETE RPPCs in California. "To obtain this estimate,
first the nationwide EPA estimates for recycling of
milk jugs and other containers were added together
(27,600 tons milk jugs. + 21,600 tons other contain-ers = 49,200 tons). Ne~, to extrapolate nationwide
recycling to California, the nationwide .figure was
multiplied by the proportion of the U.S. population
residing in California (49,200 tons x .12 = 5,904).
The result, 5,904’tons, is an estimate of non-PETERPPC re.cycling in California. "
Numerator Option 2: Extrapolate SPI Recycling
Data to California Based on Population
The Society of the Plastics Industry, Inc. (SPI)
conducts nationwide plastics recycling studies with
the assistance of R.W. Beck and Associates. Tl~e
most recent studY addresses the calendar years
1990 and 1991 and .is summarized in the.document
"Post-Consumer Plastics Recycling Rate Study."
As with the EPA studies, this effort, too, is on-
going. Annual reports for the preceding two years
are published approximately every April. Thus, the
16
report due in April 1993 will contain informbtion for
the calendar years 1991 and 1992.
Data from the study can be extrapolated based on
the proportion of the U.S. population that resides in
Catifornia. In 1990 Californians accounted for 12.0
percent of the totat U.S. population; this figureincreasedslightly in 1991 to 12.2 percent.
The SPI study data was obtained through a nation-
wide telephone survey of plastic reclaimers. To
mitigate the problem of double counting scrap that
is passed between processors before being used in
a new product, only processors sellin.g material for"end-use" were surveyed.. The term "end-use"
implies that subsequent to sale, the material was
used to make a final product, and was not sold to an
intermediary or broker.
Because many firms specialize in the productionand/or r~clamation of some but not all resins, survey
participation rates varied depending on resin type.
No attempt was made to compensate for non-
.participating firm~i
Data for the SPI study were reported in more than
25 categorIes. Recycled tonnage was reported by
resintype, and .aggr.egate numbers .(iiei,. not resin "specific) were separated into packagin9 and non-
packaging categories. Within the packaging
category, subcategories for various packaging types
are provided. Although reporting by resin type is
consistent with SB 235’s provisions, the packagin.gcategories established by SPI are not..always consis-
tent with the RPPC workingdefinition. For example,the category "other packaging" often includes non-
rigid packaging such as bags and films.
Several assumptions have been made to extrapolate
results from the SPI study to.California. A
discussion andbrief analysis of these assumptions
follows:
¯ Per.capita diversion of non-PETE RPPCs in Califor-
nia is consistent with national per capita diversion.
This may or may not be .true. Without performingresearch specific to California, there is no means to
knowif this a.,ssumptJon is accurate.. ’-
¯ Although some firms did not respond to thesurvey, this does not result in substantial under-
statement of tonnage recycled,
The raw data on which the SP! study is based is
considered proprietary. Without access to the back-
up proprietary data, there is no means to determine
the validity of this assumption.
¯ Diversion of non-RPPCs included in SPI’s "other
packaging" category isonegligible; Therefore, ’the
amounts presented in this category are attributed to
non:PETE RPPCs.
As stated with respect to the previous assumption,
it is not possible to determine the validity of this
assumption without access to back-up data. How-
ever, the non-RPPC items included in the "other
¯ packaging" category are primarily flexible films
mad~ Of HDPE and PP, and PS food service items.
None of these items are characterized by particularly
strong secondary markets, so it may be safe to
assume that diversion for the years 1990 and 1991
" was marginal.
Calculations:
Performing the required calculations results in. a non-
PETE RPPC recycling estimate of 10,500 tons in
1990 and 18,989 tons in 1991. To obtain thesefigures, nationwide numbers from the SPI study
17
were converted from millions of pounds to tons and
then prorated to California based on population.
Pounds were convened to tons by dividing by
2,000, and prorating was achieved by multiplying
nationwide tonnage by the percent of ~e U.S.
population that resides in California; this figure was
12.0 percent in 1990 and 12.2 percent in 1991.
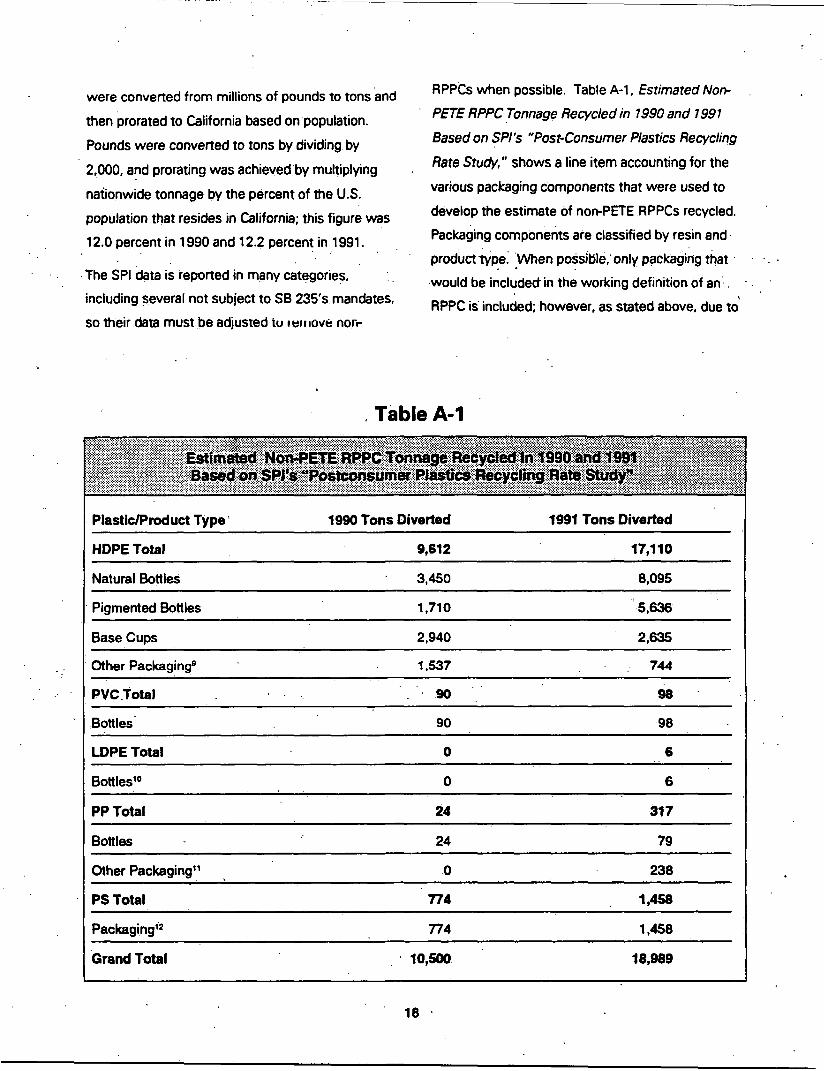
¯ The SPI data is reported in many categories, ..
including ~everal not subject to SB 235’s mandates,
so their data must be adjusted tu ~u,,ove nor~
RPPCs when possible. Table A-l, Es~imated Non-
PETE RPPC.Tonnage Recyc/ed in 1990 and 7991~ Based on SPI’s "Post-Consumer Plastics Recycling
Rate Study," shows a line item accounting for the
various packaging components that were used to
develop the estimate of non-PETE RPPCs recycled.Packaging components are classified by resin and.
product tYpel ’.When possil~le, only packagi~lg that¯
¯ would be included in the working definition of an:.
RPPC is included; however, as stated above, due to
Table A-1
Plastic/Product Type ~
1990 Tons Diverted 1991 Tons Diverted
HDPE Total 9,612 17,110
Natural Bottles 3,450 8,095
Pigmented Bottles 1,710 5,636
Base Cups 2,940 2,635
Other Packagingg 1.537 744
PVC.Tota~ .90 " " S8
Bottles 90 98
LDPE Total, 0 6
Bottles ’° 0 6
PP Total 24 317
Bottles 24 79,
Other Packaging~ 0 238
PS Total 774 1,458
Packaging’2 774 1,458
Grand Total ’ 10,500 18,989
18 .
the subcategory bf "other packaging" that includes
both RPPCs and non-RPPCs, total consistency with
regard to SB 235 is not possible.
Nurnerator Option 3: Use AB 939Reported Diversion Data
Assembiy Bill 939 requires cities and counties to
report wastediversion (source reduction,recYcling,
and composting)bY material catego~/for 1990. As.
of March 11, 1993, 495 out of 525 iurisdictions,representing 98.4 percent of California’s population,
had ~eported this information. Data gathered as a
result of AB 939 mandates pertain strictly to the
1990 calendar year. Furthermore, because localitiesare not required to submit this information annually
to the Board, this source is static.1~
Jurisdictions’were allowed to use the following four
categories to report diverted plastic: HDPE contain-
ers (e.g., milk jugs), PETE containers (soft drink
bottles and custom containers), film plastic, and
.other plastic. Recycling of non-PETE RPPCs in 1990
can be approximated by using the HDPE container
category.
Some jurisdiction .s aggregated subcategories priQr toreporting. For example, as OPposed to reportingfour subcategories, a jurisdiction ma~y report the .
aggregate amount of HE)PE and PETE containers
diverted. When this occurs, the CIWMB cannotdetermine what portion of the diverted material is
PETE Or HDPE: therefore, total tonnage is allocated
to the "other plastic~; category?4
Even if each subcategory were u~ed, the resulting
data would not correspond to the exact parameters
established in SB 235. Recycled non-PETE RPPCs
made from resins other than HDPE are quantified in
.the ".other plastic" category. These containers
should be removed from the ~’other plastic" cat-egory andadded to diverted HDPE containers;
however, because the data were aggregat.ed prior toreporting, the amount of diverted RPPCs made from
resins, other than PETE or HDPE cannot be deter-
mined.
Several assumptions are associated with Using AB959 mandated repot:t data as the foundati0nfor a~
estimate of non-PETE RPPC recycling~ A discussion
and brief analysis of these assumptions and other
concerns follows:
= Because AB 939 tiacks diversion, which inclbdesboth source reduction and recycling, using diversion
to estimate RPPC recycling implies that source
reduction is negligible.
Whi/e source reduction is at the top of the waste
management hierarchy, it is difficult to quanti~.
Because jurisdictions reporting diversion f6r AB 939
purposes are required to quantify diversion~ many
choose to do this without quantifying source
reduction efforts.in their diversion calculations.Although staff did not review a// submitted reports, it
can be assumed that reported diversion
approximates act.ua/ recycling.
¯ The amount of. recycled containers made fiom
non-PETE resins other than HDPE are negligible.
Data in the previous OPtion, "Extrapolate SPI Recy-cling Data to California Based on Population," shows
that recycling of resins other than PETE and HDPEaccounted forless than ten percent of non-PETE
container recycling.
¯ The amount of HDPE containers included in the"other plastic" category are negligible.
19
It is known that 11 counties did not use the HDPE
container category for reporting. Thus, diversion of
HDPE containers is included in the "other plastic"
category. Only one of these counties, San Diego, is
significantly populated and urbanized. The
remaining ten counties include Amador, Calaveras,
Fresno, Glenn, Madera, Matin, San. Benito, San Luis
Obispo, Siskiyou, and Yolo. ExCluding data from
these ~counties un~ierstates diversion of HDPE to an
unknown extent.
Calculations:
Based on AB 939 mandated reporting, 18,345 tons
of HDPE containers were diverted in California in1990. As previously stated, it is not possible to
bstimate dive~’sion of RPPCs made from resins other
than PETE or HDPE using AB 939 data,
B. Denominator. Non-PETE RPPC Tonnage
Generated
The denominator, non-PETE RPPC tonnage gener-
ated, can be calculated by using one of the following
options:
Extrapolate National Resin Sales toCalifornia
Ba~ed on Population. -. .
¯ Use EPA Data.
’~¯ Use AB 939 Plastic Generation Statistics in
Conjunction with Resin Sales Data.
¯ Integrate Statistics Maintained by California
State Agencies VVith Modem Plastics Sales,
Data,
Denominator Option 1: Extrapolate National
Resin Sales to California Based on Population ¯
National resin sales are published annually in the
January.edition of Modem Plastics, a magazine
published by McGraw-Hill..Report methodology is
established by the Society of Plastics Industries
¯ (SPI) and is conducted by the firm Ernst & Young.
To haye year-end to~als ready for the January
publication, fouflh quarter sales are based on
Projections. These projections are adjusted in the
f011owingyear’s edition. .Thus~,.theJanuary 1993
issue included sales for 1992 (incorporating a .. .
projected fourth quarter) and the adjusted sales
for 1991.
Sellers of resin report monthly sales in the following
ways (units are millions of pounds): bY resin type; by
amount sold for various applications, within a resin
type; and by the amount sold in major resin markets
including packaging and containers. Monthly sales
reported by each company are cross checked with
the company’s sales for the previous month and ’
with sales for the same month, one year prior.
Totals are not adjusted for non-reporting resin
sellers.
To estimate non-PETE RPPC generation in
California, nationwide non-PETE RPPC resin sales
had to be converted to tons, then prorated to
California based on population. In .!990, 12.0
percent of the nation’s population resided in
California, and in 1991 12.2 percent of the U.S.
population lived in the state.
The packaging and ~ontainer statistics assembled
by Modem Plastics identify the amount of each
resin type sold for producing containers, closures,
coatings, and films. Estimates of non-PETE RPPC
generation can be obtained either by’using the pre-
assembled Modem Plastics container categow and
excluding PETE containersates or by performing a
line item sbmrnation of all non-PETE resin applic~
20
lions that fall within the SB 235 working.RPPC
definition.
If the pre-assembled Modem Plastics container
category =s used to estimate non-PETE .RPPC
generation, there is no means to determine what
specific packaging items were considered for
inclusion in the container category. Hence, contain-
ers that are considered RPPCs may.be excluded¯
from the calculations while containers not Consid-
ered RPPCs may be included. If the line item
summation sales method is used, the "other
Packaging" categories include some non-RPPC
applications.
Assumptions that must be made to extrapolate the
sales data (using either the "pre-assembled" or -
"line-item" data pubtished in Modem" Plastics/
include the .following:
¯ California’s per capita non-PETE RPPC generation
patterns are consistent with the nation’s.
Without undertaking a specific study, the validity of
this assumption is unknown.
¯ Non-repo~ting resin sellers account for a negligible
portion of the non-PETE RPPC market.
Surveyrepresentatives have s~ated that participa-
tion in the annual survey varies by resin type and
that most large resin sellers.participate; however,
the proportion of actual sales accounted for is
unknown. To the extent that resin sales 90 unre-
ported,, the recycling rate will be inflated (if the
numerator remains constaht and the denominator
decreases, the overafl recycling rate increases).
¯ Resin export and the import of Products packaged
in RPPCs does not impact the equivalency of resin
sales and RPPC generation.
The United States is a net exporter of resin and a
net importer of plastic products.1~ The amount of
resin exported specifically for RPPC manufactureand the amount of products imported that are
~contained in RPPCs cannot be de~ermined. As a
result, the impact of these, e.xPO.~., and import..activities oh ~he "sold-eclua/s-generated" assumP"
tion also is unknown.
¯ If the pre-aggregated container category is used, it
mustbe assumed that non-RPPCs that are included
in the category and RPPCs hat are not included in
the category are negligible.
The exact components of this category are un-
known, so the validity of the assumption cannot be
determined.
¯ If non-PETE RPPC generation is estimated by a
line item count, it must be assumed that the amount
of non-RPPCs included in the "other packaging"
categories is negligible.
There is no means to absolutely verify this assump-
tion; however, it is likely that the amount of non-
RPPC packaging included is not substantial when
Compared to total non-PETE RPPC resin sales,
Calculations:
As stated. Modem Plastics maintains data on.
millions of pounds of resin used in producing
packaging and containers. If the Modem Plastics _
container category, excluding PETE resin 16,172
million pounds in 1990 and 6,083 million pounds in
1991) is convertad to tons (dividing.by 2,000 equals
3.1 million tons in 1990 and 3.0 million tons in 1991)
and proiated to California based on population
21
(multiplying by .12 in 1990 and .122 in 1991), total
California generation of non-PETE RPPCs in 1990
was 370,320 tons and in 1991 was 371,063 tons.
An estimated one percent resin loss occurs during
the manufacturing process.TM Compensating for this
loss results in slightly lower estimates of non-PETERPPC generation of 366,617 tons in 1.990 and.
367,352~tonsin 1991...
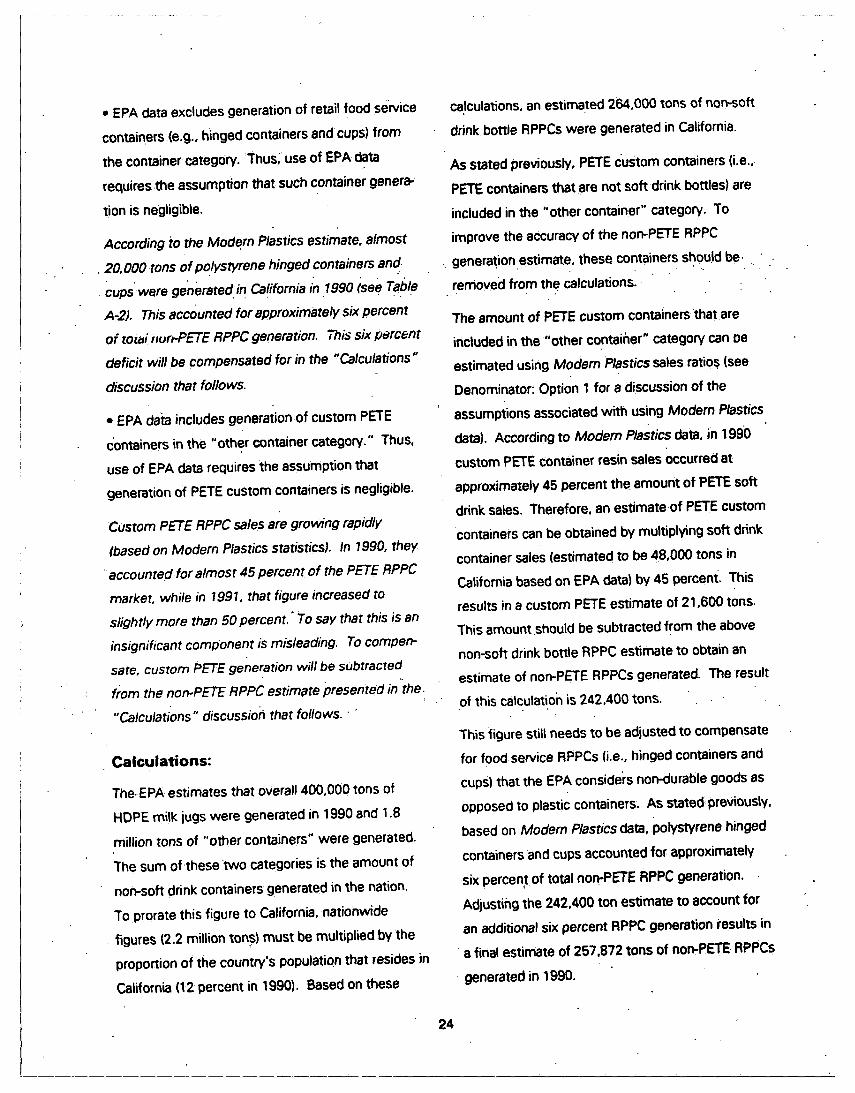
Table A-2, Estimated Non-PETE RPPC Tonnage
Generated in 1990 and 1991 Based on Modem
Plastics Data 1992, provides an estimate of non-
PETE RPPC generation in Califomia based on a line,
item accounting of non-PETE RPPC resin sales as
reported inModem Plastics. Based On this line item
aggregation, 331,980 tons of non-PETE RPPCs were
generated in California in 1990 and 334,249 tons
were generated in 1991.
To obtain these estimates, data were first converte
to tons (divide reported pounds by 2000 pounds per
tons) and then prorated to California based on
population (multiply nationwide tonnage by. 12 and
.122, the proportion of the U.S. population residing
m California.in 1990 and 1991). Finally all non-PETE
RPPC line item entries were summed. The result i
the non-PETE RPPC generation estimate.
An estimated one percent resin loss occurs during
the container manufacturing process. Adjusting for
this loss results in slightly lower figures for non-
PETE RPPC generation of 328,660 tons in 1990 and
330,907 tons in 1991.
Denominator Option 2: Use U.S. EPAGeneration Data in Conjunction withResin Sales Data
As stated with respect to diversion (see Numerato
.Option 1), the EPA conducts periodic waste charac-
d
s.
r:
terization studies, the results of which can be
prorated to California based on population. The
most recent results of these studies are for the1990 Calendar year and are summarized in the
publication "Characteristics of Municipal SolidWaste in the United States: 1992 Update. "
A materials flow methodology is used by the EPA to¯ determine waste, gerieration. Time series data on’
domestic production of materials and products Were
compiled and serve as the basis for these esti-mates. Adjustments were made to compensate for
imports, exports, permanent diversion from the
municipal waste stream, and product lifetime,
The EPA study divides plastic container data into th~
following categories: soft drinkbottles (PETE), milk
bottles (HDPE), and other containers (all resins,
including PETE and HDPE). These reporting catego-
ries differ from those necessan/for the resinspecific rates required by SB 235. The EPA cat-
egory "other containers." includes custom PETE
RPPCs (i.e., PETE RPPCs that are not soft drink
bottles). Also, retail food service containers such ashinged containers and cups are considered RPPCs
under the SB 235 working definition, but are classi-fied under the n0n-durable goods category, not as
containers, according to the EPA. "
Several assumption have been made to extrapolate
results from the EPA study to California. A discus-
sion and brief analysis of these assumptions
follows:
¯ Per capita generation of non-PETE RPPCs in
California must be consistent with per capita
generation in the nation.
This may or may not be true. Without performing.
research specific to Caiifomia, there is no means to
know if this assumption is accurate.
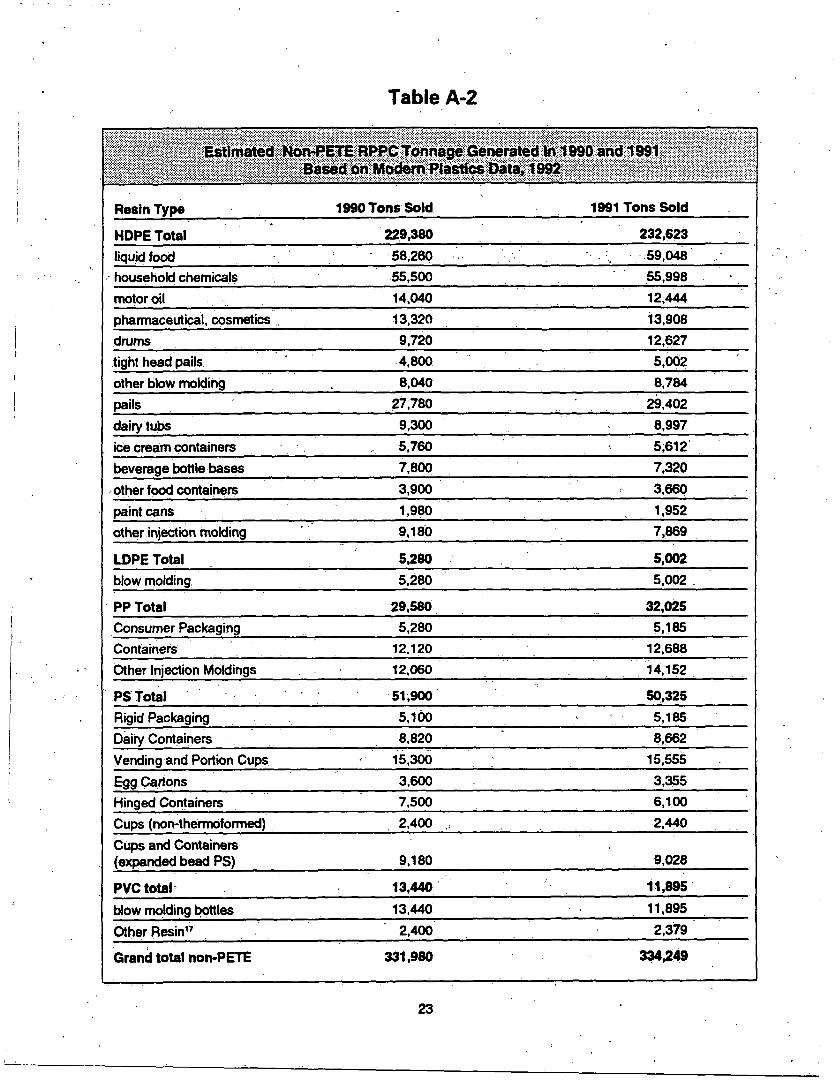
Table A,2
Resin Type 1990 Tons Sold 1991 Tons Sold
HDPE Total 229,380 232,623liquid food ~58,260 -.. - :, ¯ -.59,048
household chemicals 55,500 55,998
motor oil 14,040 12,444
pharmaceutical, cosmetics _ 13,320 13,908
drums 9,720 12,627
tight head pails ¯ 4,800 5,002
other blow molding 8,040 8,784
pails 27,780 29,402
dairy tubs 9,300 8,997
ice cream containers 5,760 5,612
beverage bottle bases 7,800 7,320
¯ other food containers 3,900 3,660
paint cans 1,980 1,952
other iniection molding 9,180 7,869
LDPE Total 5,280 $,002
blow molding 5,280 5,002
PP Total 29,580 32,025Consumer Packaging 5,280 5,185
Containers 12,120 12,688
Other Injection Moldings 12,060 14,152
PS Total ~ 51;900 50,325Rigid Packaging 5,100 5,185
Dairy Containers 8,820 " 8,662
Vending and Portion Cups 15,300 15,555
Egg Cartons 3,600 3,355
Hinged Containers 7,500 6,100
Cups (non-therrnoformed) 2,400 2,440
Cups and Containers(expanded bead PS) 9,180 9,028
PVC total~ 13,440 " 11,895
blow molding bottles 13,440 11,895
Other Resin’7 2,400 2,379
Grand total non-PETE 331,980 334,249
¯ EPA data excludes generation of retail food service
containers (e.g., hinged containers and cups) from
the container category. ~Thus~ use of EPA data
requires the assumption that such container genera-tion is negligible.
According ~o the Modem Plastics estimate, almost
.20,000 tons of polystyrene hinged containers and.cupswere generated in california in .1990 isee 7~ab/e
A-2), This accounted for approximately six percent
of m~i nun-FETE RPPC generation. This six percentdeficit will be compensated for in the "calculations"
discussion that follows.
= EPA da~a includes generation of custom PETE
containers in the "other container category." Thus,
use of EPA data requires the assumption that
generation of PETE custom containers is negligible.
Custom PETE RPPC sales am growing rapidly
(based on Modem Plastics statistics). In 1990, they
¯ accounted for almost 45 percent of the PETE RPPC
market, while in 1991, that figure increased to
slightly more than 50 percent." To say that this is an
insignificant component is misleading. To compen-
sate, custom PETE generation will be subtracted
f}om the non-PETE RPPC estimate presented in the
"Calculations " discussion that follows. ¯ "
Calculations:
The. EPA estimates that overall 400,000 tons of
HDPE milk iugs were generated in 1990 and 1.8
million tons of "other containers" were generated.
The sum of these two categories is the amount of
non-soft drink containers generated in the nation.
To prorate this figure to California, nationwide
figures (2.2 million ton,s) must be multiplied by theproportion of the country’s populatio.n that resides in
California (12 percent in 1990). Based on these
calculations, an estimated 264,000 tons of non-soft
drink bottle RPPCs were generated in California.
As stated previously, PETE Custom containers (i.e.,.
PETE containers that are not soft drink bottles) areincluded in the "other container" category. To
improve the accuracy of the non-PETE RPPC
generat.ion.estimate, these containers sh0u!d be.
removed from the Calculations.
The amount of PETE custom containers that are
included in the "other contaiher" category can Deestimated using Modem Plastics sales ratio~ (see
Denominator: Option 1 for a discussion of the
assumptions associated with using Modem Plasticsdata). According to Modem Plastics data, in 1990
custom PETE container resin sales Occurred atapproximately 45 percent the amount of PETE soft
drink sales. Therefore, an estimate of PETE custom~containers can be obtained by multiplying soft drink
container sales (estimated to be 48,000 tons inCalifornia based on EPA data) by 45 percent. This
results in a custom PETE estimate of 21,600 tons.
This amount should be subtracted from the above
non-soft drink bottle RPPC estimate to obtain anestimate of non-PETE RPPCs generated. The result
of this calculation is 242,400 tons.
This figure still needs to be adjusted to compensatefor food service RPPCs (i.e., hinged containers and
cups) that the EPA considers non-durable goods as
opposed to plastic containers. As stated.previously,
based on Modem Plastics data, ~olystyrene hinged
containers and cups accounted for approximately
six percen,t of total non-PETE RPPC generation.Adiusting the 242,400 ton estimate to account for
an additional six percent RPPC generation results in
a final estimate of 257.872 tons of non-PETE RPPCs¯ generated in 1990.
24
Denominator Option 3: Use AB 939 Plastic
Generation Statistics in Conjunction with
National Resin Sates Data
The California plastic waste generation statistics
obtained from AB 939 required reporting can be
used in conjunction with resin sales ratios tO
estab!ish’an estimate of .RPPC sales.-. Waste .:.generation is not reported in terms of non-PETERPPCs, but can be estimated by multiplying tons of
plastic generated i.n California by the ratio of theresin used in non-PETE RPPC applications to total
resin sales. Modem Plastics sales statistics can be
used to establish the ratio.
Plastic waste generation data for 1990 can beobtained from AB 939 mandated reports: However,
as previously stated, AB 939.does not require
annual updates of solid waste generation studies,
so this source cannot continue to be used in
the future.
The assumptions previously discussed for the useof Modem Plastics data (see Denominator~: Option
1) also apply to this option. In addition, thefollowing assumption have been made:
¯ If’is assumed that plastic reSi~ ~ales and plastic
generbtion are equ=vatent..
The veloci~/ with which materials that are "sold"
enter the waste stream and are considered,,generated" varies. Items suc~ as packagingcontainers have a short life span and quickly be-
come waste. O~her items with plastic component
such as appliances and cars enter the waste stream
after many years of use by the consumer. Thus,
while it can be said with some confidence thatRPPC sales are equivalent to generation, for plastics
in general this may not be true.
Calculations:
The Modem Plastics sales ratio can be establishedby using either the pre~ggregated container cat-
egory or by performing a line item accounting of all
non-PETE RPPC applications.
Using the pre~aggregated container category to
.. determine resin used.in non~PETE RPPCs,.tota! no.n-PETE RPPC sales in California in 1990 ere estimatedto be 277,170 tons, This estimate is obtained by
using the to;lowing rati~ ~,d performing the c~!c’-’L=-
tions in the following formula:
P x r1 = estimate of non-PETE RPPC sales
in 1990
Where:
P = AB 939.reported tons of non-PETE plastic waste
generated in 1990 = 2,752,887
resin used in non-
r, =~ = 6.172 million t~ounds=. 10068total resin sales 61,301 million pounds
P x rt = 2,752,887 tons x .10068 = 277,.!70 tons
Using the line item accounting method to determine
resin ~sed in non-PETE RPPCs, total non-PETE
RPP~ sates in Ca..lifomia in 1990 are estimated to be248,457 tons. This estimate is obtained, by using
the same f~rmula as was used above, but substitut-ing the lineitem estimate for non-PETE RPPC resin
sales for the pre~gg~egated container category
estimate. The calculations required to obtain the
s estimate of non-PETE RPPC sales are as follows:
P x r~ = estimate of non-PETE RPPC sates in 1990
Where:
P = AB 939 reported tons of non-PETE plastic waste
generated in 1990 = 2,752,887
resin used in non-
r, =~J~..~=~.533 million ~ounds=.09026total resin sales 67.,301 million pounds
P x r, .= 2,752,887 tons x .09026 = 248,457 tons
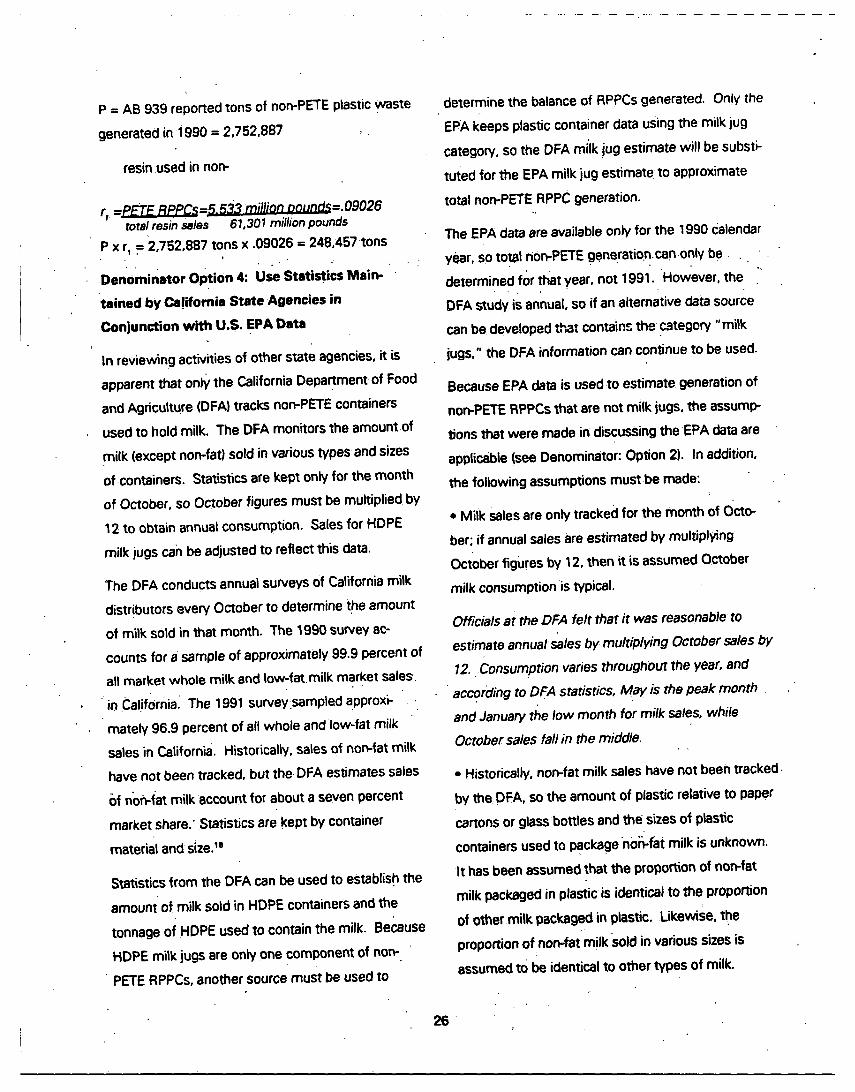
Denominator oPtion 4: Use Statistics Main-tained by California State Agencies in
Conjunction with U.S. EPA Data
In reviewing activities of other state agencies, it is
apparent that only the California Department of Food
and Agriculture (DFA) tracks non-PETE containers
used to hold milk. The DFA monitors the amount ofmilk (except non-fat) sold in various types and sizesof containers. Statistics are kept only for the month
of October, so October figures must be multiplied by
12 to obtain annual consumption. Sales for HDPE
milk jugs can be adjusted to reflect this data.
The DFA conducts annual surveys of California milk
distributors every October to determine the amountof milk sold in that month. The 1990 survey ac-
counts for a sample of approximately 99.9 percent of
all market whole milk and low-fat, milk market sales.in Californial The 1991 survey.sampled approxi-
mately 96.9 percent of all whole and low-fat milksales in California. Historically, sales of non-fat milk
have not been tracked, but the. DFA estimates salesOf non-fat milk account for about a seven percent
market share." Statistics are kept by container
material and size.le
Statistics from the DFA can be used to establish the
amount of milk sold in HDPE containers and thetonnage of HDPE used to contain the milk. Becaus
HDPE milk jugs are only one component of non-
’ PETE RPPCs, another source must be used to
e
determine the balance of RPPCs generated. Only the
EPA keeps plastic container data using the milk jug
category, so the DFA milk iug estimate will be substi-
tuted for the EPA milk jug estimate to approximate
total non-PETE RPPC generation.
The EPA data are available only for the 1990 Calendar
year, so total non-PETE generation.can.only be..determined for that year, not 1991. However, the
DFA study iS annual, so if an alternative data source
can be developed that contain~ the category "milk
jugs," the DFA information can continue to be used.
Because EPA data is used to estimate generation of
non-PETE RPPCs that are not milk jugs, the assump-tions that were made in discussing the EPA data are
applicable (see Denominator: Option 2). In addition,
the following assumptions must be made:
¯ Milk sales are only tracked for the month of Octo-
ber; if annual sales are estimated by multiplying
October figures by 12, then it is assumed October
milk consumption is typical.
Officials at the .DFA felt that it was reasonable toestimate annual sales by, multiplying October sales by12.. Consumption varies throughout the year, and
" acco~;ding ro DFA statistics, May is the peak monthand January the low month for milk sales, while
October sales fall in ~ne middle.
¯ Historically, non-fat milk sales have not been tracked.
by the DFA, so the amount of plastic relative to paper
cartons or glass bottles and the sizes of plastic
containers used to package no’-fat milk is unknown.
It has been assumed that the proportion of non-fat
milk packaged in plastic is identical to the proportion
of other milk packaged in plastic. Likewise, the
proportion of non-fat milk sold in various sizes is
assumed tO be identical to other types of milk.
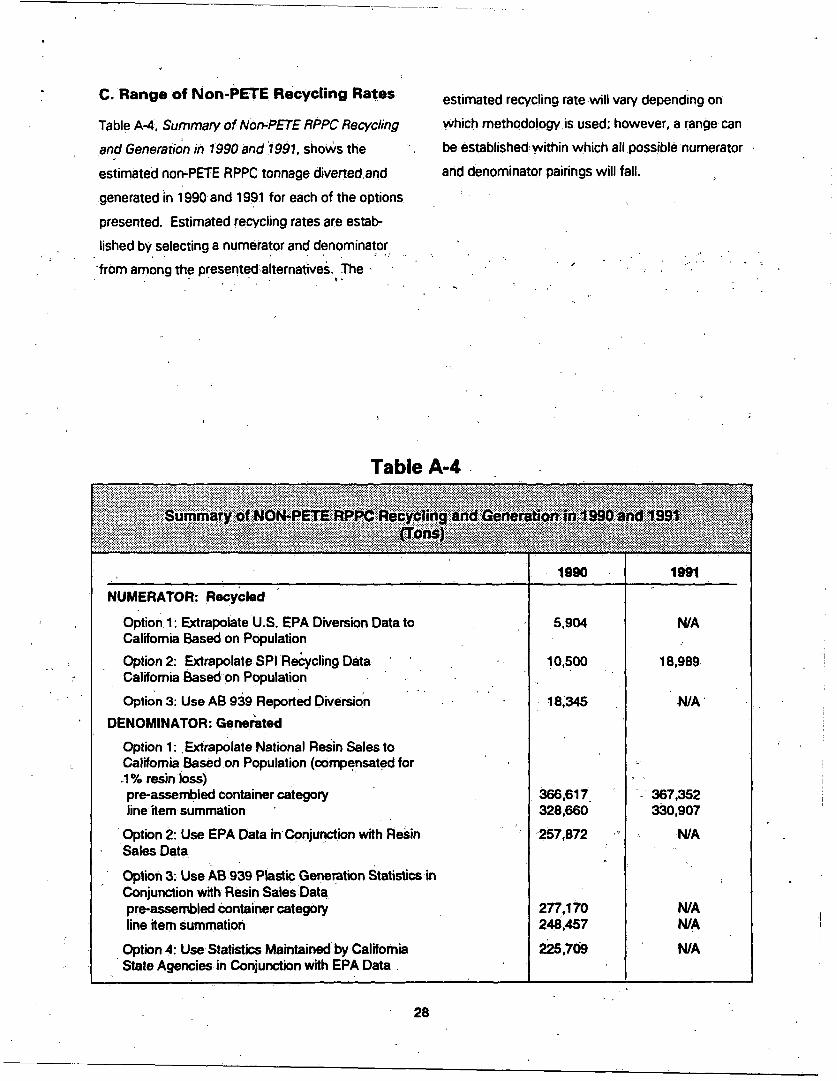
C. Range of Non-PETE Recycling Rates
Table A-4, Summary of Non, PETE RPPC Recyc/ing
and Generation in 1990 and 11991, sho~s the
estimated non-PETE RPPC tonnage diverted.and.
. generated in 1990 and 1991 for each of the optionspresented. Estimated recycling rates are estab-
lished by selecting a numerator and denominator
’from among:the. . presentedalternative~.,. . .~ , .,The ¯
estimated recycling rate will vary depending on
which methodology is used; however, a range can
be established within which all possible numerator
and denominator pairings will fall;
Table A-4 L
1990 1991
NUMERATOR: Recycled
Option 1: Extrapolate U.S. EPA Diversion Data to 5,904 WACalifornia Based on PopulationOption 2: Extrapolate SPI ReCycling Data ’ 10,500 18,989California Based on Populationoption 3: Use AB 939 Reported Diversion 18,345 N/A
DENOMINATOR: GeneratedOption 1-. Extrapolate National Re~in Sales toCalifornia Based on Population (compe, nsated for..1% resin loss)pre-assembled container category 366,617 367,352line item summation 328,660 330,907
Option 2: Use EPA Data inC0njunction with Resin ’257;872 N/ASales Data
Option 3: Use AB 939 .Plastic Generation Statistics inConjunction with Resin Sales Datapre-assembled Container category 277,170 N/Aline item summation 248,457 N/A
Option 4: Use Statistics Maintained by CaliforniaState Agencies in Conjunction with EPA Data.
28
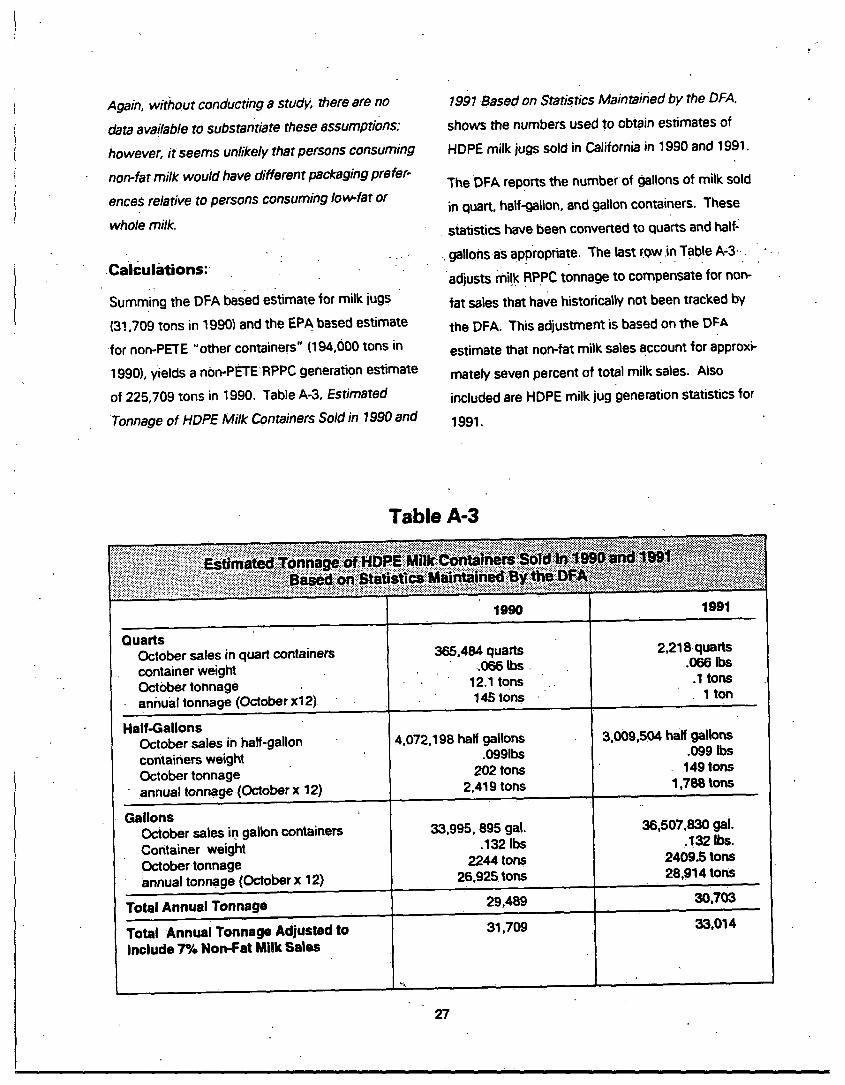
Again, wit~hout conducting a study, ~here are no
¯ data available to substantiate these assumptions:
however, it seems unlikely that persons consuming
non-fat milk would have different packaging prefer-
ences relative to persons consuming low-fat or
whole milk.
.Cal©ulations:. ¯.
Summing the DFA based estimate for milk jugs
(3! ,709 tons in 1990) and the EPA based estimate
for non-PETE "other containers" (194,000 tons in
1990), yields a non-PETERPPC generati.on estimate
of 225,709 tons in 1990. Table A-3, Estimated
Tonnage of HDPE Milk Containers Sold in 1990 and
1991 Based on Statistics Maintained by the DFA,
shows the numbers used to obtain esbmates of
HDPE milk jugs sold in California in 1990 and 1991.
The DFA reports the number of gallons of milk sold
in quart, half-gallon, and gallon containers. Thesestatistics have been converted to quarts and half:
¯ gallons as appropriate. The last tow.in Table A,3-..
adjusts mi!.k RPPC tonnage to compensate for non-fat sales that have historically not been tracked by
the DFA, This adjustment is based on the DI:A
estimate that non-fat milk sales account for approxi-
mately seven percent of total milk sales. Alsoincluded are HDPE milk jug generation statistics for
1991.
Table A-3
QuartsOctober sales in quart containers
container weightOctober tonnageanhu~_! tonnage (October x12)
365,484 quarts..066 Ibs.
12.1 tons145 tons
2,218.quarts.066 Ibs.1 tons
1 ton
Half-GallonsOctober sales in haft’galloncontainers weightOctober tonnageannual tonnage (October x 12)
4,072,198 half gat~ons.0991bs
202 tons2,419 tons
3;009,504 half gallons.099 ~s
149 tons1,788 tons
GallonsOctober sales in gallon containersContainer weightOctober tonnageannual tonnage (October x 12)
33,995, 895 gal..132 Ibs
2244 tons26,925 tons
36,507;83O gal..132 Ibs.
2409.5 tons28,914 tons
Total Annu~_~l Tonnage 29,489
Total Annual Tonnage Adjusted to 31,709 33,014
Include 7% Non-Fat Milk Sales
27
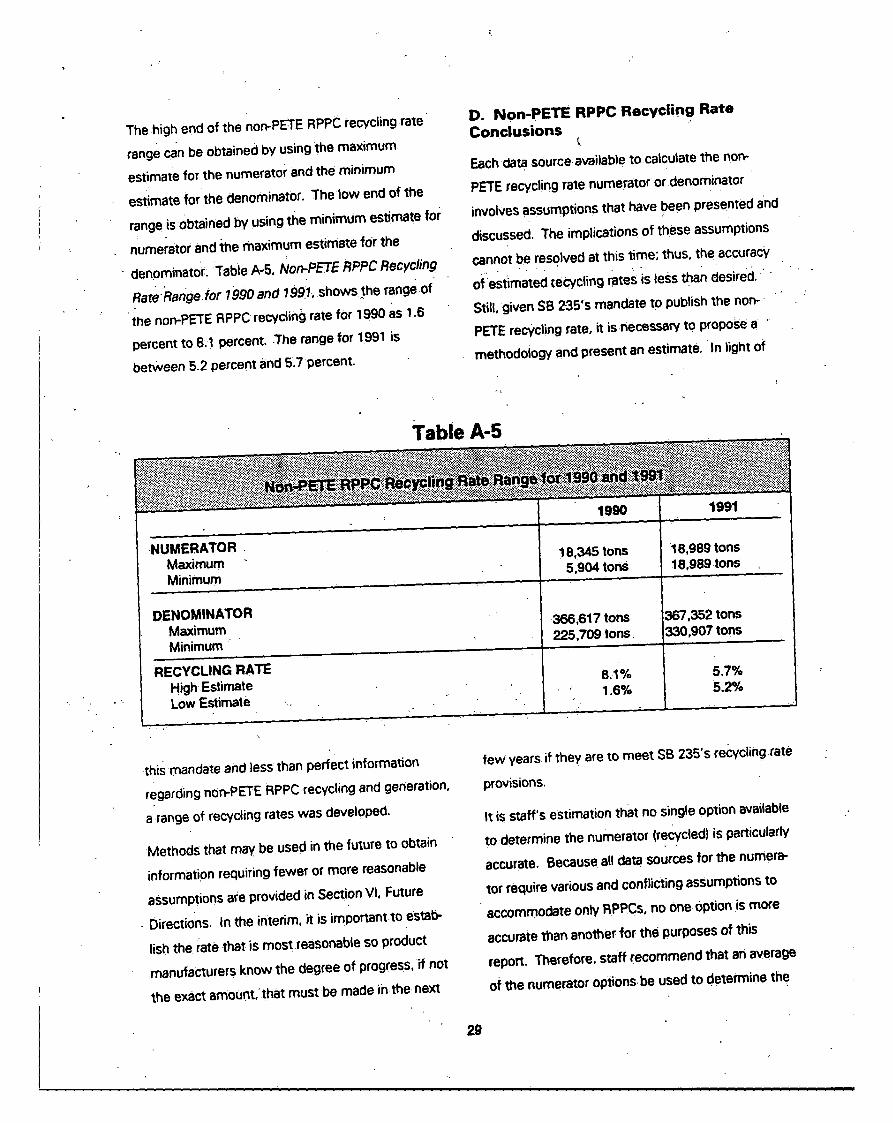
The high end of the non-PETE RPPC recycling rate
range can be obtained by using the maximum
estimate for the numerator and the minimum
estimate for the denominator. The low end of therange is obtained by using the minimum estimate fo~
numerator and ~he maximum estimate for thedenominator. Table A-5, Non-PETE RPPC Recycling
RateRange.for 1990 and 1991, shows .the range of
~he non-PETE RPPC recycling rate for 1990 as 1.6
percent to 8.1 percent..The range for 1991 is
between 5.2 percent and 5.7 percent.
D. Non-PETE RPPC Recycling RateConclusions
Each data. source available to catcutate the non-PETE recycling rate numerator or denominatorinvolves assumptions that have been presented and
discussed. The implications of these assumptionscannot be resolved at this time; thus, the accuracy
of"estimated [ecycling rates is less than ~lesired.
Still, given SB 235’s mandate to pubtish the non-PETE recycling rate, it is necessaw to propose amethodology and present an estimate. In light of
Table A-5
1990
MaximumMinimum
1 B,345 tons5,904 tons
18,989 tons18,989 tons
DENOMINATORMaximumMinimum
RECYCLING RATEHigh EstimateLow Estimate -..
366,617 tons225,709 tons
8.1%1.6%
~67,352 tons330,907 tons
5.7%5.2%
this mandate and less than perfect information
regarding non-PETE RPPC recycling and generation,
a range of recycling rates was developed.
Methods that may be used in the future to obtain
information requiring fewer or more reasonable
assumptions are provided in Section VI, Future
Directions. In the interim, it is important to estab-
lish the rate .that is most reasonable so product
manufacturers know the degree of progress, if not
the exact amount, that must be made inthe’next
few years if they are to meet SB 235’s recycling rate
provisions.
It is staff’s estimation that no singte option available
to determine the numerator (recycled) is particularly
accurate. Because all data sources for the numera-tor require various and conflicting assumptions to
" accommodate only RPPCs, no one Option is more
accurate than another for the purposes of this
report. Therefore, staff recommend that an average
of the numerator options be used to determine the
2g
amount of non-PETE RPPCs recycled,x‘ An averageshould minimize exVemes with respect to under-stating or overstating diversion. The average of the
three options for deriving the amount of n0n-PETE
RPPCs diverted is 11,583 tons in 1990 and 18,989
tons in 1991.
Staff recommend that Option 1, Extrapolate Na-.tiona/ Resin Sales .to Cafifomia Based onPopulation.,be used in this and subsequent reports for determi-
nation of the denominator (generated). An extrapo-
lation of national resin sales is recommended
because the data from this source are more specific
to RPPCs and resin type than the other options. In
addition, the Technical Advisory Committee, re-
ferred to in the Introduction, suggested that ex-
trapolating national resin sales to California based on
population would provide an accurate estimate of
generation. Either the pre-assembled containercategory or the line item sumr~ation can be used to
determine generation, or as with the numerator, an
average of the two can be determined. The average
of the two (347,639 tons in 1990 and 349,130 tons
in 1991) will be used to calculate the non-PETERPPC recycling rate.
The estimated non-PETE RPPC recycling rate for
1990 is 3.3 percent. This figure increased slightly in
1991 to 5~4 percent. Due to time lags in data
compilation and the fact that much of the data are
not updated annually, there simply are not sufficient
alternatives to present a more current recycling
rate. The CIWMB has in excess of one Yeartodevelop a mo~e up to date"andadequate method ~or
¯ gathering the req~jired information (see Section VI,
Future Directions, for recommendations).
IV. PETE RPPC Recycling Rates .
The formula for cal~:ulating PETE RPPC recycling
rates is as follows:
Recycling Rate = p~l’E RPPC Tonnaae .RecycledPETE RPPC Tonnage Generated
Options for deriving the numerator and. denominator
are discussed below. These results are summa- ..rized in Table A-8, summary of PETE RPPC Recy-
cling and Generation in 1990 & 1991, and Table A-9,
PETE RPPC Recycling Rate Range for 1990 and
1991. Both tables are located at the end of thissection. Analysis and conclusions regarding themost accurate opl~on for determining the PETE
RPPC recycling rate is presented in Subsection D,
PETE RPPCRecycling Rate Conclusions.
A. Numerator: PETE RPPC Tonnage Recycled
The numerator, PETE RPPC tonnage recycled, can
be calculated by using one of the following opt=ons:
¯ Extrapolate U.S. EPA Diversion Data to
California Based on Population.
¯ Extrapolate SPI Recycling Data to California
Based on PoPulation.
¯Use AB 939 Reporte~ Diversion.
¯ Integrate. Statistics Maintained by California
State Agencies with Modem P/astics Sales
Data.
Numerator Option 1: Extrapolate U.$. EPA
Diversion Data to California Based on Population
Similar to the. estimate for nbn-PETE RPPC recy-
cling, recycling of PETE RPPCs can be extrapolated
from the EPA study. The EPA conducts national
.waste generation and diVersion studies with assia-.
lance from the consulting firm Franklin Associates,_
Ltd. These studies have occurred periodically overthe past 20 years and the results are regularly
summarized in the document "Characterisrics ofMunicipal Solid Waste_in the United Stares." The
most recent version of this study, the 1992 Update,
addresses .the year 1990. . . ..
Data from this,stud~ can be extrapolated to CalifoP
nia based on population. To perform this extrapola-
tion, national diversion figures, have been multiplied
by the proportion of the U.S. population that resides
in Calif.ornia. In ~1990 Californians accounted for12,0 percent of the total U.S. population.
Generally, the EPA diversion data is obtained from
industry sources, such as SPI. These sources track
diversion by material and/or product type. The data
are’manipulated by the EPA to eliminate figures that
include recycling of in-house (postindustrial) scrap.
The EPA study divides.plastic container data into the
following categories: soft drink bottles (PETE), milk
bottles (HDPE), and other containers (all resins,including PETE and HDPE). These reporting catego-
ries differ from those necessary for the.resinspecific rates required by SB 235. The EPA cat-
egory "other containers" includes custom PETE
RPPCs ~i.e., PETE RPPCs that are not soft drink
bottles). Also, retail food service containers suchhinged containers and cups are considered RPPCs
under the SB 235 working definition, but are classi-
fied Under the non-durable goods categow, not ascontainers, according to the EPA.
31
Several assumptions have been made to extrapolateresults from the EPA study to California. A discus-
sion and brief analysis of these assumptions follows
¯ Per capita diversion.of PETE RPPCs in California is
consistent with per capita diversion in the nation.
This may or ma)~ not be accurate. Without perform-
ing.research specific to Califorhia, there is no means ;
to know if this assumption is accurate.
¯ Diversion of PETE RPPCs not included in EPA
container figures (retail food service containers such
as hinged containers and cups) is negligible.
Generally, this assumption is accurate. These food
service items are primarily made out of rigid and
foamed polystyrene.
¯ Diversion of custom PETE RPPCs included in the
EPA’s "other container" category is negligible;.
With respect to the year 1990, other sources show.
that nationwide and California custom PETE con-tainer rec)icling was minimal.6 However, over the
past few years it has become increasingly common
for California recycling programs to collect PETE
containers. Consequently, PETE container recycling
(bo"th ~oft.drink bottles and custOm containersl hasincreased at a rapid rate. Thus, while this assump-:
tion holds for the year 1990, it may be less accurate
for subsequent years. Thus, recycling will be
understated,
¯ Statistics.reported in the EPA study are for "diver-
sion," not "recycling. ". Using their data unadjusted
implies that diversion and recycling are equivalent.
The EPA distinguishes between recycling and
diversion because some recycling processes result
in the generation of by-products that themselves
require disposal For example, paper reprocessing
:
32
results in generation of a sludge-like material that
requires disposal. Unlike paper recycling, plastic
reprocessing typically does not result in the genera-
tion of by-products that require disposal Therefore,
with respect to RPPCs, the terms diversion and
recycling can be used interchangeably with a
modicum of confidence.
Calculations: ..
~Performing the required calculations for 1990 datayields 12,000 tons of PETE RPPCs recycled inCalifornia. To obtain this figure, the nationwide EPA
estimate for diversion of soft drink bottles (100,000tons) was extrapolated to California by multiplying
by .12 (the proportion of the U,S. population residing
in California in 1990).
Numerator Option 2: Extrapolate SPl Recycling
Data to California Based on Population
As with the estimate for non-PETE RPPC recycling,
the SPI study," Post-Consumer Plastics Recycling
Rate Study," can be used to estimate recycling of
PETE RPPCs in California. SPI conducts nationwide
plastics recycling studies with the assistance of the
firm R.W. Beck and Associates. The most recentstudy addresses the calendar years 1990 and 1991.
As with the EPA studies, this effort, too, is ongoing. Annual reports for the preceding two yearsare published approximately every April. Thus, the
report due in April 1993 will contain information for
the calendar years 1991 and 1992.
Data from the study can be extrapolated to Califor-
nia based on population. To perform this extrapola-
tion, national recycling figures must be multiplied by
the proportion of the U.S. population that resides in
california. In 1990 Californians accounted for 12.0percent of~he total U.S. population; this figure
increased S. ligl~tly in 1991 to 12.2 percent.
The information presented in the SPI study was
obtained through a nationwide telephone survey of
plastic reclaimers. To mitigate the problem of
double counting scrap that is passed between
processors before being used in a new product;
only processors selling material for "end-use" were
surveyed. The term "end-use" implies thatsubse-quent to.~sale, th~ material.was used to make a
product; it was not sold to an intermediary broker.
Because many firms specialize in the productionand]or reclamation of specific resins, not all resins,
survey participation rates varied depending on resin
.type. No attempt was made to compensate for
non-participating~ firms.
Data forthe SPI study were reported in more than
25 categories. Recycled tonnage was reported by
resin type, and aggregate numbers were separated
into packaging and non-packaging categories.
Within the packaging category, subcategories for
various packaging types are provided. The r~porting
categories are consistent with the needs estab-
:iished in SB 235 for PETE RPPC recycling rates.
The SPI study separates PETE containers into two
categories, soft drink bottles and custom~
containers.
Even though the data categories are consistent wit
SB 235 PETE RPPC recycling rate requirements;
several assumptions still must be made to extrapo-late results from the SPI study to California. A
discussion and brief analysis of these assumptions
follows:
¯ Per capita diversion of PETE RPPCs in California is
consistent with national per capita diversion.
This may or may not be true. Without performingresearch specific to. California, there is no means to
h
know if this assumption is accurate. Cafifomia, like
many states, has a bottle bill, so this encourages
container return. Whether Californian’s are morelikely than their U.S. counterparts to redeem con-
tainers is unknown.
¯ The lack of response to the survey by some firms
did not result, in substantial underSta~tement oftonnage recyc|ed.
The raw data on which the SPI study is based is°considered proprietary. Without access to the back-
up data, there is no means to determine the validlY/of this assumption.
Calculations:
Performing the required calculations results in aPETE RPPC recycling estimate of 13,601 tons in
1990.and i7,573 tons in 1991. To Obtain thesefigures, nationwide numbers from the SPI study
have been converted from millions of pounds to
tons and then were prorated to California based on
popu~lation. Pounds were converted to tons bydividing by 2,000, and prorating was achieved by
multiplying nationwide tonnage by the percent of
theU.S, population that resides in California: thisfigure was 12:0percent in 1990 and 12.2 percent in
1991: Table A-6, Estimated PETE RPPC Tonnage
Recycled in 1990 and 1991 Based on SPI’s "Post-
Consumer Plastics Recycling Rate Study," shows
estimated PETE RPPC diversion.
Numerator Option 3: Use AB 939Reported Diversion Data
. As stated with respect to non-PETE RPPCs, AB 939
required reports can be used to estimate PETE
RPPC diversion as well. Assembly Bill 939 requires
cities and counties to report waste diversion (source
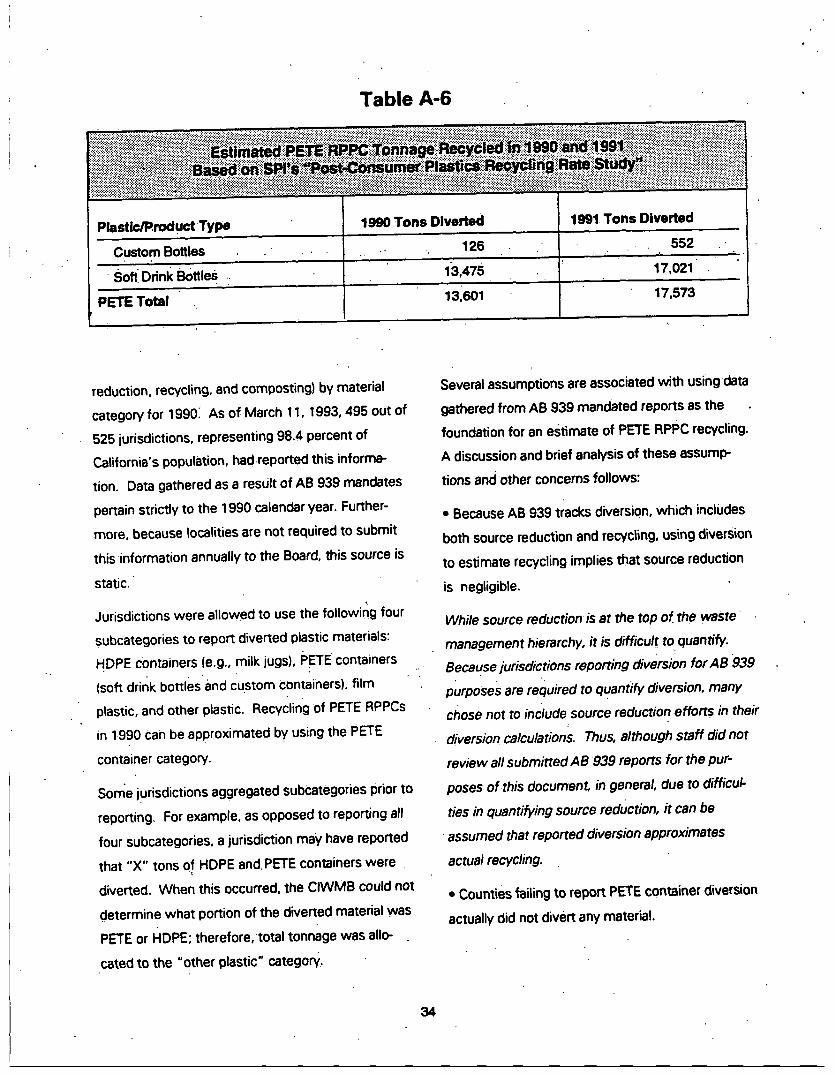
Table A-6 ’
P~ic/Product Type 1990 Tons Diverted 1991 Tons Diverted
Custom Bottles .. .. -. 126 ¯ ¯ . . 552
¯ Sofll Drink Bottles .. 1’3,475 17,021
PETE Total 131601 ~ 17,573
reduction, recycling, and composting) by materialcategory for 19901 As of March 11, 1993, 495 out of
525 jurisdictions~ representing 98.4 percent of
Ca|ifornia’s population, had reported this informa-
tion. Data gathered as a result of AB 939 mandatespertain strictly to the 1990 calendar year. Further-
more, because localities are not required to submit
this information annually to the Board, this source is
static.
Jurisdictions were allowed to use the followir~g four
sut3categories to report diverted plastic materials:HDPE containers (e.g., milk jugs), PETE containers
(soft drir~k bottlesand custom containers), filmplastic, and other plastic. Recyclir~g Of PETE RPPCs
in 1990 can be approximated by using the PETEcontainer category.
Sonde jurisdictions aggregated subcategories prior to
reporting. For example, as opposed to reporting all
four subcategories, a jurisdiction may have reported
that "X" tons of HDPE and.PETE containers were
diverted. When this occurred, the CIWMB could n.determine what portion of the diverted material waPETE or HDPE; therefore, total tonnage was allo-
cated to the "other plastic" categorY.
ots
Several assumptions are associated with using data
gathered from AB 939 mandated reports as thefoundation for an estimate of PETE RPPC recycling.
A discussion and brief analysis of these assump-
tions and other concerns follows:
= Because AB 939 tracks diversion, which includes
both source reduction and recycling, using diversion
to estimate recycling implies that source reduction
is negligible.
While source reduction is at the top of the waste
management hierarchy, it is difficult to quantify.Because jurisdictions reporting diversion for AB 939purposes are required to quantify diversion, many
chose not to include source reduction efforts in theirdiversion ca/culations. Thus, a/though s~aff did not
review al/ submitted AB 939 reports for the pur-
poses of this document, in general, due to difficul-
ties in quamifying source reduction, it can be
¯ assumed that reported diversion approximates
actual recycling.
¯ Counties failing to report PETE container diversion
actually did not divert any material.
It is known that six counties did not report diversion
of PETE containers, but did report diversion of
"other plastic/’ These six counties include Amador,
Calaveras, Fresno,, Imperial, San Benito, and San
Diego. Due to the redemption value associated
with PETE soft drink bottles, it is unlikely that no
diversion of these containers, occu.rred. Therefore, itSeems. likely that a portionof the "other plastic ~’
~ategon/ includes PETE RPPCs, and that the PETE
container diversion rate is understated in these
reports.
Only San Diego County is both densely populated
and significantly urbanized, two criteria that enhance
recycling opportunities. Thus, although there is no
means to detar~nine what portion of the "other
plastic" diversion is attributable to PETE containers,
it is likely that excluding the data from these coun-
ties does not grossly understate diversion.
Calculations:
Based on AB 939 mandated reporting, an estimated
15,378 tons of PETE containers were recycled.
Numerator Option 4: IntegrateStatistics Maintained by California State
-Agencies with spI Recycling Data
The Department of Consewation monitors sales and
returns of plastic beverage containers regulated by
AB 2020, the Beverage Container Recycling and
Litter Reduction Act. Statistics are maintained and
published by container count. Year-end summaries
of :sales and recycling are published by the DOC in
June of the following year. Thus, the report docu-
menting 1992 will be published in June 1993.
The PETE RPPC market is comprised of two types
of containers, soft drink bottles ahd custom contain-
ere. (These containers are called beverage contatn-
ers and postfilled containers in AB 2020 terminol-ogy.) The DOC information can be used to calculate
tons of beverage containers recycled: The DOCalso
reports, the number of postfilled containers (i.e.,
custom containers) that are returned for recycling,
but are not currently regulated by AB 2020/How-ever, uniikebev~rage b0tttesa~about.seven per
pound, there is no standard weight for postfilled .
containers, so the DOC information regarding thenumber of posffilled containers-cannot De convuf t~d
to pounds, and. therefore, cannot be used to estab-
lish diverted tonnage of custom PETE RPPCs.
Because there is no means of determining tons of
PETE custom containers diverted using DOC data,
another source mus~ be used to determine PETE
custom container diversion. The SPI study sepa-
rates recycling of PETE containers by soft drink
bottles and custom containers, so it will be used toestimate custom container recycling.
In addition ,to the assumptions made with respect to.
using the SPI study to extrapolate PETE recycling to
California Isee Numerator: Option 2), the followingadditional assumption had to be made with respect
to the DOC data!
¯ It must be assumed that reporting by DOC certi-
fied processors captures all PETE beverage con-
tatner re’cling in Caiifornia.
To obtain the California Redemption Value associ-
ated with be~,efage container recycling, recyclersmust sell their material to DOC certified processor
For this reason virtually all CRV material is handled
by DOC certified processors who report tonnage tothe DOC Therefore, it is likely that the amount of
PETE beverage containers recycled, but not ac,
counted for in the DOC statistics, is minimal.
s.
Calculations:
If the DOC beverage bottle data (12,028 tons in
1990 and 20,983 tons in 1991) is combined with the
SPI estimate of custom PETE RPPC diversion (126
tons in 1990 and 552 tons in 1991), then all PETE
RPPCs are accounted for. This results in total PETE
diversion of 12,154 tons in 1990 and 21,535 tons in
1991..
B. Denominator: PETE RPPC TonnageGeneratred .~. =
The denominator, PETE RPPC ~onnage generated,
can be calculated by using one of the following
options:
¯ Extrapolate NationalResin Sales to California
Based on Population.
¯use EPA Data.
¯ Use AB 939 PETE Container Waste Genera-
tion Statistics.
¯ Integrate Statistics Maintained by California
State Agencies and the Federal Government.
Denominator Option 1:~ Extrapolate National
Resin Sales to.California Based on Population
As stated previously with respect to cali:ulating the
non-PETE recycling.[ates denominator, data pub-lished in Modem P/astics can be used to extrapolate
RPP.C generation. National resin sales are published
annually in the January edition of Modem P/astics, a
magazine published by McGraw-~ill. Report
methodology is established by SPI and is conducted’
by the firm Ernst & Young. To have year end totals
ready for the Ja.nuary publication, fourth quarter
sales are based on projections. These projections
are adjusted in the following year’s edition. Thus,
the January 1993 issue included sales for 1992
(incorporating a projected fourth quarter) and the
adjusted sales for 1991.
Sellers of resin report monthly sales in the following
ways (units are millions of pounds): by resin type;
by amount sold for vadous applications,¯ within a
resin type; and by the amount sold in major resin
markets includingpackaging and containers.Monthly sales re,ported by each company are cross
¯ checked with the company’s sales for the ¯previous
~d with sa!e~:)r the s~me~’nnnth, one yearprior. Totals are not adjusted for non-reporting resin
sellers.
1"o estimate PETE RPPC generation in¯ California,
nationwide PETE RPPC resin sales had to beconverted to tons, then prorated to California based
on population. In 1990, 12.0 percent of the nation’s
population resided in California. and in 1991 12.2
percent of the U.S. population lived in the state.
The packaging and container statistics assembled
by Modem Plastics identify the amount of eachresin type sold for producing containers, closures,
coatings, and films. Estimates of PETE RPPC
generation can be obtained either by using the pre-
assembled Modem Plastics Container category andincluding only PETE resin sales or by performing a -
line item summation of PETE resin applications that
fall within the SB 235 working RPPC definition.
If the pre-assembled Modem P/astics container~
category is used to estimate PETE RPPC genera-.tion, there is no means Zo determine what specific
packaging items were considered for inclusion in
the container category. Hence, containers that are
considered RPPCs may be excluded from the
calculations while Containers that are not consid-ered RPPCs may be included.
If line item PETE RPPC sales are used to estimate’
generation, the line item .categories include soft
drink bottles and custom containers, and sheeting.
The sheeting category presents problems.because
it includes both RPPCs and non-RPPCs. Resin sales
for containers such as cups and food trays, both
potential!y RPPCs according !o the working defini-tion (these. items are includedif they arecapable of
multiple re-closure), are contained in the sheeting
category. Also included are resin sales for non-
RPPC applications such as blister packaging (not
capable of multiple re-closure). Because there is no
means to separate the RPPCs from the non-RPPCs,
this category will not be included in the PETE
generation calculations. All sheeting applications (of
Which only a portio~ are actual RPPCS) represent
approximately an additional eight percent PETE
resin sales.
Assumptions that must be made to extrapolate the
sales data using either the pre-assembled or lineitem data published in Mbdem Plastics include the
following:
¯ California’s per capita PETE ~RPPC generation is
consistent v~th the nation’s,
without undertaking a specific study, the validity of
this assumption is unknown.
¯ Non-reporting resin sellers account for a negligible
portion of the PETE RPPC market.
Survey representatives, have stated that participa-tion in the annual survey varies by re~in type and
that most large resin sellers participate; however,
the proportion of actual sales accounted for is’
unknown..
¯ Resin.export and the import of products Pa.ckaged
in RPPCs does not impact the equivalency of resin
sales and RPPC generation.
The United States is a net exporter of resin and a net
importer of plastic products.14 The amount of resin
exported specifically for RPPC manufacture and the
amount of products imported that are contained in
RPPCs cannot be determined. As a result, the
impact of these exportand import activ!tie.s on.the"~old-equals-gener~ed" assumption also is. un-
/(nown. " ".
¯ if the pre-aggregated container category is used, it
must be assumed that non-RPPCs that are includedin the category and RPPCs that are not included in
the category are negligible.
The exact components of this category are un-
known, so the validity of the assumption cannot be
determined.
¯ If PETE RPPC generation is estimated by a line
item count, it must be assumed that the two catego-
ries, soft drink bottles and custom containers,
account for all PETE RPPCs.
Although it is known that using these two categories
excludes some RPPCs, there is no means of deter-mining the extent to which generation will be
understated.
Calculations:
As stated, Modern Plastics maintains data onmillions of pounds of resin used in producing pack-
aging and containers. If the Modem Plastics con-tainer Category, including onlY PETE resin (1,204
million pounds in 1990 and 1.360 million pounds in1991), is convened to tons (dividir~g by 2,000 equals
600,000 tons in 1990 and 680,000 tons in 199i) andprorated to California based on population (multiply-
ing by :12 in 1990 and .122 in 1991), total California
37
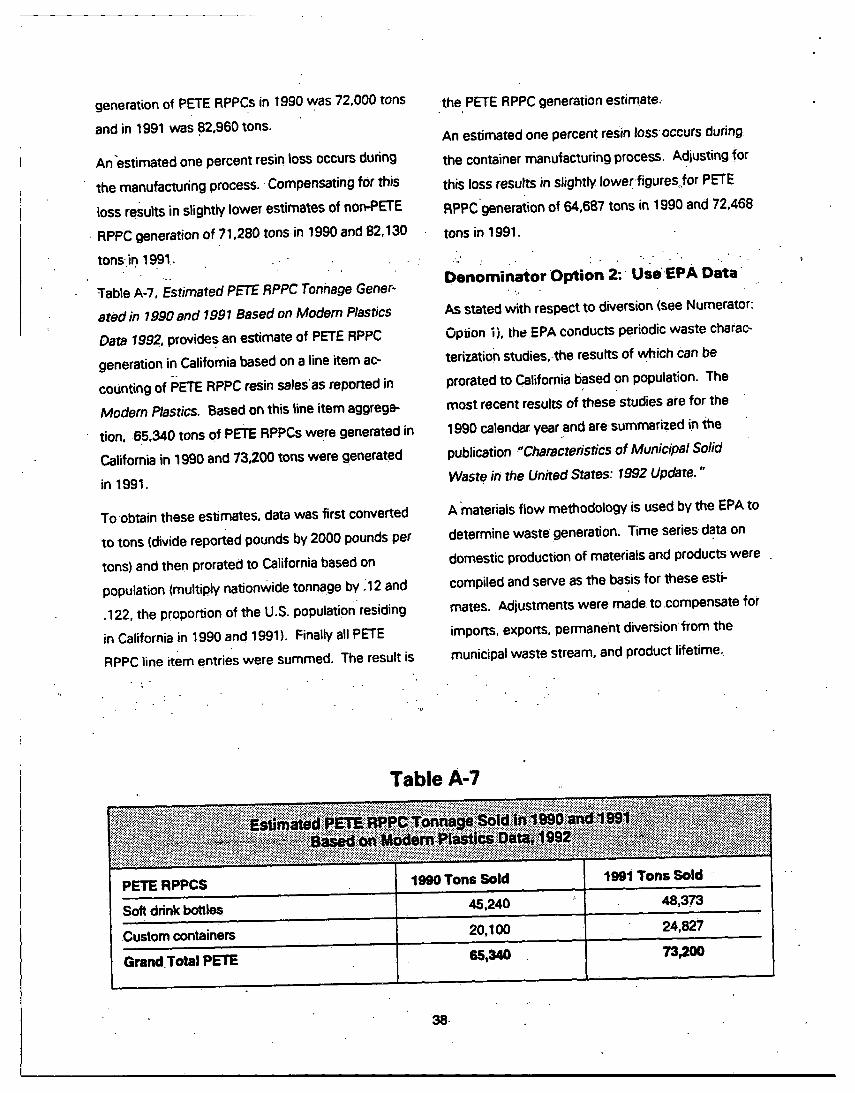
generation of PETE RPPCs in 1990 was 72,000 tons
and in 1991 was ~82,960 tons.
An "estimated one percent resin loss occurs during
the manufacturing process. Compensating for this
loss results in slightly lower estimates of non-PETE
¯ RPPC generation of 71,280 tons in 1990 and 82,130
tons.in. 1991. . ¯
Table A-7, Estimated PETE RPPC Tonnage Gener-
ated in 1990 and 1991 Based on Modem Plastics
Data 1992, provides, an estimate of PETE RPPCgeneration in California based on a line item ac-counting of FETE RPPC resin salesas reported in
Modem Plastics. Based on this line item aggrega-tion, 65,340 tons of PETE RPPCs were generated in
California in 1990 and 73,200 tons were generated
in 1991.
To obtain these estimates, data was first convertedto tons (divide reported pounds by 2000 pounds per
tons) and then prorated to California based on
population (multiply nationwide tonnage by ~12 and
¯ 122, the proportion of the U.S. population residing
in California in 1990 and 1991). Finally all PETE
RPPC line item entries were summed. The result is
the PETE RPPC generation estimate.
An estimated one percent resin loss occurs duringthe container manufacturing process. Adiusting for
this loss results in slightly lower, figures.for PETERPPCgeneration of 64,687 tons in 1990 and 72,468
tons in 1991.
Denominator Option 2: UseEPA Data
As stated with respect to diversion (see Numerator:Option i), the EPA conducts periodic waste charac-
terizatio~ studies,.the results of which Can be
prorated to California based on population. The
most recent results of these studies are for the
1990 calendar year and are summarized in thepublication "Characteristics of Municipal SolidWaste in the United States: 1992 Update. "
A materials flow methodology is used by the EPA to
determine waste generation. Time series data on
domestic production of materials and products were
compiled and .serve as the basis for these esti-mates. Adjustments were made to compensate for
imports, exports, permanent diversion from themunicipal waste stream, and product lifetime;
Table A-7
PETE RPPCS 1990 Tons Sold 1991 Tons Sold
Soft d~nk bottles 45,240 48,373
Custom cop_t_~iners 20,100 24,827
GrandTotal PETE 65,340 73,200
The EPA study divides plastic container data into the
following categories: soft drink bottles (PETE), milk
bottles (HDPE), and other containers (all resins,including PETE andHDPE). ~Thes~e reporting catego-
des differ from those necessary for the resin
specific rates required by SB 235. The EPA cat-egory "otfier containers" includes custom PETE
RPPCs (ile,, PETE RPPCS tha~ are no~ s~ft drink -.
¯ bottles). Also, retail fo~d service containers such ashinged containers and cups are considered RPPCSunder the SB 235 working definition, but are classi-
-fled under the non-durable goods category, not as
containers, according to the EPA.
Several assumptions have been made to extrapolateresults from the EPA study to California. A discus-
sion and brief analysis of these assumptions fol-
~OWS~
¯ Per capita generation of PETE RPPCs in California
must be consistent with per capita generation in the
nation.
This may or may not be accurate. Without perform-
ing research specifiC to California, the accuracy of
this assumption cannot be determined.
¯ Sales of RPPCs not included.in l~e EPA container
¯ figures (i.e., retail food Service containers such as
hinged contai nets and cups) are negligible.
Retail food service containers are primarily made
frbm polystyrene, so not including them in PETE
generation should not result in a grossly understated
estimate.
¯ Generation of custom PETE RPPCs included in the
EPA’s "other container" category are negligible.
Custom PETE RPPC sales are growing_rapidly. In
1990, they accounted for almost 45 percent of the
PETE RPPC market, while in 1991, that figureincreased to slightly more than 50 percent. To say
that this is.an insignificant component is misleading.An attemptto compensate for this p.rob/em will be
presented in the "Calculations" discussion below.
¯ Calculations: " -. : ’
The.EPA estimates that nationwide:4oo,ooo.tor~s ofPETE soft drink bottles were generated in 1990, To
prorate th_is figure to California, nationwide figures
(400,000 tons) must be multiplied by the proportionof the country’s population that resides in California
(12.0 percent in 1990). Based on these calculations,
an estimated 48,000 tons of PETE soft drink bottleswere generated in California.
As stated previously, PETE custom containers (i.e.,
PETE container~ that are not soft drink bottles) areincluded in the "other container" category. The
amount of PETE custom containers that are in-cluded in the "other container" category can be
estimated using Modem Plastics sales ratios (see
Denominator: Option 1 for a discussion of the
assumptiqns.associat.ed with using Modem Plasticsdata). According.to Modem Plasticsdala, in 1990
custom PETE Container resin sales occurred atapproximately 45 percent the amount of PETE soft
drink sales. An estimate of PETE custom containerscan be obtained by multiplying soft drink container
sales (estimated to be 48,000 tons in Californiabased on EPA data) by 45 percent. The resultingproduct is 21,600 tons. This is the estimate of
PETE custom containers. It should be added to the
above estimate of soft drink bottles toobtain anestimate of total PETE RPPCs generated. The,
result of this calculation, 69,600 tons, is the esti:
mated PETE RPPC generation in 1990.
Denominator Option 3: Use AB 939PETE Container Generation Statistics
.The California PETE container generation statistics
obtained from required AB 939 reporting can be
¯ used.to establish an estimateof PETE RPPC sale~,¯ However, because AB 939 does not require annual
ulodetes of solid waste generation studies, thissource cannot continue to be used in the future. As
of March 11, 1993, the CIWMB had compiled
information for 495 out of 525. jurisdictions that
represent 98.5 percent of the state’s population,
Assumptions associated with using this data source
include the following:
¯ Counties reported the line item diversion and
disposal of PETE containers.
Three counties (San Diego, Calaveras, and Imperial)
did not report PETE container disposal and six
counties did not report PETE container diversion
(Amador, Calaveras, Fresno, Imperial, San Benito,
and San Diego), Because generation is based on
d/sposal and diversion, it is likely that PETE genera-
tion is slightly understated.
Calculations:
PETE containers are reported as a subcategory
within the overall plastic category. The compiled AB
939 data show that 86,487 ions of PETE containerswere generated in 1990.
Denominator Option 4: IntegrateStatistics Maintained by California StateAgencies
The Department of Conservation monitors sales and
returns of plastic beverage containers regulated by AB
2020, the Beverage Container Recycling and Litter
Reduction Act. Statistics are maintained and published
by container count. Year-end summaries of sales and
recycling are published by the DOC in June of the follow-
ing year. Thus, the report documenting 1992 will bepublished in June !993.
The PETE RPPC market is comprised of two types of.
containers, soft d~ink bottles and custom containers.(T~h=_~e c.or,.*.~_ine..-s ~re (,~llP.d beverage’containers andposffilled containers in AB 2020 termin01ogy.) The DOC
information can be used to calculate tons of beverage
containers generated. Because there is no means of
determining ton~ of PETE custom containers generated
using DOC data, another source must be used to deter-
mine PETE.custom container dive~rsion. The ModemPlastics data separate PETE resin sales by soft drink
bottles and custom containers, so it will be :used to
estimate custom container generation.
In addition to the assumptions made with respect to
using the Modem Plastics data to extrapolate PETE
custom container generation to Califomia (see Denomina-
tor: Option li, the following additional assumption had tobe made with respect to the DOC data:
¯ It mus~ be assumed that reporting by DOCreports
captures all PETE beverage container sales in California.
Due to the Califomia Redemption Value associated with
beverage container sales and recycling, these containers
are closely tracked by the DOC. Therefore, it is likely that
..¯their¯ statistics are. accurate.
Calculations:
Based on DOC figures, 39,120 tons of PETE beverage
containers were sold in 1990 .and 37.142 tons were s01d
in 1991. When added to the custom container estimates
¯
"
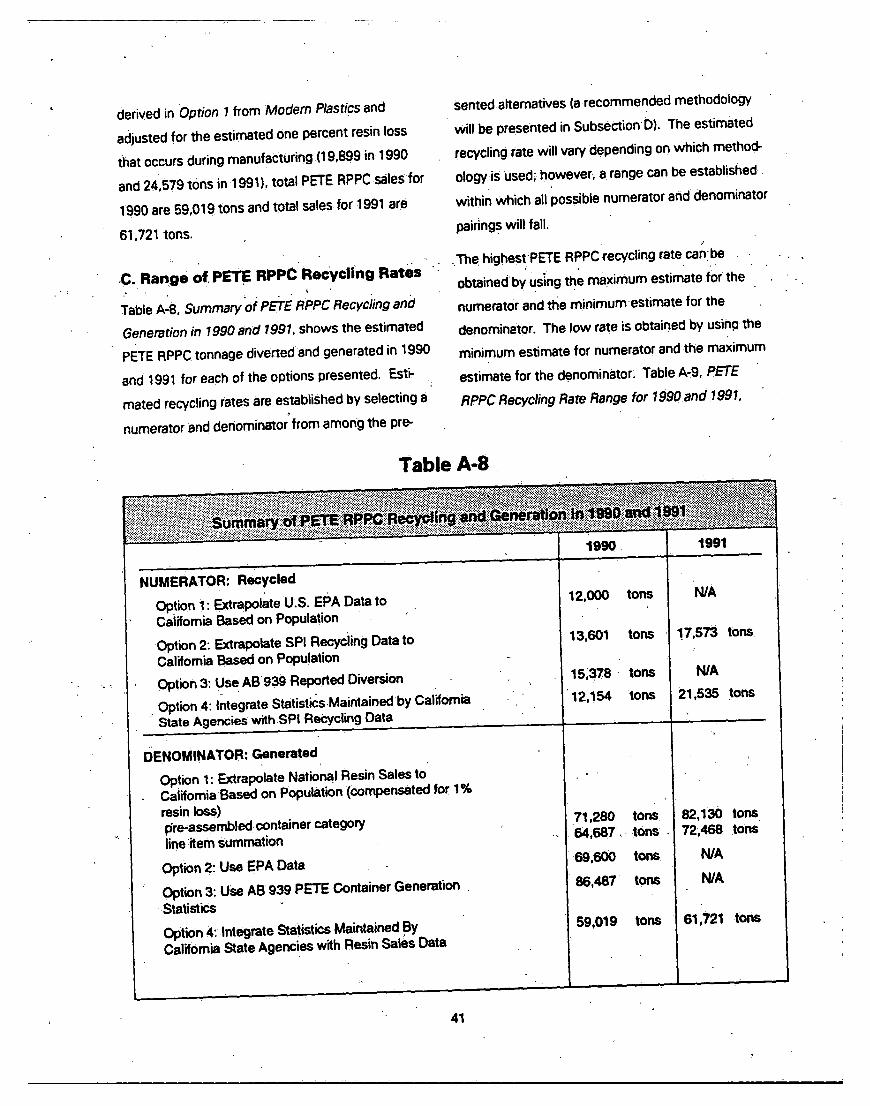
derived in Option 1 from Modem Plastics and
adjusted for the estimated one percent resin loss
that occurs during manufacturing (19,899 in 1990
and 24,579 tbns in 1991), total PETE RPPC sales for
1990 are 59,019 tons and total sales for 1991 are
61,721 tons.
.C. Range of PETE RPPCRecycling Rat~s "
Table A-8, Summaryo~ pETE RPPC Recyciing and
Generation in 1990 and 1991. ,shows the estimated
PETE RPPC tonnage diverted and generated in 1990
and 1991 for each of the options presented. Esti-
mated recycling rates are established by selecting a
numerator and denominator~from among the pre-
sented alternatives (a recommended methodology
will be presented in SubsectionD). The.estimatedrecycling rate will vary depending on which methock
ology is used;however; a range can:be established r
within which all Possible numerator and denominatorpairings will fall,
..The highest~PETE RPPCrecycling rate can:beobtained by using the maximum estimate for the
numerator and the minimumestimate for thedenominator. The !ow rate is obtained by usin.a the
minimum estimate for numerator and the maximum
estimate for the denominator, Table A-9, FETE
RPPC Recycling Rate Range for 1990and 1991,
Table A-8
NUMERATOR: Recycled
Option 1: Extrapolate U.S. EPA Data to
12,000 tons N/A
Caiifomia Based on Population ~
Option 2: Exlrapolate SPI Recycling Data to 13,601 tons 17,573 tons.
California Based on Population
Option 3: Use. AB 939 Reported Diversion .
¯Option 4: Integrate StatistkisMaintained by California
15,378 tons
12,154 tons
N/A
21,535 tons
State Agencies with SPI Recycling Data
DENOMINATOR: GeneratedOption 1: Extrapolate National Resin Sales toCaiifomia Based on Population (compensated for 1%resin loss)i~re-assembled: container categoryline ;item summation
Option 2: Use EPA Data
Option 3: Use AB 939 PETE Container Generation .
71,280 tons64,687 .~ ¯ tons
69,600 tons
86,487 tons
82,130 tons.72,468 tons
WA
WA
¯ Statistics
Option 4: ~lntegrate Statistics Maintained ,ByCalifornia State Agencies with Resin Sales Data
59,019 tons 61,721 tons
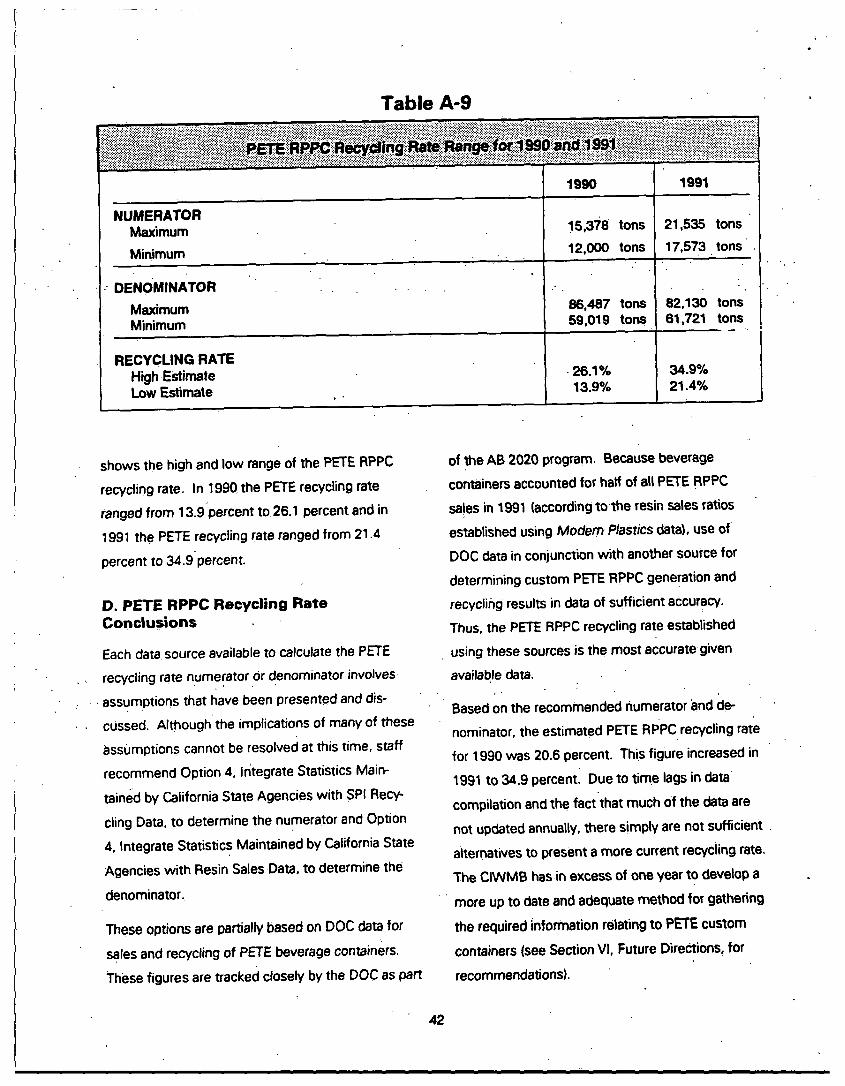
Table A-9
1990 1991
NUMERATORMaximum !5,378 tons 21,535 tons
Minimum ¯. 12,000 tons 17,573. tons
-" OENOMINATOR
MaximumMinimum
86,487 tons 82,130 tons59,019 tons 61,721 tons
RECYCLING RATEHigh EstimateLow Estimate
.26.1% 34,9%13.9% 21.4%
shows the high and low range of the PETE RPPCrecycling rate, In 1990 the PETE recycling rate
ranged from 13.9 percent tO 26,1 percent and in
1991 the PETE recycling rate ranged from 21.4percent to 34.gpercent.
D. PETE RPPC Recycling RateConc|usions
Each data source available to calculate the PETE
recycling rate nume~rator Or denominator involves.assumptions that have been presented and dis-
cussed, Although the implications of many of these~ssumptions cannot be resolved at this time, staff
recommend Option 4, Integrate Statistics Main-
tain~d by California State Agencies with SPI Recy-
cling Data, to determine the numerator and Option
4, Integrate Statistics Maintained by California State
Agencies with Resin Sales Data, to determine the
denominator.
These options are partially based on DOC data forsales and recycling of PETE beverage containers.
These figures are tracked closely by the DOC as part
of the AB 2020 program. Because beverage
containers accounted for half of all PETE RPPCsales in 1991 (according tothe resin sales ratios
established using Modem Plastics data), use of
DOC data in conjunction with another source for
determining custom PETE RPPC gene[ation andrecycling results in data of sufficient accuracy.
Thus. the PETE RPPC recycling rate established
using these sources is the most accurate given
available data.
Based on the recommended numerator and de-nominator, the estimated PETE RPPc recycling rate
for 1990 was 20.6 percent. This figure increased in
1991 to 34.9 percent. Due to time lags in datacompilation and the factthat much of the data are
not updated annually, there simply are not sufficient
alternatives to present a more current recycling rate.
The CIWMB basin excess of one year to develop a
more up to date and adequate method for gathering
the required information relating to PETE custom
containers (see Section VI, Future Directions, for
recommendations).
42
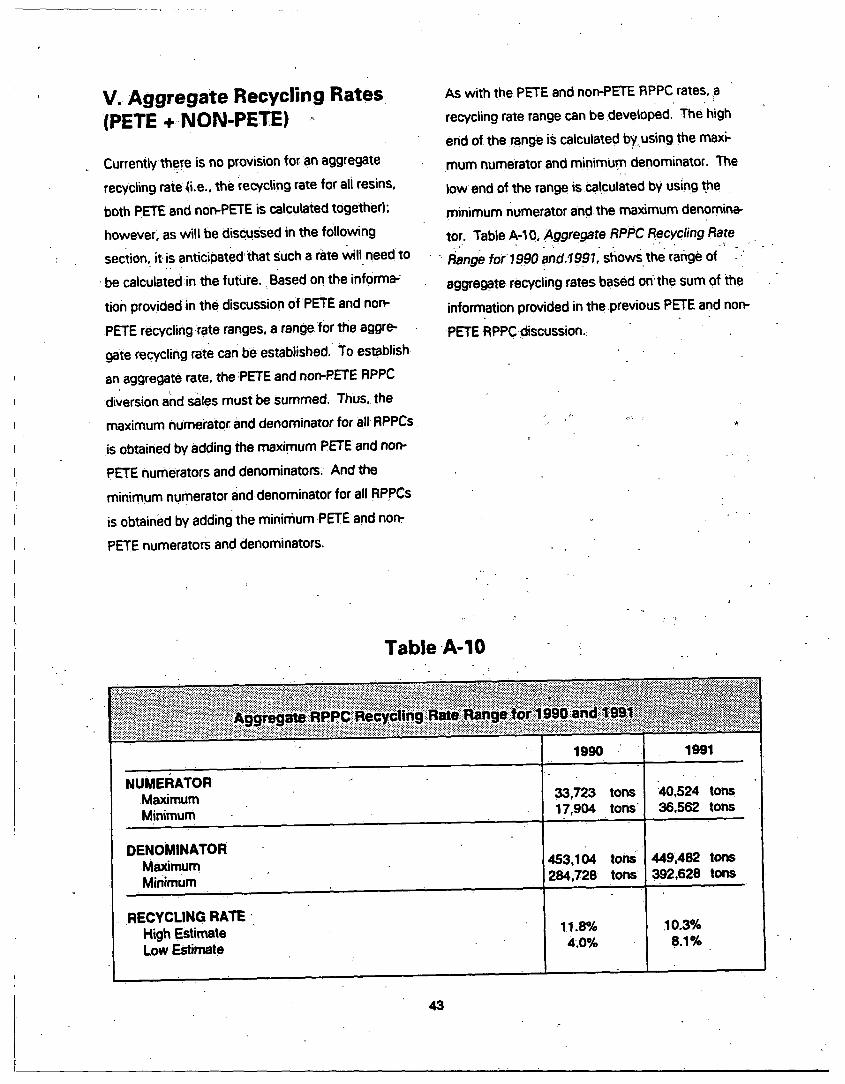
V. Aggregate Recycling Rates(PETE +-NON-PETE)
Currently there is no provision for an aggregaterecycling rate ~i.e., the recycling rate for ali resins,
both PETE and non-PETE is calculated together);however, as will be discussed in the followingsection, it. is anticipated that Such a rate Will need t
¯ be calculated in the future._ Based on the informa-~
tion provided in the discussion of PETEand non-
PETE recycling rate ranges, a range for the aggre-gate recycling rate can be established.~ To establis
an aggregate rate, the PETE and non-PETE RPPC
diversion and sales must be summed. Thus, themaximum numerator and denominator for all RPPCis obtained by adding, the maximum PETE and non-
PETE numerators and denominators: And the
minimum numerator and denominator for all RPPC
is obtained by adding the minimum PETE and non-
PETE numerators and denominators.
o
h
s
s
As with the PETE and non-PETE RPPC rates, arecycling rate range can be developed. The high
end of the range is calculated byusing the maxi-mum numerator and minimum denominator. The
low end of the range is calculated by using t.he
minimum numerator and the maximum denomina-
tor. Table A-10, Aggregate RPPC Recycling Rare .Range for1990 and..1991~ shows the range of --
aggregate recycling rates based on"the sum of the
information provided in the previous PETE and non-
PETE RPPC discussion.
Table-A-10
- 1990 ’ 1991
NUMERATORMaximumMinimum -
33,723 tons17,904 tons
~40,524 tons36,562 tons.
DENOMINATORMaximumMinimum
t°ns~1453’104284,728 tons
449,482 tons392,628 tons.
RECYCLING RATE ¯High EstimateLow Estimate
11.8%42.0%
.10,3%8.1%
VI. Future Directions ..
Presented in this subsection are alternative options,
not previously discussed, that the CIWMB could
develop to obtain the information, necessary toestablish RPPC recycling rates. The alternatives are
briefly analyzed and recommendations for determin-ing recycling rates in futureyea~s are made. This
subsection also addresses present efforts to amend
SB 235; the general direction of these efforts, and
their corresponding impact on determining recycling
rates, will be discussed.
A. Recommendations for AlternativeMethods to Calculate Recycling Rates
Due to time and resource constraints, it wasnecessary to rely on existing data to develop PETE
and non-PETE recycling rate estimates. These
estimates address the 1990 and 1991 calendaryears, not 1992 as might be expected. Entitiesthat
engage in annual updates of recycling figures~(i.e.,SPI) are in the process of publishing their d~ta for
the 1992 calendar year. Incorporating that informa-
tion into this report would have resulted in delay, In
addi~i .o.n.. to this time factor, other issues must be
¯ ¯addressed with respect tQ.themethods p~esented
for deriving recycling rates.
Estimates of recycling ~ates vary dramatically
depending on the data source used to obtain the
estimate. To conform to SB 235 parameters, each
of the cite~l sources first had to be subjected to
various assumptions of unknown validity. Thus, th
resulting recycling rates are less accurate than
desired. Developing new, more accurate data
sources for recycling rate numerators and
denominators would result in a more accurate
estimate of the RPPC recycling rates. Another
e
issue to consider is that the U.S. EPA and the AB
939 data are not updated annually. Because SB 235
recluires an annual recycling rate report, these two
sources cannot be used for future reports.
The n~ed to de.v.elop more accurate methods to
estimate RPPC recycling and generation in California
is,a, pparent...A general discussion and .analysis.ofalternatives for obtaining RPPC recycling and
generation figures is presented below. This discus-
sion concludes with recommended methods for
obtaining RPPC recycling and generation figures.
1. Recycling Rate Numerator (recycled)
Alternatives for calculating the tonnage of non-PETE
and PETE RPPCs recycled in California were pre-
sented in Sections Ill(A) and IV(A) of this document.These alternatives included (1) Extrapolate U.S. EPA
Diversion Data to California Based on Population, (2)
Extrapolate SPI Recycling Data to California Based
on Population; (3) Use AB 939 Reported DiversionData, and (4) Integrate Statistics Maintained by
California State Agencies with SPI Recycling Data.
In addition to these previously discussed options,
three alternative options exist for obtaining thenecessary information. These options include the
following:
¯ Use Modified DOC Reporting Procedures.
¯ Survey California Plastic Processors.
¯ Use AB 2494 Reported Data.
Use Modified DOC Reporting Procedure~
More than 60 California plastic processors arecertified by the DOC under the AB 2020 program.
As part of this program, they are required to submit
monthly reports’to the DOC that document the
amount of AB 2020 plastic scrap handled. All of
these processors accept PETE RPPCs regulated by
AB 2020, and many accept non-PETE RPPCs and
PETE RPPCs not regulated by AB 2020.
Because plastic scrap regulated by AB 2020 has the
highest value of all postconsumer plastics and
because.DOC reimbursement for processing costsis contingent on certification, most postconsumer
plastic handlers will be certified by the DOC. Thus,
access to these entities would resu~ in th~ D~rd’sability to track virtually ill plastic scrap diverted in
California.
With a slight modification, the DOC’s reporting
requirements would provide an additional source forobtaining diversion statistics. This modification
would recluire the DOC monthly survey to include
provisions for reporting all RPPC.diversion. not only
AB 2020 PETE containers and other PETE contain-ers. Reporting would need to be in weight units,
not determined by container count, to be compat-
ible with the recycling rate denominator.
Survey California Plastic Processors:
The CIWMB could engage in its own survey of "
plastic ~)rocessors. It is anticipated that the infor-mation obtained ~rom this survey would be equiva-
lent to that obtained by modifying current DOC
reporting procedures. However, such an undertak-
in~ would essentially be a duplication of DOC
efforts and w~)uld result in increasing the privatesector’s reporting burden. In the interest of mini-
mizing public and prig, ate sector efforts in obtaining
RPPC recycling information, this
opt=on is not recommended.
Use AB 2494 Reported Data:
Another alternative the Board could pursue to
improve RPPC diversion estimates is tO incorporate
an RPPC category into the AB 2494 reportingmethods that Board staff are currently developing.
However, unlike the DOC reports, reporting require-
rnents associated with AB 2494 are. essent!ally..votuntaw and of unknown ~requenw-. B~cause AB
2494 reporting byrecyclers is voluntai~/, this option
is inferior. Reporting through AB 2494 .channelscould serve as a crosscheck against other data
sources, and, therefore, should not be altogether
discounted.
Recommended Approach:
For the purpose of obtaining RPPC recycling infor-
mation, the CIWMB should consultwith the DOC to
modify the DOC’s plastic processor repo~ngprocedures. If it is not feasible to modify DOC
reporting, the CIWMB should initiate an indepen-
dent plastic processor survey. Repoiting method-
ologies for AB 2494 purposes shquld be developedin a manner so that they may be utilized by the
Board as a crosscheck to estimate RPPC recycling,but not used as .the primary information source.
2. Recycling Rate Denominator(generated)
Alternatives for calculating the tonnage of non-PETE
and PETE RPPCs generated in California were
presented in Sections Ill(B) and IV(B) of this docu-
ment. These alternatives included (1) Extrapolate
National. Resin Sales to California Based on Popula-
tion, (2) Use U.S. EPA Generation Data in Conjunc-
tion with Resin Sales Data, (3) Use AB 939 Ptastic
Generation Statistics, and (4) Use Statistics Main-
rained by California State Agencies in Coniunction
with U.S. EPA Data or National Resin Sales. In
addition to these prev~iously discussed options, three
alternative options exist for obtaining the necessary
information. These options include the following:
¯Waste Sort Extrapolations,
¯ Sales Reports from Product Manufacturers or
Retailers, and . .
¯Retail Shelf Surveys.
Waste Sort Extrapolations:
Rather than rely on outside entities for the datarequired to estimate RPPC sales, the CIWMB could
commission annual waste sorts. Container disposal
figures could then be added to diversion estimates
to obtain total RPPC sales in California. Waste sortsprovide a high level of control over methodology;thus, the sort ~ouid be conducted using the exact
SB 235 definition of an RPPC. Waste sorts wouldneed to be performed annually to provide up-to-date
information and account for variations in RPPC
disposal. In addition, the accuracy of waste sorts is
a function of the number, location, frequency andtiming of sampting~ so accuracy.would vary, with
more accurate data also bei.ng more costly.
Sales Reports from ProductManufacturers or Retailers:
The CIWMB could require all products sold in
California that are contained in R,PPCs to be re-ported. "[his would entail product manufacturers
submitting to the CIWMB both the RPPC weight
and the number of product units sold in California fo
each of their RPPC lines. It is anticipated that there
are several thousand product manufacturers that
must comply with SB 235. The amount of time
r
required by ClWMB staff to obtain and compile the
data and the corresponding expense make this
option undesirable. Furthermore, many manufactur-
¯ ers claim that given complex product distribution
systems, they are unable to determine the exact
sales of a product line in any given state. Thus,
developing the tracking systems required to obtain
,California-specific da.ta would be a substantial -
undertaking:
Requiring retail outlets, as opposed to product
manufacturers, to submit RPPC sales information
would eliminate the need to develop a system totrack RPPCs through distribution channels. How-
ever, reporting at the retail level would necessitate aparallel tracking mechanism. Ais0, as evidenced by
the implementation of the "snack tax," it would be
necessary to develop and thoroughly disseminate
an exhaustive list of products sold in RPPCs.
According to information obtained using Standard
Industrial Classification (SIC) codes, there are more
than 22,000 grocery and convenience store outlets
=n the state (SiC code 5411). ~n addition to grocerystores, specialty stores selling items such as beauty
supplies and automotive products, as well asbakeriesand.liquor stores, would all be affected by
any retail reportidg requirements. Additionally,reporting through retailers would not provide
information regarding RPPC weights. The CIWMB
would either need to develop a standard RPPC
weight or contact product manufacturers. As with
reportingat the level of the.product manufacturer,
reporting by retail outlets would be costly and
burdensome for both the private and public sectors.
Retail Shelf Surveys:
A final alternative for developing estimates of RPPC
generation in California is based on retail shelf
surveys. In performing initial research related to SB
235, CIWMB staff conducted shelf surveys at two
retail outlets, a grocery store, and a variety store.
The purpose of this exercise was;to identify the
,..number-and type of RPPCs used to package prod-
ucts sold at those stores¯
It would be impractical to attemp[ to modify shelf
surveys to estimate the tonnage of RPPCs gener-
ated in California. Because it is not possible to
conduct shelf surveys at all retail outl~’ts, a method-
ology would be needed to account for the different
product stoc.king that occurs at various similar stores
(grocery store "X" versus grocery store "Y") as well
as the vari~tio.n in stocking at dissimilar stores (e.g.,
a grocery store versus.an automotive supply store).
Virtually all types of retail stores carry products
packaged in RPPCs, so surveys would need to be
conducted at many types of stores¯
It took Several weeks for CIWMB staff to conduct
.the shelf survey for the sole purpose oflidentifying
RPPC lines. Sales levels and container weights
¯ wo.uld need to be accounted for when determining
RPPC tonnage;~ this would resu!t in an even greater
time commitment.
Recommended Approach:
Due to the:substantial resources required to imple-ment any of the above analyzed’ alternatives, none
were recommended/Options based on U.S. EPA
and AB 939data cannot be recommended becausethey are not:updated annually as SB 235 requires.
Tiherefore, it is recommended that,the per capita
extrapolation of national resin sales from the publica-
tion Modem Plastics. be used to determine RPPC
generation. The extrapolation should be performed
on a per capita basis, so the result will be I~ropor-
tional to the amount of the U.S. population that
resides in California. |See Sections Ill(B) and IV(B)
for a discussion of assumptions.] To improve the
accuracy of the estimates, information maintained,by the DOe:for soft drink bottlbs can be substituted
for the Modem Plastics’ soft drink bottle estimate.
The extrapolation of Modem Plastics data can. be
performed using either the pre-aggregated con-
tainer category or a line item accounting method,
neither of which is precisely accurate. Because
neither is clearly preferable, it is recommended that
an average of the two be used to estimate RP~PC
generation in California.
B. Proposed Amendments to Current :Statutory Language
When consulting with affected parties, ClWMB
staff were made aware of inconsistencies between
SB 235’s statutory language, the expectations of
parties engaged in the legislative process, and the
=ntent of the author’s office. Two Senate Bills
~ntended to remedy these inconsistencies have
been introduced, one by SB 235’s author, Senator
Hart, (SB 951), the other by Senator Boatwright (SB
466). Although these Bills address multiple .aspects
of SB 235, only those proposed amendments.that
directly relate to the calculation of the PETE and
non-PE-I’E recycling rates wiil be discussed in this
document¯
In its current state (March 5, 1993, version), SB951, the Hart amendments, would.not modify the
PETE and non-PETE recycling rates. The Board
would continue to be re~luimd to publish annual
47
reports documenting recycling rates for these
RPPCs. There is no provision for an aggregate
recycling rate that would combine both PETE and
norPPETERPPCso
Unlike the current Hart amendments, SB 466, the
Boatwright amendments (amended in Senate April
¯ 12; 1993), would create an aggregate. ~’ecycling rate.
¯ The �IV~/MB Would still need to publ!sh the PETE. .RPPC recyclingrate, but there would be no require-
ment to publ=sh a no.PETE RPPC ~ecyciing rate.
The Boatwright amendments also propose anexemption from the compliance requirements for all
RPPCs that hold food and cosmetics, Both corn-modifies are currently regulated by SB 235 unless "
they are specifically a drug, medical food, or infant
formula. Although these items would be exempt
from compliance, they would be included in the
calculation of the aggregate recycling rate.
ENDNOTES
Section 42310 (b) and (c).
= Primarily the following six resins are used in
manufacturing RPPCs and have been incorporated
into container coding systems. "l’he numbers andacronyms used by coding systems to identify the
resins ale provided as well:.
(1) PETE: polyethylene terephthalate (also
abbreyiated PET) _
(2i HDPE: high density polyethylene
(3) V: polyvinyl chloride (also abbreviated
PV¢)
(4) LDPE:= low density polyethylene
(5) PP: polypropytene
(6) PS: polystyrene
3 Reporting guidelines established by AB 939 only
address plastic containers comprised of HDPE or
PETE resins.
¯ The terms "sales" and "recycled" are established
inthe definition of a recycling rate in SB 235 (Sec~
tion 42301). For the purposes of. this report, the¯ term "generated" is used inte~changeabi¥ with the..
term "sales". The assumption implicit to equating
the two terms is that RPPCs sold in California aredisposed (and therefore generated) in California andVice-ve rsa. While not strictly accurate, staff had no
means to estimate the impact of container migra-
tion on tonnage estimates: Also the term "genera-Iron" is consistent with terminology established in
AB 939.
s Senate Bill 235 provides that recycling rates may
be calculated on the basis of weight, volume, or ¯
¯ number. Because waste management data are
traditionally compiled on the basis of weight, all
recycling rates calculated-in this document will be
weight based.
e Mod.erffP/astics is a periodical, published by
McGraw-Hill. January issues contain a summary of
annual resin sales by product application.
~ F, conomi~ RePort .of the: G~verno~,"July 1992: "
~ Post-ConSumer Plastics Recycling Rate Study
(Calendar Years 1990 and 1991), Society of the
Plastics Industry and Biannual Report of Redemp-
tion and RecycJing Rates (January 1, 1992 - June 30,
1992). Californi~ Department of Consen~ation.
¯ "Other Packaging" includes tubs and containers.~
film packaging; retail bags. and other miscellaneous
packaging. Non-retail bags were included as Other
Packagingin the 1990 estimates and as Non-
Packaging in the 1991 estimates.
lo. New .1991 Categories not used in 1990~
11- Other Packaging includes tubs/containers, flexible
packaging, and other miscellaneous packaging.
t= Includes rigid (non-foam) packaging, rigid foam
packaging, protective packaging, food sewicespackaging,and(~ther miscellaneous packaging.
~ Assembly Bill 2494 modifies AB 939’s provisions
and requires periodic reporting of waste disposal
and diversion. The law itself is ambiguous withrespect to issues such as reporting frequency,
material types by which reporting .will occur, and
entities required to report. Board staffhave recently
begun developing regulations to implement AB
2494, but at this point it would be premature to
speculate regarding whether the information
generated will be useful for establishing RPPC
recycling rates.
49
,4 One county (Imperial County) did not report
diversion of PETE containers but reported diversion
of HDPE containers and other plastic. Six counties(Glenn. Madera, Marin, San Luis Obispo~ Siskiyou,
and Yolo Counties) did not report diversion of HDPE
containers, but did report diversion of PETE contain-
ers and other piastics. Five counties ( :Amador,Cataverasl .Fresno, San Benit0, and San Diego
Counties) did not report diversion of either PETE or
HDPE containers, but did report diversion of other
plastics.
,s Contribution of Plastics to the U.S. Economy.
Society of the Plastics Industry, Inc., 1992.
Franklin Associates, 1992.
,7 "Other Resin" includes Acrylonitrile Butadiene
Styrene (ABS), Cellulosics, Polycarbonate (PC), and
Styrene Acrylonitrile (SAN) resins.
~6 The following statistics were used to convert milk
sales in plastic containers to tonnage of RPPCs used
to contain milk:
Average quart container. = 120 grams or .265
pounds
AVe.rage half gallon containers = 75 grams or-
.165 pounds
Average gallon container = 60 grams or .132
pounds.
,9 Contribution of Plastics to the U.$. Economy.
Society of the Plastics Industn/, Inc., 1992.
50
I I I IIII II