rigorous standards by determining which of two methods of … · 2006-04-27 · 2 rigorous...
TRANSCRIPT

1
Chapter One: Introduction
Since the early 1900s, efforts to improve mathematic achievement among students
from the United States compared with their peers in other industrialized countries have
been part of educational reform movements (Joshi, 1995; Miller & Mercer, 1997a). These
efforts include the mathematics standards established by the National Council of
Teachers of Mathematics (NCTM) (Flint & Karlsson, 1996). As a result, math standards
and corresponding expectations of student performance are increasing.
Students with learning disabilities have more difficulty than peers without
disabilities in math computation and problem solving (Miller & Mercer, 1997a). The
discrepancies occur among students of all ages. According to Cawley and Miller (1989),
the rate of learning for students with disabilities is half that of peers without disabilities.
An extensive body of research addresses strategies for providing instruction in
math. The National Center to Improve the Tools of Educators reviewed 956 articles on
math research in its report to the California State Board of Education (Dixon, Carnine,
Lee, Wallin, & Chard, 1998). Some of the studies reviewed included students with
learning disabilities. Although extensive research is available, practitioners must continue
to improve and to “fine tune” methods of instruction. As Miller and Mercer (1997a)
explain, “Researchers and teachers must continue to work together to determine which
curricula and instructional practices will bring about the best results in the shortest
amount of time” (p. 54).
With “fine tuning” in mind, the purpose of this study was to address the
discrepancy between low mathematics achievement in calculation skills and increasingly

2
rigorous standards by determining which of two methods of instruction is more effective
and efficient for students with a learning disability.
The review of literature includes research articles on math skills of students with
learning disabilities of all ages, computation skills of primary students, use of
manipulatives, methods of instruction for math computation, and the TouchMath system
of computation. The national standards recommended by NTCM briefly are discussed as
they affect student expectations. Also reviewed are the positive outcomes of effective
instruction for students with behavioral problems. Informational articles also are included
that address the issues regarding math standards, critiques of math research, behavior
management interventions, and math manipulatives. The literature review was conducted
via ERIC On-line, Kentucky Virtual Library, on-line educational journals, and
educational web sites. Manual searches were conducted at the university’s educational
library. Innovative Research, Inc., the company that produces TouchMath, provided
research supporting the use of TouchMath.

3
Chapter Two: Review of Literature
Math Achievement Among Students with Learning Disabilities
Research suggests that students with mild disabilities lag behind their peers in
mathematical calculation and application (Fleischner, Garnett, & Sheppard, 1982;
Fleischner, & Manheimer, 1997; Cawley & Miller, 1989; Mercer, 1997; Garnett &
Fleischner, 1983). This lag occurs with elementary (Cawley & Miller, 1989; Garnett, &
Fleischner, 1983) middle school (Fleischner et al., 1982; McLeod & Armstrong, 1982),
and high school students (Warner, Alley, Schumaker, Deshler, & Clark, 1980; Cawley,
Baker-Kroczynski, & Urban, 1992; Cawley & Miller, 1989; Greenstein & Strain, 1977).
In a survey of middle to high school math teachers by McLeod and Armstrong (1982),
teachers reported that students with disabilities lack adequate skills in basic computation
and numeration. Middle school students also lack basic addition facts. Fleischner et al.
(1982) found that middle school students with learning disabilities have math skills
equivalent to those of typical third graders. Garnett and Fleischner (1983) compared the
math skills of two hundred forty children, ages 8 to 13, half with learning disabilities and
half without disabilities. Their automatization ability and proficiency in basic fact
computation were evaluated. The study showed that students with learning disabilities
were slower and less proficient than peers without disabilities. Other studies have shown
that students with learning disabilities are accurate with regard to basic fact responses but
perform more slowly than peers without disabilities. This slower pace may reflect an
inefficient use of strategies, such as counting instead of recall (Fleischner, et al. 1982;
Erenberg, 1995; Goldman, Pellegrina, & Mertz, 1988). Cawley, Fitzmaurice, Shaw, Kahn
and Bates (1979) found that high school students with learning disabilities made

4
progress, but their progress was slower than that of peers without disabilities. In a later
study, Cawley and Miller (1989) found that, typically, these students required 2 years of
study to yield a 1-year gain in skill.
National Reform Standards in Mathematic Achievement
According to the U.S. Department of Education’s Office of Educational Research
and Improvement (Campbell, 2000), math scores declined among students nationwide
from 1973 to 1982. This decline was supported in a report, A Nation At Risk, in April
1983 by The National Commission on Excellence in Education. Although studies
completed by the U.S. Department of Education (Campbell, 2000) show an increase in
student scores since 1982, concerns of student progress nationwide compared with
students in other nations, continue to exist (Gonzales, 2000). Among the many efforts to
reform math instruction, national standards have been one reaction to poor student
performance nationwide. The NCTM standards stress instruction based on problem
solving strategies used in students’ daily lives rather than abstract operations, rote
memorization, drill and practice (Mercer, 1997; Flint & Karlsson, 1996). The NCTM
developed the following goals:
• Students learn to value mathematics
• Students become confident in their abilities to do
mathematics
• Students become mathematical problem solvers
• Students learn to communicate mathematically
• Students learn to reason mathematically (Flint & Karlsson, 1996, p. 4)

5
Flint and Karlsson (1996) support the standards and explain, “Manipulatives, calculators
and computers are tools that enable students to explore concepts and number patterns,
analyze data rather than memorize a series of steps and perform drills on paper” (p. 5).
Other researchers disagree with the standards and suggest best practice as defined by
other research is being ignored (Mercer, 1997). Dixon and Carnine (1990) argue the
NCTM standards fail to emphasize pedagogy, the instructional delivery system, and
implementation. Miller and Mercer (1997a) suggest “enough knowledge has been
gathered to move math educators into a ‘refining’ rather than a ‘reforming’ mode” (p.
33). It is not the purpose of this review to debate this issue, but to point out the
differences in the views of researchers.
Rationale for Learning Facts
Basic facts. Although the NCTM standards do not specifically list mastery of
basic math facts, there is support for teaching these skills. Mercer (1997) explains the
logical structure of math as it builds from simple relationships to more complex tasks.
In a study of multiplication and division, Miller and Milam (1987) discovered that errors
in multiplication primarily were due to a lack of basic addition skills and memorization of
multiplication facts. Miller and Mercer (1997b) explain that students who lack mastery of
basic facts will experience failure at higher-level thinking skills. Dixon (1994) stresses
that teaching the four basic operations (addition, subtraction, multiplication, and division)
is essential to any math curriculum. Basic addition skills are essential to the foundation of
all math skills.
Levels of instruction. Mercer (1997) discusses the basic levels of teaching math
according to Underhill: concrete, semi-concrete, and abstract. Manipulatives are used at

6
the concrete level to improve the student’s understanding of the mathematical process.
Manipulatives are defined as “objects or things that appeal to several of the senses”
(Yeats, 1991, p.7) and have been used in math instruction since the 1930s (Sowell, 1989).
Manipulatives have been used effectively for third grade students with learning
disabilities (Marsh & Cook, 1996), fourth graders with learning disabilities (Jones,
Thornton, & Toohey, 1985), at-risk students in grades four through six (Bryet, 1992),
junior high students (Threadgill-Sowder & Juilfs, 1980), and students in kindergarten
through grade eight (Suydam & Higgins, 1977). Some research has indicated possibly
inappropriate uses of manipulatives as some students use the manipulatives mechanically
instead of meaningfully (Baroody, 1989, p.4). Mercer (1997) defines the semi-concrete
level as the use of materials that include dots, lines, tallies, pictures or any visual model.
According to Mercer (1997), the abstract level involves use of numerals in computation.
Instructional Strategies for Teaching Math
Mercer, Jordan, and Miller (1994) emphasize that teachers must be aware of
individual student needs and design instructional strategies that address those needs.
Research supporting this statement includes that of Threadgill-Sowder and Juilfs (1980),
who found that manipulatives helped low achieving junior high school students but
slowed the progress of “more able” students (p. 363). Baroody (1989) was critical of
manipulatives because pupils can learn to use manipulatives mechanically to obtain
answers, just as with symbols. He observed that the particular medium used (objects,
pictures of objects, or video displays of pictured objects) may be less important than that
the experience is meaningful to pupils and they are actively engaged in thinking about it.
Evans and Carnine (1990) also suggest that instruction is necessary to ensure that both
7
procedural and conceptual knowledge are developed. Evans and Carnine as well as Scott
(1993) suggest bypassing the concrete stage and teaching math computation using a semi-
abstract method of instruction.
Scott (1993) used TouchMath, a multi-sensory program from Innovative Learning
Concepts, Inc., with three elementary students: one with learning disabilities, one
identified with mild mental disability, and one with moderate mental disabilities as
outlined by Georgia’s criteria for identifying students with special needs. In TouchMath,
the student uses dots on each number for counting forward or backward. Appendix A
shows all numerals with touchpoints. The skill areas include column addition, two-digit
addition with regrouping, single-digit subtraction, two-digit subtraction, and two-digit
subtraction with regrouping. A multiple-probe design across math skills was used. The
phases were initial screening, probe conditions, touchpoint training, and intervention.
These phases were implemented with each subject individually for 15 to 30 minutes.
After baseline was complete, the trainer taught the students the touchpoints on the
numerals until they reached 100% mastery. Then math computation with the use of
touchpoints began. The trainer modeled calculation steps with touchpoints and supervised
guided practice. The probes consisted of 20 math problems used in the training phase but
the problems did not have touchpoints. All students made progress when using
touchpoints and met criterion. One student maintained 100% accuracy on 3- and 6-week
maintenance probes and generalization. The last data on the other two subjects were four
probe sessions immediately following a training phase. One student was 100% accurate
on column addition and three-digit subtraction, while demonstrating an accuracy of 89%
on double-digit subtraction. This was an improvement from 0% accuracy in baseline. The

8
last student, whose baseline data ranged from 0% to less than 40% accuracy,
demonstrated 100% accuracy on all three skill areas.
Kokaska (1975) used a manual notation system to teach addition and subtraction
to four primary students with mild mental disabilities. This system used dot notation for
counting in addition and subtraction. These female students (ages 9, 12, 12, 13)
previously had demonstrated their inability to learn the math skills from the regular
curriculum materials and being taught individually. Three students continued to draw the
dots on the numerals in order to solve the equation. The students increased their accuracy
in addition even though the difficulty of computation increased from single digit addition
to double digit and column addition. One student progressed farther by only visualizing
the dots to compute addition, subtraction, and beginning multiplication problems.
Kramer and Krug implemented a system like TouchMath, which uses a dots-on-
numerals system to teach basic math concepts to students with various disabilities
(learning disability, educable mentally retarded, language disability, trainable mentally
retarded, educationally handicapped) from kindergarten to second grade. The students
progressed through four different stages: counting each bold dot on the numerals;
counting each faded dot on the numerals; starting with the top numeral and adding by
counting the faded dots of the bottom numeral; and converting to rote facts. Each student
progressed through these phases at his/her own rate. Kramer and Krug (1973) found this
system benefited students who were beginning to learn math concepts, students having
difficulty, or students who would rely on a manipulative system throughout their lives.
Evans and Carnine (1990) compared two types of instruction—concrete and semi-
concrete—to determine which was more effective and efficient. They compared two

9
commercial texts: Explorations by Addison-Wesley, which uses manipulatives, and
Connecting Mathematics Concepts, which use an algorithm strategy. The results were
similar throughout posttest and maintenance conditions. Each strategy was comparable to
the other in terms of accuracy. Evans and Carnine were surprised that the scores were so
low (68% and 60% accuracy respectively), considering the amount of time spent in
instruction. A significant difference was established in efficiency. Instruction with
concrete manipulatives took longer than the algorithm strategy.
Implications for Instruction with Students with Behavioral Problems
“Low achievement and behavior problems go hand in hand; they are highly
related risk factors” (Kauffman, 1997, p. 247). Kauffman describes a study by
Kupersmidt and Patterson that reported a direct correlation between students with three or
more social problems and low achievement. Other researchers stress the importance of
increasing the academic skills of students with behavior problems as a strategy for
decreasing discipline concerns (Ayllon & Roberts, 1974; Kerr & Nelson, 2002).
Good instruction is now known by researchers to be the first line of
defense in behavior management. That is, a good instructional program
prevents many behavior problems from arising, and an emphasis on
instruction is compatible with the clearest mission of public schools
(Kauffman, 1997, p. 91).
When teachers have access to two instructional procedures that use strategies with
proven effectiveness, it seems desirable to determine which procedure is more efficient.
Neither the student nor the teacher has time to waste in school. Mercer et al. (1994) warn
that the poor math progress of students with learning problems and the likelihood of

10
higher standards establishes a clear need to improve math instruction. Without better
math instruction, these students will continue to face debilitating frustration and failure.
Purpose of the Research
Teachers of students with disabilities constantly must strive for effective and
efficient instructional methods. The purpose of this study was to determine which method
of instruction—semi-concrete using TouchMath, or concrete using manipulatives as
outlined in The Path to Math Success—is more efficient when teaching addition to
primary students with learning disabilities. The district-adopted math program is Silver
Burdette Ginn’s The Path to Math Success (Fennell et al., 1998). This study attempted to
answer the following questions:
1. Which is more effective, TouchMath or manipulatives, in teaching basic
additions facts to students with learning disabilities?
2. Which is more time efficient, TouchMath or manipulatives, in teaching basic
addition facts to students with learning disabilities?
3. What are students’ opinions of TouchMath and manipulatives?
Effective and efficient instruction is needed to assist students with learning
disabilities acquire academic skills in a timely manner. The answers to these questions
are one step towards improving instruction for students with learning disabilities.
11
Chapter Three: Methods
An adaptive alternating treatment design was used to compare two methods of
instruction. Three sets of addition problems were developed with different numerals in
each set. Two of the sets represented the methods of instruction for comparison, while the
third was a control set. Daily probe data was gathered on students’ rate of correct digits
per minute. Following initial baseline probes across all three sets, the design was
implemented across three conditions. In the first condition (Strategy 1), each method of
instruction was taught using the longer method. The student was required to count (via
touchpoints or manipulatives) both numerals in the addition problem. The second
condition (Strategy 2), involved teaching a quicker method of adding, in which the
student said one numeral aloud and added (via touchpoints or manipulatives) the next
numeral.
When using the touchpoint method for Strategy 1, students had to touch the
touchpoints on both numerals and count. One set of addition problems were used with
touchpoints while a different set of addition problems was used with manipulatives.
When using manipulatives for Strategy 1, students put round colored counters beside
both numerals and counted them together.
With Strategy 2 touchpoints, the student had to say the large numeral, and then
touch the touchpoints of the smaller numeral to count. Similarly, when using
manipulatives in Strategy 2, the student placed the colored counters next to the smallest
numeral, said the large number, and added by counting the counters.
While students were applying the methods to respective sets of problems, daily
probe data was gathered on each set, as well as on the control set. In the third condition,
12
the most effective method of instruction, as documented by comparing data between
touchpoint method and manipulative method, was applied to this control set.
Participants
Six primary students, identified by the school district as having disabilities under
the Individuals with Disabilities Education Act, participated. All students and were
receiving resource assistance in math, After parents were notified and permission was
granted, they were asked to resist from tutoring their children in math. Student
prerequisite skills included rote counting to 18, one-to-one correspondence to 18, fine
motor skills to touch each point, write numerals to 18, and stable school attendance.
Several students received free or reduced school lunch, which is one measure of
socioeconomic status. With the exception of one student, intelligence was defined as the
full-scale intelligence quotient determined by the Wechsler Intelligence Scale for
Children, third edition (WISC-III). The sixth student (Michael) had been assessed at age
4 on the Battelle Developmental Inventory, and was diagnosed a having a developmental
delay disability. Five of the students had behavior goals written in the Individualized
Education Plan (IEP). Following directions, stay in assigned area, and stay on task were
some of the objectives.
Special education diagnostic label (SE Label) and specific academic achievement
were determined by results of an evaluation completed by the school psychologist for
each student’s initial placement or re-evaluation by his IEP team. Each student also had
academic delays in other areas. Placement level and hours of special education services
were determined by committee, which developed individual education plans. Each
student participated in the regular classroom except for the resource time listed. Table 1

13
summarizes the students’ characteristics.

14
Leve
l of
Spec
ial
Educ
atio
n Pl
acem
ent
R
esou
rce
R
esou
rce
R
esou
rce
R
esou
rce
R
esou
rce
R
esou
rce
mild
de
lay
mild
de
lay
mild
de
lay
mild
de
lay
mild
de
lay
mild
/ m
oder
ate
dela
y
Tabl
e 1.
Des
crip
tion
of st
uden
ts
SE L
abel
mild
men
tal
disa
bilit
y
lear
ning
di
sabi
lity
ot
her h
ealth
im
paire
d
lear
ning
di
sabi
lity
de
velo
pmen
tal
dela
y m
ild m
enta
l di
sabi
lity
Elig
ible
fo
r fre
e or
re
duce
d lu
nch no
yes no
yes no
yes
Spec
ific
Aca
dem
ic
Ach
ieve
men
t in
Mat
h G
rade
Le
vel
1 1 1 1 1 1
Dai
ly T
ime
in S
peci
al
Educ
atio
n Pl
acem
ent
2.
5 hr
s
1.5
hrs
2 hr
s 1
hr
1
hr
2
hrs
Beh
avio
r G
oals
on
IEP no
yes
yes
yes
yes
yes
Nam
e K
eith
D
oug
Rye
R
icha
rd
Mic
hael
Ti
m
Gen
der
M M M M M M
Age
6 6 6 6 6 6
Ethn
icity
Ang
lo
A
nglo
Ang
lo
A
nglo
Bi-r
acia
l
Ang
lo
IQ 61 83 81 98 n/
a 69

15
The researcher was an elementary special education teacher with thirteen years
experience teaching children with disabilities. She also had many years of experience
teaching addition using Touch Math procedures and manipulatives. The researcher was
completing the final requirements for a Master’s degree in Emotional and Behavioral
Disabilities. The researcher implemented daily lessons, collected student data, and
summarized the information outlined in this study.
Two staff members participated as data collectors. One was a certified special
education teacher with 9 years experience working with students with disabilities. The
second person assisting was the instructional assistant for special education. She was
completing the final requirements for an undergraduate degree in special education.
These staff members documented the reliability of instruction and student responses.
Setting
All students attended public elementary school in a small county the Southeast with
a population of 27,612. The school had a population of 620 students preschool through
fifth grade.
Instruction occurred in a small group setting in the resource room. Students sat
around the semi-circle of a kidney-shaped table as the instructor sat in the cutout section.
Instruction and probe sessions were implemented in a group setting with the six
participants.
Materials
Instruction via one set of addition problems dedicated to one of 3 procedures, was
implemented daily at the same time of day. The set to be implemented each day was
determined by random drawing. A piece of paper with one set of problems was placed in
16
a container. A paper was drawn out and that set was written on the calendar. When all
three pieces of paper were drawn, all went back into the container to be drawn again. This
continued until three months of implementation was scheduled.
There were three different probe worksheets for each set. These were used
consecutively. Each session lasted 15-20 minutes. During daily probe sessions, students
were seated separately throughout the room to complete the worksheet independently.
Appendix B lists the addition problems in each set. No numeral appeared in more
than one set. Appendixes C, D, and E present one sample worksheet for each set. These
were used for probe assessments, which included the control set. The math problems for
each probe assessment were randomized to attempt to reduce the threat to internal
validity of a child memorizing the test. For baseline conditions, the probe worksheets
were used.
Individual addition problems for student use during the instructional sessions were
written on 2 in. by 11 in. strips of paper with six replications of one addition problem.
Each addition problem was on a separate strip of paper. The font style was Primary One
with a point size of 36. During the TouchMath phase, two strips of problems were
available—one with touchpoints and one without. Manipulatives (one inch round colored
counters) were used for the problems in Set B.
A stopwatch/timer was used to document all conditions: instructional, probe,
maintenance, and generalization. Established classroom reinforcers were planned for use
during this study and were readily available. These reinforcers included using the “magic
wand” to recognize students on task, granting free play time when academic tasks were
completed early, and competing in the “Good Behavior Game” (Kerr & Nelson, 2002).

17
The students responded positively to the structure and methods introduced. Only Doug
needed to follow the rule for completing the probes, which was that neither touchpoints
nor manipulatives could be used in solving the problems. During two probe sessions for
the control set, Doug was observed using touchpoints when he was not allowed. He
created his own touchpoints for numerals one and four. When reminded not to use
touchpoints, he stopped. No other behavior intervention was needed for any child.
Positive reinforcement was effective.
Data Collection
Three probe worksheets were developed for each method of instruction so students
would not memorize the answers. Each worksheet was labeled A, B, and C. The use of
worksheet A would be repeated only after B and C worksheets and probe worksheets
from the other methods of instruction were used, which occurred approximately every 9
days. Twenty problems were presented on each side of the worksheet for a total of 40
problems. The back was a duplicate of the front. The students gave no indication they
recognized this duplication as no student turned the probe worksheet over for an answer.
Each worksheet had addition problems placed in random order. Of the nine
problems, three were repeated six times, five were repeated four times, and one was
repeated twice. This unequal representation of addition problems is a limitation of this
study.
Nine numerals were sorted into three sets. Each set was paired with a method of
instruction. Numerals nine and one were grouped into Set C. Having the easiest numeral
(one) and the hardest numeral (nine) in the same set potentially interfered with the
equivalency of the three sets. The other two sets are as equivalent as possible using

18
numerals two through eight.
Each of the three sets had nine different addition problems with 20 on each side.
Another way in which the facts were controlled was two sets had nine single digit
answers and one set had 10 single digit answers. The sums were counterbalanced as two
sets had two addends five or above and two sums below five. Set C had one sum above
five while three were below five. These three sets were functionally independent of one
another, as there was no repetitive use of an addend.
Probe sessions were conducted daily at the beginning of the class prior to
instruction. When signaled to begin, the group of students had one minute to answer as
many problems as possible. The number of digits correct in this one-minute timing
determined the rate correct. The number of correct digits written per minute was recorded
for comparison (Mercer, 1997). Data also were collected on students’ correct use of
touchpoints. The only responses possible were correct, incorrect or no response. The
social validity of each method was assessed via student interviews.
Procedures
General procedures
The researcher implemented both methods of instruction, control set, and all
probe sessions to reduce threats to internal validity due to instrumentation. Simple
addition was taught using two methods: TouchMath and manipulatives.
Baseline. Baseline data consisted of one 1-minute probes for each instructional
method and the control set. Worksheets for daily probes were used to collect baseline
data. Students were reminded to not use tally marks or their fingers. Prior to baseline,
each student’s fine motor skills were assessed to determine the rate of numerals per
19
minute a student could write. Students wrote numerals zero to nine as many times as
possible in one minute. Their rates ranged from 44 to 64 numerals per minute.
Intervention. During instruction, one method of instruction was implemented daily.
The instructional methods and the control set were rotated through sessions in random
order to reduce possible multiple treatment interference. When the probe was addition
with touchpoints, the day’s instruction was on addition with touchpoints. When the probe
was addition with manipulatives, the instruction was addition with manipulatives. When
the probe was the control set, the day’s lesson was a review of math skills not related to
this study. This review included creating patterns, counting money, identifying fractions,
skip counting, and orally solving story problems. The time allowed for his review day
was equivalent to that for each other method.
Each session began with a timed probe session. When needed, the instructional
sessions began with a simple finger play used to quiet the group. This finger play was
adapted from one recommended by Jean Feldman (1995). If a student failed to participate
in any activity, the regular classroom discipline procedure was implemented (see
Appendix F for classroom discipline procedure). The discipline procedures were based
upon methods from Harry Wong’s (Wong & Wong, 1998) First Days of School and Tim
Phelan’s (1995) 1-2-3 Magic: Effective Discipline for Children 2-12. No discipline
intervention was needed. All students participated willingly and responded positively to
the structure and methods introduced. Other than reminding Doug to not use his inventive
touchpoints for the control set, no behavior problems occurred.
Probe sessions. Probe sessions for addition with touchpoints (Set A) and addition
with manipulatives (Set B) occurred prior to instruction (see Appendix G for the

20
reliability of student response data collection form used for baseline and probe sessions).
Probe sessions occurred daily after the first instructional session. The probe worksheets
consisted of addition problems in the individual sets. The problems on the worksheet
were randomized. In order to document the correct number of digits per minute, each
probe session was one minute in duration.
General Procedures for Touchpoints
Touchpoint acquisition. The researcher guided the students using an
antecedent/prompt/test method (Wolery et al., 1992) to teach the position of the
touchpoints. Instruction for teaching touchpoints was described in Bullock’s (1998)
TouchMath First Grade Counting Kit Guide. This instruction time was documented. The
numerals, which were introduced with touchpoints, were two, five, and eight (see
Appendix A for a description of the touchpoints for all numerals).
The researcher displayed the numeral two with touchpoints and modeled the proper
method for touching and counting the touchpoints. The students then imitated the correct
method using number two with touchpoints. Next the researcher demonstrated the same
method but the numeral did not have the touchpoints printed on it. Criterion for mastery
was for the student to use the correct method of counting with touchpoints even though
the numeral did not have printed touchpoints. Each numeral was taught to a mastery
criterion of 100% accuracy on 5 consecutive trials prior to the introduction of the next
numeral. Also, all students were required to meet criterion for mastery before a new
numeral was introduced to the group. Students continued to practice touching the correct
pattern until all had met criterion. A maximum of two numerals were taught in each
session. Any student who did not reach criterion received tutoring at a time other than
21
during established sessions. Keith was the only student needing extra time. He required 1
additional minute to master touchpoints for numeral five. When touchpoints were used
with the control set, he needed 1 additional minute to master numeral nine. When the
students met criterion for the three numerals, instruction on addition with touchpoints
began (see Appendix H for data sheet).
Intervention: TouchMath strategy 1. Bullock (1998) encouraged teaching students
TouchMath addition in a progressive sequence. Therefore, addition began with numerals
two and five and followed the sequence outlined in each set. The method for teaching
TouchMath addition followed the guidelines in the kit (Bullock, 1998) and used an
antecedent, prompt, and test model (see Appendix I for a sample lesson plan.) Instruction
with touchpoints on the numerals continued until all students demonstrated 100%
accuracy (counting the touchpoints correctly for 3 consecutive trials). Then the students
practiced adding the same problems, touching their fingers on the appropriate points even
though the touchpoints were not marked on the numerals. Mastery was defined as adding
the problem correctly for three consecutive trials. After all students mastered one
problem, the next problem was introduced. A maximum of two addition problems could
be introduced in one session. If any student performed below 60% accuracy on the probe
session, touchpoint addition for those problems was retaught. Instructional time was
documented. Keith required 4 additional minutes learning the fact 2+5, 4 additional
minutes to master 5+2, and 2 additional minutes learning 2+8 for a total of 10 minutes.
He did not need extra time for the other six addition problems. Keith’s additional tutoring
sessions occurred when other students had a few minutes free time (which they spent
quietly reading a book or practicing math problems) during math class or after they had

22
left the resource room. This tutoring was accomplished in two sessions. After all students
mastered all addition problems, the second strategy was implemented.
Strategy 2. The second strategy was a faster method of adding in TouchMath.
This step taught the students to use touchpoints in a more efficient manner. Students were
taught to say the largest number and add on using touchpoints. For example, if the
addition problem was 8+5, students were taught to start with eight and count up while
using touchpoints on numeral five: Say 8, and count on 9,10,11, 12, 13.
General Procedures for Manipulatives
Intervention: manipulatives strategy 1. An antecedent, prompt, and test strategy
was used to teach students how to use three-dimensional manipulatives in solving
addition problems. The students already had the prerequisite skill of one-to-one
correspondence. Students gathered the appropriate number of single colored counters to
match one number, gathered another colored counter for the second number, combined
(added) the manipulatives, and determined the answer. For example, if the problem was
3+6, the student counted three red counters, six blue counters and combined them for the
answer (Fennell, Ferrini-Mundy, Ginsburg, Greenes, Murphy, & Tate, 1998). A sample
lesson plan is provided in Appendix J. Mastery was defined as adding the problem
correctly for three consecutive trials. After all students mastered one problem, the next
problem was introduced. A maximum of two addition problems could be introduced in
one session. When all students met criterion, the manipulatives were removed and the
students practiced the same problems. Following directions from the teacher’s manual
The Path to Math Success, the researcher encouraged them to draw a picture (circles) to
represent the numeral (Fennell et al., 1998). They were not allowed to count on their

23
fingers, make tally marks, or use any other technique. Although tally marks are a semi-
concrete level of math similar to drawing circles, this study only encouraged drawing
circles as recommended by the teacher’s manual. When all students completed the
problem correctly on three consecutive trials, another addition problem was taught. Keith
required 4 addition minutes to master 3+6, and 3 more minutes to learn 6+3 for 7 extra
minutes. Tutoring occurred during math class when the other students had a few minutes
of free time or after they left the resource classroom. Keith did not need any extra time
for the other seven addition problems. After all students mastered all addition problems,
the second strategy was implemented.
Strategy 2. The second strategy is a faster method of adding with manipulatives.
The students were taught to add using manipulatives using a shortcut as outlined in the
teacher’s manual The Path to Math Success. For example, if the problem was 6+3, the
student put three manipulatives beside the numeral three. The students said the numeral
six and counted up as they used the manipulatives. The researcher modeled the correct
method by placing manipulatives by the smaller number, saying the largest numeral and
counting the manipulatives of the smaller numeral. Students then demonstrated
understanding by performing the procedure. Any errors were immediately corrected and
students practiced the correct procedure.
As described earlier, probe sessions occurred prior to instruction and consisted of
addition problems limited to Set B. The problems on the worksheets were randomized.
Although no manipulatives, tally marks, or touchpoints were used during one-minute
probe sessions, students could draw circles to help add. No student was observed using
touchpoints or tally marks.

24
General Procedures for Control Set
Daily probes. Probes for the control set consisted of one-minute sessions. The
students were reminded to not use fingers, tally marks, or touchpoints. No instruction on
addition occurred. The students received instruction on math concepts unrelated to this
study. One student, Doug, attempted using touchpoints on two occasions—probe 31 and
33. He stopped when directed; however, this may have increased his number of digits
correct for those sessions.
Touchpoints and Set C. Data collected during probes for Set A and Set B
demonstrated that a higher rate of correct numerals per minute occurred when one
method of teaching addition was used. That method was implemented with Control Set C
addition problems.
The plans for maintenance and generalization are noted but were not implemented
because the school year ended. The intervention strategies continued to the last week of
school.
Experimental Design
An adapted alternating treatment design (Sindelar, Rosenberg, & Wilson, 1985)
was used to assess the efficiency of the two instructional procedures. Comparisons were
made across strategies (touchpoints and manipulatives) and participants. A control set
was added to the procedures to strengthen experimental control. Similarities across
instructional procedures, sets of addition problems, reinforcement and discipline
procedures, as well as randomized worksheets and counterbalanced times for
instructional sessions were used in this study to reduce the threats to internal validity
which can occur with this type of design.

25
Reliability
Reliability observers were a special education teacher and one special education
instructional assistant. Previously, the school psychologist trained both in making
behavioral and educational observations. In addition, the special education teacher had
received training in collecting reliability data from her university studies. The observers
were instructed how to collect reliability data specific to this study.
The point-by-point method of reliability (number of agreements divided by the
number of agreements plus disagreements multiplied by 100) was used to assess the
student responses on worksheets during probe and baseline sessions (see Appendix G)
(Tawney & Gast, 1984).
In order to compare the efficiency of two methods of addition, the researcher
needed to follow the previously described plan with a high degree of accuracy. This plan
was determined by conducting a task analysis of teaching the skill of addition for each
method. This study checked for instrumentation effects by completing dependent and
independent reliability 20% of the time and at least once per condition. Procedural
reliability, which assessed the accuracy with which procedures during an intervention
strategy were followed, was determined by the number of teacher behaviors observed for
each instructional method (see Appendix K). The number of teacher behaviors observed
was divided by the number of planned teacher behaviors multiplied by 100 (Billingsly,
White, & Munson, 1980). One procedural reliability observation occurred during
touchpoint acquisition instruction, with a 100% agreement. Procedural reliability data
were collected on three occasions while teaching addition using touchpoints. The
observations occurred once during Strategy 1, once during Strategy 2, and once during a

26
probe session using the control set. On each occasion, reliability was 100%. Procedural
reliability was assessed twice for teaching addition with manipulatives--once each during
Strategies 1 and 2. Procedural reliability for teaching addition with manipulatives was
100% accuracy. Seven observations occurred during probe sessions for an average
accuracy of 97%.
Social Validity
Wolf (1978) suggested social validity be determined on three levels. The first is
determining whether intervention goals are socially important. Students must master
basic addition in order to be successful in higher-level math computation. Thus, all
kindergarten, first and second grade students must learn addition as outlined in the
curriculum document as well as Kentucky’s Learning Goals and Academic Expectations
1.5-1.9 (http://www.kde.state.ky.us/oapd/curric/Publications/Transformations/
acadexp.html).
Wolf’s (1978) second level of social validity involves determining the social
appropriateness of the procedures. Students use simple addition daily as a functional life
skill. Also, Kentucky’s Core Content for Mathematics Assessment (MA-E-1.2.2) stated
students must “add . . . whole numbers using a variety of methods”
(http://www.kde.state.ky.us/oapd/curric/corecontent/mathematics_cc_30.asp).
The third level of social validity asked if the participants were satisfied with the
results (Wolf, 1978). At the end of the study, the students were given a survey that asked
which method, if any, they preferred to use while adding numbers.

27
Chapter Four: Data Analysis
Effectiveness of Touchpoints vs. Manipulatives
Doug. When Doug counted touchpoints on both numbers to add (Strategy 1; see
Figure 1), his rate correct per minute showed a decreasing trend. In 5 probes, his correct
rate per minute ranged from a high of 17 to a low of 10. As the increasing trend in
Strategy 2 demonstrates, when Doug said the largest number and touched the touchpoints
on the smaller number as he counted forward, there was a dramatic improvement. His
correct rate per minute increased from 10 in the last probe using Strategy 1 to 19 digits
correct when Doug used Strategy 2. Using Strategy 2, his digits correct per minute
increased to a high of 33 on the 25th probe. As illustrated in Figure 1, the data paths for
touchpoints, manipulatives, and the control set separated when Strategy 2 was
implemented. Although the number of digits correct per minute was lower on probe 35
than on probe 32, the trend line was ascending. Doug’s average number of digits correct
increased in each strategy from 14.5 in the first strategy to 28 in the second strategy and
to 33.3 when touchpoints were added to the control set.
When Doug used manipulatives, his rate correct showed a slight ascending trend
for the first strategy (using manipulatives for both numerals). His rate of digits correct per
minute ranged from 9 to 20. During Strategy 2, the trend line of his performance was
slightly ascending but his rate was lower than with touchpoints. Doug’s average during
the second strategy was 15 digits correct in one minute.
Even though no instruction occurred, Doug’s rate correct on the control set
significantly improved. The significant increase in correct digits per minute for the
control set may have been influenced by his self-taught touchpoint strategy, or by his

28
increased speed in completing the worksheet. The increase also may have been due to the
fact that numeral 1 is in that set. Analyses of Doug’s probe worksheets showed he
completed more problems with an addend of one. During the second condition
(Condition B), Doug was able to complete all probe worksheets with numeral one as an
addend. On worksheets prior to that, Doug was unable to solve all the addition problems
with an addend of one. Doug’s rate correct remained stable during Strategy 1 at 14 digits
per minute. During Strategy 2, he steadily increased from a low of 11 to a high of 26.
During probe 31 and 33, Doug was observed attempting to use touchpoints. Doug
commented that he knew where the touchpoints were for numerals one, three, and four
without the teacher showing him. Later in the study, when Doug was taught the
touchpoints for numerals one and four for Condition C, he commented that he already
knew them.
As Figure 1 shows, when using Strategy 1, there were no differences in Doug’s
rate correct for touchpoints, manipulatives, or the control set. However, when Strategy 2
was introduced, Doug’s level of performance was substantially better using touchpoints.
A significant separation of correct digits per minute occurred with Strategy 2, favoring
touchpoints. In Condition C, touchpoints were taught for the numerals 1,4,5,and 9 (Set C
numerals). A significant increase of the average number of correct digits increased from
21 to 33. The average of correct digits per minute was higher for any addition problem
with which Doug used touchpoints.

29
Figure 1. Doug’s Probe Data

30
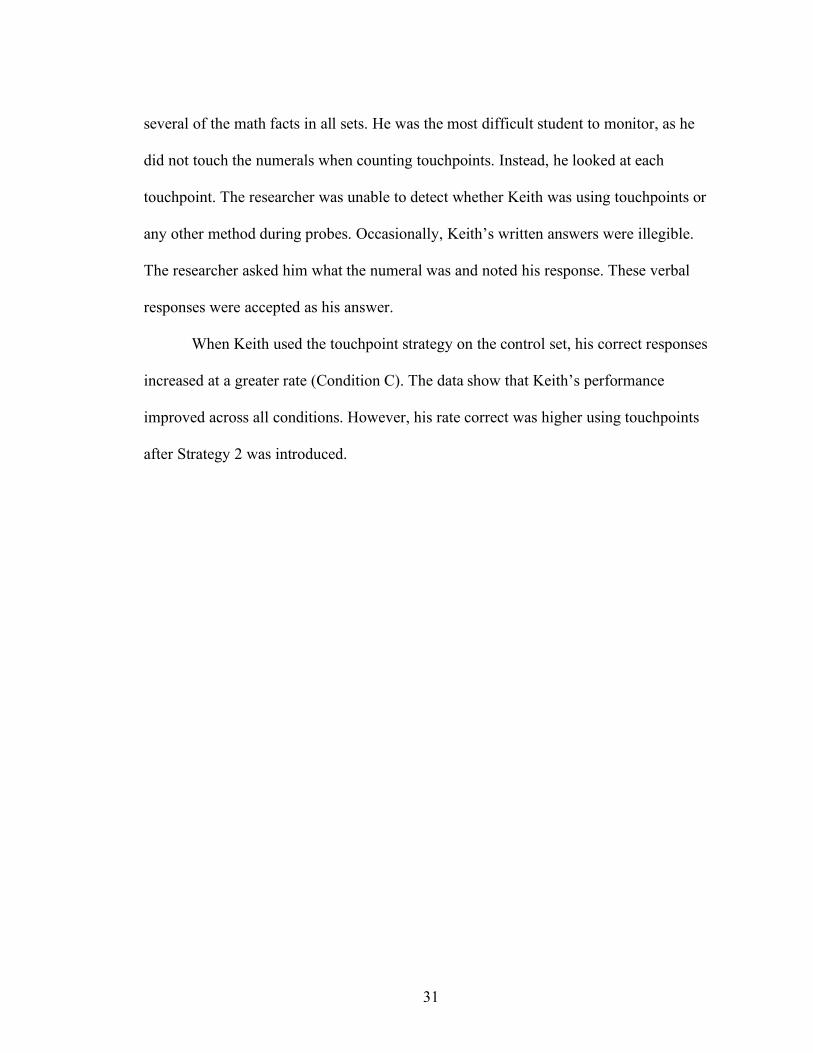
Keith. Similar to the trend in Doug’s data, the data representing Keith’s
performance when adding with touchpoints showed a descending trend (see Figure 2).
This trend reversed direction when the second strategy of adding more efficiently was
implemented. The data for adding with touchpoints separated on probe 25 when Keith’s
number of digits correct increased from 17 to 26. Moreover, when using this strategy,
Keith’s lowest number of correct digits per minute was 13 on probe 20 and his highest
was 43 on probe 35. Keith had the greatest success using the touchpoints the fast way
(Strategy 2) than with any other method. In probes for Set A (touchpoint strategy), he
occasionally skipped the fact 8+5 and 5+8. His average number of correct digits
increased in each condition: baseline was 4; Strategy 1 was 9.67; the second strategy was
29.8; and when using touchpoints on the control set, it was 32.67.
This graph also shows an ascending trend during the second condition when
adding with manipulatives. However, Keith’s rate correct was greater when adding with
touchpoints the fast way (Strategy 2) than adding with manipulatives. The data for adding
with touchpoints and adding with manipulatives did not overlap. Keith’s average digits
correct in the second strategy using touchpoints was 29.8 compared to 24.4 for
manipulatives. During probes, Keith skipped addition facts when he did not immediately
know the answer.
In the second condition, Keith’s rate correct on the control set increased, even
though no instruction occurred. He did not skip any facts. During Condition C when
Keith used touchpoints with the control set, his rate correct increased from 24 digits
correct per minute to 33 digits correct.
Anecdotal notes taken during probe sessions revealed that Keith memorized
31
several of the math facts in all sets. He was the most difficult student to monitor, as he
did not touch the numerals when counting touchpoints. Instead, he looked at each
touchpoint. The researcher was unable to detect whether Keith was using touchpoints or
any other method during probes. Occasionally, Keith’s written answers were illegible.
The researcher asked him what the numeral was and noted his response. These verbal
responses were accepted as his answer.
When Keith used the touchpoint strategy on the control set, his correct responses
increased at a greater rate (Condition C). The data show that Keith’s performance
improved across all conditions. However, his rate correct was higher using touchpoints
after Strategy 2 was introduced.

32
Figure 2. Keith’s Probe Data

33
Richard. The probe data in Figure 3 demonstrates the difficulty of determining
which method of teaching simple addition worked best for Richard. During the first
intervention strategy, his rate of correct responses using touchpoints and manipulatives
decreased slightly, while his rate increased on the control set (Set C). His data for the
control set did not overlap the other data during Strategy 1; it was consistently higher.
Richard’s rate of correct digits per minute improved during the second strategy for both
methods of instruction and the control set. His rate correct for touchpoints and
manipulatives ran parallel; however, when using Strategy 2 with touchpoints, Richard’s
rate of correct digits per minute was slightly higher than with manipulatives. This data for
touchpoints separated and remained higher than any other method. During Strategy 2,
Richard’s lowest number of correct digits per minute was 16 on probe 20 while the
highest was 28.
The only notable increase occurred when Richard used touchpoints on the control
set during Condition C. His number of digits correct increased from 24 to 31 when he
added with touchpoints. When Richard used touchpoints for the numerals in the control
set, his rate of correct digits per minute increased from an average of 23 per minute to 32.
After learning to add the fast way (Strategy 2) with both strategies, Richard’s average of
correct digits per minute was higher for any addition problem when he used touchpoints.
Richard’s progress may have been affected by a one-week absence due to illness.

34
Figure 3. Richard’s Probe Data

35
Michael. During the first intervention strategy, Michael’s rate of correct digits per
minute showed a descending trend when he added numbers with touchpoints. This
reversed dramatically during the second strategy when he added touchpoints the fast way.
His rate increased from a low of 10 digits correct per minute to a high of 41 digits correct
per minute within four trials. Michael’s range of correct digits per minute went from a
low of 4 on probe 12 (Strategy 1) to a high of 47 on probe 41 (control set).
With the control set, Michael’s rate of correct digits was greater than with either
touchpoints or manipulatives until he learned to add with touchpoints the fast way
(Strategy 2). His rate of correct numerals per minute increased when adding touchpoints
the fast way and the data separated on probe 28. His average number of correct digits
increased from 10.6 during Strategy 1 to 30 with Strategy 2. Similarly, Michael’s rate
correct significantly increased with the control set after touchpoints were implemented,
from 29.8 to 42.3 correct digits per minute.
When Michael added using manipulatives, his average correct digits decreased
from Baseline (13 correct digits) to Strategy 1 (10 correct digits). He returned to the
baseline average of 13 correct digits per minute when adding the fast way (Strategy 2).
When he used touchpoints with problems in the control set during Condition C,
his average increased significantly from 30 correct digits per minute to 43 correct digits
per minute. Michael’s average of correct digits increased when he used touchpoints the
fast way with any set of addition problems.

36
Figure 4. Michael’s Probe Data

37
Rye. As shown in Figure 5, during the first strategy, Rye’s data for all methods of
instruction overlapped. When Rye added with touchpoints, his data showed an increasing
trend during Strategy 1. His lowest rate of digits correct per minute was 6 and his highest
was 15. This trend continued at a greater rate when he added the fast way during Strategy
2. His performance ranged from 8 digits correct on probe 23 to 31 digits correct on probe
35. Rye’s data for adding with touchpoints separated from the data on other probe sets on
probe 25. His average number of correct digits increased from a baseline of 7 to 11.5
during Strategy 1and 20.6 while adding the fast way in Strategy 2.
When using manipulatives, Rye’s average correct rate increased from baseline to
Strategy 1 but the trend line was descending. The trend line continued to decrease during
Strategy 2 but at a slower rate than in the first strategy. His data range from a low of 3 to
a high of 18. This data was not stable as it increased 10 digits between probes 21 and 24
then decreased 12 digits between probes 29 and 34.
Rye’s rate of digits correct per minute for the control set remained stable
throughout Strategy 1 and Strategy 2. The lowest rate was 4 digits correct to a high of 8
digits correct. His rate correct for addition problems increased when the touchpoint
method was introduced during Condition C, from 15 digits from 8 on probe 36 to 23
correct on probe 38. His rate of digits correct continued to increase with 29 digits and 33
digits on the last two probes.

38
Figure 5. Rye’s Probe Data

39
Tim. During Strategy 1, Tim’s data for both methods of instruction and the control
set overlapped during between probes 4 and 14. The data for adding with touchpoints
increased and separated on probe15 with an increase of 13 digits, from 2 to 15 digits
correct per minute.
Tim’s correct rate of digits per minute clearly increased when he added using
touchpoints. The researcher once had to remind Tim to use touchpoints during the probes.
As shown in Figure 6, his average number of correct digits increased steadily from 2 to
9.5 to 16 when adding with touchpoints during Strategy 1. Although his rate was lower
during two probe sessions, he continued to improve with the second strategy. Tim’s range
of correct digits per minute ranged from a low of 10 to a high of 20 during Strategy 2.
Meanwhile, Tim’s average rate correct for adding with manipulatives remained stable
and low (1.6, 3 respectively) throughout Strategy 1 and 2.
On the problems in the control set, Tim’s average number of correct digits was
consistently low during baseline and intervention until touchpoints were used in
Condition C. Tim’s range was a low of 1 to a high of 5 during both strategies. When
touchpoints were used with the addition problems in the control set, his rate correct
increased from 4 to 20 digits. Tim was absent two days and missed instruction and probe
sessions 18 and 22. No remediation occurred and no probes were administered for these
days.

40
Figure 6. Tim’s Probe Data

41
Efficiency of Touchpoints vs. Manipulatives
Table 2 shows the number of minutes each student needed to learn touchpoints
placement to criterion. Keith required 2 minutes more than his peers to memorize
touchpoint placement. He needed 1 additional minute each to master touchpoints on
numeral 5 and 9. Instructional minutes required for the students to learn how to use
manipulatives were minimal, as only one demonstration was needed.
Table 3 and Table 4 display individual times each student needed to meet
criterion for each addition problem for touchpoints and manipulatives, respectively. Keith
required more training time to reach mastery using both methods. He required 10 minutes
more to master touchpoints and 7 minutes more for manipulatives. During the touchpoint
method, he required 4 additional minutes to master 2+5, an additional 3 minutes to
master 5+2, and 2 additional minutes for 2+8. When mastering manipulatives, Keith
needed 4 additional minutes to learn 3+6, and 3 minutes for 6+3. Keith required
additional minutes for the first 3 problems using touchpoints and the first 2 problems
using manipulatives. The other students required the same amount of time to master
adding with touchpoints (52 minutes) and for adding with manipulatives (58 minutes).
On average, 53.7 minutes was needed to reach mastery for adding all problems using
touchpoints while 59.2 minutes was required for adding using manipulatives. At first
glance, it seems learning to add using touchpoints is more efficient. However, the time
required to teach touchpoint placement must be added. When these minutes (average
19.4) are added, the total time for teaching touchpoints is 73.1 minutes compared to total
time of 59.2 minutes for reaching mastery with manipulatives.

42
Table 2. Instructional minutes to criterion learning touchpoints
Name 2 5 8 subtotal 1 4 9 subtotal Total
Keith 3 5 4 12 2 2 5 9 21
Doug 3 4 4 11 2 2 4 8 19
Rye 3 4 4 11 2 2 4 8 19
Richard 3 4 4 11 2 2 4 8 19
Michael 3 4 4 11 2 2 4 8 19
Tim 3 4 4 11 2 2 4 8 19
Average time: 3 4.2 4 11.2 2 2 4.2 8.2 19.4
Table 3. Instructional minutes to criterion using TouchMath
Name 2+5 5+2 2+8 8+2 5+8 8+5 2+2 5+5 8+8 Total
Keith 12 11 9 6 5 5 4 4 6 62
Doug 8 7 7 6 5 5 4 4 6 52
Rye 8 7 7 6 5 5 4 4 6 52
Richard 8 7 7 6 5 5 4 4 6 52
Michael 8 7 7 6 5 5 4 4 6 52
Tim 8 7 7 6 5 5 4 4 6 52
Average time: 8.7 7.7 7.3 6 5 5 4 4 6 53.7

43
Table 4. Instructional minutes to criterion using manipulatives
Name 3+66+33+77+36+77+63+36+67+7 Total
Keith 12 10 7 7 6 6 5 6 6 65
Doug 8 7 7 7 6 6 5 6 6 58
Rye 8 7 7 7 6 6 5 6 6 58
Richard 8 7 7 7 6 6 5 6 6 58
Michael 8 7 7 7 6 6 5 6 6 58
Tim 8 7 7 7 6 6 5 6 6 58
Average time:8.7 7.5 7 7 6 6 5 6 6 59.2
Student Preference for Touchpoints vs. Manipulatives
Table 5 displays the results of the student survey regarding which method, if any,
they preferred. A student survey worksheet (see Appendix L) was completed. Each
student circled the method, touchpoints or manipulatives, he preferred.
As they handed in the worksheet, each student was asked to explain his decision.
Keith chose touchpoints and commented, “It does it faster.” Rye made the same comment
about touchpoints while Doug stated, “It makes me go faster.” Richard explained that
touchpoints “are easier.” Michael did not have a comment about why he picked
touchpoints.
Tim was the only student who chose manipulatives, although his data showed that
he performed better using touchpoints. When he was asked to explain his choice, Tim
said he liked touchpoints. While trying to clarify Tim’s choice, the researcher
demonstrated each method and asked if Tim liked adding with manipulatives or

44
touchpoints. Tim answered touchpoints. Later, the researcher again asked touchpoints or
manipulatives. Tim replied manipulatives. It seemed Tim answered by repeating the last
choice the researcher gave. This data on Table 5 reflects Tim’s original answer on the
survey although his actions show he continued to use touchpoints
Table 5. Student survey. Which method, if any, is preferred?
Name Touchpoints Manipulatives
Keith yes
Doug yes
Rye yes
Richard yes
Michael yes
Tim yes
Total: 5 1

45
Chapter Five: Discussion
The first question addressed by this research was which is more effective,
TouchMath or manipulatives in teaching basic addition facts to students with learning
disabilities. Each student’s average number of digits correct per minute was greater when
using touchpoints than when using manipulatives. Comparing the rate of correct digits
between manipulatives and touchpoints, the difference ranged from a minimum of five
(Richard: 24 digits with touchpoints; 19 digits with manipulatives) to a maximum of
seventeen (Michael: 30 digits with touchpoints; 13 digits with manipulatives). When
comparing trends of the individual student data, there were greater increasing trends with
addition using touchpoints than addition with manipulatives. This improvement using
touchpoints was evident during the second intervention strategy--adding the fast way, as
well as during Condition C--teaching touchpoints for numerals in the control set. There
was one exception. Comparison of Richard’s data between addition with touchpoints and
manipulatives showed similar trend lines during the second intervention strategy.
However, Richard’s average correct digits per minute showed he performed at a higher
rate using touchpoints.
Five of the six students had behavior goals on their Individual Education Programs.
The only difference noted in the data between Keith, who did not have behavior goals,
and the other students, is that Keith required more instructional time to master
touchpoints, adding with touchpoints, and adding with manipulatives. Anecdotal notes
show all students were on task and required no behavioral intervention. All students
increased their fluency rate in simple addition.
The second question asked was which method was more time efficient in teaching

46
basic addition facts to students with learning disabilities. The average time for a student
to acquire touchpoint placement and adding each math fact in Set A with touchpoints was
73.1 minutes. The average time for a student to add each math fact in Set B using
manipulatives was 59.2 minutes. Learning to add using manipulatives was 13.9 minutes
faster on average than learning touchpoints for three numerals and adding using
touchpoints. However, when comparing just adding and eliminating the time to master
touchpoint placement, it was quicker to add with touchpoints (53.7 minutes) than with
manipulatives (59.2). This difference may be due to the time required to move three-
dimensional manipulatives into place. For a total comparison, adding with manipulatives
had an initial advantage over adding with touchpoints. However, this advantage may be
lost over time.
The third research question addressed student’s opinions regarding both
instructional procedures. When the students were asked which method, if any, they
preferred, 5 of 6 chose adding with touchpoints. Tim was the only student who said he
preferred using manipulatives when he added. Although Tim’s performance demonstrates
he has a much higher rate of accuracy using touchpoints and he verbally changed his
preference of method, Tim’s original answer is indicated on Table 5. After the students
learned the touchpoints for Set A, a few continued to ask for the touchpoints for numerals
in the other sets. When they were not provided, one student created his own touchpoints
for the numerals. After completing the survey, each student was asked why he preferred a
particular method. All students selecting touchpoints said in some manner that is was
faster and easier.
Of the three research questions, the results favored adding simple equations using

47
the TouchMath method was preferred on two. Using the TouchMath method resulted in a
higher rate of correct digits per minute and was more preferred than adding with
manipulatives. Adding with manipulatives was a few minutes faster than learning to add
with touchpoints. This advantage may be lost as students gain fluency, because time is no
longer required to teach the placement of touchpoints on numerals.
Limitations
Several limitations of this study may have affected the results. First, the control set
was not equivalent to the other two sets due to numerals one and nine being in that set.
These were the easiest and hardest numbers to add; therefore, they should not have been
in the same set. Another limitation was the unequal number of unique facts in each probe
worksheet. In probe worksheet A, 2+5 was presented two times. The following problems
were listed six times: 5+2, 2+8, and 5+8. These problems were listed four times: 8+2,
8+5, 2+2, 5+5, and 8+8. Other probes for the different sets had a similar pattern. The
back of the probe worksheets was a duplicate of the front. This compounded the problem
of unequal representation of each fact. Although students did not indicate that they were
aware of the duplication, it was possible that they memorized the order of some answers.
Another problem created by using only three numerals in each set was the limited
variety of answers. For example, the only answers for set A were 7, 10, 13, 4, and 16.
Again, the students did not seem to be aware of this pattern, as they used other answers to
solve the math problems, but it could have contributed to memorizing the sums. Another
limitation of the study was implementing Strategy 2 following the exact directions in the
teacher’s manual. The method the manual recommends to increase fluency is to place
manipulatives or draw circles beside the smaller number. In order to be more consistent
48
with Strategy 2 touchpoint method, drawing only circles should have been used. Drawing
circles and using touchpoints would be consistent semi-concrete level as described by
Mercer (1997) while using three-dimensional counters is a concrete level.
Another limitation of this study was the failure to document the time students
spent learning to add with manipulatives. While time required to master touchpoint
acquisition was documented, the time required to master how manipulatives were used to
add was not. The time was minimal but documentation was needed for comparison.
Finally, although the results of this study support TouchMath as an effective and
student preferred method of adding. However because the school year ended, this study
does not provide generalization and maintenance data to support its use over time and
across settings.
Implications for Future Research
This study is one small step toward building the external validity (Birnbrauer,
1981) of the TouchMath method of teaching addition. While touchpoints were better than
manipulatives for developing single digit math fluency, it may not generalize to other
operations or to higher-level addition skills. This study does not support using only
touchpoints for understanding the function of addition. Previous instruction for these
students included simple addition story problems, which used three-dimensional figures
(sheep, cows, ducks, etc.) to act out the story. In this study, TouchMath was used for
fluency and accuracy, not for number sense in addition. Similar studies should continue
this research to establish data on generalization and maintenance to support the use of
TouchMath across settings and over time. Although this study showed touchpoints were
effective with this group of students with learning and behavior problems, a more
49
thorough investigation is needed to document its effectiveness on students with a variety
of behavioral difficulties. Further research also is needed to establish effectiveness across
students of all ages as well as with various disabilities.
Other products from Innovative Learning Concepts, Inc. use touchpoints for
subtraction, multiplication, and division. Results from this study on addition cannot be
generalized to other operations using touchpoints. I prefer using touchpoints for students
who understand the concept of addition and subtraction but have difficulty memorizing
addition and subtraction facts. I do not use touchpoints with students needing to
memorize multiplication facts. If students are required to memorize, I prefer they
memorize the actual multiplication facts instead of memorizing skip counting in order to
use touchpoints. External validity is needed for the various operations. After external
validity is established for effectiveness with these operations, further research is needed
comparing efficiency between instructional methods (i.e., manipulatives) across students,
skills, and settings.
Following Miller and Mercer’s (1997a) call for professional educators to seek
practices that provide “the best results in the shortest amount of time” (p. 54.), a more
thorough investigation is needed to compare the efficiency of different strategies.
TouchMath should also be compared to other effective strategies to determine which is
more efficient. No study of relative efficiencies would be complete if it only considered
two options, all effective strategies should be compared.

50
Appendix A
Touchpoint Counting Patterns