rims journal of management - m s ramaiah foundation...his doctoral studies to an analysis of mahatma...
TRANSCRIPT

RIMS JOURNAL OF
MANAGEMENT
M S RAMAIAH FOUNDATION
RAMAIAH INSTITUTE OF MANAGEMENT STUDIES
RAMAIAH INSTITUTE OF MANAGEMENT SCIENCES
ISSN 2455 – 1449
Vol.4(I), Jan – June 2019
TRADING PERFORMANCE OF IRON ORE IN WORLDWIDE
Dr. G. Hudson Arul Vethamanikam, Dr. S. Rajamohan
CONSUMER PREFERENCE ON PAYMENT OPTIONS IN ONLINE
SHOPPING
Dr. D.Joel Jebadurai,
DISTINGUISHING THE FACTORS INFLUENCING BRAND
PREFERENCE OF SELECTED MOBILE PHONE IN RURAL AND
SEMI-URBAN AREAS.
Prof. Honey Gupta, Prof. Jawahar Kumar
METRICS OF ORGANIZATIONAL PRACTICES IN HUMAN
RESOURCE MANAGEMENT: SELECTED PERSPECTIVES FROM HR
ANALYTICS
Dr. Indranil Bose
TRANSFORMATIONAL LEADERSHIP – THE NEED OF THE HOUR? Mr. Prasad L , Dr. Noor Firdoos Jahan
MENTORING FOR PROFESSIONALISM
Dr. Radha.R

RIMS Journal of Management Vol.4 (I), Jan-June 2019
Chief Patrons
Dr.M.R.Pattabiram
Founder Trustee
Mrs. Anitha Pattabhiram
Founder Trustee
Editorial Advisory Board
Dr. Radha R, Dr. Y Rajaram
Dean Ex-Dean
RIMS, Bangalore RIMS, Bangalore.
Editor
Dr. M. Swapna,
Associate Professor, RIMS,
Bangalore
RIMS JOURNAL OF MANAGEMENT
RIMS Journal of Management is a bi-annual publication of Ramaiah Institute of
Management Studies / Sciences. The journal is committed to delivering high-quality
research findings and results to the world. All manuscripts are subject to a double
blind peer review by the members of the editorial board. The accountability of the
ideas, information, data and analysis presented by the authors rests on the authors.

RIMS Journal of Management Vol.4 (I), Jan-June 2019
RAMAIAH INSTITUTE OF MANAGEMENT STUDIES / SCIENCES (RIMS)
RAMAIAH INSTITUTE OF MANAGEMENT STUDIES/SCIENCES (RIMS) is an institution of
higher education dedicated to the cause of business education. The institution is a part of the
M S RAMAIAH Foundation, a charitable trust that has the avowed objective of providing
exemplary service in all of its offerings.
Dr M S RAMAIAH, the founder of the MSR Group of institutions, was a pioneer in the
educational sector in South India. A visionary leader who rose from humble beginnings to
being one of the most respected figures in the field of higher education, he saw education as a
noble way to serve society. M S RAMAIAH Institute of Technology was founded in 1962 and is
today considered to be one of the best technology institutions in the country that attracts
students from different parts of the world. Over the years, the legendary founder forayed into
medicine, pharmacy, law, science, arts and dentistry. Today, the group is one of the largest of
its kind in the country, with most of its programs having been given the autonomy to design
and deliver the best because of their excellent track record.
Dr. M R PATTABIRAM, the Managing Trustee of M S RAMAIAH FOUNDATION and
Founding Director of RIMS is a chip off the old block. A deeply spiritual and ethical leader, he
is well-known for his impeccable integrity and the ability to achieve results without cutting
corners. Not surprisingly, besides his many qualifications at the graduate level, he has devoted
his doctoral studies to an analysis of Mahatma Gandhi's ideas and ideals in terms of their
profound relevance to the current world. Ever anxious to look beyond the ordinary and the
local, he had an abiding passion for creating a management institution that would one day be
counted among the best in the world. Thus was born RAMAIAH INSTITUTE OF
MANAGEMENT STUDIES/SCIENCES (RIMS).
Within a short span of time, RIMS has established itself as an innovative B-School with a deep
and uncompromising attitude towards quality as can be gauged from the following:
RIMS was honoured by ABP Mumbai as “BEST INSTITUTE WITH INNOVATION IN
SKILL DEVELOPMENT” under National Education Awards 2018 (9th Edition) on 5th July
2018.
RIMS has been ranked at No.75 out of top 100 B-Schools by Dalal Street Investment
Journal dated Feb 19 – March 4 2018.
The FIRST and ONLY B-School in India to have earned two CHEA (Council for Higher
Education Accreditation, USA) recognized Accreditations for its PGPM and MBA Programs
– the accreditations have been granted with commendations by the Accreditation Council
for Business Schools and Programs (ACBSP), USA and the International Assembly for
Collegiate Business Education (IACBE), USA.
The only B-School to have been awarded the highest STAR AWARD at the National Quality
Education Conference of the American Society for Quality (November 2012) and also the
only B-School in India to have won two Awards of Distinction at the National Quality
Education Conference of the American Society for Quality (2010 and 2011)

RIMS Journal of Management Vol.4 (I), Jan-June 2019
The only B-School in India to have reached the finals of the International Team Excellence
Awards of the American Society for Quality in two successive years – 2011 and 2012. In
2011, RIMS received the Attendee's Choice Award for “Complex Project” and in 2012 for
“Creative Solution / Action”
The youngest B-School in the country to be accorded the highest A++ grading by Business
India, the pioneer in B-School ratings, which has been grading B-Schools since 1982
(October 2011 and November 2012)
The youngest B-School in the country to be ranked by BUSINESS TODAY (October 2012) –
No. 33 in Learning Experience, No. 36 in Future Orientation, and No. 69 Overall.
Ranked No. 70 by MBAUniverse.com (December 2012)
The only B-School in India to have partnered with ASQ India Chapter to conduct
innovative programs on quality in different sectors (IT, Manufacturing, Health Care,
Financial Services, and Pharmaceuticals).
The only B-School to have been featured in two Case Studies of the American Society for
Quality
Our Value Perspectives Are:
Leadership that has a long-term perspective
Respect for the Individual
Service Orientation
Collaboration and Teamwork
Empowerment
Innovation
Accountability
Inclusive Growth and Progress
Global Outlook
Uncompromising Commitment to Quality and Continuous Improvement
Performance Orientation

RIMS Journal of Management Vol.4 (I), Jan-June 2019
VISION
To be a global center of learning to evolve competent human resource asset with
professional skills, ethics and personal values.
MISSION
To provide a “Comprehensive Learning Experience” to develop our students to be
most preferred prospects by the corporate.
To integrate corporate needs and academic inputs.
To enhance the learning experience by building competent professionals
of the millennium in terms of physical fitness, community orientation,
solidarity of living & learning together, interdependence and self-
confidence.
To constantly and consistently upgrade the intellectual capital in terms of
teaching faculty, use of technology in designing, developing and delivering
curricula with value added inputs to students.
To promote research among faculty to enhance the intellectual capital
value.
To train and develop faculty and support staff for improved quality of
service.
QUALITY POLICY
Meet or exceed student expectations relating to
o Assurance of Learning
o Career Development
Meet or exceed expectations of all stakeholders, faculty, staff, recruiters,
parents, promoters, regulators and society.

RIMS Journal of Management Vol.4 (I), Jan-June 2019
Call for Papers
Dear Researcher,
Greetings from RIMS, Bangalore!
RIMS Journal of Management (ISSN 2455-1449) is published by RIMS, Bangalore - a
premier business institute under the M S Ramaiah Foundation and committed to
excellence in academics, research and corporate partnerships. The journal aims to
serve managers, researchers and academicians with emerging principles and practical
inputs across the myriad challenges confronting management discipline.
We welcome insightful articles, case studies, book reviews, interviews and research
papers. Rigorous, detailed and thought-provoking work that establish clear connects on
contemporary issues using empirical findings, in-depth application of theoretical
frameworks or other significant observations in any area of management will be
appreciated.
The journal is peer-reviewed and follows a double blind review process. The manuscript
should be well written and follow the APA style of formatting.
Important dates for authors:
Issue/Date Abstract
(on or before)
Word
Limit for
Abstract
Full Paper
(on or before)
Word Limit
(for Full
Paper)
January-June Issue April 30
500 words
with 6
keywords
June 10
Up to 5000
words (page
limit 10- 15
pages )
Notification of
Approval
May 15 June 20
July-December Issue October 31 December 10
Notification of
Approval
November 15 December 20
We look forward to your valuable contribution.

1 RIMS Journal of Management, Vol.4(I),Jan-July 2019
Trading performance of iron ore in worldwide
Introduction
The Indian Commodity Market has
grown tremendously since the operation
of Commodity Futures Exchanges, both
in terms of volume and value of trade.
Currently, there are five national
exchanges (Multi Commodity Exchange
of India Limited, National Commodity
& Derivatives Exchange Limited,
National Multi-Commodity Exchange of
Dr. G. Hudson Arul Vethamanikam
Assistant Professor, School of Management, CMR University,
Bangalore - 560 043, Cell No: +91 9787969692,
Email Id: [email protected]
Dr. S. Rajamohan
Director cum Senior Professor, Alagappa Institute of Management,
Alagappa University, Karaikudi - 630 004, Cell No: +91 9994590559,
Email: [email protected]
Abstract
The financial markets are involved in the financial instruments such as currency,
bonds, shares, commodity and so on. The investors have been fondness to make their
investment in derivative instruments, especially the commodities are performing well
in the global market. It is owned the high volatility than other markets such as the
share market. The commodity investment depends upon the risk taken in the futures
market and the huge volatility of the market. The risk and volatility are assisting to
earn high returns. There are four national and 21 regional exchanges, which are
trading commodities in India. There are 80 commodities allowed by the Indian
government to trade in the markets. The MCX has merged with SEBI for improving
the protection towards the investors and avoiding the fraud than easily invest the
money in the commodity market without fear. The precious metals of gold, silver and
iron ore has been making an enormous impact on the commodity market. These three
investments have been covered more than fifty percent of the nonagricultural
commodities segment. The investors, mostly preferred and focused to make an
investment in gold, silver and iron ore. Hence it is creating the more vibrant in the
commodity market. The commodity market cannot compete with other market without
precious metals participation. This research article is discussing only overviews of
entire activities in iron ore commodity.
Keywords: Commodity Market, Nonagricultural Commodity, Iron Ore, Trading
Performance, Import & Export activities.
JEL Code: G1, G15, G10.

2 RIMS Journal of Management, Vol.4(I),Jan-July 2019
Trading performance of iron ore in worldwide India Limited, Indian Commodity
Exchange Limited and ACE Derivatives
and Commodity Exchange Limited) and
sixteen commodity specific regional
exchanges. The Indian Commodity
Market allows trading of futures and
spot contracts on commodities. Option
contracts are not available in the Indian
Commodity Market. Multi Commodity
Exchange is the largest national
commodity exchange in India; it began
its operations in November 2003[1]. The
exchange offers many commodities in
the categories of bullion, ferrous metals,
non-ferrous metals, energy, and
agriculture
The commodity derivatives
markets are poised to take a new
trajectory with the revolutionary
changes brought by the regulators and
policy makers through a slew of
measures with an aim to bring liquidity
and depth to the markets thereby
enhancing their efficient functioning in
terms of transparent price discovery
and risk management. Liquidity in
Indian commodity derivatives markets,
after declining steadily during the last
three years, has started recovering in
the first half of 2018-19 consequent to
anumber of initiatives, including the
introduction of options, permitting
participation of the bank-subsidiary
broking firms and category III alternate
investment funds etc.,
As the global economy growth
slows, commodities have come into
sharp spotlight. After rising for the
major part of the previous decade,
commodity prices were in a slacker for
the last four years. Iron is the world's
most commonly used metal - steel, of
which iron ore is the key ingredient,
representing almost 95 percent of all
metal used per year. It is used primarily
in structural engineering applications
and in maritime purposes, automobiles,
and general industrial applications
(machinery)[2].
The total recoverable reserves of
iron ore in India are about 9,602 million
tonnes of hematite and 3,408 million
tonnes of magnetite. Chhattisgarh,
Madhya Pradesh, Karnataka,
Jharkhand, Odisha, Goa, Maharashtra,
Andhra Pradesh, Kerala, Rajasthan and
Tamil Nadu are the principal Indian
producers of iron ore. World
consumption of iron ore grows 10 per
annum on average with the main
consumers being China, Japan, Korea,
the United States and the European
Union[3].
Review of Literature
There are a number of studies
which have been undertaken previously
relating to a commodity market. Some
of the studies are highly useful to
identify the areas already investigated
and formulate insight into the present
study. The researcher has included the
review of literature in order to identify
the gap in the research.
Wilson (2012)[4]in practice, there
are often conventions which simplify the

3 RIMS Journal of Management, Vol.4(I),Jan-July 2019
Trading performance of iron ore in worldwide procedure of price determination, and
help avoiding blatant deviations from
some average price level. In manganese,
where most trades is transacted
through annual bilateral contracts, a
commercial practice has developed
where a major supplier enters into
preliminary discussions with a major
customer, while the rest of the industry
defers its contract negotiations. As soon
as this pair reaches an agreement, all
other suppliers and users adopt the
agreed price as a guideline for their own
price setting. Very similar practices
applied to the annual contracts under
which a large proportion of
international iron ore trade was
transacted, but this system has been
undergoing significant change in the
recent past.
S. Rajamohan, G. Hudson Arul
Vethamanikam and C. Vijayakumar
(2014)[5]the markets are classified based
on the financial instruments such as
shares, bonds, commodity, currency and
so on. The investors have been fondness
to make their investment in derivative
instruments, especially the commodities
are performed well in the global market,
and it is owned the high volatility than
other markets. By investing in
commodities, an investor gains exposure
to changes in commodity prices, which
are ultimately determined by global
supply and demand. Return of the
commodity investment depends upon
the risk taken in the futures market
and the huge volatility of the market
assist to earn high returns. There are
four national and 21 regional
exchanges, which are trading
commodities in India. There are 80
commodities allowed by the Indian
government to trade in the markets.
The commodity performance has been
evaluated through the turnover of the
exchanges. The result of the commodity
may induce the investors to make
investment and create the awareness of
industry hence the active
commodities has been considered by the
researcher to analyze the performance.
The selected commodity has been
considered to conclude the result based
on market participation in the MCX
index. The precious metals of gold and
silver has been made enormous impact
on the commodity market and both
investment has been covered more than
fifty percent of the nonagricultural
commodities segment. The investors
mostly preferred and focused to make
investment on gold and silver hence it is
created the vibrant in the commodity
market. The commodity market cannot
compete with other market without
precious metals participation.
The research article on “Trading
trends in Indian commodity exchanges
with special reference to non-
agricultural commodities” by Anand
Bansal and Satinder Kaur
(2017)[6]denoted that global commodity
markets have gone through a long
journey. In India, the emergence and
augmentation of the organized

4 RIMS Journal of Management, Vol.4(I),Jan-July 2019
Trading performance of iron ore in worldwide commodity derivative market is
relatively a recent phenomenon. Since
its inception in June 2000, derivative
exchanges have exhibited exponential
growth in terms of volume and value of
trade. The setting up of the three
exchanges was the turning point in the
history of commodity market of India.
Hence, the study is undertaken to
analyse the trends and progress of the
national commodity exchanges of India
and comparing the value of the trading
activities of the selected nonagricultural
commodities. The data for the
commodities under study covers period
from the year 2004-2005 till the year
2014-2015.Thestudy is based on the
secondary data related to exchanges
such as MCX, NCDEX and NMCE.
Objectives of the Study
1. To understand the theoretical
background of Iron ore
Commodity.
2. To measure the Usages of Iron
Ore in Worldwide.
3. To assess the trading activities of
iron ore towards the Import and
Export.
The usages of iron ore in
worldwide
Multi Commodity Exchange (MCX)
of India received permission from the
commodity markets regulator namely
the Forward Markets Commission
(FMC), to launch iron ore futures
contract[7]. Iron ore is one of the most
important commodities in the world.
The MCX iron ore futures contract will
give all market participants an
opportunity to hedge their price risks
against the volatility of the physical
market. The Table.1 brings out the
usages of Iron Ore in worldwide.
Table - 1: The usages of Iron ore in
worldwide
(in Million MT)
Country 2007 2008 2009 2010 2011 2012 2013
Brazil 355
(17.75)
355
(15.99)
300
(13.39)
370
(14.29)
373
(12.69)
375
(12.5)
398
(13.49)
Australia 299
(14.95)
342
(15.41)
394
(17.59)
433
(16.72)
488
(16.60)
525
(17.5)
530
(17.97)
India 180
(9.0)
220
(9.91)
245
(10.94)
230
(8.88)
240
(8.16)
140
(4.67)
150
(5.08)
China 707
(35.35)
824
(37.12)
880
(39.29)
1070
(41.31)
1330
(45.24)
1310
(43.67)
1320
(44.75)
Russian
Federation
105
(5.25)
100
(4.50)
92
(4.11)
101
(3.90)
100
(3.40)
105
(3.5)
102
(3.46)
Canada 33
(1.65)
31
(1.40)
32
(1.43)
37
(1.43)
34
(1.16)
39
(1.3)
40
(1.36)
South
Africa
42
(2.1)
49
(2.21)
55
(2.46)
59
(2.28)
60
(2.04)
63
(2.1)
67
(2.27)
United
States
52
(2.6)
54
(2.43)
27
(1.21)
50
(1.93)
55
(1.87)
54
(1.8)
52
(1.76)
Ukraine 78
(3.9)
73
(3.29)
66
(2.95)
78
(3.01)
81
(2.75)
82
(2.73)
80
(2.71)
Iran 32
(1.6)
32
(1.44)
33
(1.47)
28
(1.08)
28
(0.95)
37
(1.23)
37
(1.25)
Kazakhstan 24
(1.2)
23
(1.04)
22
(0.98)
24
(0.93)
25
(0.85)
26
(0.87)
25
(0.85)
Sweden 25
(1.25)
24
(1.08)
18
(0.80)
25
(0.97)
25
(0.85)
23
(0.77)
26
(0.89)
Venezuela 23
(1.15)
21
(0.95)
15
(0.67)
14
(0.54)
17
(0.58)
27
(0.9)
30
(1.02)
Others 47
(2.35)
47
(2.12)
43
(1.91)
46
(1.78)
59
(2.01)
61
(2.03)
93
(3.15)
World 2000
(100)
2220
(100)
2240
(100)
2590
(100)
2940
(100)
3000
(100)
2950
(100)
Source: USGS(Bracket Indicate the Percentage to Total)
Table.1presents that the
performances of Iron Ore in different
countries like Brazil, Australia, India
and so on, which is measured by million
metric tonnes and contributions. In
2007, the usage of steel is high in Brazil
from 2007 to 2013 except the 2009 (300
MT). The Brazil, Australia and China
are increasing the usages of steel in
simultaneously during 2007 to 2013.
The other countries are not standard,
5 RIMS Journal of Management, Vol.4(I),Jan-July 2019
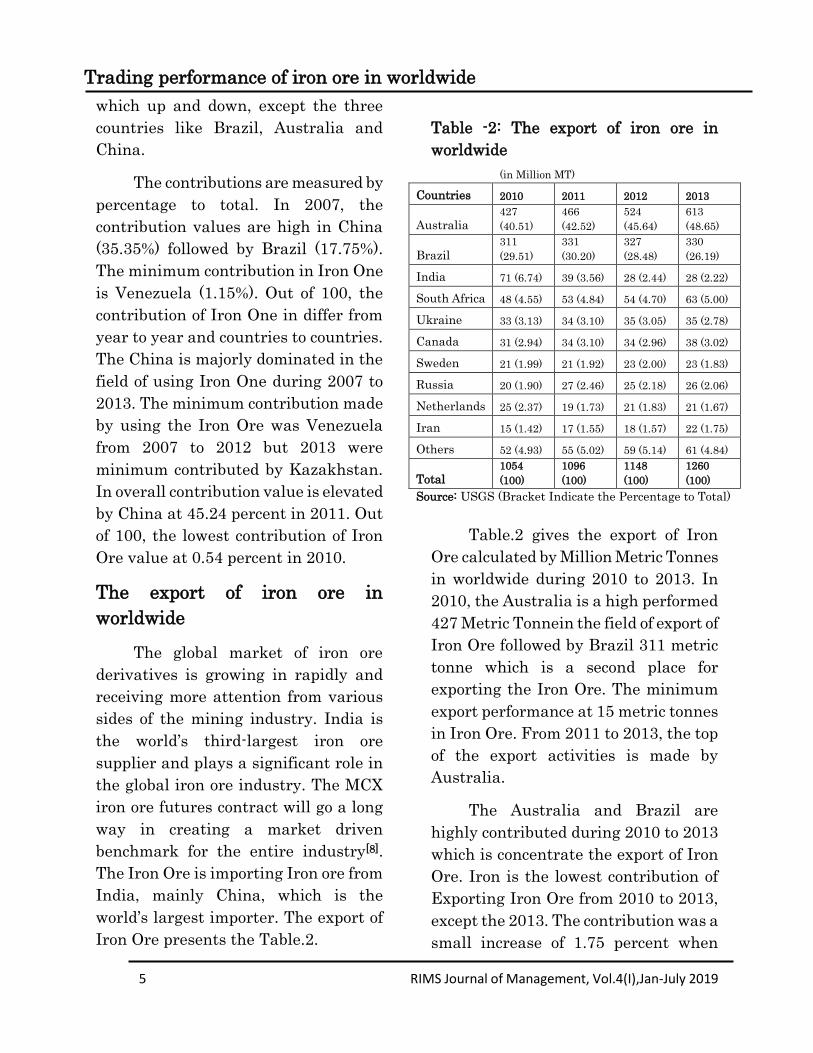
Trading performance of iron ore in worldwide which up and down, except the three
countries like Brazil, Australia and
China.
The contributions are measured by
percentage to total. In 2007, the
contribution values are high in China
(35.35%) followed by Brazil (17.75%).
The minimum contribution in Iron One
is Venezuela (1.15%). Out of 100, the
contribution of Iron One in differ from
year to year and countries to countries.
The China is majorly dominated in the
field of using Iron One during 2007 to
2013. The minimum contribution made
by using the Iron Ore was Venezuela
from 2007 to 2012 but 2013 were
minimum contributed by Kazakhstan.
In overall contribution value is elevated
by China at 45.24 percent in 2011. Out
of 100, the lowest contribution of Iron
Ore value at 0.54 percent in 2010.
The export of iron ore in
worldwide
The global market of iron ore
derivatives is growing in rapidly and
receiving more attention from various
sides of the mining industry. India is
the world’s third-largest iron ore
supplier and plays a significant role in
the global iron ore industry. The MCX
iron ore futures contract will go a long
way in creating a market driven
benchmark for the entire industry[8].
The Iron Ore is importing Iron ore from
India, mainly China, which is the
world’s largest importer. The export of
Iron Ore presents the Table.2.
Table -2: The export of iron ore in
worldwide
(in Million MT)
Countries 2010 2011 2012 2013
Australia 427
(40.51)
466
(42.52)
524
(45.64)
613
(48.65)
Brazil
311
(29.51)
331
(30.20)
327
(28.48)
330
(26.19)
India 71 (6.74) 39 (3.56) 28 (2.44) 28 (2.22)
South Africa 48 (4.55) 53 (4.84) 54 (4.70) 63 (5.00)
Ukraine 33 (3.13) 34 (3.10) 35 (3.05) 35 (2.78)
Canada 31 (2.94) 34 (3.10) 34 (2.96) 38 (3.02)
Sweden 21 (1.99) 21 (1.92) 23 (2.00) 23 (1.83)
Russia 20 (1.90) 27 (2.46) 25 (2.18) 26 (2.06)
Netherlands 25 (2.37) 19 (1.73) 21 (1.83) 21 (1.67)
Iran 15 (1.42) 17 (1.55) 18 (1.57) 22 (1.75)
Others 52 (4.93) 55 (5.02) 59 (5.14) 61 (4.84)
Total 1054
(100)
1096
(100)
1148
(100)
1260
(100)
Source: USGS (Bracket Indicate the Percentage to Total)
Table.2 gives the export of Iron
Ore calculated by Million Metric Tonnes
in worldwide during 2010 to 2013. In
2010, the Australia is a high performed
427 Metric Tonnein the field of export of
Iron Ore followed by Brazil 311 metric
tonne which is a second place for
exporting the Iron Ore. The minimum
export performance at 15 metric tonnes
in Iron Ore. From 2011 to 2013, the top
of the export activities is made by
Australia.
The Australia and Brazil are
highly contributed during 2010 to 2013
which is concentrate the export of Iron
Ore. Iron is the lowest contribution of
Exporting Iron Ore from 2010 to 2013,
except the 2013. The contribution was a
small increase of 1.75 percent when
6 RIMS Journal of Management, Vol.4(I),Jan-July 2019
Trading performance of iron ore in worldwide compared with the previous year and
have a slide change made by
Netherlands 1.67 percent.
The import of iron ore in
worldwide
The Export and Import are
necessary to measure the Iron Ore
Performance in worldwide. The
agricultural and Non-Agricultural
commodity are traded in the online
commodity market such as MCX,
NCDEX and so on[9]. The non-
agricultural commodity are majorly
traded on Multi-Commodity Exchanges.
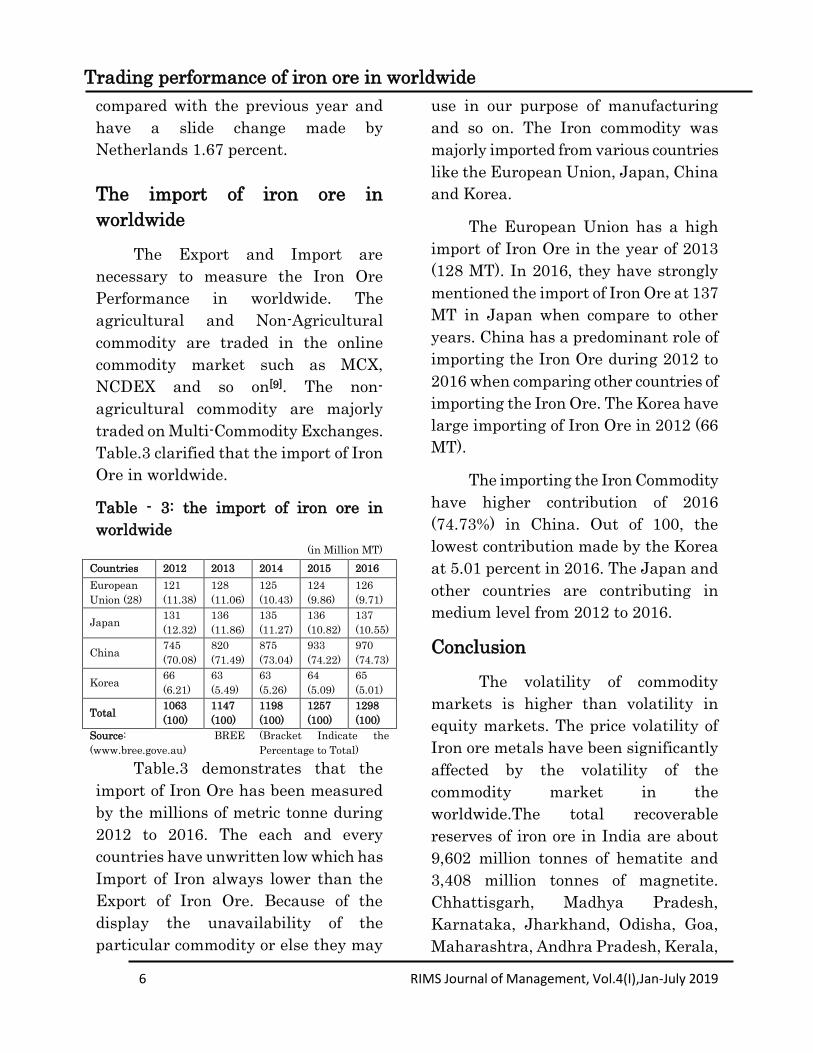
Table.3 clarified that the import of Iron
Ore in worldwide.
Table - 3: the import of iron ore in
worldwide
(in Million MT)
Countries 2012 2013 2014 2015 2016
European
Union (28)
121
(11.38)
128
(11.06)
125
(10.43)
124
(9.86)
126
(9.71)
Japan 131
(12.32)
136
(11.86)
135
(11.27)
136
(10.82)
137
(10.55)
China 745
(70.08)
820
(71.49)
875
(73.04)
933
(74.22)
970
(74.73)
Korea 66
(6.21)
63
(5.49)
63
(5.26)
64
(5.09)
65
(5.01)
Total 1063
(100)
1147
(100)
1198
(100)
1257
(100)
1298
(100)
Source: BREE
(www.bree.gove.au)
(Bracket Indicate the
Percentage to Total)
Table.3 demonstrates that the
import of Iron Ore has been measured
by the millions of metric tonne during
2012 to 2016. The each and every
countries have unwritten low which has
Import of Iron always lower than the
Export of Iron Ore. Because of the
display the unavailability of the
particular commodity or else they may
use in our purpose of manufacturing
and so on. The Iron commodity was
majorly imported from various countries
like the European Union, Japan, China
and Korea.
The European Union has a high
import of Iron Ore in the year of 2013
(128 MT). In 2016, they have strongly
mentioned the import of Iron Ore at 137
MT in Japan when compare to other
years. China has a predominant role of
importing the Iron Ore during 2012 to
2016 when comparing other countries of
importing the Iron Ore. The Korea have
large importing of Iron Ore in 2012 (66
MT).
The importing the Iron Commodity
have higher contribution of 2016
(74.73%) in China. Out of 100, the
lowest contribution made by the Korea
at 5.01 percent in 2016. The Japan and
other countries are contributing in
medium level from 2012 to 2016.
Conclusion
The volatility of commodity
markets is higher than volatility in
equity markets. The price volatility of
Iron ore metals have been significantly
affected by the volatility of the
commodity market in the
worldwide.The total recoverable
reserves of iron ore in India are about
9,602 million tonnes of hematite and
3,408 million tonnes of magnetite.
Chhattisgarh, Madhya Pradesh,
Karnataka, Jharkhand, Odisha, Goa,
Maharashtra, Andhra Pradesh, Kerala,

7 RIMS Journal of Management, Vol.4(I),Jan-July 2019
Trading performance of iron ore in worldwide Rajasthan and Tamil Nadu are the
principal Indian producers of iron ore.
World consumption of iron ore grows 10
per annum on average with the main
consumers being China, Japan, Korea,
the United States and the European
Union. The Iron ore is a good
commodity for investment money
without fear in competitive life. The
investors easily to get profit compared
to other commodities like silver, gold
and so on. The performance and usage
of Iron one is well in the worldwide.
Since the pricing of futures contract
does not consider the volatility of the
underlying asset, therefore, to mitigate
the risk of price volatility in the base
metals of Iron Ore. Thus the
introduction of option contracts would
benefit the producers and consumers of
the metals in the commodity market. It
will provide them an opportunity to
construct a hedge to reduce
theparticular risk they face in the
underlying assets.
8. References
1. Hudson Arul Vethamanikam.G, Mary
KirubaRani.VandJoel Jebadurai.D,
“Neural Learning: Price Prediction for
non-agricultural Commodities Using
Back Propagation Network”,
International Journal of Engineering &
Technology, Vol.7, Issue.4, 2018,
pp.2058-2062.
2. Iron ore pricing emerges from Stone
Age, Financial Times, October 26, 2009,
Retrieved
from:http://www.ft.com/cms/s/0/b0580bf
6-c220-11de-be3a-
00144feab49a,s01=1.html
3. Qazi, Shabir Ahmad and Qazi,
NavaidShabir, “Natural resource
Conservation and Environment
Management”, APH Publishing,
2008.Retrievedfrom:https://books.google
.com/books?id=XfUVyq4zt9IC&pg=PA1
01
4. J. Wilson, “Chinese Resource Security
Policies and the Restructuring of the
AsiaPacific Iron Ore Market”. Resources
Policy, Vol.37, No.3, July 2013, pp.331-
339.
5. S. Rajamohan, G. Hudson Arul
Vethamanikam and C. Vijayakumar,
“Market Performance of the Non-
Agricultural Commodities in India”,
Pezzottaite Journals,Vol.3, No.4,
October-December 2014.
6. Anand Bansal and Satinder Kaur,
“Trading trends in Indian Commodity
Exchanges with Special Reference to
Non-Agricultural Commodities”,
International Journal of Indian Culture
and Business Management, Vol.14,
No.1, January 2017, pp.94-108.
7. Retrieved from:
http://asiaetrading.com/mcx-launches-
iron-ore-futures-
contract/Retrievedfrom:http://www.ind
ianmba.com/faculty_column/fc1604/fc1
604.html
8. Anshul Sharma, Gurmeet Singh,
Manisha Sharma and Pooja Gupta,
Impact of Crude
9. Oil Price on Indian Economy,
“International Journal of Social
Sciences & Interdisciplinary Research”,
Vol.1, No. 4, April 2012, pp.95-98, ISSN
2277 3630.

Consumer preference on payment options in online shopping
8 RIMS Journal of Management, Vol.4(I),Jan-July 2019
Introduction
Online shopping is growing in
India day by day with the use of
internet. Retailer expands their
market with that customer who may
not otherwise visit the physical store.
The main significance of online
shopping is to get attention of that
customer who use internet most the
time. Online shopping is a major
part of the overall electronic
commerce, or e-commerce, industry
which consists of all the buying and
selling of goods and services over
electronic systems such as the
internet and other computer
networks by households, businesses
and other agencies. With the spread
of the internet, the amount or trade
that is conducted electronically has
seen extraordinary growth; and has
led to innovations and development
in areas such as electronic funds
transfer, electronic data interchange
and internet marketing. The online
marketers used the opportunities
and introduced lot of products in the
market. And the other benefit of
online shopping is their unique
online payment methods which
attracts customer for purchase
online. If there is so many benefit in
online shopping on other side online
shopping also come with potential
risk and dangers that customer
wants to be aware.
Dr. D.Joel Jebadurai,
Assistant Professor, Department of Commerce
and Management, Acharya Institute of Graduate
Studies, Soldevanahalli, Bangalore.
Email.id: [email protected],
Mobile : 9943172016
Abstract
Online marketing is the popular mode of business in recent days. It is mainly for
the consumers are having the all facilities like offline marketing in the online
shopping. While purchasing the goods in the online portal, consumers are spent
their valuable time in the payment process. It is mainly for the reason of the lack
of trust and perceived risk of the consumers towards the online marketers. In order
to solve payment issues, online marketer also offering the number of payment
options to the customers. In this research is focused with the objective of find out
the payment method preferred by the consumers in the online shopping. 297
respondents are interviewed by the researcher separately in the Tirunelveli city. In
order to assess the preference of payment options of the consumers’ garret ranking
method was applied. The researcher has found that Cash on Delivery (COD) is the
payment option preferred by the consumers in the online shopping compared with
the other options.

Consumer preference on payment options in online shopping
9 RIMS Journal of Management, Vol.4(I),Jan-July 2019
Online marketers of amazon,
flipkart , snapdeal and so on are the
popularised online marketers in
India they have introduced all the
products in the market for the
purpose of attracting the consumers.
But consumers are get the
satisfaction only when they are
receive the goods as per the value
paid by them. In order to cover all
types of consumers in India, online
marketers also introduced the
payment methods of cash on
delivery, EMI options, credit card
and so on.
Review of literature
Chung‐Hoon Park, Young‐Gul Kim,
(2003) wrote a research article
entitled "Identifying key factors
affecting consumer purchase
behavior in an online shopping
context”. They explained that while
interactions in the real world
shopping are mainly based on
face‐to‐face activities between
consumers and service personnels,
interactions in electronic commerce
take place mainly through the
retailer’s Web site. This study
investigated the relationship
between various characteristics of
online shopping and consumer
purchase behavior. They found that
information quality, user interface
quality, and security perceptions
affect information satisfaction and
relational benefit that, in turn, are
significantly related to each
consumer’s site commitment and
actual purchase behavior.
Mohammad Hossein Moshrefjavadi
et.al, (2012) made a study with the
objective of analyze the factors
affecting on online shopping behavior
of consumers that might be one of
the most important issues of e-
commerce and marketing field. In
order to examine the model the
impact of perceived risks,
infrastructural variables and return
policy on attitude toward online
shopping behavior and subjective
norms, perceived behavioral control,
domain specific innovativeness and
attitude on online shopping behavior
as considered as the hypotheses of
study. Respondents to the
questionnaire were consumers of
online stores in Iran which randomly
selected. Finally regression analysis
was used on data in order to test
hypothesizes of study. The study
identified that financial risks and
non-delivery risk negatively affected
the consumer attitude toward online
shopping. Results also indicated that
domain specific innovativeness and
subjective norms positively affect
online shopping behavior.
Furthermore, attitude toward online
shopping positively affected online
shopping behavior of consumers.
Dipti Jain, Sonia Goswami, Shipra
Bhutani (2014) come out with the
objective of to study the impact of
Perceived Risk, Perceived enjoyment,
Perceived usefulness and Perceived

Consumer preference on payment options in online shopping
10 RIMS Journal of Management, Vol.4(I),Jan-July 2019
ease of use factors on online
shopping behavior of consumers in
Delhi. The sample of the study
comprised of 160 online shoppers.
Respondents belonged to different
age groups, income groups and
occupations and have a prior
experience in online shopping. The
results of the study revealed that
only one factor, namely Perceived
Risk significantly affected online
shopping behavior of consumers in
Delhi while Perceived enjoyment,
Perceived ease of use and Perceived
enjoyment hinders the consumers to
shop online. The research findings
revealed that perceived risk
negatively impact consumers
attitude towards online shopping
while perceived usefulness, perceived
ease of use and perceived enjoyment
has no impact on consumers’ attitude
towards online shopping. So the
researchers suggested that the
companies must focus on Perceived
risks to develop consumers trust
towards online shopping.
Chirag Parmar (2015) conducted the
study with the objective of find out
the preferred option for payments in
online shopping. There is several
option of payment in online
purchasing such as credit card, debit
card, cash on delivery, EMI option,
gift voucher or wallet Rs. of
particular site. In order to assess the
preference of the consumers, a
survey was conducted and the 120
questionnaires were distributed
among the people of different
markets and the general public in
Bikaner. He found that on-line
shoppers prefer the cash on delivery
method while buying the goods in the
online.
Statement of the problem
The entire process of the
market is designed based on the
needs and wants of the customers.
Online marketing is also not
exception too. In today world,
customers are king in the market.
Customers are update themselves
about the products introduced in the
market through various
technological gadgets. Customers are
considered numerous factors before
finalise their purchase decision in
the online market. Online markets
also identify the needs of the
consumers and introduce the
changes accordingly. But a
sometimes online market doesn’t
have the opportunity to find out the
actual factor consideration of the
customers in the online market. This
gap leads to lot of problems in the
online market. In order to find out
the actual factors considered by the
consumers during the purchase and
find out payment option of the
customers this study has been
undertaken.
Objectives of the study
1. To study the demographic profile
of the respondents
Consumer preference on payment options in online shopping
11 RIMS Journal of Management, Vol.4(I),Jan-July 2019
2. To analyse the preferred payment
option of the consumers in the
online market
Methodology
The study mainly deals with
the primary data only. The data that
have been collected from the online
buyers in the Tirunelveli city with
the help of the online marketers
delivery employees. Convenience
sampling method was used to collect
the responses from the consumers
those who are ready to provide the
details. Sample size 297 respondents
are considered for the analysis of the
study. Interview schedule method is
used to collect the responses from the
respondents.
Findings
Demographic profile of the
respondents
Demographic profile of the
respondents is very much important
in the social science research. In this
research the researcher has
considered the gender, age,
educational qualification and income
of the respondents.
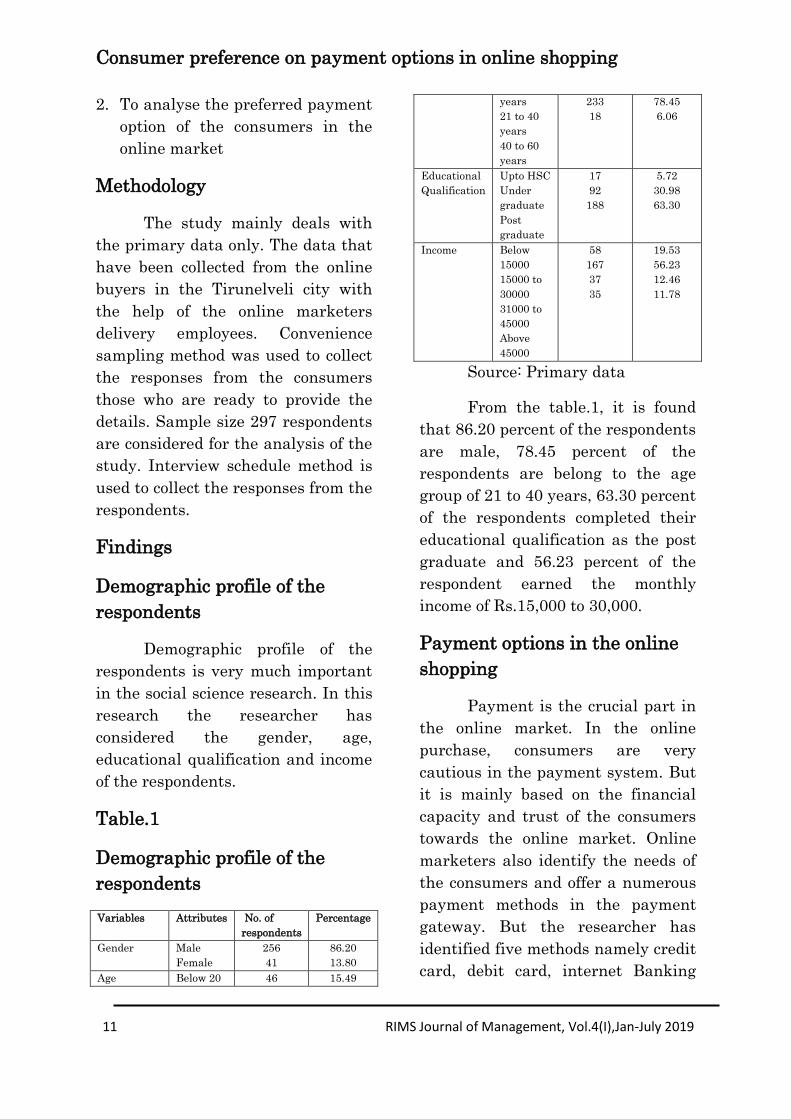
Table.1
Demographic profile of the
respondents
Variables Attributes No. of
respondents
Percentage
Gender Male
Female
256
41
86.20
13.80
Age Below 20 46 15.49
years
21 to 40
years
40 to 60
years
233
18
78.45
6.06
Educational
Qualification
Upto HSC
Under
graduate
Post
graduate
17
92
188
5.72
30.98
63.30
Income Below
15000
15000 to
30000
31000 to
45000
Above
45000
58
167
37
35
19.53
56.23
12.46
11.78
Source: Primary data
From the table.1, it is found
that 86.20 percent of the respondents
are male, 78.45 percent of the
respondents are belong to the age
group of 21 to 40 years, 63.30 percent
of the respondents completed their
educational qualification as the post
graduate and 56.23 percent of the
respondent earned the monthly
income of Rs.15,000 to 30,000.
Payment options in the online
shopping
Payment is the crucial part in
the online market. In the online
purchase, consumers are very
cautious in the payment system. But
it is mainly based on the financial
capacity and trust of the consumers
towards the online market. Online
marketers also identify the needs of
the consumers and offer a numerous
payment methods in the payment
gateway. But the researcher has
identified five methods namely credit
card, debit card, internet Banking
Consumer preference on payment options in online shopping
12 RIMS Journal of Management, Vol.4(I),Jan-July 2019
Cash on Delivery (COD) and
Equated Monthly Instalment (EMI)
for made the payment in the online
market. After that in order to assess
the customers’ priority level in the
payment methods, it was ranked by
the respondents. With a view to find
out the payment method which one
is the mostly preference method of
payment for the customers the garret
ranking has been used. Table 2
explains the payment methods
adopted the customers while buying
the goods in the online market.
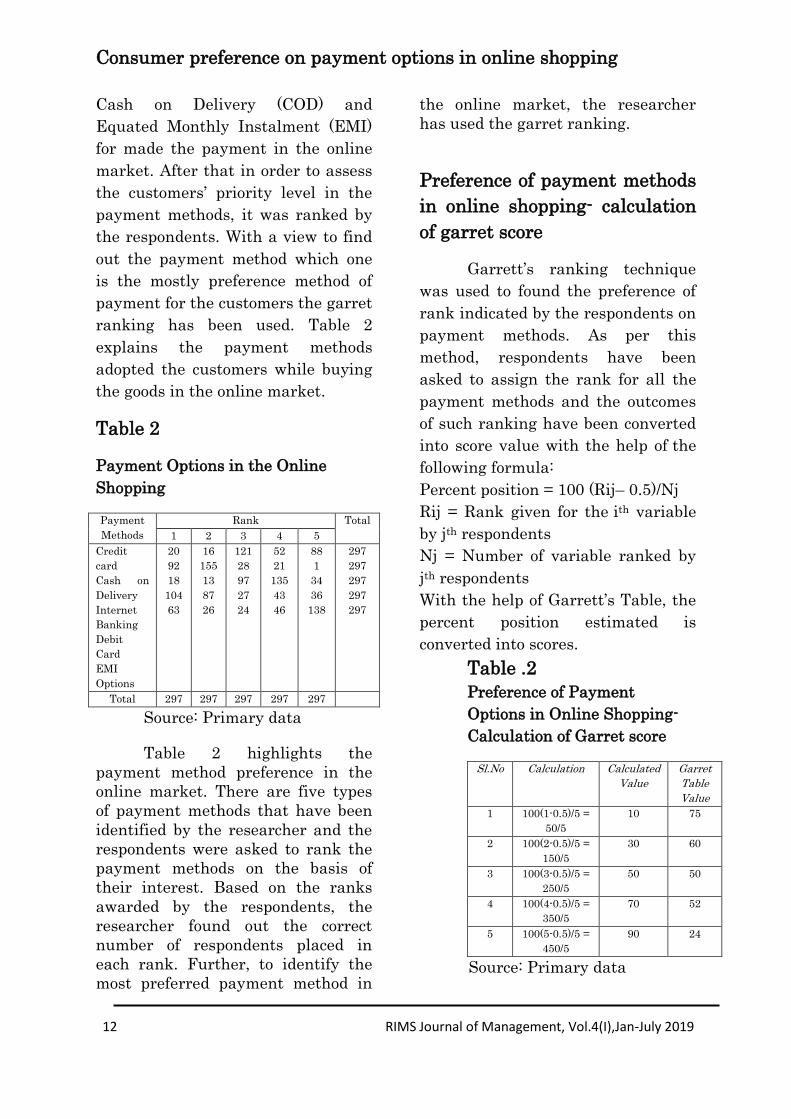
Table 2
Payment Options in the Online
Shopping
Payment
Methods
Rank Total
1 2 3 4 5
Credit
card
Cash on
Delivery
Internet
Banking
Debit
Card
EMI
Options
20
92
18
104
63
16
155
13
87
26
121
28
97
27
24
52
21
135
43
46
88
1
34
36
138
297
297
297
297
297
Total 297 297 297 297 297
Source: Primary data
Table 2 highlights the
payment method preference in the
online market. There are five types
of payment methods that have been
identified by the researcher and the
respondents were asked to rank the
payment methods on the basis of
their interest. Based on the ranks
awarded by the respondents, the
researcher found out the correct
number of respondents placed in
each rank. Further, to identify the
most preferred payment method in
the online market, the researcher
has used the garret ranking.
Preference of payment methods
in online shopping- calculation
of garret score
Garrett’s ranking technique
was used to found the preference of
rank indicated by the respondents on
payment methods. As per this
method, respondents have been
asked to assign the rank for all the
payment methods and the outcomes
of such ranking have been converted
into score value with the help of the
following formula:
Percent position = 100 (Rij– 0.5)/Nj
Rij = Rank given for the ith variable
by jth respondents
Nj = Number of variable ranked by
jth respondents
With the help of Garrett’s Table, the
percent position estimated is
converted into scores.
Table .2
Preference of Payment
Options in Online Shopping-
Calculation of Garret score
Sl.No Calculation Calculated
Value
Garret
Table
Value
1 100(1-0.5)/5 =
50/5
10 75
2 100(2-0.5)/5 =
150/5
30 60
3 100(3-0.5)/5 =
250/5
50 50
4 100(4-0.5)/5 =
350/5
70 52
5 100(5-0.5)/5 =
450/5
90 24
Source: Primary data

Consumer preference on payment options in online shopping
13 RIMS Journal of Management, Vol.4(I),Jan-July 2019
Table.2 shows the Garret
scores. Initially the Garret ranks
are calculated by using suitable
Garret ranking formula. Based on
the Garret ranks, the Garret Table
value has been ascertained. The
Garret Table scores of each factor in
Table 1 have been multiplied to
record scores in the Table.2 after
adding each row, the total Garret
scores have been obtained.
Preference of payment options
in online shopping- garret
ranks
In order to identify the payment
method which one is mostly
preferred while buying the goods in
the online market the respondents
were requested to express their
opinion by giving ranks and it was
processed through the garret scores
and Table 3 displays the garret
scores and its ranks.
Table .3
Preference of Payment Options
in Online Shopping- Garret
Ranks
Payment
Methods
Rank Garret
Score
Garret
Rank 1 2 3 4 5
Credit
card
Cash on
Delivery
Internet
Banking
Debit
Card
EMI
Options
1500
6900
1350
7800
4725
960
9300
780
5220
1560
6050
1400
4850
1350
1200
2704
1092
7020
2236
2392
2112
24
816
864
3312
13326
18716
14816
17470
13189
4
1
3
2
5
Source: Primary data
Table 3 portrays the rank
assigned by the respondents towards
the payment methods in online
shopping. Based on the garret score
value, the researcher has found that
the highest score is awarded to the
factor “Cash on Delivery” ranked as
factor first, followed by “debit card”.
The least score is awarded to EMI
options.
Conclusion
From the study the researcher
found that the cash on delivery is the
payment options preferred by the
consumers in the online shopping. It
is mainly for the reason of the lack of
trust of the consumers in the online
shopping. So the online marketers
create the trust in the mind of the
consumers by means of adopting the
proper return policy, quality goods
and so on. This research is very
useful to the stakeholders those who
are focus on the online markers in
their research and also online
marketers for their policy decisions.
References
1. Chung‐Hoon Park, Young‐Gul
Kim, (2003) "Identifying key
factors affecting consumer
purchase behavior in an online
shopping context",
International Journal of Retail
and Distribution
Management, Vol. 31, No.1,
pp.16-29.
2. Mohammad Hossein
Moshrefjavadi, Hossein Rezaie

Consumer preference on payment options in online shopping
14 RIMS Journal of Management, Vol.4(I),Jan-July 2019
Dolatabadi, Mojtaba
Nourbakhsh, Amir
Poursaeedi, Ahmadreza
Asadollahi (2012), “An
Analysis of Factors Affecting
on Online Shopping Behavior
of Consumers”, International
Journal of Marketing Studies,
Vol.4, No.5, pp. 35-43.
3. Dipti Jain, Sonia Goswami,
Shipra Bhutani (2014),
“Consumer Behavior towards
Online Shopping: An
Empirical Study from Delhi”,
IOSR Journal of Business and
Management, Volume 16,
Issue 9, pp.65-72
4. Chirag Parmar (2015) “A
Comparative Study on Various
Payment Options in Online
Shopping” International
Journal on Recent and
Innovation Trends in
Computing and
Communication, Vol.3, No.4,
pp. 2433-2436.
5. http://www.seoexpertsindia.co
m/internet-marketing-
services.php
6. https://economictimes.indiatim
es.com/industry/services/retail/
online-retail-consumers-to-
cross-100-million-by-2017-
assocham-resurgent-india-
study/articleshow/56417797.c
ms
7. http://www.livemint.com/Indu
stry/9iUxlQZ4iHwPiXRKscx3
LK/Indias-ecommerce-market-
to-grow-30-to-200-billion-by-
202.html
8. https://www.thebalance.com/sa
fe-online-payment-methods-
315821
9. https://blog.kissmetrics.com/ea
sy-payment-process/
10. https://www.ecommercewiki.or
g/Online_Payments/Online_Pa
yments_Basic/What_are_onlin
e_payment_methods
Distinguishing the factors influencing brand preference of selected
Mobile Phone in rural and semi-urban areas.
15 RIMS Journal of Management, Vol.4(I),Jan-July 2019
Introduction
India has got a huge population which
provides a lot of opportunities to
various marketers. India has proved to
be one of the fastest growing markets
in the world. According to the
National Council of Applied Economic
Research (NCAER), almost 70% of the
total population of India lives in the
rural areas and semi-urban. The
consumer durable segment of the
market is focusing on the rural and
semi-urban markets as urban markets
are becoming saturated. Therefore,
urban markets have touched its
maximum level for various types of
consumer goods and since the rural
income is growing, various marketers
are trying to bring strength for large
rural and semi-urban segments of the
Prof. Honey Gupta
Research Scholar (University of Delhi, Delhi)
Email Id: [email protected],
Mobile: 9971020028
Prof. Jawahar Kumar
Assistant Professor, International Institute of Business Studies, Bengaluru
Email Id: [email protected],
Mobile: 9620748701
Abstract
India has a huge population which provides a lot of opportunities to various
market. Almost 70% of the accumulated population of India lives in the rural and
semi-urban areas. The consumer durable segment of the market is concentrating on
the rural and semi-urban markets as the urban markets have reached its
saturation. This study aims on the reasons for the preference of a selected brand of
mobile among the consumers of rural and semi-urban areas. The known variables
like price, product and reference group have been assessed by using Spearman rank
correlation. A total sample of 400 respondents was taken from semi-urban and
rural areas of Baddi, Himachal Pradesh. It was found that both semi-urban and
rural areas displays a somewhat same preference when it comes to different brands
of Mobile. The findings revealed that durability, price,popularity and reference
group have been the major factors that affect brand preference for mobile in semi-
urban areas, whereas, factors such as brand name, colour variety, quality and
reference group affect brand preference in rural areas.
Keywords: Brand preference, mobile phone,

Distinguishing the factors influencing brand preference of selected
Mobile Phone in rural and semi-urban areas.
16 RIMS Journal of Management, Vol.4(I),Jan-July 2019
market, hence the concept rural
marketing has got more
importance.The right strategy for the
marketer is to focus on the rural and
semi-urban market to get a major
share of the consumer from these
areas. According to a Tata Strategic
Management Group report, it is
observed that 66% of consumer
durables are bought by the consumers
from the rural segments. Mobile &
electronic products are likely to grow
in coming future in semi-urban and
rural areas.
The rural and semi-urban markets are
tapped partially and urban areas have
reached its saturation point. This can
be the valid point for marketers to
emphasize on the need to explore rural
and semi-urban markets. Rural and
semi-urban consumers are found to be
interested in branded products these
days, therefore, the market for goods
and service seem to have started to
flourish in these sectors. The
consumer durables sector in India is
going to witness some very interesting
times in rural and semi-urban
markets.
Mobiles can be used to present the
consumer durable markets. Mobiles
have earned an essential durable
commodity status in the world. Mobile
market has got a great potential to
grow. There are various reputed
brands available in the durable
market. When it comes to mobiles, the
consumers have got numerous brand
alternatives to choose from.
Consumers brand preferences helps in
understanding consumer behaviour. A
deeper understanding of such
preference can help marketers‟ design
better marketing program and build a
long-term relationship with consumers
In Himachal Pradesh, the urban
markets are becoming saturated.
Therefore, the rural and semi-urban
markets have got a bright future .90%
of the population of Himachal Pradesh
lives in rural areas and the semi-
urban population is also rising in
Himachal Pradesh according to census
2011.
Marketers have focused on urban and
rural areas only and could not
distinguish between semi-urban and
rural areas. Semi-urban can‟t be
considered as urban areas because
they are different in demographic-wise
in terms of income, education, lifestyle
and infrastructure. Therefore, the
behaviour of consumers of semi-urban
and rural areas are also different.
Semi-urban areas can be defined as
areas which have recorded population
between 10k-1 lakh, and have better
access to the market, more disposable
income, better infrastructure than
rural areas and Rural areas refers to
the areas which have got a population
less than 10,000 and the most
important factors for rural areas is

Distinguishing the factors influencing brand preference of selected
Mobile Phone in rural and semi-urban areas.
17 RIMS Journal of Management, Vol.4(I),Jan-July 2019
that more than 75% of the population
is completely dependent on
agriculture for their survival stated
by RBI.
Review of literature
(Rajeswari R.,Pirakatheeswari P.,
2014)aimed to study the socio-
economic profile of the selected
consumers and the factors influencing
the consumers in the selection and use
of particular products. Features that
influence the respondents while they
purchase the consumer durable goods,
the factor Price ranked first. It was
followed by Quality. The factor Brand
Image got third rank and the factor
Model/Design got fourth rank.
(Rastogia R., Chaudhary S.,
2012)examined the purchase
motivators like Item of necessity,
symbol of social status, marketing
influence, brand reputation for
television, washing machine and
refrigerator in the rural areas. A large
no. of rural consumers prefers the
brands and their products because of
the quality of the product and then the
price of the product respectively. The
responses also show that the brands
most preferred by the consumers
regarding television, washing machine
and refrigerator are Samsung, LG and
LG respectively.
(Deepa I. R., 2013)focused on the
assessment of the impact of
advertisement on purchase of youth
with reference to consumer goods. The
study concluded that the youth get the
information about the different
products mainly from television and
newspaper advertisement. From the
research study it was concluded that
advertisements influence on the
purchase decision of youth for
consumer goods.
(Dharmaraj C., M. Sivasubramania
M., 2011) refined the factors that
influence the brand preference of
passenger cars in India. It is indeed
obvious from the study that the
performance factors of the passenger
car brands have dominated the
preference of customers, based on
their economic status. Overall, it is the
all-round ability of the car brands
reliability, safety, technology, value
for money, high resale value, high
mileage, maintenance cost, quality,
comforts, durability, etc. that prove to
be decisive factors.
(Chakraborty S., 2015)aimedto know
the factors affecting brand preference
of consumer durables.LG is the most
preferred brand for refrigerator and
TV, Usha is the most preferred for
ceiling fan, mixer grinder and iron.
Cost effectiveness is the most
important reason behind brand
preference of select consumer durables
followed by product appearance and
brand status.

Distinguishing the factors influencing brand preference of selected
Mobile Phone in rural and semi-urban areas.
18 RIMS Journal of Management, Vol.4(I),Jan-July 2019
(Pradhan J., Misra D.P., 2014)
explored the rural consumer buying
behavior through brand awareness
and influence of demographic factors
on brand preference. The results
indicated that there were statistical
relationships between age, gender,
family type and education with brand
preference. However, there was no
statistical relationship between
occupation and annual income with
the brand preference.
(Anand V. et al., 2016)studied the
association between demographic
factors and brand preference of the
respondents of DTH users in rural
areas; to study the variation between
demographic factors and brand
preference; to understand the effect of
study variables such as cost, features,
convenient services and support
facilities on brand preference, to
examine the relationship between
brand preference and purchase
decisions and to find out the effect of
brand preference on purchase
decisions. It was found that there is
association between the demographic
factors viz., age, area, monthly income
of the respondents with the Consumer
Brand Preference. The research
results also revealed that there is no
association between the gender of the
respondents and the Consumer Brand
Preference. From the regression
results, the researcher found that the
Brand preferences do not vary with
the demographic factors namely
gender, age and area of the
respondents. The results also revealed
that the Brand preference do vary
with the income of the respondents.
The results revealed that there is a
significant relationship between
Consumer Brand Preference and
Purchase Decision. There is a
significant effect of Consumer Brand
Preference on Purchase Decision.
All the above studies revolve around
the rural and urban areas, but not
much has been done on the semi-
urban areas, which are actually
different from rural and urban areas.
Thus, this study will focus on semi-
urban and rural areas with respect to
brand preference of mobile.
Objective:
• To rank the brands preferred by
the consumers of mobile.
• To compare the factors affecting
brand preferences of mobile in
semi-urban and rural areas.
Research methods
In this study semi-urban and rural
areas of Baddi, Himachal Pradesh
with a sample size of 400 were taken.
According to Krejcie and Morgan
Table, the sample size should be
384 www.surveysystem.com.
400 samples were collected and all
400 were taken for the study as all

Distinguishing the factors influencing brand preference of selected
Mobile Phone in rural and semi-urban areas.
19 RIMS Journal of Management, Vol.4(I),Jan-July 2019
the samples were considered
reliable.
Primary and Secondary sources
were used for data collection.
The samples were collected
through questionnaires from
the semi-urban and rural
consumers.
The sampling technique was
probabilistic.
Baddi is recognized as an
industrial town & Nagar
panchayat. It is situated in
Southwestern Solan district of
Himachal Pradesh. This area
was chosen for the study as it is
a mix of both semi-urban and
rural areas which is important
for the study.
Variables like Quality, Brand
name, Reliability, Popularity,
Colour-variety, and Durability,
Price and Reference group were
taken for the study apart from
variables like age, gender,
income.
Spearman Rank correlation was
used for analysis.
Data analysis and interpretation
Ranking brands of mobile according to
the preference
Table 2: Ranking different brands of
mobile according to the preference
Brand preferred of Mobile
Semi-urban Rural
Frequency Percent Frequency Per
cent
Valid
HTC 28 14.0 19 9.5
Samsu
ng
66 33.0 83 41.5
Apple 65 32.5 38 19.0
LYF 4 2.0 16 8.0
Micro
max
14 7.0 14 7.0
Intex 10 5.0 4 2.0
Oppo 5 2.5 7 3.5
Gionee 2 1.0 5 2.5
Others 6 3.0 14 7.0
Total 200 100.0 200 100.
0
Interpretation: The mobile brands-
HTC, Samsung, Apple, LYF,
Micromax, Intex, Oppo, Gionee are
ranked as per the frequencies shown
in the Table above.
From the Table, it is seen that both
semi-urban and rural areas show a
somewhat same preference when it
comes to different brands of Mobile. In
both the areas, the most preferred
brand of mobile is Samsung followed
by Apple and then HTC. The least
preferred brand in both the areas are
Intex, Oppo and LYF.
Classification of respondents
according to the brands preferred of
mobile
Table 3: Classification of respondents
according to the brands preferred of
mobile (in Nos.)
Location
HT
C
Sam
sun
g
Ap
ple
LY
F
Mic
rom
ax
Inte
x
Op
po
Gio
nee
Oth
ers
Tota
l
Semi-
urban
28 66 65 4 14 10 5 2 6 200
Rural 19 83 38 16 14 4 7 5 14 200
Distinguishing the factors influencing brand preference of selected
Mobile Phone in rural and semi-urban areas.
20 RIMS Journal of Management, Vol.4(I),Jan-July 2019
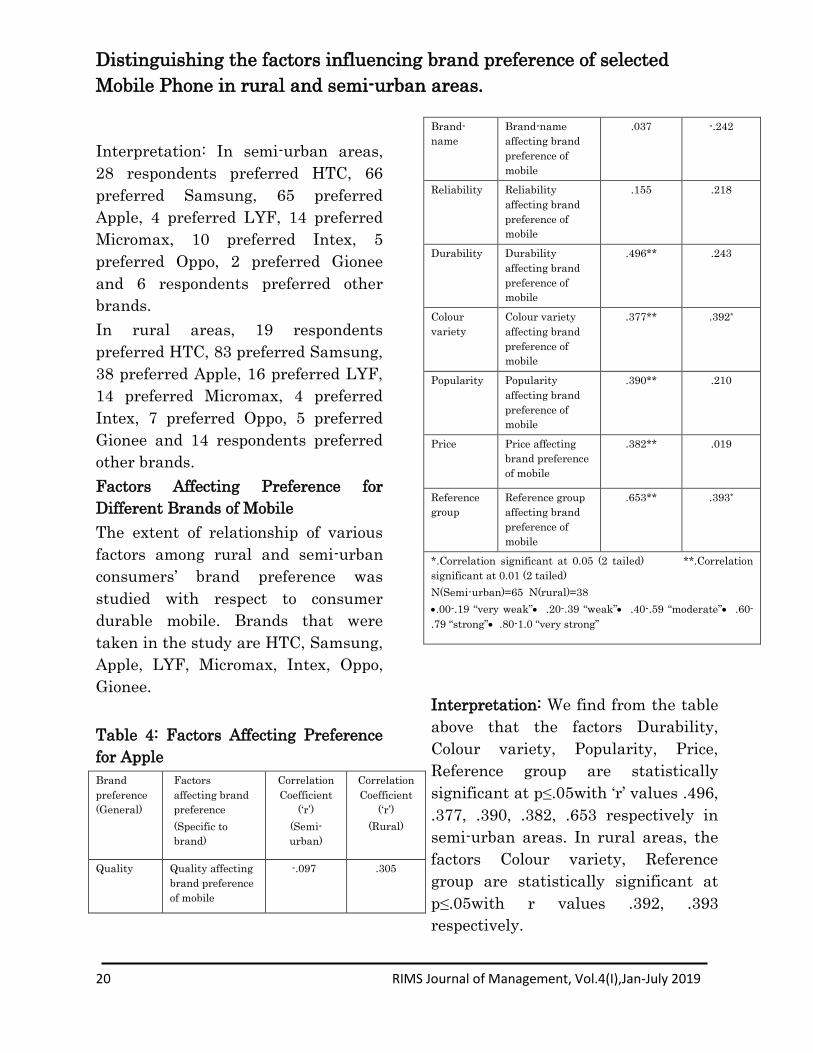
Interpretation: In semi-urban areas,
28 respondents preferred HTC, 66
preferred Samsung, 65 preferred
Apple, 4 preferred LYF, 14 preferred
Micromax, 10 preferred Intex, 5
preferred Oppo, 2 preferred Gionee
and 6 respondents preferred other
brands.
In rural areas, 19 respondents
preferred HTC, 83 preferred Samsung,
38 preferred Apple, 16 preferred LYF,
14 preferred Micromax, 4 preferred
Intex, 7 preferred Oppo, 5 preferred
Gionee and 14 respondents preferred
other brands.
Factors Affecting Preference for
Different Brands of Mobile
The extent of relationship of various
factors among rural and semi-urban
consumers‟ brand preference was
studied with respect to consumer
durable mobile. Brands that were
taken in the study are HTC, Samsung,
Apple, LYF, Micromax, Intex, Oppo,
Gionee.
Table 4: Factors Affecting Preference
for Apple
Brand
preference
(General)
Factors
affecting brand
preference
(Specific to
brand)
Correlation
Coefficient
(„r‟)
(Semi-
urban)
Correlation
Coefficient
(„r‟)
(Rural)
Quality Quality affecting
brand preference
of mobile
-.097 .305
Brand-
name
Brand-name
affecting brand
preference of
mobile
.037 -.242
Reliability Reliability
affecting brand
preference of
mobile
.155 .218
Durability Durability
affecting brand
preference of
mobile
.496** .243
Colour
variety
Colour variety
affecting brand
preference of
mobile
.377** .392*
Popularity Popularity
affecting brand
preference of
mobile
.390** .210
Price Price affecting
brand preference
of mobile
.382** .019
Reference
group
Reference group
affecting brand
preference of
mobile
.653** .393*
*.Correlation significant at 0.05 (2 tailed) **.Correlation
significant at 0.01 (2 tailed)
N(Semi-urban)=65 N(rural)=38
.00-.19 “very weak” .20-.39 “weak” .40-.59 “moderate” .60-
.79 “strong” .80-1.0 “very strong”
Interpretation: We find from the table
above that the factors Durability,
Colour variety, Popularity, Price,
Reference group are statistically
significant at p≤.05with „r‟ values .496,
.377, .390, .382, .653 respectively in
semi-urban areas. In rural areas, the
factors Colour variety, Reference
group are statistically significant at
p≤.05with r values .392, .393
respectively.
Distinguishing the factors influencing brand preference of selected
Mobile Phone in rural and semi-urban areas.
21 RIMS Journal of Management, Vol.4(I),Jan-July 2019
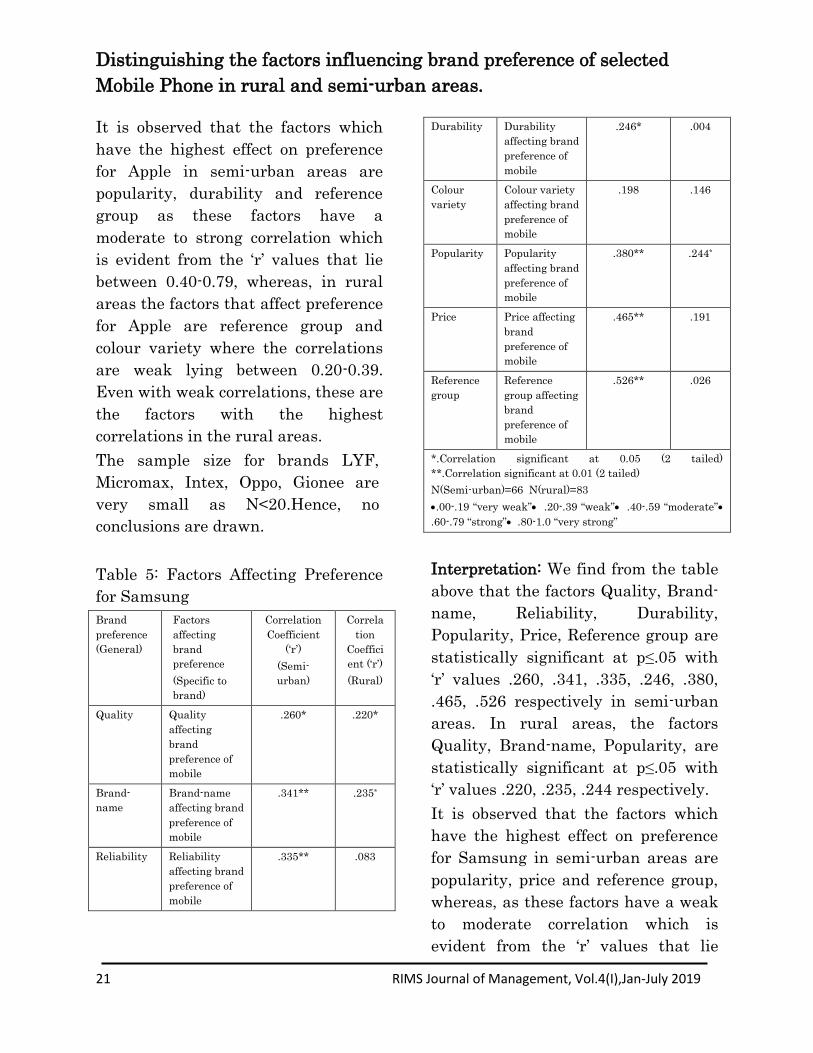
It is observed that the factors which
have the highest effect on preference
for Apple in semi-urban areas are
popularity, durability and reference
group as these factors have a
moderate to strong correlation which
is evident from the „r‟ values that lie
between 0.40-0.79, whereas, in rural
areas the factors that affect preference
for Apple are reference group and
colour variety where the correlations
are weak lying between 0.20-0.39.
Even with weak correlations, these are
the factors with the highest
correlations in the rural areas.
The sample size for brands LYF,
Micromax, Intex, Oppo, Gionee are
very small as N<20.Hence, no
conclusions are drawn.
Table 5: Factors Affecting Preference
for Samsung
Brand
preference
(General)
Factors
affecting
brand
preference
(Specific to
brand)
Correlation
Coefficient
(„r‟)
(Semi-
urban)
Correla
tion
Coeffici
ent („r‟)
(Rural)
Quality Quality
affecting
brand
preference of
mobile
.260* .220*
Brand-
name
Brand-name
affecting brand
preference of
mobile
.341** .235*
Reliability Reliability
affecting brand
preference of
mobile
.335** .083
Durability Durability
affecting brand
preference of
mobile
.246* .004
Colour
variety
Colour variety
affecting brand
preference of
mobile
.198 .146
Popularity Popularity
affecting brand
preference of
mobile
.380** .244*
Price Price affecting
brand
preference of
mobile
.465** .191
Reference
group
Reference
group affecting
brand
preference of
mobile
.526** .026
*.Correlation significant at 0.05 (2 tailed)
**.Correlation significant at 0.01 (2 tailed)
N(Semi-urban)=66 N(rural)=83
.00-.19 “very weak” .20-.39 “weak” .40-.59 “moderate”
.60-.79 “strong” .80-1.0 “very strong”
Interpretation: We find from the table
above that the factors Quality, Brand-
name, Reliability, Durability,
Popularity, Price, Reference group are
statistically significant at p≤.05 with
„r‟ values .260, .341, .335, .246, .380,
.465, .526 respectively in semi-urban
areas. In rural areas, the factors
Quality, Brand-name, Popularity, are
statistically significant at p≤.05 with
„r‟ values .220, .235, .244 respectively.
It is observed that the factors which
have the highest effect on preference
for Samsung in semi-urban areas are
popularity, price and reference group,
whereas, as these factors have a weak
to moderate correlation which is
evident from the „r‟ values that lie
Distinguishing the factors influencing brand preference of selected
Mobile Phone in rural and semi-urban areas.
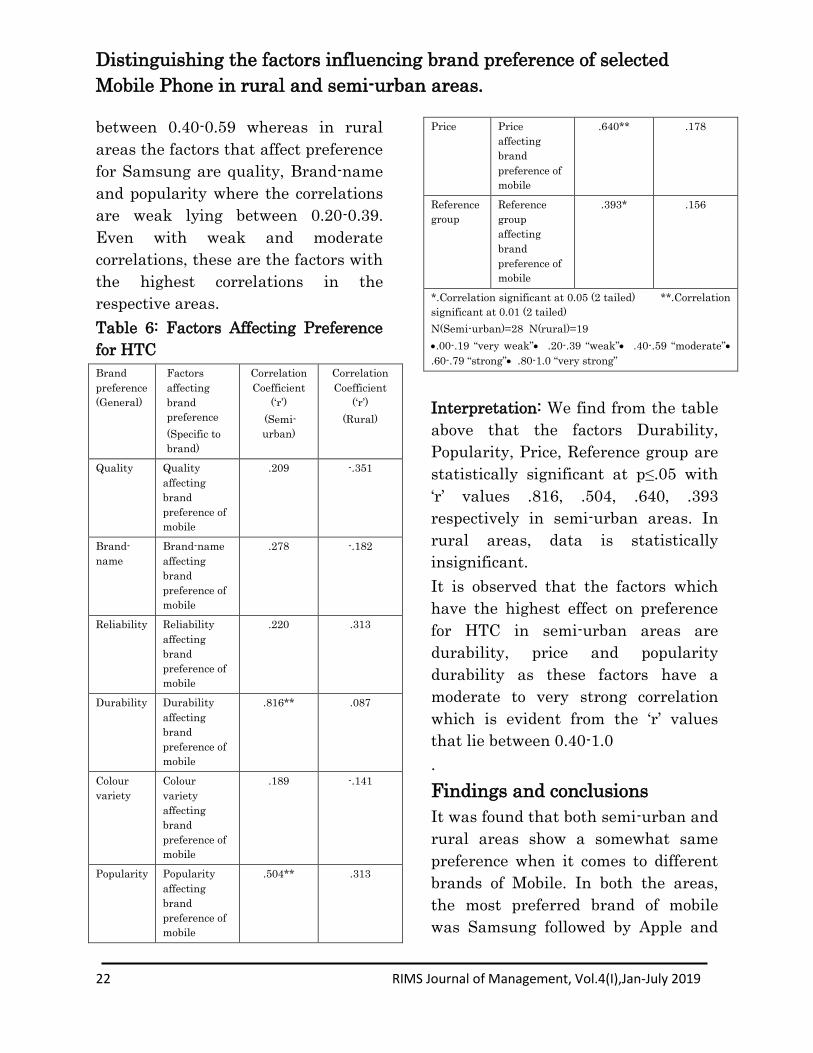
22 RIMS Journal of Management, Vol.4(I),Jan-July 2019
between 0.40-0.59 whereas in rural
areas the factors that affect preference
for Samsung are quality, Brand-name
and popularity where the correlations
are weak lying between 0.20-0.39.
Even with weak and moderate
correlations, these are the factors with
the highest correlations in the
respective areas.
Table 6: Factors Affecting Preference
for HTC
Brand
preference
(General)
Factors
affecting
brand
preference
(Specific to
brand)
Correlation
Coefficient
(„r‟)
(Semi-
urban)
Correlation
Coefficient
(„r‟)
(Rural)
Quality Quality
affecting
brand
preference of
mobile
.209
-.351
Brand-
name
Brand-name
affecting
brand
preference of
mobile
.278 -.182
Reliability Reliability
affecting
brand
preference of
mobile
.220 .313
Durability Durability
affecting
brand
preference of
mobile
.816** .087
Colour
variety
Colour
variety
affecting
brand
preference of
mobile
.189 -.141
Popularity Popularity
affecting
brand
preference of
mobile
.504** .313
Price Price
affecting
brand
preference of
mobile
.640** .178
Reference
group
Reference
group
affecting
brand
preference of
mobile
.393* .156
*.Correlation significant at 0.05 (2 tailed) **.Correlation
significant at 0.01 (2 tailed)
N(Semi-urban)=28 N(rural)=19
.00-.19 “very weak” .20-.39 “weak” .40-.59 “moderate”
.60-.79 “strong” .80-1.0 “very strong”
Interpretation: We find from the table
above that the factors Durability,
Popularity, Price, Reference group are
statistically significant at p≤.05 with
„r‟ values .816, .504, .640, .393
respectively in semi-urban areas. In
rural areas, data is statistically
insignificant.
It is observed that the factors which
have the highest effect on preference
for HTC in semi-urban areas are
durability, price and popularity
durability as these factors have a
moderate to very strong correlation
which is evident from the „r‟ values
that lie between 0.40-1.0
.
Findings and conclusions
It was found that both semi-urban and
rural areas show a somewhat same
preference when it comes to different
brands of Mobile. In both the areas,
the most preferred brand of mobile
was Samsung followed by Apple and
Distinguishing the factors influencing brand preference of selected
Mobile Phone in rural and semi-urban areas.
23 RIMS Journal of Management, Vol.4(I),Jan-July 2019
then HTC. The least preferred brand
in both the areas were Intex, Oppo
and LYF.
The research findings showed that
popularity, durability, price and
reference group have been the major
factors that affect brand preference for
mobile in semi-urban areas, whereas,
factors such as quality, brand name,
colour variety and reference group
affect brand preference in rural areas.
From the above analysis it is seen that
factors that affect brand preferences in
both regions are different except
reference group. Reference group
affects brand preference for mobile in
both regions.
Research implication
Rural and semi-urban population
comprises of 70% of the entire
population of India. Therefore, it is
very important for the marketers to
understand thebehaviour of the
consumers who lives in these areas.
This study will help the marketers to
design marketing strategies for this
area and the areas which have similar
demographics as that of the area
taken for the study.This study will
also help companies to position their
products in these areas.
Limitation of the studyand scope
for further research
This research is restricted to only
one area i.e. Baddi, which is
situated in Himachal Pradesh,
Therefore, this study might not be
applicable in other areas.
Moreover, this study take into
consideration only one consumer
durable i.e. Mobile phone. Similar
studies can be taken up for other
consumer durables as well.
The sample size taken for this
study is 400 which is very small
and results of the study cannot be
generalized for the entire
population.
There can be different results if
different sample size and sample
population is taken.
References
Anand, V. V., Renganathan, R.,
Srinivasakumar, V., Balachandran, S.,
Vaishaly, V. A., Sindhuja, S., &
Radhika, R. (2016). A study on
consumer brand preference with
reference to DTH in rural area. Indian
Journal of Science and Technology,
9(27).
doi:10.17485/ijst/2016/v9i27/97621
Çelik, A. K., Eygü, H., & Oktay, E.
(2015). A study on factors influencing
young consumers‟ smartphone brand
preference in Erzurum, Turkey.
European Journal of Business and
Economics, 10(2), 24-31.

Distinguishing the factors influencing brand preference of selected
Mobile Phone in rural and semi-urban areas.
24 RIMS Journal of Management, Vol.4(I),Jan-July 2019
Chahal, A. (2013). Conational Drivers,
Mainly Advertisement Influencing
Brand Preference of Consumer
Durable Goods: An Experimental
Analysis in North India. International
Journal of scientific research and
management, 1(4), 241-250.
Chakraborty, S. (2015, June). Brand
Preference Of Consumers Towards
Selected Consumer Durables: A Case
Study Of Tinsukia Town. Indian
Journal of Research, 4(7).
Deepa, I. R. (2013). Impact of
advertisements on purchase decision
of youth with reference to consumer
goods. Advances in Management,
6(9), 36.
Dharmaraj, C., & Sivasubramanian,
M. (2011). A Study On Factors
Contributing Brand Preference Of
Passenger Car. International Journal
of Business Management Economics
and Information Technology, 320.
Fernandes, M. D. (2015). Customer
Preferences and Brand Awareness for
FMCG Products in Rural Market: An
Empirical Study on the Rural Market
of the Rajkot Region. "ASM‟s
International E-Journal.
Gupta, S. K., & Saxena, M. (2013).
Rural Consumer Behaviour: A
Challenge For Urban Marketers.
International Journal of Management
Research and Reviews, 3(2), 2479-
2484.
Hasan, A. (2014). Consumer Brand
Preference for Consumer Durable
Goods With Reference to Lucknow
District. International Journal of
Economics & Management Sciences,
4(1), 2.
Jha, M. (1988). Rural marketing:
Some conceptual issues. Economic and
political weekly, 23(9), M8-M16.
Keller, K. L. (1993). Conceptualizing,
measuring, and managing customer-
based brand equity. . The Journal of
Marketing, 1-22.
Murghai, A. R. (2015). Rural
Marketing Strategies Of Consumer
Durables In India. Shodhganga.
O'Connor, P. J., & Sullivan, G. L.
(1995). Market segmentation: A
comparison of benefits/attributes
desired and brand preference.
Psychology & Marketing, 12(7), 613-
635.
Pradhan, M. J., & Misra, D. P. (2014,
September). Rural Brand Awareness
and Preferences for FMCGs: An
Empirical Study on Keonjhar District
of Odisha, India. IOSR Journal of
Business and Management, 16(9), 17-
29.
Prakash, H. S., & Begum, M. (2008).
“Brand Awareness and Preferences
towards Fast Moving Consumer
Durables”, An Empirical Study with
Specific Relevance to Rural
Consumers of Mangalore District.

Distinguishing the factors influencing brand preference of selected
Mobile Phone in rural and semi-urban areas.
25 RIMS Journal of Management, Vol.4(I),Jan-July 2019
AIMS International Journal of
Management.
Rajeswari, R., & Pirakatheeswari, P.
(2014). A Study on Consumer
Behaviour and Factors Influencing the
Purchase Decision of Durable Goods
with Reference to Salem District.
International Research Journel of
Business and Management–IRJBM,
7(2), 10-18.
Rao, S. L. (1973). Rural Marketing of
Consumer Products. Economic and
Political Weekly, 8(34), M77-M79.
Retrieved from
http://www.jstor.org/stable/4362954
Rastogi, R., & Chaudhary, S. (2012).
Psychology and Buying Behaviour of
Rural Consumer with Special
Reference to Television, Washing
Machine and Refrigerator in the Rural
Areas of Meerut Region. International
Journal of Trade and Commerce., 1(2),
249-259.
Sarvana, S. (2010, May). “A Study On
Consumer Behaviour of Women With
Special Reference To Durable Goods
In Coimbatore City, Tamil Nadu”, .
40(5).
Sathya, P., & Vijayasanthi, C. (2013).
Consumer Behaviour towards
Consumer Durable Goods in
Thiruvarur District. International
Journal of Science and Research, 5(5).
Shende, V. (2014). Analysis of
research in consumer behaviour of
automobile passenger car customer. .
International Journal of Scientific
and Research Publications, 4(2), 1.
Singh, A. K., & Majumder, M. (2014,
June). Importance Of Brand
Awareness In Purchase Decision Of
FMCG Products For Consumers: A
Comparison Between Urban, Semi-
urban And Rural Markets.
International Journal of in
Multidisciplinary and Academic
Research (SSIJMAR), 4(3).
Stafford, J. E. (1966). Effects of group
influences on consumer brand
preferences. Journal of marketing
Research, 3(1), 68-75.
Subhadeep, C. (2016). Brand
Preference of Consumers for Select
Consumer Durables-A Study in Select
Muncipal Wards of Tinsukia Town.
International Journal on Customer
Relations, 4(2).
Sultana, S. (2015). Factors affecting
the consumer brand choice preference
towards new package of cellular
phone: A study on comilla region.
Global Disclosure of Economics and
Business. 4(2), 181-196.
Vijayalakshmi, G. T., & Manimozhy,
N. (2015). A Study On Brand
Preference Towards Smart Phone
Users In Thiruvarur District, Tamil
Nadu. International Journal of
Advanced Scientific Research &
Development, 163 – 168.
Metrics of Organizational Practices in Human Resource Management:
Selected perspectives from HR analytics
26 RIMS Journal of Management, Vol.4(I),Jan-July 2019
Dr. Indranil Bose
Dean-School of Business
University of Bolton, Academic Centre-Ras Al Khaimah
Al HudaibaBareraat, Ras Al Khaimah
United Arab Emirates
Email: [email protected]
Mobile: (+971)559860258
Abstract
Workforce analytics is presently considered as an important component of HR
analytics in business and industry. Many researches have been conducted on the
contribution of effective workforce analytics to broader achievements of HR
analytics in many industries. Workforce analytics have been found to be the key
indicators of different facets of the contemporary organizations such as
organizational hierarchy, number of functions or departments, understanding
organizational complexity, size of the organizations etc. Traditional measures of
organization structure such as span of control and tooth-to-tail ratio have also been
found to be widely used and many strategic decisions related to HR and
organizational strategies are related to it. Workforce analytics, has however, come
out of traditional measurement roles. New developments and models are now found
to be in great popularity, such as organizational shaping through pyramid ratios,
and predictive analysis etc. The other developments in the field, those have
significantly contributed in recent times are ensuring organization shaping through
employee growth analysis, developing and using analytical techniques to measure
softer aspects of the organization structure and collaborating organization
demographics and succession planning through several pyramids and ratio models.
All these developments in the field of workforce analytics have offered the
opportunities to the organizations to quantify many present and future
developments and possibilities of framing other relevant decisions pertaining to HR
in more accurate and scientific manner. The present paper presents conceptual
reflections on all these developments and an attempt has been made to explore
their relevance to make HR more competitive and strategically equipped in the
present business scenario.
Key words: Workforce analytics, span of control, tooth-to-tail ratio, pyramid ratios,
predictive analysis, employee growth analysis, softer aspects, organization
structure, measurements, HR analytics, conceptual study.

Metrics of Organizational Practices in Human Resource Management:
Selected perspectives from HR analytics
27 RIMS Journal of Management, Vol.4(I),Jan-July 2019
Introduction:
Organization structure is unique to
every organization. Unlike HR
processes, it does not easily allow
itself to be measured for efficacy.
However, improving a process
produces benefits that are much
localized. On the other hand, any
improvement using analytics in the
organization structure has greater
leverage across the organization.
However, different factors inherent of
the organization structure such as the
number of levels, the number of
functions or departments,
organization complexity and size of
the organization play significant role
in effective use of analytics.
Traditional measures of
organizational structure:
Traditionally, organizations have been
using two measures for assessing the
health of their organization. These are
management of span of control and
tooth-tail-ratio in
staffing.Management of span of
control can be simply put as the
average number of employees
managed by a manager. It can be
arrived at this by simply dividing the
total headcount by the number of
people designated as managers. For
example, if a company has 100
employees and 10 managers, the
management span of control is
100/10=10. Companies arrive at this
ratio and set goals to improve it on an
ongoing basis. For example, if the
ratio is 1:6.4 today, it should become
1.7 tomorrow. This is based on the
underlying assumption that there is a
good range for the ratio and one
should strive to be within that range.
In the 1990s, V.A. Graicunas created a
formula to identify a desirable span of
control. He estimated the span of
control based on relationships. As per
his opinion, every manager not only
has to manage the direct relationship
with each team member, but also the
relationships between themselves and
the group. The study finally shown
that when all these are added up, the
manager would find it difficult to
handle more than six reports in any
situation (Soundararajan& Singh,
2017).With time, attempts have been
made to recalibrate this approach,
such as 1:20 ratio in the situation of
assembly line production, where
management supervision is minimal
or 1:4/1:5 ratio in research and
development set up, where close
supervision is necessary. Neilson and
Wolf (2012), in their research have
shown that in the same industry, the
ideal management span of control may
vary based on different situations such
as nature of responsibilities,
characteristics of the subordinates etc.
The same study has given examples
from service industries managerial
levels. The examples have shown that

Metrics of Organizational Practices in Human Resource Management:
Selected perspectives from HR analytics
28 RIMS Journal of Management, Vol.4(I),Jan-July 2019
CEO span of control in the US has
increased from five direct reports in
1986 to 10 in 2006. Richard and
Nickson (2016)have however identified
1:7/1:8 as the magic ratio for optimal
reports.
Tooth-to-tail ratio, though is widely
used in armed forces to determine the
staffing levels (such as combat
personnel or tooth to non-combat
personnel or tail) for long time,
corporates have also started to use the
concept on practical grounds. In
corporates, such classification has
been generally done between typical
business functions (sales,
manufacturing, customer support etc.)
and typical enabler functions (finance,
legal, HR, quality assurance etc.).
According to Richard and Nickson
(2016),such classification matters
significantly for maintaining healthy
organization as the decisions related
to workloads, organization structures,
business strategies and finally the
financial health are directly related to
it. A study on the banking industry in
Europe has shown that in most of the
organizations 8%-12% range of head
counts were employed in enabler
functions, whereas 85%-90%
headcounts fell in the business
functions category (Smith and Rao,
2014).The study further described the
tendency of reducing the headcounts
in both categories to manage costs and
in the process many enabler as well as
business functions got outsourced.
Soundararajan& Singh (2017)have
highlighted the importance of tooth-to-
tail ratio in an organization not only
for head counts, but also for pay-roll
purposes. According to their opinion,
an optimum organization needs to be
decided on the basis of business
requirements, without providing a
buffer.
Emerging structural
measurements and organizational
competitiveness:
Different structural measurements for
organizational competitiveness have
become common phenomena in
present business scenario. It has been
found that organizations are
emphasizing on different pyramid
ratios and predictive analysis has
emerged as a major tool in this regard.
Organization shaping through
pyramid ratios is now widely used as
every organization has the inherent
preference towards attaining pyramid
structure. As per Soundararajan&
Singh (2017),every organization talks
numbers and in the process two
dimensions suffice. Thus a triangular
structure emerges and the reference of
pyramid structure becomes relevant.
According to them, this logic seems to
be simple, though it might be difficult
to arrive at an exact proportion of each
level of employment. Following
example can depict the picture of a

Metrics of Organizational Practices in Human Resource Management:
Selected perspectives from HR analytics
29 RIMS Journal of Management, Vol.4(I),Jan-July 2019
pyramid, with length of the lines
equivalent to percentage headcount
(refer table 1).
Table 1: Percent headcount in each
role
Role Role ratio Role as a
percentage
of lower role
Role as a
percentage
of lowest
role
Engineer 48% NA -
Sr.
Engineer
27% 1.1.8 1: 1.8
Lead 13% 1: 2.1 1:3.7
Project
Manager
6% 1:2.2 1: 8
Manager 3% 1:2 1:16
Senior
Manager
2% 1:1.5 1:24
Director 1% 1:2 1:48
Source: self prepared.
In the above table, the percentages
indicate the percent headcount in each
role.
Role as a percentage of lower role=
Percentage headcount in a role (Senior
Engineer)
Percentage headcount in the target
role (Lead)
The above formula shows 27/13= 2.1,
which indicates there are 2.1 senior
engineers for every lead. This
validates the fact that the
organization has a tapering pyramid.
Likewise, for every project manager,
the number of engineers can be found
as follows:
Role of percentage of lowest role=
Percentage headcount in entry level
(engineer)
Percentage headcount in the target
role (project manager)
The above formula shows 48/6=8,
which indicates for every project
manager, 8 engineers can be found.
This definitely shows a healthy
organization trend. If it were 2, then
the company has far too many project
managers.
It can be found from the above
examples that the ratios nearly double
at each level. It can be equated to a
progression of 2,4,8,16,32 and 64.
According to Richard and Nickson
(2016), each organization has very
different ratios based on their stage of
growth and internal mobility. They
further added that most of the
manufacturing organizations apply
workforce ratios and that too
primarily in their white colour staffs.
In their observations every company,
after a point of time, sets up internal
universities (learning system) to
recruit fresh graduates from college to
maintain their pyramid ratios and as
far as possible have talent grown from

Metrics of Organizational Practices in Human Resource Management:
Selected perspectives from HR analytics
30 RIMS Journal of Management, Vol.4(I),Jan-July 2019
within. They further added that there
was a stage in the IT industry, where
more than 60% of the workforce was
composed of entry-level engineers.
This led to a structure that looked like
a triangle with its bottom stretched,
which was not a ideal structure.
As per Soundararajan& Singh (2017),
in a healthy organization, it is natural
that the role ratios between a level
and the one above it are usually more
than1, which denotes that in the
organization, not everyone gets
promoted automatically.
Predictive analysis is found to be
another important and growingly
popular method to shape the
organization and that in turn are
ensuring better measurability of the
organization. Better measurement of
the organizations is also contributing
towards growing organizational
competitiveness. Organization shaping
through predictive analysis is the
technique, by which organizations’
shapes are defined through prediction
of future manpower needs and their
supplies. According to Kelvin and
Rutledge (2017), there are two main
predictive analysis, those found
responsible for shaping the structure
of the organizations. These are (1)
determining the way/ways by which
an organization stays on the pyramid
ratios and (2) measuring the role of
replacement ratios. One obvious
example of determining the way/ways
by which an organization stays on the
pyramid ratios is growing talent
internally and restricting hiring
strictly to entry levels. This way, there
are always people coming in through
the ranks. The example of measuring
the role of replacement ratios can be
given in the following manner.
Assume that a company has an
attrition of 10%. Then, it needs to
replace that extent of headcount.
Where there are internal successors
identified, people are moved into these
roles. Otherwise, external hiring
remains the second big source for
replacement hiring. Soundararajan&
Singh (2017) have divided
replacement hiring into the following
categories: replacement hired at a
higher level, replacement hired at a
same level and replacement hired at a
lower level. According to them, one
organization needs to review each
position and to make sure that at least
a quarter of the positions annually are
replaced at a level less than the
person leaving the job. They have
further recommended that a review on
how many % of positions are backfilled
at the same level, should be the part of
the practice. The comment by Richard
(2009) can be taken into consideration,
where he observed that in an effective
and competitive organization should
encourage to backfill at least 25%

Metrics of Organizational Practices in Human Resource Management:
Selected perspectives from HR analytics
31 RIMS Journal of Management, Vol.4(I),Jan-July 2019
positions at the lower level. Based on
such observations, two types of
organizational shapes have been
shown. The most common one is of
pyramid shape, where each level has
lesser people than the level below
that. The other common type of the
shape is the combination pattern,
where at most of the levels, there are
lesser people than the level below and
in some levels the opposite trend is
also possible. The second type of
organizational shape has been linked
to certain developments. For example,
in a multi-national organization with
operations in a country
The HR might not have the liberty to
hire trainees from campus at each
levels due to practical constraints.
Though, many of the new hires tend to
grow towards above positions within
short time. In such cases, the company
shifts from a ‘default lateral hire’ to
‘default grow from within’. The shape
of the company then becomes a mixed
structure (Refer table 1).
Table 1: Organizational structure
based on mixed/combined hiring
approaches
Year 1
Level Numbers Internal
growth
External
hire
IC 30 30
Lead 50 10 40
Manager 20 05 15
Year 2
IC 60 60
Lead 70 40 30
Manager 30 15 15
Year 3
IC 100 100
Lead 80 60 20
Manager 40 32 8
Source: self made
The above table shows that the
company has grown from a head count
of 100 to 220 over a 3-year period.
However, it has consciously changed
the pyramid shape from the shape
that was bulged in the middle.
According to Richard (2009), such a
strategy also provides for a conscious
and optimal mix of internal
promotions versus lateral hiring. He
further said that coming out of
traditional conservative approach and
adopting such mixed and combined
approach clearly indicates greater
competitiveness of the workforce in
many industries.
Organization shaping and
employee growth:
Employees prefer their organizations
to provide considerable career growth.
However, the situation becomes
challenging, when, an organization is
in a growth industry and is growing as
well as it’s competitors. Here in such
as situation, even the company has
the ideal pyramid, it still needs to
have a good distribution of employees
within the level. Guy and Thomas
(2010) in their study have identified
the challenges of HR of shaping the
organizations and ensuring employee
growth. They further added that in the

Metrics of Organizational Practices in Human Resource Management:
Selected perspectives from HR analytics
32 RIMS Journal of Management, Vol.4(I),Jan-July 2019
situation of employees demand for a
career move, every 2-3 years, HR
should share not just the career path
but also the time expected for each
progression for average performance
and company growth rate. Then, for
satisfying employee aspirations, the
HR should review the population
distribution within each level. They
have described an ideal situation in
the book (Refer table 2).
Table-2: Career move model 1 Level Tenure in level Numbers
Engineer 0-2 50
2-3 25
Lead 0-2 50
2-3 20
3-4 10
Manager 0-3 30
3-4 10
4+ 10
Source: Guy and Thomas (2010)
It can be found from the above table
that how subsequent positions become
vacant and the career move goes on.
Here, the structure remains the
pyramid one and employee growth can
be cascaded down the path.
Guy and Thomas (2010) have also
given examples of top heavy
organizations and their impact on
employee growth in the organizations
(Refer table 3)
Table 3: Career move model 2 Level Tenure in level Numbers
Engineer 0-2 40
2-3 25
Lead 0-2 20
2-3 30
3-4 10
Manager 0-3 15
3-4 30
4+ 20
Source: Guy and Thomas (2010)
The organization, shown above in the
study of Guy and Thomas(2010) can be
considered as relatively top heavy. It
is found that of the 50 manager
aspirants, only 15 are promoted. For
the 15 vacancies, there are 40
aspirants at the lead level and then
there are 25 aspirants for 15 positions
in the lead level.
Given that this shape has been
created based on ad-hoc hiring, the
company will tend to loose more
employees at the lower levels as they
have gained competencies of a higher
level in their role and they could easily
move to the next level in other
companies. According to Stuart and
Johnson (2012), organization shaping
then drives employee growth, when we
do not analytically review the staffing
plans holistically and attrition
becomes an issue in the future.
Ensuring competitiveness by
measuring the softer aspects of
organization structure:
Though the organization structures
look neat on the computer display, but
in reality, they are filled by people
who interact with each other.
According to Soundararajan& Singh
(2017),perception of the organization

Metrics of Organizational Practices in Human Resource Management:
Selected perspectives from HR analytics
33 RIMS Journal of Management, Vol.4(I),Jan-July 2019
structure plays an important role in
enabling the success of the structure
in specific and of the employees in
general. They have further opined
that, it is possible to measure some of
these as a one-off exercise and identify
focus areas. For example, in a
company with lots of matrix reporting
relationships, one can identify the
number of employees with matrix
relationships and employees who are
matrixed to more than two managers.
Both are indicators of organizational
complexity and need to be observed.
Here, employee surveys are found to
be most commonly used methods to
capture all perception feedbacks in
companies. Most of the scholars have
opined that by using all these
workforce related analytics, the
organizations can become more
competitive over the years. According
to Stuart and Johnson (2012), such
enhanced competitiveness have been
found in cost aspects, in enhanced
employee motivation and reduced
attrition and in the development of
future proof staffing plans.
Organization demographics and
succession planning:
Often countries are analyzed on their
population distribution. For example,
Europe and Japan have aging
populations, while India and China
still have relatively younger
population. India has the world’s
youngest population which will
remain so for the next 10-15 years.
Analysis refer to this as the
demographic dividend. Same is the
trend in the countries like China,
Taiwan etc. In these countries, most of
the organizations, specially in
technology based industries,
organizations are investing money and
making long term plans to retain their
young employees. Succession planning
has become more important tool here.
Japan has a different distribution of
population. 40-44 and 65-69 are the
biggest age groups there. Just looking
at the demographics, the situation
tells us that the nature of people
problems in Japan and India are
totally different. While coming across
some manufacturing organizations,
where average age is in the high 40s,
low attrition is the main feature of the
workforce and HR priorities are
changed. Therefore, succession
planning needs to become a
phenomenon, where both the
incumbents as well as successors are
found to be of same age group and are
likely to retire at the same time.
Therefore succession planning
remains a major area of concern,
which has derived from age
distribution. Gender distribution has
also been identified as major factor for
determining succession planning
(Mary and Rehan, 2014).They have
observed that even in studies of

Metrics of Organizational Practices in Human Resource Management:
Selected perspectives from HR analytics
34 RIMS Journal of Management, Vol.4(I),Jan-July 2019
gender diversity, same issues come up.
Soundararajan& Singh (2017) in their
studies have therefore related the
issues of measuring softer aspects,
measuring demographics etc. as some
of the preconditions of effective
workforce analytics. According to the,
any such effective analytics can result
in forecasting of appropriate
organizational structures,
organizational shapes and sizes
leading to more competitive
organizations.
Some recent observations on
effectiveness of competitive
analytics:
Different techniques and intricacies
have been attempted to be discussed
in the above deliberations. However,
the level of effectiveness and the scale
of application of such applications for
work-force analytics in industry has
remained a subject of discussion and
academic review. One school of
researchers have opined that
workforce analytics has not only
changed the perspectives of strategic
decision thinking, but also influenced
the overall practices of HR discipline
(Singh and Rozario, 2014; Freeman et.
al, 2015; Welinker and Raman,
2016;Johnson and Douglas,
2016).Another group of scholars have
adopted more cautious approach.
According to Mary and Rehan
(2014),Sebastian and Monroe
(2015),Rubaini (2015),as a part of HR
analytics, workforce analytics has
remained a major supporting
instrument but not the strategic tool
itself. Many of them have further
observed that the practice of workforce
analytics is still at a very nascent
state and lot of interventions are yet
to come.
Conclusion:
The above discussions have remained
limited to conceptual deliberations
related to different aspects of work-
force analytics and its applications
through measuring organizational
shapes and structures through the
numbers of levels and layers, number
of functions or departments, through
organizational complexities, size of the
organizations etc. The practice of
workforce analytics to determine the
organizational effectiveness and
competitiveness has been found to
emerge an area of robust
experimentation. More and more
studies are expected on the domain in
future. The present study can also be
improved by adding more advanced
applications and priorities of the
workforce analytics in future. An
element of empiricality can be a more
practical approach in that context.
Metrics of Organizational Practices in Human Resource Management:
Selected perspectives from HR analytics
35 RIMS Journal of Management, Vol.4(I),Jan-July 2019
References:
Freeman A., Robert. K.L. & Smith,
J. (2015), Structural determinants
of organizational competitiveness,
International Business Strategy
Review, Vol. X Issue 1, pp. 23-29
Guy, F. and Thomas, D. (2010),
The theory of the growth and
competitiveness in farm
management, International
Journal of Sustainability, Vol. 34
No.2, pp. 654-677
Johnson, T. and Douglas, C.(2016).
Kelvin, J. and Rutledge, S.T.
(2017), Derivatives and analytics:
the strategic perspectives, Journal
of IT and Management, Vol. 10
No.6, pp. 56-78
Mary, J. and Rehan, C. (2014), War
for talent and HR analytics,
Journal for Human Capital, Vol. 8
No. 1, pp. 451-463
Neilson, G. & Wolf, J (2012), How
many direct reports? , Harvard
Business Review
Richard, J. (2009), How an
organization is shaped with HR
policy? Human Resource
Management and Strategic
Review, Vol. 6 No. 1, pp. 190-214
Richard, G. and Nickson, K. (2016),
How analytical the decision may
be: an HR experience, Journal of
Business and Entrepreneurship,
Vol.30 No.4, pp. 341-357.
Rubaini, A. (2015),The art of
human capital management,
Boston, MA: Aberdeen Press LLC.
Sebastian, v. and Monroe, R.
(2015), Structure is not
organization, Business Horizons,
Vol 29 No. 2, pp 19-29.
Singh, J. and Rozario, D. (2014),
HRD: using analytics to plan and
optimize the organizational
competitiveness, Journal of Human
Resource Management and
Business Strategy, Vol. 10 No. 1,
pp. 510-532
Smith, A. and Rao, R (2014), HR
analytics and business
competitiveness, International
Journal of Strategy and Systems,
Vol. 30 No.1, pp. 230-243
Soundararajan, R & Singh, K
(2017), Winning on HR Analytics:
Leveraging data for competitive
advantage, 1st edition, Sage
Stuart, R. and Johnson, A. (2012),
Trends in workforce analytics,
Journal of Kenan-Flagler Business
School, Vol. 6 No.1, pp. 67-74
Welinker, E. and Raman, R.(2016),
Trends of HR analytics, Journal of
Strategy, Vol. 52 No. 4, pp. 700-716
Transformational Leadership – The Need of the Hour?
36 RIMS Journal of Management, Vol.4(I),Jan-July 2019
Mr. Prasad L,(Ph.D), MBA, B.E.
Research Scholar& Assistant Professor
Ramaiah Institute of Management Studies/Sciences
No. 15, New BEL Road,MSRIT Post, M S Ramaiah Nagar,Bangalore 560054
Email.id: [email protected]
Mobile : +91 98441 28846
Dr. Noor Firdoos Jahan, Ph.D
Professor
R. V. Institute of Management
CA 17, 26th Main, 36th Cross, 4th T Block, Jayanagar, Bangalore 560041
Abstract
What is Leadership, and who is a Leader? How important is Leadership in steering a company
towards success? Which type of Leadership style is most suitable for leading a company to
success? Are Leaders born or made?
The above are just a few of the questions that but naturally come up in the minds of students
and practitioners of management. The simplest definition of a Leader is that“A leader is one
who has followers”. Without followers, there is no leader – a simple yet practical truth. But, if
the Leader does not possess certain qualities that inspire and motivate the followers, they will
not follow him. From this perspective, a Leader has to treat the initial followers as equals, and
once he has sufficient followers, nurture them. Another notion attached to Leaders and
Leadership is that Leaders need to have a Vision. Henry Kissinger has famously said that “the
task of the leader is to get his people from where they are to where they have not been”.
Leadership as a subject has been studied over the last 100 years or more. From the initial
theories of leadership such as the “Trait Approach” to “Transformational Leadership”, various
theories have thrown light on the subject of leadership and have contributed to a better
understanding of leadership. Some of the popular leadership theories are: Trait Approach,
Skills Approach, Style Approach, Situational Approach, Contingency Theory, Path-Goal
Theory, Leader-Member Exchange Theory, Transformational Leadership, Servant Leadership,
Authentic Leadership, Team Leadership, and Psychodynamic Approach.
This conceptual research paper focuses on “Transformational Leadership” – a theory which is
fast gaining acceptance the world over as one of the most effective theories in leadership.
Whilst discussing Transformational Leadership, this paper also throws light on related types of
Leadership – Transactional Leadership, and Laissez-Faire Leadership (Passive Avoidant
Leadership). Transformational Leadership is all about changing and transforming followers.
Key words:leader, leadership, leadership theories, transformational leadership, leadership
styles
Transformational Leadership – The Need of the Hour?
37 RIMS Journal of Management, Vol.4(I),Jan-July 2019
Introduction
The 21st century has thrown various
challenges to the business world,
including the threat of disruptive
technologies such as Artificial
Intelligence, Machine Learning,
Robotics, Blockchain, Analytics,
Internet of Things, Design Thinking,
etc. As a result, businesses are being
forced to adopt these technologies
and skill/re-skill their workforce in
order to be able to compete in the
market place and sustain themselves
in the long run. Moreover, of late, we
are seeing a shift from Globalization
to Nationalism, thereby impacting
businesses which are heavily
dependent on global markets for
their revenues and survival. In such
a complex and dynamically changing
business environment, the role and
importance of the leader has come
under scrutiny. On the one hand,
technology is making certain
categories of jobs obsolete (especially
low level jobs which are repetitive in
nature and don’t require too much of
human intelligence), and on the
other hand, leaders are expected to
deliver more from less. How does the
leader inspire/motivate his followers
to deliver more than what they were
expected to? Adapting a
Transformational Leadership style
could be the answer and the need of
the hour.
Transformational Leadership is a
relatively new approach to
leadership and has been one of the
current and most popular
approaches to leadership since the
1980s. The Multifactor Leadership
Questionnaire (MLQ), also known as
Form 5X-Short, evaluates three
different leadership styles:
Transformational, Transactional,
and Passive-Avoidant.
Leaders can measure how they
perceive themselves with respect to
specific leadership behaviours using
the Leader/Self form. But, the crux of
the Multifactor Leadership
Questionnaire is in the Rater form
where subordinates rate the leader
on specific leadership behaviours.
The Multifactor Leadership
Questionnaire is based on the 360
degree feedback method and has 45
items which are rated on a 5-point
behavioural scale.
The instrument has been extensively
researched and validated. It has
been used in thousands of research
papers, doctoral dissertations, and
master’s theses.
3.0: Literature Review
3.1: Leadership
The reference to various theories on
Leadership in this section have been
taken from a book titled “Leadership:
Theory and Practice” by Peter G.
Northouse (2012).
Across the world, business
corporations are always on the
lookout for people with leadership
ability due to the belief that such

Transformational Leadership – The Need of the Hour?
38 RIMS Journal of Management, Vol.4(I),Jan-July 2019
people have special assets that
improve the bottom line of the
corporations.
Northouse puts forth in his book that
the various research findings on the
topic of Leadership provide insight
that is vastly different (more
sophisticated and complex) from the
simple views of Leadership found in
popular books on Leadership.
The definition of Leadership has
evolved greatly over the last 100
years and more. At the beginning of
the twentieth century (1900-1929),
Leadership was looked upon as
control and centralization of power,
with domination over followers being
a common theme.
During 1930-1940, researchers
focused on the traits of a leader and
looked at leadership as being able to
influence followers rather than
dominate them. The 1940s saw a
shift in the focus of research on
Leadership – from traits of leaders to
how leaders behave while leading
and directing group activities.
In the 1950 and 1960s, we saw
researchers continuing to support
the group approach, and added a few
more dimensions - like leaders
developing a relationship with
followers while developing shared
goals of the organization and the
effectiveness of the leader.
The 1970s were influenced by the
Organizational Behaviour approach,
wherein the ability of leaders in
initiating and maintaining groups or
organizations towards achieving the
group or organization’s goals were
taken into account.
Towards the end of the twentieth
century (1980-2000), the focus
shifted back to dominating the
followers (do as the leader wishes),
having an influence over them and
on the traits of the leader. For the
first time, researchers started
looking at transformational
leadership (the ability of leaders to
charge and transform people).
Northouse argues in his book that
even after a century of research on
Leadership, in the twenty first
century, there is still no agreement
on a common definition of
Leadership. But, for the sake of
convenience he defines leadership as
“Leadership is a process whereby an
individual influences a group of
individuals to achieve a common
goal”
In the last sixty years, there have
been sixty five different classification
systems to define the dimensions of
leadership.
A few components that are at the
core of the phenomenon of leadership
are that leadership is a process that
involves leaders having an influence
over a group of followers in achieving
common goals.

Transformational Leadership – The Need of the Hour?
39 RIMS Journal of Management, Vol.4(I),Jan-July 2019
Though there are sixty five different
classification systems to define
leadership, only twelve leadership
theories have been reviewed in this
study. The selection of these twelve
leadership theories was based on the
extent of research done on these
theories, their popularity and
practical applicability in the real
world. The leadership theories that
have been reviewed in this study are:
Trait Approach, Skills Approach,
Style Approach, Situational
Approach, Contingency Theory,
Path-Goal Theory, Leader-Member
Exchange Theory, Transformational
Leadership, Servant Leadership,
Authentic Leadership, Team
Leadership, and Psychodynamic
Approach.
Comparison of Leadership
Theories
Having reviewed the various theories
on leadership, it is important to
compare the various theories from a
standpoint of which leadership
theory would be used for the purpose
of research in this study. Table 3.1
compares the various theories of
leadership.
Table 3.1: Comparison of Leadership
Theories Sl.
No Theory
Central
Theme
Strengt
hs
Weakness
es
1 Trait
Theory
Leaders
are born
with
leadership
traits
Backed
by
extensi
ve
researc
h
Does not
link traits
with
leadership
outcomes
2 Skills
Approach
Leadership
skills and
abilities
can be
learned
Include
s a
wide
variety
of
compon
ents of
leaders
hip
Too broad.
Beyond
the
dimension
s of
leadership
skills
3 Style
Approach
Focuses on
the
behaviour
of leaders
Has
great
validity
and
credibil
ity
Does not
link
leadership
styles with
leadership
outcomes
4 Situationa
l Approach
Adaptabilit
y of leaders
based on
situation
Very
practic
al
approa
ch and
has
stood
the test
of time
Not
backed by
extensive
research
5 Contingen
cy Theory
Matching
leadership
skills with
the right
setting
Is
support
ed by
extensi
ve
empiric
al
researc
h
Does not
address
the
mismatch
between
leaders
and
situations
6 Path-Goal
Theory
Motivating
followers
to achieve
goals
Is very
practic
al in its
approa
ch
Is complex
and
confusing.
Has
received
partial
support in
empirical
research
7 LMX
Theory
Interaction
between
leader and
follower
Is a
very
strong
descrip
tive
theory
Measurem
ent of
Leader-
Member
Exchange
is
questiona
ble
8 Transform
ational
Leadershi
p
Changing
and
transformi
ng
followers
Widely
researc
hed
and
has
proven
effectiv
eness
Poor
validity
for
measurem
ent of
Transform
ational
Leadershi
p
9 Servant
Leadershi
p
Putting
followers
before self
Only
theory
that
focuses
No
common
definition
or

Transformational Leadership – The Need of the Hour?
40 RIMS Journal of Management, Vol.4(I),Jan-July 2019
on
followe
rs
framework
for
Servant
Leadershi
p
10 Authentic
Leadershi
p
Focuses on
whether
leadership
is genuine
and real
Meets
the
need
for
trustwo
rthy
leaders
hip
Is still in a
formative
stage
11 Team
Leadershi
p
Focus on
working in
teams and
shared/dist
ributed
leadership
Is in
tune
with
today's
reality
Is complex
and does
not have
an
exhaustive
list of
Team
Leadershi
p skills
12 Psychodyn
amic
Approach
Focuses on
the
personality
types of
leaders
Is
univers
al in its
approa
ch
Has
limited
use in
practice
3.2: Transformational
Leadership
Transformational Leadership is a
relatively new approach to
leadership and has been one of the
current and most popular
approaches to leadership since the
1980s. This approach is an integral
part of the New Leadership
paradigm, which includes gives more
attention to the charismatic and
affective elements of leadership.
Transformational Leadership aims to
change and transform people and
deals with emotions, values, ethics,
standards, and long term goals. This
leadership approach includes making
an assessment of the follower’s
motives, satisfying their needs, and
treating them as full human beings.
Transformational Leadership is all
about the leader influencing the
follower to achieve more than what is
expected from them by making use of
charismatic and visionary
leadership.
When a leader focuses on his
interests rather than on the interests
of his followers, it is termed as
pseudo-transformationalleadership.
When leaders put the interest of
others over their interests, such
leadership is termed as socialized
leadership.
Transformational Leadership is
different from Transactional
Leadership. Transactional
Leadership focuses on the exchange
that happens between leaders and
followers, whereas Transformational
Leadership is all about the leader
engaging with a follower and
influencing him to achieve more than
what he is capable of.
Transformational Leadership has
often been compared to Charismatic
Leadership, in terms of similarities
between the two approaches.
Some researchers have viewed
Transformational and Transactional
Leadership as being part of the same
continuum, as depicted in Figure 3.1.
Figure 3.1: Leadership
Continuum from Transformation to
Laissez-Faire Leadership

Transformational Leadership – The Need of the Hour?
41 RIMS Journal of Management, Vol.4(I),Jan-July 2019
Transformational Leadership and
Transactional Leadership are best
described by the Model of
Transformational and Transactional
Leadership (Table 3.2).
Table 3.2: Model of Transformational
and Transactional Leadership
The seven factors that are
incorporated in Transformational
and Transactional Leadership are
also depicted in the Full Range of
Leadership Model (Figure 3.2).
There have been other perspectives
on characteristics of
Transformational Leadership:
visionary, social architect, creating
trust, and creative deployment of self
(Bennis and Nanus) and model the
way, inspire a shared vision,
challenge the process, enable others
to act, and encourage the heart
(Kouzes and Posner)
Figure 3.2: Full Range of Leadership
Model
Legends used in Figure 3.2
LF Laissez-Faire
MBE Management by Exception
CR Contingent Reward
IC Individualized Consideration
IS Intellectual Simulation
IM Inspirational Motivation
II Idealized Influence
Strengths of Transformational
Leadership
The Transformational Leadership
approach has an intuitive appeal and
has been widely researched from
many different perspectives. The
approach gives a lot of importance to
the follower’s needs, values, and
morals. Based on research, it can be

Transformational Leadership – The Need of the Hour?
42 RIMS Journal of Management, Vol.4(I),Jan-July 2019
said that there is enough evidence to
prove that Transformational
Leadership is an effective form of
leadership.
Criticisms of Transformational
Leadership
Some critics feel that this approach
lacks conceptual clarity and that the
measurement of leadership has very
poor validity.
The approach looks at leadership
from a personality trait point of view
rather than from a behaviour point
of view. The approach does not
establish a causal link between
transformational leaders and how
they are able to bring about change
in the followers.
Leadership Instrument
The Multifactor Leadership
Questionnaire (MLQ), also known as
Form 5X-Short, evaluates three
different leadership styles:
Transformational, Transactional,
and Passive-Avoidant. Leaders can
measure how they perceive
themselves with respect to specific
leadership behaviours using the
Leader/Self form. But, the crux of the
Multifactor Leadership
Questionnaire is in the Rater form
where subordinates rate the leader
on specific leadership behaviours.
The Multifactor Leadership
Questionnaire is based on the 360
degree feedback method and has 45
items which are rated on a 5-point
behavioural scale. The instrument
has been extensively researched and
validated. It has been used in
thousands of research papers,
doctoral dissertations, and master’s
theses.
Famous personalities with
Transformational Leadership
styles
Some of the transformational leaders
the world has seen are: Alexander
the Great, Michael Bloomberg,
Richard Branson, Buddha, Andrew
Carnegie, Fidel Castro, Coco Chanel,
Jesus Christ, Winston Churchill,
John Deere, Walt Disney, Henry
Ford, Benjamin Franklin, Sigmund
Freud, Bill Gates, Samuel Goldwyn,
Adolf Hitler, Lee Iaccoca, Steve Jobs,
Herb Kelleher, Martin Luther King,
Dalai Lama, Vince Lombardi, Nelson
Mandela, Douglas McArthur, Elon
Musk, J. Pierpont Morgan, David
Ogilvy, David Packard, J. C. Penney,
Howard Schultz, Charles Schwab,
Alfred Sloan, Sun Tzu, Sam Walton,
and Muhammad Yunus (Murray
Johnson, March 2014)
Review of Empirical Studies
The doctoral thesis titled
“Anexamination of the relationship
between emotional intelligence,
leadership styles and leadership
effectiveness”, submitted by Mr.
BadriNath to Jaypee Institute of

Transformational Leadership – The Need of the Hour?
43 RIMS Journal of Management, Vol.4(I),Jan-July 2019
Information Technology, Noida
(India) on 25-10-2013 was reviewed
as it was found to be closely related
to the research topic.
The objectives of the study was to
study the relationship between
emotional intelligence of leaders and
their leadership effectiveness,
transformational leadership style,
transactional leadership style, and
passive avoidant leadership style.
The research design used in the
study was descriptive research. The
researcher chose a quantitative
method as he wanted to establish a
measurable relationship between the
variables. The survey data was
analyzed using a two-step structural
equation model (SEM).
The researcher conducted the study
using a sample of 156 managers and
312 subordinates, working for
software companies in the National
Capital Region (NCR), India. The
Emotional and Social Competency
Inventory (ESCI) rating version was
used for measuring the manager’s
emotional intelligence and the
Multifactor Leadership
Questionnaire (MLQ) 5x (Rater
Form) was used to measure the
manager’s leadership style and
leadership effectiveness.
The researcher has tested the
hypotheses using SPSS, and AMOS
was used to develop development
and structural models.
According the results of the study,
the researcher has concluded that a
statistically strong positive
relationship exists between
emotional intelligence of a leader
and his effectiveness,
transformational leadership style,
and transactional leadership style.
The study also establishes a
significant negative relationship
between a leader’s emotional
intelligence and his passive avoidant
leadership style.
Objectives of the study
The objectives of this study are to:
Understand Transformational
Leadership
Make recommendations for
further research on this topic
Research Methodology
This research paper is qualitative
and exploratory in nature. Data has
been collected from secondary
sources, by doing extensive literature
review on the topics leadership. The
secondary data has been collected
from published sources such as the
Internet, and articles published in
journals.
Data analysis and interpretation
Some of the key learning, analysis,
and interpretation from the review of
literature can be summarised as
follows:

Transformational Leadership – The Need of the Hour?
44 RIMS Journal of Management, Vol.4(I),Jan-July 2019
The review of literature has
revealed views of leadership
ranging from simple to
sophisticated and complex
Leadership has evolved, from the
initial days of having control and
domination over followers, to
changing and transforming
followers
There is no common definition of
leadership
Transformational Leadership is
an integral part of the New
Leadership Paradigm, which
focuses on the charismatic and
affective elements of leadership
Transformational Leadership is
being compared and equated to
Charismatic Leadership due to
the similarities in notions and
approaches of the two types of
leadership styles
There is sufficient evidence to
prove that Transformational
Leadership is a highly effective
form of leadership, based on the
thousands of instances where
researchers have used the
Multifactor Leadership
Questionnaire to study the
leadership styles of the
respondents
Conclusion
The research paper has made an
attempt to present an overview of
Transformational Leadership and
highlighting its importance in the
world of business. However, since
this is a paper which is qualitative
and explorative in nature, it does
not offer empirical evidences to
prove that Transformational
Leadership is indeed an effective
form of leadership, thus paving
the way for future researchers to
delve more in detail into this topic.
References
1. Peter G. Northouse, “Leadership:
theory and practice”, Sage
Publications, 2012
2. BadriNath, “An examination of
the relationship between
emotional intelligence, leadership
styles and leadership
effectiveness”, 2013
3. Murray Johannsen, “125
transformational leaders: list of
famous ones from many
countries”,
https://www.legacee.com, 2014
Mentoring for Professionalism
45 RIMS Journal of Management, Vol.4(I),Jan-July 2019
Mentoring for Professionalism
Professionalism, the buzz word in
today’s Business and Social
environment is defined as “The
combination of all the qualities that
are connected with trained and skilled
people that can apply their thoughts
and actions with great sense of
equanimity and purposeful tactic”. It
provides a guideline and underlines an
approach that can help others easily
understand and accept a person’s
matured behaviour with great
appreciation even amidst chaos and
difficult situations. In the business
world, it can be seen as an approach
that enables an employee to achieve
his fullest potential and maximise the
results, while being fair in a justifiable
manner as may be relevant for that
situation. This, when practiced with a
sense of purpose, ensures profound
clarity for everyone who is connected
with that person or the process or the
situation thus making it easy to adopt
and gives no room for doubts or
suspicion in terms of the means as
well as the outcome. Professionalism
is also a “Test of Character and
Dr. Radha.R, M.Com., M.Phil. ACS., Ph.D
Professor,
Ramaiah Institute of Management Studies, (RIMS)
# 193 , New BEL Road, MSRIT Post, MS Ramaiah Nagar,
Bangalore 560054
Phone: 98802 10716
E-mail:[email protected]
Abstract
In this era of stiff global competition all the companies look forward to having
professionals onboard. They insist on professional qualification, professional power
dressing, etiquettes, behavior and everything that states “Professional”. The
organizations also understand and appreciate the importance of mentoring. But, both
the concepts, being very important should be linked together right from the student
days so that this can be displayed when the students join the organizations. The B
Schools should ensure that the students are groomed to be thorough professionals and
use “Mentoring” as an effective tool towards achieving this objective. This is a
conceptual paper which relates professionalism and the use of mnyoring to achieve this.
Key Words : Professionalism, B Schools, Mentoring

Mentoring for Professionalism
46 RIMS Journal of Management, Vol.4(I),Jan-July 2019
Belief”. While it gets constantly tested
and evaluated under various
situations and conditions its measured
not only on the basis of outcome and
purpose but also hinges on the degree
of consistency and commitment to
maintain even under pressure.
In this fast paced and ever changing
world we have to consistently match
up with others and yet look different
from the crowd and this can be done
only by doing things differently. That
is exactly what Mr. ShivKera, the
motivational guru has said. “Leaders
do not do different things; they do
things differently”. Professionalism
enables us to do all that in a
structured and organised manner and
also exhibit a sense of unbiased
evaluation of all the possibilities and
yet doing the right thing at the right
time.
Going by dictionary Professionalism
refers to being Competent, Proficient,
Resourceful, Capable, Expert, Skilled,
Qualified and the list is endless as all
professionals would know.
Professionalism is attributed to being
able to tackle and manage anticipated
as well as unanticipated issues on the
fly without losing focus on the overall
purpose or growth of the individual as
well as the organisation should the
environment and underlying situation
conflict amidst themselves too.
The gamut of issues to be tackled
combined with the need to reinvent
have taught the higher education
institutes and especially B Schools to
create top notch professionals who will
be a hybrid of “Smart Brains” and
“Smart Personalities” giving the most
required edge to the students of the B
Schools.
When we dive deeper into
Professionalism we understand that it
is not a mere acquisition of
professional degrees nor is it a
training certificate as quite often
misunderstood… It is about
roundedness (360) of thinking, acting,
involving and performing while
raising the level of achievement and
the benchmark for success without
leaving behind even iota of fairness
and integrity. Appearance,
demeanour, reliability, competence,
ethics, poise, etiquettes,
communication and accountability can
be listed as the essential qualities for
a thorough professional. But a
teaching professional additionally
requires knowledge and awareness
about diversity of his/her students to
make teaching and learning a more
rewarding experience. Therefore, for a
teacher to be a thorough professional
he/she requires that extra zing to
connect with his/her students and
make teaching a rewarding experience
both for the teacher and for the

Mentoring for Professionalism
47 RIMS Journal of Management, Vol.4(I),Jan-July 2019
taught. This can be achieved through
“Mentoring” and therefore, this paper
is an attempt to associate
professionalism with mentoring.
What are the focus areas to make a
professional out of a teacher with the
added element of effective mentoring?
Planning is all about preparation
that will help meet the challenges of
tomorrow or any time in the
foreseeable future. Professional
behaviour demands a certain amount
of planning so that overruns are
avoided, risk is reduced, cost and time
is reduced and the work proceeds
smoothly and efficiently. “Mentoring”
should encompass the tenets of
effective planning which enables the
students to firm on both short term
plans as well as long term ones. It
should also create awareness in the
minds of the students that if a given
plan fails, what should be the other
options and how it should be invoked
when needed. Planning is not only
about what to do as it pans out, but
also about anticipating possible fall-
outs and avoiding or circumventing
them. While professionalism teaches
them to take calculated risks ( a
variation of being aggressive to
achieve business goals in today’s
competitive environment) and might
push the individual to go for the kill (
in certain situations, achievement
becomes paramount and there may be
no easier options) it would call for
being dispassionate and
unemotionally strong to act
aggressively to meet the gaols. But
even so, in the face of such a
demanding situation –
Professionalism expects more
maturity and justifiable reasoning and
hence mentoring students to be able to
meet their goals without
compromising on any of the
fundamentals is critical and
necessary. Mentoring actually trains
their mind and the method of thinking
to attune themselves to do the right
thing and even be ready to face
failures without losing sight of the
goals as well as the edifice of
behaviour and character that becomes
visible in such situations. Therefore
the need to counsel them on how
failures can be handled without
becoming emotionally bankrupt is also
an added lesson that adds a jewel to
the art of Mentoring towards
Professionalism as the life line.
Communication is the unwritten
script for making professionalism
work. Some examples will make it
easy to appreciate why communication
plays a key role… Do we take care to
explain things to our students,
colleagues or to our management? A
doctor who explains a point to a
worried patient is more professional

Mentoring for Professionalism
48 RIMS Journal of Management, Vol.4(I),Jan-July 2019
than a doctor who does not bother to
assuage the feelings even if it’s a
simple injury. Should the doctor be
more concerned about writing
prescription to quickly dispatch the
patient and then invite the next or
ensure the patient feels comfortable
even under distress?. While both the
doctors intend to achieve the same
goal (the end result) here-in, one
reduces worry while the other causes
unnecessary tension in the minds of
the patient. It’s the element of caring
that gets depicted when the
communication is correct and
meaningful to the end recipient who
has to absorb and act – which
incidentally is the true measure of
meaningful communication.
“Mentoring” should enable or enlist
the mechanisms to help connect easily
and purposefully. Communication is
one of the means to demonstrate
professionalism as it reflects both the
purpose and the means to achieve it.
As all leaders purport -
Communication should be complete - –
more because it’s understood and
absorbed by a different person (the
Recipient) – who alone can tell
whether it was useful or not. Hence
the emphasis should be on “impressive
and effective communication skills” –
which will be the invisible guide to go
up the ladder of a professional.
Decision making is another
evaluation criteria to determine the
degree of professionalism. The way we
make our decisions shows us to the
whole world and/or to the Team that
we are associated with; depicting as to
how we approach a problem and also
as to how we derive a solution, all the
while leveraging on the means that
will help us reach our set goals. The
methods may be many, but, what is
critical is for the veracity of the basis
and the consistency of the decisions
along with the approach mechanism
that will stand us in good stead. Many
are used to decisions made on whims
and fancies and sometimes exposed to
partisan or biased views or decisions.
This is where professionalism gets
compromised and the leader falls very
badly. It must also be pertinent to
note that people still use different
techniques to analyse and evaluate a
situation on their own merits and
hence may be inclined to use
intuitions to make or justify a
decision. However, what drives
Professional Decision-making is the
combined factorization (effect) of
consistency, purposefulness, integrity,
unbiased valuation, risk mitigated
options, better-outcome-value all
which define and highlight the degree
of Professionalism when it comes to
Decision-Making. Therefore, effective
mentoring should always harp on the
ethical decision making and guide the

Mentoring for Professionalism
49 RIMS Journal of Management, Vol.4(I),Jan-July 2019
protégés to go through the various
steps in decision making without
losing sight of the end.
Doing the job and doing it right
without being just “yes men” is key.
Doing the right things both from an
individual perspective as well as
organisational perspective is a true
exhibition of a Professional approach.
Therefore, it is the job of the teacher to
not only be a professional in their
dealings, but also make the students
to feel the urge to imbibe the quality of
professionalism. Again to drive home
this about being FOCUSED and doing
it RIGHT – teachers have to rely on
“Mentoring” to ensure that the tenets
of professionalism is well understood
and internalized by the student
forever.
Mentoring provides a framework
where the students pursuing
professional education develop skills
and knowledge and enhance their
personal and professional skills to be
successful in their ventures.
Mentoring program in B Schools is a
structured formal process that aims at
enriching the protégé’s abilities and
overall skills that an able mentor can
easily elicit from or train an individual
on. Mentoring also helps in
understanding the protégé’s overall
potential, career aspirations and also
their personal expectations that need
to be tended to (given direction and
focus). Mentoring programs should
educate, nurture, teach, orient,
invigorate, guide, naturalize and
reinforce the protégés capabilities
(hidden or apparent) and empower
them to reach the set target or goals.
This is like a tap that has to be opened
for it to flow and the mentor only
shows the tap and the method to do so
– not just opens the tap (which is often
the case); Hence the focus here is to
help the students evaluate and
understand their inner self and
capabilities, with deep internal focus
and allow them to apply their
thoughts in the right manner for
deriving the right steps to achieve the
right goals without compromising on
any of the filters of professionalism
that have been described in the
previous pages as the essentials. This
part of Mentoring helps the student
graduate from being TAUGHT to
being AWARE and FOCUSED.
Deploying Mentoring is the finishing
touch to the structure of
professionalism-Training. It would
therefore be appropriate to point out
that institutes desirous of embarking
on “Mentoring program” should
necessarily have qualified teachers as
mentors with commitment, empathy,
flexibility, appreciation of diversity.
Being a good listener and a person
Mentoring for Professionalism
50 RIMS Journal of Management, Vol.4(I),Jan-July 2019
with integrity is utmost for the Mentor
to be successful. They should be
capable of holding hands when needed
and let loose as appropriate to help
the students learn the art & science
behind professionalism that now is the
basis of all engagements in life. It’s
also the only mantra that seems to
have no arguments against it in
almost all walks of life. Enabling the
budding professionals and guiding
them in the right direction is a service
that will be considered as deeper
human service than many. More so in
a world filled with tensions and
conflicts…
So, “Mentoring” to achieve high degree
of Professionals is a yeo-man service
for mankind as a whole.
Another key aspect of “Mentoring”
that must not be ignored or
forgotten… It is not merely a rapport
building exercise but it has to be
structured with well defined objectives
and a clear path to achieve the end
result. It has been said that we learn
best by teaching and teach best what
we most need to learn. “Mentoring”
allows for Bi-directional learning
during Teaching, which is
unparalleled.
Conclusion - When B Schools
embark upon the task of moulding
their students; it is imperative that
they do it through effective mentoring
sessions and groom them as
professionals.
References :
Allen TD. Mentoring others: A
dispositional and motivational
approach. Journal of Vocational
Behavior. 2003;62:134–154.
Austin AE. Preparing the next
generation of faculty. The Journal
of Higher Education. 2002;73:94–
122.
Baumeister RF, Leary MR. The
need to belong: Desire for
interpersonal attachments as a
fundamental human emotion.
Psychological Bulletin.
1995;117:497–529.
Bhatta G, Washington S. “Hands
up”: Mentoring in the New Zealand
Public Service. Public Personnel
Management. 2003;32:211–227.
Miller A. Best practices in formal
youth mentoring. In: Allen TD, Eby
LT, editors. Blackwell handbook of
mentoring. Oxford: Blackwell; (in
press)
Mullen CA. Naturally occurring
student-faculty mentoring
relationships: A literature review.
In: Allen TD, Eby LT, editors.
Blackwell handbook of mentoring.
Oxford: Blackwell; (in press)

“ PROFESSIONAL EDUCATION
is changing;
WE ARE CHANGING
professional education ”
-Dr. M R Pattabiram Director
RAMAIAH INSTITUTE OF MANAGEMENT STUDIES
RAMAIAH INSTITUTE OF MANAGEMENT SCIENCES
No. 15, New B.E.L. Road, M S Ramaiah Nagar, MSRIT Post, Bangalore- 560054
Ph: + 91-80-23607640/41, 080 – 2308 1000/002/003 Fax: +91-80-23607642
E-mail: [email protected],[email protected]
Website : www.msramaiahfoundation.in