risc-v, spike, and the rocket core - eecs instructional
TRANSCRIPT

RISC-V, Spike, and the Rocket Core
CS250 Laboratory 2 (Version 091713)Written by Ben Keller
Overview
This lab will serve as an overview of several important technologies that have been developed bygraduate students in the Berkeley Architecture Group. The Berkeley architecture toolflow is builtaround the RISC-V instruction set architecture (ISA), a new and improved RISC instruction set.In this lab, you will write programs in C and assembly, compile them with riscv-gcc, and runthem with spike, the RISC-V ISA simulator. You will then run those same programs on the Rocketcore, a hardware implementation of the RISC-V ISA. Finally, you will modify the layout of theRocket core to improve its performance and reduce its energy consumption. These basic processordesign skills will come in handy when you drive your accelerators from the Rocket core in futurelabs and the course project.
Deliverables
This lab is due Tuesday, September 24 at 2PM. The deliverables for this lab are:
• (a) C source code and assembly code checked into your git repo
• (b) Python scripts to parse simulation results and power reports
• (c) build results for DC, ICC, and Primetime
You are encouraged to discuss your design with others in the class, but you must write your owncode and turn in your own work.

CS250 Lab Assignment 2 (Version 091713), Fall 2013 2
The RISC-V ISA
RISC-V (pronounced “risk-five”) is a new instruction set architecture (ISA) designed to supportcomputer architecture research and education. It was developed by the Berkeley Architecture Group(now part of the ASPIRE Lab). RISC-V is a free, open ISA, and it is the fifth RISC instruction setthat has been developed at Berkeley. The base ISA was designed to be clean, simple, and suitablefor direct hardware implementation.
The base instructions of the RISC-V ISA are similar to those of other RISC instruction sets, suchas MIPS or OpenRISC. A summary of some of these 32-bit instructions is shown in the table below.For more information about the RISC-V ISA, see www.riscv.org.
31 27 26 22 21 17 16 12 11 10 9 7 6 0
jump target opcode J-typerd upper immediate opcode U-typerd rs1 imm[11:7] imm[6:0] funct3 opcode I-type
imm[11:7] rs1 rs2 imm[6:0] funct3 opcode B-typerd rs1 rs2 funct10 opcode R-typerd rs1 rs2 rs3 funct5 opcode R4-type
imm25 1101011 J imm25imm25 1101111 JAL imm25
imm12hi rs1 rs2 imm12lo 000 1100011 BEQ rs1,rs2,imm12imm12hi rs1 rs2 imm12lo 001 1100011 BNE rs1,rs2,imm12imm12hi rs1 rs2 imm12lo 100 1100011 BLT rs1,rs2,imm12imm12hi rs1 rs2 imm12lo 101 1100011 BGE rs1,rs2,imm12
rd rs1 imm12 000 0000011 LB rd,rs1,imm12rd rs1 imm12 001 0000011 LH rd,rs1,imm12rd rs1 imm12 010 0000011 LW rd,rs1,imm12
imm12hi rs1 rs2 imm12lo 000 0100011 SB rs1,rs2,imm12imm12hi rs1 rs2 imm12lo 001 0100011 SH rs1,rs2,imm12imm12hi rs1 rs2 imm12lo 010 0100011 SW rs1,rs2,imm12
rd rs1 imm12 000 0010011 ADDI rd,rs1,imm12rd rs1 000000 shamt 001 0010011 SLLI rd,rs1,shamtrd rs1 imm12 010 0010011 SLTI rd,rs1,imm12rd rs1 imm12 100 0010011 XORI rd,rs1,imm12rd rs1 000000 shamt 101 0010011 SRLI rd,rs1,shamtrd rs1 000001 shamt 101 0010011 SRAI rd,rs1,shamtrd rs1 imm12 110 0010011 ORI rd,rs1,imm12rd rs1 imm12 111 0010011 ANDI rd,rs1,imm12rd rs1 rs2 0000000 000 0110011 ADD rd,rs1,rs2rd rs1 rs2 1000000 000 0110011 SUB rd,rs1,rs2rd rs1 rs2 0000000 001 0110011 SLL rd,rs1,rs2rd rs1 rs2 0000000 010 0110011 SLT rd,rs1,rs2rd rs1 rs2 0000000 011 0110011 SLTU rd,rs1,rs2rd rs1 rs2 0000000 100 0110011 XOR rd,rs1,rs2rd rs1 rs2 0000000 101 0110011 SRL rd,rs1,rs2rd rs1 rs2 1000000 101 0110011 SRA rd,rs1,rs2rd rs1 rs2 0000000 110 0110011 OR rd,rs1,rs2rd rs1 rs2 0000000 111 0110011 AND rd,rs1,rs2

CS250 Lab Assignment 2 (Version 091713), Fall 2013 3
RV32M Instruction Subset31 27 26 22 21 17 16 12 11 10 9 7 6 0
rd rs1 rs2 0000001 000 0110011 MUL rd,rs1,rs2rd rs1 rs2 0000001 001 0110011 MULH rd,rs1,rs2rd rs1 rs2 0000001 010 0110011 MULHSU rd,rs1,rs2rd rs1 rs2 0000001 011 0110011 MULHU rd,rs1,rs2rd rs1 rs2 0000001 100 0110011 DIV rd,rs1,rs2rd rs1 rs2 0000001 101 0110011 DIVU rd,rs1,rs2rd rs1 rs2 0000001 110 0110011 REM rd,rs1,rs2rd rs1 rs2 0000001 111 0110011 REMU rd,rs1,rs2
The RISC-V Tools
The RISC-V toolchain is a standard GNU cross compiler toolchain ported for RISC-V. You willuse riscv-gcc to compile, assemble, and link your source files. riscv-gcc behaves similarly tothe standard gcc, except that it produces binaries encoded in the RISC-V instruction set. Thesecompiled binaries can be run on spike, the RISC-V ISA simulator. They can also be used togenerate a hexadecimal list of machine code instructions that can be loaded into the instructionmemory of a simulated (or real) processor.
Figure 1 shows how the RISC-V tools fit into the VLSI flow described in Lab 1. Note that theVLSI tools that perform synthesis and place-and-route are not shown.
RISC-V C Programming
Make sure that you have pulled the latest version of the lab template repository, and that you aresourcing the course tools:
% source ~cs250/tools/cs250.bash_profile
Now you will compile your first RISC-V program. Assuming you have defined $LABROOT as thebase of the lab 2 directory, type:
% cd $LABROOT/c
Take a look at the source code of the provided “Hello world” program, hello.c. We will useriscv-gcc to compile this program.
% riscv-gcc -c common/crt.S -o crt.o
% riscv-gcc -c hello.c -o hello.o
% riscv-gcc -T common/test.ld common/syscalls.c -lc hello.o -o hello.run
In the common directory, crt.S defines an important startup sequence, and syscalls.c containsdefinitions of the standard libraries called in the program. The first two steps compile the sourcefiles, and the final step links all of the sources into a single executable called hello.run.
Now we can simulate the compiled program with spike, which will simulate execution of theRISC-V binary.

CS250 Lab Assignment 2 (Version 091713), Fall 2013 4
AssemblySourceCode
RISC-VBinary
riscv-gcc
CSourceCode
spike
TestOutputs
RocketChiselSource
Chisel
CEmulatorVerilog
Execute C Emulator
elf2hex
RISC-VMachine
Code
Execute VCS Simulator
VCSSimulator
VCS
TestOutputsWaveforms
TestOutputsWaveforms
Figure 1: A summary of the Lab 2 toolflow, with source files in green and program executionoutputs in blue.

CS250 Lab Assignment 2 (Version 091713), Fall 2013 5
% spike hello.run
Check to make sure that the program behaves as expected.
In this same directory, create a C source file named test.c and write a new C program of yourchoosing. You can write another simple program that prints text or performs simple arithmetic,or you can kick the tires of the RISC-V toolchain with a more complicated program. Make sure toinclude a comment that notes what your program does. Feel free to explore the common directoryto find other functions that may be of use to you.
Once you have written your C program, compile, link, and run your program using riscv-gcc andspike.
We use other RISC-V tools to examine the assembly and machine code that was generated by thecompiler. In the c directory, type:
% riscv-objdump --disassemble-all hello.run > hello.dump
Open the hello.dump file that is generated. This file lists all of the instructions that make up the“Hello world” program in human-readable assembly code. As you can see, even a simple C programcan compile to many hundreds of instructions!
We can also generate the machine code represented by the binary.
% elf2hex 16 16384 hello.run > hello.hex
Open the generated hello.hex file. It contains a hexadecimal encoding of the bits that make upthe binary executable. While this code is not human-readable, these types of files are loaded intomachine memory to execute binaries on a target machine.
Reference C Benchmarks
The process of compiling, linking, and executing C programs can be automated with Makefiles,just as in Lab 1. The riscv-tests directory contains several C programs that can be compiled inthis way.
% cd $LABROOT/riscv-tests/benchmarks
% make
% make run-riscv
These programs are designed to be run on simulated processors for debugging and benchmarkingpurposes. Accordingly, most of them print little information directly to the console unless there issome error in execution. In this build setup, the outputs of the ISA simulator are printed to .out
files. Look at a few of the generated .out files and verify that they are empty and clear of errors.You can also look through the generated .dump files to see the compiled assembly for the variousreference benchmarks.
RISC-V Assembly Programming
The RISC-V C compiler is a powerful programming tool, but, like any compiler, it introduces extralayers of hierarchy and abstraction that can sometimes obstruct a clear understanding of precisely

CS250 Lab Assignment 2 (Version 091713), Fall 2013 6
what instructions are being run. Sometimes, it is in our interest to avoid the C compiler andwrite hand-coded RISC-V assembly instructions so that we can more easily predict exactly how aprogram ought to behave.
Let’s take a look at some assembly source code.
% cd $LABROOT/assembly
The assembly program add.S was written to test the add instruction of the target environment.(RISC-V source code files have the extension .S.) Compile and run the program:
% riscv-gcc -nostdlib -nostartfiles -Ip -Imacros/scalar \
% -T p/link.ld add.S -o add.run
% spike add.run
*** FAILED *** (tohost = 4)
Unfortunately, spike has indicated that something went wrong in the execution of the program.This could indicate an issue with either the ISA simulator or the program itself. Since the ISAsimulator is reasonably robust, let’s open up the source code of add.S to see if we can figure outwhy the test is failing.

CS250 Lab Assignment 2 (Version 091713), Fall 2013 7
...
TEST_RR_OP( 2, add, 0x00000001, 0x00000000, 0x00000000 );
TEST_RR_OP( 3, add, 0x00000002, 0x00000001, 0x00000001 );
TEST_RR_OP( 4, add, 0x0000000a, 0x00000004, 0x00000007 );
TEST_RR_OP( 5, add, 0xffffffffffff8000, 0x0000000000000000, 0xffffffffffff8000 );
TEST_RR_OP( 6, add, 0xffffffff80000000, 0xffffffff80000000, 0x00000000 );
TEST_RR_OP( 7, add, 0xffffffff7fff8000, 0xffffffff80000000, 0xffffffffffff8000 );
...
TEST_PASSFAIL
...
The first thing you’ll notice about this assembly file is that it does not seem to contain any actualassembly code! Instead, the assembly code has been organized into macros that are called byadd.S. These macros are somewhat similar to functions in their construction, but they are treateddifferently by the compiler, which simply substitutes the assembly code associated with each macrointo the program in the designated order, filling in any variables with the arguments provided bythe macro call. The compiler is not performing any optimization on the provided assembly code,nor is it exercising the stack as would be the case with a function call in C. Instead, these macrosare simply a bookkeeping convention, a way for assembly writers to organize their code and avoidrewriting common sets of instructions.
We can see that add.s repeatedly passes arguments to a macro called TEST RR OP. This is a macrowritten to test the correctness of any R-type instruction. Open the file test macros.h, located inmacros/scalar, and find the TEST RR OP macro.
...
#define TEST_RR_OP( testnum, inst, result, val1, val2 ) \
TEST_CASE( testnum, x3, result, \
li x1, val1; \
li x2, val2; \
inst x3, x1, x2; \
)
...
As you can see, most of what this macro does is load the specified values into registers $x1 and$x2 and perform the specified R-type instruction on those two registers, storing the result in $x3.The macro also calls another macro called TEST CASE that checks that the result computed by thetarget and stored in $x3 matches the correct result provided in the macro argument result. IfTEST CASE detects a failed test, it stores the testnum in register $x28
At the end of the add.S program, a macro called TEST PASSFAIL is called. If you like, you can lookat this simple macro, also found in test macros.h. This macro checks to see whether any valuehas been stored into $x28, and calls either RVTEST PASS or RVTEST FAIL accordingly. Let’s look atthese final two macros to see why our program is failing.
Open the file p/riscv test.h, and find the RVTEST PASS and RVTEST FAIL macro definitions.

CS250 Lab Assignment 2 (Version 091713), Fall 2013 8
...
#define RVTEST_PASS \
fence; \
li x1, 1; \
mtpcr x1, cr30; \
1: b 1b; \
#define RVTEST_FAIL \
fence; \
beqz x28, 1f; \
sll x28, x28, 1; \
or x28, x28, 1; \
mtpcr x28, cr30; \
1: b 1b; \
...
While these macros may contain several unfamiliar instructions, we can still figure out what theydo. If RVTEST PASS is called, the value 1 is loaded into a special register called $cr30. IfRVTEST FAIL is called, the value stored in $x28 is loaded into $cr30. Recall that $x28 waspreviously loaded with the testnum of any test that failed. Therefore, after one of these macros iscalled, $cr30 either contains a 1 if all of the tests passed, or the number of the failed test if one ofthem failed.
The mtpcr instruction is not found in the base RISC-V ISA. Instead, it is defined in a separatesupervisor-level ISA specification that also defines the role of $cr30 and other privileged controlregisters. Documentation of the RISC-V Supervisor ISA is forthcoming on the RISC-V website.For our purposes, $cr30 is known to spike as a special register that indicates the status of theprogram. As soon as the register is written with a value other than 0 or 1, spike prints an errormessage to the console and ends the program.
Because of our investigation, we know that our error message from executing add.run is the resultof a failure in the fourth test in the add program. Open add.S and fix the arithmetic error. Thencompile and run the program again and verify that it does not print an error message.
Writing Your Own RISC-V Assembly Macros
Now you will write some assembly of your own. Open the second provided assembly test file,mytest.S. This file is structured similarly to add.S, but instead of calling the TEST RR OP macro,it calls three new macros:
• TEST POW takes as arguments a base and an exponent and evaluates the base raised to thatexponent.
• TEST FIB takes as an argument an integer n and calculates the nth element in the Fibonaccisequence. Note that the first and second elements in the Fibonacci sequence are both 1. Thatis, if n = 1 or n = 2, your macro should calculate a result of 1.
• TEST GCD takes as arguments two integers and finds the greatest common divisor of thoseintegers.

CS250 Lab Assignment 2 (Version 091713), Fall 2013 9
Each of these test macros finishes by writing testnum to $x28 and then calling RVTEST FAIL if thecalculated result does not match the provided answer.
Skeletons of these macros are provided in the file my macros.h. You should write assembly codefor each macro so that they operate as intended. These macros are excellent opportunities to writefunctional programs with recursive calls if you are so inclined, but you are welcome to use whateverprogramming approach you like. Note that these programs only need to operate on small, positiveinteger inputs. Do not worry about zero, negative, or floating-point inputs, or about the possibilityof overflow.
Once you have written your macros, you should be able to compile and run mytest.S withouterrors:
% riscv-gcc -nostdlib -nostartfiles -I. -Ip -Imacros/scalar \
% -T p/link.ld mytest.S -o mytest.run
% spike mytest.run
Note that the macro instantiations in mytest.S are each written to pass as provided. Be sure torun some failing tests as well to ensure that your macro tests identify them. If your macros arewritten correctly, spike should print an error message to the console identifying any failed tests.
Debugging Your Assembly Code
While running spike can correctly execute your program, it does not provide any debugging infor-mation by default. Fortunately, it can also be run in a debug mode:
% spike -d mytest.run
In debug mode, you can step through the program one cycle at a time and observe the programcounter and the current instruction. You can also take advantage of several other debuggingfeatures:
• r num: run for num cycles
• rs num: run for num cycles without printing debug information
• reg 0 regnum: print the value of register regnum
Type q to exit the simulator. You may also find it helpful to compare the debug output with theprogram’s .dump file.
As you are debugging, please note that spike is not meant to be a cycle-accurate simulator ofthe assembly code. When spike runs, memory operations “magically” resolve in a single cycle,and branches are always evaluated without delay. The ISA simulator can evaluate the functionalcorrectness of programs, but it is not a good way to measure how long they will take to run. Suchcycle-accurate simulation requires a target hardware implementation such as the one that you willcompile later in the lab.

CS250 Lab Assignment 2 (Version 091713), Fall 2013 10
Reference Assembly Tests
We can use Makefiles to automate the compilation and execution of assembly code.
% cd $LABROOT/riscv-tests/isa
% make
% make run
The many assembly tests in this directory are intended to ensure that any hardware RISC-Vimplementation properly executes every instruction defined in the ISA. The somewhat verbosenaming convention for each test provides details about the test. For example, rv64ui-p-add teststhe 64-bit extension of the RISC-V instruction set in user mode with integer instructions in asimulated physical test environment. While there are many other types of tests, we will focus ontests with the designation rv64ui-p for the purposes of this lab.
Note that these tests will “pass silently” if successfully executed. Messages should only print tothe console if a test fails. As with the C benchmarks, the outputs of the ISA simulator are printedto .out files. Look at a few of the generated .out files and verify that they are empty. You canalso look through the generated .dump files to see the assembly for the various reference tests.

CS250 Lab Assignment 2 (Version 091713), Fall 2013 11
The RISC-V Rocket Core
The RISC-V ISA specification defines the desired behavior of a RISC-V processor, but until thispoint in the lab, such a processor has been entirely theoretical. In this section, we introducethe RISC-V Rocket core, a microarchitecture developed by the Berkeley Architecture group thatimplements the 32-bit instruction format of the RISCV64 ISA .
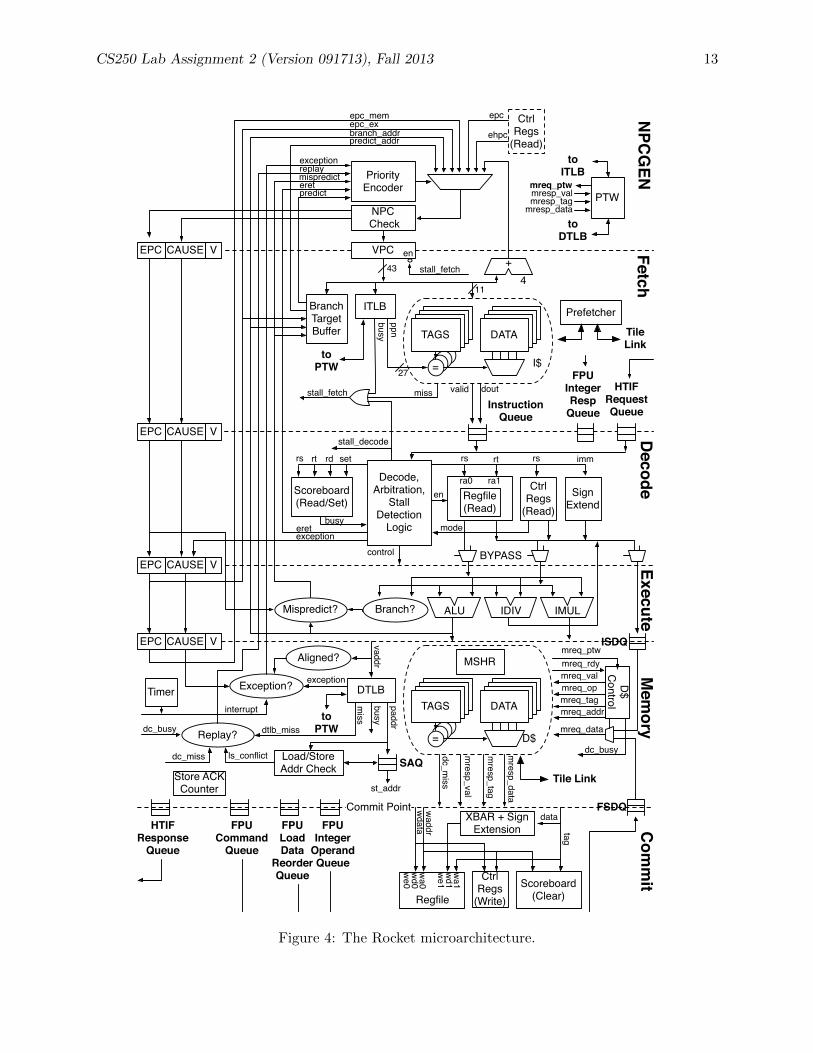
Rocket is an in-order, single-issue scalar processor that includes a six-stage integer pipeline (seeFigure 2). It has a 31-entry, 64-bit register file and uses a scoreboard to detect data hazardsinvolving instructions with multi-cycle latencies. The processor has both a user and a supervisormode; an synchronous trap or external (asynchronous) interrupt can trigger a transition from userto supervisor mode. A detailed graphical description of the Rocket microarchitecture can be seenin Figure 4. Note that while several queues in the last stage reference a floating-point unit, theversion of Rocket used in CS250 does not have an FPU.
Figure 2: The Rocket pipeline.
The Rocket core contains a fast L1 instruction cache and L1 data cache. In the CS250 instantiationof Rocket, these caches communicate through a simple bus to a simulated DRAM that acts as mainmemory for the system (see Figure 3).
Uncore
Rocket
L1 D$L1 I$
ProcessorLogic
2:1 Mux
Emulated DRAM
Figure 3: The CS250 Rocket memory hierarchy.

CS250 Lab Assignment 2 (Version 091713), Fall 2013 12
Versions of the Rocket core have been taped out into silicon in at least seven different implemen-tations of the EOS and Raven research projects. In this lab, you will familiarize yourself with thebasics of the Rocket core so that you can take advantage of its brand-new accelerator interface laterin the course.
The Chisel C Emulator
As described in Lab 1, Chisel can generate a fast C emulator from the scala source files that ishandy for simulating and debugging hardware designs. Let’s make such an emulator for Rocket.
% cd $LABROOT/emulator
% make
This will compile a C emulator capable of cycle-accurate simulation of the Rocket core. If theRocket core is properly implemented, it ought to be able to execute RISC-V binaries identicallyto the ISA simulator. The C emulator provides our first opportunity to test the correctness of theimplemented hardware.
Let’s run the assembly tests that you wrote on the Rocket core to see if Rocket can execute yourprograms correctly. If you haven’t done so already, compile your mytest.S program and generatea hex file. Then type:
% ./emulator +dramsim +max-cycles=30000000 +verbose \
% +loadmem=../assembly/mytest.hex none 2> output/mytest.out
This will run your program on the emulated processor. The dramsim argument includes the simu-lated DRAM in the processor emulation. max-cycles sets a timeout constraint in case the programhangs. The loadmem command allows the program data to be loaded into simulated memory beforethe simulation begins. Without this command, numerous simulation cycles would be spent at thebeginning of each program loading data into memory.
Since the emulator was run in verbose mode, it prints debug information to the console each cycle,including the value of the program counter and the type of instruction that was run. Take a lookat the generated mytest.out file to see the results for your program.
C: 0 [0] pc=[00000002000] W[r 0=0000000000000000] ...
C: 1 [0] pc=[00000002000] W[r 0=0000000000000000] ...
C: 2 [0] pc=[00000002000] W[r 0=0000000000000000] ...
C: 3 [0] pc=[00000002000] W[r 0=0000000000000000] ...
...
In Rocket, the program counter is always initialized to 0x2000, so our program starts there. You’llnotice that the program counter remains at this address for many cycles before any instructionsare executed. This is because the memory system simulates a typical latency for DRAM accesses,which are required to load instructions into the cache before the processor can begin executing theprogram. Note the additional long pauses over the course of the program’s execution while theprocessor stalls, waiting for the results of memory requests. This is the main (though not the only)reason that simulations of programs run on the processor take many more simulated cycles thanthose run on spike.
CS250 Lab Assignment 2 (Version 091713), Fall 2013 13
=
VPC
ITLB
43
TAGS DATA
I$
valid dout
BranchTargetBuffer
NPC Check
FetchDecode
rs rt
Scoreboard(Read/Set)
rs rt rd set
busy
Decode,Arbitration,
StallDetection
Logic
ExecuteALU IDIVBranch?
BYPASS
SignExtend
imm
=
DTLBTAGS DATA
D$
Mem
ory
Tile Link
Com
mit
Commit PointXBAR + Sign
Extension
Mispredict?
EPC
EPC
EPC
CAUSE
CAUSE
CAUSE
Exception?
FPUCommand
Queue
FPUIntegerResp
Queue
HTIFRequestQueue
HTIFResponse
Queue
Prefetcher
Scoreboard(Clear)
FP Regfile (Read)
Scoreboard(Read/Set)
Decode +Hazard
DetectionLogic
FMA
ITOF FTOI
FSDQ
interrupt
SAQ
mresp_val
mresp_tag
Load/StoreAddr Check
ISDQ
mreq_data
FPULoadData
ReorderQueue
busyBYPASS
Decode
FloatingPointUnit
RECODE
Execute
Scoreboard(Clear)
Com
mit
Replay?
FSR
RECODE
FCMP
NPCGENPriority
Encoder
CAUSE
predict
predict_addrbranch_addr
mispredict
exception
epc_mem
replay
stall_decode
IMUL
Store ACKCounter
ehpc
CtrlRegs
(Read)
CtrlRegs
(Write)
Timer
ls_conflict
27
epc
eret
epc_ex
eret
missstall_fetch
miss
busy
exception
paddr
vaddr
rs
V
V
V
mreq_addr
wd0wa0
Regfile
we0
wd1wa1we1
ppn
data
tag
InstructionQueue
control
st_addr
mresp_data
mreq_tag
mreq_valmreq_rdy
EPC
FPUInteger
OperandQueue
Aligned?
dc_miss
MSHR
V
dc_busy
toPTW
4+
busy
PTWmresp_valmresp_tag
mresp_data
toITLB
toDTLB
mreq_op
TileLink
mreq_ptwD$
Control
CtrlRegs
(Read)
mreq_ptw
dc_busy
enstall_fetch
dc_miss
mode
dtlb_miss
exception
toPTW
toFIRQ
stall
waddr wdata
FP Regfile(Write)
waddr
ra0Regfile(Read)
ra1
waddrwdata
en
rdata0
rdata1
rdata2
Ex1Ex2
11
Figure 4: The Rocket microarchitecture.

CS250 Lab Assignment 2 (Version 091713), Fall 2013 14
Look through the file and observe the remainder of your program’s execution. If you’d like, youcan follow along in the dump file to note the various function calls. Scroll to the bottom of the fileand be sure that the test did not fail. (If the test passes the ISA simulator, there is no reason thatit should fail in the C emulator.)
Analyzing RISC-V Test Results
The primary purpose of the included tests and benchmarks is to verify the correctness of the RISC-V hardware implementation. Let’s make sure that Rocket is working as intended for all of theinstructions in the ISA.
% cd $LABROOT/emulator
% make run-asm-tests
Note that this command will only run if you have already compiled the RISC-V tests as previouslydescribed.
The RISC-V assembly tests are intended to check the functionality of each instruction individually.You should already be familiar with the way in which these programs use the control register cr30to signify correct operation. As noted previously, these tests only display any message if they fail;if they pass, they should not print any additional information. Unfortunately, a failed test mightalso not display any information (for example, if the test fails catastrophically, the program maynever reach the RVTEST FAIL portion of the program). It would be better to have some assurancethat each test actually reaches the ”PASS” state.
Write a Python script called check.py that parses the dump file of each test to identify the addressassociated with the pass location. Your script should then parse the results of the C emulator andverify that the test reaches that “pass address”. For example, the add.S test passes if the programcounter reaches 0x251c, according to its dump file:
...
000000000000251c <pass>:
251c: 0000012f fence
...
In the emulator’s logged output of the processor simulation, we see that the program counterreaches address 0x251c near the end of program execution:
...
C: 1714 [1] pc=[0000000251c] W[r 0=0000000000000002] ... fence
...
So we know that the add test passed. Your Python script should automatically check all of theRISC-V test results to ensure that they passed as well, and print a summary to the console. Youcan find a list of the tests in the top-level Makefrag file.
Analyzing RISC-V Benchmark Results
The RISC-V benchmarks run more complicated programs than the simple assembly tests. They areused to check for correct operation, but also to check the runtime of the processor when executing

CS250 Lab Assignment 2 (Version 091713), Fall 2013 15
various programs of interest. First, run the benchmarks on the emulated Rocket core. (Again, theymust already be compiled.)
% make run-bmarks-test
You will notice that one of the RISC-V benchmarks does not pass simulation. The dgemm benchmarkperforms a series of dense matrix multiplications on matrices storing floating point numbers. Sincethe CS250 Rocket core does not contain a floating point unit, this benchmark will not run on theprocessor, even though it successfully passed in ISA simulation.
Add to your Python script above so that it counts the number of cycles required to execute eachbenchmark. When you’re finished, you should be able to run your script to analyze the correctnessof each test and the runtime of each benchmark.
Debugging with the Waveform Viewer
While we have provided you with a working processor for this lab, you will inevitably need to debugcomplex hardware designs over the course of the semester. It is possible, as in Lab 1, to modify thesource code of the C emulator to print additional debug information for this purpose. However,the emulator takes considerable time to recompile for large designs, so this may be impractical as aquick debugging tool. Alternatively, you can build a C emulator that records the switching activityof each node in the design and generates vcd files that can be converted and viewed as graphicalwaveforms in DVE.
To do this, we will recompile a different version of the emulator:
% make emulator-debug
You can run all of the benchmarks and tests on the emulator with make run-debug. For ourpurposes, let’s just run a single test:
% make output/rv64ui-p-add.vpd
The Makefile will use the new emulator to generate the vpd file. Open the generated file with DVEand explore the waveforms of the various signals within the Rocket core. See if you can identifythe additions that are written into the test (see Figure 5), and the final determination that the testpassed.
In general, compiling and running the emulator to generate vpd files takes longer than running thestandard emulator, so take this step only when necessary for debugging.

CS250 Lab Assignment 2 (Version 091713), Fall 2013 16
Figure 5: The Rocket core successfully adds 1 and 1.
Rocket and the VLSI Flow
Despite the vastly increased complexity of the design, the VLSI flow for compiling the Rocket corefrom RTL to GDS is similar to the flow you learned in Lab 1. You will push the Rocket core allthe way through the flow, checking functional correctness after each step, and then use PrimetimePX to accurately measure the power consumption of the system.
Getting Oriented
From your top-level lab 2 directory, go to vlsi/build and take a look at the build infrastructure.Open the Makefrag in this directory.
...
UCB_STDCELLS = synopsys-32nm/typical_rvt
clock_period = 1.25
clock_uncertainty = 0.04
vcs_clock_period = 0$(shell echo "scale=4; ${clock_period}*0.5" | bc)
dc_clock_period = 0$(shell echo "scale=4; ${clock_period}*1.0" | bc)
...
Makefrags provide additional information so that Makefiles can complete their tasks. This Makefragprovides (among many other things) the target clock period for the Synopsys tools. Note the currentdefault of 1.25ns.
Close the Makefrag and generate the top-level Verilog from the Chisel source.
% cd $LABROOT/vlsi/build/vcs-sim-rtl
% make

CS250 Lab Assignment 2 (Version 091713), Fall 2013 17
This will build the Verilog for Rocket and create a VCS simv file from which the Verilog can besimulated. Now run the assembly tests and benchmarks on the simulated Verilog.
% make run-asm-tests
% make run-bmarks-test
Check the .out files for any errors. Use your Python script from the previous section to ensure thatthe processor passes each assembly test and that the procesor runtime of each benchmark is thesame number of cycles as it was in the C simulator.
The VCS simulator for the processor does not generate vpd files by default due to the additionalruntime penalty. The Makefiles are configured to produce these files upon request:
% make simv-debug
% make run-asm-tests-debug
% make run-bmarks-test-debug
Building the Chip
Now that we’ve verified our RTL, let’s synthesize our design.
% cd $LABROOT/vlsi/build/dc-syn
% make
This will take some time to run. Note that the folder that contains the DC build includes theclock period in its name. This can be useful when tweaking the clock period target provided to thesynthesis and comparing the results.
Once synthesis finishes, look briefly through the generated reports. In particular, take a look at theQOR report and verify that the design meets timing by checking whether the critical path of theclock named clk is near to the target period. (A small negative slack of a few tens of picosecondsis OK, and perhaps even ideal; it indicates that Design Compiler has exerted some optimizationeffort to bring the clock close to the minimum achievable clock period.)
After synthesis, run post-synthesis gate-level simulation in the vcs-sim-gl-syn directory. Notethat the C simulator does not print as much debug information as in previous simulation stages,so you will not be able to verify the correct execution of the RISC-V tests by analyzing the .out
files. (A message should still print to the console if any of the tests fails.) You can still use yourPython script to measure the runtime of the RISC-V benchmarks, however.
Next, we’ll move on to place-and-route.
% cd $LABROOT/vlsi/build/icc-par
% make
This process will take quite some time for the Rocket core, perhaps an hour or more. Once it hasfinished, look through the generated reports on area, timing, and power, and make a note of anysignificant changes as compared to the synthesis results. To get a better picture of the design, openthe design in the ICC Compiler graphical view.

CS250 Lab Assignment 2 (Version 091713), Fall 2013 18
Figure 6: Click the folder in the top right to select the design.
% cd current-icc
% icc_shell -64bit
% ...
% Initializing...
% icc_shell> source icc_setup.tcl
% icc_shell> start_gui
Be sure to first source the setup script to load the libraries for the design. Once the graphical viewappears, select File > Open Design..., and use the file browser to select the saved database filefor the design (see Figure 6). The tcl scripts used to build the design save Milkyway views of theintermediate stages, but we’re just interested in the final product for now. Select chip finish iccand open the design.
You should now be looking at your completed layout of the Rocket core. The large SRAM blocksare readily visible around the boundaries of the chip. These are not “real” SRAM cells, but rathermacros generated by an SRAM modeling tool called Cacti. Cacti takes information on the desiredsize, design (6T vs. 8T), and technology of each SRAM cell in the design and generates “blackbox” models that can be used for placement. It also generates power and timing models in formatscompatible with the Synopsys flow. You can mouse over the various SRAM cells to see their sizesand uses in the processor. The largest blocks make up the two-ported L1 data cache, with theinstruction cache and several tag arrays also represented.
In addition to the text reports generated by ICC, several graphical views can illuminate trends orissues in the design of digital hardware. In the Placement menu, select Cell Density Map. Theassociated menu will appear in a sidebar. Click “Reload” and then “OK”. Now you can see theplacement density of the standard cells across the design (see Figure 7). In modern ASIC flows,designers usually target a density of no more than 70 or 80 percent to allow space for clock treesynthesis, buffer insertion, routing, and incremental tweaks to placement or other stages. Thehistogram shows that our utilization is somewhat higher than is comfortable; ICC likely had toexpend a good deal of effort to make everything fit. Once you’re done looking at the placementdensity, click the small “X” in the top right corner of the sidebar to return to the regular view.

CS250 Lab Assignment 2 (Version 091713), Fall 2013 19
Figure 7: Standard cell density in the core.
Now let’s look at another design metric. In the Route menu, select Global Route Congestion Map.This shows any areas where ICC had trouble routing all of the signals, either due to a large numberof wires or a narrowly constrained routing area (see Figure 8). ICC may have had some troublerouting near the SRAM boundaries, as the SRAMs have blockages that prevent routing in many ofthe layers above them.
Feel free to look at some of the other reports that can be generated in the ICC graphical view.Once you’re finished, close ICC and return to the command line.
As evidenced by these ICC views of our design, we might do well to make some changes to thedesign floorplan. Floorplanning is a key step in chip design, in which the designer determines suchaspects of the design as the location of macros and pins. A bad floorplan can significantly degradethe quality of results from ICC.
In our case, we might improve our floorplan by simply increasing the total area of the chip availablefor placement and routing. Open floorplan/floorplan.tcl, and find the line that sets the chiparea:
...
create_floorplan \
-control_type width_and_height -core_width 700 -core_height 700 \
-flip_first_row \
-start_first_row \
-left_io2core 5 \

CS250 Lab Assignment 2 (Version 091713), Fall 2013 20
Figure 8: Congestion map of the core.
-bottom_io2core 5 \
-right_io2core 5 \
-top_io2core 5 \
...
Increase the core width and core height variables by 100um each. Then re-run ICC to completionand compare the results. You should also take a look at the graphical view to see if the densityand congestion are improved.
If you’d like to make sure that your floorplan changes are incorporated into the design, you canmake just the first stage of the design with make init design icc. This allows you to open thedesign and view the floorplan without having to run all the way through place-and-route.
Once you’re satisfied with your floorplan and ICC results, run post-layout simulations to verifychip functionality.

CS250 Lab Assignment 2 (Version 091713), Fall 2013 21
Analyzing Power
In Lab 1, we used Primetime as a more accurate power simulator than ICC. For a more complexdesign like the Rocket core, Primetime can also expose the dependence of system power consumptionon the inputs used on that system. In this case, our system inputs are the programs that are runon the processor.
Start running Primetime on the Rocket core, using the RISC-V benchmarks:
% cd $LABROOT/vlsi/build/pt-pwr
% make
This Makefile compiles a different version of the post-PAR simv. This new simulator efficientlygenerates vpd outputs that can be transformed into saif switching activity files for use withPrimetime. It then runs Primetime on each of the six functional processor benchmarks. Thesesimulations may also take some time to complete for this larger design.
When the power simulations have completed, open the generated power reports. Make a note ofthe extent to which the power numbers vary based on the benchmark being run.

CS250 Lab Assignment 2 (Version 091713), Fall 2013 22
Submission and Writeup
Questions
1. With a stopwatch (or some other, more sophisticated timer), note how long it takes to simulatethe execution of the dhrystone.riscv benchmark in the following modes:
• ISA simulation
• Chisel C emulation
• Verilog RTL simulation
• Post-synthesis gate-level simulation
• Post-place-and-route gate-level simulation
Additionally, use your Python script and the generated log files to determine the numberof simulated cycles required to run this benchmark, and convert your results into units ofsimulated cycles per second.
Given this discrepancy, why would designers ever want to simulate program execution onpost-PAR Verilog?
2. Step through a program of your choice in debug mode in the ISA simulator. Compare therequired number of cycles to complete the program to the number of cycles required to runthe program on the C emulator processor model. Explain the discrepancy.
3. Compare the worst critical paths of your post-synthesis results against those of your post-ICCresult. How does the timing of the whole design change after it goes through place-and-route?Do the worst critical paths pass through the same modules or different ones? Why might thisbe the case?
4. Run ICC with four different floorplans, varying the chip dimensions from 700um x 700um to850um x 850um in increments of 50um. Make a table to compare the quality of the resultsin terms of:
• Timing (worst negative slack)
• Area, according to the area report
• Density utilization (summarize this qualitatively by viewing the report graphically)
• Routing congestion (summarize this qualitatively by viewing the report graphically)
• ICC runtime (look at the timestamps on the generated log files)
Comment on any trends.

CS250 Lab Assignment 2 (Version 091713), Fall 2013 23
5. Write a Python script to fill in the table below comparing the reported power numbers bydifferent parts of the design flow. Report average power in mW.
Tool Benchmark Total Switching Leakage Datapath ICache DCachePower Power Power Power Power Power
DC -
ICC -
PrimeTime median
PrimeTime multiply
PrimeTime qsort
PrimeTime towers
PrimeTime vvadd
PrimeTime dhrystone
Submission
To complete this lab, you should commit the following files to your private Github repository:
• Your working C and assembly code.
• The reports directories from DC, ICC (4 runs), and Primetime. Please commit the textreports only!
• Your Python scripts to analyze simulations and power numbers.
• Your answers to the questions above, in a file called writeup.txt or writeup.pdf.
Some general reminders about lab submission:
• If you are using one or more late days for this lab, please make a note of it in your writeup.If you do not, your TA will assume that whatever was committed at the deadline representsyour submission for the lab, and any later commits will be disregarded.
• Please note in your writeup if you discussed or received help with the lab from others in thecourse. This will not affect your grade, but is useful in the interest of full disclosure.
• Please note in your writeup (roughly) how many hours you spent on this lab in total.