risk analysis of offshore terminals in the caspian sea
TRANSCRIPT

Ocean Systems Engineering, Vol. 9, No. 3 (2019) 261-285
DOI: https:// doi.org/10.12989/ose.2019.9.3.261 261
Copyright © 2019 Techno-Press, Ltd.
http://www.techno-press.org/?journal=ose&subpage=7 ISSN: 2093-6702 (Print), 2093-677X (Online)
Risk analysis of offshore terminals in the Caspian Sea
Kambiz Mokhtari and Jamshid Amanee
ECO College of Insurance, Allameh Tabataba’i University, Tehran, Iran
(Received January 28, 2019, Revised May 9, 2019, Accepted May 13, 2019)
Abstract. Nowadays in offshore industry there are emerging hazards with vague property such as act of terrorism, act of war, unforeseen natural disasters such as tsunami, etc. Therefore industry professionals such as offshore energy insurers, safety engineers and risk managers in order to determine the failure rates and frequencies for the potential hazards where there is no data available, they need to use an appropriate method to overcome this difficulty. Furthermore in conventional risk based analysis models such as when using a fault tree analysis, hazards with vague properties are normally waived and ignored. In other word in previous situations only a traditional probability based fault tree analysis could be implemented. To overcome this shortcoming fuzzy set theory is applied to fault tree analysis to combine the known and unknown data in which the pre-combined result will be determined under a fuzzy environment. This has been fulfilled by integration of a generic bow-tie based risk analysis model into the risk assessment phase of the Risk Management (RM) cycles as a backbone of the phase. For this reason Fault Tree Analysis (FTA) and Event Tree Analysis (ETA) are used to analyse one of the significant risk factors associated in offshore terminals. This process will eventually help the insurers and risk managers in marine and offshore industries to investigate the potential hazards more in detail if there is vagueness. For this purpose a case study of offshore terminal while coinciding with the nature of the Caspian Sea was decided to be examined.
Keywords: risk analysis; risk management; fault tree analysis; event tree analysis; bow-tie model;
fuzzy set theory; offshore terminals; Caspian Sea
1. Introduction
There has been growing concern in public and private sectors regarding the threats of the
hazards associated within offshore terminals to people, assets, environment and reputations
resulting from the offshore terminals‟ operations and management. Investigations show that almost
all the major accidents and losses in terms of delays and costs could be avoided with effective RM
programmes Wang (2004), Tarila and Edward (2017).This paper is focusing on offshore terminals,
discusses recently emergent RM-related issues with taking into consideration of the externally and
internally driven elements e.g. pure risks (i.e. uncertainty of damage to property by fire, flood or
the prospect of premature death caused by accidents) and speculative risks (i.e., risks which are
linked directly to the business function, decision making processes and management). This view
has been steadily increasing, for example, a number of studies have reported such trend in the
United Nations Conferences on Trade and Development from 1996 to 2006 UNCTAD
Corresponding author, Ph.D., Ex-Master Mariner, E-mail: [email protected]

Kambiz Mokhtari and Jamshid Amanee
(2006),developed a security risk assessment and management framework that is capable of
reflecting the logistics scope of transport networks.
The focus was mostly on the development, management, commercial, operational and
organisational issues of the marine ports and terminals. On the marine related RM area, GAO (2019)
has stressed for “further refinements needed to assess risks and prioritise protective measures at
related critical infrastructure”. In UK, DETR (2000) and required all marine ports and terminals to
carry out risk assessment of marine operations in order to implement the safety management system.
Additionally UK, HSE (2019) has urged offshore contactors and operators to conduct safety cases
and safety reports on different stages of their operations e.g. design, commissioning, operation,
transportation, decommissioning as well as reviewing them periodically.
In offshore industry e.g., for offshore terminals a high quality RM is absolutely necessary for
their sustainable development. In this regard risk is defined as “a measure of human injury,
environmental damage or economic loss in terms of both the incident likelihood and the magnitude
of the injury, damage or loss” CCPS (2000) and Mokhtari (2012). Risk analysis involves the
development of an overall estimation of risk by gathering and integrating information about
scenarios, frequencies and consequences. It is one of the major components of the whole RM
process of any particular enterprise.
The main aim of this paper is to use a proposed RM framework and a developed generic risk
analyse model to evaluate and prioritise hazards in offshore terminals. The proposed framework for
the purpose of offshore terminals consists of the following three main phases:
Hazard Identification
Risk Assessment
Risk Mitigation
Overall the developed risk analyse model can facilitate on achieving the objectives of the RM
framework within the offshore terminals. The research results can help professionals to decide
whether to take preventive actions or corrective actions during the risk mitigation phase of the RM
framework. This will lead to proceed toward a proactive or a reactive RM process.
This paper is organised as follows. Section 2 reviews the existing literature. Section 3 presents
and discusses risk analysis in offshore terminals that including bow-tie based risk analysis model
and proposing the methodology for implementing the risk analysis. Section 4 provides a case study
based on Caspian Sea to demonstrate the use of the proposed methodology on offshore terminals.
Conclusions and further work are discussed in Section 5.
2. Literature review
Along with the rapid progress of industrialisation, the risk of incidents is increasing and it has
become increasingly recognised that there is a worldwide trend for losses due to accidents to rise
even more rapidly than gross national product Lees (1996). As a result in order to analyse the
potential risk factors appropriately there is a need to utilise risk analysis model. Moreover no
course in a RM cycle would be complete without the inclusion of a major component on risk
analysis. Risk analysis acts as a kind of hub, around which many other practical aspects of RM
rotate Dickson (2003). Dickson discuss that every risk is caused by some factor or factors and
262

Risk analysis of offshore terminals in the Caspian Sea
results in some effect or effects. It can be viewed rather like a chain. The cause is linked to the
nature of the risk and the risk itself is linked to the effect.
In the process of risk analysis, both qualitative and quantitative techniques can be used
Krishnaet al.(2003). Nowadays variety of techniques are used for risk analysis including Physical
Inspections, Organisational Charts, Flow Charts, Safety Review, Checklist Analysis, Relative
Ranking, “What-if” Analysis, Preliminary Hazard Analysis (PHA), Hazard and Operability Study
(HAZOP), Failure Modes and Effects Analysis (FMEA), Fault Tree Analysis (FTA), Event Tree
Analysis (ETA), Cause-Consequence Analysis (CCA), Human Reliability Analysis (HRA) (Lees
1996, Dickson 2003, CIS 2002, Krishna et al. 2003, ABS 2019, Chiara and Giuseppe 2014,
Jichuan et al. 2018, Mareike and Athanasios 2018). These techniques have all been developed in
the industrial setting, normally in response to some practical business problems. It is, however,
unlikely that one technique will solve all problems for different industry types.
2.1 Bow-tie analysis
A bow-tie framework has been proposed to integrate a broad group of cause–consequence
models Visser (1998). The traditional fault tree and event tree models are „bow-tied‟ and the fault
tree‟s “top event” is connecting with the event tree‟s “initiating event”. The bow-tie will be regard
as a “lens” for focusing on causes of an event and “projecting” that onto the space of the event‟s
consequences. The consequences will eventually be attributed into decision problems for the
purpose of RM. The bow-tie‟s consequence side can make an interface with the decision models,
ultimately decisions taken will be reflected back towards the causes Groeneweg (1998). Bow-tie
framework not only has proven a valuable conception in mishap prediction, but also has
demonstrated its importance in analysing the past accidents and signifying improvements to avoid
further re-occurrence of undesired events Bellamy et al. (2007). In particular it proved for being
able to provide a suitable level of simplification of the causal factors in order to be able to
summarise large quantities of data into a relatively small number of common scenarios, which can
cover the majority of the accidents. In an accident scenario, the link between an accident and all its
possible causes can be represented in the form of a fault tree HSE (2010). In the same time, the
relationship between an accident and its possible multiple consequences can be represented by
means of an event tree. Fault and event trees can be integrated in the form of a bow-tie diagram
where the centre event represents „the release of a hazardous agent‟ as presented in Fig. 1. This
framework is particularly useful for analysing accidents, as their causes and consequences remain
linked together. Moreover, it provides the user with a simplified classification framework where
the usually varied information available in incident reports can be consistently stored and
summarised according to a fixed common criteria.
A number of research groups have used the bow-tie framework to manage the occupational
risks by developing a risk assessment model and software tools DNV (2000) and RIVM (2019).
Indeed the bow-tie analysis is a tool that has both proactive and reactive elements and
systematically works through the hazard and its management. It uses a methodology known as the
Hazards and Effects Management Process (Edwards 1999, Zuijderduijn 1999, Blom et al. 1999). It
can be used to demonstrate how effective a marine facility's safety management system is
performing and also to complete gap analyses Elliott et al. (2019). The bow-tie framework can be
used to demonstrate how the pertinent safety management system element requirements are met
with respect to the control and management of hazards and risk factors (ABS 2019, Trbojevic and
Car 2000, Cockshott 2005, Mokhtari and Ren 2014).
263

Kambiz Mokhtari and Jamshid Amanee
Fig. 1 A Bow-tie diagram
Source: Modified from GEXCON (2019)
2.2 FTA
FTA was first introduce in 1961 and has long been adapted for many applications in the process
industry i.e. onshore and offshore sector‟s quantitative risk analysis to predict the probability of
hazardous incidents and to identify the most important risk contributors. Moreover a fault tree is a
logic and graphical representation that explores the interrelationships between a potential critical
event in a system and the reasons for this event Hoyland and Rausand (1994). A typical fault tree
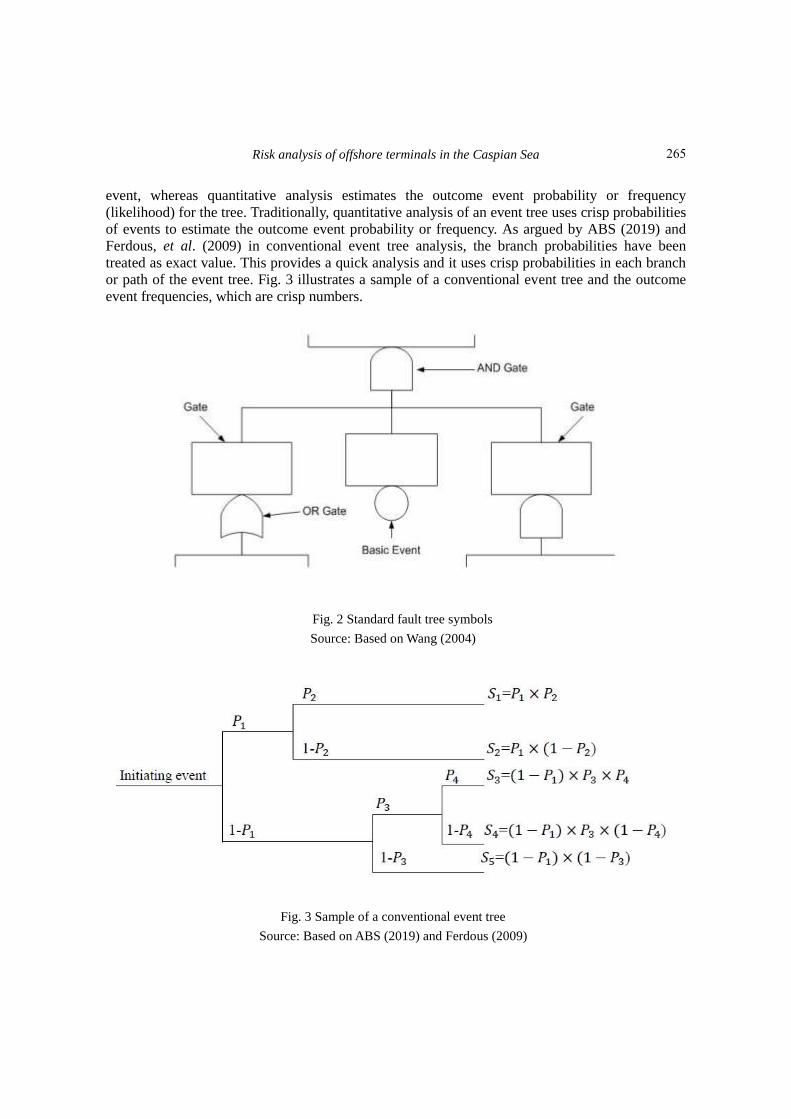
consists of the top event, the basic events, and the logic gates Jichuan et al. (2018). Fig. 2
illustrates the key fault tree analysis symbols. There are two important types of events i.e. top
event and basic event. The top event represents an undesirable state of the system; the basic events
represent the state of the systems‟ components. FTA uses logic gates to describe the relationships
between the basic events and the top event. The AND logic gate denotes that the output is in a
failure state, if all the inputs are in failure state. The OR logic gate denotes that the output is in
failure state, if at least one of the inputs is in failure state. An intermediate event represents an
intermediate state of the system that is related directly or indirectly to the top event with a logic
gate Dokas and Karras (2009).
2.3 ETA
The event tree analysis has been successively used in pre-incident applications, to examine the
incident precursors and post-incident applications, and to identify the possible hazards (outcome
events) for an accidental event (ABS 2019, Ferdous et al. 2009, AIChE 2000, Lees 2005, CMPT
1999). Qualitative analysis in an event tree identifies the possible outcome events of an initiating
264
Risk analysis of offshore terminals in the Caspian Sea
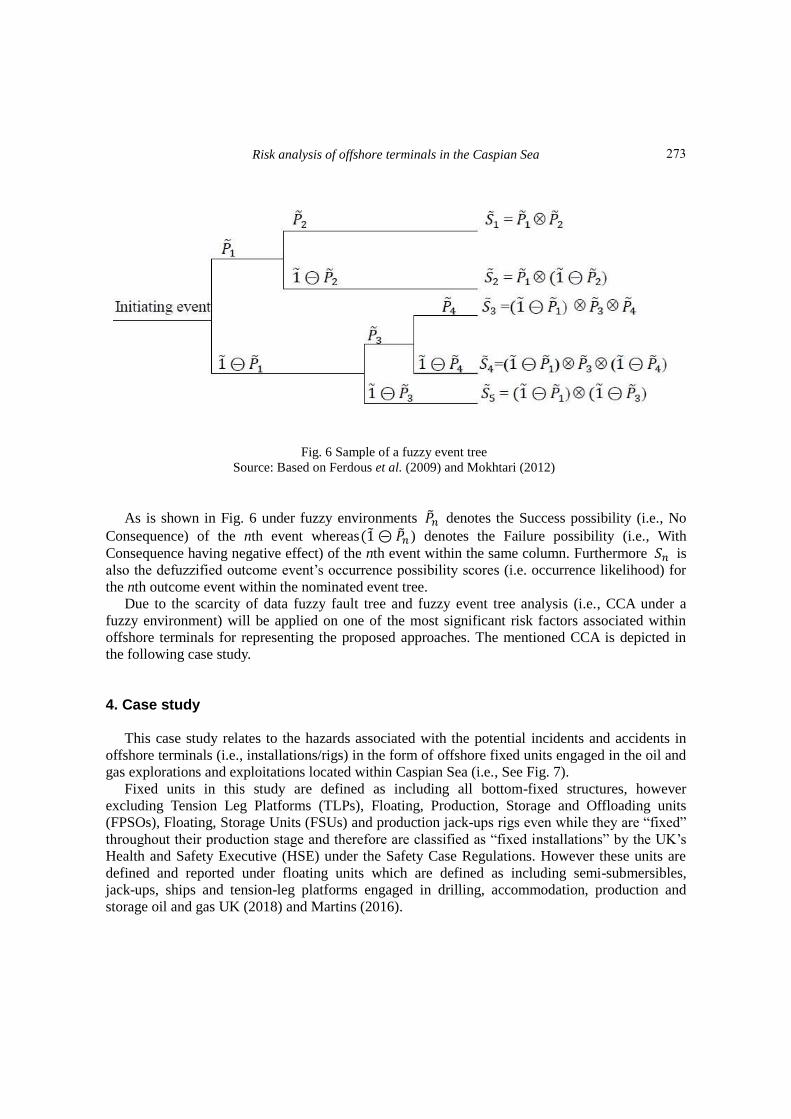
event, whereas quantitative analysis estimates the outcome event probability or frequency
(likelihood) for the tree. Traditionally, quantitative analysis of an event tree uses crisp probabilities
of events to estimate the outcome event probability or frequency. As argued by ABS (2019) and
Ferdous, et al. (2009) in conventional event tree analysis, the branch probabilities have been
treated as exact value. This provides a quick analysis and it uses crisp probabilities in each branch
or path of the event tree. Fig. 3 illustrates a sample of a conventional event tree and the outcome
event frequencies, which are crisp numbers.
Fig. 2 Standard fault tree symbols
Source: Based on Wang (2004)
Fig. 3 Sample of a conventional event tree
Source: Based on ABS (2019) and Ferdous (2009)
265

Kambiz Mokhtari and Jamshid Amanee
As it is shown 𝑃𝑛denotes the Success/True/Yes probability of the nth event whereas the (1- 𝑃𝑛)
denotes the Failure/False/No probability of the nth event within the same column. 𝑆𝑛is alsothe
calculated outcome eventfrequency for the nth outcome event within the depicted event tree. In
relation to ETA, ABS (2019) explains that this type of analysis can provide (1) qualitative
descriptions of potential problems (combinations of events producing various types of problems
from initiating events) and (2) quantitative estimates of event frequencies or likelihoods, which
assist in demonstrating the relative importance of various failure sequences.
3. Hazard analysis in offshore terminals
This paper will analyse the hazards which can be regarded as basic events and main causes for
a top event of “physical damage to offshore terminals” that have been identified and explained in
the authors‟ previous works Mokhtari (2011) and Ren et al. (2000). The illustrated hazards have
been previously identified through the risk identification i.e., HAZID process of the introduced
RM framework which is one of the risk identification techniques. This paper will analyse the
hazards (Basic Events) and consequences as a result of the mentioned risk factor (Top Event)
while using the bow-tie methodology accompanying the FTA and ETA methods.
This has been fulfilled by introducing a generic risk analyse model in Fig. 4 which shows the
addressed model has been integrated into a RM Framework of the offshore terminals. The
previously identified offshore terminals‟ risk factors have been prioritised and ranked with the use
of the Fuzzy Analytical Hierarchy Process (FAHP) method. Eventually one of the most significant
risk factors identified was “physical damage to offshore terminals”. As mentioned before if it is
considered that this risk factor is top event then with the use of Fig. 4 its main causes (i.e., basic
events or hazards) and potential outcome consequences can be analysed while using CCA method.
3.1 Methodology for hazard analysis
The cause-consequence diagram method (See Fig. 1) Andrew and Ridley (2002) is based on the
occurrence of critical event, which for example may be an event, involving the failure of
components or subsystems that is likely to produce hazardous consequences. Once a critical event
has been identified, all relevant causes of it and its potential consequences are developed using two
conventional reliability analysis methods i.e., FTA and ETA which were explored previously. FTA
is used to describe the causes of an undesired event. ETA shows the consequences that a critical
event may lead to if one or more protection systems do not function as designed. In this paper with
the use of the CCA and fuzzy set theory, fuzzy failure probability for a top event along withits
basic events (potential hazards)will be estimated. The selected risk factor will be evaluated and
analysed with the use of a case study. This will help examining the introduced risk analyse tool
that can suit for RM purposes in offshore terminals. Fuzzy set theory, experts‟ judgements,
converting linguistic terms to fuzzy numbers and defuzzification processes will be used to obtain
the Fuzzy Possibly Scores (FPSs) for the basic events in order to determine their Fuzzy Failure
Probabilities (FFPs) as well as to determine a final FFP for top event in this paper. As in this
study Triangular Fuzzy Numbers (TFNs) will be employed, these processes are fully explained in
the following section. Additional information and steps needed for evaluation of the selected risk
factor by the use of CCA and in form of FFTA and FETA have been explained in the next sections.
266

Risk analysis of offshore terminals in the Caspian Sea
Fig. 4 A generic Risk Analysis Model integrated into a RM Framework
267

Kambiz Mokhtari and Jamshid Amanee
3.1.1 Fuzzy set theory Fuzzy set theory was introduced to deal with vagueness of human judgement, which was
oriented to the rationality of uncertainty caused by imprecision or vagueness (Keller and Tahani
1992, Saaty 2001, Murtaza 2003, Takagi and Hayashi 1991, Zadeh 1965, Marco 2018). A major
contribution of fuzzy set theory is its capability of representing vague data. Fuzzy set is a class of
objects with a continuum of grades of membership. Such a set is characterised by a membership
(characteristic) function, which assigns to each object a grade of membership ranging between
zero and one. The theory also allows mathematical operators and programming to apply to the
fuzzy domain. Furthermore a fuzzy set is an extension of a crisp set. Crisp sets only allow full
membership or non-membership at all, whereas fuzzy sets allow partial membership Balli and
Korukoglu (2009).
On the other hand fuzzy numbers are the special classes of fuzzy quantities. A fuzzy number is
a fuzzy quantity M that represents a generalisation of a real number r. Intuitively; M (x) should be
a measure of how well M(x) “approximates” r Nguyen and Walker (2000). A fuzzy number M is a
convex normalised fuzzy set. A fuzzy number is characterised by a given interval of real numbers,
each with a grade of membership between 0 and 1. It is possible to use different fuzzy numbers
according to the situation and in practice triangular and trapezoidal fuzzy numbers are used Klir
and Yuan (1995). As Ertugrul and Karakasoglu (2007) expressed in applications it is often
convenient to work with Triangular Fuzzy Numbers (TFNs) because of their computational
simplicity, and they are useful in promoting representation and information processing in a fuzzy
environment. A TFN i.e., �� is shown in Fig. 5.
A tilde ‘~’ will be placed above a symbol if the symbol represents a fuzzy set. TFNs are
defined by three real numbers, indicated simply as (𝑙 ,𝑚 ,𝑢 ). The parameters 𝑙 , 𝑚 and 𝑢 ,
respectively, indicate the smallest possible value, the most promising value, and the largest
possible value that describe a fuzzy event Kaufmann and Gupta (1985). Their membership
functions as shown in the Fig. 5 can be defined as follows
𝜇��(𝑥)=
{
0, 𝑖𝑓 𝑥 ≤ 𝑙𝑥−𝑙
𝑚−𝑙, 𝑖𝑓 𝑙 < 𝑥 < 𝑚
1, 𝑖𝑓 𝑥 = 𝑚𝑢−𝑥
𝑢−𝑚, 𝑖𝑓 𝑚 < 𝑥 < 𝑢
0, 𝑖𝑓 𝑥 ≥ 𝑢
(1)
There are various operations on TFNs. However, three of the main operations used in this study
are illustrated here. Moreover two positive TFNs are ��1= (𝑙1, 𝑚1, 𝑢1) and ��2 = (𝑙2, 𝑚2, 𝑢2)
and 𝑙1 , 𝑚1 , 𝑢1, 𝑙2 , 𝑚2 , 𝑎𝑛𝑑 𝑢2are real numbers. The distance measurement d (��1, ��2) is
identical to the Euclidean distance Chang (1996) and Chen (2000). Then under fuzzy
environments their basic operations such as their addition i.e., ⊕, multiplication i.e., and
subtraction i.e., ⊝can be defined as follows Yang and Hung (2007)
��1 ⊕ ��2 =(𝑙1,𝑚1,𝑢1) ⊕ (𝑙2,𝑚2,𝑢2) = (𝑙1 ⊕ 𝑙2,𝑚1 ⊕ 𝑚2,𝑢1 ⊕ 𝑢2) (2)
��1 ��2 = (𝑙1,𝑚1,𝑢1) (𝑙2,𝑚2,𝑢2) = (𝑙1 𝑙2, 𝑚1𝑚2, 𝑢1 𝑢2) (3)
��1 ⊝ ��2 = (𝑙1,𝑚1,𝑢1)⊝(𝑙2,𝑚2,𝑢2)=(𝑙1 ⊝ 𝑢2, 𝑚2 ⊝ 𝑚1, 𝑢1 ⊝ 𝑙2) (3)
268

Risk analysis of offshore terminals in the Caspian Sea
Fig. 5 A Triangular Fuzzy Number (TFN),��
Source: Based on Zadeh (1965) and Chang (1996) Table 1 Transformation for Fuzzy membership functions
Grade Occurrence Likelihood (��) Consequence Severity (��) Membership Function
1 Very Low (VL) Slight (SL) (0.00,0.00,0.25)
2 Low (L) Minor (MI) (0.00,0.25,0.50)
3 Medium (M) Moderate (MO) (0.25,0.50,0.75)
4 High (H) Critical (CR) (0.50,0.75,1.00)
5 Very High (VH) Catastrophic (CA) (0.75,1.00,1.00)
Other algebraic operations such as change of sign, subtraction, division etc. with fuzzy numbers
can be found in (Zimmerman 1996, Kahraman 2001, Ren et al. 2007).
Due to the highly subjective nature and lack of information, it is usually difficult to measure
risk parameters i.e., occurrence likelihood and consequence severity of the risk factors precisely. A
reasonable and suitable way to express these parameters is to use qualitative linguistic variables
particularly during experts‟ judgments. To estimate the occurrence likelihood, for example, one
may often use such variables as very low, low, medium, high and very high. Additionally to assess
the consequence severity also one may use such variables as slight, minor, moderate, critical and
catastrophic.
These subjective linguistic variables can be further defined in terms of membership functions.
A membership function is a curve that defines how each point in the input space is mapped to a
membership value between 0 and 1. Of these membership functions, the simplest are the triangular
and trapezoidal fuzzy numbers Li and Liao (2007). As TFNs are decided to be used in this paper to
represent the linguistic variables for this purpose they have been shown in Table 1 (Yang and Hung,
2007, Anoop et al. 2006). Thus membership degrees of risk parameters as they range from 0 to 1
can be assigned by experts, with reference to Table 1 in a fuzzy environment.
269

Kambiz Mokhtari and Jamshid Amanee
3.1.2 Fuzzy FTA The conventional FTA has been used broadly, however, it is often very difficult to assess the
precise failure rates or failure probabilities for individual components or failure events. This
happens particularly in systems like nuclear power plants where available data are insufficient for
statistical inferences or the data show a large variation Jackson and Hockenbury (1981). To
overcome these difficulties the use of FST (Liang and Wang 1993, Singer 1990) is being
considered. In this respect the failure possibility defined by a TFN on the interval [0,1] is used to
characterise the possible deviation of the basic events. Therefore the concept of the failure
possibility can be applied to overcome the deficiencies which probability approach had during
implementing of the traditional fault tree analysis to handle vagueness Liang and Wang (1993). In
this study the same will be used hereafter and the failure possibilities are considered as triangular
fuzzy sets to incorporate the uncertainties in the parameters.
In normal cases where there are sufficient data and considering the fact that the probability of the
events are only relative frequencies of their occurrences (Andrew and Moss 2002, Henley and
Kumamoto 1981) for an AND gate event, its probability can be obtained by Eq. (5)
( ) =
n
i 1
(5)
Where P is the probability of top event; denotes the failure probability of the basic event i and
n is the number of basic events associated with the AND gate. For an OR gate event, its probability
is determined by Eq. (6).
( ) =
n
i 1
( ) (6)
Furthermore there is also a gate called NEG gate in which its probability is equivalent to 1-
Cheng and Lan (2004). Whereas due to the scarcity of the hazardous events‟ occurrences and
insufficient data as explained before it is realistic to use fuzzy FTA instead of its traditional
version. The fuzzy form of “AND” and “OR” operations functions can be obtained in Eqs. (7) and
(8) as follows Cheng and Lan (2004)
( ) =
n
i 1
(7)
( ) = ⊝
n
i 1
( ⊝ ); = (1, 1, 1) (8)
3.1.2.1 Procedure for carrying out a FFTA Steps for carrying out a FFTA in this paper are summarised as follows:
Step 1- Select a top event (i.e. a risk factor) and build a logic fault tree diagram for it.
Step 2- Divide the basic events (hazards) of any fault tree logic diagram into probability
analysis of the known events and possibility analysis (subjective linguistic evaluations) of
unknown or vague events.
270

Risk analysis of offshore terminals in the Caspian Sea
If all of the events are unknown a subjective linguistic evaluation as explained in Steps 3 and 4
should be carried out in the form of a possibility analysis in order to obtain the failure possibilities
for basic events and eventually for top event under fuzzy environment. Moreover if all the events
were known, they will be evaluated by the use of conventional or traditional FTA method i.e.
probability analysis. Nevertheless, if some of them are known and some are unknown they will be
evaluated by combination approach using the both possibility and probability approaches
explained in Steps 5 and 6 respectively.
Step 3- Conduct the linguistic assessments for vague events.
Step 4- Transform linguistic expressions into fuzzy numbers and aggregate the experts‟
opinions into one fuzzy number.
For this purpose as Clemen and Winkler (1999) explained due to different opinion of possibility
of the basic events, it is necessary to combine or aggregate the opinion into a single one. There are
many methods to aggregate fuzzy numbers; an appealing approach is the as follows (functions
needed for this aggregation is shown in Section 3.1.1)
m
iji WM Aij
1
, j=1, 2,…, n (9)
Where𝐴𝑖𝑗 is the linguistic expression of a basic event i given by expert j. m is the number of
basic events. n is the number of the experts. 𝑊𝑗is a weighting factor of the expert j and 𝑀𝑖
represents combined fuzzy number of the basic event i.
Step 5- Convert fuzzy numbers of the failure possibilities (i.e., FPSs) for the vague events into
their Fuzzy Failure Probabilities (i.e., FFPs) using Eq. (10); Onisawa and Nishiwaki (1988).
FFP={
, 𝑺
, 𝑺 = , K = *(
− 𝑺
𝑺)+
× 2.31 (10)
Step 6 – Convert the available failure probabilities (crisp values) of the real data into Fuzzy
Failure Probabilities (FFPs) using Table 2 (Lind 1983, Miller and Swain 1987).
Step 7- Obtain the final FFP for the top event by integrating FFPs obtained through Steps5 and
6 using Eqs. (7) and/or (8). In order to defuzzify FFP of the top event three fuzzy parameters will
be added together and then will be divided by three to find the centre of their gravity i.e.,
defuzzification (transforming the fuzzy number to crisp value) (Tuhua and Dataob 2005, Zhao and
Govind 1991).
Table 2: Guide line for Lower and Upper Bound of the Estimated Failure Rate
Failure rate (Fi) Lower Bound Upper Bound
0.01< Fi Fi ÷ 5 2 × Fi
0.001< Fi < 0.01 Fi ÷ 3 3 × Fi
Fi < 0.001 Fi ÷ 10 10 × Fi
Source: Based on Lind (1983); Miller and Swain (1 987)
271

Kambiz Mokhtari and Jamshid Amanee
Step 8- Analyse and interpret the results. 3.1.3 Fuzzy ETA In practice, it is hard and costly to get exact values for event occurrences because in a most of
cases these estimated values are the results of an experts‟ inadequate knowledge, incomplete
information, poor quality data or unsatisfactory analysis of a failure mechanism. These
unavoidable problems impart uncertainties in the ETA and make the entire risk analysis process
less credible for decision making. In addition, experts‟ judgments are qualitative and linguistic in
nature and may suffer from inconsistency if lack of consensus among various experts arises. The
classical probabilistic framework is not very effective to deal with vague or
incomplete/inconsistent concepts Rosqvist (2003) and Druschel et al. (2006). The existing research
(Abrahamsson 2002, Thacker and Huyse 2003, Wilcox and Ayyub 2003) discusses methods to
handle uncertainties in experts‟ judgments and to interpret them for the purpose of conducting risk
analysis. Fuzzy sets theory has proven effective and efficient in handling these types of
uncertainties (Chen 2000, Wilcox and Ayyub 2003, Sentz and Ferson 2002, Bae et al. 2004,
Agarwal et al. 2004, Ayyub and Klir 2006). Therefore under fuzzy environment ��𝑛denotes the
Success/True/Yes possibility of the nth event whereas the(1 ⊝ ��𝑛) denotes the Failure/False/No
possibility of the nth event within the same column. Furthermore𝑆𝑛 also is the defuzzified
outcome event‟s occurrence possibility scores for the nth outcome event within the nominated
event tree.
3.1.3.1 Procedure for carrying out a FETA The below mentioned steps demonstrate how to analyse an event tree using fuzzy set theory. In
the suggested approach, the subjective judgment of event possibility is assumed linguistic and
described using a TFN. The fuzzy possibility of initiating event is then used to estimate the
outcome events‟ possibilities that are also estimated as fuzzy numbers. The fuzzy-based approach
used for ETA comprises the following five steps:
Step 1- For an initiating event (i.e., a risk factor) identified within the offshore terminals, the set
of possible consequence and no consequence states must be defined to construct the event tree
logic diagram.
Step 2- Define initiating event‟s possibility using TFNs. (See Steps 3, 4, 5, 6 and 7 of the
FFTA).
Step3- Determine each of the outcome events‟ possibilities as a TFN by calculating the all fault
tree paths (i.e., See Fig. 6) by the use of Eqs. (2)-(4).
Step 4: Defuzzify the outcome events‟ possibilities (FPSs) to obtain a crisp value for each event
tree consequence.
Step 5- Analyse and interpret the results.
272
Risk analysis of offshore terminals in the Caspian Sea
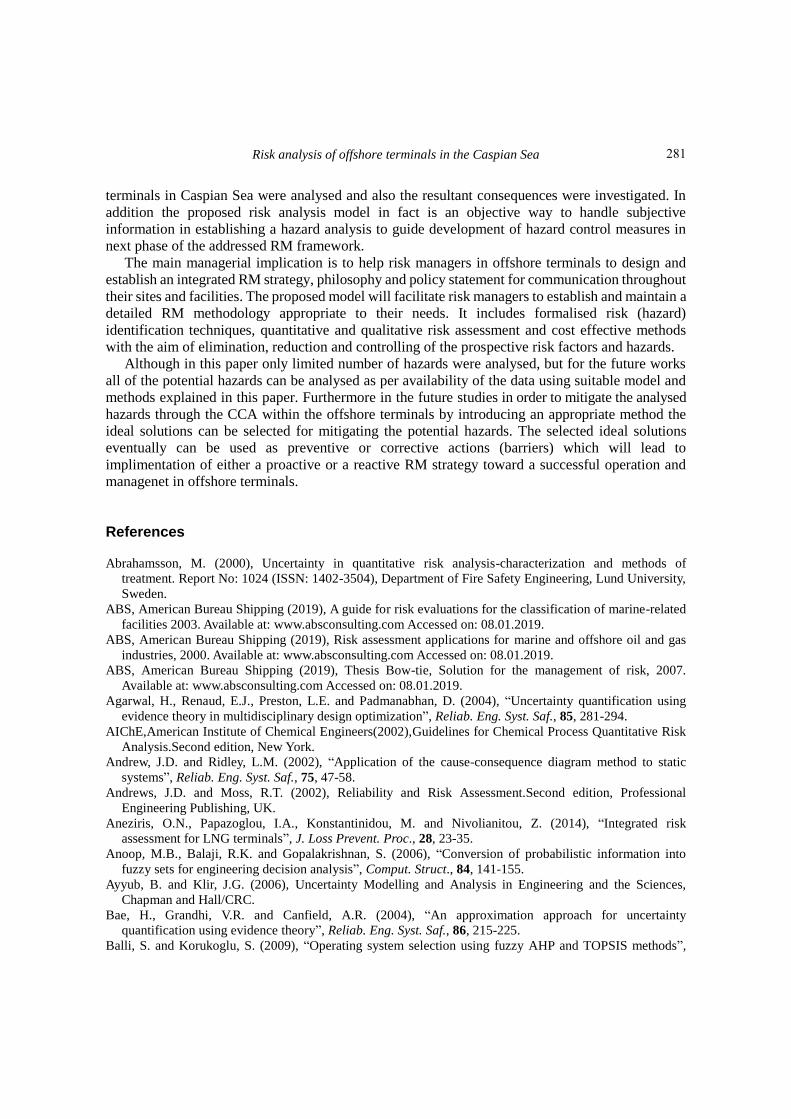
Fig. 6 Sample of a fuzzy event tree
Source: Based on Ferdous et al. (2009) and Mokhtari (2012)
As is shown in Fig. 6 under fuzzy environments ��𝑛 denotes the Success possibility (i.e., No
Consequence) of the nth event whereas(1 ⊝ ��𝑛 ) denotes the Failure possibility (i.e., With
Consequence having negative effect) of the nth event within the same column. Furthermore 𝑆𝑛 is
also the defuzzified outcome event‟s occurrence possibility scores (i.e. occurrence likelihood) for
the nth outcome event within the nominated event tree.
Due to the scarcity of data fuzzy fault tree and fuzzy event tree analysis (i.e., CCA under a
fuzzy environment) will be applied on one of the most significant risk factors associated within
offshore terminals for representing the proposed approaches. The mentioned CCA is depicted in
the following case study.
4. Case study
This case study relates to the hazards associated with the potential incidents and accidents in
offshore terminals (i.e., installations/rigs) in the form of offshore fixed units engaged in the oil and
gas explorations and exploitations located within Caspian Sea (i.e., See Fig. 7).
Fixed units in this study are defined as including all bottom-fixed structures, however
excluding Tension Leg Platforms (TLPs), Floating, Production, Storage and Offloading units
(FPSOs), Floating, Storage Units (FSUs) and production jack-ups rigs even while they are “fixed”
throughout their production stage and therefore are classified as “fixed installations” by the UK‟s
Health and Safety Executive (HSE) under the Safety Case Regulations. However these units are
defined and reported under floating units which are defined as including semi-submersibles,
jack-ups, ships and tension-leg platforms engaged in drilling, accommodation, production and
storage oil and gas UK (2018) and Martins (2016).
273

Kambiz Mokhtari and Jamshid Amanee
Table 3 Basic Events (Hazards) which can cause Top Event of “damage to offshore terminals”
Basic Events (Hazards) Basic Event (Hazard) No
Fire and Explosions BE 1
Collisions and Contact damages BE 2
Structural failures BE 3
Helicopter crush BE 4
Terrorism and Sabotage BE 5
War and Political perils BE 6
Ice damages BE 7
Storm damages BE 8
Earthquake and Tsunami BE 9
Source: Based on UKHSE (2019), Mather (2009) and Sharp (2009)
There are many hazards with different natures and categories and in order to make any analysis
of the addressed hazards first it is required to break them down into board categories or areas such
as internal/external hazards or other simple frameworks such as
operational/technical/legal/environmental types of hazards or risk factors in order for categorising
sources of hazards but in this paper only the ones which can directly affect an offshore terminal
and cause physical damage or in extreme cases would lead to total destruction of the offshore
terminals as shown in Table 3 will be examined hereafter. As is mentioned there are many other
types of hazards which can affect the site indirectly and they are not be regarded as direct causes
of a damage or destruction. Some of them are such as blowouts, cranes, falling objects, leakages,
spills/releases, and wells‟ problems etc which have been decided not to be incorporated here for
the purpose of this paper. Apart from the basic events (hazards) such as BE1 to BE4 which can be
classified under operational risk factors, others e.g., BE5 to BE9 can only be initiated via external
sources of uncertainties such as natural disasters, act of war, terrorism etc.
Caspian Sea is the largest lake on the planet. The sea is bordered by the countries of Azerbaijan,
Russia, Kazakhstan, Turkmenistan and Iran. There are many of oil and natural gas production
platforms along the edges of the sea especially within the coasts of Azerbaijan and Turkmenistan.
In addition, large quantities of sturgeon live in its waters, and the caviar produced from their eggs
is a valuable commodity. Fresh water flows into the sea via the Volga River and Ural River in the
North, however, the sea remains somewhat salty only in centre and South of the Caspian Sea. The
highest depth of water is in South which is 1025 m.
Until the date Caspian Sea has not been stroke by any kind of heavy storms,
earthquakes/tsunamis or severe ice. However occasional passing fronts in autumns and winters with
the North Atlantic origin disturb the sea in timely bases but cannot be accounted as severe types to
damage the offshore terminals. As they pass in West-East direction and the area they affect is small
in compare to other seas e.g. North Sea, Mediterranean Sea, their effect is not felt harshly.
Additionally in North of Caspian Sea during winters formation of ice is always evident. Ice
formation is not taken place in central parts and Southern parts of the sea Barannik (2004).
274

Risk analysis of offshore terminals in the Caspian Sea
Fig. 7 Map of Caspian Sea
Source: Based on World Atlas (2019) Presently there is no available data or report on terrorism activities in the region. The nearest of
such activities can be traced in Republic of Chechnya (i.e., City of Groznyy) in Russia which is
near to Northwest of Caspian Sea CNN (2019). There is no report on any war or potential political
perils except the international disputes which have been going on for nearly a decade among the
states bordering the Caspian Sea for settling the dispute about the legal status of the sea
Haghayeghi (2003).
All five littoral states of Azerbaijan, Iran, Kazakhstan, Russia, and Turkmenistan have plans to
further exploit the sea‟s estimated oil reserves. Presently major oil companies e.g., TOTAL, BP,
EXXONMOBILE, CHEVRON etc with good reputation are active in Caspian Sea near costs of
Azerbaijan especially in conjunction with the major pipeline project of BAKU-JIHAN. Such
activities mean drilling new wells, highlighting risks for an incident that could cause catastrophic
effects such as damage to offshore terminals within the landlocked Caspian Sea i.e., the largest
inland body of water on earth OWJE (2019).
275

Kambiz Mokhtari and Jamshid Amanee
Fig. 8 Fault tree diagram for Top Event of “damage to offshore terminals “along with Basic Events
“The accident in the Gulf of Mexico shows that such a disaster could happen anywhere. The
United States, with its super-modern technologies, is barely capable of stopping this disaster,”
Gulaliyev says. “You can imagine the scale of the damages to the environment from such incidents
in countries like Azerbaijan” RFERL (2018). As a result major consequences for the risk factor i.e.,
“damage to offshore terminals” can be loss of life, property, reputation and damage to environment
(ABS 2019, Aneziris et al. 2014, Wu 2015, Nagi et al. 2018). Fig. 8 is fault tree diagram for Top
Event i.e., “damage to offshore terminals”. Failure probabilities or occurrence frequencies (crisp values) for operational types of hazards
such as BE1 [i.e., Fire (0.203) and Explosion (0.011) = 0.214], BE2 [i.e., Collision (0.0085) and
Contact (0.030) = 0.0385], BE3 [i.e., Structural = (0.0034)] and BE4 [i.e., Helicopter = (0.0016)] in
the form of number of incidences and incidence frequencies (per unit year) are (0.2140), (0.0385),
(0.0034) and (0.0016) respectively. Since for the cases of marine losses and/or damages, hazards
for instance fire and explosion or others such as collision and contact are considered in same
categories therefore each of these two types have been regarded as one individual basic event and
for this reason their occurrence frequencies as is mentioned above were added together. The origin
of data is based on accident statistics for offshore fixed units from 1990 to 2007. These data are
based on the combination of original data gathered from different databases as is mentioned (i.e.
See Table 2: All fixed units from Page 8) in oil and gas UK (2018). The available failure
probabilities will be transformed into FFPs using Table 2 while implementing the probability
approach. The calculated FFPs of the known failure rates (i.e., BE1 to BE4) are shown in Table 5.
On the other hand as there is no data for external types of hazards such as BE5, BE6, BE7,BE8
and BE9 via using possibility approach the FPSs obtained through the experts‟ judgements (See
Table 4) will be transformed into FFPs through using Eq. (10). In this regard the calculated FFPs
of the unknown failure rates (i.e., BE5 to BE9) are shown in Table 5. Therefore primarily after
collecting the experts‟ opinions through the predesigned evaluation sheet the following
calculations are carried out in order to determine the FPSs for the mentioned basic events listed in Table 4. Furthermore Table 1 is used for carrying out the following estimations:
BE5= W1 L W2VL W3 L = (0.00, 0.17, 0.42)
BE6= W1 L W2 L W3M = (0.08, 0.33, 0.58)
276

Risk analysis of offshore terminals in the Caspian Sea
BE7 =W1VL W2 L W3VL = (0.00, 0.08, 0.33)
BE8= W1VL W2VL W3VL= (0.00, 0.00, 0.25)
BE9= W1 L W2 L W3 L = (0.00, 0.25, 0.50)
Fuzzy Possibility Scores (FPSs) for the basic events BE5 to BE9 shown in Fig.4 are transformed
into Fuzzy Failure Probabilities (FFPs) in Fig. 5 via using Eq. (10). Due to the scarcity of data and the fact that some of the basic events (hazards) were vague and
in order to determine the failure rate for the risk factor i.e., “damage to offshore terminals” it has
been decided to carry out the evaluation by using the experts‟ judgements. To carry out an
optimum experts‟ judgements in this paper, three experts have been selected to carry out the
judgements process. All experts have their Bachelor i.e. BSc and Master i.e., MSc degrees in
maritime related fields. In addition each has served as a harbour pilot previously for 5 years in
different Iranian offshore terminals. Each expert has near 15 years‟ experience on offshore
terminals‟ operations and management. Experts are now holding managerial positions in different
operational fields for Iranian offshore terminals. The main factor for selecting these experts was
based on their expertise that they have equally contributed in the related fields as a result they have
a thorough knowledge about the risk factor of “damage to offshore terminals”. For this reason
these experts will have equal weights (i.e., Wn) in respect of each other that would affect equally
the evaluation processes for the mentioned top event in Caspian Sea. After collecting the experts‟
opinions and integrating them by means of Eqs. (2) and (9) with the use of Eq. (8) the required
calculations will be carried out in order to find out the final FFP of the nominated top event for the
purpose of Caspian Sea. The calculated FFP of the top event i.e., after defuzzification was
found to be 0.265. Then by eliminating of each basic event the new FFPs for the new top events i.e.
; (i=1,2,3,..,9) will be obtained respectively as shown in Table 6. Subsequently the amount of
each deviation i.e., [ ⊝ has been recorded under the deviation index column in Table 6.
The greater number for deviation index means having higher importance on the FFP of the top event.
That means elimination of any basic even (hazard) which can lead to a higher deviation index will
reduce the failure probability of the top event more than in the case of other eliminations. As it is
shown in Table 6 basic event number one i.e., BE1 has the highest importance among others. In
[ ⊝ ; TE denote top event of “damage to offshore terminals” and TEi denotes the top event
which its ith basic event (hazard) is eliminated.
Table 4 Table of Fuzzy Possibility Scores (FPSs) for unknown failure rates
Basic Event (BE) Number FPSs
5 (0.00, 0.17, 0.42)
6 (0.08, 0.33, 0.58)
7 (0.00, 0.08, 0.33)
8 (0.00, 0.00, 0.25)
9 (0.00, 0.25, 0.50)
277

Kambiz Mokhtari and Jamshid Amanee
Table 5 Table of Fuzzy Failure Probabilities (FFPs) for known and unknown failure rates
Basic Events (Hazards) Number FFPs
BE 1 (0.0428, 0.2140, 0.4280)
BE 2 (0.0077, 0.0385, 0.0770)
BE 3 (0.0011, 0.0034, 0.0102)
BE 4 (0.0005, 0.0016, 0.0048)
BE 5 (0.0000, 0.0001, 0.0027)
BE 6 (0.000006, 0.0012, 0.0048)
BE 7 (0.0000, 0.000006, 0.0012)
BE 8 (0.0000, 0.0000, 0.0005)
BE 9 (0.0000, 0.0005, 0.0049)
Table 6 Importance of elimination of each basic event in failure probability of the top event
Elimination
of Basic
Events
FFPs for new Top Events after elimination of
the related Basic Events (Hazards)
Defuzzified
FFPs for
new Top
Events
Deviation
index Ranking
l m u
BE 1 0.010 0.045 0.114 0.0563 0.2087 1
BE 2 0.045 0.219 0.451 0.2383 0.0267 2
BE 3 0.051 0.246 0.488 0.2616 0.0034 3
BE 4 0.052 0.248 0.491 0.2637 0.0013 6
BE 5 0.052 0.250 0.492 0.2647 0.0003 9
BE 6 0.052 0.248 0.489 0.2630 0.0020 4
BE 7 0.052 0.249 0.489 0.2633 0.0017 5
BE 8 0.052 0.249 0.492 0.2643 0.0007 8
BE 9 0.052 0.249 0.491 0.2640 0.0010 7
FFP for the top event i.e. “damage to offshore terminals” are calculated by the use of the fuzzy
fault three analysis using Eq. (8) as follows:
��(𝑂𝑅) =1 ⊝
n
i 1
(1 ⊝ ��𝑖); 1 = (1,1,1)
��𝑇𝐸 =1 ⊝ [(1 ⊝ ��𝐵𝐸1) (1 ⊝ ��𝐵𝐸2) (1 ⊝ ��𝐵𝐸3) (1 ⊝ ��𝐵𝐸4) (1 ⊝ ��𝐵𝐸5) (1 ⊝ ��𝐵𝐸6)
(1 ⊝ ��𝐵𝐸7) (1 ⊝ ��𝐵𝐸8) (1 ⊝ ��𝐵𝐸9)] = (0.052, 0.249, 0.493) = 0.265 i.e., defuzzified FFP
for the risk factor of “damage to offshore terminals”.
Fig. 9 illustrates the sensitivity analysis carried out for the top event i.e., “damage to offshore
terminals”, based on the results shown in the Table 6. It shows that by elimination of any basic
event (hazard) how the FFP for the related new top event will be reduced.
278

Risk analysis of offshore terminals in the Caspian Sea
Fig. 9 Sensitivity analysis for top event of i.e. “damage to offshore terminals”
Fig. 10 Event tree analysis for risk factor “damage to offshore terminals”
Source: Consequences are based on ABS (2019)
279

Kambiz Mokhtari and Jamshid Amanee
Table 7 Occurrence possibility scores for different consequences
No Consequences Likelihoods Rankings
1 No Consequences 0.803 1
2 Loss of Life 0.133 3
3 Loss of Property 0.187 2
4 Damage to Environment 0.117 4
5 Loss of Reputation 0.084 5
Fig. 10 illustrates the event tree analysis for the risk factor “damage to offshore terminals”
along with linguistic fuzzy variables. In order to evaluate the addressed consequences it has been
decided to carry out the evaluation using the experts‟ judgements. The same experts used in
previous section have been asked for the evaluation purposes here (See Page 18). Estimations for
the event tree shown in Fig. 10 are as follows
��1 = W1H+W2H+W3VH = (0.58, 0.83, 1.00); S1 = 0.803 defuzzified value
(1 ⊝ ��1) ��21= (0.00, 0.17, 0.42) (W1MW2MW3M) =
(0.00, 0.17, 0.42) (0.25, 0.50, 0.75) = (0.00, 0.085, 0.315);
S2 = 0.133 defuzzified value
(1 ⊝ ��1) ��22 = (0.00, 0.17, 0.42) (W1HW2HW3VH) =
(0.00, 0.17, 0.42) (0.58, 0.83, 1.00)= (0.00, 0.141, 0.42);
S3 = 0.187 defuzzified value
(1 ⊝ ��1) ��23 = (0.00, 0.17, 0.42) (W1MW2 LW3M) =
(0.00, 0.17, 0.42) (0.17, 0.42, 0.67)= (0.00, 0.071, 0.281);
S4 = 0.117 defuzzified value
(1 ⊝ ��1) ��24= (0.00, 0.17, 0.42) (W1 LW2 LW3 L) =
(0.00, 0.17, 0.42) (0.00, 0.25, 0.50)= (0.00, 0.042, 0.21);
S5 = 0.084 defuzzified value
As there is no data for the mentioned consequences therefore only possibility approach under
fuzzy environment have been incorporated in this section of the study. By using Eqs. (2)-(4); Table
1 and procedure mentioned in Subsection 3.1.3.1 (i.e., See Fig. 6) the final results obtained in this
paper are listed in Table 7 along with rankings for consequences. As it can be seen consequence
number one i.e., “damage to offshore terminals” with no consequences (i.e., Near Miss) will have
the highest occurrence possibility score.
5. Conclusions
This paper evaluated one of the most significant risk factors in offshore terminals by use of the
CCA in order to complete the risk assessment phase of the RM framework within the offshore
terminals. However through this process all the potential hazards causing damage to offshore
280
Risk analysis of offshore terminals in the Caspian Sea
terminals in Caspian Sea were analysed and also the resultant consequences were investigated. In
addition the proposed risk analysis model in fact is an objective way to handle subjective
information in establishing a hazard analysis to guide development of hazard control measures in
next phase of the addressed RM framework.
The main managerial implication is to help risk managers in offshore terminals to design and
establish an integrated RM strategy, philosophy and policy statement for communication throughout
their sites and facilities. The proposed model will facilitate risk managers to establish and maintain a
detailed RM methodology appropriate to their needs. It includes formalised risk (hazard)
identification techniques, quantitative and qualitative risk assessment and cost effective methods
with the aim of elimination, reduction and controlling of the prospective risk factors and hazards.
Although in this paper only limited number of hazards were analysed, but for the future works
all of the potential hazards can be analysed as per availability of the data using suitable model and
methods explained in this paper. Furthermore in the future studies in order to mitigate the analysed
hazards through the CCA within the offshore terminals by introducing an appropriate method the
ideal solutions can be selected for mitigating the potential hazards. The selected ideal solutions
eventually can be used as preventive or corrective actions (barriers) which will lead to
implimentation of either a proactive or a reactive RM strategy toward a successful operation and
managenet in offshore terminals.
References
Abrahamsson, M. (2000), Uncertainty in quantitative risk analysis-characterization and methods of
treatment. Report No: 1024 (ISSN: 1402-3504), Department of Fire Safety Engineering, Lund University,
Sweden.
ABS, American Bureau Shipping (2019), A guide for risk evaluations for the classification of marine-related
facilities 2003. Available at: www.absconsulting.com Accessed on: 08.01.2019.
ABS, American Bureau Shipping (2019), Risk assessment applications for marine and offshore oil and gas
industries, 2000. Available at: www.absconsulting.com Accessed on: 08.01.2019.
ABS, American Bureau Shipping (2019), Thesis Bow-tie, Solution for the management of risk, 2007.
Available at: www.absconsulting.com Accessed on: 08.01.2019.
Agarwal, H., Renaud, E.J., Preston, L.E. and Padmanabhan, D. (2004), “Uncertainty quantification using
evidence theory in multidisciplinary design optimization”, Reliab. Eng. Syst. Saf., 85, 281-294.
AIChE,American Institute of Chemical Engineers(2002),Guidelines for Chemical Process Quantitative Risk
Analysis.Second edition, New York.
Andrew, J.D. and Ridley, L.M. (2002), “Application of the cause-consequence diagram method to static
systems”, Reliab. Eng. Syst. Saf., 75, 47-58.
Andrews, J.D. and Moss, R.T. (2002), Reliability and Risk Assessment.Second edition, Professional
Engineering Publishing, UK.
Aneziris, O.N., Papazoglou, I.A., Konstantinidou, M. and Nivolianitou, Z. (2014), “Integrated risk
assessment for LNG terminals”, J. Loss Prevent. Proc., 28, 23-35.
Anoop, M.B., Balaji, R.K. and Gopalakrishnan, S. (2006), “Conversion of probabilistic information into
fuzzy sets for engineering decision analysis”, Comput. Struct., 84, 141-155.
Ayyub, B. and Klir, J.G. (2006), Uncertainty Modelling and Analysis in Engineering and the Sciences,
Chapman and Hall/CRC.
Bae, H., Grandhi, V.R. and Canfield, A.R. (2004), “An approximation approach for uncertainty
quantification using evidence theory”, Reliab. Eng. Syst. Saf., 86, 215-225.
Balli, S. and Korukoglu, S. (2009), “Operating system selection using fuzzy AHP and TOPSIS methods”,
281

Kambiz Mokhtari and Jamshid Amanee
Math. Comput. Appl., 14(2), 119-130.
Barannik, V., Borysova, O. and Stolberg, F. (2004), “The Caspian Sea region: Environmental change”, Royal
Swedish Academy of Sciences, 33, 1-2.
Bellamy, L.J., Alea, B.J.M., Geyerc, T.A.W., Goossensd, L.H.J., Haled A.R., Ohe, J., Mude, M., Bloemhofe,
A., Papazoglouf, I.A. and Whistong, J.Y. (2007), “Story builder, a tool for the analysis of accident
reports”, Reliab. Eng. Syst. Safe., 92, 735-744.
Blom, H.A.P., Everdij, M.H.C. and Daams, J. (1999), ARIBA Final Report Part II: Safety Cases for a new
ATM operation, NLR report TR-99587, Amsterdam.
CCPS, Centre for Chemical Process Safety (2000), Guideline for Chemical Process Quantitative Risk
Analysis, New York: Centre for Chemical Process Safety, American Institute of Chemical Engineers
(AIChE).
Chang, D.Y. (1996), “Applications of the extent analysis method on fuzzy AHP”, Eur. J. Operational Res.,
95, 649-655.
Chen, C.T. (2000), “Extensions of the TOPSIS for group decision-making under fuzzy environment”, Fuzzy
Set. Syst., 114, 1-9.
Cheng, C.W. and Lan, A.L.H. (2004), “Web access failure analysis fuzzy reliability approach”, Int. J.
Comput. Internet Management, 12(1), 65-73.
Chiara, V. and Giuseppe, M. (2014), “Risk analysis of LNG terminal: Case study”, Chem. Eng. T., 36,
277-282.
CIS, Chemical Industries Association (1992), A guide to Hazard and Operability Studies.
Clemen, R.T. and Winkler, R.L. (1999), “Combing probability distribution from experts in risk analysis”,
Risk Anal., 19(2), 187-203.
CMPT. (1999), A Guide to quantitative risk assessment for offshore installations. The centre of marine and
petroleum technology, UK.
CNN Report. (2019), Available at:
https://edition.cnn.com/2013/10/17/world/europe/chechnya-fast-facts/index.html. Accessed on 21.
January. 2019.
Cockshott, J.E. (2005), “Probability bow-ties. A transparent risk management tool”, Process Saf. Environ.
Protection, 83(4), 307-316.
DETR. Department of Transport, Port Marine Safety Code (2000), ISBN: 1 85112 365 2.
Dickson, G.C.A. (2003), Risk Analysis. The Institution of Risk Management, IRM, Witherby Publishing.
DNV, Det Norske Veritas (2000), Frequency analysis of accidental oil releases for FPSO operations in the
Gulf of Mexico. Final Report, Houston.
Dokas, I.M., Karras, D.A. and Panagiotakopoulos, D.C. (2009), “Fault tree analysis and fuzzy expert
systems: Early warning and emergency response of landfill operations”, Environ. Model. Softw., 24, 8-25.
Druschel, R.B., Ozbek, M. and Pinder, G. (2006), “Application of Dempster–Shafer theory to hydraulic
conductivity”, Proceedings of the CMWR-XVI, Conference Programme Copenhagen, Denmark.
Edwards, C.J. (1999), “Developing a safety case with an aircraft operator”, Proceedings of the 2nd Annual
Two-Day Conference on Aviation Safety Management, May 1999.
Elliott, M., Boyes, S. and Smyth, K. (2019), The Marine risk assessment and management using the Bow-tie
approach and its practical applications.Institute of Estuarine and Coastal Studies (IECS), University of
Hull, Hull HU6 7RX, UK. Available at:
http://coastal-futures.net/wp-content/uploads/2016/02/Elliott-The-Bow-Tie-Approach-risk-assessment-ilo
vepdf-compressed.pdf. Accessed on: 08.01.2019.
Ertugrul, D. and Karakasoglu, N. (2007), Performance evaluation of Turkish cement firms with fuzzy
analytic hierarchy process and TOPSIS methods, Expert Systems with Applications, Article in Press.
Ferdous, R., Khan, F., Sadiq, R., Amyotte, P. and Veitch, B. (2009), “Handling data uncertainties in event
tree analysis”, Process Saf. Environ. Protection, 87, 283-292.
GAO, United States Government Accountability Office (2019), Port risk management: Further Refinements
Needed to Assess Risks and Prioritize Protective Measures at Ports and Other Critical Infrastructure.
Report to Congressional Committees, 2005. Available at: https://www.gao.gov/new.items/d0691.pdf.
282

Risk analysis of offshore terminals in the Caspian Sea
Accessed on: 09.01.2019.
GEXCON (2019), World leading Company in the fields of safety and risk management, Available at:
https://www.gexcon.com.Accessed on: 07.01.2019.
Groeneweg, J. (1998), Controlling the controllable. Leiden: DSWO Press.
Haghayeghi, M. (2003), “The coming of conflict to the Caspian Sea”, Problems of Post-Communism, 50(3),
32-41.
Henley, J. and Kumamoto, H. (1981), Reliability engineering and risk assessment, Prentice Hall, Englewood
Clift, N J.
Hoyland, A. and Rausand, M. (1994), Systems Reliability Theory Models and Statistical Methods, John
Willey and Sons, New York.
HSE, Health and Safety Executive (2019), Feasibility of storybuilder software tool for major hazards
intelligence Prepared by the Health and Safety Laboratory for the Health and Safety Executive, 2010.
Available at: www.hse.gov.uk. Accessed on 02.01.2019.
Jackson, P.S., Hockenbury, R.W. and Yeater, M.L. (1981), “Uncertainty analysis of system reliability and
availability assessment”, Nucl. Eng. Des, 68, 5-29.
Kahraman, C. (2001), Capital budgeting techniques using discounted fuzzy cash flows. (Eds., Ruan, D.;
Kacprzyk, J. and Fedrizzi, M.), Soft Computing for Risk valuation and Management: Applications in
Technology, Environment and Finance, Physica- Verlag, Heidelberg, 375-396.
Kang, J. Sun, L. and Soares, C.G. (2018), “Fault tree analysis of floating offshore wind turbines”, Renew.
Energ., 1-13.
Kaufmann, A. and Gupta, M.M. (1985), Introduction to Fuzzy Arithmetic: Theory and Applications, Van
Nostrand Reinhold, New York.
Keller, J.M. and Tahani, H. (1992), “Implementation on conjunctive and disjunctive fuzzy logic rules with
neutral networks”, Int. J. Approx.Reason., 6, 221-240.
Klir, G.J. and Yuan, B. (1995), Fuzzy Sets and Fuzzy Logic: Theory and Application. Prentice Hall, New
Jersey.
Krishna, K., Wang, Y., Saraf, S.R., Rogers, W.J., Baldwin, J.T., Gupta, J.P. and Mannan, M.S. (2003),
“Hydroxylamine production: Will a QRA help you decide?”, Reliab. Eng. Syst. Safe., 81, 215-224.
Lees, F.P. (1996), Loss Prevention in the Process Industries. 2nd Ed., Boston.
Lees, F.P. (2005), Loss Prevention in the Process Industries. Butterworths, London. Third edition. 9, 05-122.
Li, Y. and Liao, X. (2007), “Decision support for risk analysis on dynamic alliance”, Decision Support Syst.,
42, 2043-2059.
Liang, G.S. and Wang, M.J. (1993), “Fuzzy fault-tree analysis using failure possibility”, Microelectron.
Reliab., 33, 583-597.
Lind, N.C. (1983), “Models of human error in structural reliability”, Struct. Saf., 1, 166-175.
Marco, E.G.V.C. (2018), “The likelihood interpretation as the foundation of fuzzy set theory”, Int. J. Approx.
Reason., 90, 333-340.
Mareike, L. and Athanasios, K. (2018), “A review of reliability-based methods for risk analysis and their
application in the offshore wind industry”, Renew. Sust. Energ. Rev., 91, 1065-1076.
Martins, M.R., Pestana, M.A., Souza, G.F.M. and Schleder, A.M. (2016), “Quantitative risk analysis of
loading and offloading Liquefied Natural Gas (LNG) on a floating storage and regasification unit
(FSRU)”, J. Loss Prevent. Proc., 43, 629-653.
Mather, A. (2009), FPSO Handbook. Witherby seamanship international Ltd. ISBN: 9781905331574.
Miller, D.P. and Swain, A.D. (1987), Human error and human reliability in G Salvendy, Handbook of human
factors, John Wiley and sons, Inc., New York.
Mokhtari, K. (2011), Advanced Risk Management in Offshore Terminals and Marine Ports, PhD Thesis.
Liverpool John Moores University.
Mokhtari, K. (2012), RISK MANAGEMENT - A Guideline for QHSES and Risk Managers in Offshore and
Marine Industries, LAMBERT Academic Publishing in Germany, April, 2012. ISBN: 9783848410286.
Mokhtari, K. and Ren, J. (2014), “A risk management methodology for maritime logistics and supply chain
applications”, Ocean Syst. Eng., Publisher: Korean Society of Ocean Engineers,4(2), 137-150.
283

Kambiz Mokhtari and Jamshid Amanee
Murtaza, M.B. (2003), Fuzzy-AHP Application to Country Risk Assessment. American Business Review.
Middle Tennessee State University, TN.
Nagi, A., Ashraf, Z., Mohamed, D., Ismail, E., Ahmed, M. and Wenming, S. (2018), “Operational risk
assessment of offshore transport barges”, Int. J. Ocean Eng., 156, 333-346.
Nagi, A., Mohamed, D., Ismail, E., Chai, Sh. and Abdusalam, A. (2018), “Risk assessment of LNG and
FLNG vessels during maneuvering in open sea”, J. Ocean Eng.Sci., 3, 56-66.
Nguyen, H.T. and Walker, E.A. (2000), A first course in fuzzy logic. Chapman and Hall/CRC, Florida.
Oil and gas UK (2018), Available at:
https://oilandgasuk.co.uk/wp-content/uploads/woocommerce_uploads/2015/10/HS029-2009-CURRENT-
Accident-Statistics.pdf Accessed on 20. March. 2018.
Onisawa, T. (1988), “An approach to human reliability in man-machine systems using error possibility”,
Fuzzy Set. Syst., 27, 87-103.
OWJE (2019), Available at: http://mapas.owje.com/maps/607_Northern-Caspian-Sea-Region-Map.html
Accessed on 21. January. 2019.
Ren, J., Jenkinson, I., Wang, J., Xu, D.L. and Yang, J.B. (2008), “A methodology to model causal relationships
on offshore safety assessment focusing on human and organisational factors”, J. Saf. Res., 39(1), 87-100.
Ren, J., Wang, J., Jenkinson. I., Xu, D.L. and Yang, J.B. (2007), “A Bayesian network approach for offshore risk
analysis through linguistic variables”, China Ocean Eng., 21(3), 371-388.
RFERL (2018), Available at:
http://www.rferl.org/content/History_BP_Oil_Spill_Haunt_Caspian_Sea/2052194.html, Accessed on 27.
Dec. 2018.
RIVM (2019), National institute for public health and the environment of Netherland, RIVM Report
620801001, 2008. Available at: https://www.rivm.nl/en.Accessed on: 08.05.2019.
Rosqvist, T. (2003), On use of experts judgment in the quantification of risk assessment, Dissertation for the
degree of Doctor of Technology, Helsinki University of Technology, Espoo, Finland.
Saaty, T.L. (2001), Decision Making with Dependence and Feedback: Analytic Network Process, RWS
Publications, Pittsburgh.
Sentz, K. and Ferson, S. (2002), Combination of evidence in Dempster–Shafer theory. SAND 2002-0835.
Sharp, D. (2009), Upstream and offshore energy insurance, Witherbys insurance, ISBN: 9781856093514.
Singer, D.A. (1990), “Fuzzy set approach to fault tree and reliability analysis”, Fuzzy Set. Syst., 34, 145-155.
Takagi, H. and Hayashi, I. (1991), “NN-driven fuzzy reasoning”, Int. J. Approx. Reason., 5, 191-212.
Tarila, Z. and Edward, G.O. (2017), “Senior managers and safety leadership role in offshore oil and gas
construction projects”, Procedia Eng., 196, 1011-1017.
Thacker, B. and Huyse, L. (2003), Probabilistic assessment on the basis of interval data, In 44th
AIAA/ASME/ASCE/AHS Structures, Structural Dynamics, and Materials Conference Published by the
American Institute of Aeronautics and Astronautics, Inc, 2003.
Trbojevic, V.M. and Carr, B.J. (2000), “Risk based methodology for safety improvements in ports”, J.
Hazard.Mater., 71, 467-480.
UNCTAD (2006), United Nation Conference on Trade and Development. Maritime security: Elements of an
analytical framework for compliance measurement and risk assessment.
Visser, J.P. (1998), Developments in HSE Management in oil and gas exploration and production, (Eds.,Hale
A.R. and Baram, M.), Safety management, the challenge of change. Oxford: Pergamon.
Wang, Y. (2004), Development of a computer-aided fault tree synthesis methodology for quantitative risk
analysis in the chemical process industry, Ph.D. thesis.
Wilcox, C.R. and Ayyub, M.B. (2003), “Uncertainty modelling of data and uncertainty propagation for risk
studies”, Proceedings of the IEEE 4th International Symposium on Uncertainty Modelling and Analysis.
World Atlas (2019), Available at: http://www.worldatlas.com/aatlas/infopage/caspiansea.htm Accessed on
21.Jan. 2019.
Wu, W.S., Yang, C.F., Chang, C.H., Château, P.A. and Chang, Y.C. (2015), “Risk assessment by integrating
interpretive structural modelling and Bayesian network, case of offshore pipeline project”, Reliab. Eng.
Syst.Saf., 142, 515-524.
284

Risk analysis of offshore terminals in the Caspian Sea
Yang, T. and Hung, C.C. (2007), “Multiple-attribute decision-making methods for plant layout design
problem”, Robot. Comput.-Integrated Manufact., 23, 126-137.
Yuhua, D. and Dataob, Y. (2005), “Estimation of failure probability of oil and gas transmission pipelines by
fuzzy fault tree analysis”, J. Loss Prevent. Proc., 18, 83-88.
Zadeh, L.A. (1965), “Fuzzy sets”, Inform. Control., 8, 338-353.
Zhao, R. and Govind, R. (1991), “Defuzzification of fuzzy intervals”, Fuzzy Set. Syst., 43, 45-55.
Zimmerman, H.J. (1996), Fuzzy sets theory and its applications, Kluwer academic publishers, Boston.
Zuijderduijn, C. (1999), Risk management by Shell refinery/chemicals at Pernis, The Netherlands;
Implementation of SEVESO-II based on build up experiences, using a Hazards and Effects Management
Process.
MK
285