risk and insurance in village india, econometrica, 62(3...
TRANSCRIPT

"Risk and Insurance in Village India", Econometrica, 62(3), May 1994, 539-
591.
The copyright to this article is held by the Econometric Society,
http://www.econometricsociety.org. It may be downloaded, printed and reproduced only for
personal or classroom use. Absolutely no downloading or copying may be done for, or on behalf
of, any for-profit commercial firm or other commercial purpose without the explicit permission of
the Econometric Society. For this purpose, contact Claire Sashi, General Manager, at


Risk and Insurance in Village IndiaAuthor(s): Robert M. TownsendSource: Econometrica, Vol. 62, No. 3 (May, 1994), pp. 539-591Published by: The Econometric SocietyStable URL: http://www.jstor.org/stable/2951659Accessed: 09/04/2010 13:10
Your use of the JSTOR archive indicates your acceptance of JSTOR's Terms and Conditions of Use, available athttp://www.jstor.org/page/info/about/policies/terms.jsp. JSTOR's Terms and Conditions of Use provides, in part, that unlessyou have obtained prior permission, you may not download an entire issue of a journal or multiple copies of articles, and youmay use content in the JSTOR archive only for your personal, non-commercial use.
Please contact the publisher regarding any further use of this work. Publisher contact information may be obtained athttp://www.jstor.org/action/showPublisher?publisherCode=econosoc.
Each copy of any part of a JSTOR transmission must contain the same copyright notice that appears on the screen or printedpage of such transmission.
JSTOR is a not-for-profit service that helps scholars, researchers, and students discover, use, and build upon a wide range ofcontent in a trusted digital archive. We use information technology and tools to increase productivity and facilitate new formsof scholarship. For more information about JSTOR, please contact [email protected].
The Econometric Society is collaborating with JSTOR to digitize, preserve and extend access to Econometrica.
http://www.jstor.org

Econometrica, Vol. 62, No. 3 (May, 1994), 539-591
RISK AND INSURANCE IN VILLAGE INDIA
BY ROBERT M. TOWNSENDI
The full insurance model is tested using data from three poor, high risk villages in the semi-arid tropics of southern India. The model presented here incorporates a number of salient features of the actual village economies. Although the model is rejected statisti- cally, it does provide a surprisingly good benchmark. Household consumptions comove with village average consumption. More clearly, household consumptions are not much influenced by contemporaneous own income, sickness, unemployment, or other idiosyn- cratic shocks, controlling for village consumption (i.e. for village level risk). There is evidence that the landless are less well insured than their village neighbors in one of the three villages.
KEYWORDS: Risk, insurance, consumption smoothing, village economies.
1. INTRODUCTION
PEOPLE IN THE VILLAGES of southern India, and throughout much of the underdeveloped world, live in poor, high-risk environments. Per capita income and per capita consumption are low, and the risk to agriculture from erratic monsoon rains is high. Crop and human diseases are also prevalent.
Various policy issues turn on this level of risk and on the presence or absence of risk reduction mechanisms at the village and regional levels. First, are landless laborers and the especially poor particularly vulnerable to adverse shocks? Are these people isolated from the rest of the community by some hierarchical class or caste structure so that a special welfare policy is necessary? Second, are informal credit markets sufficiently flexible as regards the repay- ment of loans in bad years, or does uninsured risk cause adverse fluctuations in consumption? Third, does reliance on family members as an insurance network cause high population growth with its long-run impoverishing effect on welfare? In short, is there some scope for policy or policy reform?
This paper poses a simple question: how good or how bad are the institutions which might insure people in villages in southern India against erratic rainfall, crop and human diseases, and severe income fluctuations? Among potential risk-bearing institutions one might evaluate, one can quickly think of five: (1) diversification of a given farmer's landholdings into various spatially separated
1 am deeply indebted to Mark Rosenzweig and Jose Scheinkman for initial collaboration on this project. I also want to thank my three research assistants, Ethan Ligon, Youngjae Lim, and Shiv Bhandari, who have made invaluable contributions at various stages; the National Institute of Health, the Institute for Policy Reform, the National Science Foundation, and the Population Research Center at NORC for helpful research funding; suggestions and comments from John Cochrane, Lars Hansen, Fumio Hayashi, James Heckman, Ariel Pakes, Martin Ravallion, the editor and referees of Econometrica, and participants of seminars at the University of Chicago, the University of North Carolina, the University of Pennsylvania, the Wisconsin-Econometrics Confer- ence, May 1990, Yale University, and the World Bank; Emmanuel Skoufias for making available to me his processed labor data (see Skoufias (1988)); and Tom Walker, R. P. Singh, and the in-resident investigators at ICRISAT for answering my many questions. I assume full responsibility for any errors.
539

540 ROBERT M. TOWNSEND
plots and into various crops, (2) storage of grain from one year to the next, (3) purchases and sales of assets such as bullocks and land, (4) borrowing from village lenders or itinerant merchants and borrowing/lending more generally, and (5) gifts and transfers in family networks.
The problem with these questions, and with this list, is that each mechanism or institution on the list is nontrivial to evaluate. Indeed, each entry is a research topic in its own right. Thus, restricting attention to India, and primarily to the International Crops Research Institute of the Semi-Arid Tropics (ICRI- SAT) villages, which will be used as a data base for this study, Rosenzweig and Stark (1989) and Rosenzweig (1988) study the role of the family in facilitating transfers among villages in the larger regional context. Similarly, Jodha (1978) studies credit markets in the ICRISAT villages, and Bell, Srinivasan, and Udry (1988) and Kochar (1989) do so for villages in the north of India. Walker, Singh, and Jodha (1983) study the role of plot and crop diversification in ICRISAT villages, and Rosenzweig and Wolpin (1993) study the role of bullock purchases and sales there. Finally, Cain (1981) studies the role of distress land sales and credit, contrasting ICRISAT villages with villages in Bangladesh.
Each of these studies is interesting in its own right. But in studying one market or institution only, the researcher may miss smoothing possibilities provided by another. For example, transfers may be small or missing, but this may not leave the family vulnerable if credit markets function well.
This paper presents a general equilibrium framework which overcomes the problem of looking at risk-sharing markets or institutions one at a time. Specifically, the general equilibrium model inevitably leads the researcher to focus on outcomes, namely, consumption and labor supply, so that all actual institutions of any kind are jointly evaluated.
Wilson (1968) and Diamond (1967) derived the basic proposition that if preferences are time separable and display weak risk aversion, if all individuals discount the future at the same rate, and if all information is held in common, then an optimal allocation of risk bearing of a single good in a stochastic environment implies that all individual consumptions are determined by aggre- gate consumption, no matter what the date and history of shocks, and so individuals' consumptions will move together. This proposition implies that within the ICRISAT villages, income, sickness, and other idiosyncratic shocks should not influence consumption at all once aggregate consumption is con- trolled for. These implications hold in a multiple commodity world under separable preferences (though separability is not necessary, as shown by Mace (1991), or can be controlled for, as shown here) and survive virtually all specifications of technology, as shown by Scheinkman (1984) and Townsend (1993).
Intuition for these results can be garnered by consideration of a two-agent economy with one risk-averse farmer experiencing crop fluctuations and one risk-neutral insurer. Without information or enforcement problems, the risk- averse agent can be completely insured, so his crop fluctuations do not matter for his consumption. Even if both agents are risk averse, any arrangement which

RISK AND INSURANCE 541
has one risk-averse agent absorbing his idiosyncratic fluctuations cannot be optimal, because the other agent must be locally risk neutral at the proposed allocation with respect to fluctuations of the first. In an optimal arrangement, both would coinsure the fluctuations of each, though the extent of coinsurance depends on preferences. More generally, we can allow as many agents as we want. Thus, in an optimal arrangement, consumption allocations are determined as though all crop outputs over all agents were pooled together and then optimally redistributed. The pile of grain for distribution is aggregate consump- tion, and its. size is determined by aggregate, uninsurable shocks. When one controls for aggregate consumption and an individual fixed effect, individual crop output and other idiosyncratic variables should have no impact on con- sumption whatever. Finally, when one controls for aggregate consumption, one need not assume a closed economy. Fluctuation in aggregate village consump- tion represents the residual, village risk which the larger regional economy has not removed.
There are a priori grounds for taking villages as the natural unit to study. Village economies satisfy the explicit or implicit conditions of general equilib- rium modeling, namely that individuals in the entire community can arrange their institutions and allocations in such a way as to achieve a Pareto optimum. Many families have been present for generations; many contemporary residents live, eat, and work in the village; the villages have their own legal systems replete with contract enforcement mechanisms; and village residents may have relatively good information about the ability, effort, and outputs of one another. Moreover, residents of poor, high-risk villages have a collective incentive to come up with good arrangements: the absence of these can be life threatening.
Two caveats are immediately in order. First, the arguments given above also imply that kinship groups or networks among family and friends might provide a good, if not better, basis for testing the risk-sharing theory. Unfortunately, the household sample used below is stratified within villages by land class, not by household relationships. But the point remains that something can be done along this line (see the review of the literature in Section 7, especially Altonji, Hayashi, and Kotlikoff (1992)).
The second caveat concerns an equivalence between allocations consistent with an optimal allocation of risk bearing and allocations consistent with the existence of complete markets, especially markets for contingent claims as in Arrow (1964) and Debreu (1959). For the most part this paper tests only the proposition that allocations be Pareto optimal. Informal networks, gifts, and transfers among family and friends, long-term relationships with creditors, and other perhaps as yet unobserved institutional arrangements may be used by some or all of the villagers in efforts to achieve an optimum. It is certainly not necessary that households trade Arrow-Debreu state-contingent securities in some initial market! Neither is it necessary that the structure of spot, asset, and credit markets be equivalent to an Arrow-Debreu complete markets structure. Markets, if they are used at all, can be used in combination with local institutions.
542 ROBERT M. TOWNSEND
An exception concerns the measure of profits and income used in this paper. In order to go from physical crop yields to income measures, valuing the inputs of labor, pesticide, fertilizer, and so on, the paper takes the position that there are perfect spot markets within villages for all these items and that within period expenditures can be financed with credit. In fact village factor markets may not function perfectly well (see the comprehensive review of the evidence in Walker and Ryan (1990)). In particular, sharecropping is not an uncommon practice in the villages of this study, and Shaban (1987) finds that there is an efficiency loss, in sharecropping relative to owner-operated plots. More gener- ally, this paper restricts itself to testing for optimal risk bearing in consumption (and labor supply) assuming perfect factor and within-period credit markets, leaving tests of efficiency in production to future research.2
These caveats aside, I come to the basic point: the full risk sharing proposi- tion can be tested with the extraordinary amount of data, including the required consumption data, that are available from three poor, high-risk villages in southern India, sampled by ICRISAT. The villages are located in three separate agroclimatic zones, in Mahbubnagar district of Andhra Pradesh and in Sholapur and Akola districts of Maharashtra. Consumptions are (indirectly) measured annually for 1975-1984 for 40 households in each of the three villages of Aurepalle, Shirapur, and Kanzara.
There has been an increasing amount of empirical work based on the Arrow-Debreu model, as described above, namely Mace (1991), Cochrane (1991), Altonji, Hayashi, and Kotlikoff (1992), Abel and Kotlikoff (1988), Carroll and Summers (1989), Deaton (1990), and Rashid (1990). A summary of this literature is reserved for the concluding section of this paper, Section 7, which affords an opportunity to compare and contrast this literature to the results of the present study. At the time of writing of the initial working paper (Townsend (1989)), no one had carried out tests of complete markets or full insurance with data from villages in poor, high-risk agrarian environments; Deaton (1990) and Rashid (1990) have now made contributions. Yet villages offer a natural envi- ronment in which to test the full risk-sharing model, and the policy implications which tie this work to the development literature make the results for villages important in their own right.
A summary of what is actually found in the data is reserved for Sections 5 and 6, though the reader may jump there now and then return to the more detailed analytic sections which follow. In particular, Section 2 of the paper describes the relevant aspects of production, income, and risk in' these ICRISAT villages. This section offers fairly decisive evidence that even within villages not all households are planting the same crops in the same soils and experiencing the same weather. More generally, they are not engaged in the same income-generating
2 In particular, the specification here does not capture contingent decision making within a crop season or across seasons in a given year. This is not consistent with the actual environment of the village economies.

RISK AND INSURANCE 543
activities. With relatively low correlations across soils, crops, and activities, incomes fail to comove much across households. The ICRISAT village economies are thus ideally suited for a test of the risk-sharing hypothesis. Section 3 describes some aspects of household demographics, setting down the commodity space and individual preferences. It makes clear how one can go from theory specified at the level of the individual to consumption measured at the level of the household. Various additional pitfalls in the use of the ICRISAT consump- tion data are described. Section 4 then presents the relevant pieces of the programming problem for the determination of Pareto-optimal allocations and delivers exact risk-sharing rules for a particular preference specification, allow- ing for changes in household composition. Less exact specifications that allow for additional demographics and for nonseparable preferences in consumption and leisure are described. Additional implications of the analogous decentral- ized, complete markets equilibrium are also noted, in particular the relationship between Pareto weights in the programming problem and wealths in the decentralized solution. Section 5 then presents the empirical results for the time series, taking one household at a time; Section 6 does the same for pooled, cross-sectional panel data. Finally, Section 7 presents comparisons to the literature and conclusions.
2. PRODUCTION, INCOME, AND RISK
As already noted, the villages in the semi-arid tropics of southern India sampled by ICRISAT are primarily agrarian economies with high risk. To quantify these assertions, one can begin with an analysis of crop production, the dominant source of income in terms of village aggregates. Specifically, from the ICRISAT plot data one has available a list of all inputs and outputs used in farming a given plot or subplot by a given sampled household in a given year. From these data both quantities and values can be determined. Inputs include labor, pesticide, herbicide, fertilizer, and seed. Outputs include the principal crops or vector of multiple crops and by-products such as fodder. Acting as though there were perfect spot markets in all these inputs and outputs in the village economy, one can compute realized profits per unit of land cum bullocks for a given sampled household in a given year (this assumes that land and bullocks are used in fixed proportions and that there is no market for either of these inputs; see the corrections in footnote 10). Averaging over all sampled households that farm a given plot type with the same crop in a given year, and doing the same for each year, yields a time series of profits per unit of land cum bullocks for various soil and crop technologies. These can then be used to compute coefficients of variation (with standard errors) and cross technology correlations (with 95 percent confidence intervals).3
3These come from Anderson (1984) and assume 10 years of data. Of course realized profit variance may misstate the actual risk faced by any individual farmer if there are unobserved differences in farmer productivity.

544 ROBERT M. TOWNSEND
The dominant crops of Aurepalle are castor, a cash crop with a coefficient of variation (CV) of 1.01; a sorghum, pearl millet, and pigeon pea intercrop mixture with a CV of 0.51; and paddy with a CV of 0.70.4 With the exception of paddy, these are dry land crops and are grown in the kharif (monsoon) season. As is evident from the CV's, the risk is high. On the other hand, cross-crop correlations are relatively low, ranging from 0.09 to 0.81 (but with large confidence intervals). Thus, diversification across crops might seem to be a sensible strategy to reduce risk, at least in autarky, and the farmers themselves agree in conversations that there is an advantage in doing so. I shall come back to this subject momentarily.
Soil is not uniform in Aurepalle. For example, coefficients of variation for castor planted in medium to shallow black soil and in shallow red soil are 0.72 and 1.01, respectively, with a correlation coefficient of only 0.37.5 The same diversification comment applies. Farmers are keenly aware of soil differences and have their own local vocabulary for soil types; see Dvorak (1988).
Similar comments apply for the village of Shirapur except that Shirapur's soils retain moisture so that postmonsoon (rabi) planting is an important activity. The dominant crops are rabi sorghum and also (aggregated) pulses distinguished by kharif and rabi planting, with CV's ranging from 0.37 to 1.01 and correlations from 0.17 to 0.69.6 Thus, as in Aurepalle, there is considerable risk, yet there remain diversification possibilities. Similarly, with one rabi sorghum type as an example, cross-soil correlations of sorghum yields are relatively low, ranging from -0.09 to 0.44.7
Relative to Aurepalle and Shirapur, Kanzara presents a picture of apparent uniformity, with most households planting some cotton intercrop mixture in medium black soils in the kharif season. Rainfall in Kanzara is also more abundant and less erratic in amount and timing. By contrast, in Aurepalle, rainfall appears nonuniform even across plots within the village.8
Are most households doing the same thing and experiencing the same outcomes in any one of these three villages? Apparently not, despite the diversification possibilities noted above. Most households do not hold a "market portfolio" of crops or soil types, at least not in Aurepalle and Shirapur. For crops planted one at a time by each of the surveyed households in 1976, for example, it seems that proportions among the dominant crops vary considerably across households, and indeed the residual category of minor crops is often substantial for any given household.9 This failure to diversify may itself indicate that there are alternative risk-reduction devices in the villages. That is, it may be taken as very indirect evidence of insurance.
4See Table 1 of the earlier working paper (Townsend (1991)). 5See Table 2 of the working paper. 6 See Table 3 of the working paper. 7See Table 4 of the working paper. 8 This is based on preliminary data from 22 rain gauges placed in Aurepalle village in May 1990
under a joint project of Rolf Mueller and this author with ICRISAT. See also Huda et al. (undated). 9 See Tables 5 and 6 of the earlier working paper.

RISK AND INSURANCE 545
Individual crop profits are no doubt measured with error, as are incomes generally.'0 In the analysis below this will loom as a potentially significant feature. Indeed, household consumption will be shown to move somewhat with average consumption, and to move little with individual income. This suggests that actual incomes have a large common component which is better measured by average consumption than by the individual incomes themselves. Corrections will be made for measurement error in the empirical work presented below. Still, the analysis just given suggests that this measurement error hypothesis, which can hold in the abstract and in particular actual economies, does not hold strongly for Aurepalle and Shirapur. Specifically, the covariances above are obtained by averaging over households with the same crop/plot technologies, thereby removing some measurement error at the individual level. Subject to large standard errors, these covariances show the various crop/plot technolo- gies to be distinct. Tables 5 and 6 of the working paper show that farmers are not holding the "market portfolio" of these technologies. Thus incomes across farmers appear not-to have a large common component."
As noted, some households in the villages are also engaged in other activities, particularly animal husbandry-milk products, wool, and so on. Manure is also a natural by-product. The care of animals in turn requires inputs such as labor and fodder. Animal husbandry is a second important line of activity.
In Aurepalle palm trees represent a third kind of asset. But the analysis can be handled in a similar fashion, yielding profits from the sale of palm liquor. These profits are coded as profits from trade and handicrafts along with other more obvious activities.
Households can work for themselves and for others in all the above men- tioned activities. ICRISAT's summary files contain earned household income for all 10 years. This is simply the income earned from labor market activities outside the household, summed over all participating household members and all outside activities. This gives, of course, an intuitive measure of income:
10 Profit numbers were compared to those used by ICRISAT, namely returns to family-owned resources. Under that conceptualization, any input, including labor, which is owned and used in farming is not subtracted as a cost. Orders of magnitude turn out to be similar, with these intriguing exceptions. When returns to owned resources are used, coefficients of variation are always lower and the cross-crop correlations are almost always greater. Profit calculations were also compared to those subtracting off the rental from owned and hired bullocks. (In fact, it seems there is a lively rental market in bullocks, at least in Aurepalle; this is under study in collaboration with ICRISAT and will be reported in detail at a later date.) These latter profits are lower, but the thrust of'the variance-covariance analysis still applies. An alternative and more realistic framework would allow rental of land as well as the purchases and sales of assets within and across periods. Both can be accommodated. In particular, the relevant measure of spot market income would then be profits net of the rentals of land and bullocks plus revenue from the sale of these assets themselves. An earlier preliminary analysis suggested that this latter measure of income is, if anything, at least as variable as the original net income variables used above. However, this is a separate project to be reported more fully in a subsequent paper.
1"Lim (1992) has carried out a factor analysis of both consumption and income, reinforcing these conclusions. There are five dominant factors driving income across households, but the coefficients on these are not identical across households. On average about 25% of the variance in incomes is idiosyncratic.

546 ROBERT M. TOWNSEND
income that is available for consumption after labor-leisure decisions are made; it will be used in the empirical work below. However, the theoretically relevant concept of income is the contribution to full income-the wage multiplied by the time endowment-summed over all household members. This will also be used in the empirical work below, but a strong word of caution is in order.
The ICRISAT labor data are noisy and awkward to use. For 1975-1977, detailed labor data files consist of day-before-interview recall data only, not time aggregates. For 1978-1984, individual labor supply is measured including own farm production but not including household production activities such as food processing and fuel gathering. The number of days worked and wage data for females and children seem especially unreliable. Thus full income and labor supply are derived using the data on adult males only. Full income is the time endowment of a given adult male in the survey, guessed arbitrarily at 312 days per year (following Rosenzweig (1988)), less measured days absent from labor participation because of sickness. An adult male wage series is obtained by dividing entries for earned income by the number of days and then averaging over sampled adult males. This yields an estimate of the contribution to a household's full income for 1978-1984.
A variable called village average labor supply for 1978-1984 can be derived by averaging labor supply of all sampled adult male individuals in a household in a given sample interval and then averaging over households. This average village labor number is equivalent to average village leisure up to a (negative) constant (females and children are ignored) if time endowments are constant. In
TABLE I
COMPOSITION OF INCOME, BY SOURCE AND LANDHOLDINGS a
Landholdings Village Income Source None Small Medium Large All
Aurepalle Crop 0.0225 0.2623 0.3967 0.5645 0.4476 Labor 0.6527 0.3363 0.1623 0.0429 0.1538 Trade & 0.2799 0.2919 0.3033 0.1242 0.1957 Handicrafts Animal 0.0449 0.1095 0.1373 0.2685 0.2029 Husbandry
Shirapur Crop 0.4364 0.3735 0.5293 0.5617 0.4992 Labor 0.4897 0.3825 0.3305 0.2268 0.3209 Trade & 0.0002 0.0142 0.0000 0.0372 0.0189 Handicrafts Animal 0.0736 0.2298 0.1404 0.1743 0.1610 Husbandry
Kanzara Crop 0.0529 0.2603 0.5002 0.6429 0.5109 Labor 0.8506 0.5962 0.3513 0.1424 0.3056 Trade & 0.0664 0.1144 0.0248 0.0034 0.0307 Handicrafts Animal 0.0301 0.0290 0.1237 0.2113 0.1528 Husbandry
a Figures reported are proportions of income from a given source, given village and landholdings.

RISK AND INSURANCE 547
this sense average labor is a proxy for average leisure, one which avoids the problem of measuring time endowments. However, even the adult male labor data are noisy. One observes relatively low measured hours on average, and many males move out of the labor force for extended periods of time, giving sickness (used above), absence from station, holiday, migration, and unemploy- ment as reasons for not working. Of course, measures of sickness, unemploy- ment, and other reasons for not working can be derived and entered in the household regressions described below, following the work of Cochrane (1991). One exception should be noted. The labor data are sufficiently poor in Shirapur that none of the additional labor variables could be calculated.
With these caveats regarding the labor income data, let us return to the composition of income, as obtained from ICRISAT's summary files. Income over the four principal components mentioned above-crop, livestock, trade and handicrafts, and earned labor income-varies by household landholdings and by village, as depicted in Table I. Yet profits from crop production remain the principal component for medium and large farmers and for the villages as a
TABLE II
COEFFICIENTS OF VARIATION AND CORRELATION OVER INCOME SOURCESa
Profits from Livestock Trade & Village Crop Prod. Income Earned Wages Handicraft
Aurepalle 0.4227 - 0.0188 0.5800 0.6297 (0.1101) [-0.50,0.50] [0.05,0.85] [0.05,0.85]
0.2136 0.3607 0.4586 (0.0499) [-0.25,0.75] [-0.20,0.75]
0.4554 0.8194 (0.1211) [0.45,0.95]
0.4292 (0.1123)
Shirapur 0.2442 0.5817 0.6386 0.7913 (0.0578) [0.05,0.85] [0.05,0.85] [0.45,0.95]
0.1938 0.2535 0.6738 (0.0449) [-0.30,0.70] [0.05,0.85]
1.3068 0.7352 (0.6140) [0.35,0.90]
0.3235 (0.0795)
Kanzara 0.4048 0.8721 0.8067 0.9345 (0.1043) [-0.55,0.95] [0.45,0.95] [0.85,1.00]
0.3830 0.7436 0.8586 (0.0974) [0.35,0.90] [0.55,0.95]
0.5330 0.8240 (0.1493) [0.45,0.95]
0.2973 (0.0721)
a Numbers in parentheses are standard deviations, and those in brackets are 95% confidence intervals.
548 ROBERT M. TOWNSEND
0.
Household Number Year
(a) Comovement of household incomes (deviation from village average) Aurepalle.
4000 . '.....-.....
3000-
[:[22000-X2
Household Number Year
(b) Comovement of household incomes (deviation from village average) Shirapur.
cr
0.
2000
Household Number Year
(c) Comovement of household incomes (deviation from village average) Kanzara.
FIGURE 1

RISK AND INSURANCE 549
Aurepalle
0.8-
0.6-
0.4~~
~ .2 0-
0
-o.4
-0.6
-0.8
5 10 15 20 25 30 Household rank
Shirapur
0.8-
0.6-
0.4-
Household rank
Kanzara
08 '
-0.64/
-0.86
1- 5 1 0 1 5 20 25 30 3
Household rank
FIGURE 2.-Correlation coefficient of household with aggregate income.

550 ROBERT M. TOWNSEND
4000 .. .. . ..
3000- ~~~~~~~~~~~..-..'.. . ..' 3000 ...'...
p.1 000.. .
Household Number Ya
(a) Comovement of household consumptions (grain only) (deviation from village average) Au- repalle. 400 . . . .
4000- ~~~~~........... .. ..'.......'>
3000 . .........S
.L2000 .......
'1000.
30
Household Number Year
(b) Comovement of household consumptions (grains only) (deviation from village average) Shirapur.
4000 . . ; ' ' . .'
3000....
a 2000.
3-000 ....
2000
1000- ~ 1 6 8 80 8
Household Number Year
(c) Comovement of household consumptions (grains only) (deviation from village average) Kanzara.
FIGURE 3

RISK AND INSURANCE 551
Aurepalle
0.8 .
0.6
0.4-
0.2-
-10
0
-0.4-
-0.6
-0.8
5 10 15 20 25 30 Household rank
Shirapur
0.8
0.6
0.4
r 0.2- 0
*& 0 o 0 0
Household rank
-0.8
-0.6-
-0.4
0.2
C .2- *~0 L 0
Household rank
FIGURE 4.-Correlation coefficient of household with aggregate consumption (grains only).

552 ROBERT M. TOWNSEND
whole-roughly 47% on average. Livestock and especially labor income may be more important for landless and small farmers, but are 15-32% on average for villages as a whole.
As with the variance-covariance analysis for crops and soil types, it can be shown that, with the exception of Kanzara, there are diversification possibilities over these components of income (see Table II). Cross-activity correlations are not high. Yet, while the overall risk remains high, not everyone is holding the "market portfolio," as is evident in Table I. Livestock production is typically the least risky enterprise with a lower CV, and earned wages the most. (The latter may or may not reflect defects in the labor data.)
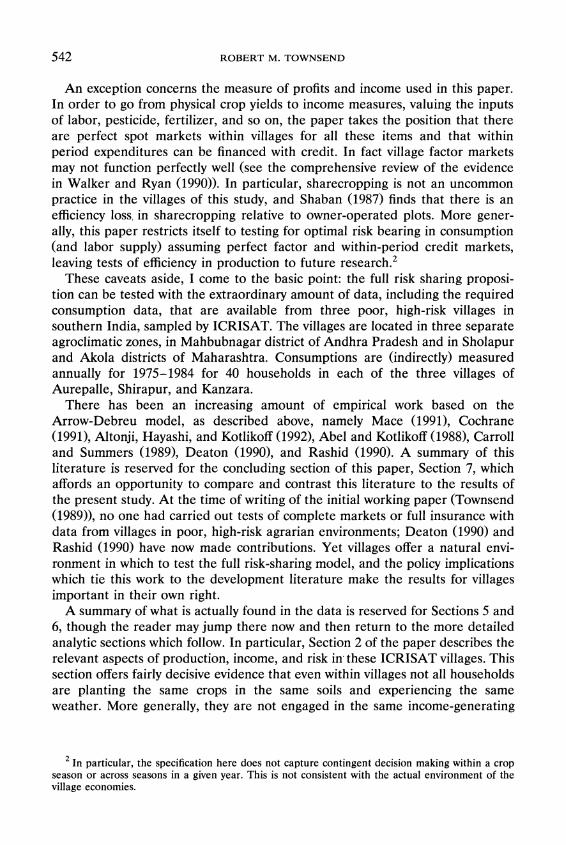
As has already been emphasized, the net effect of this risk, coupled with the failure to take advantage of relatively low cross-soil, cross-crop, and cross-activ- ity correlations, is that households' incomes (summed over all components) do not comove. This is evident in the time series (Figure 1) plotting the income deviation of a given continuously sampled household at a point in time from the sample average at a point in time, doing so over all continuous households and over all 10 years. These figures also reveal the diversity in incomes over households at a point in time. The correlation coefficients of household incomes with aggregate village income are given in Figure 2 for each of the three villages. Even in the apparently uniform village of Kanzara there seems to be considerable household diversity, suggesting measurement error (see below). These income figures should be compared and contrasted with the analogous time-series figures for grain consumption (Figure 3), which are much less jagged, and the correlation coefficients for grain consumption (Figure 4), which are slightly higher, both to be described further below.
Table A.I in the Appendix provides summary statistics of the levels and standard deviations of these income and consumption variables over time and over households, as well as other variables used in the study and to be described below. Note that average consumption is only about half of measured average income. Also, the standard deviation of consumption is far less than that of income and its components. The dominant income component in levels is profits from crop production, with the exception of full income, which seems to overvalue the time endowment or wage dramatically.
3. HOUSEHOLD DEMOGRAPHICS, THE COMMODITY SPACE, AND INDIVIDUAL PREFERENCES
In 1975 the populations of Aurepalle, Shirapur, and Kanzara were 2856, 2079, and 1014 individuals; or 476, 297, and 169 households, respectively. Over the 10 years through 1984, households' sizes changed with births and deaths. Also, individuals moved in and out of households with temporary and permanent migration. Likewise, marriages and eventual divisions of extended families caused occasional and considerable change in the number of individuals in a given household.

RISK AND INSURANCE 553
Perhaps symptomatic of this turbulence is the difficulty of keeping surveyed households in the sample over all 10 years. The initial sample included 10 households of each type-landless, small, medium, and larger landholders-in each village. Over time households dropped out of the sample, leaving 35, 32, and 36 so-called continuously sampled households in Aurepalle, Shirapur, and Kanzara, respectively. When a household was dropped, it was replaced with a household from the same land class category, keeping the total in the sample at 40 at any one time. Thus, in practice, more than 40 households per village with usable consumption files were sampled: 45, 46, and 45 households in Aurepalle, Shirapur, and Kanzara, respectively.
A brief analysis of the dropout households, with number of years in the sample regressed against various variables, indicated a preponderance in the dropouts of landless households and households with relatively high labor earnings. The actual reason for dropping out of the survey is not available. It is possible, of course, that households dropped out for risk response reasons, say migration in the face of a relatively large uninsured shock.
Related to these considerations is the fact that the number of landless households in the village population is underrepresented in the sample. In the analysis below the data are adjusted where possible to reflect actual proportions in the village population as of the initial 1975 census: 31%, 33%, and 32% for Aurepalle, Shirapur, and Kanzara, respectively.
With fluctuations in household size, it seemed that the individual rather than the household would be the more stable unit for purposes of utility analysis, even though consumption and most income components are measured at the level of the household. Thus preferences are modeled at the level of the individual, and households are treated as changing clusters of individuals.
Specifically, let Wk(c, 1, Ak) denote the basic, within-period utility function for consumption c and leisure 1 by individual k, assuming that the individual is alive and present in the village economy in a given period, where consumption c is taken for the moment to be a vector of consumption goods. Variable A,k represents the age-sex index of individual k at date t. Assume initially that utility functions are separable between consumption and leisure and have an exponential form. Namely, for individual k in household i at date t let
( 1) W [,wkck, I,k Ak] = uk(Ck ,Ak ) + Vk(lk ,Ak)
where
(2) uk(Ct,A )= --exp [-oict At
If all individual members k within a household i have equal welfare weights A' and are equally risk averse with coefficient o-i, then utility function (2) is consistent with the allocation of total household consumption to equalize the marginal utility of consumption across the individual members k. Specifically,

554 ROBERT M. TOWNSEND
letting ,u, denote the common marginal utility of consumption in household i at date t and adding up first-order conditions over the N,/ members k of household i at date t yields
-Nt' 1 Nt'
- n (A AkIn (A-k) k
-ln ( Al) --t=_l_-_-_=l --ln(/t) 1 1~~~~~~
These equations can then be added up over households i (see below). Fortu- nately, aggregate household i consumption E N'L IC appears in this equation; again consumption is measured at the household level. The other variables in this equation are the age-sex weights Ak. Further, the relevant measure of consumption from this equation in each household i is
N,' N,'
(3) c* = Eck E kA k=1 k=1
or, roughly, adult equivalent consumption in household i. A dietary survey by Ryan, Bidinger, Pushpamma, and Rao (1985) measured
caloric intake at the individual level for distinct age-sex categories. Averaging over income, land class, and village, these dietary numbers are used to construct educated guesses for the age-sex weights At.12 Fortunately, age, sex, and number of household members are measured in the ICRISAT Census file.
As to the measurement of household consumption vector c, various measures are available over various subsets of years, a function of how the household data were collected. The starting point for measuring consumption of various grains in 1975 was own crop production. To this were added and subtracted various transactions in the massive ICRISAT transactions file. For example, purchases, in-kind loans, and incoming gifts were added and sales, seed, and grain paid as wages were subtracted. An adjustment needs to be made for changes in households' grain stocks during the year. This apparently caused a problem in 1975 since initial stocks were poorly measured.
However, from 1976 on, an improved procedure was used. The starting point for grain was not production in the field but milled grain. In practice milled grain is often milled at home and seems more likely to be consumed than unmilled grain. The milling of grain, whether done at home or not, is duly noted in the transactions files.13 Still, transactions in milled grain (subsequent to
12 The educated guesses for age-sex weights are: for adult males, 1.0; for adult females, 0.9. For males and females aged 13-18, 0.94, and 0.83, respectively; for children aged 7-12, 0.67 regardless of gender; for children 4-6, 0.52; for toddlers 1-3, 0.32; and for infants 0.05.
13 This is counter to the claim of Ravallion and Chaudhuri (1992) and has been checked by Lim (1992).

RISK AND INSURANCE 555
milling) do appear in the transactions file as well, and these were dutifully added and subtracted where appropriate. Lim (1993) has used this procedure to recalculate consumption, and obtained results which agree closely with the consumption data in ICRISAT's summary file.14
Unfortunately, not all of the remaining consumption categories were col- lected in all years. Table A.II in the Appendix indicates some drop-off in some but not all categories in the last three years, 1982-1984. The magnitude of the drop-off varies by village. This leaves the researcher with some decisions about which consumption categories to use and for what years.
Considerations of the drop-off categories and worries about spurious correla- tion in household consumption might lead one to use only grain consumption if one insists on using all 10 years of the data. Fortunately for the researcher, if less so for the households themselves, grain constitutes a large component of the household consumption: 47%, 35%, and 29% of all nondurable (real) consumption expenditures in Aurepalle, Shirapur, and Kanzara, respectively.
Inclusion of other categories of consumption (all food, edible oils, and clothing) allows one to recover 77.5%, 77.7%, and 71.7% of all consumption expenditures in Aurepalle, Kanzara, and Shirapur, as measured for 1976-1981. Consumption categories such as clothing may be more sensitive to idiosyncratic income fluctuations, so inclusion of these other categories seems desirable for tests of full insurance. A stringent standard which excludes consumptions known to be measured with error would dictate use of the years 1976-1981 only.
Rather than choosing once and for all between these two options (grain only for all 10 years versus all consumption for 1976-1981 only) and recognizing that consumption is measured with error in any event, in much of the analysis below I use each of the two options and also use all available consumption data over all 10 years as a third alternative. Differences in results will be noted where appropriate.'5
14 Crop income includes the imputed value of own crop production not sold. Under the 1975
ICRISAT procedure, consumption would include a similar category. Noting that the revised 1976-1985 ICRISAT procedure yields consumption numbers which are low relative to income, and motivated by an earlier draft of this paper and Gautam (1991), Ravallion and Chaudhuri (1992) use consumption data with the 1975 procedure over all 10 years. This yields correlations of consumption with income that are much higher than those reported below. This seems natural, however, since the starting point for the Ravallion-Chaudhuri measure of consumption is income itself. Ravallion and Chaudhuri also drop the first and last year of the data given concerns about data reliability, but the results indicated below do not turn on the use of eight years versus 10 years of data; this has been checked.
15 Tests were carried out for nonseparability of food from clothing, along the lines of the consumption-leisure analysis reported below. Nonseparability was rejected; aggregate consumption of clothing failed to explain individual food expenditure once aggregate food was used in the regression. Durables such as watches, radios, and bicycles are still relatively rare in the ICRISAT villages, and service flows are difficult to measure, especially variations in the service flow from housing. In the end, then, consumption vector c is taken to be a scalar, the value-weighted sum of various consumption categories, divided by a cost of living index to convert to real units in 1975.

556 ROBERT M. TOWNSEND
4. THE PROGRAMMING PROBLEM FOR DELIVERING PARETO OPTIMAL ALLOCATIONS
The programming problem for the determination of Pareto-optimal alloca- tions can now be written. Suppose in particular that there is some initial date t = 0 in the distant past and one future doomsday date T. At each date t let Et denote the contemporary realization of all the underlying random variables in the economy, assumed to be observed, for simplicity, at the beginning of date t. These realizations or shocks include random variables associated with the weather (that is, rainfall, temperature, humidity, and the like); shocks associated with the incidence of crop and human illness; shocks associated with changes in district prices; and random factors helping to determine births, deaths, migra- tions, division of extended families, and other endogenous demographic states.16 Let C<k(ht) and lk (ht) denote consumption and leisure, respectively, assigned to individual k given contemporary state Et and prior history of states (E1, . . -, ), where ht = (E1, . . ., E). Also let prob (ht) denote the ex ante probability at date t = 0 of this history and contemporary realization. Then the date t = 0 ex ante expected utility of individual k can be written as
T
(4) EptE prob (ht)Wk[Cck(ht), lk (ht), Atk] t=1 h,
with consumption c k(ht) restricted to be nonnegative and leisure lk (ht)bounded between zero and the time endowment. Here it is understood that utility, consumption, and leisure are zero for dead or unborn individuals. All individu- als discount the future stream of within-period utilities at a common rate p8 and share common expectations.17"18,19
16 There is an important literature which argues that some demographic events are uninsurable, e.g. Rosenzweig and Stark (1989), Ainsworth (1988), and the references cited therein. Implicitly, by expanding the commodity space, one is allowing for tests of this insurance here. Further, various demographic variables such as number of migrants, number of siblings, and number of daughters-in- law are explicitly included as right-hand-side variables in the regressions reported below. The benchmark regressions are also expanded to include household size, number of adults, and number of children, and these enter negatively in explanations of measured per capita consumption. This could reflect lack of insurance or economies of scale.
17 By setting the utility term of migrants at zero as well, one gives up on any attempt to integrate migration decisions with the analysis of risk bearing. In particular, all statements below on Pareto-optimal allocations should be understood to be conditional on migration states. As noted, people may migrate out of a village in bad times. We shall find out below whether consumptions are optimally distributed for those who stay in residence. This does not preclude the possibility that consumption dropped for those who left or otherwise moved in a way inconsistent with the risk-sharing model. A partial attempt to measure the impact of migration on consumption of residual claimants is reported below, namely by including the number of family migrants as a potential explanatory variable in the consumption regressions.
18 Sickness could be imagined to enter utility and influence the consumption variable as well, probably lowering it. This realistic but complicating feature is ignored in the theory. But the effects in practice, if any, should be picked up in the regressions of consumption on sickness to be described below.
19 Experimentation with positive subsistence points in consumption revealed these to be insignif- icantly different from zero for the most part, and they were subsequently dropped from the analysis.

RISK AND INSURANCE 557
Letting Ak denote the programming weight associated with individual k (in some family i), suppose for simplicity that these weights satisfy
M
(5) O < Ak < 1, E Ak = 1, k=1
where M is the number of individuals ever potentially alive and present in the village economy. The program is then simply one of maximizing the sum of weighted utilities by choice of consumptions c k(hd) and leisures lk (h,):
M T
(6) Ak E lE prob (ht)Wk[Clk(ht), lk(ht), Ak k=1 t=l ht
subject to resource constraints defining commodity aggregates, for each t, for each ht,
M
(7) Eck(ht) < -t(ht), k=1
M _ (8) Lk I(ht) < it(ht);
subject to feasibility constraints on consumption and leisure: that consumption be nonnegative and leisure bounded between zero and the time endowment, that is, for each t and for each ht,
(9) ct (ht) > 0; OAt (ht) Tt (ht);
and subject to a constraint capturing the balance of payments equation for the village as a whole: total expenditures on consumption and leisure cannot exceed full income, or, if we subtract labor from the time endowment, the value of consumption imports cannot exceed earnings from labor supply plus net profits. To write down this equation one would need to develop notation for aggregate profits from crop, livestock, and trade and handicraft activities. The equation would also need to allow changes in the village capital account, that is, changes in grain stocks, changes in currency, net sales of the vector assets, net changes in outside indebtedness adjusted for net gifts, and so on. Fortunately, neither this constraint nor any of the notation need be written out explicitly. Whatever determines aggregate consumption c-t(ht) and aggregate leisure It(ht), individ- ual consumptions and leisures need to be distributed so as to maximize (6) subject to (7), (8), and (9).20
20As noted, the objective function (6) is just the weighted sum of utilities for all potentially alive and present individuals in the village economy. At the level of a given household one could take the head at date t = 0 as altruistic, caring about the utility of all present and potential future members, with their utility terms entering additively into his. This delivers the intergenerational strings in the objective function (6) as in the work of Barro (1974) and Altonji, Hayashi, and Kotlikoff (1992). However, the sum in (6) is taken over all households, as though they cared about one another as well. These interpretations are not necessary, however, under either the present programming problem interpretation or the complete markets interpretation.

558 ROBERT M. TOWNSEND
If nonnegativity constraints (9) on consumption and leisure are not binding, then the first order conditions determining consumption and leisure are
(10) A c k(ht), lk (ht), Ak= AjW'j[c(ht), lI(ht), Ail = pC(ht)
and
(11 AkI c(ht), ltk(ht), Ak] AjWl [ctj(ht), lit(ht), Ail = A1(ht)
for all individuals such as k, j alive and present at date t and state ht, in number M(ht). Here lj(ht) is the common Lagrange multiplier on constraint (7) and lj(ht) on constraint (8). The common term (pt prob(ht)) which would appear on the left-hand side of (10) and (11) across individuals k and j has been factored out and placed in the Lagrange multipliers.
Now suppose that utility functions are separable and have the form (2) above. Keep track of varying family size numbers Nt/(ht) of household i at date t under history ht over N total households. Finally, assign common A'-weights to all individuals k in a household i and assign common risk aversion index ri. Then, following the steps of Mace (1991), here adding first-order conditions first over individuals k in household i and then over households i in the village, one obtains a formula for household j's consumption:
Nk= - N 1_-
ctk 1 - log( A') (12) k
logA) = - Ir
N/ N~~~~~,
_1 E Aklog(Ak) k=1~ ~ ~~=
___
r Nt'
Ak No 11
| k=1 t k=CiiLE,l

RISK AND INSURANCE 559
In equation (12), age-sex adjusted consumption per person in family j is determined by an economywide average of this variable. The coefficient on the variable can vary across households depending on risk aversion. Fixed effects are captured by the intercept term, specifically, the weight of household j relative to the village average. Finally, there is a second-order demographic adjustment term.21 Note that apart from intercepts all variables in equation (12) are measured.
Equation (12) may be viewed as a polar case of the more general implication predicted by the full risk sharing model. In (12), if variation in risk aversion indices oi is suppressed, all variation across households is in the intercepts (if one ignores the demographic term); that is
Nt/
Eck k=1 1( - E log (A')
(13) Nt/ k l--~og (AJ) - 1l(J
EAtk k=1
Nt' Nt'
1k A A log1(A 1 N EAt log(Ak)
Nt' i=N 1 EN t
L Ak k A= k k=1 k=1
N E C k
N i tN
k=1
If one were to use CRRA preferences, then one would find that all variation is in the slope coefficients on aggregate consumption (see the working paper), ignoring the demographic term. In the pooled, cross-sectional regressions, each of these restrictions can be imposed, one at a time. But when one runs the time-series regressions for households one at a time, both intercepts and slope terms are allowed to vary (in effect allowing risk aversion indexes oi to vary in (12); a oi-weighted demographic term ought to be used in the time series, as in (12), not (13), but this is not feasible). Ideally, one would like to do nonparamet- ric analysis of the more general implication that individual consumption should move monotonically with aggregate consumption and with nothing else, but 10 data points per household preclude this kind of data analysis.
If utility functions are nonseparable in consumption and leisure, then as in first-order conditions (10) and (11), one needs to allow the equating of marginal utilities of both consumption and leisure. Still, aggregate leisure and aggregate
21 This comes from the fact that consumption per unit of age, not consumption alone, enters the objective function.

560 ROBERT M. TOWNSEND
consumption are sufficient to determine all individual consumption allocations if no nonnegativity or upper bound constraint on leisure or consumption is binding. This suggests regression equations somewhat akin to (12) with the inclusion of average leisure, to control for the nonseparability. As noted, measures of leisure and labor supplied are also available from the ICRISAT data.
The careful work of counting household members and weighting by age and sex is meant to capture all relevant demographic change. By that standard no additional demographic or household size variables should enter equation (12) or (13) or their analogues with average leisure generated by (10) and (11). Still, the age-sex weights could be wrong.22 In addition there may be some economies of scale in some unobserved household production process, so that larger households need fewer measured "consumption inputs" per person to sustain ultimate utility levels. Such economies of scale have been estimated in disparate data sets from a variety of countries. See, for example, Lazear and Michael (1988). Economies of scale argue for the inclusion of additional demographic variables such as household size.
As noted, the theoretical foundation of this paper need not take a stand on how the optimal risk-sharing allocations might be achieved. Networks among family and friends, implicit or explicit contracts with village lenders, and other smoothing devices might work alone or in combination with one another. It is also true, of course, under the supposedly neoclassical environment of these village economies, that a decentralized complete markets competitive equilib- rium would be one of the many Pareto optima traced out as solutions to the program above as the household A'-weights were varied. This competitive equilibrium could be achieved with a sequence of spot markets for goods and labor in combination with markets in assets and perhaps in debts with state-con- tingent payoffs. It is certainly not necessary to trade Arrow-Debreu securities at some initial date t = 0. In any event, various combinations of markets can be enough to span the state space and to make an association between the weights in the programming problem and wealths in a decentralized complete markets competitive equilibrium.
This relation is particularly strong for the specific utility functions described above if, as a crude approximation, date- and state-contingent aggregate con- sumption is approximately constant (in the data it is not). Namely, for the exponential and CRRA utility functions, the log of the Pareto weight for household j is a linear function of either the level or the logarithm of the wealth of household j, respectively. This suggests finding variables in the data set which might be related to the wealth of household j and checking to see whether either levels or logs of these variables are related to the relative log weight of household j, estimated as a fixed effect in the regression equations. In
22A separate but interesting project would make more systematic use of the time series of consumption available from the dietary survey, along the lines indicated in this paper. The advantage of the dietary data is that they are available at the level of the individual.

RISK AND INSURANCE 561
particular, if landholdings and livestock are stable over time, then the profit components of wealth (that is, present and future profits from crop production and livestock) might be captured by the current value of land and livestock holdings. Of course, wealth should also include initial stocks and various assets. Theory also suggests that the value of inheritance would be a good proxy for date t = 0 wealth.
In summary, consider a reduced-form version of (12), or
(14) c*' a + 8 j + SiAJ + JXtJ + uJ, where
Nt, Nti
(15) c*' = E ck EAk k=1 k=1
is adult equivalent consumption in household j and l N
(16) t NE c i=l
is village average consumption per adult equivalent. Variable AJ is the demo- graphic term dictated by (12) (really (13), with possible variation in the or ignored for this term), XJ is any other variable, and uJ is a disturbance term. Note again from (13) that a common coefficient of risk aversion a- implies that fBJ = 1 and 8J= -1/o- for all j. These restrictions are imposed in the panel estimation (see Section 6), but not in the time-series regressions (Section 5), which allow individual variation. Of course the theory implies that no additional variables XJ will enter in (14) except perhaps for average leisure or a household size variable. That is, household income from crop production, income from livestock, income from trade and handicrafts, all income, full income, the wage, household sickness, days in unemployment, days not working for any reason, and so on should not enter as significant variables in the regression equations. This then constitutes a test for an optimal allocation of risk bearing. One should bear in mind, of course, that one can test against only events which have occurred relatively often in the sample. There is no way to tell from the data whether other events are optimally insured.23
5. EMPIRICAL RESULTS FROM THE TIME SERIES
One feature of these village economies is the tendency for comovement across households of age-sex adjusted consumption per person. This is espe- cially evident from the analogue to the income graph mentioned earlier (Figure 1). But now Figure 3 plots deviations of household consumption of grain at a point in time from average consumption at a point in time over all households and over all 10 years. Relative to the analogous figures for income, consump- tions comove more, i.e., deviate from the average less. More formal statistics are
23 The time span, 1975-1984, was relatively drought free. There were big droughts just before and just after the sample period.

562 ROBERT M. TOWNSEND
also revealing. The correlation of age-sex adjusted consumption of grain per person, household by household, with the village sample average is displayed in Figure 4. The point estimates of the correlations for consumption tend to exceed those for income (Figure 2), with the partial exception of Kanzara. The standard errors are large, however.
To carry out more formal tests of the risk-sharing model, one needs to identify the source of error terms in the regression equations (14). The view taken here is that the dependent variables in equations (14) are measured with errors which are independent and identically distributed (i.i.d.) over time for a given household (and independent across households at a point in time). This delivers an i.i.d. error term in the time-series regressions (and in the cross-sec- tional regressions reported below). On the right-hand side of the regressions, the village-wide average consumption variable is approximated by the sample average. One hopes by the law of large numbers that the approximation is fairly accurate. Still, the sample average remains only an approximation. Thus, in the time-series regressions, when one examines one household at a time over the sample period, the average consumption variable does not include the con- sumption of the specific household under scrutiny.
In addition to average consumption and the demographic adjustment variable dictated by (14), other right-hand-side variables Xi are entered one at a time into the time-series regressions for each household j. Multiple additional right-hand-side variables are not attempted because of limited degrees of freedom. Of course, several of these additional right-hand-side variables may be measured with error, presumably biasing the associated coefficient estimates toward zero. (A correction for measurement error is conducted when the data are pooled in the panel below.)
As Deaton (1990) has pointed out, the coefficients /JV on the average consumption variable must average to unity across households if the sample is sufficiently large and if no other terms are included in the regression, even if household regressions are run one at a time. In this sense the average value for the coefficients tells us nothing. However, the dispersion of the fVi around a value of unity is of some interest. The theory with uniform risk aversion implies that the coefficients 8' should be unity for every household. (Still, the coeffi- cient for a given household may be close to zero if that household is quite risk averse.)
Of course the value of the intercepts ac should average to zero across households if the sample is sufficiently large. Again, there is no information in the value of the average.
To simplify and shorten the presentation here, results are reported for the regressions in levels only. Results for the regressions in logs are quite similar, almost uniformly. Most of these are available in the earlier working paper.24
24 For the record, the following variables take on zero or negative values, necessitating the use of truncated logs: crop yields, profits, labor income, real livestock, value of inheritance, operated area, and owned bullocks.

RISK AND INSURANCE 563
AggMgate Consmption
C -5
Rank of Household Graphs by village
(A)
Aggregate Conmption
AUO
Rank of Household Graphs by village
(B)
Aggregate Consmption
AOU h Kazwa
C4- 5 1 _/ S - '*
5 1 >
-s -s
Rank of Household
Graphs by village
(C)
FIGURE 5.-Estimates of ,B, ordered by magnitude. The bands define a 95% confidence interval. The first panel uses as its measure of consumption the sum of the value (in 1975 rupees) of all foodstuffs, edible oil, and clothing per adult equivalent per year, and uses all years (1975-1984). The second panel uses only the value of grain per adult equivalent per year, and uses all years. The third panel uses the same measure of consumption as the first, but uses only years 1976-1981. Estimates greater than five in absolute value have been removed in order to produce a readable graph.

564 ROBERT M. TOWNSEND
All Income GrapuepU hsbaph Kvaiara
*~~~~~~~~ S ^ *
S
Ui 0
-5 ~ ~ ~ ~ ~ ~ 7
4 4~~~~~~~~~~~1 2
Rank of Household Graphs by village
(A)
All Income AUr1U Sr Zw
x. S 0U
Rank of Household Graphs by village
(B)
All Income smote allue Kwaowa
C .~~~A AAA A AAt'A
0 0
U~~~~~
Rank of Hwsoehold Graphs by village
(C) FIGURE 6.-Estimates of (the coefficient associated with all income), ordered by magnitude.
The bands define a 95% confidence interval. The first panel uses as its measure of consumption the sum of the value (in 1975 rupees) of all foodstuffs, edible oil, and clothing per adult equivalent per year, and uses all years (1975-1984). The second panel uses only the value of grain per adult equivalent per year, and uses all years. The third panel uses the same measure of consumption as the first, but uses only years 1976-1981. Estimates greater than five in absolute value have been removed in order to produce a readable graph.

RISK AND INSURANCE 565
Figure 5 reports on coefficient values ,Bi for average consumption, ordered from lowest to highest (with 95% confidence intervals), using the three different combinations of time intervals and consumption categories. Using all 10 years of the data and the more inclusive consumption category (Figure 5, panel A), one notes that the consumption coefficient values have a tendency to center around unity, with the lower confidence line often above zero, at least for Shirapur and Kanzara. This fit deteriorates substantially, however, in panel B, which uses grain only, and in panel C, which uses only six years of data; zero and unity are indistinguishable, and more extreme values are included.
Figure 6 shows the same type of coefficient plots for the all-income variable. Now there is a striking tendency for the coefficient values to be centered around zero and for these values to be bounded away from unity. This remains true when the data on grain only for all 10 years and the data for all consumptions for only six years of data are used.
Table III.a reports the average values and standard deviations across house- holds of the coefficient estimates ai on intercepts, ,BJ on average consumption, and 8i on the demographic variable. The average value of the demographic coefficient 8' is negative in two out of three villages, consistent with theory, but the value seems implausible. Table III.b reports the coefficients J on the all-income variable and on various alternative measures of income. Table III uses all 10 years of data but for grain consumption only. Income coefficients' averages are bounded from above by .35 and are often lower; an exception concerns profits from livestock, reaching .90 in Kanzara. Note, however, the enormous standard deviations of coefficient values in the population.
More formally, one wonders whether there is enough power to reject the hypothesis that the coefficients ,Bi on average consumption should be one for every household (with uniform risk aversion) and that the coefficients Vj on income be zero. If not, is there power to reject the perverse hypothesis that the
TABLE III
a. TIME SERIES ESTIMATES FOR BENCHMARK REGRESSION'
Population Coeff N Mean Std. Dev.
1 All a 133 64.8840 424.1715 2 /3 133 0.7386 1.9168 3 8 133 -171.8203 2364.43
4 Aurepalle a 44 - 21.1252 316.4395 5 /3 44 0.9681 1.2367 6 8 44 244.5828 2450.87
7 Shirapur a 45 17.4952 257.3634 8 ,B 45 0.9410 1.2026 9 8 45 -371.5519 1525.96
10 Kanzara a 44 150.1918 580.7951 11 J6 44 0.4654 2.7933 12 8 44 -326.9005 2864.55
a Estimated using the regression equation (14) and ordinary least squares. The measure of consumption is the value of consumed grains.

566 ROBERT M. TOWNSEND
TABLE III Continued
b. TIME SERIES ESTIMATES OF vb
Population Xi N Mean Std. Dev.
1 Aurepalle Al Income 44 0.1107 0.6774 2 Crop Income 44 - 0.0549 1.0683 3 Labor Income 44 0.3588 0.8839 4 Profit from Trade 44 0.2289 2.8739
and Handicrafts 5 Profit from 44 0.1329 2.8991
Animal Husbandry
6 #Household 44 - 34.8736 9.7365 Members
7 #Adults 35 - 20.3090 8.2518 8 #Children 35 - 7.4447 9.7078
9 Shirapur All Income 45 - 0.0473 0.7282 10 Crop Income 45 0.0060 0.5716 11 Labor Income 45 0.1228 0.8650 12 Profit from Trade 45 0.0642 1.5072
and Handicrafts 13 Profit from 45 0.1236 1.1744
Animal Husbandry
14 #Household 45 -11.2844 11.0306 Members
15 #Adults 33 - 18.3510 9.4325 16 #Children 33 - 12.7787 9.8409
17 Kanzara All Income 44 0.1106 0.8024 18 Crop Income 44 0.2213 1.7041 19 Labor Income 44 0.0960 1.0223 20 Profit from Trade 44 - 0.2830 4.0115
and Handicrafts 21 Profit from 44 0.9061 2.7730
Animal Husbandry
22 #Household 44 - 57.2679 25.5271 Members
23 #Adults 36 - 12.2616 9.7776 24 #Children 36 6.5228 8.2398
bThe variables in lines 1-5, 9-13, and 17-21 are measured in units of 1975 rupees per adult equivalent. The uniits for lines 6-8, 14-16, and 22-24 are simply unweighted head counts. Reported means and standard deviations are of studentized ordinary least squares estimates of (14) with each of the X' added in turn as an additional independent variable, weighted to correctly reflect the proportion of landless households in the population. The measure of consump- tion for these regressions is the value of consumed grains. All years (1975-1984) are used.
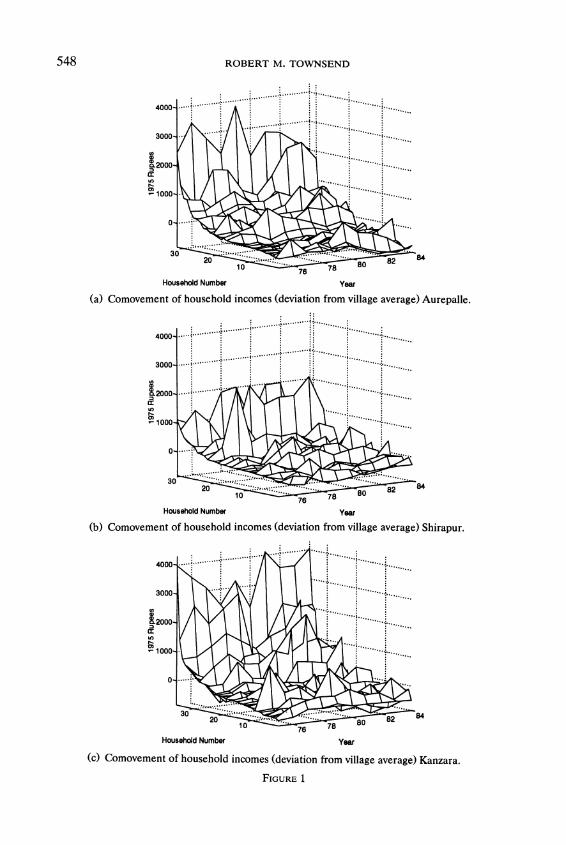
reverse is true? As can be seen from Table IV, there is a tendency to reject /3) = 0 and accept /3-' = 1 with all 10 years of data, though this tendency is weaker in Aurepalle than in the other two villages. This power deteriorates markedly with only six years of data or when the data on grain only are used. For the income coefficients Vi, on the other hand, in Table V, one accepts
= 0 and rejects V = 1 for most households and most income categories with 10 years of data (Table V.a). This remains true, though somewhat attenuated,

RISK AND INSURANCE 567
TABLE IV
TABULATION OF REJECTIONS OF Two NULL HYPOTHESESa
H0:o, = 1 H0:o8 = 0
Population N 3 < 1 3 = 1 3 > 1 3<O ,3 = ,3 > 0
A All 133 22 107 4 9 55 69 Aurepalle 44 5 38 1 2 24 18 Shirapur 45 8 35 2 3 14 28 Kanzara 44 9 34 1 4 17 23
B All 133 27 101 5 9 90 34 Aurepalle 44 8 34 2 2 22 20 Shirapur 45 9 34 2 3 32 10 Kanzara 44 10 33 1 4 36 4
C All 129 22 104 3 12 99 18 Aurepalle 43 7 34 2 4 26 13 Shirapur 43 6 37 0 3 37 3 Kanzara 43 9 33 1 5 36 2
'In panel (A), the measure of consumption used is the sum of the value of all foodstuffs, edible oil, and clothing, all in units of 1975 rupees per adult equivalent, for years 1975-1984. In panel (B), the measure of consumption is as in (A), except only the value of grain is used. In panel (C), the measure of consumption is as in (A), except only the years 1976-1981 are used. The counts in the middle columns of each set are the number of households for which one cannot reject 13 = 1 or 13 = 0 at a 95% level of confidence. The counts in the left-hand columns of each set are the number of households for which one can reject 13 = 1 or 13 = 0, and for which the associated t statistic lies in the left-hand tail of its distribution. Finally, the counts in the right-hand columns are the number of households for which one can reject 13 = 1 or 13 = 0 and for which the associated t statistic lies in the right-hand tail of its distribution.
TABLE V
a. TABULATION OF NUMBER OF REJECTIONS OF Two SETS OF NULL HYPOTHESES
(ALL CONSUMPTION)a
Ho: 0= Ho: ;= 1
Population Variable ;<0 ;=0 > O < 1 = 1 > 1
1 Aurepalle All Income 4 32 8 37 7 0 2 Crop Income 3 40 1 26 18 0 3 Labor Income 3 37 4 17 27 0 4 Profit from Trade 3 37 4 15 27 2
and Handicrafts 5 Profit from Animal 3 37 4 13 30 1
Husbandry 7 #Household 9 35 0
Members 8 #Adults 5 30 0 9 #Children 2 31 2
a The measure of consumption used is the sum of the value of all foodstuffs, edible oil, and clothing, all in units of 1975 rupees per adult equivalent per year. These regressions use years (where available) 1975-1984. The counts in the middle columns of each set are the number of households for which one cannot reject ; = 1 or ; = 0 at a 95% level of confidence. The counts in the left-hand columns of each set are the number of households for which one can reject ; = 1 or ; = 0 and for which the associated t statistic lies in the left-hand tail of its distribution. Finally, the counts in the right-hand columns are the number of households for which one can reject = 1 or ; = 0 and for which the associated t statistic lies in the right-hand tail of its distribution. The null hypothesis that = 1 is only sensible when X, has the same units as the measure of consumption: this is the case only for lines 1-5, 10-14, and 19-23.

TABLE V Continued
a. TABULATION OF NUMBER OF REJECTIONS OF Two SETS OF NULL HYPOTHESES (ALL CONSUMPTION)
Ho: 0 Ho: ;=1
Population Variable {<O =O > O < 1 >= 1 >1
10 Shirapur All Income 7 31 7 37 8 0 11 Crop Income 7 33 5 29 16 0 12 Labor Income 4 37 4 23 22 0 13 Profit from Trade 4 40 1 12 33 0
and Handicrafts 14 Profit from Animal 5 35 5 14 30 1
Husbandry 16 #Household 7 38 0
Members 17 #Adults 6 27 0 18 #Children 2 29 2
19 Kanzara All Income 6 33 5 42 2 0 20 Crop Income 6 37 1 31 13 0 21 Labor Income 5 35 4 29 15 0 22 Profit from Trade 5 37 2 11 33 0
and Handicrafts 23 Profit from Animal 6 35 3 19 25 0
Husbandry 25 #Household 5 39 0
Members 26 #Adults 1 35 0 27 #Children 0 34 2
b. TABULATION OF NUMBER OF REJECTIONS OF Two SETS OF NULL HYPOTHESES (GRAIN CONSUMPTION)b
Ho: ; = ? Ho: {= 1
Population Variable ;<0 {=o ;>O < 1 = 1 > 1
1 Aurepalle All Income 3 34 7 37 7 0 2 Crop Income 4 39 1 28 16 0 3 Labor Income 3 35 6 18 26 0 4 Profit from Trade 3 37 4 21 22 1
and Handicrafts 5 Profit from Animal 3 38 3 20 23 1
Husbandry 7 #Household 10 34 0
Members 8 #Adults 1 32 2 9 #Children 2 33 0
10 Shirapur All Income 5 35 5 42 3 0 11 Crop Income 6 37 2 33 12 0 12 Labor Income 5 35 5 37 8 0 13 Profit from Trade 6 37 2 15 29 1
and Handicrafts 14 Profit from Animal 6 37 2 27 17 1
Husbandry 16 #Household 7 36 2
Members 17 #Adults 5 27 1 18 #Children 1 30 2
bThe measure of consumption used is the value of consumed grains, all in units of 1975 rupees per adult equivalent per year. These regressions use years (where available) 1975-1984. The counts in the middle columns of each set are the number of households for which one cannot reject ; = 1 or ; = 0 at a 95% level of confidence. The counts in the left-hand columns of each set are the number of households for which one can reject ; = 1 or ; = 0 and for which the associated t statistic lies in the left-hand tail of its distribution. Finally, the counts in the right-hand columns are the number of households for which one can reject C= 1 or <= 0 and for which the associated t statistic lies in the right-hand tail of its distribution. The null hypothesis that T= 1 is only sensible when X, has the same units as the measure of consumption: this is the case only for lines 1-5, 10-14, and 19-23.
TABLE V Continued
b. TABULATION OF NUMBER OF REJECTIONS OF Two SETS OF NULL HYPOTHESES (GRAIN CONSUMPTION)
H0: 0= HO:__ _ _1
Population Variable <0 0 > 0 < 1 ;=1 > 1
19 Kanzara All Income 6 35 3 42 2 0 20 Crop Income 6 36 2 35 9 0 21 Labor Income 6 35 3 32 12 0 22 Profit from Trade 7 37 0 16 28 0
and Handicrafts 23 Profit from Animal 5 36 3 29 15 0
Husbandry 25 #Household 8 36 0
Members 26 #Adults 3 32 1 27 #Children 0 34 2
C. TABULATION OF NUMBER OF REJECTIONS OF Two SETS OF NULL HYPOTHESES (6 YEARS)C
HO: ;= HO:; 1
Population Variable <0 ;=0 ;> 0 < 1 = 1 > 1
1 Aurepalle All Income 8 35 0 23 20 0 2 Crop Income 7 36 0 21 22 0 3 Labor Income 7 32 4 9 34 0 4 Profit from Trade 6 34 3 12 31 0
and Handicrafts 5 Profit from Animal 6 36 1 13 29 1
Husbandry 7 #Household 8 35 0
Members 8 #Adults 2 33 0 9 #Children 1 34 0
10 Shirapur All Income 5 35 2 24 18 0 11 Crop Income 6 34 2 20 22 0 12 Labor Income 5 37 0 12 30 0 13 Profit from Trade 6 35 1 7 34 1
and Handicrafts 14 Profit from Animal 5 32 5 8 30 4
Husbandry 16 #Household 7 36 0
Members 17 #Adults 1 31 1 18 #Children 1 32 0
19 Kanzara All Income 6 37 0 25 18 0 20 Crop Income 6 37 0 16 27 0 21 Labor Income 7 35 1 15 28 0 22 Profit from Trade 6 36 1 10 33 0
and Handicrafts 23 Profit from Animal 7 35 1 10 33 0
Husbandry 25 #Household 6 37 0
Members 26 #Adults 1 35 0 27 #Children 0 35 1
c The measure of consumption used is the sum of the value of all foodstuffs, edible oil, and clothing, all in units of 1975 rupees per adult equivalent per year. These regressions use years (where available) 1976-1981. The counts in the middle columns of each set are the number of households for which one cannot reject ; = 1 or = 0 at a 95% level of confidence. The counts in the left-hand columns of each set are the number of households for which one can reject ; = 1 or ; = 0 and for which the associated t statistic lies in the left-hand tail of its distribution. Finally, the counts in the right-hand columns are the number of households for which one can reject = 1 or ; = 0 and for which the associated I statistic lies in the right-hand tail of its distribution. The null hypothesis that = 1 is only sensible when X, has the same units as the measure of consumption: this is the case only for lines 1-5, 10-14, and 19-23.

570 ROBERT M. TOWNSEND
TABLE VI
REJECTIONS OF FULL INSURANCE AGAINST INCOME SHOCKSa
Aurepalle Shirapur Kanzara Landholdings + - + - +
Landless 6 0 1 2 1 5 Small Farm 3 0 3 2 1 1 Medium Farm 1 3 5 2 3 2 Large Farm 1 0 0 4 3 1
aThe numbers in this table are a simple count of the number of households, by land class, for which a significant coefficient was found in any of the regressions reported in Table V for any of the income variables (i.e. all income, crop income, labor income, profit from trade or handicrafts, or profit from animal husbandry). The counts in the columns headed with a " + " are of households which have income shocks positively correlated with their consumption; those counts in the columns labelled with a "-" are of households which have income shocks negatively correlated with their consumption. This table uses only grain consumption as the measure of consumption.
with only six years of data (Table V.c). But the effect reappears and may be more exaggerated when the measure of consumption is grain only (Table V.b). The time-series data provide little evidence on the value of the coefficients /i but indicate a surprising degree of insurance against idiosyncratic income shocks.
Using grain consumption only and all 10 years of data, I ran tests for first-order serial correlation. I was able to reject the null hypothesis of no first-order serial correlation at the 10% significance level for only eight of the 125 households for which I was able to calculate a Durbin-Watson statistic. First differences are also used in the panel below.
In summary, it is difficult to reject the hypothesis that /8i = 1, although the power of the tests is low. More clearly, income shocks seem to matter little in the determination of consumption. Since I do, however, reject /i = 1 and accept V> 0 for some households, a natural question arises: who is not insured in these villages? If we check for the significance of any income term (labor, livestock, crop profits, all income, trade and handicrafts) over each and every household, we get more rejections of the hypothesis that income does not matter and a hint of pattern by land class. Specifically, the landless and small farmers in Aurepalle and the small and medium farmers in Shirapur seem more vulnerable. However, medium and larger farmers seem more vulnerable in Kanzara. This is apparent in Table VI.
6. EMPIRICAL RESULTS FROM THE PANEL
In the cross-sectional regressions, in which households are pooled to form a panel, there remains the problem that at any date the average of the dependent variable over households is close to the right-hand-side average consumption variable. This makes the coefficient on average consumption unity. To avoid this problem in the cross-sectional regressions, the average consumption variable is subtracted from both sides, as the theory dictates with uniform risk aversion. Alternatively, both in the benchmark regressions and in the regressions with alternative right-hand-side variables, one can take each household's difference

RISK AND INSURANCE 571
TABLE VII
ALTERNATIVE INCOME MEASURES a
Village Income Deviations Lagged Income 3-Year Average
Aurepalle 0.0199 0.0067 0.0043 (0.0150) (0.0136) (0.0178)
Shirapur 0.0535* - 0.0063 0.0500* (0.0125) (0.0118) (0.0154)
Kanzara 0.0813* -0.0209 0.0622* (0.0128) (0.0117) (0.0156)
aAlternative timing and forms for income variables coefficient values for incomes in cross-sectional regression (18). The first column uses the devia- tion of each household's income from the village average for X; the second column uses income from the previous year; and the third column uses a three-year average of the household's income. The measure of consumption is the value of consumed grain.
from the sample average of households. This again removes the average consumption variable from the right-hand side and places it on the left-hand side, with all other right-hand-side variables now expressed as differences from household sample averages, reported in Table V11.25
To correct for measurement error in right-hand-side variables, one can follow Griliches and Hausman (1986). That is, to test for measurement error in right-hand-side variables, suppose that the true value of some such variable is given by XJ, but we observe only
A . .
(17) = XtJ + v,
where the measurement error vi has mean zero and is i.i.d. over households and time. Then substituting into equation (14), assuming common coefficients across households, and subtracting average consumption from the left-hand side yields
(18) ct* _ct a 5t AtI + Vw,Xti + ut .
Estimation of (14), eliminating fixed effects by taking differences from sample averages, delivers the so-called within estimate w, whereas estimation of a first-differenced version delivers estimates Va:
(19) (C*i _ C-t) -(ct*jl- E-,_) = 5(Ati -Ati-,) +
VA(Xt-tl
+ (uti- uti 1 )-va( -
vti-v_ )
Evidently, in estimation of both w and ga in (18) and (19), respectively, right-hand-side variables are correlated with the disturbance term. Nonetheless, by combining the information given by these two (inconsistent) estimates, we can construct a consistent estimate in (14) of the true parameter T in (14)
25 Deaton (1990) avoids the use of an average consumption variable altogether by allowing for village-specific effects. Ravallion and Chaudhuri (1992) use this procedure with the ICRISAT consumption data as here. The results are not inconsistent with those reported below.

572 ROBERT M. TOWNSEND
TABLE
VIII
a.
PANEL
ESTIMATES
WITH
ALL
CONSUMPTION
Village:
Aurepalle
Shirapur
Kanzara
(B)
First
(C) 2
IV
(E)
First
(F) 2
IV
(H)
First
(I) 2
IV
(A)Std.
Diff
G-H
(D)
Std.
Diff
G-H
(G)Std.
Diff
G-H
Variable
Vw
A G
1
All
Income
0.0772*
0.0469
0.1169*
0.0592*
-0.0073
0.1233*
0.2177
(0.0221)
(0.0236)
[0.768]
(0.0277)
[0.0236]
[1.290]
(0.0219)
(0.0227)
[-
3.177]
2
Crop
Profit
-0.0150
-0.0380
0.0825*
0.0352
0.0513*
0.0677*
-0.2545
(0.0312)
(0.0299)
[0.380]
(0.0373)
[0.0301]
[0.609]
(0.0286)
(0.0308)
[-
2.355]
3
Labor
Income
0.0401
0.2597*
0.1127*
0.1925*
0.0198
0.1003*
(0.0647)
(0.0830)
[-
1.543]
(0.0740)
[0.0655]
[-0.271]
(0.0406)
(0.0422)
[-
1.058]
4
Profit
from
0.2363*
0.1495*
0.0291
-0.1091
0.1347
0.4057*
Trade
and
(0.0352)
(0.0389)
[1.197]
(0.0671)
[0.0757]
[0.742]
(0.0895)
(0.0863)
[-
1.312]
Handicrafts
5
Profit
from
0.0485
-0.0276
0.5014*
0.1994*
1.4678
0.0672
0.2252*
Animal
(0.0676)
(0.0689)
[-0.116]
(0.0789)
[0.0693]
[2.193]
(0.0606)
(0.0715)
[-1.387]
Husbandry
6
Full
Income
-0.0123*
0.0016
NA
NA
NA
-0.0081
0.0058
(0.0027)
(0.0058)
[-
1.412]
(0.0044)
(0.0043)
[-0.012]
7
Wage
-10.269
-7.1232
-41.201*
-47.7768
-
116.31*
-11.7713
-297.696
(8.4114)
(10.2640)
[0.004]
(15.4649)
[31.3120]
[-0.467]
(14.057)
(16.8668)
[-4.161]

RISK AND INSURANCE 573
8
Proportion of
1462.02
493.741
NA
NA
NA
-0.94
269.242
Year
Sick
(1469.77)
(1852.40)
[0.210]
(325.22)
(280.49)
[-
0.443]
9
Prop. of
Year
NA
NA
NA
NA
NA
NA
1192.96
60.6126
Unemployed
(752.48)
(534.058)
[0.910]
10
Proportion of
484.739
-151.657
NA
NA
NA
63.025
125.480
Year
Spent
(816.014)
(771.299)
[0.311]
(281.21)
(232.173)
[-0.001]
Not
Working
11
Average
0.0754
0.0726
NA
NA
NA
0.2433*
0.3284*
Village
(0.0396)
(0.0399)
[-
0.061]
(0.0672)
(0.0586)
[-
0.687]
Leisure
12
Average
1.0616
0.4566
NA
NA
NA
0.6648*
0.2443
Village
Labor
(0.5311)
(0.5191)
[1.298]
(0.2543)
(0.2161)
[1.957]
13
#Household
-
45.778*
-49.071*
-
25.507*
-
51.7642*
-15.6266
-
21.355*
-
45.8264*
Members
(6.3693)
(7.1571)
[0.333]
(5.5078)
[7.1431]
[2.109]
(6.7116)
(9.9030)
[1.453]
14
#Adults
-
30.459*
-
32.304*
-
52.448*
-
76.9893*
-
25.534*
-
31.8577*
(9.7187)
(12.8311)
[0.115]
(8.8253)
[12.7216]
[1.252]
(9.3840)
(14.3541)
[0.444]
15
#Children
-47.880*
-32.815*
-22.154*
-65.3670*
-12.7078
-15.1700
(11.9590)
(12.9499)
[-0.781]
(10.221)
[14.1735]
[1.743]
(12.866)
(16.4253)
[0.063]
aParameter
estimates
exploiting
the
panel
aspect of
the
data
set.
The
measure of
consumption
(the
dependent
variable) is
the
sum of
the
value of all
foodstuffs,
edible
oil,
and
clothing, in
units
of
1975
rupees
per
adult
equivalent
per
year.
All
years
(1975-1984)
are
used
where
available.
The
estimates in
columns
A,
D,
and G
(labelled
"Std.,"
for
'Standard')
come
from
the
regression
implied by
equation
(18),
with
some
additional
independent
variable,
whose
coefficient
we
call
4w
(only
one
additional
independent
variable
is
added at
any
one
time, so
that
this
table
reports
the
results
of 3
villages x 3
estimators x 15
independent
variables).
The
estimates in
columns B,
E,
and H
(CJ)
come
from
first-differenced
versions
of
the
same
regression,
equation
(19). If
the
standard
and
first-differenced
estimates
differ
significantly,
then
this
may
be
taken
as
evidence
of
measurement
error in
the
independent
variables;
the
parenthetical
number in
each
cell
of
columns
C, F,
and I is a t
statistic
testing
this
hypothesis.
Where
the
difference is
significant,
the
estimate
from
(20) is
given in
columns C, F,
and I
(c),
which
assumes
the
existence of
such
measurement
error
and
corresponds to a
two-instrument
version of
the
estimator
described
by
Griliches-Hausman
(1986),
an
estimator
which is
consistent
even
when
measurement
error is
present.
Standard
errors
are in
parentheses.
Estimates of
the
standard
error of ;
are
not
reported;
they
are,
however,
bounded
below by
the
estimates of
the
standard
error of
V,,.
Starred
estimates
are
significant at
the
the
95%
confidence
level.

574 ROBERT M. TOWNSEND
TABLE
VIII
Continued
b.
PANEL
ESTIMATES
WITH
GRAIN
CONSUMPTIONb
Village:
Aurepalle
Shirapur
Kanzara
(B)
First
(C) 2
IV
(E)
First
(F) 2
IV
(H)
First
(1) 2
IV
(A)
Std.
Diff
G - H
(D)
Std.
Diff
G
-H
(G)
Std.
Diff
G-H
Variable
w I
d
{w
C
CA
1
All
Income
0.0474*
0.0289*
0.0605*
0.0233
0.0725*
0.0697*
(0.0159)
(0.0151)
[0.599]
(0.0129)
(0.0142)
[1.676]
(0.0122)
(0.0152)
[0.120]
2
Crop
Profit
0.0238
-0.0066
0.0463*
0.0172
0.0596*
0.0313*
(0.0224)
(0.0191)
[0.716]
(0.0175)
(0.0181)
[0.818]
(0.0165)
(0.0204)
[0.935]
3
Labor
Income
0.0591
0.2335*
0.1022*
0.1456*
0.0623*
0.0721*
(0.0464)
(0.0522)
[-
1.761]
(0.0345)
(0.0390)
[-
0.497]
(0.0235)
(0.0279)
[-
0.278]
4
Profit
from
0.1241*
0.0430
0.0447
-0.0773
0.3276
0.1109*
0.2794*
Trade
and
(0.0260)
(0.0252)
[1.538]
(0.0315)
(0.0453)
[2.074]
(0.0521)
(0.0569)
[-1.562]
Handicrafts
5
Profit
from
-0.1539*
-0.0081
0.0937*
0.0118
0.1007*
0.1132*
Animal
(0.0478)
(0.0439)
[-1.622]
(0.0389)
(0.0420)
[1.204]
(0.0350)
(0.0476)
[-0.2431
Husbandry
6
Full
Income
-0.0014
0.0092*
NA
NA
NA
-0.0025
0.0010
(0.0014)
(0.0029)
[-
0.526]
(0.0023)
(0.0032)
[0.381]
7
Wage
12.3740*
-10.2991
12.9453
0.81028
-3.9341
-13.2026
(5.5288)
(6.3401)
[0.374]
(7.4907)
(18.0369)
[0.477]
(9.2951)
(10.9313)
[0.4641

RISK AND INSURANCE 575
8
Proportion of
329.64
475.580
NA
NA
NA
34.118
90.563
Year
Sick
(772.506)
(11029.3)
[-0.046]
(166.85)
(204.62)
[-0.250]
9
Prop. of
Year
NA
NA
NA
NA
NA
NA
250.140
149.675
Unemployed
(388.82)
(388.463)
[0.169]
10
Proportion of
816.088
1171.61*
NA
NA
NA
63.025
125.480
Year
Spent
(422.328)
(416.363)
[-0.511]
(281.21)
(232.173)
[-0.222]
Not
Working
11
Average
0.0555*
0.0744*
NA
NA
NA
0.1132*
0.1373*
Village
(0.0205)
(0.02157)
[-0.555]
(0.0347)
(0.0456)
[-
0.503]
Leisure
12
Average
0.9926*
1.0886*
NA
NA
NA
0.1090
0.1092
Village
(0.2691)
(0.2732)
[-0.324]
(0.1332)
(0.1577)
[-0.154]
Labor
13
#Household
-
33.571*
-
35.4594*
-
15.955*
-
29.7459*
-23.5239
-6.1817
-
24.0593*
Members
(4.5549)
(4.4722)
[0.353]
(2.5296)
(4.3161)
[2.454]
(3.9607)
(6.6264)
[1.855]
14
#Adults
-
18.987*
-25.2752*
-23.177*
-44.2497*
-14.5125
3.9391
-15.4041
(6.4754)
(7.9797)
[0.426]
(4.2859)
(7.2936)
[2.038]
(5.6423)
(9.3545)
[1.524]
15
#Children
-
28.557*
-
17.851*
-
22.833*
-36.2144*
-11.8080
-0.5633
(7.9957)
(8.1289)
[-
0.759]
(4.7524)
(8.1505)
[1.377]
(7.6255)
(10.6792)
[-
0.644]
bParameter
estimates
exploiting
the
panel
aspect of
the
data
set.
The
measure of
consumption
(the
dependent
variable) is
the
value of
consumed
grain in
units of
1975
rupees
per
adult
equivalent
per
year.
All
years
(1975-1984)
are
used
where
available.
The
estimates in
columns
A,
D,
and G
(labelled
"Std.,"
for
'Standard')
come
from
the
regression
implied
by
equation
(18),
with
some
additional
independent
variable,
whose
coefficient
we
call
Vw
(only
one
additional
independent
variable is
added at
any
one
time, so
that
this
table
reports
the
results
of 3
villages x 3
estimators x 15
independent
variables).
The
estimates in
columns
B,
E,
and
H(GA)
come
from
first
differenced
versions
of
the
same
regression,
equation
(19). If
the
standard
and
first-differenced
estimates
differ
significantly,
then
this
may be
taken as
evidence of
measurement
error in
the
independent
variables;
the
parenthetical
number in
each
cell of
columns C, F,
and I is a t
statistic
testing
this
hypothesis.
Where
the
difference is
significant,
the
estimate
from
(20) is
given in
columns C,
F,
and I
(c),
which
assumes
the
existence
of
such
measurement
error
and
corresponds to a
two-instrument
version of
the
estimator
described
by
Griliches-Hausman
(1986),
an
estimator
which is
consistent
even
when
measurement
error is
present.
Standard
errors
are in
parentheses.
Estimates
of
the
standard
error of ;
are
not
reported;
they
are,
however,
bounded
below
by
the
estimates of
the
standard
error of
Vw.
Starred
estimates
are
significant at
the
the
95%
confidence
level.

576 ROBERT M. TOWNSEND
TABLE
VIII
Continued
C.
ABBREVIATED
PANEL
ESTIMATES
USING
ALL
CONSUMPTION'
Village:
Aurepalle
Shirapur
Kanzara
(B)
First
(C) 2
IV
(E)
First
(F) 2
IV
(H)
First
(I) 2
IV
(A)Std.
Diff
G-H
(D)
Std.
Diff
G-H
(G)Std.
Diff
G-H
Variable
VA s
Gs
;s
1
All
Income
0.1362*
0.0955*
0.0830*
0.0345
0.1398*
0.1408*
(0.0265)
(0.0218)
[0.804]
(0.0265)
(0.0266)
[1.314]
(0.0270)
(0.0268)
[-
0.0511
2
Crop
Profit
0.0186
-0.0330
0.0276
0.0092
0.0978*
0.1228*
(0.0395)
(0.0279)
[0.136]
(0.0358)
(0.0334)
[0.394]
(0.0392)
(0.0394)
-
0.442]
3
Labor
Income
0.3334*
0.2600*
0.2096*
0.2028*
0.0924*
0.0841
(0.1099)
(0.0934)
[0.339]
(0.0779)
(0.0775)
[0.178]
(0.0507)
(0.0514)
[0.094]
4
Profit
from
0.2349*
0.1895*
0.0599
-0.1361
0.3425*
0.3157*
Trade
and
(0.0351)
(0.0326)
[0.604]
(0.0646)
(0.0825)
[1.855]
(0.1067)
(0.1080)
[1.085]
Handicrafts
5
Profit
from
0.0106
0.2101*
0.2751*
0.1799*
0.2996*
0.4201*
Animal
(0.0877)
(0.0673)
[-1.221]
(0.0770)
(0.0806)
[0.769]
(0.0813)
(0.1008)
[-
0.8391
Husbandry
6
Full
Income
0.0047
0.0096
NA
NA
NA
0.0068
0.0041
(0.0088)
(0.0091)
[-
1.698]
(0.0048)
(0.0062)
[0.009]
7
Wage
59.1397*
-8.8646
-310.420
-2.0078
29.1321
-11.9500
39.1644
(19.5826)
(12.8291)
[2.066]
(19.7586)
(32.9593)
[-
0.332]
(23.201)
(20.0377)
[-
1.390]

RISK AND INSURANCE 577
8
Proportion of
391.353
171.615
NA
NA
NA
59.170
172.770
Year
Sick
(1477.63)
(1812.26)
[-0.094]
(269.53)
(298.77)
[-0.200]
9
Prop. of
Year
NA
NA
NA
NA
NA
NA
789.276
456.984
Unemployed
(862.84)
(792.377)
[0.259]
10
Proportion of
1480.78
1610.86
NA
NA
NA
71.23
193.12
Year
Spent
(759.536)
(818.836)
[-0.282]
(250.81)
(272.327)
[-0.228]
Not
Working
11
Average
0.0632
0.0710*
NA
NA
NA
0.4476*
0.4421*
Village
(0.0393)
(0.0376)
[-0.163]
(0.1231)
(0.1345)
[-0.109]
Leisure
12
Average
1.2715*
0.0230
NA
NA
NA
-0.1242
0.3216
Village
(0.5601)
(0.5959)
[0.095]
(0.3778)
(0.4067)
[-
0.373]
Labor
13
#Household
-
41.367*
-
37.855*
-
34.669*
-
51.071*
-25.874*
-37.446*
Members
(9.7183)
(9.1363)
[-0.115]
(4.8569)
(7.2513)
[1.772]
(8.0570)
(11.2449)
[0.711]
14
#Adults
-
24.394
-
39.938*
-
58.919*
-
79.670*
-20.3641
-
34.350*
(14.0559)
(14.3454)
[0.506]
(8.5677)
(12.1923)
[1.312]
(10.948)
(16.0657)
[0.749]
15
#Children
-
60.485*
-
24.703
-
42.525*
-
64.447*
-
22.0482
-
11.3564
(15.9957)
(15.4936)
[-
1.174]
(9.8851)
(14.9319)
[1.084]
(14.064)
(18.6691)
[-0.426]
CParameter
estimates
exploiting
the
panel
aspect of
the
data
set.
The
measure of
consumption
(the
dependent
variable) is
the
sum of
the
value of all
foodstuffs,
edible
oil,
and
clothing, in
units of
1975
rupees
per
adult
equivalent
per
year.
Only
six
years
(1976-1981)
are
used.
The
estimates in
columns A,
D,
and G
(labelled
"Std.,"
for
'Standard')
come
from
the
regression
implied
by
equation
(18),
with
some
additional
independent
variable,
whose
coefficient
we
call
gw
(only
one
additional
independent
variable is
added at
any
one
time,
so
that
this
table
reports
the
results
of 3
villages x 3
estimators x 15
independent
variables).
The
estimates in
columns B,
E,
and
H(GA)
come
from
first-differenced
versions of
the
same
regression,
equation
(19). If
the
standard
and
first-differenced
estimates
differ
significantly,
then
this
may be
taken as
evidence of
measurement
error in
the
independent
variables;
the
parenthetical
number in
each
cell of
columns C, F,
and I is a t
statistic
testing
this
hypothesis.
Where
the
difference is
significant,
the
estimate
given by
equation
(20) is
given in
columns C, F,
and
I(;),
which
assumes
the
existence of
such
measurement
error
and
corresponds to a
two-instrument
version of
the
estimator
described
by
Griliches-Hausman
(1986),
an
estimator
which is
consistent
even
when
measurement
error is
present.
Standard
errors
are in
parentheses.
Estimates of
the
standard
error of g
are
not
reported;
they
are,
however,
bounded
below
by
the
estimates of
the
standard
error of
Vw-
Starred
estimates
are
significant at
the
the
95%
confidence
level.

578 ROBERT M. TOWNSEND
according to
T- 1 2;Tw Var(X) - T Var(AX)
(20) = T
2Var(X)- T Var(AX) T
where XJ=XJ- (1/T)T=1X1, and IXJ = XJ - XJ_ 1. Note that if V and Ta do not differ significantly, then this is an indication that there is no measure- ment error. We can test for equality of these two estimates by constructing a t statistic, since the difference V - a has an (asymptotically) normal distribu- tion.
The first two columns for each village in Table VIII indicate that differenced estimates from (19) are not much different from those within estimates (18). The third column provides a test of equality of these two estimates.
In contrast to the results when time series are used, it seems from Table VIII that income does matter in the determination of consumption. Still one may be surprised at the small magnitude of many of these estimates. For the all-income and crop profits variables the highest coefficient value is 0.14 over the first two estimators, and most entries are lower, with a median value of 0.05. The coefficient values on labor income and on profits from handicrafts or animal husbandry tend to be higher, with a maximum of 0.50; but again most entries are far lower, with a median value of 0.11. Note from Table VIII that there is little systematic difference across consumption categories and the sample years included. The interest rate in these villages varies from 18% to 60% (Binswanger et al. (1985)), so by standards of the permanent income model these numbers appear relatively low.
Income from labor supply and other sources may be neither statistically independent from consumption per person nor exogenous to the decision problem facing a typical household. Thus the occasional significance of income variables in the regression equations may not strike one as evidence against full insurance. If consumption and leisure are substitutes, for example, an increase in the labor supply (leading to an increase in earned income) would lead to an increase in consumption, other things equal.
As noted earlier, however, one can control for potential nonseparabilities of this sort by controlling for average leisure, assuming that no boundary con- straints on consumption or leisure are binding. Specifically, as a first approxima- tion, one need include only average leisure (or average labor) in the benchmark regressions. These are also reported in Table VIII. The leisure (or labor) variable is significant in many instances. This argues for the inclusion of leisure (or labor) as a standard variable (see below). On the other hand, with one exception, measures of sickness, unemployment, and other reasons for not working fail to be significant.
There is one set of variables which shows up consistently in the cross-sec- tional regressions, namely measures of household size. This is evident in Table

RISK AND INSURANCE 579
VIII for the variables counting all household members, and to a lesser extent for the variables counting the number of children and the number of adults. The coefficients are significantly negative. This argues for the inclusion of household size as a standard variable (see below).
Tests for measurement error in right-hand-side variables fail to turn up much of significance. There appears to be measurement error in the all-income and crop profits variables in Kanzara, consistent with the earlier discussion on apparent uniformity of technologies in this village, and error in the profits from trade and handicrafts and animal husbandry variables in Shirapur. Still, the coefficient value from equation (20) in all these instances remains low, with the exception of profits from animal husbandry in Shirapur. The wage and many of the household size and composition variables also appear to be measured with error. (The original demographic variable in (14) was also tested for measure- ment error, and it was not significant.)
One might object to entering alternative variables one at a time in these panel regressions (in contrast to the household regressions, where there are few degrees of freedom). Thus an entire set of income variables (crop profits, labor income, livestock income, income from trade and handicrafts) is entered into the benchmark regression jointly along with the household size and with average labor variables, as indicated above. This is reported in Tables IX.a and IX.b for the all-consumption and grain only variables, respectively. Statistically, for the all-consumption variable, one soundly rejects the hypothesis that incomes do not matter. Yet the estimated income coefficients are not significant at the 5% confidence level in Aurepalle and Shirapur when the measure of consumption is grain only.
By running the cross-sectional regressions for the landless and the landed households separately, one can check to see whether income terms are more likely to enter for the poor. Also, because sample average consumption is no longer the average of the dependent variable, average consumption can be included as a right-hand-side variable. Thus differential risk aversion as between "rich" and "poor" can be estimated as well. This is reported in Table X for the regressions in levels with the inclusion of the all-income variable for all 10 years. From the regressions it seems that the landless are more risk averse across all villages, strikingly so for the regressions using grain only. On the other hand, the landless seem much less well insured against income shocks than farmers in all three villages, especially Aurepalle. These results are not entirely consistent with the earlier count of households with significant income terms in the time-series regressions (Table VI).
One wonders whether the full insurance model is being confronted with a powerful alternative. Perhaps contemporary income matters less for consump- tion than past incomes. Table VII does not provide support for this hypothesis, using all 10 years of data but consumption of grain. (The first column in Table VII refers to contemporary income only but uses differences of households' incomes from the sample average income.) Again, the results are not much different from before.

580 ROBERT M. TOWNSEND
TABLE IX
a. JOINT TESTS OF THE INFLUENCE OF INCOME (ALL CONSUMPTION)a
Village: Aurepalle Shirapur Kanzara
a 111.1106 100.475 209.7624 (322.1838) (157.1196) (371.3722)
#Household - 9.3984 - 27.9994* - 25.8958 Members (16.2527) (4.2805) (15.3197)
Average Village 0.1967 NA 0.1457 Labor (0.5399) (0.1699)
Crop Profit 0.0149 0.0276 0.0687* (0.0338) (0.0244) (0.0293)
Labor Income 0.1265 0.0578 0.0861 (0.0903) (0.0483) (0.0573)
Profit from Trade 0.1664* -0.0595 -0.0411 and Handicrafts (0.0497) (0.0504) (0.1135)
Profit from Animal -0.1894* 0.2607* 0.1595* Husbandry (0.0894) (0.0544) (0.0403)
F-Prob 0.0037 0.0001 0.0086
b. JOINT TESTS OF THE INFLUENCE OF INCOME (GRAIN CONSUMPTION)b
Village: Aurepalle Shirapur Kanzara
8 - 10.2739 117.6079 - 135.1060 (188.7707) (98.2982) (290.5135)
#Household - 13.5127 - 15.0887* - 20.9397 Members (9.5226) (2.6780) (11.9841)
Average Village 0.4092 NA - 0.0262 Labor (0.3163) (0.1329)
Crop Profit (0.0145 0.0217 0.0519* (0.0198) (0.0153) (0.0232)
Labor Income 0.1122* 0.0465 0.0590 (0.0592) (0.0302) (0.0448)
Profit from Trade 0.0310 - 0.0311 - 0.0766 and Handicrafts (0.0291) (0.0315) (0.0888)
Profit from Animal 0.0571 0.0538 0.1345 Husbandry (0.0524) (0.0340) (0.0706)
F-Prob 0.1492 0.0552 0.0081
"This table reports parameter estimates exploiting the panel aspect of the data set, and adding to the regression equation (18) each of the components of income as an exogenous variable. In addition, household size and the village average labor supply are added as controls in the regressions for Aurepalle and Kanzara, and household size alone is added as a control variable for Shirapur (where average labor supply is unavailable). The row labelled "F- Prob" contains the probability that all the income components are not jointly significant (based on the associated F statistic). This table uses data for 10 years and all consumption categories.
bThis table reports parameter estimates exploiting the panel aspect of the data set, and adding to the regression equation (18) each of the components of income as an exogenous variable. In addition, household size and the village average labor supply are added as controls in the regressions for Aurepalle and Kanzara, and household size alone is added as a control variable for Shirapur (where average labor supply is unavailable). The row labelled "F- prob" contains the probability that all the income components are not jointly significant (based on the associated F statistic). This table uses consumption of grains for 10 years.

RISK AND INSURANCE 581
TABLE X
a. EFFECT OF LANDHOLDING ON INSURANCE (ALL CONSUMPTION)a
Village Land Class Village Consumption All Income
Aurepalle Landless 0.3172* 0.3553* (0.1413) (0.0762)
Farmers 1.0485* 0.0421* (0.1070) (0.0205)
Shirapur Landless 0.7882* 0.1126* (0.1048) (0.0446)
Farmers 1.0650* 0.0926* (0.0625) (0.0216)
Kanza Landless 0.9322* 0.1159* (0.1364) (0.0476)
Farmers 1.1327* 0.0901* (0.0709) (0.0182)
b. EFFECT OF LANDHOLDING ON INSURANCE (GRAIN CONSUMPTION)"
Village Land Class Village Consumption All Income
Aurepalle Landless 0.0513 0.3214* (0.1818) (0.0625)
Farmers 1.2431* 0.0009 (0.1241) (0.0170)
Shirapur Landless 0.2818 0.0569* (0.1882) (0.0247)
Farmers 1.1193* 0.0483* (0.1231) (0.0134)
Kanzara Landless 0.1114 0.0857* (0.3080) (0.0339)
Farmers 1.0947* 0.0614* (0.1480) (0.0120)
3Benchmark with all-income distinguishing landless laborers from farmers. This table uses consumption in all categories for 10 years.
bBenchmark with all-income distinguishing landless laborers from farmers. This table uses consumption of grains for 10 years.
In a related way, the aggregate consumption variable can be excluded from the cross-section regressions altogether (along with the demographic term). Coefficient values are shown in Figure 7. In Aurepalle and Shirapur the coefficient values on income reported in Figure 7 are greater than the estimates reported in Table VII. But remarkably, the coefficient values in Figure 7 stay below 0.18 or so. Including standard errors pushes the upper bound to only 0.24. Income effects, however estimated, do not seem large.
The relationship between the intercept values in the benchmark cross-sec- tional regressions and actual value of various assets is of some interest. This relationship is revealed by regressions of estimated intercept values, normalized by standard errors of the estimates, against values for bullock holdings, landholdings, wealth, and inheritance, normalized by standard devia- tions in the 10-year sample, where relevant. Table XIa for the all-consumption

582 ROBERT M. TOWNSEND
Aurepall Shirapur
.C: 2 < \<
E
o anzara C 3
4X .2- cu a=
WI ~ ~ ~ ~ ~ I
.",1
4. 0
Graphs by village FIGURE 7.Estimates from a regression of household consumption on the average of income
over the last j periods, with two SE bands.
variable reveals that operated landholdings are related in a positive way to estimated intercepts in Aurepalle and Kanzara and can explain up to 40% of the variation in the intercepts. Owned bullocks are significant in Aurepalle and Kanzara, explaining between 38% and 55% of the variation. Total wealth-a combined measure of landholdings, bullocks, and other assets-is significant in all three villages, explaining between 24% and 48% of the variation. Inheri- tance, on the other hand, is significant only in Aurepalle, explaining 52% of the variation there. Theory might have predicted the opposite: inheritance may be the best measured proxy for the wealth term in the right-hand side of the Arrow-Debreu t = 0 budget constraint and hence should be close to the intercepts. Landholdings and bullocks, on the other hand, change in value even within a generation in these ICRISAT villages; see Cain (1981) and Walker and Ryan (1990). Acquired characteristics should not be highly correlated with the estimated weights.26 Indeed, in Table XIb for grain only, none of these variables is significant. However, it seems that the intercepts are imprecisely estimated.
26 One might suppose that the movement of intercepts with acquired characteristics such as land, bullocks, and age can be explained by the fact that true talent characteristics are observed by villagers themselves but not by the econometrician. That is, a household with high talent, augmented by age and experience, might be given more land and be rewarded with high consumption. The problem with this model is that if these characteristics are observed by all the villagers initially, then consumption levels should adjust early in the life cycle, to reflect differential wealths, and should not move up with age and landholdings acquired later. If the villagers themselves do not see latent characteristics until later, then such characteristics represent shocks which might be insured ex ante. So, again, little movement in consumptions over time would result. In the end one is driven to a private information model as indicated below, with latent characteristics seen only by the individuals themselves.

TABLE XI
RELATIONSHiP BETWEEN INTERCEPTS AND WEALTH (ALL CONSUMPTION)a
Aurepalle Shirapur Kanzara
R2 R2 R2
Variable Coefficient Pr > F Coefficient Pr>F Coefficient Pr>F
Area of 75.3901* 0.3654 46.8825 0.1119 72.6061* 0.3964 Operated (17.5627) 0.0002 (23.7264) 0.0571 (16.0915) 0.0001 Landholdings
Value of 0.7888* 0.5485 0.1829 0.0140 0.4786* 0.3817 Owned Bulls (0.1265) 0.0001 (0.2755) 0.5116 (0.1094) 0.0001
Value of 0.0279* 0.5164 0.0001 0.0000 0.0091 0.0478 Inheritance (0.0048) 0.0001 (0.0102) 0.9926 (0.0073) 0.2214
Number of 7.8893 0.0206 1.0890 0.0003 15.0894 0.0634 Siblings (9.6170) 0.6730 (10.5034) 0.9181 (10.4125) 0.1573
Number of - 29.8590 0.0468 - 47.0702 0.0712 - 28.0986 0.0069 Married Sons (23.8171) 0.2190 (30.5264) 0.1332 (60.3379) 0.6447
Number of 27.3845 0.0066 - 23.6448 0.0624 -11.3360 0.0225 Migrants (59.2378) 0.6470 (16.4622) 0.1609 (13.4121) 0.4045
Total Wealth 0.0092* 0.4826 0.0113* 0.2346 0.0111* 0.3390 (0.0017) 0.0001 (0.0037) 0.0043 (0.0028) 0.0004
Age of Head of - 4.6972 0.0543 13.6948 0.0415 26.3948 0.0719 Household (12.3202) 0.4206 (14.5099) 0.5296 (17.3928) 0.3264
Age of Head 0.0223 - 0.1484 - 0.2845 squared (0.1080) (0.1454) (0.1914)
RELATIONSHiP BETWEEN INTERCEPTS AND WEALTH (GRAIN CONSUMPTION)b
Aurepalle Shirapur Kanzara
R2 R2 'R2
Variable Coefficient Pr > F Coefficient Pr> F Coefficient Pr >F
Area of 4.8373 0.0062 13.5482 0.0383 18.9751 0.1422 Operated (10.8374) 0.6583 (12.1956) 0.2752 (8.3687) 0.0305 Landholdings
Value of 0.0460 0.0077 0.0210 0.008 0.1124 0.1108 Owned Bulls (0.0925) 0.6218 (0.1370) 0.8786 (0.0572) 0.0584
Value of 0.0019 0.0100 - 0.0019 0.0049 0.0021 0.0141 Inheritance (0.0033) 0.5730 (0.0050) 0.7001 (0.0032) 0.5099
Number of 1.4773 0.0030 1.3129 0.0021 4.0788 0.0244 Siblings (4.7845) 0.7595 (5.1840) 0.8017 (4.6364) 0.3858
Number of - 17.7345 0.0679 - 23.8563 0.0750 - 4.6094 0.0010 Married Sons (11.6131) 0.1366 (15.0482) 0.1230 (26.4025) 0.8625
Number of - 13.7583 0.0069 -11.8266 0.0640 - 6.1245 0.0345 Migrants (29.2057) 0.6408 (8.1247) 0.1555 (5.8152) 0.3004
Total Wealth 0.005 0.0079 0.0036 0.1015 0.0026 0.0963 (0.0012) 0.6168 (0.0020) 0.0708 (0.0014) 0.0788
Age of Head of -3.1143 0.0364 9.8182 0.0725 12.3079 0.0914 Household (6.1321) 0.5625 (7.0502) 0.3232 (7.5080) 0.2375
Age of Head 0.0201 - 0.1035 - 0.1284 squared (0.0537) (0.0706) (0.0826)
aThis table reports coefficient estimates from regressing studentized estimates of households' intercepts from (14) on different measures of household wealth (both physical and human capital). The first column for each village reports the coefficient estimate, along with standard errors of those estimates. Asterisks denote significance at the 5% level. The second column for each village reports the R2 associated with the regression, along with the probability that a rejection of joint insignificance (based on the F statistic) is in error. For each of the first seven rows of the table, the sole right-hand variables in the regression were an intercept and the variable described at the left; for the final two rows, both the age of the head and the square of head's age were included along with an intercept. The measure of consumption is inclusive of all categories.
bThis table reports coefficient estimates from regressing studentized estimates of households' intercepts from (14) on different measures of household wealth (both physical and human capital). The first column for each village reports the coefficient estimate, along with standard errors of those estimates. Asterisks denote significance at the 5% level. The second column for each village reports the R2 associated with the regression, along with the probability that a rejection of joint insignificance (based on the F statistic) is in error. For each of the first seven rows of the table, the sole right-hand variables in the regression were an intercept and the variable described at the left; for the final two rows, both the age of the head and the square of head's age were included along with an intercept. The measure of consumption used includes grain only.

584 ROBERT M. TOWNSEND
One wonders more generally how acquired characteristics affect consumption, in particular whether there are significant shifts in the consumption distribution within the 10-year sample. To find out, the sample was divided into two separate five-year periods, and a test for the significance of changed intercepts was performed. Few households have changed intercepts: 5, 3, and 3 for Aurepalle, Shirapur, and Kanzara, respectively. Age of the household head is another characteristic which changes over time and should have no bearing on consump- tion if the theory is correct. The inclusion of age and squared age in the regressions on intercepts is not significant. One also wonders about the influ- ence of other demographic variables, specifically, number of siblings, number of daughters-in-law of the head, and number of migrants, as suggested by the work of Rosenzweig (1988). None of these variables is significant in the specification here.
7. COMPARISONS AND CONCLUSIONS
As noted, there has been an increasing amount of empirical work on the Arrow-Debreu model, much of it rejecting the complete markets hypothesis. Mace (1991) has studied individual household consumption expenditures in the U.S. with the Consumer Expenditure Survey. Under common exponential or CRRA utility functions, she derived the implication that either growth rates in household consumption or changes in levels of household consumption are determined by the associated average consumption variable. Further, the addi- tion of household income in her linear regressions should have no explanatory power. Again, this is a test for possible idiosyncratic, uninsured components, a key insight pursued by Cochrane (1991) with a cross section of families from the Panel Study of Income Dynamics.
The Mace and Cochrane results are sensitive to exactly what measure of consumption is used and what additional variables such as income are tried out on the right-hand side of their regressions. Roughly, for Mace, the hypothesis of comovement in consumption in the U.S. does not do as badly as one might have expected for some commodity groups; still, the regressions have dismal explana- tory power, and household incomes do matter. Similarly, Cochrane shows that food consumption growth rates are lower for families which have experienced extended illness or job layoffs with protracted job search; incomes also matter.
In the ICRISAT villages of southern India, sickness, unemployment, and all reasons for not working have little effect. Income, on the other hand, matters statistically. That is, full insurance is rejected in the ICRISAT data. But overall the effect of income on consumption is not large.
Mace and Cochrane do not use the time series for particular households in their studies. For Mace, the overlapping panel of the CES makes this impossi- ble; Cochrane restricts attention to divergence in growth rates for only three years in a pure cross section, though the PSID would allow time disaggregation. Also, neither Mace nor Cochrane set out to estimate fixed effects on consump-

RISK AND INSURANCE 585
tion levels across households, to see what these might be related to. Cochrane, but not Mace, controls for demographics by finding a subsample with no demographic changes. This is not possible in ICRISAT data; hence the effort here to control for demographics by incorporating demographic changes into the theory directly, using supplementary information on age, sex, and caloric weights from a dietary survey.
Independently, Abel and Kotlikoff (1988) and subsequently Altonji, Hayashi, and Kotlikoff (1992) have been exploring the implication of intergenerational altruism for consumption. They end up studying the allocation of consumption across families grouped either by age of the household head or by relation to one another as within dynastic families. For them, altruism is a way to motivate the models and to select candidate families, but it is the full risk-bearing implications for consumption which are being examined. Their conclusions are mixed. Consumption growth rates across age groups are not statistically differ- ent in the CES survey. On the other hand, the consumptions of dynastically related families in the PSID data set are influenced by their own incomes, apparently; this would not be the case if each dynasty faced a collective, dynastic budget constraint. However, Altonji, Hayashi, and Kotlikoff are for the most part imposing equality in weights across families, so that the correlations between family consumption levels and family income levels could be the source of the rejection. Indeed, when they allow differential growth rates across households, their rejection is weaker in their time-series, dynamic factor model, a model which does not impose the equality restriction.
The Altonji-Hayashi-Kotlikoff results recommend an attempt to identify relationships among households in the ICRISAT sample. It is not yet clear whether the household sample is large enough to do this, and in any event the sample was stratified by land class, not household relationships. Still, a prelimi- nary analysis of consumption by caste groups failed to turn up anything obvious.
The ICRISAT sample does allow an attempt to measure differential access to insurance by land class groups. The results here, though tentative, suggest that landless and perhaps small farmers are more vulnerable to idiosyncratic shocks. Thus mixed support is provided for the common conjecture, noted at the outset, that the poor are less connected and more vulnerable. Complementary support- ing evidence for this conjecture in the ICRISAT data is given by Morduch (1990), who uses somewhat different methods and Euler equation techniques.
Altonji, Hayashi, and Kotlikoff control for demographic changes in their work. They make only limited use of the data on wealths. But as Hayashi has suggested, a natural test of altruism 'is to see whether estimated fixed effects or Pareto weights are related to actual wealths. If they are not but the consump- tion data move in a manner consistent with full insurance, then one might conclude that something other than market forces is helping to determine the allocation of resources. As it turns out, the fixed effects in the ICRISAT villages are not closely related to the most natural wealth variable theory would suggest, namely, inheritance. And though wealth is related to landholdings and owned bullocks, these have changed within the time span of the present generation of

586 ROBERT M. TOWNSEND
the ICRISAT sample. This provides mild evidence against both altruism and complete markets.
Virtually the only study to statistically accept the hypothesis of complete markets is that of Altug and Miller (1990) with, again, the PSID data. Their tests are different from those of Mace (1991), Cochrane (1991), and Altonji, Hayashi, and Kotlikoff (1992), however, since they fit intertemporal and cross- household Euler conditions directly. Further, Altug and Miller allow for shocks to preferences and various unobserved but time-varying factors meant to cap- ture relative price effects. Unfortunately, their point estimates of risk aversion in the population are implausibly low. A nice aspect of their study is the explicit incorporation of household production and nonseparable preferences, allowing nontrivial interaction of consumption with labor supply; see also Browning and Meghir (1991).
Possibly the first person to take the consumption implications of complete markets to data was Leme (1984), who showed with graphs that aggregate consumptions across countries do not comove together. Carroll and Summers (1989) have recently amplified this point, focusing on how country consumptions track country incomes; a related literature in international economics is emerg- ing. It might thus be pointed out that the general equilibrium model with its focus on consumption offers a way to distinguish aggregate risk from idiosyn- cratic risk whatever the geographic unit under consideration. This distinction may have been unclear in the discussion thus far. If one takes the village as a natural geographic unit to study, for example, then one must distinguish shocks which are insurable at the individual, household level from shocks to the entire village which are not so insurable. Rainfall may be bad for everyone, for example, though again, there is mounting evidence that rainfall is not uniform even within the confines of the lands of an eight-square-mile village. In any event, aggregate risk at the village level still may be related to but not identical with aggregate (estimated) regional risk. The extended model thus allows villages to insure one another, though, again, whether or not they do is an empirical question.
An effort here to pool the villages of the ICRISAT sample and to test the complete markets hypothesis at the regional level failed to turn up anything decisive. Village consumptions do comove somewhat with a three-village aver- age, with the village in question excluded, though Shirapur does much better in this regard than either Aurepalle or Kanzara. Indeed, the inclusion of village income variables in 10-year time-series regressions can cause the aggregate regional consumption variable to fail to be significant. Yet the village income variables themselves often fail to be significant, unless several are included jointly, and the coefficients on these income variables are sometimes negative, i.e., have the "wrong" sign.
Efforts are under way to test for complete markets at the regional level or national level in other data sets. Rashid (1990) does this with a one-year cross section in Pakistan, judiciously using sparse data on wealths. She finds greater comovement in consumptions at the village or district level than at the provin-

RISK AND INSURANCE 587
cial level, suggesting some fragmentation in national financial markets. Surpris- ingly, the estimated transitory components of income do not influence consump- tion at all. In contrast, in some work of Deaton (1990) in the Cote d'Ivoire, marginal propensities to consume out of current income are not low even when village dummies capturing the effect of village consumption are controlled for.
It thus seems that we shall need to develop alternative models of the determination of consumption and leisure. One hopes in this regard that the anomalies which emerge from the full insurance benchmark will provide some guidance for the development of these alternative models. For example, the extent of comovement in consumption in the ICRISAT Indian data suggests that local financial markets there are good, if not perfect. This is consistent with knowledge gained from earlier studies (Walker et al. (1983) and Cain (1981)) showing that ICRISAT households absorb most fluctuations in income by credit transactions, especially in Aurepalle, and that purchases and sales of assets and grain inventories play only a limited role. Lim (1992) shuts down all insurance and smoothing opportunities other than credit markets and asks whether this particular alternative model explains the consumption data well. He concludes that there is more smoothing of consumption than could be explained by a standard credit markets model.
More generally there remains the obvious bottom line question: How do households in the ICRISAT villages manage to smooth so well? Again, credit markets and gifts seem to smooth much of the fluctuations in income, and probably smooth as well fluctuations induced by erratic timing in asset pur- chases and sales. An initial rough check on this in Aurepalle reveals that gifts and loans are not small as a fraction of the level of consumption and sometimes exceed it (in absolute value). Issues of timing and the role of assets remain to be considered, but it seems clear that the volume of activity in financial markets, at least in Aurepalle, is not small.27
There are also indications that explicit private information models of the ICRISAT Indian data might be consistent with the extent of comovement in consumption while explaining some of the anomalies. In particular, Phelan and Townsend (1991) and Phelan (1990) have shown that information-constrained efficient consumptions move with incomes but only slowly, at least when the model is calibrated against the CES U.S. data. This appears to be consistent with the positive but low coefficients measuring the impact of income on consumption in the ICRISAT data and the effect of time-varying characteristics such as landholdings on consumption. Ligon (1993) is currently carrying more explicit tests. There is evidence as well that neoclassical optimization conditions in production are violated in the ICRISAT data as in the work of Morduch
27A more detailed analysis of exactly how households manage to smooth consumption is beyond the scope of this paper. Rosenzweig and Wolpin (1993) investigate the sales and purchase of bullocks and investment in pumps and wells, numerically simulating a theoretical model with an explicit dynamic optimization problem. However, to make this tractable, they shut down all credit markets, and this is clearly at odds with the facts.
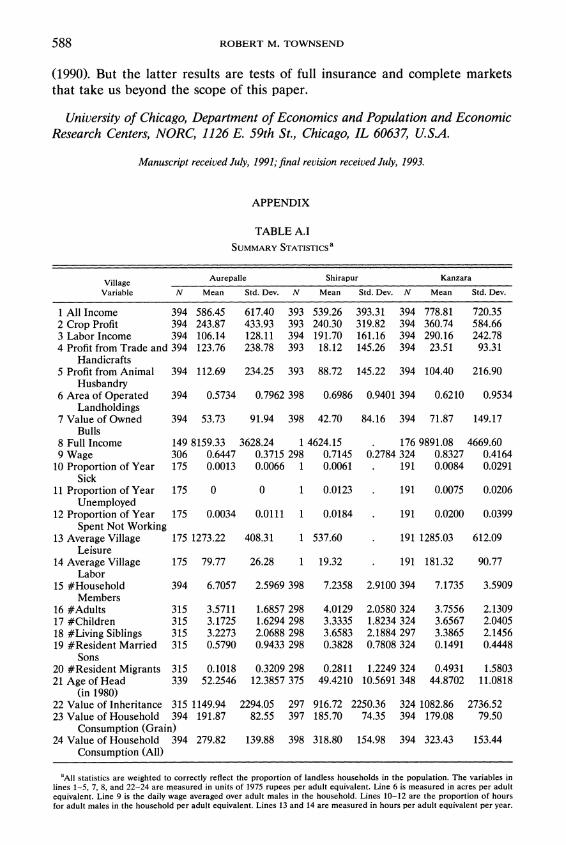
588 ROBERT M. TOWNSEND
(1990). But the latter results are tests of full insurance and complete markets that take us beyond the scope of this paper.
University of Chicago, Department of Economics and Population and Economic Research Centers, NORC, 1126 E. 59th St., Chicago, IL 60637, U.SA.
Manuscript received July, 1991; final revision received July, 1993.
APPENDIX
TAB3LE A.I
SUMMARY STATISTICS a
Village Aurepalle Shirapur Kanzara Variable N Mean Std. Dev. N Mean Std. Dev. N Mean Std. Dev.
1 All Income 394 586.45 617.40 393 539.26 393.31 394 778.81 720.35 2 Crop Profit 394 243.87 433.93 393 240.30 319.82 394 360.74 584.66 3 Labor Income 394 106.14 128.11 394 191.70 161.16 394 290.16 242.78 4 Profit from Trade and 394 123.76 238.78 393 18.12 145.26 394 23.51 93.31
Handicrafts 5 Profit from Animal 394 112.69 234.25 393 88.72 145.22 394 104.40 216.90
Husbandry 6 Area of Operated 394 0.5734 0.7962 398 0.6986 0.9401 394 0.6210 0.9534
Landholdings 7 Value of Owned 394 53.73 91.94 398 42.70 84.16 394 71.87 149.17
Bulls 8 Full Income 149 8159.33 3628.24 1 4624.15 . 176 9891.08 4669.60 9 Wage 306 0.6447 0.3715 298 0.7145 0.2784 324 0.8327 0.4164
10 Proportion of Year 175 0.0013 0.0066 1 0.0061 . 191 0.0084 0.0291 Sick
11 Proportion of Year 175 0 0 1 0.0123 . 191 0.0075 0.0206 Unemployed
12 Proportion of Year 175 0.0034 0.0111 1 0.0184 . 191 0.0200 0.0399 Spent Not Working
13 Average Village 175 1273.22 408.31 1 537.60 . 191 1285.03 612.09 Leisure
14 Average Village 175 79.77 26.28 1 19.32 . 191 181.32 90.77 Labor
15 #Household 394 6.7057 2.5969 398 7.2358 2.9100 394 7.1735 3.5909 Members
16 #Adults 315 3.5711 1.6857 298 4.0129 2.0580 324 3.7556 2.1309 17 #Children 315 3.1725 1.6294 298 3.3335 1.8234 324 3.6567 2.0405 18 #Living Siblings 315 3.2273 2.0688 298 3.6583 2.1884 297 3.3865 2.1456 19 #Resident Married 315 0.5790 0.9433 298 0.3828 0.7808 324 0.1491 0.4448
Sons 20 #Resident Migrants 315 0.1018 0.3209 298 0.2811 1.2249 324 0.4931 1.5803 21 Age of Head 339 52.2546 12.3857 375 49.4210 10.5691 348 44.8702 11.0818
(in 1980) 22 Value of Inheritance 315 1149.94 2294.05 297 916.72 2250.36 324 1082.86 2736.52 23 Value of Household 394 191.87 82.55 397 185.70 74.35 394 179.08 79.50
Consumption (Grain) 24 Value of Household 394 279.82 139.88 398 318.80 154.98 394 323.43 153.44
Consumption (All)
aAll statistics are weighted to correctly reflect the proportion of landless households in the population. The variables in lines 1-5, 7, 8, and 22-24 are measured in units of 1975 rupees per adult equivalent. Line 6 is measured in acres per adult equivalent. Line 9 is the daily wage averaged over adult males in the household. Lines 10-12 are the proportion of hours for adult males in the household per adult equivalent. Lines 13 and 14 are measured in hours per adult equivalent per year.

RISK AND INSURANCE 589
TABLE A.11
FREQUENCY OF OBSERVED CONSUMPTIONa
Village Year Rice Wheat Bajra Jowar Maize Pulses Oil Sugar Vegetable Milk Meat Clothing
Aurepalle 1975 33 3 29 27 1 21 37 37 38 36 32 33 1976 39 2 3 9 0 16 38 25 39 20 35 30 1977 39 0 0 39 0 20 39 39 39 13 34 25 1978 39 1 0 38 0 37 39 37 39 9 37 33 1979 40 27 27 39 0 40 40 40 40 20 38 33 1980 40 21 31 40 0 39 40 38 40 27 38 34 1981 40 25 37 40 1 40 40 40 40 25 38 33 1982 40 33 39 40 1 40 8 11 6 30 10 13 1983 38 31 35 37 0 39 6 0 4 25 2 23 1984 39 31 32 37 1 39 2 0 1 25 4 28
Shirapur 1975 18 37 2 32 38 36 39 39 39 39 31 34 1976 35 40 2 40 40 40 40 40 40 40 34 33 1977 39 39 7 39 30 39 39 39 39 39 32 33 1978 39 40 5 40 11 40 40 40 40 40 34 33 1979 40 40 5 40 5 40 40 40 40 40 35 33 1980 40 40 0 40 12 40 40 40 40 40 34 33 1981 40 40 1 40 27 40 40 40 40 40 34 33 1982 40 40 0 40 6 40 39 0 6 33 16 10 1983 40 39 1 40 8 40 9 2 7 31 10 11 1984 40 40 0 40 11 40 2 0 0 27 1 2
Kanzara 1975 34 38 1 32 7 35 40 40 40 40 28 36 1976 38 40 0 40 0 38 40 40 40 40 32 36 1977 38 40 1 40 0 39 40 40 40 40 30 36 1978 37 38 1 38 0 35 38 38 38 38 27 36 1979 38 38 1 38 0 38 38 38 38 38 31 36 1980 38 38 2 38 0 38 38 38 38 38 29 36 1981 40 39 8 40 1 40 40 40 40 40 28 36 1982 40 38 6 39 0 40 0 0 11 27 0 1 1983 40 38 2 40 0 40 3 0 5 24 1 14 1984 40 38 2 40 0 40 1 0 1 29 0 2
aEach cell describes the number of households for which a positive quantity of that good is observed to have been consumed.
REFERENCES
ABEL, ANDREW, AND LAURENCE KOTLIKOFF (1988): "Does the Consumption of Different Age Groups Move Together? A New Nonparametric Test of Intergenerational Altruism," manuscript.
AINSWORTH, M. (1988): "Socioeconomic Determinants of Fertility in Cote d'Ivoire," Economic Growth Center Discussion Paper No. 557, Yale University.
ALTONJI, JOSEPH, FuMIo HAYASHI, AND LAURENCE KOTLIKOFF (1992): "Is the Extended Family Altruistically Linked? Direct Tests Using Micro Data," American Economic Review, 82, 1177-1198.
ALTUG, SUMRU, AND ROBERT A. MILLER (1990): "Household Choices in Equilibrium," Economet- rica, 58, 543-570.
ANDERSON, T. W. (1984): An Introduction to Multivariate Statistical Analysis, Second Edition. New York: Wiley.
ARROW, K. (1964): "The Role of Securities in the Optimal Allocation of Risk Bearing," Review of Economic Studies, 31, 91-96.
BARRO, ROBERT (1974): "Are Government Bonds Net Wealth?" Journal of Political Economy, 82, 1065-1117.
BELL, CLIVE, T. N. SRINIVASAN, AND CHRISTOPHER UDRY (1988): "Agricultural Credit Markets in Punjab: Segmentation, Rationing and Spillover," manuscript.

590 ROBERT M. TOWNSEND
BINSWANGER, H. P., T. BALARAMAIAH, V. BASHKAR RAO, M. J. BHENDE, AND K. V. KASHIRSAGAR
(1985): "Credit Markets in Rural South India: Theoretical Issues; Empirical Analysis," World Bank Discussion Paper ARU 45.
BROWNING, M., AND C. MEGHIR (1991): "The Effects of Male and Female Labor Supply on Commodity Demands," Econometrica, 59, 925-951.
CAIN, M. (1981): "Risk and Insurance: Perspectives on Fertility and Agrarian Change in India and Bangladesh," Population and Development Review, 7, 435-474.
CARROLL, CHRIS, AND LAWRENCE SUMMERS (1989): "Consumption Growth Parallels Income Growth: Some New Evidence," manuscript.
COCHRANE, JOHN (1991): "A Simple Test of Consumption Insurance," Journal of Political Economy, 99, 957-976.
DEATON, ANGUS (1990): "On Risk, Insurance, and Intra-Village Smoothing," preliminary draft. DEBREU, GERARD (1959): Theory of Value: An Axiomatic Analysis of Economic Equilibrium. New
York: Wiley (for Cowles Foundation). DIAMOND, PETER (1967): "The Role of a Stock Market in a General Equilibrium Model with
Technological Uncertainty," American Economic Review, 57, 759-776. DVORAK, K. A. (1988): "Indigenous Soil Classification in Semi-Arid Tropical India," ICRISAT,
Economic Crop Progress Report No. 84. GAUTAM, MADHAR (1991): "Measurement Errors and Consumption Analyses: Implications of Using
Alternative Estimates from ICRISAT VLS-Data," Mimeo, World Bank. GRILICHES, Z., AND J. HAUSMAN (1986): "Errors in Variables in Panel Data," Journal of Economet-
rics, 31, 93-118. HUDA, A. K. S., R. C. SACHAN, AND S. M. VIRMANI (undated): "Spatial Variability of Rainfall and
Its Impact on Productivity of Two Soils," ICRISAT. JODHA, N. S. (1978): "Role of Credit in Farmer's Adjustment Against Risk in Arid and Semi-Arid
Tropical Areas of India," ICRISAT. KOCHAR, ANJINI (1989): "An Empirical Investigation of Rationing Constraints in Rural Credit
Markets in India," University of Chicago, manuscript. LAZEAR, E. P., AND R. T. MICHAEL (1988): Allocation of Income within the Household. Chicago:
University of Chicago Press. LEME, PAULO (1984): "Integration of International Capital Markets," manuscript, University of
Chicago. LIGON, ETHAN (1993): "Optimal Consumption Risk Sharing: Theory and Measurement in Rural
India," University of Chicago Working Paper. LIM, YOUNGJAE (1992): "Disentangling Permanent Income and Risk Sharing: A General Equilib-
rium Perspective on Credit Markets in Rural South India," University of Chicago, Dissertation. (1993): "A Note on ICRISAT Consumption Data," correspondence.
MACE, BARBARA (1991): "Consumption Volatility: Borrowing Constraints or Full Insurance," Journal of Political Economy, 99, 928-956.
MORDUCH, JONATHAN (1990): "Risk, Production, and Saving: Theory and Evidence from Indian Households," Harvard University, manuscript.
PHELAN, CHRISTOPHER (1990): "Incentives, Insurance and the Variability of Consumption and Leisure," University of Chicago Dissertation.
PHELAN, CHRISTOPHER, AND ROBERT TOWNSEND (1991): "Computing Multiperiod Information-Con- strained Optima," Review of Economic Studies, 58, 853-881.
RASHID, MANSOORA (1990): "Rural Consumption: The Evidence from Pakistan," University of Chicago Ph.D. Dissertation.
RAVALLION, M., AND S. CHAUDHURI (1992): "Tests of Risk-Sharing in Three Indian Villages," manuscript.
ROSENZWEIG, MARK (1988): "Risk, Implicit Contracts and the Family in Rural Areas of Low-In- come Countries," Economic Journal, 98, 1148-1170.
ROSENZWEIG, MARK, AND ODED STARK (1989): "Consumption-Smoothing, Migration, and Mar- riage: Evidence from Rural India," Journal of Political Economy, 97, 905-926.
ROSENZWEIG, MARK, AND KENNETH WOLPIN (1993): "Credit Market Constraints, Consumption Smoothing, and the Accumulation of Durable Production Assets in Low-Income Countries: Investments in Bullocks in India," Journal of Political Economy, 101, 223-244.
RYAN, J. G., R. D. BIDINGER, P. PUSHPAMMA, AND PAUL PRAHLAD RAO (1985): "The Determinants of Individual Diets and Nutritional Status in Six Villages of Southern India," Research Bulletin 7, ICRISAT.
RISK AND INSURANCE 591
SCHEINKMAN, JOSE (1984): "General Equilibrium Models of Economic Fluctuations: A Survey of Theory," manuscript, University of Chicago.
SHABAN, R. (1987): "Testing Between Competing Models of Sharecropping," Journal of Political Economy, 95, 893-920.
SKOUFIAS, EMMANUEL (1988): "Dynamics of Labor Demand and Supply of Rural Households: A Theoretical and Empirical Analysis," University of Minnesota Ph.D. Dissertation.
TOWNSEND, R. (1989): "Risk and Insurance in Village India," first draft February, 1989. Addendum University of Pennsylvania, May, 1990. Revised May, 1991.
(1993): The Medieval Village Economy: A Study of the Pareto Mapping and General Equilib- rium Models. Princeton: Princeton University Press.
WALKER, T. S., AND JAMES G. RYAN (1990): Village and Household Economies in India's Semi-Arid Tropics. Baltimore.: Johns Hopkins University Press.
WALKER, T. S., R. P. SINGH, M. ASOKAN, AND H. P. BINSWANGER (1983): "Fluctuation in Income in Three Villages of India's Semi-Arid Tropics," ICRISAT.
WALKER, T. S., R. P. SINGH, AND N. S. JODHA (1983): "Dimensions of Farm-Level Diversification in the Semi-Arid Tropics of Rural South Asia," Economic Progress Report 51, ICRISAT.
WILSON, ROBERT (1968): "The Theory of Syndicates," Econometrica, 36, 119-132.