risk assessment approaches - fema.gov assessment approaches part iii ... isk assessment is a process...
TRANSCRIPT
RISK
ASSESSMENT
APPROACHES
Part III
RISK
ASSESSMENT
APPROACHES
"The time has come to face the fact that this Nation can no longer afford the high costs of natural disasters. We can no longer afford the economic costs to the American taxpayer, nor can we afford the social costs to our communities and individuals."
James Lee Witt, Director, FEMA Testimony before U.S. Congress October 27, 1993

RISK ASSESSMENT APPROACHES294 RISK ASSESSMENT APPROACHES
Introduction
295
Introduction
Risk assessment is a process or application of a methodology for evaluating risk as defined by probability and
frequency of occurrence of a hazard event, exposure of people and property to the hazard, and consequences of that exposure. Different methodologies exist for assessing the risk of natural hazard events, ranging from qualitative to quantitative.
FEMA is developing a methodology that can be applied throughout the nation by local, State, and regional officials. The results will be used to plan and stimulate efforts to reduce risks from natural hazards and the technological hazards that may be triggered by natural events. Preparations for emergency response and recovery can be tailored to address the consequences of expected events. The methodology will be flexible enough to integrate the unique components of individual hazards, while at the same time be applicable to multiple hazards.
Expected benefits of a standard risk assessment methodology include: consistency of approach; more economic use of available resources; improved sharing of knowledge; more consistent and standardized measurements of performance for mitigation efforts; more consistent and standardized measurements of progress in reducing specific and multiple hazards locally, regionally, and nationally; and more effective means for setting local, regional, and national priorities.
Chapter 24 summarizes the development and applications of the risk assessment or loss estimation methodology initially developed for earthquake hazards by the National Institute of Building Sciences (NIBS) under cooperative agreement with FEMA.
For comparison purposes, other risk assessment approaches are summarized in Chapter 25. They are less quantitative and detailed and do not estimate damage or losses.

CHAPTERCHAPTER
24
HAZUS:HAZUS: STANDARD RISKSTANDARD RISK
ASSESSMENTASSESSMENT (LOSS ESTIMATION)(LOSS ESTIMATION)
METHODOLOGYMETHODOLOGY
RISK ASSESSMENT APPROACHES
Chapter Summary
298 RISK ASSESSMENT APPROACHES
Chapter Summary
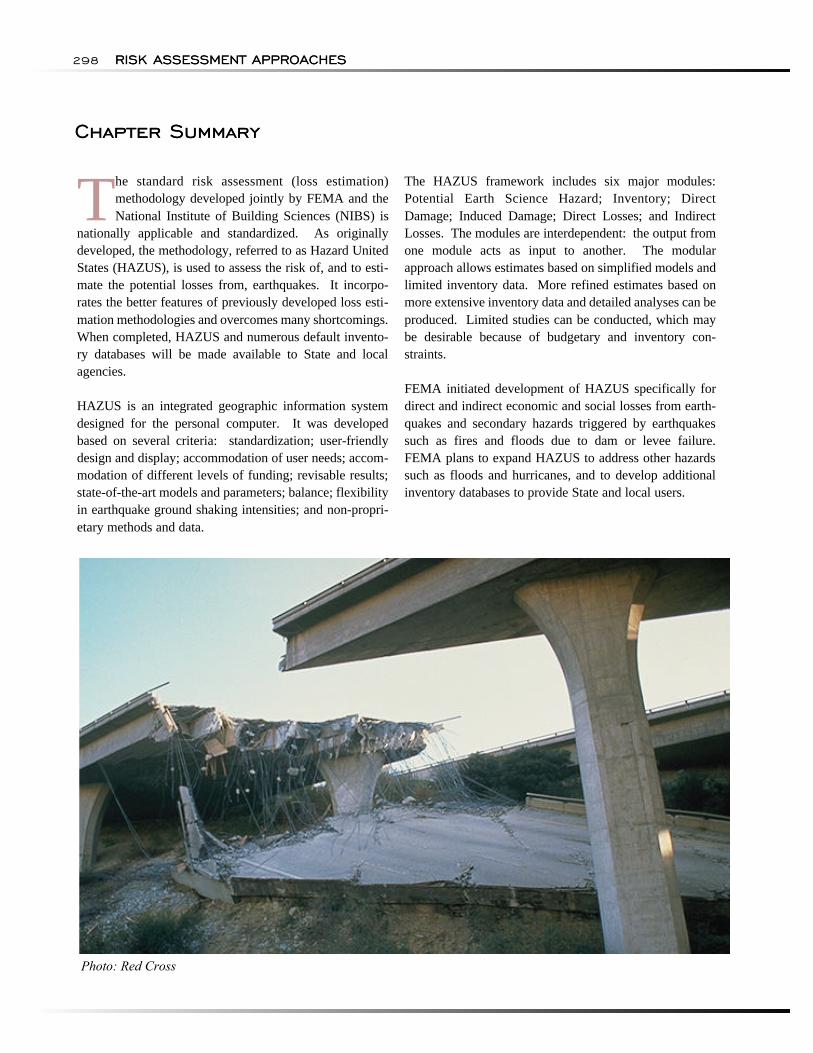
The standard risk assessment (loss estimation) methodology developed jointly by FEMA and the National Institute of Building Sciences (NIBS) is
nationally applicable and standardized. As originally developed, the methodology, referred to as Hazard United States (HAZUS), is used to assess the risk of, and to estimate the potential losses from, earthquakes. It incorporates the better features of previously developed loss estimation methodologies and overcomes many shortcomings. When completed, HAZUS and numerous default inventory databases will be made available to State and local agencies.
HAZUS is an integrated geographic information system designed for the personal computer. It was developed based on several criteria: standardization; user-friendly design and display; accommodation of user needs; accommodation of different levels of funding; revisable results; state-of-the-art models and parameters; balance; flexibility in earthquake ground shaking intensities; and non-proprietary methods and data.
The HAZUS framework includes six major modules: Potential Earth Science Hazard; Inventory; Direct Damage; Induced Damage; Direct Losses; and Indirect Losses. The modules are interdependent: the output from one module acts as input to another. The modular approach allows estimates based on simplified models and limited inventory data. More refined estimates based on more extensive inventory data and detailed analyses can be produced. Limited studies can be conducted, which may be desirable because of budgetary and inventory constraints.
FEMA initiated development of HAZUS specifically for direct and indirect economic and social losses from earth-quakes and secondary hazards triggered by earthquakes such as fires and floods due to dam or levee failure. FEMA plans to expand HAZUS to address other hazards such as floods and hurricanes, and to develop additional inventory databases to provide State and local users.
Photo: Red Cross
HAZUS: STANDARDIZED RISK ASSESSMENT (LOSS ESTIMATION) METHODOLOGYHAZUS: STANDARDIZED RISK ASSESSMENT (LOSS ESTIMATION) METHODOLOGY 299
RISK ASSESSMENT APPROACHES
BACKGROUND
OVERVIEW OF DEVELOPMENT EFFORT
Standardization.
300 RISK ASSESSMENT APPROACHES
BACKGROUND
The first task undertaken by FEMA and the National Institute of Building Sciences (NIBS) during development of HAZUS was an assessment of earthquake loss estimation methodologies (FEMA, 1994). Conducted jointly by the California Universities for Research in Earthquake Engineering and Risk Management Solutions, Inc., the assessment identified more than 1,000 individual references, from which approximately 150 studies were selected for detailed review.
The literature review revealed that, although numerous regional studies were carried out during the last two decades, potential users such as emergency response planners and local governments found them to be less useful than expected for a variety of reasons. The reasons included: the inability of a single study to meet the very different needs of users at different levels of government; the costs of collecting inventory data and per-forming studies; the stagnant nature of the results when compiled in report form; and the highly technical nature in which results were presented. In addition, final reports rarely contained documentation of the inventory used, and the output was often provided in a tabular format that provided little insight about the geographical distribution of damage and losses.
Many of the studies reviewed based loss estimates on a worst case scenario or a maximum size event. Using several scenarios of varying magnitudes and frequencies provides estimates of the range of losses and provides a better basis for preparedness and mitigation. The majority of studies reviewed used Modified Mercalli Intensity (MMI) and isoseismal maps to represent the level of potential ground motion hazards. Few researchers made an attempt to use a probabilistic description of ground motion.
Recognizing limitations of earlier studies, FEMA and NIBS incorporated into HAZUS the better features of the methodologies reviewed to overcome many short-comings. HAZUS includes all the elements of risk assessment, the important concepts of which are:
• Applicability on different levels, depending on the efforts and interests of the user and the level of data available;
• Inventory databases that can be updated easily, such as building stock, critical facilities, lifeline systems, and levees and dams;
• State-of-the-art models for relating the magnitude of an event to damage;
• State-of-the-art models for estimating the probability or frequency of occurrence of a given magnitude event; and
• GIS technology to easily display the results and to evaluate different scenarios and assumptions.
HAZUS will be made available to State and local agencies along with many baseline inventory databases to support consistent risk assessments across all States and regions. FEMA plans to enhance and extend HAZUS to address other hazards.
OVERVIEW OF DEVELOPMENT EFFORT
Development and implementation of HAZUS in a GIS-based system are being completed by a consortium of natural hazard loss experts, including earth scientists, engineers, architects, economists, emergency planners, social scientists, and software developers. Technical direction for, and review of, methodology development are provided by an eight member Project Working Group with guidance from a Project Oversight Committee. The Project Oversight Committee represents user interests in the earthquake engineering and emergency planning communities.
The Project Working Group focuses on developing a useful tool for local, State, and regional officials to estimate regional losses, to provide the basis for planning emergency response and recovery, and to stimulate efforts to mitigate risks. With input from the Project Oversight Committee, the Project Working Group established a set of criteria, described below, to accomplish the project goals.
Standardization. To enable comparisons between different regions, standard practices were defined to:
• Collect inventory data based on site-specific or U.S. Census tract aggregation;
• Classify database maps for soil types, liquefaction susceptibility, and landslide susceptibility;
• Classify occupancy classes for buildings and facilities;
• Classify building structure type; • Describe damage states for buildings and lifelines; • Develop building damage functions; • Group, rank, and analyze lifelines; • Use technical terminology; and • Provide output.
HAZUS:
User Friendly Design and Display.
Accommodation of User Needs.
Accommodation of Different Levels ofFunding.
Revisable Results.
State-of-the-Art Models and Parameters.
Balance.
Flexibility in Earthquake Ground ShakingIntensities.
Non-Proprietary
METHODOLOGY FRAMEWORK
STANDARDIZED RISK ASSESSMENT (LOSS ESTIMATION) METHODOLOGY
Data.and Methods
HAZUS: STANDARDIZED RISK ASSESSMENT (LOSS ESTIMATION) METHODOLOGY 301
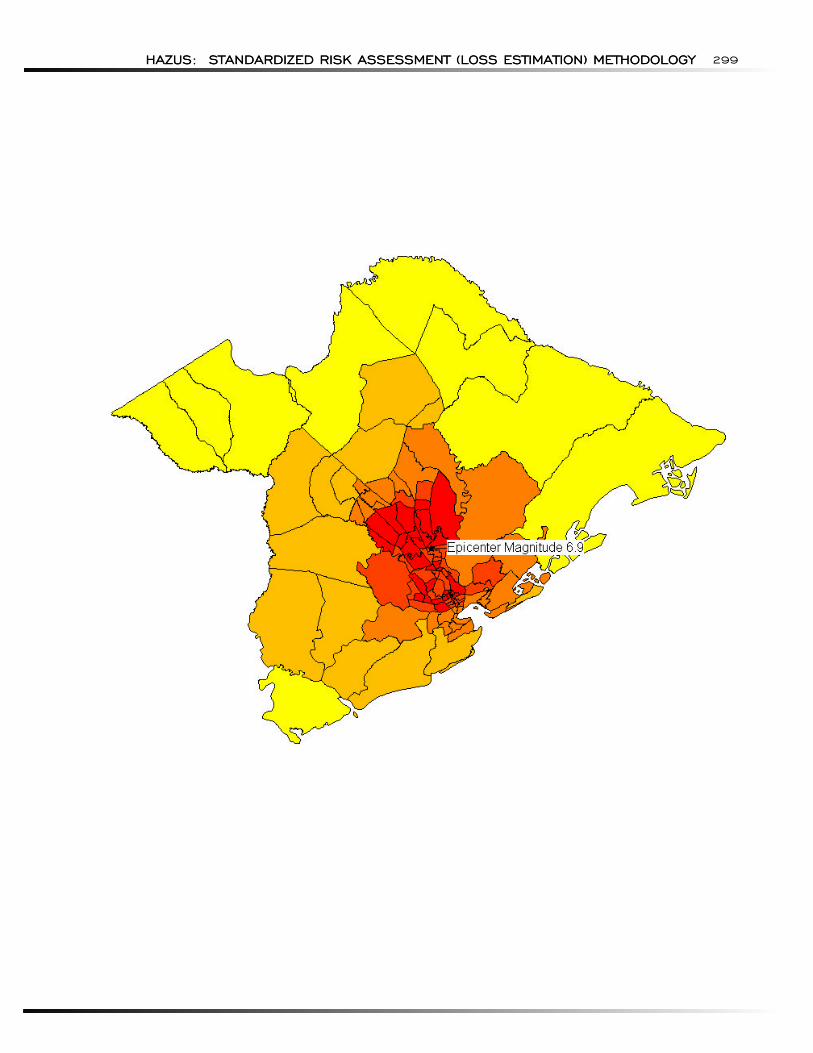
User Friendly Design and Display. HAZUS is implemented in an integrated geographic information system that can be run on a personal computer. This technology provides a powerful tool for displaying out-puts and allows users to see the geographical distribution of effects from different earthquake scenarios and assumptions.
Interactive software provides the user with a Windows-oriented environment for entering and accessing data, and allows the overlaying of input and output data on color-coded maps of the study region. Different display colors permit rapid visual identification of areas with the potential for high loss, such as areas that have both significant ground shaking and a large number of vulnerable buildings.
Accommodation of User Needs. To accommodate a wide spectrum of potential users, HAZUS consists of modules that can be activated or deactivated by the user. The needs of most users are accommodated by the flexible approach. An advantage of the GIS technology is that once the inventory database is built, it can be used for other purposes, such as planning and public works. Conversely, some useable databases may already be available in other State and local agencies, or may be available commercially.
Accommodation of Different Levels of Funding. Resources vary from region to region and among government agencies. HAZUS is flexible enough to permit different levels of detail that may be dictated by funding. The modules allow users to per-form rough estimates of damage and loss using default data that will be supplied by FEMA. More precise estimates require more extensive inventory information at additional costs to the user.
Revisable Results. Results of studies can be updated as inventory databases are improved, as the building stock or demographics of a region change, or if revised earthquake scenarios are proposed. Once the data are input, any number of scenario events can be evaluated. Databases can be updated readily and analyses can be run quickly with new information.
State-of-the-Art Models and Parameters. HAZUS incorporates state-of-the-art models and para-meters based on recent earthquake damage and loss data. The methodology can evolve readily as research progresses, prompting modification of individual modules.
Balance. HAZUS provides balance between the different components of loss estimation. For example, a precise evaluation of casualties or reconstruction costs would not be warranted if estimates of building damage are based on an inferred inventory with large uncertainty. The methodology permits users to select methods (modules) that produce varying degrees of precision.
Flexibility in Earthquake Ground Shaking Intensities. HAZUS incorporates both deterministic (specific scenario earthquakes) and probabilistic descriptions of ground shaking intensities. User-sup-plied maps of earthquake shaking intensity can be an input.
Non-Proprietary Methods and Data. HAZUS includes only non-proprietary loss estimation methods and inventory data. The GIS technology, which must be purchased and licensed from a vendor, is non-proprietary to the extent permitted by software sup-pliers. Software costs are modest and comparable to commercially available database programs.
METHODOLOGY FRAMEWORK
HAZUS is designed to be flexible, to accommodate the needs of a variety of users and applications, and to pro-vide the uniformity of a standardized approach. By framing the loss estimation methodology as a collection of modules, new modules or improvements to current models and data in existing modules, may be added without reworking the entire methodology. This approach facilitates the rapid transfer of information between the academic and research communities and the end user. The models may be modified to reflect local or regional needs or to incorporate new regional models and data.
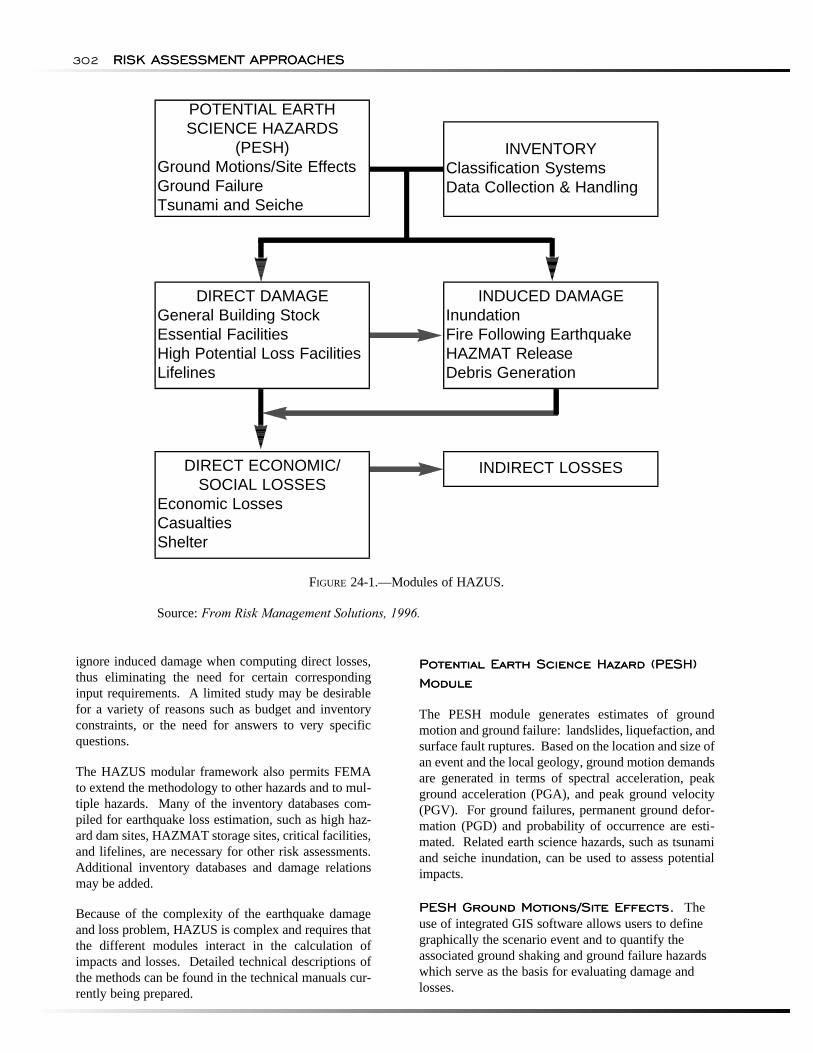
The HAZUS framework includes the following major interdependent modules (Figure 24-1):
• Potential Earth Science Hazard (PESH); • Inventory; • Direct Damage; • Induced Damage; • Direct Economic/Social Losses; and • Indirect Losses.
In general, each module is required for a comprehensive loss estimation study. However, the degree of required sophistication, and associated cost, varies greatly by user and application. It is necessary and appropriate that modules have multiple levels of detail or precision. Another advantage is that it enables users to limit studies to selected losses. For example, a user may wish to
RISK ASSESSMENT APPROACHES
Potential Earth Science Hazard (PESH)Module
PESH Ground Motions/Site Effects.
302 RISK ASSESSMENT APPROACHES
POTENTIAL EARTH SCIENCE HAZARDS
(PESH) Ground Motions/Site Effects Ground Failure Tsunami and Seiche
INVENTORY Classification Systems Data Collection & Handling
DIRECT DAMAGE General Building Stock Essential Facilities High Potential Loss Facilities Lifelines
INDUCED DAMAGE Inundation Fire Following Earthquake HAZMAT Release Debris Generation
DIRECT ECONOMIC/ SOCIAL LOSSES
Economic Losses Casualties Shelter
INDIRECT LOSSES
FIGURE 24-1.—Modules of HAZUS.
Source: From Risk Management Solutions, 1996.
ignore induced damage when computing direct losses, thus eliminating the need for certain corresponding input requirements. A limited study may be desirable for a variety of reasons such as budget and inventory constraints, or the need for answers to very specific questions.
The HAZUS modular framework also permits FEMA to extend the methodology to other hazards and to multiple hazards. Many of the inventory databases compiled for earthquake loss estimation, such as high hazard dam sites, HAZMAT storage sites, critical facilities, and lifelines, are necessary for other risk assessments. Additional inventory databases and damage relations may be added.
Because of the complexity of the earthquake damage and loss problem, HAZUS is complex and requires that the different modules interact in the calculation of impacts and losses. Detailed technical descriptions of the methods can be found in the technical manuals currently being prepared.
Potential Earth Science Hazard (PESH) Module
The PESH module generates estimates of ground motion and ground failure: landslides, liquefaction, and surface fault ruptures. Based on the location and size of an event and the local geology, ground motion demands are generated in terms of spectral acceleration, peak ground acceleration (PGA), and peak ground velocity (PGV). For ground failures, permanent ground deformation (PGD) and probability of occurrence are estimated. Related earth science hazards, such as tsunami and seiche inundation, can be used to assess potential impacts.
PESH Ground Motions/Site Effects. The use of integrated GIS software allows users to define graphically the scenario event and to quantify the associated ground shaking and ground failure hazards which serve as the basis for evaluating damage and losses.
HAZUS:
PESH Ground Failure.
PESH Tsunami and Seiche.
Inventory Module
Direct Damage Module
STANDARDIZED RISK ASSESSMENT (LOSS ESTIMATION) METHODOLOGYHAZUS: STANDARDIZED RISK ASSESSMENT (LOSS ESTIMATION) METHODOLOGY 303
The PESH module estimates site-specific ground shaking intensities and uses the values to estimate damage to buildings and lifeline inventories. Estimating the ground shaking intensities in the GIS-based program requires the three steps described below.
1. Select the scenario earthquake event. The methodology provides three approaches for characterizing an earthquake event: deterministic seismic events, probabilistic seismic hazards, or user-supplied ground shaking maps. A deterministic event is created using the supplied database of historical earth-quakes, existing seismic source maps (source maps for California are provided), or a hypothetical event customized by the user.
Users can generate annualized estimates of damage and loss based on the probabilistic spectral response contour maps developed by USGS for the NEHRP Provisions and other studies. Frequency-based hazard curves are created for the region and damage/losses are evaluated for eight discrete levels of shaking intensity.
Users can replicate a scenario event by supplying a digitized map representing ground motion or shaking, intensities that occurred from, or are predicted to occur from, earthquakes. This option was created to allow users to develop scenarios that could not be adequately described by a theoretical attenuation relationship or to replicate a well-recorded past event.
2. Determine the input ground motion levels for the baseline site-soil conditions using attenuation relationships. The methodology provides five attenuation relationships (three for use in the Western United States, one for use in the Eastern States, and one for subduction events) to explicitly determine the spectral response for eight specific periods (0.5 second, 1.0 second, etc.) and peak ground shaking (PGA and PGV). Site-specific response spectra are generated by connecting the demands (shaking) at the eight discrete spectral periods.
3. Overlay high resolution geologic information and modify ground motion demands using site amplification factors based on local site conditions. To account for site effects, a user-supplied map of high-resolution geologic data may be overlaid on the baseline shaking demands to modify ground motion demands. If a user-supplied map does not exist, the model defaults to the soil information provided with the methodology.
PESH Ground Failure. Ground deformations due to liquefaction, landslides, and surface fault ruptures are quantified and the damage to buildings and lifelines is adjusted to account for the associated ground failures. Each type of ground failure is quantified in terms of median permanent ground deformation (PGD) and probability of occurrence. Using GIS, susceptibility maps and ground motion contour maps are evaluated to determine landslide and liquefaction consequences. The expected deformation is computed for surface fault rupture as a function of a scenario event, but not for probabilistic and user-supplied events. Users have the option to assume that all or part of a fault rupture does not extend to the surface, thus limiting the effects of displacements.
PESH Tsunami and Seiche. Damage, fatalities, and fires from inundation due to tsunami or seiche can be significant. Although a tsunami wave can be almost undetectable in the open ocean, it can grow to great heights when it reaches land. Seiches are waves in a lake or reservoir that are induced because of ground shaking. If the waves are large, facilities along the lake shore can be damaged or dams can be overtopped. Since models available for estimation of losses from these hazards are not well established, PESH is limited to assessment of inundation potential unless an expert analysis is involved.
Inventory Module
Development and collection of inventory data are the most time consuming and costly aspects of performing a loss estimation study, and are often a limiting factor in the development of a comprehensive study. Because many potential users have limited budgets, HAZUS is designed to accommodate different levels of resources.
An extensive amount of data is provided in the Inventory Module: buildings, essential facilities, life-lines, population, and economic conditions. Default data are supplied to assist users who may not have the resources to develop detailed inventory data specific to a community, region, or State. However, the default data are limited for certain areas, especially utility life-lines, and should be augmented or superseded by improved information whenever possible. Uncertainty will be associated with the resulting estimates.
Direct Damage Module
This module provides damage estimates for four distinct groups: general building stock; essential facilities; high potential loss facilities; and lifelines (transporta-
RISK ASSESSMENT APPROACHES
Direct Damage - Buildings.
304 RISK ASSESSMENT APPROACHES
tion and utility systems). The groups are defined to address distinct inventory and modeling characteristics. Estimates are presented in the form of probabilities of being in a specific damage state given a specified level of ground motion and ground failure. Estimates of damage also include loss of function by facilities and lifelines, and the anticipated service outages for potable water and electric power.
Direct Damage - Buildings. In earlier loss estimation methodologies, the extent and severity of building damage typically were evaluated for generic groups of buildings using expert opinion and non-engineering parameters. In HAZUS, inelastic building capacity and site-specific response spectra are used to describe dam-age sustained by both structural and nonstructural components. A simple and practical procedure is used to estimate the inelastic seismic response of buildings, and it can be applied by the engineering community for specific structures, as well as for generalized groups of structures.
The predicted building response, in terms of PGD or PGA, is used to create fragility curves, which in turn are used to obtain probabilistic estimates of the extent and severity of damage. Damage estimates are expressed in terms of the probability that the building will be in one of five damage states: none, slight, moderate, extensive, complete. Although damage varies from none to complete as a continuous function of building response, it is impractical to describe a continuous function and discrete states are used for ease of description. For some cases, structural damage may not be directly observable if structural elements are hidden behind architectural finishes or fireproofing. Hence, the structural damage states often are described with reference to certain effects on nonstructural elements, which may be indicative of the structural damage state.
To adequately service all the needs of the methodology, the damage state definitions are descriptive and the user must glean the nature and extent of the physical damage to a building type from the damage prediction output. Life-safety, societal, and financial losses that result from the damage can be estimated.
Because damage to nonstructural building components such as architectural elements and mechanical/electrical systems affect losses differently than damage to structural components (i.e., gravity and lateral load resisting systems), HAZUS separately estimates structural and nonstructural damage. Damage to nonstructural components is considered to be independent of the building type, and descriptions of damage states are developed for common nonstructural systems rather than for building types. Whether part of a steel-frame building or
concrete shear-wall building, such components as partitions, ceilings, and cladding are assumed to incur the same degree of damage when subjected to the same interstory drift or floor acceleration.
Damage to certain nonstructural components such as full-height drywall partitions, is primarily a function of interstory drift. For other components such as mechanical equipment, damage is a function of floor acceleration. Developing fragility curves for each possible non-structural component is not practicable. Therefore, nonstructural components are grouped into drift-sensitive and acceleration-sensitive components.
The generalized method for predicting damage to buildings provides a mechanism to account for variations in structural characteristics and local soil conditions. The Direct Damage Module uses a five-step process to determine the damage state probability for a particular structure or class of structures at a given site.
1. The nonlinear building capacity incremental "pushover" curve of a building is computed based on its structural characteristics;
2. The site-specific elastic response spectra generated by the ground motion model are modified to account for the effects of both increased damping at higher response levels and durations;
3. The modified site-specific response spectra are overlaid on the nonlinear building capacity curve. The intersection point defines the expected building response (both roof displacement and acceleration);
4. For the expected building response, structural and nonstructural fragility curves are evaluated to determine damage state probabilities; and
5. The damage state probabilities are modified to account for site-specific probable ground deformations estimated by the ground failure model.
For both general building stock and essential facilities, damage state probabilities are determined for each facility or structural class. Then, based on the level of structural and nonstructural damage, the buildings are estimated to be fully functional, partially functional, or nonfunctional (closed). The output of the functionality models is a loss-of-function estimate expressed as a percent of capacity and an estimated time to recover to full capacity.
HAZUS:
Direct Damage - Lifelines.
Induced Damage Module
Induced Damage - Inundation.
Induced Earthquake.
STANDARDIZED RISK ASSESSMENT (LOSS ESTIMATION) METHODOLOGY
FollowingFire - Damage
HAZUS: STANDARDIZED RISK ASSESSMENT (LOSS ESTIMATION) METHODOLOGY 305
Damage and loss of function are key issues with respect to essential facilities, especially those involved with emergency response. Emergency facilities are treated as special structures that may or may not be designed to higher standards than the general building stock. The user can modify the performance of an essential facility to reflect the design and construction quality standards under which the facility was built.
Direct Damage - Lifelines. The amount of dam-age and restoration time are estimated for 13 transportation and utility systems. Fragility curves for life-line system subcomponents such as airport fuel facilities, highway bridges, and water treatment plants, are combined using fault tree logic to develop an overall fragility curve for the lifeline component. Based on fragility curves, a method for assessing functionality of each component was developed.
The performance of the key components and simplified rules relating performance to damage, damage state probabilities for lifeline components. Damage states are qualified descriptions of damage that portray various levels of damage, such as shattered windows, broken pipes, and cracked drywall. Estimates of loss of function and time to restore are calculated for a given event.
Evaluation of direct damage to lifeline systems requires an understanding of the interactions between components and the potential for alternatives when certain components fail. The lifeline model provides estimates of service outages for electric power and potable water systems with limited input from lifeline operators.
Induced Damage Module
When estimates of direct damage are available, induced damage can be evaluated. Induced damage is defined as the consequences of a natural hazard event, other than damage due to the primary hazard, that lead to losses. This module includes inundation due to dam or levee failure, fire following earthquake, HAZMAT release, and debris generation.
Induced Damage - Inundation. The National Inventory of Dams database is used as default information. Dams are ranked according to their hazard potential and users can query the database to prioritize the impact potential for dams in a particular region.
Development of a dam failure inundation map typically requires the assistance of a technical expert. However, HAZUS users may use existing inundation maps which
are available for many high hazard dams. HAZUS imports and overlays inundation maps with population and building inventory information to estimate expo-sure to potential inundation due to dam failure.
A recognized drawback to using existing dam-break inundation maps is that they may have been developed for different scenarios. The U.S. Bureau of Reclamation (USBR) developed a simplified approach to estimate peak discharge downstream of a dam considering the depth of water behind the dam and the con-figuration of the watercourse. This approach is included in the HAZUS technical manual.
Induced Damage - Fire Following Earthquake. Fires triggered by earthquakes can be a major problem that is well documented in historical events. The recent earthquake in Kobe, Japan, rein-forced awareness of the potential threat. Estimation of the impacts from fires is an extremely complex problem.
HAZUS uses Monte Carlo simulation techniques to assess potential impacts. The model is separated into three major elements, described below.
1. Fire ignition is a function of the severity of the shaking, the type and age of construction, and the anchoring of equipment within structures. Based on empirical information from previous earth-quakes, the number of fire ignitions is estimated from the size and type of inventory subjected to different levels of ground motion.
2. Fire spread is a function of the density of construction, the presence of wind, and the presence of fire breaks and low fuel areas such as parks, cemeteries, golf courses, wide streets, and lakes.
3. Fire suppression is a function of available fire fighting capabilities. If water service is interrupted or transportation systems are damaged, the response of fire suppression personnel is hindered.
The spread and suppression models use the damage and loss-of-function outputs of the essential facilities and lifeline modules to determine the response capabilities and effectiveness of fire suppression personnel. Thus, information about the number and location of strike teams, the average width of streets, the condition of life-line systems, and the speed and direction of the wind is required to perform a fire-following-earthquake analysis. The combination of ignition, spread, and suppression determines a fire spread area and estimates the number of serious ignitions. Based on the fire spread area, the methodology determines the population and
RISK ASSESSMENT APPROACHES
Induced Damage - HAZMAT Release.
Induced Damage - Debris Generation.
Direct Economic/Social LossesModule
Direct Losses - Economic Losses.
Direct Losses - Casualties.
306 RISK ASSESSMENT APPROACHES
value of building stock exposed.
Induced Damage - HAZMAT Release. HAZUS is restricted to considering only regional incidents such as large toxic releases, fires, or explosions, the consequences of which could lead to a significant demand on health care and emergency response facilities. Therefore, the supplied database (USEPA Tri-Services Database) includes those chemicals that are considered highly toxic, flammable, or highly explosive, and is limited to those facilities where large quantities are stored.
Before this module was developed, an exhaustive search was made of existing literature for models that could be used to predict the likelihood of occurrence of HAZMAT releases during earthquakes (Tierney and others, 1990; Ravindra, 1992; Los Angeles County Fire Department, 1992). The identified models require significant expert input, including a walk-through inspection. Furthermore, such efforts typically are aimed at large complexes such as petrochemical facilities, and are not suitable for more general applications.
Because of the limitations of state-of-the-art HAZMAT release models, the Induced Damage-HAZMAT Release module is restricted to establishing a standardized method for classifying materials and developing a default database that can be used by local planners to identify those facilities that may be most likely to have significant releases in future earthquakes. A more general model that can be used by emergency preparedness officials at the local level is needed to allow determination of the potential for HAZMAT releases.
Induced Damage - Debris Generation. Limited research has been done in the area of estimating debris from earthquakes. Some of the early regional loss estimation studies (Algermissen and others, 1973; Rogers and others, 1976) included simplified models for estimating the amount of debris from unreinforced masonry structures. HAZUS adopts a similar empirical approach to two types of debris: debris that falls in large pieces, such as steel members or reinforced concrete elements that require special treatment to break into smaller pieces before hauling away; and debris that is smaller and more easily moved with bulldozers, including brick, wood, glass, building contents, and other materials.
HAZUS uses an approach where, for given damage states for structural and nonstructural components, debris estimates are based on: the results from the Direct Damage Module; tables that quantify debris generated from different structural and nonstructural building damage states; and the typical weights of structural and nonstructural elements. Aggregated estimates of
generated debris are presented in terms of type (brick versus reinforced concrete and steel) and origin (structural versus nonstructural components).
Direct Economic/Social Losses Module
Both direct and induced damage can lead to direct economic or social losses. The Direct Economic/Social Losses Module evaluates two types of direct loss: the cost of repair and replacement of structures and lifeline systems, including structural and nonstructural damage and losses to contents and business inventory; and the consequence of building or lifeline loss-of-function, such as costs of relocation, income loss, and rental loss. Social losses are quantified in terms of casualties, injuries, displaced households, and short-term shelter needs.
Direct Losses - Economic Losses. Direct economic losses include the cost of repair or replacement of damaged structures. Structural and nonstructural damage, relocation costs, loss of business inventory, income losses, and rental losses also are direct economic losses. Relocation costs, income losses, and rental losses occur as a consequence of how long a business is inoperable, which is a function of the level of damage and the type of structure or facility.
Information from the Direct Damage Module is combined with regional economic data to compute direct economic losses. Examples of economic data used include the per square foot cost of construction by occupancy type, average per square foot rental rates, and gross sales. HAZUS accounts for regional variations in construction costs. Direct economic losses can be mapped or queried by census tract, by loss type, or by general/specific occupancy type.
Direct Losses - Casualties. HAZUS estimates earthquake-related casualties that are caused by building and bridge collapses, occupant entrapments, building and bridge damage, and nonstructural damage. A modifier is used to account for casualties that occur out-side of buildings, such as debris falling on pedestrians.
HAZUS combines the output from the Direct Damage Module with building inventory and population data to quantify casualty estimates. Daily migration patterns and associated casualties are estimated for three representative times of day: 2:00 p.m. (office hours); 5:00 p.m. (commute time); and 2:00 a.m. (night).
HAZUS:
Direct
Indirect Losses Module
CONCLUSION
BIBLIOGRAPHY AND REFERENCES
STANDARDIZED RISK ASSESSMENT (LOSS ESTIMATION) METHODOLOGY
Needs.Shelter - Losses
HAZUS: STANDARDIZED RISK ASSESSMENT (LOSS ESTIMATION) METHODOLOGY 307
Daily migration patterns are based on census data, land-use data, occupancy type, available inventory information, and transportation planning origin-destination data. For example, the model estimates the number of employees working at 2:00 p.m. in a retail commercial environment in a steel frame building. Combining these estimates with damage estimates from the Direct Damage Module yields the number and type of casual-ties resulting from building and bridge collapse or dam-age.
The output of the Direct Losses-Casualties Module contains estimates of four types of casualties by general occupancy and time, which are aggregated by U.S. Census tract. The casualty types range from "Stage 1: first aid level injuries not requiring hospitalization" to "Stage 4: instantaneously killed or mortally injured."
Users can display maps or tables of casualty estimates, which can be used to estimate the amount and type of medical attention that may be required. By combining casualty information with loss-of-function estimates for hospitals, alternate plans may be prepared for treatment of victims outside of an affected area.
Direct Losses - Shelter Needs. Homelessness caused by residential building damage results in two general shelter needs: short-term needs (up to 2 weeks) for which public shelters are provided by the American Red Cross and others; and long-term needs which are accommodated by leased housing units, importing mobile units, and constructing new public or private housing. Long-term needs are caused by extended or complete loss of housing units. Estimation of shelter needs is driven by damage information for residential units and the demographics of a region
HAZUS combines damage to residential building stock with utility service outage relationships to estimate the number of households that may be uninhabitable. The loss-of-function to utilities can drastically change the short-term shelter needs in severe climates. The uninhabitable household estimates are combined with demo-graphic data to quantify the number and composition of the population that may require short-term sheltering. Currently, HAZUS does not estimate shelter needs associated with induced damage.
Indirect Losses Module
Long-term effects on regional economy due to earth-quakes are evaluated by the Indirect Losses Module. Examples of indirect economic losses include increased unemployment rates, loss of tax revenue, loss of production, reduction in demand for products, and reduction in spending. Essentially, indirect economic losses
are a consequence of direct economic effects, major interruption to lifelines, length of time to relocate, repair and rebuild, aid that flows into a region, and the ability of a region to adjust to changes in demand and supply. To estimate indirect economic losses, HAZUS users must supply social and economic information about a region, such as population, employment base, and nature of business activities.
HAZUS estimates indirect economic losses by multiplying output from the Direct Economic Loss Module with input-output multipliers. Multipliers, based on estimates for 80 U.S. counties, are provided as defaults for a given set of industrial sectors. Economic and social information provided by users is used to determine the appropriate multipliers for a particular region and industrial sector. For example, a multiplier of two for tourism would indicate that, for every dollar of tourist revenue lost, there will be an additional dollar of lost income to those in the tourist industry.
Outputs of the indirect economic module include income change, value added change, tax revenue change, and employment change by industrial sector aggregated on a county basis.
CONCLUSION
The HAZUS risk assessment (loss estimation) methodology was specifically developed to estimate losses from earthquakes and other hazards that are induced by earthquakes. Because of the modular nature of the methodology, FEMA plans to expand its use to other hazards and may provide loss algorithms and additional inventory databases in the future.
BIBLIOGRAPHY AND REFERENCES
Algermissen, S.T., M. Hopper, K. Campbell, W.A. Rinehart, D. Perkins, K.V. Steinbrugge, H.J. Lagorio, D.F. Moran, F.S. Cluff, H.J. Degenkolb, C.M. Duke, G.O. Gates, N.N. Jacobson, R.A. Olson, and C.R. Allen. 1973. A Study of Earthquake Losses in the Los Angeles, California Area. Washington, DC: National Oceanic and Atmospheric Administration.
Federal Emergency Management Agency. 1994. Assessment of the State of the Art Earthquake Loss Estimation Methodologies, Earthquake Hazards Reduction Series 70. FEMA 249. Washington, DC: National Institute of Building Sciences.
Los Angeles County Fire Department, Hazardous Materials Section, RMPP Unit. 1992. Seismic Assessment Guidelines for RMPP Studies. Los Angeles, CA: Los Angeles Fire Department.
RISK ASSESSMENT APPROACHES308 RISK ASSESSMENT APPROACHES
Ravindra, M. 1992. "Seismic Assessment of Chemical Facilities under California Risk Management and Prevention Program." Proceedings, International Conference on Hazard Identification and Risk Analysis, Human Factors and Human Reliability in Process Safety. American Institute of Chemical Engineers, Center for Chemical Process Safety.
Risk Management Solutions, Inc. 1996. Development of a Standardized Earthquake Loss Estimation Methodology. Draft Technical Manual, Vil. I. Prepared for FEMA and the National Institute of Building Sciences. Menlo Park, CA.
Rogers, A.M., S.T. Algermissen, W.W. Hays, D.M. Perkins, D.O. Van Strien, H.C. Hughes, R.C. Hughes, H.J. Lagorio, and K.V. Steinbrugge. 1976. A Study of Earthquake Losses in the Salt Lake City, Utah Area. USGS Open-File Report 76-89. Washington, DC: U. S. Geological Survey.
Tierney, K.J., H.A. Seligson, and R.T. Eguchi. 1990. Chemical Hazards, Mitigation, and Preparedness in Areas of High Seismic Risk: A Methodology for Estimating the Risk of Post-Earthquake Hazardous Materials Releases. National Science Foundation and National Center for Earthquake Engineering Research.

HAZUS: STANDARDIZED RISK ASSESSMENT (LOSS ESTIMATION) METHODOLOGYHAZUS: STANDARDIZED RISK ASSESSMENT (LOSS ESTIMATION) METHODOLOGY 309

CHAPTERCHAPTER
25
OTHER RISKOTHER RISK ASSESSMENTASSESSMENT APPROACHESAPPROACHES
RISK ASSESSMENT APPROACHES
Chapter Summary
312 RISK ASSESSMENT APPROACHES
Chapter Summary
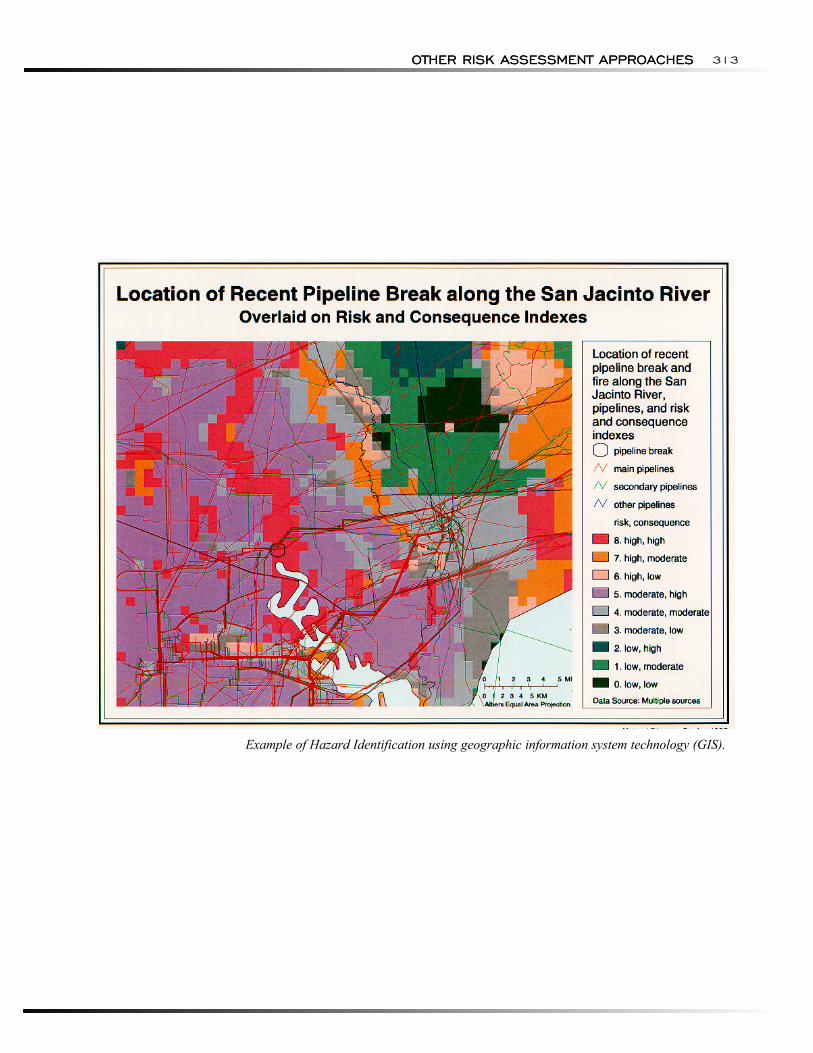
Risk assessment methodologies that estimate actual losses are vital tools for emergency managers and hazard mitigation specialists. There are other
approaches that provide important information on the nature and level of risk in a given region but that do not yield loss estimates. This chapter presents five such approaches to risk assessment:
• Risk Matrix Approach to anticipate losses and to evaluate potential impacts;
• Composite Exposure Indicator based on public expo-sure to natural hazards using a principal components analysis of 14 demographic indicator variables;
• Multiple Coastal Hazard using quantitative and qualitative risk assessments associated with seven coastal factors;
• Coastal Vulnerability Index based on a complex set of coastal factors to identify the risk from permanent and episodic sea level rise; and
• Multiple Hazard (Seismic-Hydrologic) Approaches, focusing on land-use planning and understanding the multiple-hazard impact of a local Cascadia Subduction Zone earthquake and associated tsunami, ground failure, fault rupture, liquefaction, and landslides.
OTHER RISK ASSESSMENT APPROACHESOTHER RISK ASSESSMENT APPROACHES 313
Example of Hazard Identification using geographic information system technology (GIS).
RISK ASSESSMENT APPROACHESRISK ASSESSMENT APPROACHES314
RISK MATRIX APPROACHRISK MATRIX APPROACH
The practice of risk management permits decision-mak-ers to anticipate losses and to evaluate potential impactsto facilitate effective planning and management. requires recognition of risks, evaluation of the frequen-cy of those events and the related magnitude of conse-quences or potential losses, and determination of appro-priate measures for prevention or reduction of theserisks from a cost/benefit point of view (Long and John,1993).
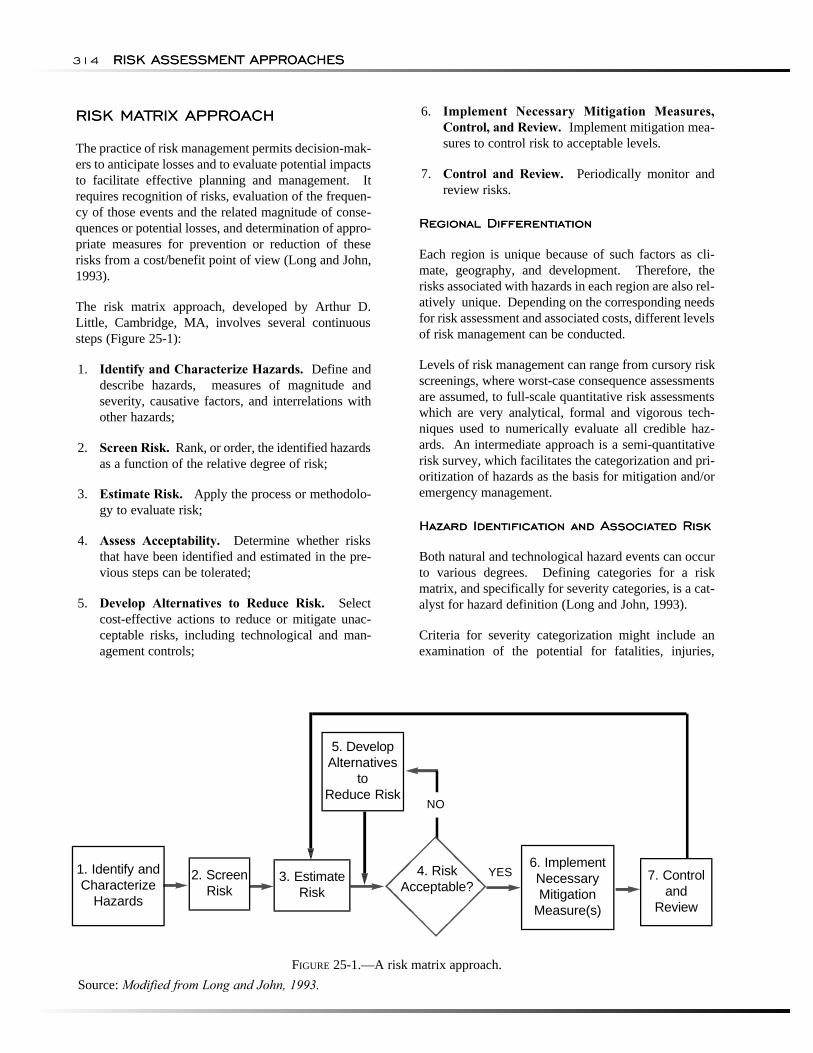
The risk matrix approach, developed by Arthur D.Little, Cambridge, MA, involves several continuoussteps (Figure 25-1):
1. Identify and Characterize Hazards. Define anddescribe hazards, severity, causative factors, and interrelations withother hazards;
2. Screen Risk. Rank, or order, the identified hazardsas a function of the relative degree of risk;
3. Estimate Risk. Apply the process or methodolo-gy to evaluate risk;
4. Assess Acceptability. Determine whether risksthat have been identified and estimated in the pre-vious steps can be tolerated;
5. Develop Alternatives to Reduce Risk. Selectcost-effective actions to reduce or mitigate unac-ceptable risks, including technological and man-agement controls;
6. Implement Necessary Mitigation Measures,Control, and Review. Implement mitigation mea-sures to control risk to acceptable levels.
7. Control and Review. Periodically monitor andreview risks.
Regional DifferentiationRegional Differentiation
Each region is unique because of such factors as cli-mate, geography, and development. risks associated with hazards in each region are also rel-atively for risk assessment and associated costs, different levelsof risk management can be conducted.
Levels of risk management can range from cursory riskscreenings, where worst-case consequence assessmentsare assumed, to full-scale quantitative risk assessmentswhich are very analytical, formal and vigorous tech-niques used to numerically evaluate all credible haz-ards. risk survey, which facilitates the categorization and pri-oritization of hazards as the basis for mitigation and/oremergency management.
Hazard Identification and Associated RiskHazard Identification and Associated Risk
Both natural and technological hazard events can occurto various degrees. matrix, and specifically for severity categories, is a cat-alyst for hazard definition (Long and John, 1993).
Criteria for severity categorization might include anexamination of the potential for fatalities, injuries,
FIGURE 25-1.—A risk matrix approach.
1. Identify andCharacterize
Hazards
5. DevelopAlternatives
toReduce Risk
2. Screen Risk
6. ImplementNecessaryMitigation
Measure(s)
3. EstimateRisk
4. RiskAcceptable?
7. Controland
Review
NO
YES
Source: Modified from Long and John, 1993.
It
measures of magnitude and
Therefore, the
Depending on the corresponding needsunique.
An intermediate approach is a semi-quantitative
Defining categories for a risk
OTHER RISK ASSESSMENT APPROACHESOTHER RISK ASSESSMENT APPROACHES 315
Minor Serious Extensive Catastrophic
High
Moderate
Low
Very Low
Frequency
Severity
C B A A
C B B A
D C B B
D D C C
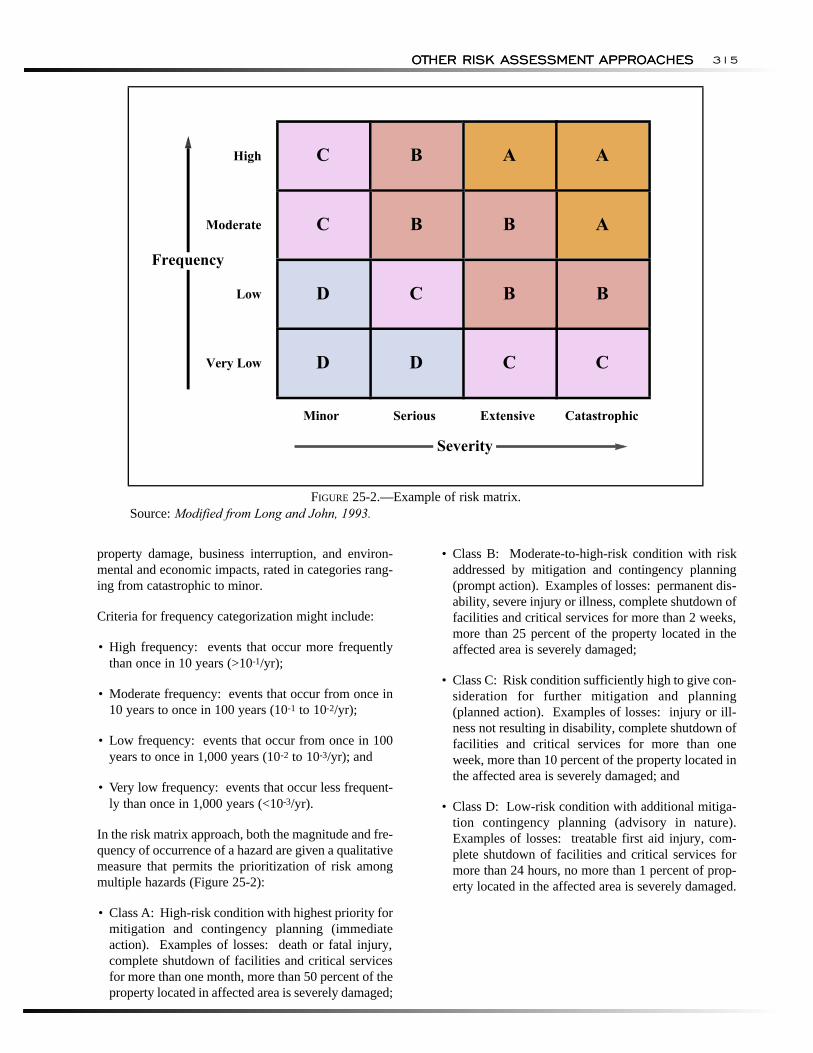
FIGURE 25-2.—Example of risk matrix. Source: Modified from Long and John, 1993.
property damage, business interruption, and environmental and economic impacts, rated in categories ranging from catastrophic to minor.
Criteria for frequency categorization might include:
• High frequency: events that occur more frequently than once in 10 years (>10-1/yr);
• Moderate frequency: events that occur from once in 10 years to once in 100 years (10-1 to 10-2/yr);
• Low frequency: events that occur from once in 100 years to once in 1,000 years (10-2 to 10-3/yr); and
• Very low frequency: events that occur less frequently than once in 1,000 years (<10-3/yr).
In the risk matrix approach, both the magnitude and frequency of occurrence of a hazard are given a qualitative measure that permits the prioritization of risk among multiple hazards (Figure 25-2):
• Class A: High-risk condition with highest priority for mitigation and contingency planning (immediate action). Examples of losses: death or fatal injury, complete shutdown of facilities and critical services for more than one month, more than 50 percent of the property located in affected area is severely damaged;
• Class B: Moderate-to-high-risk condition with risk addressed by mitigation and contingency planning (prompt action). Examples of losses: permanent disability, severe injury or illness, complete shutdown of facilities and critical services for more than 2 weeks, more than 25 percent of the property located in the affected area is severely damaged;
• Class C: Risk condition sufficiently high to give consideration for further mitigation and planning (planned action). Examples of losses: injury or illness not resulting in disability, complete shutdown of facilities and critical services for more than one week, more than 10 percent of the property located in the affected area is severely damaged; and
• Class D: Low-risk condition with additional mitigation contingency planning (advisory in nature). Examples of losses: treatable first aid injury, complete shutdown of facilities and critical services for more than 24 hours, no more than 1 percent of property located in the affected area is severely damaged.
RISK ASSESSMENT APPROACHES
COMPOSITE EXPOSURE INDICATORAPPROACH
316 RISK ASSESSMENT APPROACHES
COMPOSITE EXPOSURE INDICATOR APPROACH
Another approach to assess the risk from a given hazard based on several indicator variables is the composite exposure indicator (CEI) method (Thomas and others, 1996). The output of this approach is a ranking of the potential for losses in a given region or area for single or multiple hazards. Actual losses are not estimated because the approach does not include a relationship between exposure and losses, and economic data are not used. The approach could be extended to provide estimates of losses.
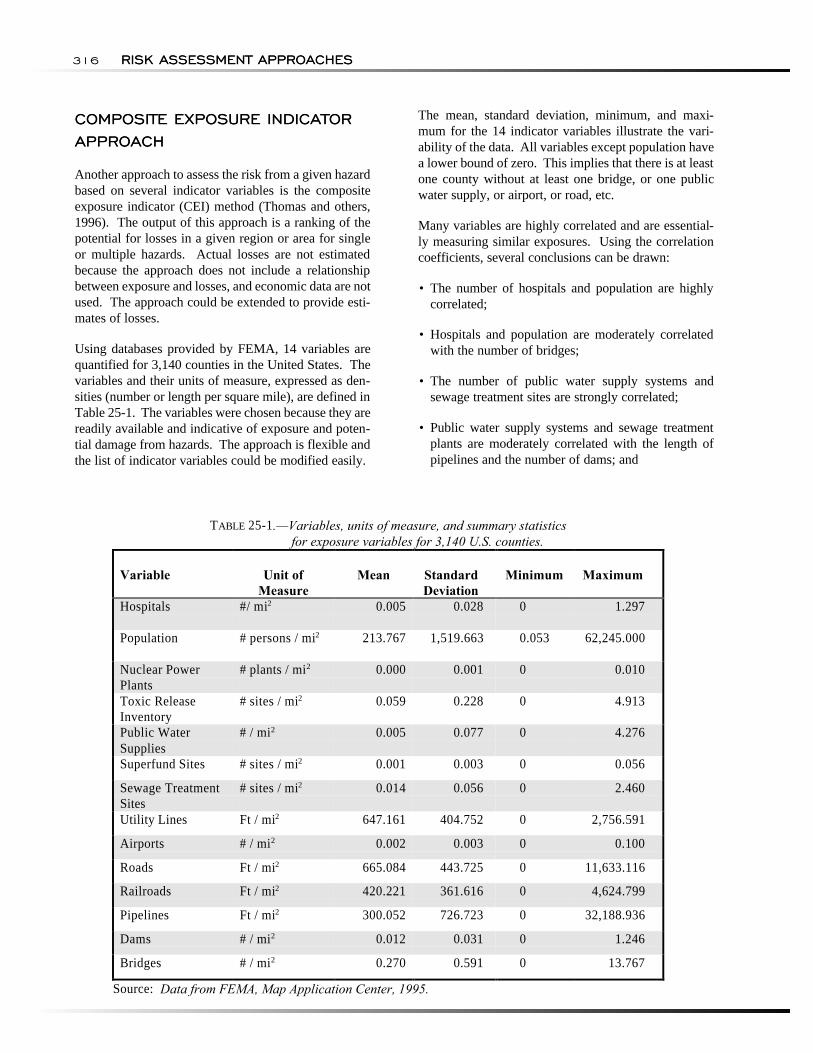
Using databases provided by FEMA, 14 variables are quantified for 3,140 counties in the United States. The variables and their units of measure, expressed as densities (number or length per square mile), are defined in Table 25-1. The variables were chosen because they are readily available and indicative of exposure and potential damage from hazards. The approach is flexible and the list of indicator variables could be modified easily.
The mean, standard deviation, minimum, and maxi-mum for the 14 indicator variables illustrate the variability of the data. All variables except population have a lower bound of zero. This implies that there is at least one county without at least one bridge, or one public water supply, or airport, or road, etc.
Many variables are highly correlated and are essentially measuring similar exposures. Using the correlation coefficients, several conclusions can be drawn:
• The number of hospitals and population are highly correlated;
• Hospitals and population are moderately correlated with the number of bridges;
• The number of public water supply systems and sewage treatment sites are strongly correlated;
• Public water supply systems and sewage treatment plants are moderately correlated with the length of pipelines and the number of dams; and
TABLE 25-1.—Variables, units of measure, and summary statistics for exposure variables for 3,140 U.S. counties.
Variable Unit of Measure
Mean Standard Deviation
Minimum Maximum
Hospitals #/ mi2 0.005 0.028 0 1.297
Population # persons / mi2 213.767 1,519.663 0.053 62,245.000
Nuclear Power Plants
# plants / mi2 0.000 0.001 0 0.010
Toxic Release Inventory
# sites / mi2 0.059 0.228 0 4.913
Public Water Supplies
# / mi2 0.005 0.077 0 4.276
Superfund Sites # sites / mi2 0.001 0.003 0 0.056
Sewage Treatment Sites
# sites / mi2 0.014 0.056 0 2.460
Utility Lines Ft / mi2 647.161 404.752 0 2,756.591
Airports # / mi2 0.002 0.003 0 0.100
Roads Ft / mi2 665.084 443.725 0 11,633.116
Railroads Ft / mi2 420.221 361.616 0 4,624.799
Pipelines Ft / mi2 300.052 726.723 0 32,188.936
Dams # / mi2 0.012 0.031 0 1.246
Bridges # / mi2 0.270 0.591 0 13.767
Source: Data from FEMA, Map Application Center, 1995.
OTHER RISK ASSESSMENT APPROACHES
MULTIPLE COASTAL HAZARDASSESSMENT APPROACH
COASTAL VULNERABILITY INDEXAPPROACH
OTHER RISK ASSESSMENT APPROACHES 317
• The length of roads is moderately correlated with sewage treatment sites and the length of railroads.
Significant correlations between variables indicate similar variation in terms of exposure, suggesting the need for a multivariate analysis approach, such as the principal components analysis. In summary, the results indicate that the first and largest principal component is the transportation variables (road and rail) and the water-related variables (public water supply, sewage sites, dams, and bridges). The second (next largest) principal component is for hospitals and population which are highly correlated. Similar analogies can be made for the other principal components.
Principal components scores (one score for each of the five components) are computed for each of the 3,140 U.S. counties and combined into a single Composite Exposure Indicator (CEI) for each county. The CEI reflects the influence of all 14 original variables and is a measure of exposure of those 14 variables to various hazards. Larger CEI values imply that more people, critical facilities and lifelines are exposed to potential damages from various natural and technological hazards.
MULTIPLE COASTAL HAZARD ASSESSMENT APPROACH
A 1989 study and mapping performed by the Coastal Engineering Research Center and the University of Virginia for USGS (Anders and others, 1989) evaluated selected segments of U.S. coastline for risk and expo-sure to coastal hazards. The frequency of occurrence and intensity of coastal factors were depicted on a map (Chapter 13).
An overall hazard assessment identifying the risk from very low to very high was established and depicted for coastal segments of the U.S. mainland, Alaska, and Hawaii. A similar assessment for the Great Lakes region is underway.
The USGS mapping represents quantitative and qualitative risk assessments associated with coastal factors that are used to identify coastal hazards: shoreline change, overwash distance, storm surge, storm and wave dam-age, earth movements, and stabilization. The mapping includes onshore factors of coastal relief (a modified geomorphology and geology factor) and population demographics.
The population density for shoreline segments was not directly integrated in the assessment to allow a determination of overall exposure. The integration of onshore
population demographics and other factors of risk could transform the hazard assessment study into a more useful tool to assess exposure.
The onshore factors needed for developing an overall assessment should include infrastructure, lifelines, and technological factors. The density of population, hospitals, schools, utility lines, roadways, railways, bridges, dams, airports, powerplants, and sewage treatment facilities in the hazard area increase the exposure. Increased exposure generally results in higher damage potential and disruption of economic health of a coastal area.
COASTAL VULNERABILITY INDEX APPROACH
A coastal hazard assessment performed by the Oak Ridge National Laboratory for DOE evaluated a complex set of coastal factors to identify the risk from permanent and episodic sea level rise for 4,557 coastal segments (Daniels and others, 1992; Gornitz and White, 1992; Gornitz, and others, 1994). The risk assessments were integrated into a Coastal Vulnerability Index (CVI).
The original CVI study used seven marine and land variables. An update to determine impacts of sea level rise expanded and revised the CVI to include six climatological variables, including tropical cyclone probabilities and intensities. For each of the 13 variables, the degree of risk was weighted based on the relative importance to the erosion or inundation risk determination.
In the 1994 publication on the CVI, Gornitz, and others, defined the high-risk coastlines as those having one or more of the following characteristics: low coastal elevations; erodible substrates; previous experience with subsidence; histories of extensive shoreline retreat; high wave/tide energies; and high probabilities of being hit by tropical or extratropical cyclones.
The CVI is composed of three major variable groups: permanent inundation, episodic inundation, and erosion. The inundation variables correlate the factors of coastal flooding as influenced by the geomorphology and geology of the coastal floodplain and topography.
The elevations of the landform and impacts of local subsidence due to sea level rise are considered permanent impacts. The episodic variables are tropical storm probability, hurricane probability, hurricane frequency-intensity, hurricane and tropical storm forward speed, extratropical cyclones (including nor'easters), storm
RISK ASSESSMENT APPROACHES
MULTIPLE HAZARD (SEISMIC-HYDRO-LOGIC) APPROACHES
Approach Developed by Preuss andHebenstreit
318 RISK ASSESSMENT APPROACHES
surge, and tide range. The erosion variables are geomorphology and geology of the coastal floodplain and topography, geologic composition of the shoreline, landform elevation and shape, shoreline erosion rates, and wave heights.
The CVI identified ranges within each risk classification for the 13 variables and ranked them on a scale of increasing vulnerability, from 1 (very low risk) to 5 (very high risk). The percentage of shoreline within each risk class was determined for each variable. The weighting of each factor and the algorithm used to combine the factors into the CVI depended on the importance and combination of the 13 factors.
The vulnerability to coastal inundation was determined to constitute the greatest impact and was weighted higher than the erosion variables. The permanent inundation factor was the most significant of the two inundation factors, and was weighted more heavily than the episodic factors.
The sums of factors were assigned weights: permanent inundation (35 percent), episodic inundation (25 per-cent), and erosion potential factor (40 percent). Within the episodic inundation factor, the variables for tropical storm and hurricane probabilities were averaged with respective weights of 0.25 and 0.75, because of differences in the relative energies of the two storm intensities. Within the erosion potential factor, the geology and landform variables were averaged because in the Southeastern U.S. study area, the variables contain similar information (Gornitz and others, 1994).
The updated CVI assessment for sea level rise in the Southeastern United States from Texas to North Carolina determined that the Gulf Coast has 30 percent, and the Atlantic Coast has 15 percent, of the respective coastlines at very high risk and exposure to inundation or increased erosion.
The CVI assigned higher vulnerability rankings to the North Carolina barrier islands and low-lying barrier islands of Louisiana than to the Florida coastline. Florida is classified as being frequented more often by fewer severe storms and has a wave climate of lower wave heights than the Outer Banks of North Carolina.
The estimated 1993 Florida coastal population is 10.5 million and total insured property values for residential and commercial properties are the highest in both categories for all coastal States from Texas to Maine. North Carolina and Louisiana may have a higher CVI ranking and physically more vulnerable coastlines than Florida, but their economic and population factors are much lower than Florida's highly developed coastline.
The integration of the Oak Ridge National Laboratory's CVI ranking into a vulnerability assessment for demo-graphics and economics may be a valuable tool for assessment of overall coastal vulnerability. Because the information is geocoded, the data can be incorporated into existing Geographic Information Systems and used to assist in determining erosion and inundation impacts from sea level rise, multiple coastal hazard impacts, and other impacts on natural and technological hazards, utilities, and lifelines.
MULTIPLE HAZARD (SEISMIC-HYDRO-LOGIC) APPROACHES
The potential for loss of life and property damage from a local tsunami event created by a Cascadia Subduction Zone earthquake is significant enough to warrant extensive regional planning efforts to prepare pre-disaster response and mitigation plans. Recent studies conducted for Grays Harbor, WA (Preuss and Hebenstreit, 1991), and Humboldt and Del Norte Counties, CA (Toppozada and others, 1995) included multiple-hazard assessments of risk and vulnerability.
Approach Developed by Preuss and Hebenstreit
Preuss and Hebenstreit (1991) developed and applied a methodology to assess the multiple hazard impacts of an earthquake and associated tsunami flood event. The report presents a risk-based urban planning approach designed to allow assignment of discrete risk factors for vulnerabilities on an individual community basis.
Tsunami high-hazard inundation zones were established along the vulnerable coastal areas. Areas subject to subsidence during an earthquake were delineated, with emphasis on the flood potential in these zones. Transportation lifelines were identified for susceptibility to flooding and landslide hazards. Local land-use patterns, population distribution, and population densities were used to delineate vulnerability zones in the model study area of Grays Harbor, WA. The secondary impacts of earthquake ground motion and the release of toxic and hazardous chemicals were identified
This multiple hazard assessment approach needs to be expanded to include more information on structures and local storage facilities. Community response to a Cascadia Subduction Zone earthquake event was deter-mined to need improvement through public awareness campaigns. Expanded assessment and mapping pro-grams have been recommended for implementation in other high risk communities of the Pacific Northwest coastline.
OTHER RISK ASSESSMENT APPROACHES
Approach Developed by Toppazada andOthers
BIBLIOGRAPHY AND REFERENCES
OTHER RISK ASSESSMENT APPROACHES 319
Approach Developed by Toppazada and Others
Toppozada and others (1995) describe an assessment of the vulnerability of infrastructure and lifelines in north-western California to a major Cascadia Subduction Zone earthquake. The assessment integrates the seismic-geologic-hydrologic hazards, including tsunami waves, ground failure, fault rupture, liquefaction, and landslides.
The report includes mapping of the hazards and societal impacts (i.e., buildings and structures, transportation lifelines, utility lines) and addresses coastal community planning needs. The hazards, seismic and planning considerations, and planning scenarios are characterized with damage assessments.
The report addresses the areas in need of improvement to expand the application of the assessment methodologies. Identifying the generally vulnerable areas in the scenario presented in the report provides the tool to lead to other investigations, such as more detailed and site-specific models on tsunami flooding, landslides, or engineering design standards for seismic resistance and retrofitting needs of local structures. Integration of the assessment components, detailed modeling, and map-ping data into a GIS database may expand its usefulness in other vulnerable coastal communities in the Pacific Northwest.
BIBLIOGRAPHY AND REFERENCES
Anders, F., S. Kimball, and R. Dolan. 1989. Map. Coastal Hazards: National Atlas of the United States. U.S. Geological Survey.
Daniels, R.C., V.N. Gornitz, A.J. Mehta, S.C. Lee, and R.M. Cushman. 1992. Adapting to Sea-Level Rise in the U.S. Southeast: The Influence of Built Infrastructure and Biophysical. Oak Ridge National Laboratory, Environmental Sciences Division, Publication No. 3915. Oak Ridge, TN.
Gornitz, V.M., and T.W. White. 1992. A Coastal Hazards Data Base for the U.S. East Coast. Oak Ridge National Laboratory, Environmental Sciences Division, Publication No. 3913. Oak Ridge, TN.
Gornitz, V.M., T.W. White, and R.C. Daniels (ed.). 1994. A Coastal Hazards Data Base for the U.S. Gulf Coast. Oak Ridge Laboratory, Environmental Sciences Division, Publication No. 4101. Oak Ridge, TN.
Gornitz, V.N., R.C. Daniels, T.W. White and K.R. Birdwell. 1994. “The Development of a Coastal Risk Assessment Database: Vulnerability to Sea-Level Rise in the U.S. Southeast.” Journal of Coastal Research, Special Issue No. 12. Coastal Hazards: Perception, Susceptibility and Mitigation. Pp. 327-338.
Long, M.H., and J.I. John. 1993. Risk-based Emergency Response. Paper presented at the ER93 Conference on the Practical Approach to Hazardous Substances Accidents. St. John, New Brunswick, Canada.
McCuen, R.H. 1993. Microcomputer Applications in Statistical Hydrology. Englewood Cliffs, NJ: Prentice Hall.
Morrison, D.F. 1976. Multivariate Statistical Methods. 2nd ed. New York: McGraw-Hill.
Preuss, J., and G.T. Hebenstreit. 1991. Integrated Hazard Assessment for a Coastal Community: Grays Harbor. U.S. Geological Survey Open-File Report 91-441-M.
Thomas, W.O., Jr., B. Bonn, and A.V. Romano. 1996. Development of a Multivariate Vulnerability Indicator. Accepted for publication, Proceedings of the International Conference and Exposition on Natural Disaster Reduction ‘96, American Society of Civil Engineers, Washington, DC.
Toppozada, T., G. Borchardt, W. Haydon, M. Peterson, R. Olson, H. Lagorio, and T. Anvik. 1995. Planning Scenario in Humboldt and Del Norte Counties, California, for a Great Earthquake on the Cascadia Subduction Zone. California Department of Conservation, Division of Mines and Geology, Special Publication 115.
