risk-based approach to identifying and selecting clinical ... · risk-based approach to identifying...
TRANSCRIPT

PharmaSUG 2014 – BB18
Risk-Based Approach to Identifying and Selecting Clinical Sites for Sponsor’s Preparation for FDA/EMA Inspection Xiangchen (Bob) Cui, Alkermes, Inc, Waltham, MA
ABSTRACT In December 2012, the Center for Drug Evaluation and Research (CDER) issued a draft guidance relating to electronic submissions. Guidance for Industry: Providing Submissions in Electronic Format—Summary Level Clinical Site Data for CDER’s Inspection Planning [1] [2] is one in a series of guidance documents intended to assist sponsors making certain regulatory submissions to FDA in electronic format. FDA’s Office of Scientific Investigation (OSI) requests the sponsor to submit a clinical dataset that describes and summarizes the characteristics and outcomes of clinical investigation at the level of the individual study site within all NDAs, BLAs, or supplements that contain clinical data submitted to CDER. The OSI has developed and is piloting a risk-based inspection site selection tool to facilitate use of a risk-based approach for the timely identification of clinical investigator sites for on-site inspection by the CDER during the review of marketing applications.
The CDER approved two NDAs (hepatitis C and cystic fibrosis) from Vertex Pharmaceuticals Incorporated in 2011 and 2012, respectively. This paper explores the risk-based methodology, which was developed based on these two NDAs, by analyzing summary level clinical site data to identify and select high risk sites to assist the sponsor in preparation for FDA/EMA inspections. The methods were applied retrospectively to a hepatitis C FDA/EMA submission and prospectively to a cystic fibrosis FDA/EMA submission, both of which were very successful. The sharing of hands-on experiences in this paper is intended to assist readers to apply this methodology to prepare cost-effectively for FDA/EMA inspections through the risk-based approach.
INTRODUCTION The Center for Drug Evaluation and Research (CDER) issued a draft guidance in December 2012, which urges sponsors to submit a clinical dataset that describes and summarizes the characteristics and outcomes of clinical investigation at the level of the individual study site (summary level clinical site data). FDA’s Office of Scientific Investigation (OSI) has developed and is piloting a risk-based inspection site selection tool to facilitate use of a risk-based approach for the timely identification of clinical investigator sites for on-site inspection by the CDER during the review of marketing applications. This tool combines data from multiple databases to quickly analyze and assess clinical sites for identifying sites for inspections. The OSI requested summary level clinical site (SLCS) data for each submission. Exploratory and retrospective data analysis of summary level clinical site data from a hepatitis C FDA submission showed that the first quartile of the risk scores across the clinical investigator sites from its pivotal study (31 sites out of 123 sites) covered the sites (5 sites) inspected by FDA and EMA. In contrast, the company prepared 36 sites for inspection and one inspected site was not among them. The method was applied prospectively to a cystic fibrosis FDA/EMA submission. Eight (8) sites were chosen as Tier 1 and three (3) sites were chosen as Tier 2 among seventy-four (74) sites for FDA/EMA inspection preparation. Two (2) sites were inspected by FDA from the eight (8) sites in Tier 1. This paper provides an introduction to SLCS data, categorizes key risk indicators for site selection for agency inspection as study conduct, safety perspective, efficacy perspective, and trial location, and proposes the risk factors for each category. Additionally, statistical methods are proposed to analyze these risk factors, to calculate the total risk score for each site, and finally identify and select the sites with high risks for FDA/EMA inspection preparation.
INTRODUCTION TO SUMMARY LEVEL CLINICAL SITE (SLCS) DATASET The OSI requests the sponsor to submit SLCS data within all NDAs, BLAs, or supplements that contain clinical data submitted to the CDER for CDER’s Inspection Planning. The FDA’s guidance for industry and specifications for preparing and submitting SLCS can be referred to [1] and [2], respectively. The hands-on experience of preparing these derived variables in SLCS dataset from FDA submission can be referred to [5].

Risk-Based Approach to Identifying and Selecting Clinical Sites for Sponsor’s Preparation for FDA/EMA Inspection, continued
2
Appendix A provides summary level clinical site data elements. The SLCS contains the following information:
1. IND Number 2. Trial Number Site ID 3. Treatment Arm 4. Enrollment (Number of Subjects Enrolled and Number of Subjects Screened) 5. Number of Subject Discontinuations 6. Endpoint 7. Endpoint Type 8. Site-specific Efficacy 9. Protocol Violations 10. Deaths 11. AEs 12. SAEs 13. Financial Disclosure 14. Name, Address and Contact information of the Primary Investigator
The key derived variables and key risk indicators for systematic assessment in a clinical trial can be identified and categorized as study conduct, safety perspective, and efficacy perspective, shown in Table 1 below. One can classify the number of protocol violations into safety perspective category.
Risk Category Variable Name and Its Label in SLCS
Study Conduct ENROLL: Total Number of Subjects Enrolled by Treatment Arm SCREEN: Total Number of Subjects Screened DISCONT: Number of Subjects Discontinuing from the Study by Treatment Arm PROTVIOL: Number of Protocol Violations
Safety Perspective DEATH: Total Number of Deaths by Treatment Arm NSAE: Number of Non-Serious Adverse Events by Treatment Arm SAE: Number of Serious Adverse Events by Treatment Arm
Efficacy Perspective
TRTEFFR: The efficacy result for each primary endpoint by treatment arm TRTEFFV: The variance of the efficacy result for each primary endpoint by treatment arm SITEEFFE: Site-Specific Efficacy Effect Size SITEEFFV: Site-Specific Efficacy Effect Size Variance
Table 1. Key Risk Indicators for Systematic Assessment in a Clinical Trial from the SLCS Dataset Display 1, 2, and 3 show a hypothetical example of SLCS for these variables listed in Table 1.
IND TRIAL SITEID ARM ENROLL SCREEN DISCONT PROTVIOL 89613 AB07-888-123 101 Active 3 12 0 5 89613 AB07-888-123 101 Placebo 4 12 1 13 89613 AB07-888-123 102 Active 6 18 0 8 89613 AB07-888-123 102 Placebo 5 18 1 10 89613 AB07-888-123 103 Active 10 21 2 18 89613 AB07-888-123 103 Placebo 9 21 1 23
Display 1. A Hypothetical Example of SLCS Dataset for Number of subjects Enrolled, Screened, Discontinuing from the Study, and Number of Protocol Violations.
IND TRIAL SITEID ARM DEATH NSAE SAE 89613 AB07-888-123 101 Active 0 32 8 89613 AB07-888-123 101 Placebo 1 45 15 89613 AB07-888-123 102 Active 0 64 24 89613 AB07-888-123 102 Placebo 0 70 17 89613 AB07-888-123 103 Active 2 102 49 89613 AB07-888-123 103 Placebo 0 128 34
Display 2. A Hypothetical Example of SLCS Dataset for Total Number of Deaths, Number of Non-Serious Adverse Events, and Number of Serious Adverse Events.

Risk-Based Approach to Identifying and Selecting Clinical Sites for Sponsor’s Preparation for FDA/EMA Inspection, continued
3
SITEID ARM ENROLL ENDPTYPE
TRTEFFR TRTEFFV SITEEFFE SITEEFFV
101 Active 1 continuous 4.6 7.2 101 Placebo 3 continuous -2.6 2.34 102 Active 2 continuous -2.4 25.69 -2.7 30.11 102 Placebo 3 continuous 0.3 4.42 103 Active 4 continuous 13 17.96 14.7 20.43 103 Placebo 3 continuous -1.7 2.47
Display 3. A Hypothetical Example of SLCS Dataset for Efficacy Result for Primary Endpoint, Variance of the Efficacy Result, Site-Specific Efficacy Effect Size, and Site-Specific Efficacy Effect Size Variance
Note: The Primary Endpoint is “Absolute change from baseline in percent predicted forced expiratory volume in 1 second (%predicted FEV1) through Week 24” for Display 3 above. TRIAL LOCATION – DIFFERENCE BETWEEN DOMESTIC SITES AND FOREIGN SITES INSPECTED BY FDA The Office of Inspector General (OIG) reported the analysis of FDA marketing applications approved in FY 2008 in June 2010 [3]. Display 4 is from Table 3 of that report. The historical data for percentages of sites (domestic and foreign) inspected shows that a domestic site has 2.7 times likelihood to be inspected than a foreign site. Hence sites from US would be considered as 2.7 times likelihood of being selected as other foreign sites per the “historical” data. It is also worth noting that overall percentage of sites inspected in FY 2008 is 1.2%.
Site Location Number of Sites Number of Inspections Percentage of Sites Inspected Domestic 5,459 102 1.9% Foreign 6.485 45 0.7% Overall Total 11,944 147 1.2%
Display 4. Number and Percentage of Clinical Investigator Inspections at Domestic and Foreign Sites for FDA Marketing Applications Approved in FY 2008
STATISTICAL METHOD FOR RANKING: A DECILE RANK The OIG report: “The Food and Drug Administration’s Oversight of Clinical Trials, September 2007” [4] states “We estimate that FDA inspected 1 percent of clinical trial sites during the fiscal year 2000–2005 period”. When a specific risk factor, e.g. high enrollment, is used to identify clinical sites within a clinical study as high risk sites, “top 10%” of clinical sites from the risk are “adequate” to prepare the FDA/EMA inspection. A decile is a statistical term, meaning that a group or population has been divided into ten equally sized groups, giving ten deciles. A decile rank is a single number on a scale of 1 to 10, which corresponds to a percentage, usually ten percentage points. For example, a decile of five might mean top 50%, or a decile of one would mean top 10%, or a decile of ten mean bottom 10%. A decile of one (top 10%) and a decile of ten (bottom 10%) are used to rank risk factors for identifying the high risk sites. In SAS, PROC RANK procedure can accomplish the task of getting the decile rank.
proc rank data=slcs out=r_scrn descending groups=10 ties=low; var enroltot; ranks r_enroltot;
run;
The SAS Option: ties=low assigns the smallest of the corresponding ranks for the tied values. The possible ranked values are from 0 to 9. A decile rank will be applied to both count and rate of risk factors in the following sections, e.g., top 10% enrollment, and top 10% enrollment rate, etc.

Risk-Based Approach to Identifying and Selecting Clinical Sites for Sponsor’s Preparation for FDA/EMA Inspection, continued
4
CHI-SQUARE TEST LIKE “GOODNESS TO FIT" BETWEEN THE OBSERVED AND EXPECTED--- DEVIATION A statistic, called a deviation (D), is defined as the squared difference between the observed (O) and the expected (E) data, divided by the expected data, i.e., D = (O - E)^2/E. The “bigger” deviation means that either “higher” or “lower” observed data relative to the expectation. Display 5 shows an example of calculation of deviation of AEs from four clinical sites and interpretation of their deviations. In this example, we assume that average AE rate is 10 AEs per dosed subject.
Site ID Number of Dosed Subjects
Observed AEs
Expected AEs
Deviation
(O - E)^2 / E
Comment
001 10 102 100 (102-100)^2/100=0.04 “Meet the Expectation”
002 8 40 80 (40-80)^2/80=20
“Too Few AEs”
Under AE reporting
003 4 60 40 (60-40)^2/40=10
“Too Many AEs”
Safety concern
004 8 60 80 (60-80)^2/80=5 “Meet the Expectation?”
Display 5. An Example of Calculation of Deviations of AEs For each site, total adverse event deviation, serious adverse event deviation, total adverse event deviation from active arm, and serious adverse event deviation from active arm will be calculated to identify the sites with “High” AE/SAE deviations from expectation for selecting the sites with high risk with respect to safety.
PROPOSED RISK FACTOR CATEGORIES OF SITE SELECTION FOR INSPECTION Table 1 classifies SLCS dataset into three categories: study conduct, safety perspective, and efficacy perspective. Display 4 shows that a domestic site has 2.7 times likelihood to be inspected than a foreign site. There are four risk factor categories of site selection for FDA inspection as shown below.
1. Due to Study Conduct 2. Due to Safety 3. Due to Efficacy 4. Trial Location
We will illustrate the risk factors of site selection for inspection within each category in the following sections. The examples in all displays are hypothetical for illustration of the methodology.
PROPOSED RISK FACTORS FOR SITE SELECTION DUE TO STUDY CONDUCT Five variables are used to flag the sites with the risk for FDA/EMA inspection due to trial conduct. Four variables (ENROLL, DISCONT, PROTVIOL, and SCREEN) are from SLCS. Variable: DOSED (Number of Subjects Dosed) is not included in SLCS. However number of subjects enrolled by treatment arm and number of subjects dosed by treatment arm are not always the same in clinical trials. It will be needed to calculate AE rates and SAE rates as the denominator. Table 2 shows the proposed risk factors to be considered for site preparation for FDA/EMA inspection due to study conduct.
Index Variable Risk Factor Description Rationale 1 ENROLL Top 10% Enrollment A decile of one (top 10%) high
enrollment within the study High Enrollment
2 ENROLL Top 10% Enrollment Rate A decile of one (top 10%) for enrollment rate within the study
High Enrollment
3 ENROLL High Enrollment Rate Enrollment rate above study average
High Enrollment
4 DOSED Top 10% Number of A decile of one (top 10%) high High Number of

Risk-Based Approach to Identifying and Selecting Clinical Sites for Sponsor’s Preparation for FDA/EMA Inspection, continued
5
Subjects Dosed number of subjects dosed within the study
Dosed
5 DOSED Top 10% Dose Rate A decile of one (top 10%) for dosed rate within the study
High Number of Dosed
6 DOSED High Dose Rate Dosed rate above study average rate
High Number of Dosed
7 DISCONT Top 10% Discont. Top 10% for discontinue count within the study
“Poor” Study Conduct
8 DISCONT Top 10% Discont. Rate Top 10% for discontinue rate within the study
“Poor” Study Conduct
9 DISCONT Low Discont. Rate 1 Discontinuation rate below study average rate
“Too Good to Be True”
10 DISCONT Low Discont. Rate 2 if Discontinuation rate below 10, i.e. sites with completion of study rate above 90%
“Too Good to Be True”
11 PROTVIOL Low Protocol Violation Rate
Protocol violation rate below study average
“Too Good to Be True”
12 PROTVIOL Top 10% Protocol Violation Count
A decile of one (top 10%) for protocol violation number within the study
“Poor” Study Conduct
13 PROTVIOL Top 10% Protocol Violation Rate
A decile of one (top 10%) for protocol violation rate within the study
“Poor” Study Conduct
14 SCREEN High Screened Subjects (Top 10% Screener)
A decile of one (top 10%) high number of subjects screened within the study
High Number of Screened
Table 2. Proposed Risk Factors for Site Preparation for FDA/EMA Inspection due to Trial Conduct Table 3 shows that there are nine (9) new variable names and their labels to be derived. They calculate the total counts in the study and the total counts within a site for these five variables: SCREEN, ENROLL, DOSED, DISCONT, and PROTVIOL.
Index New Variable Name New Variable Label 1 SCRENTOT Total Number of Subjects Screened in the Study 2 ENROLTOT Total Number of Subjects Enrolled in the Study 3 DOSEDTOT Total Number of Subjects Dosed within the Study 4 DISCNTOT Total Number of Subjects Discontinued from the study 5 PVIOLTOT Total Number of Protocol Violations within the study 6 SCRENSUM Total Number of Subjects Screened within a Site 7 ENROLSUM Total Number of Subjects Enrolled within a Site 8 DOSEDSUM Total Number of Subjects Dosed within a Site 9 DISCNSUM Total Number of Subjects Discontinued from the study within a Site 10 PVIOLSUM Total Number of Protocol Violations within a Site
Table 3. New Variable Names and Labels for Total Counts for SCREEN, ENROLL, DOSED, DISCONT, and PROTVIOL within the Study and within a Site
SITEID SCRENTOT ENROLTOT DOSEDTOT DISCNTOT PVIOLTOT SCRENSUM ENROLSUM DOSEDSUM DISCNSUM PVIOLSUM
101 260 219 213 9 1914 7 7 7 1 76 102 260 219 213 9 1914 6 6 5 1 26 201 260 219 213 9 1914 6 6 6 0 121 202 260 219 213 9 1914 7 7 7 0 59 203 260 219 213 9 1914 8 7 7 0 63 204 260 219 213 9 1914 12 10 10 0 89 205 260 219 213 9 1914 2 5 5 0 32 206 260 219 213 9 1914 4 4 4 0 14 301 260 219 213 9 1914 7 6 6 0 42 302 260 219 213 9 1914 7 7 7 0 91 303 260 219 213 9 1914 5 4 4 0 20 401 260 219 213 9 1914 3 2 2 0 20 402 260 219 213 9 1914 3 3 2 1 18

Risk-Based Approach to Identifying and Selecting Clinical Sites for Sponsor’s Preparation for FDA/EMA Inspection, continued
6
Display 6. An Example of Total Counts for SCREEN, ENROLL, DOSED, DISCONT, and PROTVIOL within the Study and within A Site Table 4 shows that eight (8) variables and their definitions to be derived for study overall rates and rates per site for these four variables: ENROLL, DOSED, DISCONT, and PROTVIOL.
Index New Variable Name New Variable Label Definition 1 ENROLAVG Study Average Enrollment Rate ENROLTOT / SCRENTOT 2 ENROLRATE Enrollment Rate Per Site ENROLSUM / SCREN 3 DOSEDAVG Study Average Dosed Rate DOSEDTOT / ENROLTOT 4 DOSEDRATE Dosed Rate Per Site DOSEDSUM / ENROLL 5 DISCNTAVG Study Average Discontinuation Rate DISCNTOT / ENROLTOT 6 DISCNTRATE Discontinuation Rate Per Site DISCNSUM / ENROLSUM 7 PVIOLAVG Study Average Protocol Violation Rate PVIOLTOT / ENROLTOT 8 PVIOLRATE Protocol Violation Rate Per Site PVIOLSUM / ENROLSUM
Table 4. New Variables and Their Definitions for Rates from ENROLL, DOSED, DISCONT, and PROTVIOL
SITEID ENROLAVG ENROLRATE DOSEDAVG DOSEDRATE DISCNTAVG DISCNTRATE PVIOLAVG PVIOLRATE 101 84.2 100 97.3 100 4.1 14.3 898.6 1085.7 102 84.2 100 97.3 83.3 4.1 16.7 898.6 520 201 84.2 100 97.3 100 4.1 0 898.6 2016.7 202 84.2 100 97.3 100 4.1 0 898.6 842.9 203 84.2 87.5 97.3 100 4.1 0 898.6 900 204 84.2 83.3 97.3 100 4.1 0 898.6 890 205 84.2 250 97.3 100 4.1 0 898.6 640 206 84.2 100 97.3 100 4.1 0 898.6 350 301 84.2 85.7 97.3 100 4.1 0 898.6 700 302 84.2 100 97.3 100 4.1 0 898.6 1300 303 84.2 80 97.3 100 4.1 0 898.6 500 401 84.2 66.7 97.3 100 4.1 0 898.6 1000 402 84.2 100 97.3 66.7 4.1 33.3 898.6 900
Display 7. An Example of Rates for ENROLL, DOSED, DISCONT, and PROTVIOL within the Study and within a Site Table 5 shows that there are nine (9) variables their labels, which are derived from the decile rank of SCREEN, in addition to the counts and rates per site of these four variables: ENROLL, DOSED, DISCONT, and PROTVIOL. Their possible values are among 0, 1, 2, 3, 4, 5, 6, 7, 8, and 9. Value 0 indicates that the site had a decile of one (top 10%) of that variable within the study.
Index New Variable Name New Variable Label 1 R_SCREEN A Decile Rank of Total Number of Subjects Screened Per Site 2 R_ENROLSUM A Decile Rank of Enrollment Per Site 3 R_DOSEDSUM A Decile Rank of Total Number of Subjects Dosed Per Site 4 R_DISCNSUM A Decile Rank of Total Number of Subjects Discontinued from the study
Per Site 5 R_PVIOLSUM A Decile Rank of Total Number of Protocol Violations Per Site 6 R_ENROLRATE A Decile Rank of Enrollment Rates Per Site 7 R_DOSEDRATE A Decile Rank of Dosed Rates Per Site 8 R_DISCNTRATE A Decile Rank of Discontinuation Rates Per Site 9 R_PVIOLRATE A Decile Rank of Protocol Violation Rates Per Site
Table 5. New Variable Names and Labels for Decile Ranks of Total Counts and Rates for ENROLL, DOSED, DISCONT, and PROTVIOL
SITEID R_ SCREEN
R_ ENROLSUM
R_ DOSEDSUM
R_ DISCNSUM
R_ PVIOLSUM
R_ ENROLRATE
R_ DOSEDRATE
R_ DISCNTRATE
R_ PVIOLRATE
101 0 0 0 0 0 1 0 1 2 102 1 0 1 0 3 1 9 0 7 201 1 0 0 1 0 1 0 1 0 202 0 0 0 1 1 1 0 1 5 203 0 0 0 1 1 5 0 1 3

Risk-Based Approach to Identifying and Selecting Clinical Sites for Sponsor’s Preparation for FDA/EMA Inspection, continued
7
204 0 0 0 1 0 5 0 1 4 205 6 1 1 1 2 0 0 1 6 206 2 1 1 1 6 1 0 1 8 301 0 0 0 1 1 5 0 1 6 302 0 0 0 1 0 1 0 1 1 303 1 1 1 1 4 5 0 1 7 401 3 5 5 1 4 6 0 1 2 402 3 3 5 0 5 1 9 0 3
Display 8. An Example of Decile Ranks of Total Counts and Rates for ENROLL, DOSED, DISCONT, and PROTVIOL within A Site Table 6 shows that nine (9) variables and their definitions, which are derived from the decile ranked counts and rates for these five variables: SCREEN, ENROLL, DOSED, DISCONT, and PROTVIOL. They are binary variables with 0 and 1 as their possible values. Value 1 indicates that the site has the risk compared to other sites within the study for that risk factor.
Index New Variable Name Derivation Rule 1 TOP10_SCREEN 1 if R_SCREEN=0; 0 else 2 TOP10_ENROL 1 if R_ENROLSUM=0; 0 else 3 TOP10_DOSED 1 if R_DOSEDSUM=0; 0 else 4 TOP10_DISCNT 1 if R_DISCNSUM=0; 0 else 5 TOP10_PVIOL 1 if R_PVIOLSUM=0; 0 else 6 TOP10_ ENROLRATE 1 if R_ENROLRATE=0; 0 else 7 TOP10_DOSEDRATE 1 if R_DOSEDRATE=0; 0 else 8 TOP10_DISCNTRATE 1 if R_DISCNTRATE=0; 0 else 9 TOP10_PVIOLRATE 1 if R_PVIOLRATE=0; 0 else
Table 6. Nine (9) variables and Their Definitions for Identifying Sites with Risk from SCREEN, ENROLL, DOSED, DISCONT, and PROTVIOL
SITEID TOP10_ SCREEN
TOP10_ ENROL
TOP10_ DOSED
TOP10_ DISCNT
TOP10_ PVIOL
TOP10_ ENROLRATE
TOP10_ DOSEDRATE
TOP10_ DISCNTRATE
TOP10_ PVIOLRATE
101 1 1 1 1 1 0 1 0 0 102 0 1 0 1 0 0 0 1 0 201 0 1 1 0 1 0 1 0 1 202 1 1 1 0 0 0 1 0 0 203 1 1 1 0 0 0 1 0 0 204 1 1 1 0 1 0 1 0 0 205 0 0 0 0 0 1 1 0 0 206 0 0 0 0 0 0 1 0 0 301 1 1 1 0 0 0 1 0 0 302 1 1 1 0 1 0 1 0 0 303 0 0 0 0 0 0 1 0 0 401 0 0 0 0 0 0 1 0 0 402 0 0 0 1 0 0 0 1 0
Display 8. An Example of Nine (9) variables for Identifying Sites with Risk from SCREEN, ENROLL, DOSED, DISCONT, and PROTVIOL Table 7 shows that five (5) variables and their definitions, which are derived from the comparison of the rates per site with one from study average for these four variables: ENROLL, DOSED, DISCONT, and PROTVIOL. They are also binary variables with 0 and 1 as their possible values. Value 1 indicates that the site has the risk compared to other sites within the study for that risk factor.
Index New Variable Name New Variable Label Derivation Rule 1 HIGH_ENROLRATE Enrollment rate above
study average 1 if ENROLRATE > ENROLAVG 0 else
2 HIGH_DOSEDRATE Dosed rate above study average rate
1 if DOSEDRATE > DOSEDAVG 0 else
3 LOW_DISCNTRATE Discontinuation rate below study average rate
1 if DISCNTRATE < DISCNTAVG 0 else
4 LOW_ Discontinuation rate 1 if DISCNTRATE < 10

Risk-Based Approach to Identifying and Selecting Clinical Sites for Sponsor’s Preparation for FDA/EMA Inspection, continued
8
DISCNTRATE2 below 10 0 else 5 LOW_PVIOLRATE Protocol violation rate
below study average 1 if PVIOLRATE < PVIOLAVG 0 else
Table 7. Five variables and Their Definitions for Identifying Sites with Risk from the Rates of ENROLL, DOSED, DISCONT, and PROTVIOL
SITEID HIGH_ ENROLRATE
HIGH_ DOSEDRATE
LOW_ DISCNTRATE
LOW_ DISCNTRATE2
LOW_ PVIOLRATE
TC_RISK TC_RISK_ SCORE
101 1 1 0 0 0 8 57.1 102 1 0 0 0 1 5 35.7 201 1 1 1 1 0 9 64.3 202 1 1 1 1 1 9 64.3 203 1 1 1 1 0 8 57.1 204 0 1 1 1 1 9 64.3 205 1 1 1 1 1 7 50.0 206 1 1 1 1 1 6 42.9 301 1 1 1 1 1 9 64.3 302 1 1 1 1 0 9 64.3 303 0 1 1 1 1 5 35.7 401 0 1 1 1 0 4 28.6 402 1 0 0 0 0 3 21.4
Display 9. An Example of Five Binary Variables for Identifying Sites with Risk from the Rates of ENROLL, DOSED, DISCONT, and PROTVIOL Fourteen (14) binary variables shown in Tables 6 and 7 can be used to identify the site with the risk for the risk factors listed in Table 2, compared to other sites within the study. In order to calculate the overall risk for Study Conduct Category, the weights of fourteen binary variables should be specified. Different weights make the different results. Who makes the decision? Does the study team leading by medical director and/or biostatistician? The simplest solution is equal weight to each risk factor. Once the weights are decided, the summation of fourteen (14) binary variables with multiplication of their weights provides the total risk score on a 0-14 scale due to trial conduct, named the variable as TC_RISK. For easy communication, conversion of TC_RISK into a score on a 100-point scale is performed by TC_RISK_SCORE=100*(TC_RISK / 14). The last two columns in Display 9 above show an example of the number of risks from 14 risk factors and score on a 100-point scale due to the trial conduct. PROPOSED RISK FACTORS FOR SITE SELECTION DUE TO SAFETY Tow variables (NSAE and SAE) from SLCS are used to flag the sites with the risk for FDA/EMA inspection due to safety perspective. Table 8 shows that ten (10) risk factors are proposed for selecting sites with these high risks.
Index Risk Factor Description Rationale 1 Top 10% AE Rate Had a decile of one (top 10%) for AE rate
within the study Subject Safety Due to “High” AE
2 Bottom 10% AE Rate Had a decile of ten (bottom 10%) AE rate within the study
Underreporting of AEs
3 Top 10% SAE Rate Had a decile of one (top 10%) for SAE rate within the study
Subject Safety Due to “High” SAE
4 Bottom 10% SAE Rate Had a decile of ten (bottom 10%) SAE rate within the study
Underreporting of SAEs
5 Top 10% “deviation from expected AE”
Had a decile of one (top 10%) Adverse Events Deviation within the Study
Subject Safety Due to “High” AE Deviation from Expectation
6 Top 10% “deviation from expected SAE”
Had a decile of one (top 10%) Serious Adverse Events Deviation within the Study
Subject Safety Due to “High” SAE Deviation from Expectation
7 Top 10% from “deviation from expected AE” from Active Arm
Had a decile of one (top 10%) Adverse Events Deviation from Active Arm
Subject Safety Due to “High” AE Deviation from Expectation Among Active Arm
8 Top 10% from Had a decile of one (top 10%) Serious Subject Safety Due to

Risk-Based Approach to Identifying and Selecting Clinical Sites for Sponsor’s Preparation for FDA/EMA Inspection, continued
9
“deviation from expected SAE” from Active Arm
Adverse Events Deviation from Active Arm “High” SAE Deviation from Expectation Among Active Arm
9 High AE Rate AE rate above study average Subject Safety Due to “High” AE Rate
10 High SAE Rate SAE rate above study average Subject Safety Due to “High” SAE Rate
Table 8. Proposed Risk Factors for Site Preparation for FDA/EMA Inspection due to Safety Table 9 shows that twelve (12) new variables and their labels are derived for the total counts of AE, SAE, AE by active arm, and SAE by active arm, within a study and within a site. These variables are needed for calculating the ten risks defined in table 8. Display 10 provides an example of these twelve variables defined in Table 9.
Index New Variable Name New Variable Label 1 AE_TOT Total Number of Adverse Events in the Study 2 SAE_TOT Total Number of Serious Adverse Events in the Study 3 AE_SUM Total Number of Adverse Events within a Site 4 SAE_SUM Total Number of Serious Adverse Events within a Site 5 AE_TOT_ACTIVE Total Number of Adverse Events from Active Arm in the Study 6 AE_SUM_ACTIVE Total Number of Adverse Events from Active Arm within a Site 7 SAE_TOT_ACTIVE Total Number of Serious Adverse Events from Active Arm in the Study 8 SAE_SUM_ACTIVE Total Number of Serious Adverse Events from Active Arm within a Site 9 DOSEDTOT_ACTIVE Total Number of Subjects Dosed from Active Arm in the Study 10 DOSEDSUM_ACTIVE Total Number of Subjects Dosed from Active Arm within a Site 11 DOSEDTOT_PBO Total Number of Subjects Dosed from Placebo Arm in the Study 12 DOSEDSUM_PBO Total Number of Subjects Dosed from Placebo Arm within a Site
Table 9. Twelve (12) Variables and Their Labels for AE, SAE, AE by Active Arm, and SAE by Active Arm, within a Study and within a Site
SITE ID
AE_ TOT
SAE_ TOT
AE_ SUM
SAE_ SUM
AE_ TOT_ ACTIVE
AE_ SUM_ ACTIVE
SAE_ TOT_ ACTIVE
SAE_ SUM_ ACTIVE
DOSED TOT_ ACTIVE
DOSED SUM_ ACTIVE
DOSED TOT_ PBO
DOSED SUM_ PBO
101 2188 114 152 8 1094 45 49 0 109 3 104 4 102 2188 114 64 6 1094 44 49 6 109 3 104 2 201 2188 114 30 1 1094 9 49 0 109 3 104 3 202 2188 114 76 2 1094 48 49 2 109 5 104 2 203 2188 114 143 2 1094 74 49 1 109 3 104 4 204 2188 114 63 3 1094 22 49 0 109 5 104 5 205 2188 114 86 2 1094 64 49 2 109 4 104 1 206 2188 114 22 0 1094 10 49 0 109 2 104 2 301 2188 114 67 5 1094 38 49 3 109 3 104 3 302 2188 114 108 14 1094 57 49 8 109 4 104 3 303 2188 114 18 0 1094 12 49 0 109 2 104 2 401 2188 114 31 0 1094 13 49 0 109 1 104 1 402 2188 114 8 1 1094 3 49 1 109 1 104 1
Display 10. An Example of Twelve (12) Variables for AE, SAE, AE by Active Arm, and SAE by Active Arm, within a Study and within a Site Table 10 shows that sixteen (16) are derived for the calculation of AE rate per site and study average, SAE rate per site and study average, AE deviation per site and study average, SAE deviation per site and study average, AE deviation per site and study average from active arm, and SAE deviation per site and study average from active arm. Display 11 and 12 provide an example of these twelve variables defined in Table 10.

Risk-Based Approach to Identifying and Selecting Clinical Sites for Sponsor’s Preparation for FDA/EMA Inspection, continued
10
Index New Variable Name New Variable Label Definition 1 AE_AVG Study Average Rate of
Adverse Events AE_TOT / DOSEDTOT
2 AE_RATE Adverse Event Rate Per Site AE_SUM / DOSEDSUM 3 SAE_AVG Study Average Rate of
Serious Adverse Events SAE_TOT / DOSEDTOT
4 SAE_RATE Serious Adverse Events Per Site
SAE_SUM / DOSEDSUM
5 EXPECT_AE Expected Non-Serious Adverse Events Per Site
DOSEDSUM * AE_AVG
6 EXPECT_SAE Expected Serious Adverse Events Per Site
DOSEDSUM * SAE_AVG
7 AE_DEVIATION Adverse Event Deviation Per Site
Round((NSAE_SUM – EXPECT_AE)**2 / EXPECT_AE),0.1)
8 SAE_DEVIATION Serious Adverse Event Deviation Per Site
Round((SAE_SUM- EXPECT_SAE)**2 / EXPECT_SAE),0.1)
9 AE_RATE_ACTIVE Adverse Event Rate from Active Arm Per Site
AE_SUM_ACTIVE / DOSEDSUM_ACTIVE
AE_RATE_PBO Adverse Event Rate from Placebo Arm Per Site
AE_SUM_ACTIVE / DOSEDSUM_PBO
10 SAE_RATE_ACTIVE Serious Adverse Event Rate from Active Arm Per Site
SAE_SUM_ACTIVE / DOSED
SAE_RATE_PBO Serious Adverse Event Rate from Placebo Arm Per Site
SAE_SUM_ACTIVE / DOSEDSUM_PBO
11 AE_AVG_ACTIVE Study Average Rate of Adverse Event Rate from Active Arm
AE_TOT_ACTIVE / DOSEDTOT_ACTIVE
12 EXPECT_AE_ACTIVE Expected Adverse Events from Active Arm Per Site
DOSEDSUM_ACTIVE * AE_AVG_ACTIVE
13 AE_DEVIATION_ ACTIVE Adverse Event Deviation from Active Arm Per Site
Round((AE_SUM _ACTIVE – EXPECT_AE_ACTIVE)**2 / EXPECT_AE_ACTIVE),0.1)
14 SAE_AVG_ACTIVE Study Average Rate of Serious Adverse Event Rate from Active Arm
SAE_TOT_ACTIVE / DOSEDTOT_ACTIVE
15 EXPECT_SAE_ACTIVE Expected Serious Adverse Events from Active Arm Per Site
DOSEDSUM_ACTIVE * SAE_AVG_ACTIVE
16 SAE_DEVIATION_ ACTIVE Serious Adverse Event Deviation from Active Arm Per Site
Round((SAE_SUM _ACTIVE – EXPECT_SAE_ACTIVE)**2 / EXPECT_SAE_ACTIVE),0.1)
Table 10. Sixteen (16) Variables for AE/SAE Rate Per Site and Study Average, AE/SAE Deviation Per Site and Study Average from Active Arm
SITEID AE_AVG AE_RATE SAE_AVG SAE_RATE EXPECT_AE EXPECT_SAE AE_ DEVIATION
SAE_ DEVIATION
101 10.3 21.7 0.54 1.14 72.1 3.78 88.5 4.7 102 10.3 12.8 0.54 1.2 51.5 2.7 3.0 4.0 201 10.3 5.0 0.54 0.17 61.8 3.24 16.4 1.5 202 10.3 10.9 0.54 0.29 72.1 3.78 0.2 0.8 203 10.3 20.4 0.54 0.29 72.1 3.78 69.7 0.8 204 10.3 6.3 0.54 0.3 103 5.4 15.5 1.1 205 10.3 17.2 0.54 0.4 51.5 2.7 23.1 0.2 206 10.3 5.5 0.54 0.0 41.2 2.16 8.9 2.2 301 10.3 11.2 0.54 0.83 61.8 3.24 0.4 1.0 302 10.3 15.4 0.54 2.0 72.1 3.78 17.9 27.6 303 10.3 4.5 0.54 0.0 41.2 2.16 13.1 2.2 401 10.3 15.5 0.54 0.0 20.6 1.08 5.3 1.1 402 10.3 4.0 0.54 0.5 20.6 1.08 7.7 0.0
Display 11. An Example of AE/SAE Rate Per Site and Study Average, AE/SAE Deviation

Risk-Based Approach to Identifying and Selecting Clinical Sites for Sponsor’s Preparation for FDA/EMA Inspection, continued
11
SITE ID
AE_ RATE_ ACTIVE
AE_ RATE_ PBO
SAE_ RATE_ ACTIVE
SAE_ RATE_ PBO
AE_ AVG_ ACTIVE
EXPECT_ AE_ ACTIVE
AE_ DEVIATION_ ACTIVE
SAE_ AVG_ ACTIVE
EXPECT_ SAE_ ACTIVE
SAE_ DEVIATION_ ACTIVE
101 15 26.8 0 2 10.04 30.1 7.4 0.45 1.4 1.4 102 14.7 10 2 0 10.04 30.1 6.4 0.45 1.4 15.1 201 3 7 0 0.3 10.04 30.1 14.8 0.45 1.4 1.4 202 9.6 14 0.4 0 10.04 50.2 0.1 0.45 2.3 0.0 203 24.7 17.3 0.3 0.3 10.04 30.1 64 0.45 1.4 0.1 204 4.4 8.2 0 0.6 10.04 50.2 15.8 0.45 2.3 2.3 205 16 22 0.5 0 10.04 40.2 14.1 0.45 1.8 0.0 206 5 6 0 0 10.04 20.1 5.1 0.45 0.9 0.9 301 12.7 9.7 1 0.7 10.04 30.1 2.1 0.45 1.4 1.8 302 14.3 17 2 2 10.04 40.2 7 0.45 1.8 21.4 303 6 3 0 0 10.04 20.1 3.3 0.45 0.9 0.9 401 13 18 0 0 10.04 10 0.9 0.45 0.5 0.5 402 3 5 1 0 10.04 10 4.9 0.45 0.5 0.5
Display 12. An Example of AE/SAE Rate by Arm Per Site and Study Average, AE/SAE Deviation by Active Arm Table 11 shows six (6) variables with their labels, which are derived from the decile rank of AE and SAE rates, deviation, and deviation by active arm per site. Their possible values are among 0, 1, 2, 3, 4, 5, 6, 7, 8, and 9. Value 0 indicates that the site had a decile of one (top 10%) of that variable within the study.
Index New Variable Name New Variable Label 1 R_AE_RATE A Decile Rank of Adverse Event Rate within the Study 2 R_SAE_RATE A Decile Rank of Serious Adverse Event Rate within the
Study 3 R_ AE_DEVIATION A Decile Rank of Adverse Event Deviation within the Study 4 R_ SAE_DEVIATION A Decile Rank of Serious Adverse Event Deviation within the
Study 5 R_ AE_DEVIATION_ACTIVE A Decile Rank of Adverse Event Deviation from Active Arm
within the Study 6 R_ SAE_DEVIATION_ACTIVE A Decile Rank of Serious Adverse Event Deviation from
Active Arm within the Study Table 11. Six Variables for Decile Rank of AE and SAE Rates, Deviation, and Deviation by Active Arm Per Site
SITEID R_AE_RATE R_SAE_RATE R_ AE_ DEVIATION
R_ SAE_ DEVIATION
R_ AE_ DEVIATION_ ACTIVE
R_ SAE_ DEVIATION_ ACTIVE
101 0 1 0 0 2 1 102 2 1 5 0 2 0 201 8 5 1 3 0 1 202 3 4 8 5 8 9 203 0 4 0 5 0 8 204 6 4 1 3 0 1 205 0 3 0 8 1 9 206 7 5 2 1 3 2 301 3 2 8 5 5 1 302 1 0 0 0 2 0 303 8 5 1 1 4 2 401 1 5 3 3 6 4 402 9 2 2 9 3 4
Display 13. An Example of Decile Rank of AE and SAE Rates, Deviation, and Deviation by Active Arm Per Site Table 12 shows eight (8) variables with their definitions, which are derived from the decile ranked rates, deviation, and deviation by active. They are binary variables with 0 and 1 as their possible values. Value 1 indicates that the site had the risk compared to other sites within the study for that risk factor.

Risk-Based Approach to Identifying and Selecting Clinical Sites for Sponsor’s Preparation for FDA/EMA Inspection, continued
12
Index New Variable Name Derivation Rule 1 TOP10_ AE_RATE 1 if R_AE_RATE=0; 0 else 2 BOTTOM10_AE_RATE 1 if R_AE_RATE is the biggest; 0 else 3 TOP10_SAE_RATE 1 if R_SAE_RATE=0; 0 else 4 BOTTOM10_SAE_RATE 1 if R_SAE_RATE is the biggest; 0 else 5 TOP10_AE_DEVIATION 1 if R_AE_DEVIATION =0; 0 else 6 TOP10_SAE_DEVIATION 1 if R_SAE_DEVIATION =0; 0 else 7 TOP10_AE_DEVIATION_ACTIVE 1 if R_AE_DEVIATION_ACTIVE =0; 0 else 8 TOP10_SAE_DEVIATION_ACTIVE 1 if R_SAE_DEVIATION_ACTIVE =0; 0 else
Table 12. Eight Binary Variables for Identifying the Risks Due to Safety Perspective
SITEID TOP10_ AE_ RATE
BOTTOM10_ AE_RATE
TOP10_SAE_ RATE
BOTTOM10_ SAE_RATE
TOP10_ AE_ DEVIATION
TOP10_SAE_ DEVIATION
TOP10_ AE_ DEVIATION_ ACTIVE
TOP10_SAE_ DEVIATION_ ACTIVE
101 1 0 0 0 1 1 0 0 102 0 0 0 0 0 1 0 1 201 0 0 0 0 0 0 1 0 202 0 0 0 1 0 0 0 0 203 1 0 0 1 1 0 1 0 204 0 0 0 1 0 0 1 0 205 1 0 0 0 1 0 0 0 206 0 0 0 0 0 0 0 0 301 0 0 0 0 0 0 0 0 302 0 0 1 0 1 1 0 1 303 0 0 0 0 0 0 0 0 401 0 0 0 0 0 0 0 0 402 0 1 0 0 0 0 0 0
Display 13. An Example of Eight Binary Variables for Identifying the Risks Due to Safety Perspective Table 13 shows two (2) variables and their definition, which are derived from the comparison of the rates per site with one from study average for AE and SAE. They are also binary variables with 0 and 1 as their possible values. Value 1 indicates that the site had the risk compared to other sites within the study for that risk factor.
Index New Variable Name New Variable Label Derivation Rule 1 HIGH_AE_RATE AE rate above study
average 1 If AE_RATE > AE_AVG 0 else
2 HIGH_SAE_RATE SAE rate above study average
1 If SAE_RATE > SAE_AVG 0 else
Table 13. Two Binary Variables for Identifying the Risks Due to AE/SAE Rate above Study Average
SITEID HIGH_AE_RATE HIGH_SAE_RATE SAFETY_RISK SAFETY_RISK_SCORE 101 1 1 5 50 102 1 1 4 40 201 0 0 1 10 202 1 0 2 20 203 1 0 5 50 204 0 0 2 20 205 1 0 3 30 206 0 0 0 0 301 1 1 2 20 302 1 1 6 60 303 0 0 0 0 401 1 0 1 10 402 0 0 1 10
Display 13. An Example of Two Binary Variables for Identifying the Risks Due to AE/SAE Rate above Study Average, Risk and Risk Scores Similar to the calculation of overall risk score due to study conduct, the summation of twelve (12) binary variables and the death flag with multiplication of their weights provides the total risk score on a 0-10 Scale

Risk-Based Approach to Identifying and Selecting Clinical Sites for Sponsor’s Preparation for FDA/EMA Inspection, continued
13
due to safety perspective, named the variable as SAFETY_RISK. Conversion of SAFETY_RISK into a score on a 100-point scale is performed by SAFETY_RISK_SCORE=100*(SAFETY_RISK / 10). The last two columns in Display 13 provide an example of number of risks and the corresponding risk scores due to the safety perspective.
PROPOSED RISK FACTORS FOR SITE SELECTION DUE TO EFFICACY Sites with anomalies of efficacy results have the high risk for FDA/EMA inspection. Table 14 shows the proposed risk factors to be considered for site preparation for FDA/EMA inspection due to efficacy perspective. Note: if study result is “positive”, the difference of Treatment Means (active arm and placebo arm) should be positive. Hence risk factor 4 and 5 are exclusive. Two variables: TRTEFFR (The efficacy result for each primary endpoint by treatment arm) and SITEEFFE (Site-Specific Efficacy Effect Size) in SLCS will be used to derive the risk score for each site within a study. Please refer to Display 3 as an example of these two variables. Display 14 shows an example of efficacy results from active arm and placebo arm, and their treatment difference by transposing SLCS for TRTEFFR.
Index Variable Risk Factor Description Rationale 1 TRTEFFR Top 10% Primary
Efficacy from Active Arm
Site had a decile of one (top 10%) for efficacy from active arm.
“Too good to be true”
2 TRTEFFR Bottom 10% Primary Efficacy from Placebo Arm
Site had a decile of ten (bottom 10%) for efficacy from placebo arm.
“Too bad to be true”
3 SITEEFFE “Bigger Contributor” to the Efficacy Result from Top 10% Sites
Site had a decile of one (top 10%) for Treatment difference between active arm and placebo.
“Too good to be true”
4 SITEEFFE “Bigger Contributor” to the Efficacy Result
Treatment difference between active arm and placebo above the study average
“Too good to be true”
5 SITEEFFE Contradictory to the Efficacy Results
Treatment difference between active arm and placebo being less than 0. i.e. Active arm was worse than placebo.
“Too bad to be true”
Table 14. Risk Factors for Efficacy Perspective
SITEID TRTEFFR_ACTIVE TRTEFFR_PBO SITEEFFE 101 -2.2 -0.9 -1.3 102 8.4 2.4 6 201 12.8 0.7 12.1 202 11.5 2.2 9.4 203 17.3 4.6 12.7 204 18.2 -2.4 20.5 205 6.2 -0.9 7.1 206 31.1 0.3 30.9 301 15.5 -2.7 18.3 302 9.4 -6.6 15.9 303 24.7 -3.6 28.3 401 4 4.8 -0.8 402 -11.2 -6.6 -4.6
Display 14. An Example of the Efficacy Results from Active Arm and Placebo Arm, and Their Treatment Difference Table 15 shows four (4) variables and their labels, which are derived from the decile rank of TRTEFFR by treatment arm and SITEEFFE: R_TRTEFFR_ACTIVE, R_TRTEFFR_PLACEBO, and R_SITEEFFE, whose possible values are among 0, 1, 2, 3, 4, 5, 6, 7, 8, and 9. The variable: SITEEFFE_AVG is the difference between the mean of efficacy from active arm and mean of efficacy from placebo arm within a study. Suppose that the primary endpoint is “absolute change from baseline in percent predicted forced expiratory volume in 1 second (%predicted FEV1) through Week 24”. From the standard summary table of primary endpoint by treatment group and visit one can have ACTIVE_AVG (mean of absolute change from baseline in predicted FEV1 at Week 24 from active arm) = 11.1093%, and PLACEBO_AVG (mean of absolute

Risk-Based Approach to Identifying and Selecting Clinical Sites for Sponsor’s Preparation for FDA/EMA Inspection, continued
14
change from baseline in predicted FEV1 at Week 24 from placebo arm) = -1.4172%. Hence SITEEFFE_AVG= ACTIVE_AVG - PLACEBO_AVG = 11.1093% - (-1.4172%)=12.5265%. We can use 12.5% to flag the sites with SITEEFFE > 12.5.
Index New Variable Name New Variable Label 1 R_TRTEFFR_ACTIVE A Decile Rank of TRTEFFR from Active Arm Per Site 2 R_TRTEFFR_PLACEBO A Decile Rank of TRTEFFR from Placebo Arm Per Site 3 R_SITEEFFE A Decile Rank of SITEEFFE Per Site 4 SITEEFFE_AVG Difference between Mean of Efficacy from Active Arm and Mean of
Efficacy from Placebo Arm within a Study Table 15. The Variables from the Decile Ranks of Efficacy Results from Active Arm and Placebo Arm, and Their Treatment Difference, Study Average of Treatment Difference Table 16 shows five (5) variables and their definition, which are derived from four variables in Table 15. They are also binary variables with 0 and 1 as their possible values. Value 1 indicates that the site had the risk compared to other sites within the study for that risk factor.
Index New Variable Name Derivation Rule 1 TOP10_EFF_ ACTIVE 1 if R_TRTEFFR_ACTIVE=0; 0 else 2 BOTTOM10_EFF_PLACEBO 1 if R_TRTEFFR_PLACEBO is the biggest; 0 else 3 TOP10_SITEEFFE 1 if R_SITEEFFE =0; 0 else 4 HIGH_SITEEFFE 1 if SITEEFFE > SITEEFFE_AVG; 0 else 5 LOW_SITEEFFE 1 if SITEEFFE < 0; 0 else
Table 16. Five Binary Variables for Identifying Sites with Risk from Efficacy Perspective Similar to the calculation of overall risk score due to study conduct, the summation of five (5) binary with multiplication of their weights provides the total risk score on a 0-4 Scale (Risk factor 4 and 5 are exclusive.) due to efficacy perspective, named the variable as EFF_RISK. Conversion of EFF_RISK into a score on a 100-point scale is performed by EFF_RISK_SCORE=100*(EFF_RISK / 4).
SITE ID
R_ TRT EFFR _ ACTIVE
R_ TRTEFFR_PLACEO
R_ SITE EFFE
SITE EFFE_ AVG
TOP10_ TRTEFF_ ACTIVE
BOTTOM10_TRTEFFR_PLACEBO
TOP10_ SITE EFFE
HIGH_ SITE EFFE
LOW_ SITE EFFE
EFF_ RISK
EFF_ RISK_ SCORE
101 9 5 8 12.5 0 0 0 0 1 1 25 102 5 2 6 12.5 0 0 0 0 0 0 0 201 3 4 4 12.5 0 0 0 0 0 0 0 202 3 3 5 12.5 0 0 0 0 0 0 0 203 1 1 3 12.5 0 0 0 1 0 1 25 204 1 7 1 12.5 0 0 0 1 0 1 25 205 6 5 5 12.5 0 0 0 0 0 0 0 206 0 4 0 12.5 1 0 1 1 0 3 75 301 2 7 1 12.5 0 0 0 1 0 1 25 302 4 9 2 12.5 0 1 0 1 0 2 50 303 0 7 0 12.5 1 0 1 1 0 3 75 401 8 1 8 12.5 0 0 0 0 1 1 25 402 9 9 9 12.5 0 1 0 0 1 2 50
Display 15. An Example of Variables Defined in Table 15 and Table 16, Risks, and Scores CALCULATE OVERALL RISK SCORE So far we have illustrated twenty-nine (29) risk factors and their calculation of risk score related to three categories: study conduct, safety perspective, and efficacy perspective, whose risk score is TC_RISK_SCORE, SAFETY_RISK_SCORE, and EFF_RISK_SCORE, respectively. Similar to the calculation of risk score for each category, the specification of weights to the three risk categories is the most critical now, because the different weights make the different risk scores to each site. Who should make the decision? It is an open question. In our application to cystic fibrosis FDA submission, we used two different weights. One is equal weight, and another are 0.5, 0.3, 0.2 to three categories, respectively.

Risk-Based Approach to Identifying and Selecting Clinical Sites for Sponsor’s Preparation for FDA/EMA Inspection, continued
15
1. TOTAL_RISK_SCORE = (TC_RISK_SCORE + SAFETY_RISK_SCORE + EFF_RISK_SCORE)/3 on 0-100 scale
2. WEIGHTED_TOTAL_RISK_SCORE = (0.5*TC_RISK_SCORE + 0.3*SAFETY_RISK_SCORE + 0.2*EFF_RISK_SCORE) on 0-100 scale
Readers can choose their own weights per the company’s clinical study team decision and inputs.
SITEID TC_RISK_ SCORE
SAFETY_RISK_ SCORE
EFF_RISK_ SCORE
TOTAL_RISK_ SCORE
WEIGHTED_TOTAL_ RISK_SCORE
101 57.1 50 25 44.0 48.6 102 35.7 40 0 25.2 29.9 201 64.3 10 0 24.8 35.1 202 64.3 20 0 28.1 38.1 203 57.1 50 25 44.0 48.6 204 64.3 20 25 36.4 43.1 205 50.0 30 0 26.7 34.0 206 42.9 0 75 39.3 36.4 301 64.3 20 25 36.4 43.1 302 64.3 60 50 58.1 60.1 303 35.7 0 75 36.9 32.9 401 28.6 10 25 21.2 22.3 402 21.4 10 50 27.1 23.7
Display 16. An Example of Risk Scores from Trial Conduct, Safety Perspective, Efficacy Perspective, Total Risk Score, and Weighted Total Risk Score SELECT SITES WITH THE HIGH RISK SCORE FOR SPONSOR’S PREPARATION FOR FDA/EMA INSPECTION Rank the sites’ total risk scores to quartiles, and select the sites with their total risk score in first quartile for the sponsor’s preparation for FDA/MAD inspection. We have two different total risk scores from equal weight and weights with 0.5, 0.3, and 0.2 to three categories, respectively. Table 17 provides five (5) variables and their derivation rules for selecting sites with high overall risks within a study.
Index New Variable Name Derivation Rule 1 RQ_TOTAL_RISK_
SCORE The quartile of Variable TOTAL_RISK_SCORE
2 RQ_WEIGHTED_TOTAL_ RISK_SCORE
The quartile of Variable WEIGHTED_TOTAL_RISK_SCORE
3 SELECTED_FROM_ TOTAL_ RISK_SCORE
Y if RQ_TOTAL_RISK_SCORE=0;N else
4 SELECTED_FROM_ WEIGHTED_TOTAL_ RISK_SCORE
Y if RQ_ WEIGHTED_TOTAL_RISK_SCORE=0;N else
5 SELECTED Y if SELECTED_FROM_TOTAL_RISK_SCORE=’Y’ or SELECTED_FROM_ WEIGHTED_TOTAL_RISK_SCORE =’Y’ or DEATH>=1; N else
Table 17. Variables and Their Derivations for Selecting Sites with High Overall Risks within A Study The site will be flagged as a risk if there is any death during the study.
SITEID RQ_TOTAL_ RISK_ SCORE
RQ_WEIGHTED_ TOTAL_ RISK_SCORE
SELECTED_ FROM_TOTAL_ RISK_SCORE
SELECTED_FROM_ WEIGHTED_TOTAL_ RISK_SCORE
SELECTED
101 0 0 Y Y Y 102 1 1 N N N 201 1 0 N Y Y 202 1 0 N Y Y 203 0 0 Y Y Y 204 0 0 Y Y Y

Risk-Based Approach to Identifying and Selecting Clinical Sites for Sponsor’s Preparation for FDA/EMA Inspection, continued
16
205 1 0 N Y Y 206 0 0 Y Y Y 301 0 0 Y Y Y 302 0 0 Y Y Y 303 0 1 Y N Y 401 1 2 N N N 402 1 2 N N N
Display 17. An Example of for Selecting Sites with High Overall Risks within A Study PROPOSED METHODS FOR TRIAL LOCATION: CALCULATE THE PROBABILITY OF EACH SITE PER HISTORICAL DATA So far all sites are considered equally in terms of the probability of being selected for sponsor’s preparation for FDA/EMA inspection, which is equal to 1 / (total number of sites within a study). Per historical data [3], US sites have 2.7 times likelihood of being selected for inspections as other foreign sites. The calculated overall risk score of each site should be adjusted if there are both US sites and foreign sites in the study. The adjusted probability of a site being chosen for FDA inspection will be applied if there are both US sites and foreign sites in the study. The new variables and their derivation rules for this calculation are shown in Table 18. Display 18 shows an example of these new variables from a study.
Variable Name
Variable Label
Derivation Rule
NUM_SITES Number of Sites within the Country
Sum of the numbers of sites within the country
ADJ_NUM_SITES Adjusted Number of Sites within the Country
2.7* NUM_SITES if Country of sites is US; NUM_SITES else
TOTSITES Total Number of Sites within the Study
Sum of NUM_SITES across all countries
ADJ_TOTSITES Adjusted Total Number of Sites within the Study
Sum of ADJ_NUM_SITES across all countries
ADJ_PROB_COUNTRY Adjusted Probability of the Country Being Chosen
ADJ_NUM_SITES / ADJ_TOTSITES
ADJ_PROB_EACH_SITE Adjusted Probability of a Site Being Chosen
ADJ_PROB_COUNTRY / NUM_SITES
PROB_EACH_SITE Probability of a Site Being Chosen
1 / TOTSITES Note: it is for comparison with ADJ_PROB_EACH_SITE.
Table 18. Variables and Derivation Rules for Adjusted Probabilities of a Site Being Chosen from FDA for Inspection
COUNTY NUM_ SITES
ADJ_NUM _SITES
TOTSITES ADJ_ TOTSITES
ADJ_ PROB_ COUNTY
ADJ_PRO_EACH_ SITE
PROB_ EACH_ SITE
AU 7 7 68 144.5 0.0484 0.0069 0.0147 CA 5 13.5 68 144.5 0.0934 0.0187 0.0147 CZ 1 1 68 144.5 0.0069 0.0069 0.0147 DE 5 5 68 144.5 0.0346 0.0069 0.0147 FR 3 3 68 144.5 0.0208 0.0069 0.0147 IE 5 5 68 144.5 0.0346 0.0069 0.0147 UK 2 2 68 144.5 0.0138 0.0069 0.0147 US 40 108 68 144.5 0.7474 0.0187 0.0147
Display 18. An Example of Sites from US and Foreign Countries with Their Adjusted Probabilities of A Site Being Chosen from FDA for Inspection

Risk-Based Approach to Identifying and Selecting Clinical Sites for Sponsor’s Preparation for FDA/EMA Inspection, continued
17
ADJUST TOTAL RISK SCORE OF EACH SITE PER HISTORICAL DATA Total Risk Score and Weighted Total Risk Score can be adjusted by multiplication of adjusted probability of each site to them as shown in Table 19 below. The four variables: R_ TOTAL_RISK_SCORE, R_ADJ_TOTAL_RISK_SCORE, R_ WEIGHTED_TOTAL_RISK_SCORE, R_ADJ_WEIGHTED_TOTAL_RISK_SCORE are obtained by ranking each risk score within the study, respectively. They are created for “monitoring” the changes of orders within the study for each total risk score. Display 20 provides the example of total risk score, weighted total risk score, and their adjusted scores. It also shows that changes of rankings of these four total risk scores.
Variable Name
Derivation Rule
ADJ_TOTAL_RISK_SCORE 100 * ADJ_PROB_EACH_SITE * TOTAL_RISK_SCORE ADJ_WEIGHTED_TOTAL_RISK_SCORE 100 * ADJ_PROB_EACH_SITE *
WEIGHTED_TOTAL_RISK_SCORE R_ TOTAL_RISK_SCORE The rank of TOTAL_RISK_SCORE R_ADJ_TOTAL_RISK_SCORE The rank of ADJ_TOTA_RISK_SCORE R_ WEIGHTED_TOTAL_RISK_SCORE The rank of WEIGHTED_TOTAL_RISK_SCORE R_ADJ_WEIGHTED_TOTAL_RISK_SCORE The rank of ADJ_WEIGHTED_TOTAL_RISK_SCORE
Table 19. Variables and Their Derivation Rules for Adjusted Risk Scores and Their Ranking Variables
SITE ID
COUN TRY
ADJ_ PROB_ EACH_SITE
TOTAL_ RISK_ SCORE
ADJ_ TOTAL_ RISK_ SCORE
WEIGHTED_ TOTAL_ RISK_ SCORE
ADJ_ WEIGHTED_ TOTAL_ RISK_ SCORE
R_ TOTAL_ RISK_ SCORE
R_ ADJ_ TOTAL_ RISK_ SCORE
R_ WEIGHTED_ TOTAL_ RISK_ SCORE
R_ ADJ_ WEIGHTED_ TOTAL_ RISK_ SCORE
101 US 0.01698112 44 74.8 48.6 82.5 5 4 2 1 102 US 0.01698112 25.2 42.9 29.9 50.7 30 27 20 15 201 IE 0.00628938 24.8 15.6 35.1 22.1 31 17 60 58 202 DE 0.00628938 28.1 17.7 38.1 24 23 12 58 57 203 US 0.01698112 44 74.8 48.6 82.5 5 4 2 1 204 UK 0.00628938 36.4 22.9 43.1 27.1 12 7 46 52 205 US 0.01698112 26.7 45.3 34 57.7 27 19 17 10 206 US 0.01698112 39.3 66.7 36.4 61.9 9 14 5 6 301 AU 0.00628938 36.4 22.9 43.1 27.1 12 7 46 52 302 AU 0.00628938 58.1 36.5 60.1 37.8 1 1 23 32 303 FR 0.00628938 36.9 23.2 32.9 20.7 11 22 45 59 401 US 0.01698112 21.2 36 22.3 37.8 36 47 25 31 402 US 0.01698112 27.1 46.1 23.7 40.3 25 45 15 29
Display 19. An Example of Total Risk Score, Weighted Total Risk Score, and Their Adjusted Scores FLAG THE SITES ON TOP 25% OF ADJUSTED RISK TOTAL SCORE OR ADJUSTED WEIGHTED TOTAL RISK SCORE Similar to the selections of risk sites from total risk score and weighted total risk score, Table 20 defines the quartiles of adjusted total risk score and weighted total risk score, the flags for selecting sites with high risk sites for FDA/EMA inspection preparation. Display 20 provides an example of these five variables.
Variable Name
Derivation Rule
RQ_ADJ_TOTAL_RISK_ SCORE
The quartile of Variable ADJ_TOTAL_RISK_ SCORE
RQ_ADJ_WEIGHTED_TOTAL_RISK_ SCORE
The quartile of Variable ADJ_WEIGHTED_TOTAL_RISK_ SCORE
SELECTED_FROM_ADJUSTED_ TOTAL_RISK_SCORE
Y if RQ_ADJ_TOTAL_RISK_ SCORE=0; N else
SELECTED_FROM_ ADJUSTED_ WEIGHTED_TOTAL_RISK_SCORE
Y if RQ_ADJ_WEIGHTED_TOTAL_RISK_ SCORE=0; N else
SELECTED_FROM_ ADJUSTED Y if SELECTED_FROM_ADJUSTED_TOTAL_RISK_SCORE=Y or SELECTED_FROM_ADJUSTED_WEIGHTED_TOTAL_RISK_SCORE=Y; N else

Risk-Based Approach to Identifying and Selecting Clinical Sites for Sponsor’s Preparation for FDA/EMA Inspection, continued
18
Table 20. Variables for the Quartiles of Both Adjusted Total Risk Score and Adjusted Weighted Total Risk Score, and for Selecting the Sites for FDA/EMA Inspection.
SITEID RQ_ADJ_ TOTAL_ RISK_ SCORE
RQ_ ADJ_ WEIGHTED_ TOTAL_ RISK_ SCORE
SELECTED_FROM_ ADJUSTED_ TOTAL_ RISK_SCORE
SELECTED_FROM_ ADJUSTED_ WEIGHTED_ TOTAL_ RISK_SCORE
SELECTED_ FROM_ ADJUSTED
101 0 0 Y Y Y 102 1 0 N Y Y 201 3 2 N N N 202 2 2 N N N 203 0 0 Y Y Y 204 2 2 N N N 205 0 0 Y Y Y 206 0 0 Y Y Y 301 2 2 N N N 302 1 1 N N N 303 2 2 N N N 401 1 1 N N N 402 0 1 Y N Y
Display 20. An Example of the Quartiles of Both Adjusted Total Risk Score and Adjusted Weighted Total Risk Score, and for Selecting the Sites for FDA/EMA Inspection. PRESENT ALL RESULTS All results from four total risk scores should be presented. The final selection will be based on all four results. The new variable: FINAL_SELECTED will flag the sites with the high risk sites if any of the four variables identifying the sites with high risk. Display 21 provides an example of all results for final selection of sites for FDA/EMA inspection preparation.
SITE ID
SELECTED_ FROM_ TOTAL_ RISK_ SCORE
SELECTED_ FROM_ WEIGHTED_ TOTAL_ RISK_ SCORE
SELECTED SELECTED_ FROM_ ADJUSTED_ TOTAL_ RISK_SCORE
SELECTED_ FROM_ ADJUSTED_ WEIGHTED_ TOTAL_ RISK_ SCORE
SELECTED_ FROM_ ADJUSTED
FINAL_ SELECTED
101 Y Y Y Y Y Y Y 102 N N N N Y Y Y 201 N Y Y N N N Y 202 N Y Y N N N Y 203 Y Y Y Y Y Y Y 204 Y Y Y N N N Y 205 N Y Y Y Y Y Y 206 Y Y Y Y Y Y Y 301 Y Y Y N N N Y 302 Y Y Y N N N Y 303 Y N Y N N N Y 401 N N N N N N N 402 N N N Y N Y Y
Display 21. An Example of All Results for Final Selection HOW RELIABLE OF THE METHODOLOGY? The above method was applied retrospectively to a hepatitis C FDA/EMA submission. There were 123 sites in a pivotal study. It selected thirty-six (36) sites out of one hundred and twenty-six (123) sites (30%). Five sites among them were inspected by FDA and EMA. It was also prospectively applied to a cystic fibrosis FDA/EMA submission. There were seventy-four (74) sites from two pivotal studies. The results from each individual study, and pooling of these two studies were presented to Clinical Operations who were leading

Risk-Based Approach to Identifying and Selecting Clinical Sites for Sponsor’s Preparation for FDA/EMA Inspection, continued
19
for agency inspection preparation. Thirty-five (35) sites (47%) were identified as high risk sites. Clinical Operations and Quality Assurance together made the final lists and selected eight (8) sites as Tier 1 and three (3) sites as Tier 2 out of these 35 sites for preparation of FDA/EMA inspection. Two (2) sites from Tier 1 were inspected by FDA later. CONCLUSION This paper explores the risk-based methodology by analyzing summary level clinical site (SLCS) dataset to identify and select high risk sites to assist the sponsor in preparation for FDA/EMA inspection. The proposed risk factors and statistical methods would serve as the reference for the readers when you are working on analyzing SLCS for FDA/EMA inspection.
REFERENCES [1] Guidance for Industry: Providing Submissions in Electronic Format — Summary Level Clinical Site Data for CDER’s Inspection Planning http://www.fda.gov/downloads/Drugs/DevelopmentApprovalProcess/FormsSubmissionRequirements/UCM332468.pdf
[2] Specifications for Preparing and Submitting Summary Level Clinical Site Data for CDER’s Inspection Planning
http://www.fda.gov/downloads/Drugs/DevelopmentApprovalProcess/FormsSubmissionRequirements/ucm332466.pdf
[3] Challenges to FDA’s Ability to Monitor and Inspect Foreign Clinical Trials
http://oig.hhs.gov/oei/reports/oei-01-08-00510.pdf
[4] The Food and Drug Administration’s Oversight of Clinical Trials, September 2007
http://oig.hhs.gov/oei/reports/oei-01-06-00160.pdf
[5] Xiangchen (Bob) Cui; Experiences in Preparing Summary Level Clinical Site Data within NDA’s Submission for FDA’s Inspection Planning. Proceedings of the Pharmaceutical SAS® Users Group Conference, PharmaSUG 2013
ACKNOWLEDGMENTS Appreciation goes to John Jiang and Mei-Hsiu Ling for their valuable review and comments.
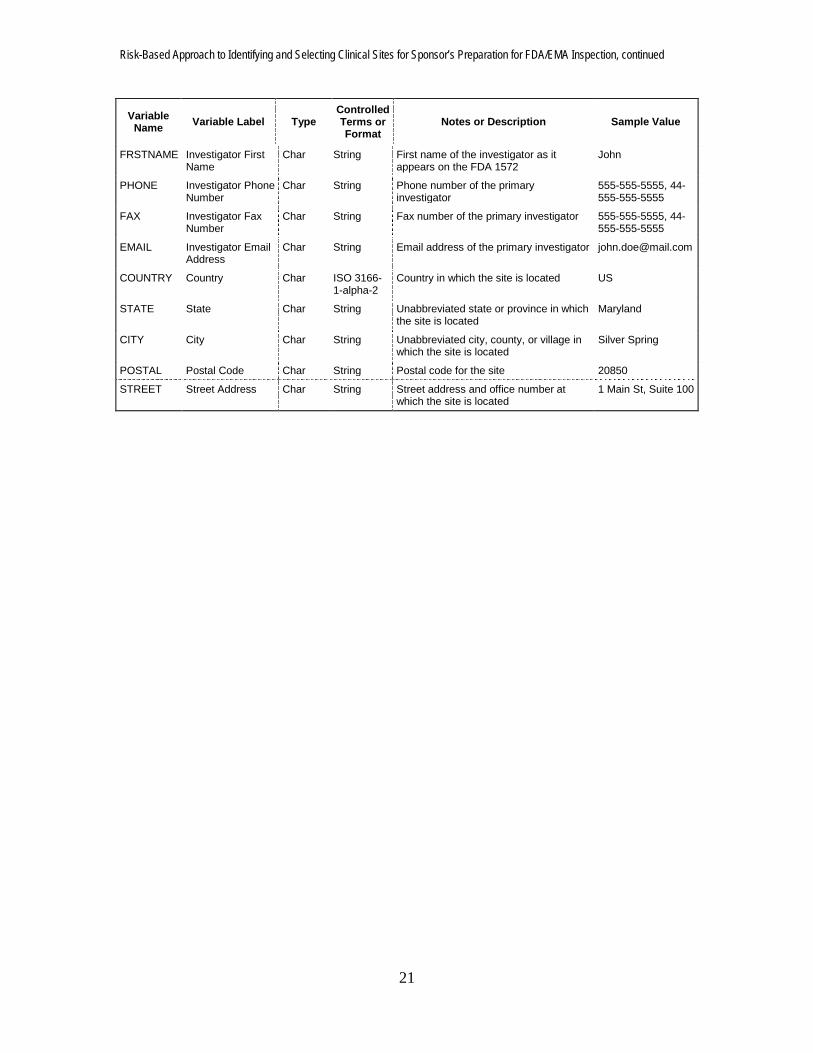
CONTACT INFORMATION Your comments and questions are valued and encouraged. Contact the author at: Name: Xiangchen (Bob) Cui, Ph.D. Enterprise: Alkermes, Inc. Address: 852 Winter Street City, State ZIP: Waltham, MA 02451 Work Phone: 781-609-6038 Fax: 617-460-8060 E-mail: [email protected] SAS and all other SAS Institute Inc. product or service names are registered trademarks or trademarks of SAS Institute Inc. in the USA and other countries. ® indicates USA registration. Other brand and product names are trademarks of their respective companies. Appendix A: Summary Level Clinical Site Data Elements

Risk-Based Approach to Identifying and Selecting Clinical Sites for Sponsor’s Preparation for FDA/EMA Inspection, continued
20
Variable Name Variable Label Type
Controlled Terms or Format
Notes or Description Sample Value
IND IND Number Num/Char 6 digit identifier
FDA identification number for investigational new drug
010010
TRIAL Trial Number Char String Study or Trial identification number ABC-123
SITEID Site ID Num/Char String Investigator site identification number 50
ARM Treatment Arm Num/Char String Plain text label for the treatment arm as referenced in the clinical study report (limit 200 characters)
Active (e.g. 25mg), Comparator drug product name (e.g. Drug x), or Placebo
ENROLL Number of Subjects Enrolled
Num Integer Total number of subjects enrolled at a given site
20
SCREEN Number of Subjects Screened
Num Integer Total number of subjects screened at a given site
100
DISCONT Number of Subject Discontinuations
Num Integer Number of subjects discontinuing from the study after being enrolled at a site
5
ENDPOINT Endpoint Char String Plain text label used to describe the primary endpoint as described in the Define file included with each application. (limit 200 characters)
Average increase in blood pressure
ENDPTYPE Endpoint Type Char String Variable type of the primary endpoint (i.e., continuous, discrete, time to event, or other)
Continuous
TRTEFFR Treatment Efficacy Result
Num Floating Point
The efficacy result for each primary endpoint, by treatment arm
0, 0.25, 1, 100
TRTEFFV Treatment Efficacy Result Variance
Num
Floating Point
The variance of the efficacy result (TRTEFFR) for each primary endpoint, by treatment arm
0, 0.25, 1, 100
SITEEFFE Site-Specific Efficacy Effect Size
Num Floating Point
The effect size should be the same representation as reported for the primary efficacy analysis
0, 0.25, 1, 100
SITEEFFV Site-Specific Efficacy Effect Size Variance
Num Floating Point
The variance of the site-specific efficacy effect size (SITEEFFE)
0.065
CENSOR Censored Observations
Num Integer The number of censored observations for the given site and treatment
5
NSAE Number of Non-Serious Adverse Events
Num Integer Total number of non-serious adverse events at a given site. This value should include multiple events per subject.
10
SAE Number of Serious Adverse Events
Num Integer Total number of serious adverse events excluding deaths at a given site. This value should include multiple events per subject.
5
DEATH Number of Deaths Num Integer Total number of deaths at a given site 1
PROTVIOL Number of Protocol Violations
Num
Integer Number of deviations from the protocol noted by the sponsor for a given site. This value should include multiple violations per subject.
20
FINLDISC Financial Disclosure Amount
Num Integer Total financial disclosure amount ($USD) by the site investigator
50000.00
LASTNAME Investigator Last Name
Char String Last name of the investigator as it appears on the FDA 1572
Doe
Risk-Based Approach to Identifying and Selecting Clinical Sites for Sponsor’s Preparation for FDA/EMA Inspection, continued
21
Variable Name Variable Label Type
Controlled Terms or Format
Notes or Description Sample Value
FRSTNAME Investigator First Name
Char String First name of the investigator as it appears on the FDA 1572
John
PHONE Investigator Phone Number
Char String Phone number of the primary investigator
555-555-5555, 44-555-555-5555
FAX Investigator Fax Number
Char String Fax number of the primary investigator 555-555-5555, 44-555-555-5555
EMAIL Investigator Email Address
Char String Email address of the primary investigator [email protected]
COUNTRY Country Char ISO 3166-1-alpha-2
Country in which the site is located US
STATE State Char String Unabbreviated state or province in which the site is located
Maryland
CITY City Char String Unabbreviated city, county, or village in which the site is located
Silver Spring
POSTAL Postal Code Char String Postal code for the site 20850
STREET Street Address Char String Street address and office number at which the site is located
1 Main St, Suite 100