risk-based indicators of canadians exposures to environmental
TRANSCRIPT
Setton et al. Environmental Health 2013, 12:15http://www.ehjournal.net/content/12/1/15
RESEARCH Open Access
Risk-based indicators of Canadians’ exposures toenvironmental carcinogensEleanor Setton1*, Perry Hystad2, Karla Poplawski1, Roslyn Cheasley1, Alejandro Cervantes-Larios3, C Peter Keller1
and Paul A Demers4
Abstract
Background: Tools for estimating population exposures to environmental carcinogens are required to supportevidence-based policies to reduce chronic exposures and associated cancers. Our objective was to developindicators of population exposure to selected environmental carcinogens that can be easily updated over time, andallow comparisons and prioritization between different carcinogens and exposure pathways.
Methods: We employed a risk assessment-based approach to produce screening-level estimates of lifetime excesscancer risk for selected substances listed as known carcinogens by the International Agency for Research on Cancer.Estimates of lifetime average daily intake were calculated using population characteristics combined withconcentrations (circa 2006) in outdoor air, indoor air, dust, drinking water, and food and beverages from existingmonitoring databases or comprehensive literature reviews. Intake estimates were then multiplied by cancer potencyfactors from Health Canada, the United States Environmental Protection Agency, and the California Office ofEnvironmental Health Hazard Assessment to estimate lifetime excess cancer risks associated with each substanceand exposure pathway. Lifetime excess cancer risks in excess of 1 per million people are identified as potentialpriorities for further attention.
Results: Based on data representing average conditions circa 2006, a total of 18 carcinogen-exposure pathwayshad potential lifetime excess cancer risks greater than 1 per million, based on varying data quality. Carcinogenswith moderate to high data quality and lifetime excess cancer risk greater than 1 per million included benzene, 1,3-butadiene and radon in outdoor air; benzene and radon in indoor air; and arsenic and hexavalent chromium indrinking water. Important data gaps were identified for asbestos, hexavalent chromium and diesel exhaust inoutdoor and indoor air, while little data were available to assess risk for substances in dust, food and beverages.
Conclusions: The ability to track changes in potential population exposures to environmental carcinogens overtime, as well as to compare between different substances and exposure pathways, is necessary to supportcomprehensive, evidence-based prevention policy. We used estimates of lifetime excess cancer risk as indicatorsthat, although based on a number of simplifying assumptions, help to identify important data gaps and prioritizemore detailed data collection and exposure assessment needs.
Keywords: Canada, Risk, Carcinogens, Cancer, Environment, Air, Food, Dust, Water, Beverages, Policy
* Correspondence: [email protected] of Geography, University of Victoria, Victoria, BC, CanadaFull list of author information is available at the end of the article
© 2013 Setton et al.; licensee BioMed Central Ltd. This is an Open Access article distributed under the terms of the CreativeCommons Attribution License (http://creativecommons.org/licenses/by/2.0), which permits unrestricted use, distribution, andreproduction in any medium, provided the original work is properly cited.

Setton et al. Environmental Health 2013, 12:15 Page 2 of 13http://www.ehjournal.net/content/12/1/15
BackgroundThe International Agency for Research on Cancer hasidentified one hundred and nine environmental factorsthat can increase cancer risk in humans, including arange of chemicals and complex mixtures, exposure cir-cumstances (i.e., certain occupations), physical agents(i.e., solar radiation), biological agents (i.e., certainviruses) and lifestyle factors (i.e., tobacco smoking) [1,2].Estimates of the proportion of cancers due to environ-mental exposures (defined in this article as pollution orcontamination) range from <1% to 29% [3-5], and asthese exposures are typically considered to be modifi-able, reducing or eliminating exposures presents an op-portunity to decrease future cancer incidence. It hasfurther been suggested that the contribution of exposureto low levels of carcinogens in the environment to over-all cancer burden has been underestimated, and that anew prevention paradigm is needed that recognizes can-cer is caused by multiple interacting factors, and there-fore we should limit exposures to avoidable environmentaland occupational carcinogens, in combination with otherfactors such as diet and lifestyle [6].In 2007, in response to recommendations from its Na-
tional Committee on Environmental and OccupationalExposures [7] and external organizations, such as theCanadian Cancer Society, the Canadian Partnershipagainst Cancer (CPAC) funded the CARcinogen EXpos-ure (CAREX) Canada project as part of its primary pre-vention efforts. The goal of CAREX Canada is todevelop and implement exposure surveillance methodsfor a range of known or suspected carcinogens. CAREXCanada includes an occupational component that buildsoff the original CAREX project developed by IARC andthe Finnish Institute for Occupational Health [8], and anon-occupational component, which we identify as ‘en-vironmental’. For some key lifestyle risk factors (e.g. diet,physical activity and smoking) estimates of prevalenceand trends over time in the general population exist inCanada, for example through national health surveys [9].For other risk factors, however, such as exposures tochemical and physical agents, these fundamental aspectsof the cancer control spectrum are not well developed[10]. The CAREX Canada environmental indicatorstherefore focus on carcinogens present in outdoor air,indoor air, indoor dust, drinking water, and foods andbeverages (note: exposures via dermal absorption are notincluded due to a pervasive lack of data on concentra-tion and product use/frequency of exposure levels). Thescope of CAREX Canada does not include the collectionof primary data. Efforts therefore focus on using existingdata only. This distinguishes CAREX Canada from ex-posure surveillance programs that take an active individ-ual monitoring approach, for example the National DoseRegistry [11].
In keeping with the population-level focus of theCAREX mandate, we developed three guiding principlesfor developing indicators for surveillance of exposures toenvironmental carcinogens in Canada: (1) indicatorsshould be based on regularly collected and availabledata, supporting ongoing surveillance over time; (2) indi-cators should consider a range of environmental media,including outdoor air, indoor air or dust, drinking water,and food and beverages; and, (3) indicators should allowfor comparisons among substances, exposure pathways,populations and geographic locations in order to supportprioritization and targeted prevention efforts.We adopted a risk-based approach, requiring the cal-
culation of lifetime average daily intake by major expos-ure routes, and the associated potential lifetime excesscancer risk (LECR). A risk-based approach was chosento allow comparisons between substances and exposurepathways and to provide an indicator that is readily in-terpretable by a wide range of stakeholders. Figure 1provides a simplified schematic of the required inputdata and typical sources, which are further describedbelow.Other methods for risk-based ranking also exist. Our
approach of estimating average daily intake is similar tothe assessments conducted under the Canadian Environ-mental Protection Act (CEPA); however, the CEPA dailyintake estimates are not converted to lifetime excesscancer risk, but are used to develop a “priority for ac-tion” ranking when the substance is considered to becarcinogenic [12]. We chose to use potential excess life-time risk as it seems more intuitively understandable,and under the right circumstances (i.e., same targetorgan and form of cancer), risk estimates may be addedto reflect cumulative exposure risks [13].The limitations of the cancer potency factors employed
here include the extrapolation of experimental resultsobserved in animals exposed to high doses to humansgenerally exposed to low doses, the assumption of a linearrelationship between dose and response, and the assump-tion of no effect threshold. Ongoing research continuallyprovides new information on the validity of these assump-tions [14-16]. For example, there is increasing evidencethat the dose–response relationship for a number of sub-stances (including diesel engine exhaust, formaldehyde,lead, nickel and TCDD), may be hormetic, that is, “u- or j-shaped”, indicating different effects depending on the ex-posure level [17]. An alternative to using cancer potencyfactors is to use concentration-response (CR) functionsfrom published human epidemiology studies. These wouldtypically have smaller uncertainties than cancer potencyfactors based on interspecies extrapolation; however, CRfunctions have been developed for relatively few sub-stances and exposure routes (primarily criteria air pollu-tants in air), which would have greatly limited comparison
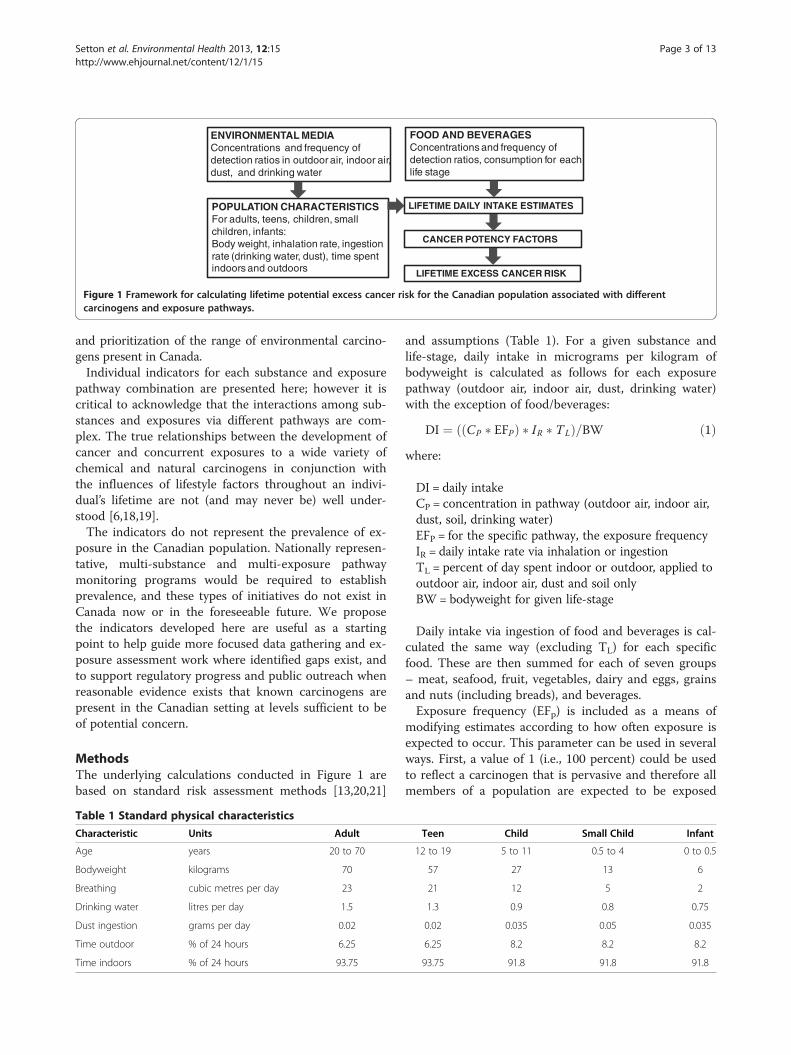
POPULATION CHARACTERISTICSFor adults, teens, children, small children, infants:Body weight, inhalation rate, ingestion rate (drinking water, dust), time spent indoors and outdoors
ENVIRONMENTAL MEDIAConcentrations and frequency of detection ratios in outdoor air, indoor air, dust, and drinking water
FOOD AND BEVERAGESConcentrations and frequency of detection ratios, consumption for each life stage
CANCER POTENCY FACTORS
LIFETIME DAILY INTAKE ESTIMATES
LIFETIME EXCESS CANCER RISK
Figure 1 Framework for calculating lifetime potential excess cancer risk for the Canadian population associated with differentcarcinogens and exposure pathways.
Setton et al. Environmental Health 2013, 12:15 Page 3 of 13http://www.ehjournal.net/content/12/1/15
and prioritization of the range of environmental carcino-gens present in Canada.Individual indicators for each substance and exposure
pathway combination are presented here; however it iscritical to acknowledge that the interactions among sub-stances and exposures via different pathways are com-plex. The true relationships between the development ofcancer and concurrent exposures to a wide variety ofchemical and natural carcinogens in conjunction withthe influences of lifestyle factors throughout an indivi-dual’s lifetime are not (and may never be) well under-stood [6,18,19].The indicators do not represent the prevalence of ex-
posure in the Canadian population. Nationally represen-tative, multi-substance and multi-exposure pathwaymonitoring programs would be required to establishprevalence, and these types of initiatives do not exist inCanada now or in the foreseeable future. We proposethe indicators developed here are useful as a startingpoint to help guide more focused data gathering and ex-posure assessment work where identified gaps exist, andto support regulatory progress and public outreach whenreasonable evidence exists that known carcinogens arepresent in the Canadian setting at levels sufficient to beof potential concern.
MethodsThe underlying calculations conducted in Figure 1 arebased on standard risk assessment methods [13,20,21]
Table 1 Standard physical characteristics
Characteristic Units Adult
Age years 20 to 70
Bodyweight kilograms 70
Breathing cubic metres per day 23
Drinking water litres per day 1.5
Dust ingestion grams per day 0.02
Time outdoor % of 24 hours 6.25
Time indoors % of 24 hours 93.75
and assumptions (Table 1). For a given substance andlife-stage, daily intake in micrograms per kilogram ofbodyweight is calculated as follows for each exposurepathway (outdoor air, indoor air, dust, drinking water)with the exception of food/beverages:
DI ¼ CP � EFPð Þ � IR � TLð Þ=BW ð1Þwhere:
DI = daily intakeCP = concentration in pathway (outdoor air, indoor air,dust, soil, drinking water)EFP = for the specific pathway, the exposure frequencyIR = daily intake rate via inhalation or ingestionTL = percent of day spent indoor or outdoor, applied tooutdoor air, indoor air, dust and soil onlyBW = bodyweight for given life-stage
Daily intake via ingestion of food and beverages is cal-culated the same way (excluding TL) for each specificfood. These are then summed for each of seven groups– meat, seafood, fruit, vegetables, dairy and eggs, grainsand nuts (including breads), and beverages.Exposure frequency (EFp) is included as a means of
modifying estimates according to how often exposure isexpected to occur. This parameter can be used in severalways. First, a value of 1 (i.e., 100 percent) could be usedto reflect a carcinogen that is pervasive and therefore allmembers of a population are expected to be exposed
Teen Child Small Child Infant
12 to 19 5 to 11 0.5 to 4 0 to 0.5
57 27 13 6
21 12 5 2
1.3 0.9 0.8 0.75
0.02 0.035 0.05 0.035
6.25 8.2 8.2 8.2
93.75 91.8 91.8 91.8

Setton et al. Environmental Health 2013, 12:15 Page 4 of 13http://www.ehjournal.net/content/12/1/15
(for example, outdoor air pollution). A value of 1 couldalso be used to represent a contamination scenario inwhich all of the intake amount has detectable levels, butthe resulting intake and risk estimates apply only toexposed populations (for example, only those peopledrinking well water contaminated with benzene fromleaking underground fuel tanks). Secondly, including apercent value of less than 1, for example 0.3 implies thatexposure occurs only in 30 percent of the intake amount(for example, the substance has been detected in only 30percent of samples tested).Given the calculated daily average intake for each life-
stage, substance and exposure pathway combination, asingle estimate of intake by exposure pathway over anentire 70 year life is calculated by weighting each life-stage specific intake level by the amount of time spent ineach life-stage, then summing:
LSWDI ¼ S LSi � Tið Þ ð2Þ
where
LSWDI = life-stage weighted daily intakeLSi = daily intake for life-stage iTi = percent of time spent in life-stage i, expressed astime in life-stage i/ total lifetime
Given an estimated lifetime average daily intake inmg/kg of bodyweight, cancer potency factors are thenapplied to estimate the associated LECR:
Lifetime Excess Cancer Risk¼ Average Daily Intake
� Cancer Potency Factor ð3Þ
This approach applies to many known and suspectedcarcinogens; however, it is important to note that forradon, lifetime excess cancer risk is calculated using totallifetime dose [22] not lifetime average daily intake. Inradon’s case, the above equations were modified as ne-cessary. Similarly, for asbestos, the average hourly con-centration over an entire lifetime is treated as therepresentative intake (dose) and LECR is calculated bymultiplying the lifetime average hourly concentration byan inhalation unit risk factor [23].Availability and quality of the input data varied widely
depending on the substance and exposure pathway con-sidered. Existing, readily available and ongoing nationaldatabases were used whenever possible, but we also hadto rely on data from government reports and peer-reviewed studies reporting measured concentrations. Weused data only from studies conducted in Canada, theUS and northern European countries with data collectedin 2000 or more recently.
Outdoor air concentrations are based either onquality-assured data from the Canadian National AirPollution Surveillance (NAPS) monitoring system for2006 [24] or peer-reviewed literature and governmentreports published since 2000. Typically, data from theNAPS monitoring system are of high quality in terms ofinstruments used and their calibration, regularity of thesampling intervals over an entire year, and the geo-graphic distribution of stations across Canada [25]. Not-ably, data for radon and asbestos came from governmentreports and peer-reviewed literature. Radon has beenmeasured extensively across Canada using acceptedmonitoring protocols [26]. Asbestos, however, is notregularly measured in outdoor air in Canada, and differ-ent methods exist for measuring levels which can pro-duce substantially different results [27], presenting apotentially important data gap.Indoor air and dust concentrations are based on data
published in peer-reviewed literature since 2000. In gen-eral, other than for radon, benzene and formaldehyde inindoor air, we found few studies reporting measuredlevels of our selected carcinogens in these exposurepathways. Sample sizes were relatively small, and studiesoften focused in one geographic location. For dust, ana-lytical methods varied (we used only data analyzed usinginductively coupled plasma mass spectrometry, the mostaccurate currently available) and results were often pre-sented as volume per square centimeter cm2, rather thanin micrograms per gram μg/g, and so we were not ableto include these in our estimates.Drinking water data are from the Ontario Drinking
Water Surveillance Program (DWSP) for 2006 for distri-bution systems (not raw water or treated water at plant)[28]. In addition, a review of published literature andgovernment reports on drinking water for Canada wasconducted, and levels compared to those from DWSP.In Canada, drinking water testing is conducted by localmunicipal governments, and results are not typicallyavailable in an easily accessible form, like the OntarioDWSP. Private wells are tested only by individuals, andthe lack of data for these Canadians is a significant gap,particularly with respect to arsenic in drinking water.The list of foods included in this study was derived
from the Canada Food Stats database [29]. Consumptionlevels for adults, teens, children, small children andinfants were based on levels specific to each life stagefrom the Nutrition Canada Survey [30] when available,otherwise per capita loss-adjusted consumption from theCanada Food Stats database were used to represent adultconsumption, and reduced in proportion to bodyweightfor other life stages. Concentrations in foods are primar-ily from the Canadian Food Inspection Agency ChemicalResidues in Food reports [31], the United States TotalDiet Study results [32] and the Dietary Exposure
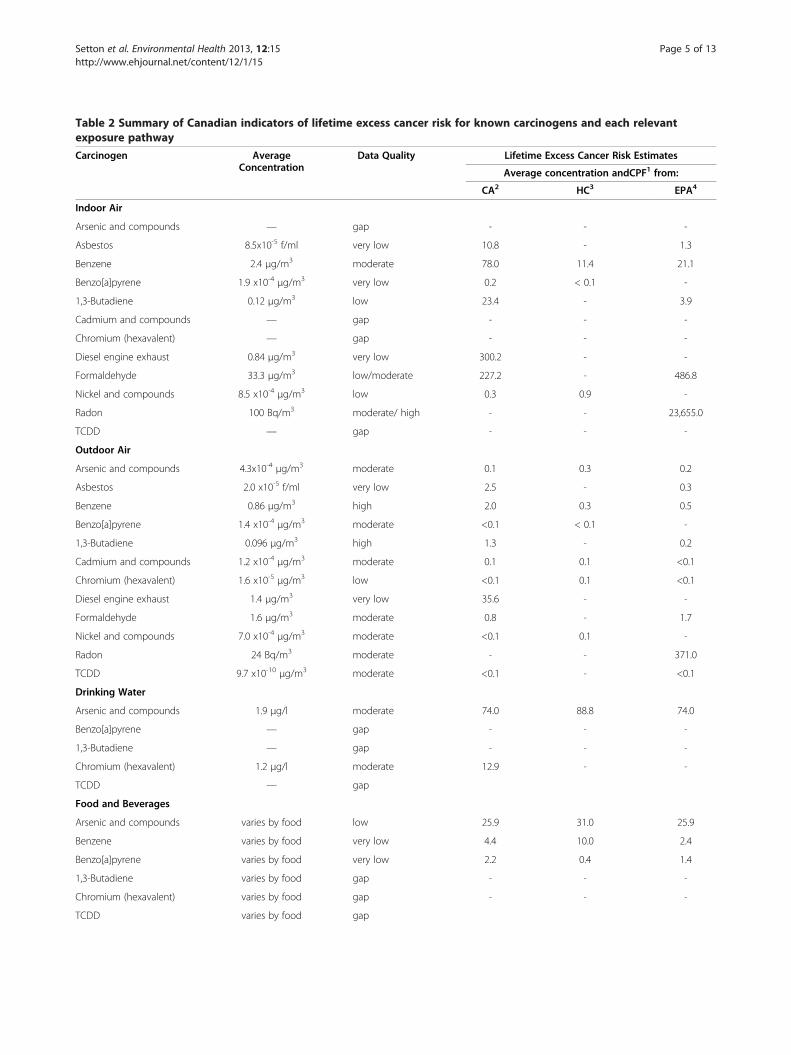
Table 2 Summary of Canadian indicators of lifetime excess cancer risk for known carcinogens and each relevantexposure pathway
Carcinogen AverageConcentration
Data Quality Lifetime Excess Cancer Risk Estimates
Average concentration andCPF1 from:
CA2 HC3 EPA4
Indoor Air
Arsenic and compounds — gap - - -
Asbestos 8.5x10⁻⁵ f/ml very low 10.8 - 1.3
Benzene 2.4 μg/m3 moderate 78.0 11.4 21.1
Benzo[a]pyrene 1.9 x10⁻⁴ μg/m3 very low 0.2 < 0.1 -
1,3-Butadiene 0.12 μg/m3 low 23.4 - 3.9
Cadmium and compounds — gap - - -
Chromium (hexavalent) — gap - - -
Diesel engine exhaust 0.84 μg/m3 very low 300.2 - -
Formaldehyde 33.3 μg/m3 low/moderate 227.2 - 486.8
Nickel and compounds 8.5 x10⁻⁴ μg/m3 low 0.3 0.9 -
Radon 100 Bq/m3 moderate/ high - - 23,655.0
TCDD — gap - - -
Outdoor Air
Arsenic and compounds 4.3x10⁻⁴ μg/m3 moderate 0.1 0.3 0.2
Asbestos 2.0 x10⁻⁵ f/ml very low 2.5 - 0.3
Benzene 0.86 μg/m3 high 2.0 0.3 0.5
Benzo[a]pyrene 1.4 x10⁻⁴ μg/m3 moderate <0.1 < 0.1 -
1,3-Butadiene 0.096 μg/m3 high 1.3 - 0.2
Cadmium and compounds 1.2 x10⁻⁴ μg/m3 moderate 0.1 0.1 <0.1
Chromium (hexavalent) 1.6 x10⁻⁵ μg/m3 low <0.1 0.1 <0.1
Diesel engine exhaust 1.4 μg/m3 very low 35.6 - -
Formaldehyde 1.6 μg/m3 moderate 0.8 - 1.7
Nickel and compounds 7.0 x10⁻⁴ μg/m3 moderate <0.1 0.1 -
Radon 24 Bq/m3 moderate - - 371.0
TCDD 9.7 x10⁻¹⁰ μg/m3 moderate <0.1 - <0.1
Drinking Water
Arsenic and compounds 1.9 μg/l moderate 74.0 88.8 74.0
Benzo[a]pyrene — gap - - -
1,3-Butadiene — gap - - -
Chromium (hexavalent) 1.2 μg/l moderate 12.9 - -
TCDD — gap
Food and Beverages
Arsenic and compounds varies by food low 25.9 31.0 25.9
Benzene varies by food very low 4.4 10.0 2.4
Benzo[a]pyrene varies by food very low 2.2 0.4 1.4
1,3-Butadiene varies by food gap - - -
Chromium (hexavalent) varies by food gap - - -
TCDD varies by food gap
Setton et al. Environmental Health 2013, 12:15 Page 5 of 13http://www.ehjournal.net/content/12/1/15

Table 2 Summary of Canadian indicators of lifetime excess cancer risk for known carcinogens and each relevantexposure pathway (Continued)
Indoor Dust
Arsenic and compounds — gap - - -
Benzo[a]pyrene 2.91 μg/g low 22.9 4.4 14.0
Chromium (hexavalent) 4.25 μg/g very low 1.2 - -
TCDD — gap
1. CPF = cancer potency factor.2. CA = California Office of Environmental Health Hazard Assessment.3. Health Canada.4. United States Environmental Protection Agency.Substances that were negligible or not carcinogenic in a specific pathway were excluded.
Setton et al. Environmental Health 2013, 12:15 Page 6 of 13http://www.ehjournal.net/content/12/1/15
Potential Model, which contains concentration datafrom numerous United States studies conducted prior to2003 [33]. Our search for Canadian food and beveragedata revealed substantial data gaps. Importantly, no data-bases were found that included both consumption levelsand concentration levels, and we encountered difficultiesin matching the foods listed between each different data-base [34]. As well, consumption data are based either on1) a national 24 hour dietary recall survey conducted inthe early 1970s (still the most comprehensive surveydone for Canadians) [30] or 2) per capita estimatesbased on amount of food available nationally [29]. Wedo not know how well these data sources represent theaverage Canadian diet now or over the long term.Varying data availability limits the representativeness
of some of the indicators. We focused on creating estimatesof mean measured levels as inputs for the indicators, in the
Figure 2 Estimates of lifetime excess cancer risk (per 1 million personcarcinogens and exposure pathways in Canada.
absence of data that would support the development ofvalid exposure distributions in the Canadian population.Qualitative assessments of how well the data used representthe ‘average’ for Canadians for each substance/exposurepathway are provided with the results and summarized inTable 2. This approach is consistent with recommendationsfor screening-level assessments [35,36]. More details on thebasis for assigning data quality ranks (gap, very low, low,moderate and high) shown in the following results areavailable on the CAREX Canada website [37], as are docu-mentation and citations for all data sources and levels usedto calculate the LECRs reported here.Cancer potency factors for the same substance can dif-
fer by several orders of magnitude between agencies,due to interpretation of epidemiological and animalstudies. We therefore present results using cancer po-tency factors derived by the California Office of
s) ranked from highest to lowest for different environmental

Setton et al. Environmental Health 2013, 12:15 Page 7 of 13http://www.ehjournal.net/content/12/1/15
Environmental Health Hazard Assessment (CAOEHHA) [38], Health Canada [13,21,39,40] and the Uni-ted States Environmental Protection Agency (US EPA)[22,41].
ResultsLECR indicators for 27 carcinogen-exposure pathwaycombinations were calculated for selected known carci-nogens (Figure 2 and Table 2). Substances that arethought to make a negligible contribution to exposureor that are not carcinogenic in a specific pathway areexcluded. Substances that might be important but whereno data were available to make this determination areincluded to highlight data gaps. LECRs of between 1 and10 per million due to non-occupational exposures aregenerally treated as being ‘essentially zero’ or ‘acceptable’by a range of federal and provincial Canadian agencies[13]. Here we use 1 per million as a threshold for con-sideration to prioritize for additional assessment, giventhe screening nature of the approach. Substances withLECRs above 1 per million based on data of moderate tohigh quality may be targeted for more detailed riskassessments, such as those using probabilistic methodsto better characterize the range of potential exposuresgiven current measured levels. Similarly, substances withLECRs below 1 per million based on moderate or highdata quality may not be important to prioritize for fur-ther study. Whenever data quality is assessed as low orvery low, or no data were found, it may be useful toundertake additional research or monitoring to bettercharacterize LECRs for comparative purposes.
Indoor airBased on average measured levels in Canada circa 2006and the highest available cancer potency factor, potentialLECRs are greater than 1 per million due to inhalationof asbestos, benzene, 1,3-butadiene, diesel engine ex-haust, formaldehyde, and radon in indoor air. The riskposed by radon exposure (LECR of 23,655) is magni-tudes larger than the next largest LECR (formaldehyde,with a LECR of 487). All have been calculated using anexposure frequency of 1, thereby implicitly assumingthat each substance is always present in indoor air at themeasured average level.Data quality for measured concentrations of carcino-
gens in indoor air ranges from very low to moderate-high. The LECR associated with diesel engine exhaust isbased on measured levels of total fine particulates byNAPS monitoring sites, and the assumption that 18 per-cent of total fine particulates are from diesel engineexhaust [42], and that 60 percent of ambient fine parti-culates infiltrate to indoor residential environments [43].Data quality for the diesel engine exhaust estimate istherefore considered to be very low. For all other
substances listed, concentration data were found exclu-sively in published literature and reports, as there are nonational programs regularly monitoring indoor air qual-ity in Canada. Moderate data quality ratings wereassigned only to those substances for which consistentlevels were reported in at least three reasonably compar-able studies (benzene, formaldehyde, and radon). Lowratings were given to those substances with fewer studiesavailable and/or some inconsistency in reported levelsacross studies (asbestos, 1,3-butadiene and nickel). Datagaps exist for arsenic, cadmium, hexavalent chromium,and 2,3,7,8-tetrachlorodibenzo[p]dioxin (TCDD).We did not find enough publicly available data to de-
velop regional indicators for indoor air. In general, in-door air quality is influenced by the varying uses ofmany consumer products, cooking practices, wood, can-dle and incense burning, and so on. We therefore expectmore random variation among residences, rather thandistinct regional differences due to these factors. Out-door air quality, however, may also contribute to indoorair quality via infiltration through open doors, windowsand gaps or cracks in building walls, and the regionalpatterns seen for outdoor air may be present in indoorair levels as well.
Outdoor airLECRs for a number of carcinogens in outdoor air circa2006 are greater than 1 per million; however, they aremuch lower than those for indoor air when consideringthe same substances. In some cases this is due to loweroutdoor ambient concentrations, but is also influencedby the much larger amount of time spent indoors overthe average lifetime. In outdoor air, LECRs based onaverage concentrations and the highest available cancerpotency factor are greater than 1 per million for asbes-tos, benzene, 1,3-butadiene, diesel engine exhaust, for-maldehyde and radon. Radon and diesel engine exhaustpose substantially larger risks than the other carcino-gens. Again, we used an exposure frequency of 1,thereby assuming that these carcinogens are present inall outdoor air. Data from the NAPS monitoring net-work suggests that this is a reasonable assumption.While we did not find much reported data for asbestos,several studies suggest it is ubiquitous in urban environ-ments [44] (Refs here). Radon, however, is not present atsignificant levels in many regions of Canada, given thegeological nature of the source. The use of an exposurefrequency factor of 1 here should be interpreted as ap-plying only to those who live in regions known to havepotential for higher levels of radon.A data quality rating of moderate was assigned to
radon as the most recent outdoor measures are from astudy conducted in 1990 in 17 Canadian cities [45]; weinclude them here although the data were gathered prior

Setton et al. Environmental Health 2013, 12:15 Page 8 of 13http://www.ehjournal.net/content/12/1/15
to 2000, as there is no expectation that outdoor levelswould decline over time. Data quality for asbestos levelsin outdoor air was considered to be very low. In Canada,only a few studies on outdoor asbestos levels were iden-tified and those were conducted in communities impactedby asbestos mines. We used data from a US measurementprogram conducted in the 1980s and 1990s in the USintended to measure asbestos levels inside buildingsthought to be contaminated with asbestos-containingmaterials [44]. Outdoor levels at each building were alsomeasured to provide a comparison of indoor/outdoorconcentrations, and we use the average of these for theLECR reported here.The remainder of the carcinogen concentration data
for outdoor air was estimated using NAPS monitoringdata and ranges from very low to high based on thenumber of monitoring stations. A low rating wasassigned to hexavalent chromium, as only total chro-mium is measured, and we used the assumption that 5percent of total chromium measured is hexavalent [46].Moderate ratings were assigned to substances with morethan 10 monitoring locations across Canada (arsenic,benzo[a]pyrene, cadmium, formaldehyde, nickel andTCDD) and a high rating was assigned to benzene and1,3-.butadiene, as they are measured at more than 50locations across Canada. Data quality for diesel engineexhaust is considered to be very low for the reasons pre-viously discussed.Outdoor air quality can vary substantially both locally
(i.e., within an urban area) and regionally (among differ-ent urban areas, and between urban and rural areas).The LECRs presented here are based on the annual aver-age level for each carcinogen measured across monitor-ing stations in Canada. Geographic variation in LECRsassociated with outdoor air is not reported here, but hasbeen characterized by applying both statistical and deter-ministic models, as detailed in Hystad et al. (2010) [47]and on the CAREX Canada website, i.e., arsenic for ex-ample [48].
Drinking waterEstimated LECRs are greater than 1 per million due toingestion of arsenic and hexavalent chromium in drink-ing water. For arsenic, we expected levels to be higher inregions with greater abundance of naturally occurringarsenic outside of Ontario, and therefore used arsenicvalues reported in the Canadian Drinking Water Guide-line Technical Document [49] and assigned a data qual-ity rating of moderate. We used the assumption that allof the chromium present in drinking water is in hexava-lent form [50], and data quality is judged to be moder-ate based on both the sample sizes ranging fromapproximately 259 to 329 for the year 2006 in DWSP[28], and the comprehensive review of data provided in
the guideline document. For both arsenic and hexava-lent chromium, we employed an exposure frequency of1. In the case of arsenic, given the geological nature ofthe source, the indicator should be more carefullyinterpreted as applying to those Canadians living inregions where arsenic is known to be a drinking watercontaminant.No useful data for benzo[a]pyrene, 1,3-butadiene, or
TCDD were identified. No cancer potency factors arereported by Health Canada, the US EPA, or the CAOEHHA for the ingestion of formaldehyde, nickel andcadmium.We did not identify enough publicly available data to
provide regional indictors for carcinogens in treateddrinking water, in large part due to drinking water qual-ity data being held by many thousands of local munici-palities and not in a centralized national database. Wealso expect significant geographic variation of arseniclevels particularly when drinking water is drawn fromprivate wells, based on geological sources of arsenic.Data that would support the development of regionalindicators on drinking water quality in private wells werenot publicly available.
Food and beveragesEstimated LECRs are greater than 1 per million due toingestion of arsenic, benzene and benzo[a]pyrene infoods and beverages, based on average concentrationsand the highest available cancer potency factor. We wereable to calculate exposure frequencies for each food,given the number of detections in each sample, andthese were used to develop the average daily intakevalues. In practice, this means that for a given substanceand food group (i.e., vegetables) the average daily intakeestimate is influenced by the exposure frequencies ofeach of the included foods.We assigned a data quality rating of very low or low to
all relevant substances for which we found data. In gen-eral, Canadian data available in peer-reviewed studies,government reports or public online databases are lim-ited in terms of consumption levels, foods tested, sub-stances measured, the geographic representation, andtemporal relevance. Typically, data were available onlyfor a few of the 206 included food items. Table 3 sum-marizes the number of foods in each major group withdata and the percent of total consumption representedby those with data. No suitable data were found for 1,3-butadiene, hexavalent chromium, or TCDD in preparedfoods and beverages. No cancer potency factors arereported by Health Canada, the US EPA, or the CAOEHHA for the ingestion of formaldehyde, nickel andcadmium.We were unable to identify any publicly available data
to support the calculation of regional LECRs for
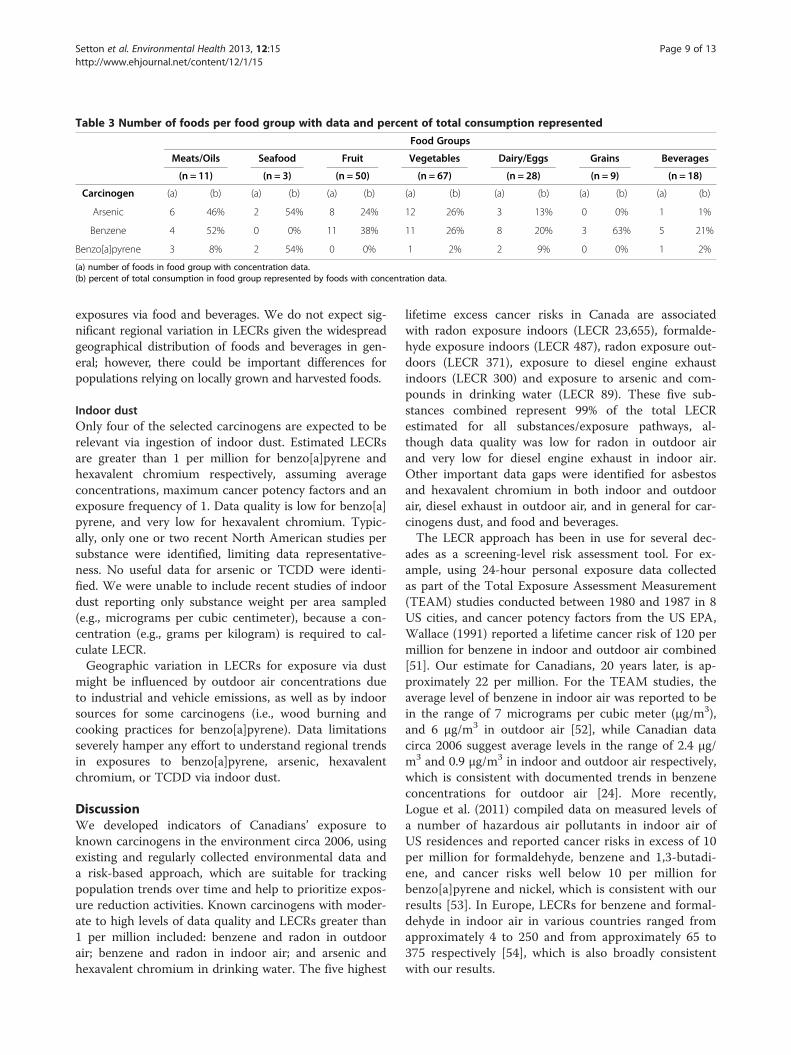
Table 3 Number of foods per food group with data and percent of total consumption represented
Food Groups
Meats/Oils Seafood Fruit Vegetables Dairy/Eggs Grains Beverages
(n = 11) (n = 3) (n = 50) (n = 67) (n = 28) (n = 9) (n = 18)
Carcinogen (a) (b) (a) (b) (a) (b) (a) (b) (a) (b) (a) (b) (a) (b)
Arsenic 6 46% 2 54% 8 24% 12 26% 3 13% 0 0% 1 1%
Benzene 4 52% 0 0% 11 38% 11 26% 8 20% 3 63% 5 21%
Benzo[a]pyrene 3 8% 2 54% 0 0% 1 2% 2 9% 0 0% 1 2%
(a) number of foods in food group with concentration data.(b) percent of total consumption in food group represented by foods with concentration data.
Setton et al. Environmental Health 2013, 12:15 Page 9 of 13http://www.ehjournal.net/content/12/1/15
exposures via food and beverages. We do not expect sig-nificant regional variation in LECRs given the widespreadgeographical distribution of foods and beverages in gen-eral; however, there could be important differences forpopulations relying on locally grown and harvested foods.
Indoor dustOnly four of the selected carcinogens are expected to berelevant via ingestion of indoor dust. Estimated LECRsare greater than 1 per million for benzo[a]pyrene andhexavalent chromium respectively, assuming averageconcentrations, maximum cancer potency factors and anexposure frequency of 1. Data quality is low for benzo[a]pyrene, and very low for hexavalent chromium. Typic-ally, only one or two recent North American studies persubstance were identified, limiting data representative-ness. No useful data for arsenic or TCDD were identi-fied. We were unable to include recent studies of indoordust reporting only substance weight per area sampled(e.g., micrograms per cubic centimeter), because a con-centration (e.g., grams per kilogram) is required to cal-culate LECR.Geographic variation in LECRs for exposure via dust
might be influenced by outdoor air concentrations dueto industrial and vehicle emissions, as well as by indoorsources for some carcinogens (i.e., wood burning andcooking practices for benzo[a]pyrene). Data limitationsseverely hamper any effort to understand regional trendsin exposures to benzo[a]pyrene, arsenic, hexavalentchromium, or TCDD via indoor dust.
DiscussionWe developed indicators of Canadians’ exposure toknown carcinogens in the environment circa 2006, usingexisting and regularly collected environmental data anda risk-based approach, which are suitable for trackingpopulation trends over time and help to prioritize expos-ure reduction activities. Known carcinogens with moder-ate to high levels of data quality and LECRs greater than1 per million included: benzene and radon in outdoorair; benzene and radon in indoor air; and arsenic andhexavalent chromium in drinking water. The five highest
lifetime excess cancer risks in Canada are associatedwith radon exposure indoors (LECR 23,655), formalde-hyde exposure indoors (LECR 487), radon exposure out-doors (LECR 371), exposure to diesel engine exhaustindoors (LECR 300) and exposure to arsenic and com-pounds in drinking water (LECR 89). These five sub-stances combined represent 99% of the total LECRestimated for all substances/exposure pathways, al-though data quality was low for radon in outdoor airand very low for diesel engine exhaust in indoor air.Other important data gaps were identified for asbestosand hexavalent chromium in both indoor and outdoorair, diesel exhaust in outdoor air, and in general for car-cinogens dust, and food and beverages.The LECR approach has been in use for several dec-
ades as a screening-level risk assessment tool. For ex-ample, using 24-hour personal exposure data collectedas part of the Total Exposure Assessment Measurement(TEAM) studies conducted between 1980 and 1987 in 8US cities, and cancer potency factors from the US EPA,Wallace (1991) reported a lifetime cancer risk of 120 permillion for benzene in indoor and outdoor air combined[51]. Our estimate for Canadians, 20 years later, is ap-proximately 22 per million. For the TEAM studies, theaverage level of benzene in indoor air was reported to bein the range of 7 micrograms per cubic meter (μg/m3),and 6 μg/m3 in outdoor air [52], while Canadian datacirca 2006 suggest average levels in the range of 2.4 μg/m3 and 0.9 μg/m3 in indoor and outdoor air respectively,which is consistent with documented trends in benzeneconcentrations for outdoor air [24]. More recently,Logue et al. (2011) compiled data on measured levels ofa number of hazardous air pollutants in indoor air ofUS residences and reported cancer risks in excess of 10per million for formaldehyde, benzene and 1,3-butadi-ene, and cancer risks well below 10 per million forbenzo[a]pyrene and nickel, which is consistent with ourresults [53]. In Europe, LECRs for benzene and formal-dehyde in indoor air in various countries ranged fromapproximately 4 to 250 and from approximately 65 to375 respectively [54], which is also broadly consistentwith our results.
Setton et al. Environmental Health 2013, 12:15 Page 10 of 13http://www.ehjournal.net/content/12/1/15
In outdoor air, McCarthy et al. (2009) analyzed ambi-ent concentrations measured at US government moni-toring stations from 2003 to 2005 inclusive [55]. Theyreport LECRs between 1 and 10 per million for the me-dian benzene and 1,3-butadiene concentrations, which isgenerally similar to our results, but report a higherLECR for median arsenic (closer to 10 per million, ver-sus 0.1 to 0.3 per million based on mean of Canadiandata) and a lower LECR for median formaldehyde(roughly between 0.01 and 0.1 per million versus 0.8 to1.7 per million based on mean of Canadian data). Mod-elled outdoor air concentrations of toxic pollutants foreach county in the US are used in the US EPA NationalAir Toxics Assessment (NATA) program [56]. For theyear 2005, NATA reports average LECRs in the USsimilar to those reported here for inorganic arsenic (0.7versus 0.3 per million), cadmium (0.07 versus 0.1 permillion), nickel (0.08 versus 0.1 per million), benzene(3.3 versus 2.0 per million) and 1,3-butadiene (0.6 versus1.3 per million). NATA also reports average LECRs fortotal chromium (0.56 per million) and total polycyclicaromatic hydrocarbons (0.8 per million), which arehigher than the LECRs of 0.1 per million for hexavalentchromium and <0.1 for benzo[a]pyrene reported here.The average LECR reported for formaldehyde by NATAis a magnitude higher than our LECR (16 versus 1.7 permillion).Loh et al. (2007) calculated lifetime excess cancer risks
for a number of airborne organic compounds using mod-eled distributions of concentrations in various microenvir-onments (outdoor and indoor at home, in offices, diningestablishments, grocery and non-grocery commercial build-ings, and during commuting) to develop estimates of repre-sentative total personal exposures [57]. Reported LECRs forbenzene and 1,3-butadiene ranged from approximately 10to 100 per million, compared to our LECRs of 12 to 80 permillion and 4 to 25 per million respectively (including bothoutdoor and indoor estimates). The LECR for formaldehydewas lower (approximately 100 per million) in Loh et al.(2007) than that reported here (228 to 490 per million).This is likely due mostly to the difference in input valueswith Loh et al. (2007) using 18 μg/m3 to represent the geo-metric mean for indoor air in the US compared to our esti-mate of 33 μg/m3 representing the mean for indoor air inCanada. Both our estimate for benzo[a]pyrene and that ofLoh et al. (2007) for polycyclic aromatic hydrocarbons(PAHs) as a group in air were less than 1 per million.Few comparable LECR estimates for arsenic, benzo[a]
pyrene and benzene in food and beverages were identi-fied. Loh et al. (2007) also calculated LECRs for dioxinand PAHs via ingestion of food specifically [57]. We didnot identify enough relevant data to estimate a LECR fordioxins (specifically TCDD) via ingestion of food, butour LECR estimate for benzo[a]pyrene specifically in
foods ranges from less than 0.1 to 0.2 per million, farlower than the range provided in Loh et al. (2007) of ap-proximately 10 to 50 per million for PAHs as a group.We did not find many relevant and comparable studies
for drinking water and dust exposure pathways. Nocurrent peer-reviewed studies reporting LECR estimatesfor arsenic in drinking water in North America were iden-tified; however, the current Canadian Drinking WaterGuideline for arsenic is 0.3 micrograms per litre (μg/L),which is also stated as being equivalent to a LECR of be-tween 1.9 to 13.9 per million [49]. Our LECR for arsenicin drinking water is approximately 89 per million basedon an average input concentration of 1.9 μg/L. Maertenset al. (2008) assessed the LECR associated with the inges-tion of PAHs in settled house dust by preschool-aged chil-dren as being in the range of 1 to 100 per million [58].The LECR reported here for ingestion of benzo[a]pyrenealone in dust, over a full lifetime, is 23 per million.Of special interest are the LECR estimates for radon in
indoor (23, 655) and outdoor air (371 per million). In-halation via indoor air is well recognized as a key expos-ure pathway, and is estimated to be the second leadingcause of lung cancer in Canada [59]. Although radon inhomes has been measured extensively in Canada, weconsidered data quality to be moderate only, given thatradon exposure follows geological patterns, and the sub-stantial effect building type and condition can have onradon levels even in homes located next to each other.The average of the available data therefore representsthose homes that have been measured, rather than whatmight be expected in all Canadian homes. Measured out-door levels in Canada suggest this pathway may also beimportant. We found only one study, conducted in 1990/91, that measured radon in outdoor air near Canadianresidences and reported 3 month average concentrationsranging from non-detection to as high as 118 Becquerelsper cubic metre (Bq/m3) [44]. Although individuals moveabout when outdoors, time spent outdoor near theirhomes could be associated with significant exposureswhen radon is present. The long-term average time of themeasured data (3 months) suggests that although radon isdissipated in outdoor air, potential exposure levels can re-main high enough to be of concern, even if indoor expo-sures are decreased.In general, differences between our estimates and others
using the same methodology would arise solely from theuse of different parameter inputs (concentrations, cancerpotency factors, or population characteristics). It is there-fore critical that all parameter inputs are clearly documen-ted, enabling others to assess their comparability andvalidity. The use of a standard approach however, providesinternal consistency and supports direct comparisonsacross exposure pathways and between substances forscreening level purposes.
Setton et al. Environmental Health 2013, 12:15 Page 11 of 13http://www.ehjournal.net/content/12/1/15
Importantly, variability among individuals exists, bothin terms of exposure levels and responses to those expo-sures. For any individual, exposure will vary both tem-porally (short and long term) and spatially depending ona multitude of factors (proximity to carcinogen sources,behaviours affecting intake rates, etc.). There is also clearevidence that exposures during key lifestages may bemore important than at other times, particularly duringchildhood and even pre-natally, and more specific cancerpotency factors may be required to better reflect thesesusceptibilities [60,61]. For these reasons, the LECRspresented here are best used as general relative indica-tors, and should not be interpreted as real cancer risksor estimates of future disease burden.Uncertainty in our indicators also exists, and is influ-
enced not only by potential measurement error in theconcentration data, but also by the use of short durationsamples to represent long term concentrations; compar-ability of concentrations across studies when differentdata collection methods are used; the use of small sam-ples (potentially non-random) to represent larger popu-lations; and the use of data from limited geographicregions to represent national concentrations.This significant lack of nationally representative data
(both geographically and temporally) does not allow us toestablish the prevalence of exposure in the Canadianpopulation, and may impede identifying trends over timeif new data do not become available. In addition, establish-ing trends in future updates of the indicators may be diffi-cult, particularly for those that depend solely on data frompublished literature or government reports, as the numberof new studies undertaken that specifically measure envir-onmental concentrations may be small, and/or changes inthe LECR estimates may represent enhanced data ratherthan actual trends in exposure. Improvements in analyticalmethods may also affect how often substances aredetected and at what levels, and therefore the resultingindicators. The authors plan to undertake a recalculationof the indicators presented here using data representativeof conditions in 2011 when available, the results of whichwill provide further insight into the feasibility of regularupdating and ease of comparability across time periods.This study suggests there are real opportunities to
improve our understanding of Canadians’ exposuresto carcinogens through undertaking more population-representative national monitoring programs. Thesewould produce better estimates of average levels, theprobable distribution of exposure levels throughout ourpopulation, and therefore more effectively targeted pre-vention programs. These types of programs are likelymore feasible in government or government partnershipsettings rather than solely academic.In lieu of undertaking probabilistic methods for
exploring variability and/or uncertainty in the input
values (due to limited data availability), we developed asimple database tool (eRISK); available from the authorsor via the CAREX Canada website on request [62]. Thetool can be used to examine the range of daily intakesand associated risks for any number of scenarios. For ex-ample, users can input values that might better representthe range of regional conditions (minimum, average ormaximum concentration) or the unique dietary intakesof different population groups, as well as adjust the stand-ard lifestage parameters and cancer potency factors.This paper describes only one aspect of the CAREX
Canada environmental project. Other components focuson providing the same indicators for selected suspectedcarcinogens (IARC Group 2A and 2B); identifying geo-graphic variation in environmental concentrations andrisk; standardizing and ranking carcinogen emissions bydifferent geographical areas in Canada; and reviewingexisting food consumption and residue databases inCanada.
ConclusionsThe risk-based approach provides a flexible method fordeveloping comparable, substance-specific estimates oflifetime daily average intake and associated LECRs for avariety of exposure pathways, including outdoor air,indoor air, drinking water, dust, soil, and foods and bev-erages, using available data. The indicators do not repre-sent real cancer risk for any individual; however, they doidentify what the LECRs are if environmental concentra-tions remain unchanged over time. If environmentalconcentrations increase or decline in the future, so willthe LECRs. Most important, perhaps, is the usefulness ofthis standardized risk assessment-based approach forcomparative risk assessment and for identifying dataquality issues and data gaps, which serves to highlightwhere future efforts should be targeted to improve ourunderstanding of Canadians’ exposures to carcinogens.
AbbreviationsBq/m3: Becquerels per cubic meter; CA OEHHA: California office ofenvironmental health hazard assessment; CPAC: Canadian partnershipagainst cancer; CR: Concentration – response; DWSP: Ontario drinking watersurveillance program; EPI: Exposure potency index; f/ml: Fibres per millilitre;IARC: International agency for research on cancer; LECR: Lifetime excesscancer risk; NAPS: National air pollution surveillance; NATA: National air toxicsassessment; PAH: Polycyclic aromatic hydrocarbon; TCDD: 2,3,7,8-tetrachlorodibenzo[p]dioxin; TEAM: Total exposure assessment measurement;US EPA: United states environmental protection agency; US: United States;μg/m3: Micrograms per cubic meter; μg/L: Micrograms per liter.
Competing interestsThe authors declare that they have no competing interests.
Authors’ contributionsES developed and led the overall study, conducted data reviews andanalysis, and prepared the manuscript. PH participated in data review andanalysis, and collaborated in the preparation of the manuscript. KP, RC, andACL participated in data review and analysis. PAD provided advice during
Setton et al. Environmental Health 2013, 12:15 Page 12 of 13http://www.ehjournal.net/content/12/1/15
the study development and manuscript preparation. All authors read andapproved the final version.
AcknowledgmentsCAREX Canada is funded by the Canadian Partnership Against Cancer. Wewould like to acknowledge the feedback from members of our independentscientific advisory panel, government staff with knowledge of existing usefuldatabases, and other interested stakeholders during the development of ourapproach and subsequent implementation over the past three years. Thanksalso to research assistants Steeve Deschênes (air quality data formatting) andSarah Chiarello (preliminary food and beverage estimates).
Author details1Department of Geography, University of Victoria, Victoria, BC, Canada.2School of Population and Public Health, University of British Columbia,Vancouver, BC, Canada. 3Department of Geography, University of BritishColumbia, Vancouver, BC, Canada. 4Occupational Cancer Research Centre,Cancer Care Ontario, Ontario, Canada.
Received: 20 September 2012 Accepted: 6 February 2013Published: 12 February 2013
References1. IARC Monographs on the Evaluation of Carcinogen Risks to Humans; http://
monographs.iarc.fr/index.php .25-11-2012.2. IARC Monographs on the Evaluation of Carcinogenic Risks to Humans -
Classifications; http://monographs.iarc.fr/ENG/Classification/index.php .25-11-2012.
3. Danaei G, Vander Hoorn S, Lopez AD, Murray CJL, Ezzati M: Causes ofcancer in the world: comparative risk assessment of nine behaviouraland environmental risk factors. Lancet 2005, 366:1784–1793.
4. Doll R, Peto R: The Causes of Cancer: Quantitative Estimates of AvoidableRisks of Cancer in the United States Today. J Natl Cancer Inst 1981,66:1192–1308.
5. Pruss-Ustun A, Corvalan C: Preventing disease through healthy environments.Geneva: World Health Organization; 2006.
6. Clapp RW, Jacobs MM, Loechler EL: Environmental and occupationalcauses of cancer: new evidence 2005–2007. Rev Environ Health 2008,23:1–38.
7. National Committee on Environmental and Occupational Exposures:Prevention of Occupational and Environmental Cancers in Canada: A BestPractices Review and Recommendations; 2005.
8. Kauppinen T, Toikkanen J, Pedersen D, Young R, Ahrens W, Boffetta P,Hansen J, Kromhout H, Blasco JM, Mirabelli D, de la Orden-Rivera V, PannettB, Plato N, Savela A, Vincent R, Kogevinas M: Occupational exposure tocarcinogens in the European Union. Occup Environ Med 2000, 57:10–18.
9. Healthy Canadians - A Federal Report on Comparable Health Indicators; 2010.http://www.hc-sc.gc.ca/hcs-sss/pubs/system-regime/2010-fed-comp-indicat/index-eng.php .14-12-2012.
10. Abelsohn A, Frank J, Eyles J: Environmental Public Health Tracking/Surveillance in Canada: A Commentary. Healthcare Policy 2009, 4:37–52.
11. Health Canada Environmental and Workplace Health National Dose Registry;http://www.hc-sc.gc.ca/ewh-semt/occup-travail/radiation/regist/index-eng.php .2-8-2012.
12. Health Canada: Human Health Risk Assessment for Priority Substances.Ottawa: Government of Canada; 1994.
13. Health Canada Environmental Health Assessment Services SafeEnvironments Programme: Federal Contaminated Site Risk Assessment inCanada Part I: Guidance on Human Health Preliminary Quantitative RiskAssessment (PQRA). Ottawa: Government of Canada; 2004.
14. Calabrese EJ: The road to linearity: why linearity at low doses became thebasis for carcinogen risk assessment. Arch Toxicol 2009, 83:203–225.
15. Calabrese EJ: Hormesis is central to toxicology, pharmacology and riskassessment. Hum Exp Toxicol 2010, 29:249–261.
16. Cohen SM, Arnold LL: Chemical Carcinogenesis. Toxicol Sci 2011,120:S76–S92.
17. Calabrese EJ: Hormetic dose–response relationships in immunology:occurrence, quantitative features of the dose response, mechanisticfoundations, and clinical implications. CRC Crit Rev Toxicol 2005, 35:89–295.
18. Kriebel D: Cancer prevention through a precautionary approach toenvironmental chemicals. Rev Environ Health 2011, 24:271–278.
19. Merlo DF, Filiberti R, Kobernus M, Bartonova A, Gamulin M, Ferencic Z,Dusinska M, Fucic A: Cancer risk and the complexity of the interactionsbetween environmental and host factors: HENVINET interactive diagramsas simple tools for exploring and understanding the scientific evidence.Environ Health 2012, 11:S9.
20. Health Canada Great Lakes Health Effects Progam: Investigating HumanExposure to Contaminants in the Environment: A Handbook for ExposureCalculations. Ottawa: Government of Canada; 1995.
21. Health Canada Environmental Health Assessment Services SafeEnvironments Programme: Federal Contaminated Site Risk Assessment inCanada Part II: Health Canada Toxicological Reference Value (TRVs). Ottawa:Government of Canada; 2004.
22. Radionuclide Carcinogenicity Slope Factors: HEAST User Guide; http://www.epa.gov/rpdweb00/heast/index.html .2-8-2012.
23. United States Environmental Protection Agency Integrated Risk InformationSystem - Asbestos; http://www.epa.gov/iris/subst/0371.htm .13-8-2012.
24. National Air Pollution Surveillance Program; http://www.ec.gc.ca/rnspa-naps/default.asp?lang=En&n=5C0D33CF-1 .3-8-2012.
25. Environment Canada: National Air Pollution Surveillance Network QualityAssurance and Quality Control Guidelines. 1995.
26. Health Canada: Cross-Canada Survey of Radon Concentrations in Homes FinalReport. 2012.
27. Cherrie J, Addison J, Dodgson J: Comparative studies of airborne asbestosin occupational and non-occupational environments using optical andelectron microscope techniques. IARC Sci Publ 1989, 90:304–309.
28. Drinking Water Surveillance Program; http://www.ene.gov.on.ca/environment/en/monitoring_and_reporting/drinking_water_surveillance_program/STDPROD_076064.html .3-8-2012.
29. Canada Food Stats Chronological Index; http://www5.statcan.gc.ca/bsolc/olc-cel/olc-cel?catno=23F0001X&chropg=1&lang=eng .3-8-2012.
30. Nutrition Canada Food and Drug Directorate Health and Welfare Canada.Ottawa: Nutrition Canada National Survey, 1970–1972; 1981.
31. Canadian Food Inspection Agency Chemical Residues in Food Reports; http://www.inspection.gc.ca/food/chemical-residues-microbiology/chemical-residues/eng/1324258929171/1324264923941#resid .3-8-2012.
32. Total Diet Study - Analytical Results; http://www.fda.gov/Food/FoodSafety/FoodContaminantsAdulteration/TotalDietStudy/ucm184293.htm.3-8-2012.
33. Exposure Research: Health Methods, Models, Tools and Databases - DietaryExposure Potential Model (DEPM); http://www.epa.gov/nerl/topics/health.html#models .3-8-2012.
34. Cheasley R, Setton E: CAREX Canada: Evaluating the Use of Food-relatedDatabases in Canada for Carcinogen Exposure Assessment [abstract];2012.
35. Ozkaynak H, Frey HC, Hubbell B: Characterizing Variability and Uncertainty inExposure Assessments Improves Links to Environmental Decision-Making.Pittsburg, PA: EM Magazine; 2008, 18–22.
36. WHO/IPCS Working Group: Uncertainty and Data Quality in ExposureAssessment Part 1: Guidance Document on Characterizing andCommunicating Uncertainty in Exposure Assessment; Part 2. Geneva:Hallmarks of Data Quality in Chemical Exposure Assessment; 2008.
37. CAREX Canada Profiles and Estimates; http://www.carexcanada.ca/en/profiles_and_estimates/ .3-8-2012.
38. California Office of Environmental Health Hazard Assessment: TechnicalSupport Document for Cancer Potency Factors: Methodologies for derivation,listing of available values, and adjustments to allow for early lifestageexposures. California: California Office of Environmental Health HazardAssessment; 2009.
39. Health Canada Environmental Health Assessment Services SafeEnvironments Programme: Draft Federal Contaminated Site Risk Assessmentin Canada Part I: Guidance on Human Health Preliminary Quantitative RiskAssessment Version 2.0. Ottawa: Government of Canada; 2007.
40. Health Canada Environmental Health Assessment Services SafeEnvironments Programme: Draft Federal Contaminated Site Risk Assessmentin Canada Part II: Health Canada Toxicological Reference Values (TRVs) Version2.0. Ottawa: Government of Canada; 2007.
41. Integrated Risk Information System (IRIS) A-Z List of Substances; http://cfpub.epa.gov/ncea/iris/index.cfm?fuseaction=iris.showSubstanceList .3-8-2012.
42. Maykut NN, Lewtas J, Kim E, Larson TV: Source Apportionment of PM2.5 atan Urban IMPROVE Site in Seattle, Washington. Environ Sci Technol 2003,37:5135–5142.

Setton et al. Environmental Health 2013, 12:15 Page 13 of 13http://www.ehjournal.net/content/12/1/15
43. Hystad PW, Setton EM, Allen RW, Keller PC, Brauer M: Modeling residentialfine particulate matter infiltration for exposure assessment. Journal OfExposure Science & Environmental Epidemiology 2009, 19:570–579.
44. Lee RJ, Van Orden DR: Airborne asbestos in buildings. Regul ToxicolPharmacol 2008, 50:218–225.
45. Grasty RL: Summer Outdoor Radon Variations in Canada and TheirRelation to Soil Moisture. Health Phys 1994, 66:185–193.
46. Environment Canada, Health Canada: Canadian Environmental Protection ActPriority Substances List Assessment Report: Chromium and its Compunds.Ottawa: Government of Canada; 1994.
47. Hystad P, Setton E, Cervantes A, Poplawski K, Deschenes S, Brauer M, vanDonkelaar A, Lamsal L, Martin R, Jerrett M, Demers P: Creating National AirPollution Models for Population Exposure Assessment in Canada. EnvironHealth Perspect 2011, 119:1123–1129.
48. CAREX Canada Arsenic Provincial Tables and Maps - Predicting Concentrations;http://www.carexcanada.ca/en/arsenic/environmental_estimate/#provincial_tables_and_maps+predicting_concentrations .4-9-2012.
49. Federal-Provincial-Territorial Committee on Drinking Water: Guidelines forCanadian Drinking Water Quality: Guideline Technical Document Arsenic.Ottawa: Government of Canada; 2006.
50. Health Canada: Water Quality Technical Document. Ottawa: Chromium; 1986.51. Wallace LA: Comparison of Risks from Outdoor and Indoor Exposure to
Toxic Chemicals. Environ Health Perspect 1991, 95:7–13.52. Wallace LA: Major Sources of Benzene Exposure. Environ Health Perspect
1989, 82:165–169.53. Logue JM, McKone TE, Sherman MH, Singer BC: Hazard assessment of
chemical air contaminants measured in residences. Indoor Air 2011,21:92–109.
54. Sarigiannis DA, Karakitsios SP, Gotti A, Liakos IL, Katsoyiannis A: Exposure tomajor volatile organic compounds and carbonyls in European indoorenvironments and associated health risk. Environ Int 2011, 37:743–765.
55. McCarthy MC, O'Brien TE, Charrier JG, Hafner HR: Characterization of theChronic Risk and Hazard of Hazardous Air Pollutants in the United StatesUsing Ambient Monitoring Data. Environ Health Perspect 2009,117:790–796.
56. Technology Transfer Network Air Toxics 2005 National-Scale Air ToxicsAssessment; http://www.epa.gov/ttn/atw/nata2005/tables.html .7-8-2012.
57. Loh MM, Levy JI, Spengler JD, Houseman EA, Bennett DH: Ranking CancerRisks of Organic Hazardous Air Pollutants in the United States. EnvironHealth Perspect 2007, 115:1160–1168.
58. Maertens RM, Yang X, Zhu J, Gagne RW, Douglas GR, White PA: Mutagenicand Carcinogenic Hazards of Settled House Dust I: Polycyclic AromaticHydrocarbon Content and Excess Lifetime Cancer Risk from PreschoolExposure. Environ Sci Technol 2008, 42:1747–1753.
59. Radon - It's Your Health; http://www.hc-sc.gc.ca/hl-vs/iyh-vsv/environ/radon-eng.php .4-9-2012.
60. United States Environmental Protection Agency Risk Assessment Forum:Supplemental Guidance for Assessing Susceptibiilty from Early-Life Exposure toCarcinogens; 2005.
61. Felter SP, Conolly RB, Bercu JP, Bolger PM, Boobis AR, Bos PMJ, Carthew P,Doerrer NG, Goodman JI, Harrouk WA: A proposed framework forassessing risk from less-than-lifetime exposures to carcinogens. Crit RevToxicol 2011, 41:507–544.
62. CAREX Canada - Tools; http://www.carexcanada.ca/en/tools/ .4-9-2012.
doi:10.1186/1476-069X-12-15Cite this article as: Setton et al.: Risk-based indicators of Canadians’exposures to environmental carcinogens. Environmental Health 201312:15.
Submit your next manuscript to BioMed Centraland take full advantage of:
• Convenient online submission
• Thorough peer review
• No space constraints or color figure charges
• Immediate publication on acceptance
• Inclusion in PubMed, CAS, Scopus and Google Scholar
• Research which is freely available for redistribution
Submit your manuscript at www.biomedcentral.com/submit