risk factors in heating, ventilating, and air … · systems in poor condition were associated ......
TRANSCRIPT

1
Published in Indoor Air Journal, volume 18, no. 4, pages 301-316
Risk Factors in Heating, Ventilating, and Air-Conditioning Systems for Occupant Symptoms in U.S. Office Buildings: the U.S. EPA BASE Study
M.J. Mendell1, Q. Lei-Gomez2, A.G. Mirer1, O. Seppänen3, G. Brunner4
1 Indoor Environment Department, Lawrence Berkeley National Laboratory, 1 Cyclotron Rd., Berkeley, CA, 94720;
2 Harvard University School of Public Health, 677 Huntington Avenue, Boston, MA 02115; 3Helsinki University of Technology, HVAC-Laboratory, P.O.Box 4100, FIN-02015 HUT,
Finland 4Indoor Environments Division, U.S. Environmental Protection Agency/ORIA, 1200
Pennsylvania Avenue, NW, Mail Code 6609J, Washington, DC 20460 .
Corresponding author: Mark J. Mendell Lawrence Berkeley National Laboratory Indoor Environment Department 1 Cyclotron Rd., MS 90-3058 Berkeley, CA 94720, USA Phone: 1-510-486-5762 Fax: 1-510-486-6658 email: [email protected]
Acknowledgements This work was supported by the Indoor Environments Division, Office of Radiation and Indoor Air, Office of Air and Radiation of the U.S. Environmental Protection Agency through interagency agreement DW8992169501-1 with the U.S. Department of Energy. The work was also supported by the Finnish Academy. Conclusions in this paper are those of the authors and not necessarily those of the U.S. Environmental Protection Agency. We thank Rick Diamond and Michael Bates for their review of the draft manuscript.
2
Risk Factors for Occupant Symptoms in Heating, Ventilating, and Air-Conditioning Systems in U.S. Office Buildings: the U.S. EPA BASE Study
Abstract Building-related symptoms in office workers worldwide are common, but of uncertain etiology. One cause may be contaminants related to characteristics of heating, ventilating, and air-conditioning (HVAC) systems. We analyzed data from 97 representative air-conditioned U.S. office buildings in the Building Assessment and Survey Evaluation (BASE) study. Using logistic regression models with generalized estimating equations, we estimated odds ratios (OR) and 95% confidence intervals (CI) for associations between building-related symptom outcomes and HVAC characteristics. Outdoor air intakes less than 60 m above ground were associated with significant increases in most symptoms: e.g., for upper respiratory symptoms, OR for intake heights 30 to 60 m, 0 to <30 m, and below ground were 2.7, 2.0, and 2.1. Humidification systems in poor condition were associated with significantly increased upper respiratory symptoms, eye symptoms, fatigue/difficulty concentrating, and skin symptoms, with OR= 1.5, 1.5, 1.7, and 1.6. Less frequent cleaning of cooling coils and drain pans was associated with significantly increased eye symptoms and headache, with OR=1.7 and 1.6. Symptoms may be due to microbial exposures from poorly maintained ventilation systems and to the greater levels of vehicular pollutants at air intakes nearer the ground. Replication and explanation of these findings is needed. Keywords: indoor air quality; HVAC system; building-related symptoms; sick building syndrome Practical implications: These findings support current beliefs that moisture-related HVAC components such as cooling coils and humidification systems, when poorly maintained, may be sources of contaminants that cause adverse health effects in occupants, even if we cannot yet identify or measure the causal exposures. While finding substantially elevated risks for poorly maintained humidification systems, relative to no humidification systems, the findings do not identify important (symptom) benefits from well-maintained humidification systems. Findings also provide an initial suggestion, needing corroboration, that outdoor air intakes lower than 18 stories in office buildings may be associated with substantial increases in many symptoms. If this is corroborated and linked to ground-level vehicle emissions, urban ventilation air intakes may need to be located as far above ground level as possible or to incorporate air cleaners that remove gaseous pollutants.

3
Background Episodes of symptom complaints, including upper and lower respiratory symptoms, eye and skin irritation, headache, and fatigue, have been reported for decades by occupants of office buildings in many countries. Explaining and mitigating these problems have been challenging. Numerous scientific studies have documented that these building-related symptoms (BRS), sometimes called sick building syndrome, are surprisingly common even in buildings without widespread health complaints (Burge, Hedge et al. 1987). Specific measured indoor exposures causing these symptoms have not been scientifically documented, in either “complaint” buildings or buildings in general. Researchers have, however, identified a number of environmental “risk factors” that are correlated with higher prevalence of symptoms in buildings selected without regard to occupant complaints, and thus may indicate as yet unidentified causal exposures. These risk factors include the presence of air-conditioning systems (Seppanen and Fisk 2002), contaminated components of heating, ventilating, and air-conditioning (HVAC) systems (Sieber, Stayner et al. 1996; Mendell, Naco et al. 2003), low ventilation rates (Seppanen, Fisk et al. 1999), higher temperatures (Mendell, Fisk et al. 2002), and dampness/visible mold in buildings (Park, Schleiff et al. 2004; Mendell, Cozen et al. 2006). Presence of central mechanical air-conditioning systems in office buildings (relative to natural ventilation) is one of the risk factors associated most consistently with increased BRS (Mendell and Smith 1990; Seppanen and Fisk 2002), although substantial variation in BRS exists among buildings with air-conditioning. Current causal hypotheses focus on aspects of HVAC that may influence production, dissemination, or concentration of indoor biological and chemical contaminants. Regarding these hypotheses, much epidemiologic evidence is available related to low ventilation rates as risk factors (Seppanen, Fisk et al. 1999) and limited evidence is available related to moisture in HVAC systems (Mendell, Cozen et al. 2006) and poor condition and maintenance of HVAC systems (Mendell, Naco et al. 2003). The U.S. Environmental Protection Agency’s Building Assessment and Survey Evaluation (BASE) study, the largest study to date of building environments and occupant symptoms in a representative set of U.S. office buildings, offers a unique opportunity to investigate risk factors for BRS. This paper presents findings from an analysis in the BASE data of risk factors involving features or practices in buildings that (1) could be determined by inspection or interview and (2) were hypothesized to be related to contamination or performance of HVAC systems. These factors include various aspects of design, condition, maintenance, and operation of HVAC systems. We hypothesized that risk factors likely to increase the probability of biological or chemical contaminants disseminated by HVAC systems, or to decrease effectiveness of ventilation that would remove indoor contaminants, would be correlated with irritant, allergic, or toxic responses in occupants. These would thus correlate with increased prevalence of work-related symptoms, potentially including lower and upper respiratory symptoms, cough, eye symptoms, fatigue or difficulty concentrating, headache, and skin symptoms. Because many of these risk factors would be correlated with each other, and because many non-environmental factors in office buildings are known to be associated with symptom reporting, we used multivariate models to estimate the independent associations with BRS of the HVAC-related risk factors.

4
While several HVAC factors related to moisture and related contamination have been associated with increased symptoms in prior analyses of these or other data (e.g., poorly draining condensate drain pans, residue in drain pans, dirt and contamination at outdoor air intakes, infrequently cleaned coils and pans) (Sieber, Stayner et al. 1996; Mendell, Naco et al. 2003; Mendell, Cozen et al. 2006), predicted associations of symptoms with most other aspects of HVAC systems investigated here were conjectural, based on engineering judgement. Thus, the analyses reported here were primarily to explore previously untested hypotheses. Methods The BASE study data were collected from 1994 to 1998 by the U.S. EPA in 100 large U.S. office buildings. Descriptions of this study have been published previously (Brightman and Moss 2000), and full details are available in the study protocol (U.S. Environmental Protection Agency 2003). Briefly, the study selected a representative set of 100 office buildings from geographic regions throughout the U.S., and randomly selected within each building a study space with, if possible, at least 50 occupants and served by no more than two ventilation air-handling units. The terms “building” and “study space” in this analysis are thus essentially equivalent and used interchangeably. Data were collected from questionnaires given to all occupants of each study space, from standardized inspections of the buildings and ventilation systems, from standardized interviews conducted with facility managers, and from a broad range of environmental measurements. Outcomes Analyses used outcomes of “weekly, building-related symptoms” – defined as specific symptoms experienced in the building at least one day per week in the last four weeks and also improving away from the building. Analyses reported here investigated associations of risk factors with seven single or combined weekly, building-related symptom outcomes: lower respiratory (at least one of wheeze, shortness of breath, or chest tightness); cough; upper respiratory (at least one of stuffy or runny nose, sneezing, or sore or dry throat); dry, itching or irritated eyes; fatigue or difficulty concentrating; headache; and dry, itching, or irritated skin. Risk factors Analyses investigated potential risk factors related to design, operation, maintenance, and condition of HVAC systems. Data on these risk factors were collected by study personnel from inspection of ventilation systems, buildings, and occupied spaces, or through interviews with facility managers on building and ventilation system-related practices and history. Table 1 lists the HVAC variables in the BASE data of initial interest. Original variables for many risk factors, due to missing, inconsistent, or illogical data values, insufficient variation, or strong intercorrelations, were either combined in composite variables or indices or omitted. Where possible, compound variables and indices corresponding to concepts of hypothetical interest were created. Original or newly created variables with continuous values were generally analyzed as categorical variables. For instance, we created a variable not in the original data set for height above the ground of the outdoor air intake, by combining available data items on location of the intake (ground, wall, or roof) and height of the intake above the adjacent ground or rooftop, and then adjusting initial values based on field notes, drawings, and photographs. Where a study space was supplied by

5
multiple air handlers with different intake heights, we averaged those heights. The continuous values of this variable were grouped into four categories for analysis using indicator variables. To assess any risks or benefits associated with operable (i.e., openable) windows, in order to go beyond a simple count, or a proportion of windows that were operable, we combined available variables for number of operable windows in each study space and occupied floor area per study space, to create a variable for the area of occupied space per operable window. This variable was dichotomized, with a reference category including 32 study spaces with floor areas of 0-600 m2 per operable window. The second category combined one study space with almost no operable windows (i.e., floor area of 1,175 m2 per operable window) with the 64 buildings with no operable windows. An analysis variable created for humidification systems combined 4 variables, and compared buildings with humidifiers that had the worst combination of poor condition, infrequent inspection, and infrequent cleaning, and separately those with fair or good combinations of these, to buildings with no humidification. Two composite variables were created related to the visible condition of HVAC components: the cleanliness/condition of HVAC components, as an indicator of risk of contamination of the ventilation air from dirty or wet surfaces, and the operational condition of HVAC components, as an indicator of risk from inadequate operation and potentially reduced provision of ventilation air. The BASE data set includes outdoor concentrations of selected pollutants, including volatile organic compounds (VOCs), measured for each study space at the approximate location and height of its outdoor air intake for each study space, as well as indoor concentrations at three randomly-selected locations within each study space. The VOC measurements were based on analyses of time-integrated samples collected during an approximate 10-hour period on Wednesday of the study week (U.S. Environmental Protection Agency 2003). Two sampling methods were used: SUMMA canisters, and (only in 70 buildings) multisorbent tubes. Confounding variables We considered several directly measured environmental parameters as potential confounding variables in analyses: temperature (using a variable for average number of hours*degrees per day that the indoor temperature was above 20ºC) (Apte, Fisk et al. 2000), humidity ratio (a measure of absolute humidity uncorrelated with temperature, calculated from measured temperature and relative humidity, based on mean indoor levels on one day), and outdoor air ventilation rate (using a variable for ventilation estimated from measures of volumetric flow (Mendell, Lei et al. 2005)). Additional potential environmental confounders included season of study and age of building. Personal variables from the occupant questionnaire on demographics, health status, job, and workspace factors were also considered in analyses as potential confounding variables: gender, age, education, smoking status, asthma, mold allergy, hay fever, type of workstation, comfort of chair, satisfaction with work station, job satisfaction, job demand, job conflict, and years worked in building. Analysis methods Details of analytical procedures are provided in Appendix 1. In summary, we first investigated potential risk factors in univariate analyses and, based on available variation, re-categorized or excluded them as necessary. For each of the seven symptom outcomes, we performed bivariate

6
analyses with the remaining risk factor variables, retaining for further analyses those with even moderate associations, and including these in a single (for each outcome) risk factor selection model for potential elimination. For each symptom outcome, we then estimated associations between retained risk factors and symptom outcomes in multivariate models adjusting for potential confounding variables, first in logistic regression models and finally in logistic regression/general estimating equation (GEE) models that adjusted for potential correlation of respondents within buildings. Outdoor air ventilation rate was included among potential confounding variables, although it may have been in the causal pathway for at least four variables (variable-air-volume vs. constant-air-volume system, average daily hours of ventilation, operational condition of HVAC components, proportion of operable windows). Accordingly, we also ran a set of parallel models without adjustment for ventilation rate to estimate the associations for those risk factors. Estimates from final logistic regression/GEE models are reported in tables and text as odds ratios (ORs) and 95% confidence intervals (CIs). OR values exceeding 1.0 indicate increased symptom prevalence in subjects with the risk factor; values less than 1.0, a decreased prevalence; and values=1.0, no relationship. We considered associations to be of greatest interest if ORs were greater than 1.5 or less than 0.65 and p-values were also less than 0.05, but still of interest if meeting only one or almost meeting both of those criteria. Finally, in exploring some associations identified in the analyses between symptoms and outdoor air intake height, we plotted several sets of data: the crude prevalence of upper respiratory symptoms by the outdoor air intake height, and values of several volatile organic compounds typically emitted by motor vehicles (e.g., benzene, toluene, ethylbenzene, and o-, p-, and m- isomers of xylene, collectively referred to as BTEX), measured both inside each study space and outside each building (at about the height and location of the outdoor air intake for the study space). Results BASE data were available from 4,326 building occupants and on study spaces within 100 buildings, although the three naturally ventilated study spaces without HVAC systems were excluded from these analyses. (Although the symptom prevalences in naturally ventilated versus air-conditioned buildings is of great interest, there were too few naturally ventilated buildings available to make meaningful comparisons.) The overall response rate for the occupant questionnaire was 85%. Overall prevalence (in the entire survey population) of the seven symptom outcome definitions investigated ranged from a low of 4.2% for lower respiratory symptoms to a high of 20.9% for upper respiratory symptoms (see bottom row of Table 2). Prevalence of each outcome varied substantially among the 100 individual buildings. The study population has been described elsewhere in more detail (Brightman and Moss 2000). To summarize, 66% of respondents were female, 61% were between the ages of 30 and 49, and 15% were current smokers. Respondents had worked in their buildings for an average of 5.9 years. Respondents’ job categories were: 35% professionals, 34% clerical, 17% managers, and 14% technical. Regarding highest level of education, approximately 46% of respondents had less than a college degree, 36% had an undergraduate degree, and 18% had a graduate degree.
7
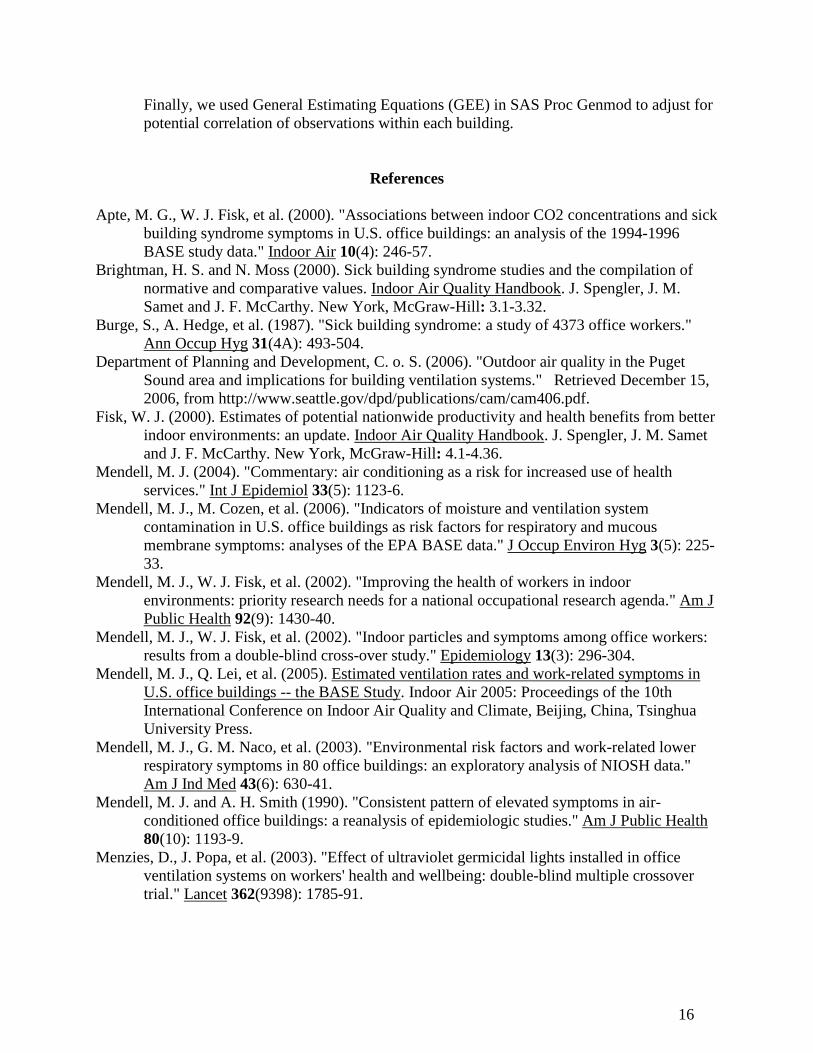
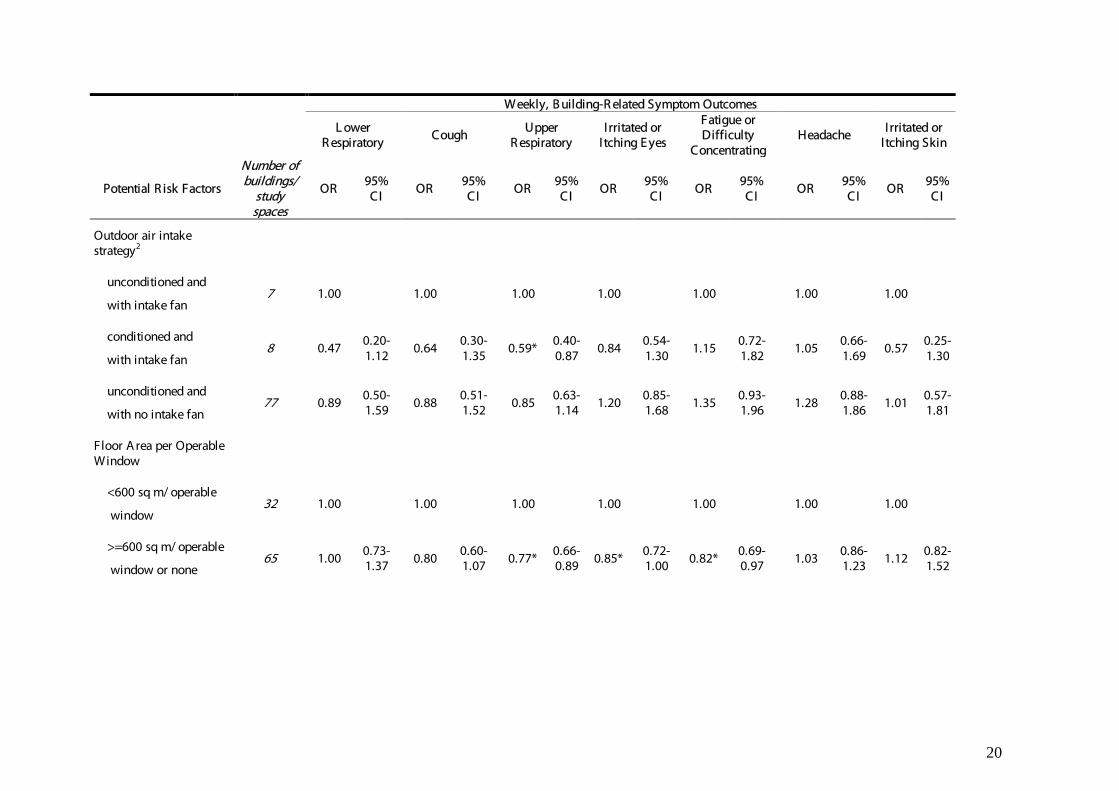
We organized the risk factors into two categories: HVAC design or configuration, and HVAC condition, maintenance, or operation. Table 1 lists the risk factors of initial interest, represented by 70 variables in the BASE data. Descriptive analysis Table 2 shows the number of buildings/study spaces in each category of the risk factor variables. All variable categories contained six or more buildings. The three naturally ventilated buildings were excluded from all variables. Numbers for each variable may not add to 97 due to missing values. Thirty-three of the 97 study spaces had some operable windows, even though all were air-conditioned. Among the study spaces, 63 had variable-air-volume air handling systems, 29 had constant-air-volume systems, and five had mixed systems. Sixty-eight study spaces had at least one air handler with an economizer system (although three others had an economizer but also an air handler supplying 100% outside air). Eighty-seven study spaces had some kind of local cooling coils. Fifteen study spaces had central humidification systems, of which six (40%) were at the lowest level on a combined index of inspection frequency, cleaning frequency, and condition. Only 40 study spaces had liner in ducts and air handlers that was considered to be in good condition. Eighty-six spaces had cooling coils or drain pans cleaned only annually or without a regular schedule. Outdoor air intakes for the study spaces were mostly 0 to 30 meters above ground level, but 9 study spaces had intakes at or below ground level, and 27 study spaces had intakes more than 30 m above ground level, of which 12 were above 60 meters. Sixty-six buildings had cooling towers, of which 46 were cleaned only annually or with no regular schedule and 35 were in fair or poor condition. Fit of air filters was fair or poor for 26 study spaces, and general condition of air filtration system was fair or poor in 44 spaces. Ventilation systems operated more than 12 hours a day in 66 study spaces, of which 31 had systems operating 24 hours per day. Unadjusted analyses Table 2 shows unadjusted (bivariate) associations with outcomes for the risk factor variables selected or created after univariate analyses. Among HVAC design or configuration factors, outdoor air intake height categories less than 60 meters above the ground were strongly associated with most symptom outcomes, with some suggestion of the highest risks for intakes below ground level. Study spaces with local cooling coils were associated with increased upper respiratory symptoms, eye symptoms, and headache. (Local cooling coils are distributed at multiple locations throughout a building, rather than located only in central air handlers in mechanical rooms, on roofs, etc.) Compared to supply ducts containing no flexible duct, those including only flexible material were associated with some decreased risk of upper respiratory symptoms, and the combination of flexible and fiberboard duct was associated with a decrease in at least four symptom outcomes. Relative to buildings with unconditioned intake of outside air and intake fans (see footnote 2 for Table 2), those with some filtering or other conditioning of intake air had decreased upper respiratory symptoms. In buildings with no (or almost no) operable windows, prevalence of upper respiratory symptoms, eye symptoms, and fatigue/difficulty concentrating decreased slightly. Relative to study spaces with economizer controls on outdoor air, the “other” category (five of these six had 100% outside air) had decreased prevalence of both upper respiratory symptoms and fatigue/difficulty concentrating.

8
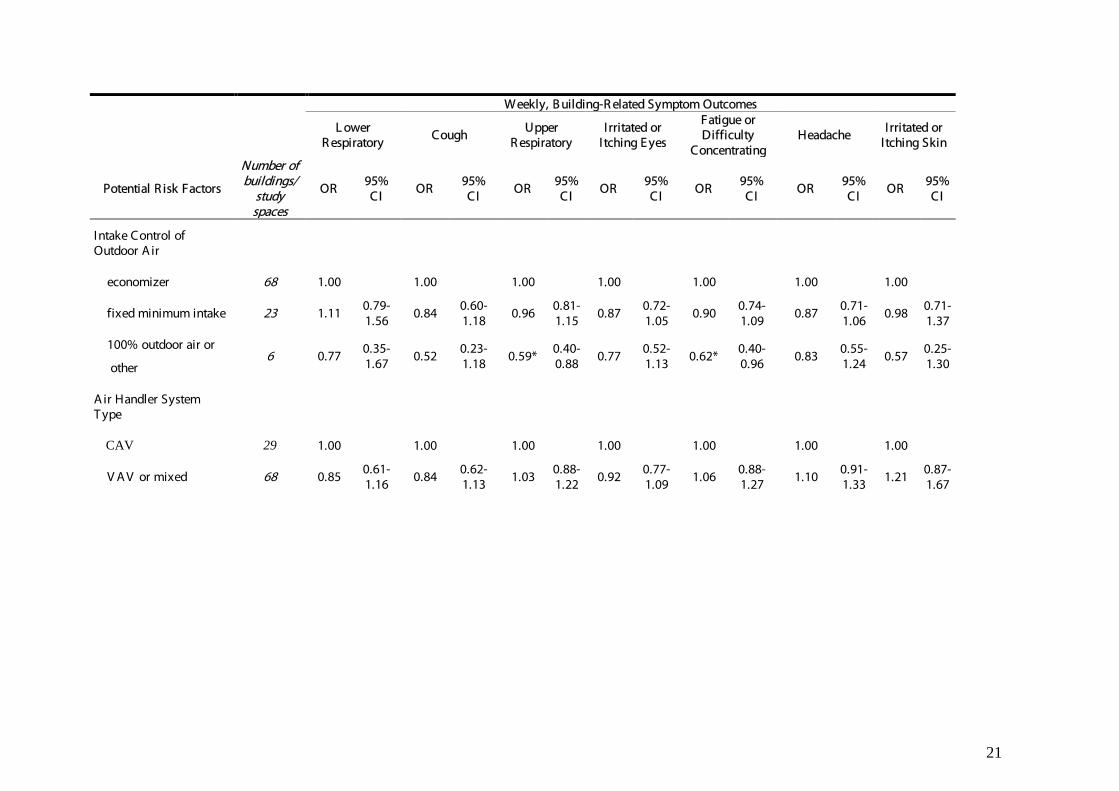
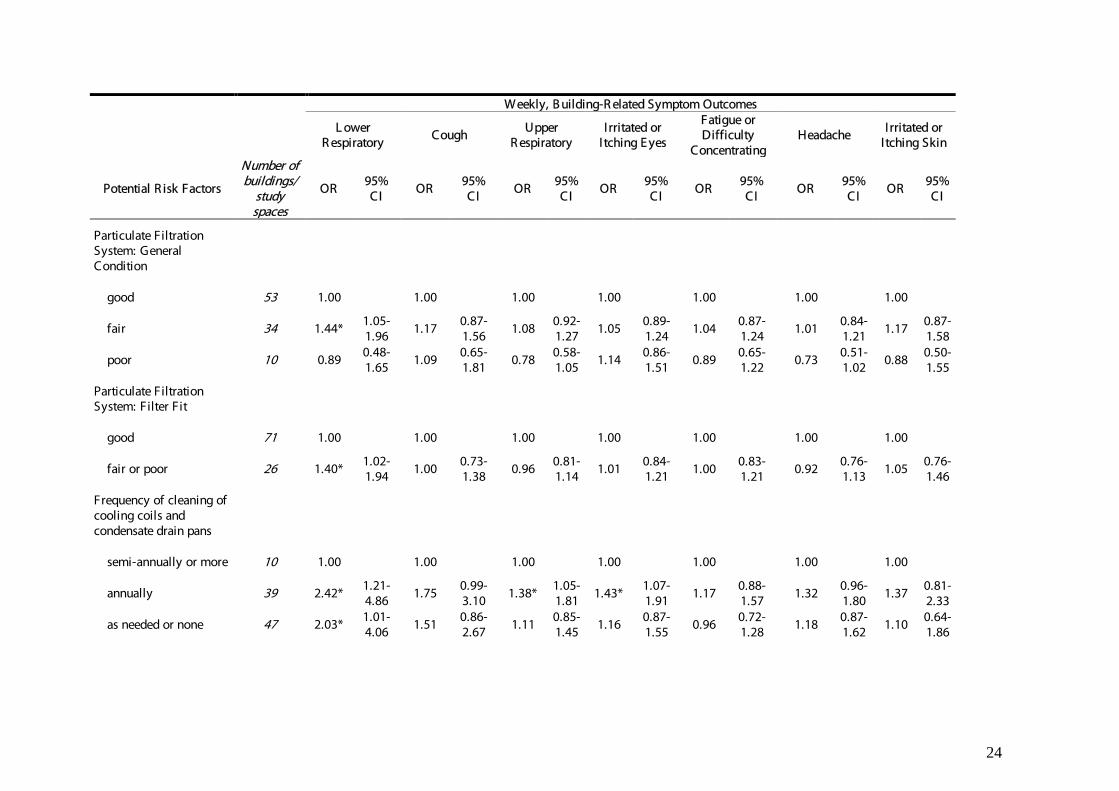
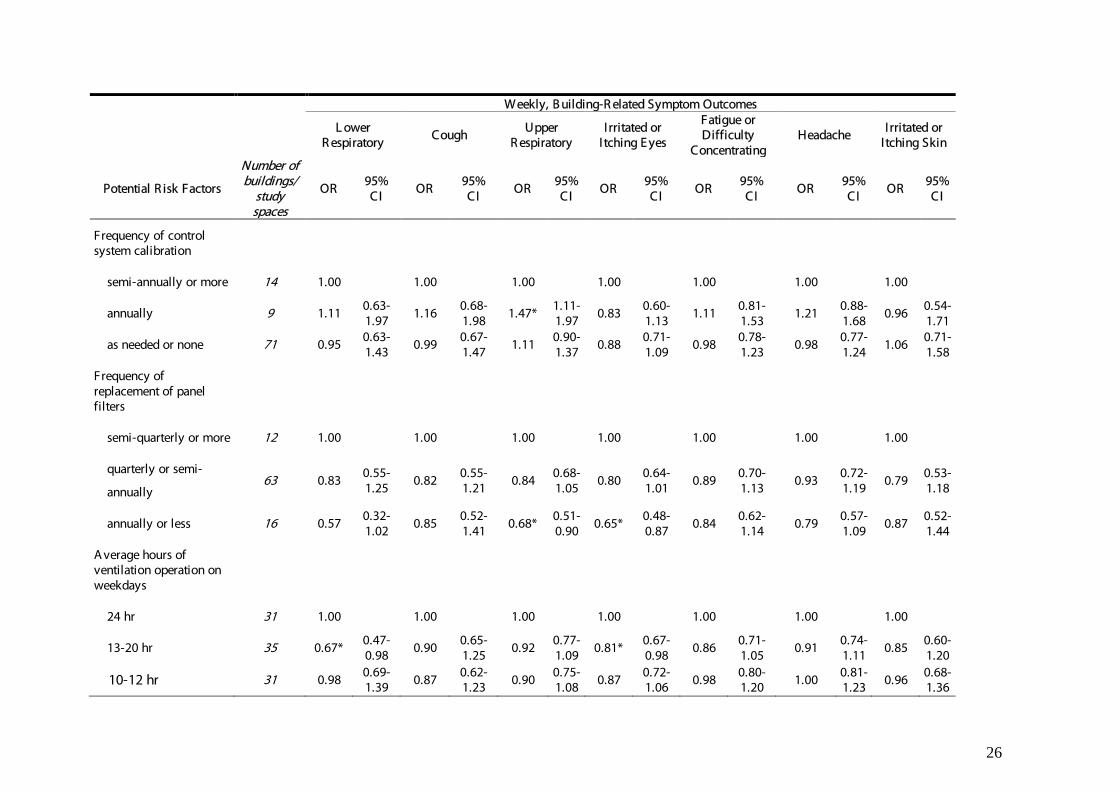
Among HVAC condition variables, the presence of a humidification system in good condition, relative to absence of humidification, was associated with some increase in headache. Humidification systems in poor condition, however, were associated with substantial increase in most symptoms. Average cleanliness/condition of air handler components rated as fair relative to good-to-fair was associated with a small unexpected reduction in four symptom outcomes; however, systems in the poorest condition were not consistently associated with changes in symptoms. Lining in the ducts and air handlers in only fair or poor relative to good condition was associated with slightly increased upper respiratory symptoms. Fair operational condition of air handling components was associated with increased upper respiratory symptoms, but those in the poorest condition were not associated with increased risk of symptoms. Fair or poor condition of cooling tower was associated with a reduction in upper respiratory symptoms. Among HVAC maintenance factors, cleaning of cooling coils and drain pans scheduled only annually was associated with increase in multiple symptoms, although the absence of regularly scheduled cleaning was associated with increase only in lower respiratory symptoms. Less frequent or unscheduled cleaning of cooling towers was associated with some decrease in several symptoms. Lack of regularly scheduled inspection of HVAC system components was associated with substantial increases in upper and lower respiratory symptoms, cough, and eye symptoms. Calibration of HVAC control systems only annually was associated with increased upper respiratory symptoms, but lack of regularly scheduled calibration was not associated with symptom prevalence. Condition of air filtration system and fit of filter had almost no association with outcomes other than increased lower respiratory symptoms. However, less frequent replacement of panel filters was associated with at least some reduced prevalence for all symptoms, especially with annual or less frequent replacement, for lower respiratory, upper respiratory, and eye symptoms. Operation of the ventilation system for 12-24 vs. 24 hours per day was associated with small decreases in lower respiratory, eye, and other symptoms, but no differences were associated with operation for only 10-12 hours per day.
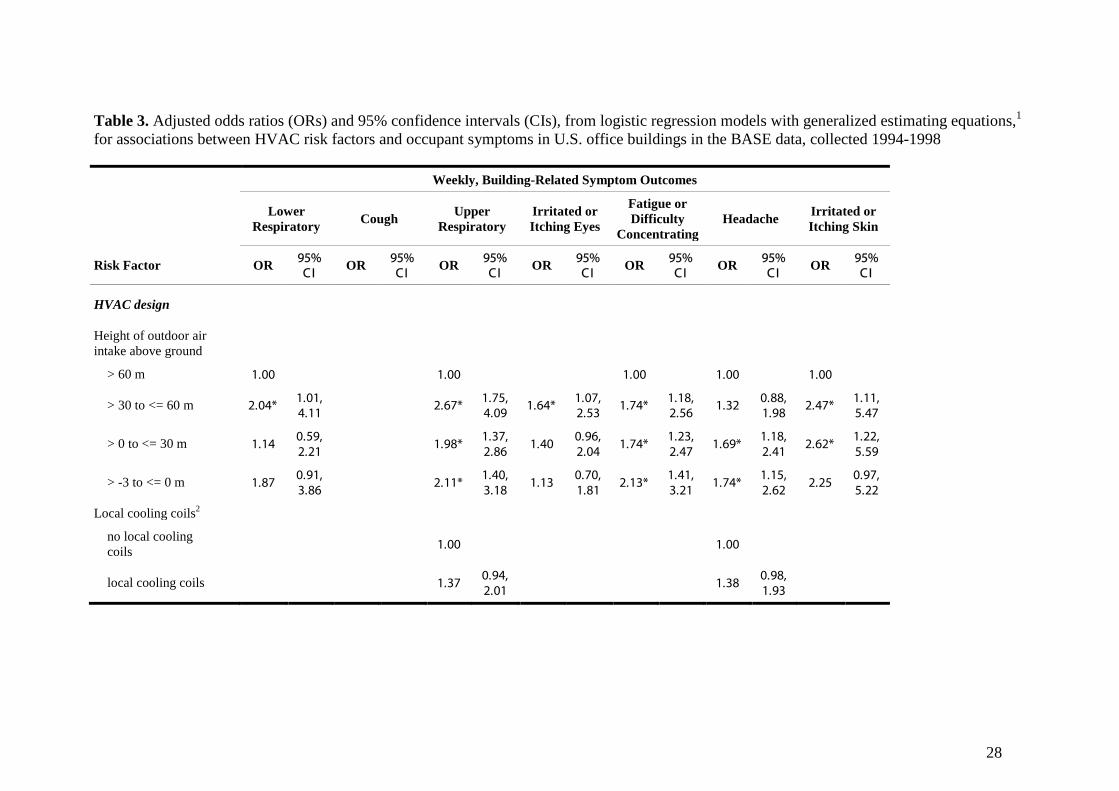
For each symptom outcome model, bivariate model outcomes determined which variables were included in initial risk selection models (not shown), using criteria described in Appendix 1. All risk factors then retained in each risk selection model were kept throughout the construction of final models for that outcome. Adjusted analyses Table 3 shows estimates from final multivariate logistic regression/GEE models, along with the numbers of individuals and buildings (= study spaces) included in each final model. Ventilation rate, when treated as a potential confounding variable, was not selected as a confounder for inclusion in any final model. Thus, the question of whether adjustment for ventilation rate would be problematic because it was in the causal pathway for several risk factors became moot. Hosmer-Lemeshow goodness-of-fit p-values for final models ranged from 0.34 to 0.97, without requiring alteration of models produced by the basic algorithm. Many fewer associations were evident after multivariate adjustment than in the bivariate models. Among HVAC design or configuration factors, outdoor air intake heights less than 60 meters above the ground were generally associated with substantially increased odds for multiple symptom outcomes, including fatigue/concentration difficulty (ORs 1.7-2.1), upper respiratory

9
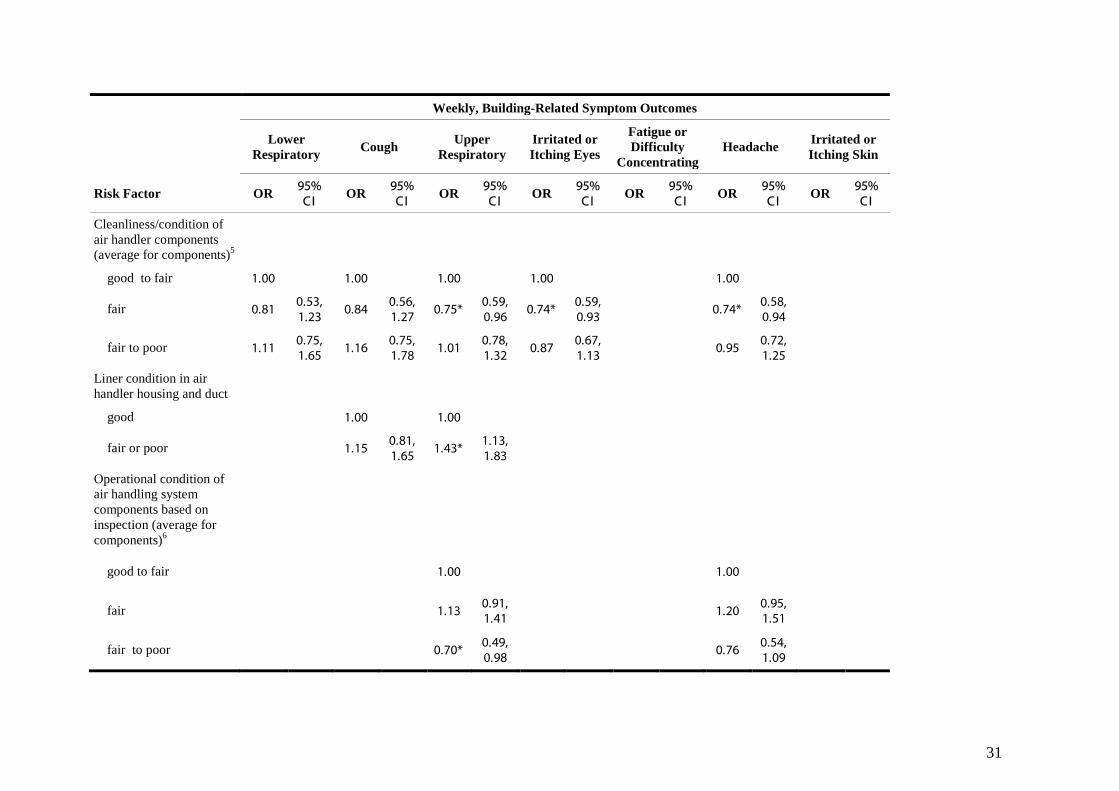
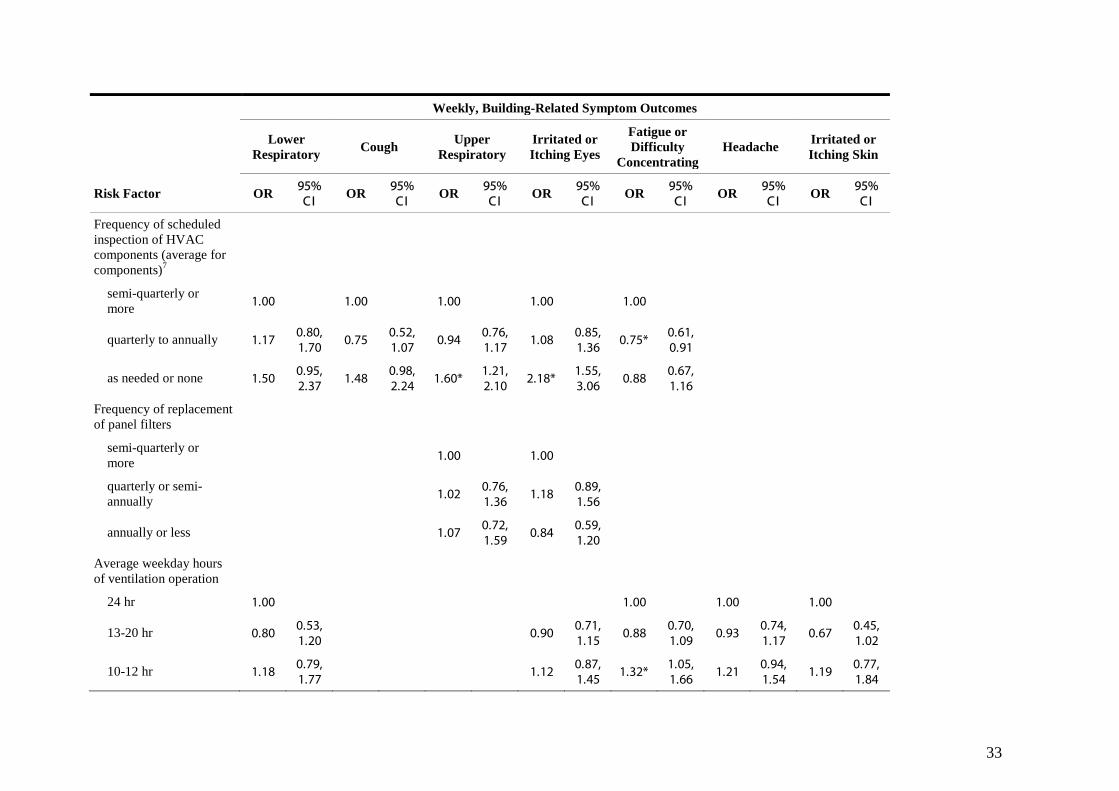
symptoms (ORs 2.0-2.7), skin symptoms (ORs 2.2-2.6), and lower respiratory symptoms (ORs 1.1-2.0). For distances less than 60 m, risks did not show systematic monotonic increases with intakes closer to the ground. HVAC systems with local cooling coils were associated with a suggestion of increased headache (OR (CI)=1.38 (0.98-1.93)) and upper respiratory symptoms (OR (CI)=1.37 (0.94 –2.01)). Unconditioned intake of outdoor air, with no intake fan was associated with an increase in eye symptoms (OR (CI)=1.72 (1.00-2.98)). In buildings with no or very few operable windows, prevalence of skin symptoms (OR (CI)=1.85 (1.24-2.76)) increased. Other HVAC design factors did not show clear adjusted associations with symptom prevalence. Among HVAC condition variables, the presence of a humidification system in good condition, relative to no humidification, was associated with a significant decrease in skin symptoms (OR (CI)=0.47 (0.23-0.96)), and a suggestion of an increase in headache (OR (CI)=1.34 (0.98-1.85)). Humidification systems in the lowest category of condition and maintenance, however, were associated with some increase in most symptoms, especially fatigue/ difficulty concentrating (OR (CI)=1.67 (1.23-2.26)), skin symptoms (OR (CI)=1.65 (1.02-2.68)), upper respiratory symptoms (OR (CI)=1.49 (1.09-2.05)), and eye symptoms (OR (CI)=1.46 (1.05-2.03)). Among other HVAC condition factors, cleanliness/condition of air handler components was not consistently associated with symptoms, although fair condition relative to good-to-fair condition was associated with a small reduction in headache, upper respiratory symptoms, and eye symptoms. Having lining in the ducts and air handlers in only fair or poor condition was associated with some increase in upper respiratory symptoms (OR (CI)=1.43 (1.13-1.83)). Although there was a suggestion of an increased risk for HVAC components in fair operational condition relative to the best condition category (good-to-fair), fair-to-poor operational condition was associated with some unexpected decrease in upper respiratory symptoms (OR (CI)=0.70 (0.49-0.98)). Among HVAC maintenance factors, cleaning of cooling coils and drain pans scheduled only annually or not scheduled, relative to at least semi-annually, were associated with increase in headache (OR (CI)=1.57 (1.09-2.25) and 1.47 (1.03-2.11), and eye symptoms (OR (CI)=1.67 (1.15-2.41) and (OR (CI)=1.48 (1.01-2.17)), respectively, and also with some apparent increase in lower respiratory symptoms and, possibly, fatigue/difficulty concentrating symptoms. Inspection of HVAC system components scheduled only quarterly to annually relative to more often was not associated with increased symptoms except for a small reduction in fatigue/concentration difficulty: OR(CI)=0.75 (0.61-0.91)); however, lack of a regular maintenance schedule was associated with substantial increases in eye symptoms (OR (CI)=2.18 (1.55-3.06)) and upper respiratory symptoms (OR (CI)=1.60 (1.21-2.10)), along with possible increases in lower respiratory symptoms and cough. Operation of the ventilation system for between 13 and 20 hours per day, relative to 24-hour operation, was associated with slightly lower prevalence of several symptoms, although confidence intervals were broad. Operation for only 10-12 hours per day, however, was associated with slightly higher prevalence of several symptoms, especially fatigue/difficulty concentrating (OR (CI)=1.32 (1.05-1.66)) and possibly headache.

10
Other Results Figure 1 plots of the crude prevalence of upper respiratory symptoms as a function of outdoor air intake height. Symptom prevalence was substantially higher at intake heights less than about 60 m above ground level, and reasonably homogeneous within that range. This relationship also generally held for other symptoms we investigated (not shown). Figures 2-4 show data from 96 buildings with HVAC systems and available data on indoor and outdoor VOC concentrations from SUMMA canister measurements. Figure 2 shows a plot of the average concentrations of o-xylene, measured outside each building (at about the height and location of the outdoor air intake for the study space), as a function of outdoor air intake height. The concentrations are reasonably homogeneous at heights up to about 60-65 m above the ground, and then decrease at higher levels. Results for the other vehicle-related compounds investigated were generally similar. Figure 3, which plots the same data as Figure 2 but using indoor concentrations of o-xylene, shows a similar pattern within a higher range of concentrations. Figure 4 shows indoor concentrations of o-xylene plotted against outdoor concentrations, with a crude trend line suggesting that they are positively correlated. The outdoor and indoor concentrations, however, each measured in two different ways, did not show consistent positive correlations with crude prevalence of symptoms reported by occupants in the study spaces (not shown). Measurements based on SUMMA canister samples showed such a relationship with upper respiratory symptoms for most BTEX compounds except benzene; however, measurements based on multisorbent tube samples in 70 buildings did not show such relationships. Discussion Comparison with prior findings and predictions The EPA BASE data allow the first broad assessment in U.S. office buildings of the associations between suspected indoor environmental risk factors and nonspecific symptoms in office workers. The present analysis primarily investigated aspects of HVAC systems not previously assessed for associations with symptoms, and chosen through engineering judgment of what characteristics of HVAC systems might plausibly increase indoor exposures to contaminants. (Ventilation rates in BASE, for instance, have been the subject of separate analyses (Apte, Fisk et al. 2000; Mendell, Lei et al. 2005), and are included in current analyses only as potential confounding variables.) Thus the primary goal of this analysis was to explore preliminary hypotheses. A few risk factors included in the present analyses have been investigated previously. Prior analyses of the BASE study data, using slightly different definitions for symptom outcomes and risk factor categories, found similarly elevated risks for less frequently cleaned condensate drain pans and coils (Mendell, Cozen et al. 2006). Prior analyses of other data, from office buildings investigated for health complaints by occupants, found elevated lower respiratory symptoms associated with several aspects of poor HVAC maintenance, including poorly draining condensate drain pans and debris in air intakes (Mendell, Naco et al. 2003). Similarly increased odds ratios for these risk factors were not found in the present analyses, in initial crude models with specific HVAC condition variables; these variables were then combined into composite variables in the current analyses. The higher contamination levels found in “complaint” buildings may be unusual in “normal” buildings, and thus too uncommon to be detectable with a statistically significant signal in a relatively small study such as in the 100 BASE buildings.

11
Prior studies have found presence of humidification systems to be associated with increased symptoms (Mendell and Smith 1990), although the relationship has not been consistent (Seppanen and Fisk 2002). Analyses here examined the risks of humidification systems, including the quality of system maintenance and condition. To our knowledge this has not been reported before. Poorly maintained humidification systems were associated with increases in most symptoms assessed, while well-maintained humidification systems had only a marginal adverse association with increased headache. Humidification is considered to reduce dryness-related symptoms in cold-winter climates. The only apparent protective association of well-maintained humidifiers, however, was with skin symptoms. If these findings were replicated, consideration of humidification systems would need to balance this potential benefit (53% reduction in odds of skin symptoms, although with a 34% increase for headache) with the well maintained humidifiers in this study, against the apparently larger potential adverse effects associated with the poorly maintained humidification systems (31 to 65% increase in odds for six symptoms, including skin, in 40% of the buildings with humidification systems). Local cooling coils have been suspected to increase risks because of the difficulty of cleaning and maintaining large numbers of coils distributed throughout a building, often in hard-to-access locations such as in ceilings. Only one study has reported investigating the association between local cooling units (e.g., fan coil units) in office buildings and symptoms (Burge, Hedge et al. 1987). That study found this to be one of several types of HVAC configuration associated with the elevation of a “total symptom index,” relative to naturally ventilated buildings. The current analysis found local cooling units were associated only with some possible increase in headache and upper respiratory symptoms, although the reference was other air-conditioned buildings, not naturally ventilated buildings, which could be expected to have generally lower symptom prevalence (Seppanen and Fisk 2002). Lack of operable windows was associated only with increased skin symptoms. Despite widespread anecdotal dissatisfaction of occupants with sealed windows in office buildings, there have been almost no prior epidemiologic studies of symptom prevalence related to sealed windows. This may be because sealed windows and air-conditioning, another risk factor for increased symptoms in offices, are closely correlated in practice. Zweers, in a multivariate analysis of data from Dutch office buildings of different ventilation types, also found that sealed windows were associated with increases in skin symptoms (Zweers, Preller et al. 1992). It is not clear what mechanism would explain this. Other risk factors for which our findings accord roughly with anecdotal beliefs among building investigators include HVAC systems lacking regularly scheduled inspections (increased eye symptoms, upper and lower respiratory symptoms, and cough), and poorer condition (e.g., dirty or wet) of lining in ducts and air handler housings (increased upper respiratory symptoms). The most striking and consistent finding, which to our knowledge has not been previously reported, was that outdoor air intakes less than 60 m above the ground were associated with, on average, approximately 40% to 140% increased odds for all symptom outcomes. Risks did not increase consistently as intake heights decreased within the range (60 m down to –3 m). It is not apparent what could explain this strong effect, seen with air intakes even eight to fifteen stories (30-60 m) above the ground. This consistent association may result from intake of outdoor air pollutants, such as vehicle-related pollutants, that are at higher concentrations near ground level

12
in cities. Ground-level vehicular exhaust pollutants, to explain the current findings, would need to be evenly mixed well above 30 m above the ground but at lesser concentrations higher up. Outdoor measurements across the different BASE buildings were consistent with such an outdoor gradient (as in Figure 2), although they did not include measurements at different heights outside the same buildings. A study by Rubino et al. (1998) provides data relevant to this question. This study monitored concentrations of vehicle-related pollutants in outdoor air, for 30 days, at various heights outside a 100 m tall urban building. They reported decreasing concentrations of automotive-related pollutants with increasing height. As distance above ground level increased from 0 to 80 m, airborne concentrations of PM10 decreased steadily from 40 to 32 µg/m3, but for distances between 80-110 m, PM10 dropped suddenly to about 25 µg/m3. BTEX compounds were approximately 25% lower (97 vs. 136 µg/m3) at heights of 75-105 m than at 15-45 m. CO concentrations decreased about 29% as height increased from 4 to 104 m above ground, with the steepest decrease up to 20 m, but some continued reduction up to about 50 m. The data in Figures 1-4 do suggest that outdoor vehicle-related VOCs, when taken in through low outdoor air intakes, may increase indoor exposures to these pollutants. The data also suggest that these VOCs, or other correlated vehicle-emitted pollutants such as CO or particles, may have a role in the occurrence of building-related symptoms. Exposures to the compounds in vehicular emissions, however, have to our knowledge not yet been previously shown to cause increased symptoms at the still low indoor concentrations (i.e., 2-4 ppb) associated with these increased outdoor concentrations. The indoor concentrations of o-xylene in the BASE buildings (range mostly 0-3 ppb) are often but not always higher (Figure 4) than the corresponding outdoor concentrations near the air intakes (mostly 0-1.5 ppb), presumably due to indoor sources. A similar trend was observed for the other BTEX compounds measured at the BASE buildings. The associations found here of outdoor air intakes below 60 m and increased occupant symptoms need replication and explanation. Limitations The BASE data, although the largest and most comprehensive collection of standardized data on indoor environments and occupants in representative office buildings in the U.S., has many limitations for helping understand causes of building-related health effects. The BASE study was conducted primarily to obtain normative data rather than to test specific a priori hypotheses, and has limitations for epidemiologic analyses. Thus many building features of research interest cannot be investigated because of insufficient representation in the study buildings. Even where categories with six or seven buildings were included in analyses, for instance, precise estimates of even actual increased risks are unlikely unless relative risks are large. BASE data were collected on many questions, so that each often lacks sufficient detail or accuracy to answer specific hypothetical questions. There are also inherent difficulties in studying environments as complex as large buildings: multiple potential levels exist for defining risk factors and determinants of exposures, with data items collected at either the building, study space, or air-handler level. Although the BASE study contained over 4,000 individual occupants in the study spaces, available resources allowed collection and analysis of most environmental data only at the level of the 100 buildings or study spaces rather than at the level of individual workspaces, allowing limited analysis of variation in these factors. The environmental reports from inspection are subjective and imprecise, and the resulting inaccuracies could have resulted in bias
13
toward the null, obscuring true associations. This is also true of the subjective, self reported health outcome assessments used. With respect to limitations in the analyses, the many intercorrelated environmental factors assessed could often not be included in the same models, making it impossible to assess risks for some factors of interest while holding other closely related factors constant. Many factors of interest did not have sufficient variation in the study buildings to include in analyses. Finally, this analysis included many risk factors and statistical tests, leading to the possibility of false positive associations occurring by chance alone (Rothman 1990). We consider the risk factor variables used in the analyses to be the 37 terms for potential risk factors included in initial bivariate models for seven outcomes. If no true underlying associations existed and if all estimates were independent, chance alone would predict approximately 13 associations with p<0.05 (e. g, 37*7/20) in final models. Thus, of the 32 associations with p-values <0.05 in the final multivariate models, about 40% may have been false positives. The least likely to be false positives are those reported previously from other data or found for multiple symptom outcomes. Interpretation This analysis explored various aspects of HVAC systems as potential risk factors to explain the consistent previous finding that the presence of HVAC systems is associated with, on average, increased building-related symptoms among occupants. Nevertheless, HVAC systems are necessary in buildings to maintain thermal comfort, control humidity, and provide outdoor air in order to maintain good indoor environmental quality. Prior available evidence suggests either production of contaminants (Mendell, Naco et al. 2003) or less effective ventilation by some HVAC systems as the most likely explanation. However, little epidemiologic investigation of this question has occurred. The present analysis suggests several aspects of HVAC systems (poorly maintained humidification systems, coils/drain pans, or other HVAC components), some already prior suspects and some not, that when deficient may increase occupant symptoms, but that may be modified to prevent the symptoms. Other possible parts of the explanation include inadequate outdoor air ventilation (Seppanen, Fisk et al. 1999) and inadequate thermal control (Mendell, Fisk et al. 2002). An additional possibility, not yet widely considered, is that, in general, conventional HVAC system design in air-conditioned buildings, involving frequently wet surfaces on cooling coils, drain pans, and sometimes humidifiers, may lead to as yet uncharacterized microbiologic exposures, and consequent illness syndromes (Menzies, Popa et al. 2003; Mendell 2004). Poor maintenance or condition of the HVAC or humidification systems would then further increase a higher baseline risk associated with HVAC systems. There is limited information in the associations found to suggest specific biologic mechanisms of response, based on similar symptom responses to related risks (e.g., for moisture and microbiologic contamination). Low height of outdoor air intake was associated with almost all symptom outcomes assessed, including lower and upper respiratory symptoms, fatigue/difficulty concentrating, headache, and skin symptoms. Although vehicular pollutants seem to be a likely explanation, specific mechanisms to explain these symptoms are not obvious. Rubino et al. (1998), based on their study of vertical concentration gradients of outdoor vehicle-related pollutants, recommended that, since indoor air quality in urban buildings relies heavily on outdoor air quality, and large improvements in outdoor air quality are achievable only with large-scale urban changes, increasing height of outdoor air intakes may allow practical improvements

14
in IAQ. A guide to building design by the city of Seattle also suggests locating building air intakes as high above the ground as possible to avoid intake of vehicular pollutants such as carbon monoxide and particles (Department of Planning and Development 2006). Humidification systems in poor condition were associated with increased upper respiratory symptoms, fatigue/concentration difficulty, eye and skin symptoms, and headache. Microbiologic contamination seems the most likely source of any resulting exposures, through allergic, irritant, or other mechanisms. Chemical biocides used in some humidifier systems, however, are also a potential explanation. On the other hand, infrequently cleaned cooling coils and condensate drip pans were associated with different symptoms – lower respiratory symptoms and headache – suggesting possibly different biologic mechanisms. As to the public health and economic implications of the reported symptoms, if exposures from HVAC systems were causal, the severity and discomfort involved for each individual can not be determined from these data, nor is the amount of any related illness absence or use of medical services or medication known. It seems plausible that increased fatigue/difficulty concentrating in a work setting would reduce work performance, which would have adverse economic effects separate from illness absence and costs of health care. The economic costs of building-related symptoms from reduced work performance in offices have been estimated to be very large (Fisk 2000; Mendell, Fisk et al. 2002). One recent finding suggests that factors related to air-conditioning systems in office buildings were associated with large increases in physician visits and sickness absence among workers (Preziosi, Czernichow et al. 2004). Overall, findings here and elsewhere suggest that some aspects of HVAC systems, related to contaminants either produced by the systems or brought in from outside, may increase risk of building-related symptoms in office buildings. The data used for these analyses, however, were not collected to explore our specific hypotheses, and thus were not optimal for that purpose. Future hypothesis-driven research, including detailed collection of appropriate data related to both environmental risk factors and health outcomes, is necessary to confirm and clarify the relationships reported here. If the relationships we have found are confirmed, then preventive actions in office and other commercial buildings could have substantial public health and economic benefits. Relatively straightforward modifications to the design and maintenance of ventilation systems may allow reductions in symptoms and improvements of work performance for millions of office workers.
15
Appendix 1. –Modeling procedures All analyses were performed using SAS version 8 (SAS Institute Inc. 2002). We first identified all variables in the BASE data corresponding to risk factors of interest for this analysis: features or practices in buildings hypothesized to be related to contamination or performance of HVAC system, including aspects of design, operation, maintenance, and condition of HVAC systems. We used data from the specific test space studied in each building where available and appropriate; otherwise we used data applicable to each building. Additional steps in the analyses were as follows:
(1) From univariate/descriptive analyses of potential risk variables, we excluded those with too many missing values (>10%), or insufficient variation in the key contrast (less than 5% of observations in any key category). We collapsed categories where necessary and feasible, and in some cases created combined variables or indices that summarized risks from closely related or highly correlated variables, to create the initial set of risk factor variables. All risk factor variables were dichotomous or categorical.
(2) For each of the seven symptom outcomes, we performed bivariate analyses with the initial risk factor variables, retaining for further analyses those with at least moderate associations. For this we required either an overall p-value< 0.25 or additionally, for multicategorical variables, a p-value <0.15 for any single term or category of a variable or a Mantel-Haenzsel trend p-value of <0.15. The set of retained risk factors varied across the different outcome models.
(3) For each symptom outcome, we then examined all risk variables remaining after step 2 together in a “risk selection” model, in order to identify and omit variables with no association with the outcomes when adjusted for other risk factors. We sequentially excluded the variable with the highest p-value, stopping when all p-values were <0.20. We also identified highly correlated variables, and combined, revised, or eliminated them as necessary.
(4) To the reduced set of risk variables in each outcome model, we added potential confounding variables, personal or environmental. Potential confounders were added sequentially to the model, and retained if an addition changed the point estimate for any risk factor by at least 10%. Selection of confounding variables was not based on hypothetically predicted potential for confounding (e.g., gender is included as a confounder, yet is unlikely to be systematically related to HVAC factors).
(5) We then reconsidered previously rejected risk variables again for contribution to these expanded models, retaining any with a p-value <0.05.
(6) Finally, we considered potential interactions between some variables in the models, but identified no evident important interactions.
(7) At this point, we examined the Hosmer-Lemeshow Goodness-of-Fit statistic, and if p<0.05, we omitted the confounders with the highest p-values until the Goodness-of-Fit p-value ≥0.05. The final models provide adjusted estimates, as odds ratios and 95% confidence intervals, for the strength of association between the risk variables and the symptom outcomes.
(8) Using the set of final logistic regression models for each of the seven outcomes, we then imputed missing values on personal variables (but not environmental or building variables) using SAS Proc MI (4 iterations) and reran the final logistic regression models.
16
Finally, we used General Estimating Equations (GEE) in SAS Proc Genmod to adjust for potential correlation of observations within each building.
References
Apte, M. G., W. J. Fisk, et al. (2000). "Associations between indoor CO2 concentrations and sick building syndrome symptoms in U.S. office buildings: an analysis of the 1994-1996 BASE study data." Indoor Air 10(4): 246-57.
Brightman, H. S. and N. Moss (2000). Sick building syndrome studies and the compilation of normative and comparative values. Indoor Air Quality Handbook. J. Spengler, J. M. Samet and J. F. McCarthy. New York, McGraw-Hill: 3.1-3.32.
Burge, S., A. Hedge, et al. (1987). "Sick building syndrome: a study of 4373 office workers." Ann Occup Hyg 31(4A): 493-504.
Department of Planning and Development, C. o. S. (2006). "Outdoor air quality in the Puget Sound area and implications for building ventilation systems." Retrieved December 15, 2006, from http://www.seattle.gov/dpd/publications/cam/cam406.pdf.
Fisk, W. J. (2000). Estimates of potential nationwide productivity and health benefits from better indoor environments: an update. Indoor Air Quality Handbook. J. Spengler, J. M. Samet and J. F. McCarthy. New York, McGraw-Hill: 4.1-4.36.
Mendell, M. J. (2004). "Commentary: air conditioning as a risk for increased use of health services." Int J Epidemiol 33(5): 1123-6.
Mendell, M. J., M. Cozen, et al. (2006). "Indicators of moisture and ventilation system contamination in U.S. office buildings as risk factors for respiratory and mucous membrane symptoms: analyses of the EPA BASE data." J Occup Environ Hyg 3(5): 225-33.
Mendell, M. J., W. J. Fisk, et al. (2002). "Improving the health of workers in indoor environments: priority research needs for a national occupational research agenda." Am J Public Health 92(9): 1430-40.
Mendell, M. J., W. J. Fisk, et al. (2002). "Indoor particles and symptoms among office workers: results from a double-blind cross-over study." Epidemiology 13(3): 296-304.
Mendell, M. J., Q. Lei, et al. (2005). Estimated ventilation rates and work-related symptoms in U.S. office buildings -- the BASE Study. Indoor Air 2005: Proceedings of the 10th International Conference on Indoor Air Quality and Climate, Beijing, China, Tsinghua University Press.
Mendell, M. J., G. M. Naco, et al. (2003). "Environmental risk factors and work-related lower respiratory symptoms in 80 office buildings: an exploratory analysis of NIOSH data." Am J Ind Med 43(6): 630-41.
Mendell, M. J. and A. H. Smith (1990). "Consistent pattern of elevated symptoms in air-conditioned office buildings: a reanalysis of epidemiologic studies." Am J Public Health 80(10): 1193-9.
Menzies, D., J. Popa, et al. (2003). "Effect of ultraviolet germicidal lights installed in office ventilation systems on workers' health and wellbeing: double-blind multiple crossover trial." Lancet 362(9398): 1785-91.

17
Park, J. H., P. L. Schleiff, et al. (2004). "Building-related respiratory symptoms can be predicted with semi-quantitative indices of exposure to dampness and mold." Indoor Air 14(6): 425-33.
Preziosi, P., S. Czernichow, et al. (2004). "Workplace air-conditioning and health services attendance among French middle-aged women: a prospective cohort study." Int J Epidemiol 33(5): 1120-3.
Rothman, K. J. (1990). "No adjustments are needed for multiple comparisons." Epidemiology 1(1): 43-6.
Rubino, F. M., L. Floridia, et al. (1998). "Height profile of some air quality markers in the urban atmosphere surrounding a 100 m tower building." Atmospheric Environment 32(20): 3569-3580.
SAS Institute Inc. (2002). "SAS Version 8." 8.2. Retrieved September 27, 2002, from http://www.sas.com/service/library/onlinedoc/.
Seppanen, O. and W. J. Fisk (2002). "Association of ventilation system type with SBS symptoms in office workers." Indoor Air 12(2): 98-112.
Seppanen, O., W. J. Fisk, et al. (1999). "Association of ventilation rates and CO2 concentrations with health and other responses in commercial and institutional buildings." Indoor Air 9(4): 226-252.
Sieber, W. K., L. T. Stayner, et al. (1996). "The National Institute for Occupational Safety and Health indoor environmental evaluation experience. Part Three: Associations between environmental factors and self-reported health conditions." Applied Occupational and Environmental Hygiene. 11(12): 1387-1392.
U.S. Environmental Protection Agency (2003). A standardized EPA protocol for characterizing indoor air quality in large office buildings. Washington, D.C., U.S. Environmental Protection Agency.
Zweers, T., L. Preller, et al. (1992). "Health and indoor climate complaints of 7043 office workers in 61 buildings in the Netherlands." Indoor Air 2: 127-136.

18
Table 1. Initial HVAC system risk factors considered for analyses1, 2
HVAC Risk Factors of Initial Interest
Prior evidence as risk factor HVAC Design or Configuration HVAC Condition, Maintenance, or
Operation Potential sources of contaminants
Presence and type of local coils and drain pans
Humidification type HVAC configuration (e.g.,
roof-top units, through-the- wall units, etc.)
Height of outdoor air intake location
Supply duct material Outdoor air intake strategy Nearby pollution sources3
Condition of air handling unit components and ducts
Condition and maintenance of humidification systems, if present
Condition of filtration system Condition of cooling towers Condition of liner in air handler
and ducts Filter fit Frequency of cleaning of coils/
condensate drain pans Frequency of filter replacement Frequency of controls calibration Frequency of cooling tower
cleaning Frequency of scheduled inspection
of HVAC components
Potentially related to amount of ventilation
Outdoor flow control strategy (economizers)
Floor area per operable window Average daily hours of
ventilation Variable-air-volume vs.
constant-air-volume3
Operational condition of HVAC components
1 Some risk factors were initially excluded before bivariate models because of missing data, inadequate variation, or inconsistent information, and thus were never evaluated for associations with symptoms: type of ductwork in central air handler, return duct material, building exhaust system, frequency of HVAC cleaning (except for specific variables on cleaning of cooling coils, drip pans, and humidifiers), minimum outdoor air intake rate, frequency of testing and balancing, correct fan direction, morning purge cycle.
2 All variables in table not noted as excluded after bivariate analyses (x) were retained for initial risk selection models either as individual variables or combined with others as composite variables.
3 These variables were excluded from all outcome models in bivariate analyses

19
Table 2. Unadjusted odds ratios (ORs) and 95% confidence intervals (CIs) for associations between HVAC risk factors and occupant symptoms in U.S. office buildings in the BASE data, collected 1994-1998 Weekly, B uilding-R elated Symptom Outcomes
L ower R espiratory Cough Upper
R espiratory I rritated or
I tching E yes Fatigue or Difficulty
Concentrating Headache I rritated or
I tching Skin
Potential R isk Factors
Number of buildings/
study spaces
OR 95% CI OR 95%
CI OR 95% CI OR 95%
CI OR 95% CI OR 95%
CI OR 95% CI
HV AC design
Height of outdoor air intake above ground
> 60 m 12 1.00 1.00 1.00 1.00 1.00 1.00 1.00
> 30 to <= 60 m 15 2.34* 1.23-4.45 1.56 0.86-
2.84 2.42* 1.72-3.41 1.47* 1.05-
2.06 1.76* 1.22-2.53 1.28 0.88-
1.87 2.25* 1.11-4.54
> 0 to <= 30 m 60 1.31 0.73-2.35 1.42 0.85-
2.38 2.19* 1.62-2.96 1.57* 1.18-
2.09 1.67* 1.22-2.27 1.58* 1.16-
2.16 2.11* 1.13-3.94
> -3 to <= 0 m 9 2.81* 1.46-5.40 1.54 0.82-
2.89 2.43* 1.70-3.48 1.50* 1.05-
2.15 1.86* 1.28-2.72 1.82* 1.24-
2.66 2.51* 1.23-5.15
L ocal cooling coils1
no local coils 10 1.00 1.00 1.00 1.00 1.00 1.00 1.00
local coils 87 1.05 0.63-1.74 1.26 0.76-
2.10 1.77* 1.33-2.38 1.50* 1.12-
2.01 1.12 0.84-1.48 1.49* 1.08-
2.05 0.86 0.55-1.36
Supply duct material
no flexible duct 26 1.00 1.00 1.00 1.00 1.00 1.00 1.00
flexible only 61 0.91 0.65-1.27 0.85 0.62-
1.15 0.82* 0.69-0.97 0.88 0.74-
1.06 0.96 0.79-1.15 0.94 0.77-
1.14 0.98 0.71-1.35
flexible and fiberboard 10 0.71 0.40-1.29 0.57 0.32-
1.01 0.67* 0.50-0.89 0.71* 0.52-
0.96 0.67* 0.48-0.92 0.94 0.69-
1.29 0.48* 0.25-0.93
20
Weekly, B uilding-R elated Symptom Outcomes
L ower R espiratory Cough Upper
R espiratory I rritated or
I tching E yes Fatigue or Difficulty
Concentrating Headache I rritated or
I tching Skin
Potential R isk Factors
Number of buildings/
study spaces
OR 95% CI OR 95%
CI OR 95% CI OR 95%
CI OR 95% CI OR 95%
CI OR 95% CI
Outdoor air intake strategy2
unconditioned and
with intake fan 7 1.00 1.00 1.00 1.00 1.00 1.00 1.00
conditioned and
with intake fan 8 0.47 0.20-
1.12 0.64 0.30-1.35 0.59* 0.40-
0.87 0.84 0.54-1.30 1.15 0.72-
1.82 1.05 0.66-1.69 0.57 0.25-
1.30
unconditioned and
with no intake fan 77 0.89 0.50-
1.59 0.88 0.51-1.52 0.85 0.63-
1.14 1.20 0.85-1.68 1.35 0.93-
1.96 1.28 0.88-1.86 1.01 0.57-
1.81
Floor A rea per Operable Window
<600 sq m/ operable
window 32 1.00 1.00 1.00 1.00 1.00 1.00 1.00
>=600 sq m/ operable
window or none 65 1.00 0.73-
1.37 0.80 0.60-1.07 0.77* 0.66-
0.89 0.85* 0.72-1.00 0.82* 0.69-
0.97 1.03 0.86-1.23 1.12 0.82-
1.52
21
Weekly, B uilding-R elated Symptom Outcomes
L ower R espiratory Cough Upper
R espiratory I rritated or
I tching E yes Fatigue or Difficulty
Concentrating Headache I rritated or
I tching Skin
Potential R isk Factors
Number of buildings/
study spaces
OR 95% CI OR 95%
CI OR 95% CI OR 95%
CI OR 95% CI OR 95%
CI OR 95% CI
Intake Control of Outdoor A ir
economizer 68 1.00 1.00 1.00 1.00 1.00 1.00 1.00
fixed minimum intake 23 1.11 0.79-1.56 0.84 0.60-
1.18 0.96 0.81-1.15 0.87 0.72-
1.05 0.90 0.74-1.09 0.87 0.71-
1.06 0.98 0.71-1.37
100% outdoor air or
other 6 0.77 0.35-
1.67 0.52 0.23-1.18 0.59* 0.40-
0.88 0.77 0.52-1.13 0.62* 0.40-
0.96 0.83 0.55-1.24 0.57 0.25-
1.30
A ir Handler System T ype
CAV 29 1.00 1.00 1.00 1.00 1.00 1.00 1.00
V A V or mixed 68 0.85 0.61-1.16 0.84 0.62-
1.13 1.03 0.88-1.22 0.92 0.77-
1.09 1.06 0.88-1.27 1.10 0.91-
1.33 1.21 0.87-1.67
22
Weekly, B uilding-R elated Symptom Outcomes
L ower R espiratory Cough Upper
R espiratory I rritated or
I tching E yes Fatigue or Difficulty
Concentrating Headache I rritated or
I tching Skin
Potential R isk Factors
Number of buildings/
study spaces
OR 95% CI OR 95%
CI OR 95% CI OR 95%
CI OR 95% CI OR 95%
CI OR 95% CI
HV AC condition, maintenance, or operation
Central humidification system3
no humidification
system 82 1.00 1.00 1.00 1.00 1.00 1.00 1.00
humidified, maintenance/condition good or fair
9 0.61 0.32-1.18 0.92 0.54-
1.56 0.99 0.75-1.29 0.84 0.62-
1.13 0.84 0.62-1.15 1.33 1.00-
1.76 0.64 0.35-1.20
humidified, maintenance/condition poor
6 1.28 0.80-2.05 2.06* 1.40-
3.01 2.05* 1.63-2.57 1.87* 1.48-
2.38 1.88* 1.47-2.41 1.74* 1.34-
2.25 1.80* 1.20-2.69
Cleanliness/condition of air handler components4 (average for components)
good to fair 39 1.00 1.00 1.00 1.00 1.00 1.00 1.00
fair 31 0.68 0.46-1.00 0.81 0.57-
1.13 0.83* 0.70-0.99 0.78* 0.65-
0.94 0.78* 0.65-0.95 0.78* 0.64-
0.96 0.88 0.63-1.23
fair to poor 27 1.29 0.92-1.82 1.18 0.85-
1.64 1.00 0.84-1.20 0.95 0.78-
1.14 0.86 0.70-1.05 0.88 0.72-
1.09 0.94 0.66-1.34

23
Weekly, B uilding-R elated Symptom Outcomes
L ower R espiratory Cough Upper
R espiratory I rritated or
I tching E yes Fatigue or Difficulty
Concentrating Headache I rritated or
I tching Skin
Potential R isk Factors
Number of buildings/
study spaces
OR 95% CI OR 95%
CI OR 95% CI OR 95%
CI OR 95% CI OR 95%
CI OR 95% CI
L iner condition in air handler housing and duct
good 40 1.00 1.00 1.00 1.00 1.00 1.00 1.00
fair or poor 52 1.16 0.85-1.59 1.22 0.91-
1.64 1.23* 1.05-1.43 1.08 0.92-
1.27 1.08 0.91-1.28 1.10 0.92-
1.31 1.14 0.84-1.53
Operational condition of air handling system components based on inspection 5 (average for components)
good to fair 59 1.00 1.00 1.00 1.00 1.00 1.00 1.00
fair 23 1.12 0.78-1.61 1.18 0.85-
1.64 1.22* 1.03-1.46 1.05 0.87-
1.26 1.06 0.87-1.29 1.06 0.87-
1.30 1.27 0.90-1.77
fair to poor 15 1.30 0.87-1.95 1.08 0.73-
1.61 0.92 0.74-1.15 1.00 0.79-
1.25 0.86 0.67-1.10 0.78 0.60-
1.01 1.25 0.84-1.87
Cooling towers: general condition
none present 30 1.00 1.00 1.00 1.00 1.00 1.00 1.00
good 25 1.10 0.75-1.61 0.93 0.65-
1.32 0.92 0.76-1.11 0.92 0.75-
1.12 1.05 0.85-1.30 1.15 0.93-
1.42 1.13 0.78-1.62
fair or poor 35 1.00 0.69-1.44 0.98 0.71-
1.36 0.81* 0.68-0.97 0.86 0.72-
1.05 0.93 0.76-1.13 0.90 0.73-
1.11 0.94 0.66-1.34
24
Weekly, B uilding-R elated Symptom Outcomes
L ower R espiratory Cough Upper
R espiratory I rritated or
I tching E yes Fatigue or Difficulty
Concentrating Headache I rritated or
I tching Skin
Potential R isk Factors
Number of buildings/
study spaces
OR 95% CI OR 95%
CI OR 95% CI OR 95%
CI OR 95% CI OR 95%
CI OR 95% CI
Particulate Filtration System: General Condition
good 53 1.00 1.00 1.00 1.00 1.00 1.00 1.00
fair 34 1.44* 1.05-1.96 1.17 0.87-
1.56 1.08 0.92-1.27 1.05 0.89-
1.24 1.04 0.87-1.24 1.01 0.84-
1.21 1.17 0.87-1.58
poor 10 0.89 0.48-1.65 1.09 0.65-
1.81 0.78 0.58-1.05 1.14 0.86-
1.51 0.89 0.65-1.22 0.73 0.51-
1.02 0.88 0.50-1.55
Particulate Filtration System: Filter Fit
good 71 1.00 1.00 1.00 1.00 1.00 1.00 1.00
fair or poor 26 1.40* 1.02-1.94 1.00 0.73-
1.38 0.96 0.81-1.14 1.01 0.84-
1.21 1.00 0.83-1.21 0.92 0.76-
1.13 1.05 0.76-1.46
Frequency of cleaning of cooling coils and condensate drain pans
semi-annually or more 10 1.00 1.00 1.00 1.00 1.00 1.00 1.00
annually 39 2.42* 1.21-4.86 1.75 0.99-
3.10 1.38* 1.05-1.81 1.43* 1.07-
1.91 1.17 0.88-1.57 1.32 0.96-
1.80 1.37 0.81-2.33
as needed or none 47 2.03* 1.01-4.06 1.51 0.86-
2.67 1.11 0.85-1.45 1.16 0.87-
1.55 0.96 0.72-1.28 1.18 0.87-
1.62 1.10 0.64-1.86

25
Weekly, B uilding-R elated Symptom Outcomes
L ower R espiratory Cough Upper
R espiratory I rritated or
I tching E yes Fatigue or Difficulty
Concentrating Headache I rritated or
I tching Skin
Potential R isk Factors
Number of buildings/
study spaces
OR 95% CI OR 95%
CI OR 95% CI OR 95%
CI OR 95% CI OR 95%
CI OR 95% CI
Frequency of cleaning of cooling tower
no cooling tower 30 1.00 1.00 1.00 1.00 1.00 1.00 1.00
semi-annually or more 20 1.03 0.67-1.57 1.01 0.69-
1.48 0.91 0.74-1.12 0.92 0.74-
1.15 1.04 0.83-1.31 1.08 0.85-
1.37 1.20 0.81-1.77
annually 36 1.03 0.72-1.47 0.89 0.64-
1.24 0.83* 0.70-0.99 0.83* 0.69-
1.00 0.95 0.78-1.15 1.03 0.84-
1.26 1.04 0.74-1.46
as needed or none 10 1.02 0.58-1.76 0.80 0.47-
1.37 0.68* 0.51-0.91 0.94 0.71-
1.26 0.84 0.61-1.15 0.67* 0.47-
0.96 0.53 0.27-1.05
Frequency of scheduled inspection of HV A C components6 (average for components)
semi-quarterly or more 36 1.00 1.00 1.00 1.00 1.00 1.00 1.00
quarterly to annually 47 1.12 0.80-1.58 0.78 0.56-
1.07 0.95 0.80-1.12 0.97 0.81-
1.16 0.86 0.72-1.03 0.91 0.75-
1.10 0.98 0.71-1.35
as needed or none 14 1.61* 1.06-2.43 1.71* 1.20-
2.45 1.69* 1.37-2.08 2.00* 1.61-
2.48 1.23 0.98-1.55 1.15 0.90-
1.47 1.27 0.85-1.90
26
Weekly, B uilding-R elated Symptom Outcomes
L ower R espiratory Cough Upper
R espiratory I rritated or
I tching E yes Fatigue or Difficulty
Concentrating Headache I rritated or
I tching Skin
Potential R isk Factors
Number of buildings/
study spaces
OR 95% CI OR 95%
CI OR 95% CI OR 95%
CI OR 95% CI OR 95%
CI OR 95% CI
Frequency of control system calibration
semi-annually or more 14 1.00 1.00 1.00 1.00 1.00 1.00 1.00
annually 9 1.11 0.63-1.97 1.16 0.68-
1.98 1.47* 1.11-1.97 0.83 0.60-
1.13 1.11 0.81-1.53 1.21 0.88-
1.68 0.96 0.54-1.71
as needed or none 71 0.95 0.63-1.43 0.99 0.67-
1.47 1.11 0.90-1.37 0.88 0.71-
1.09 0.98 0.78-1.23 0.98 0.77-
1.24 1.06 0.71-1.58
Frequency of replacement of panel filters
semi-quarterly or more 12 1.00 1.00 1.00 1.00 1.00 1.00 1.00
quarterly or semi-
annually 63 0.83 0.55-
1.25 0.82 0.55-1.21 0.84 0.68-
1.05 0.80 0.64-1.01 0.89 0.70-
1.13 0.93 0.72-1.19 0.79 0.53-
1.18
annually or less 16 0.57 0.32-1.02 0.85 0.52-
1.41 0.68* 0.51-0.90 0.65* 0.48-
0.87 0.84 0.62-1.14 0.79 0.57-
1.09 0.87 0.52-1.44
A verage hours of ventilation operation on weekdays
24 hr 31 1.00 1.00 1.00 1.00 1.00 1.00 1.00
13-20 hr 35 0.67* 0.47-0.98 0.90 0.65-
1.25 0.92 0.77-1.09 0.81* 0.67-
0.98 0.86 0.71-1.05 0.91 0.74-
1.11 0.85 0.60-1.20
10-12 hr 31 0.98 0.69-1.39 0.87 0.62-
1.23 0.90 0.75-1.08 0.87 0.72-
1.06 0.98 0.80-1.20 1.00 0.81-
1.23 0.96 0.68-1.36

27
Weekly, B uilding-R elated Symptom Outcomes
L ower R espiratory Cough Upper
R espiratory I rritated or
I tching E yes Fatigue or Difficulty
Concentrating Headache I rritated or
I tching Skin
Potential R isk Factors
Number of buildings/
study spaces
OR 95% CI OR 95%
CI OR 95% CI OR 95%
CI OR 95% CI OR 95%
CI OR 95% CI
Outcome prevalence in overall study population 4.2% 5.0% 20.9% 18.3% 16.4% 14.9% 4.6%
* P-value <0.05 1 Local cooling coils refer to the presence of any type of system with cooling coils in the study space, with or without a drain pan, including those described as air-water
induction units, fan coil units, individual room packaged AC units, heat pumps, or other unitary systems. 2 Conditioned means that the outdoor air is filtered, and possibly dehumidified, heated, or cooled before delivery to the air handler, whereas unconditioned denotes lack
of these features. Intake fan denotes a separate fan to bring in the required amount of outdoor air; with no intake fan, outdoor air is drawn in by suction induced by the supply fan.
3 The “central humidification system” variable combined values of the following variables: air handler has humidification system, general condition of humidifiers, frequency of humidifier inspection, and frequency of humidifier cleaning.
4 The “cleanliness/condition of HVAC components” variable combined values of the following variables: general condition of mechanical room, general condition of air handler housing, condition of air handler coils, general condition of air handler components, condition of air handler drain pans, condition of air handler intakes, general condition of air distribution ductwork, and condition of humidifier drain pans.
5 The “operational condition of HVAC components” variable combined values of the following variables: condition of air handler dampers, condition of air handler fan belts, leakage at seams of air distribution ductwork, condition of exhaust fan belts, general condition of exhaust fans, particle filtration system change label, general condition of terminal units, condition of terminal unit dampers, general condition of control systems, and condition of control system sensors.
6 The “frequency of scheduled inspection of HVAC components” variable combined values of variables for inspection frequency of: air handler housing, heating/cooling coil, drain pan, air distribution ductwork, control systems, cooling tower, fan coil unit, and terminal units.
28
Table 3. Adjusted odds ratios (ORs) and 95% confidence intervals (CIs), from logistic regression models with generalized estimating equations,1 for associations between HVAC risk factors and occupant symptoms in U.S. office buildings in the BASE data, collected 1994-1998
Weekly, Building-Related Symptom Outcomes
Lower Respiratory Cough Upper
Respiratory Irritated or Itching Eyes
Fatigue or Difficulty
Concentrating Headache Irritated or
Itching Skin
Risk Factor OR 95% CI OR 95%
CI OR 95% CI OR 95%
CI OR 95% CI OR 95%
CI OR 95% CI
HVAC design
Height of outdoor air intake above ground
> 60 m 1.00 1.00 1.00 1.00 1.00
> 30 to <= 60 m 2.04* 1.01, 4.11 2.67* 1.75,
4.09 1.64* 1.07, 2.53 1.74* 1.18,
2.56 1.32 0.88, 1.98 2.47* 1.11,
5.47
> 0 to <= 30 m 1.14 0.59, 2.21 1.98* 1.37,
2.86 1.40 0.96, 2.04 1.74* 1.23,
2.47 1.69* 1.18, 2.41 2.62* 1.22,
5.59
> -3 to <= 0 m 1.87 0.91, 3.86 2.11* 1.40,
3.18 1.13 0.70, 1.81 2.13* 1.41,
3.21 1.74* 1.15, 2.62 2.25 0.97,
5.22
Local cooling coils2
no local cooling coils 1.00 1.00
local cooling coils 1.37 0.94, 2.01 1.38 0.98,
1.93

29
Weekly, Building-Related Symptom Outcomes
Lower Respiratory Cough Upper
Respiratory Irritated or Itching Eyes
Fatigue or Difficulty
Concentrating Headache Irritated or
Itching Skin
Risk Factor OR 95% CI OR 95%
CI OR 95% CI OR 95%
CI OR 95% CI OR 95%
CI OR 95% CI
Supply duct material
no flexible duct 1.00
flexible only 0.88 0.70, 1.11
flexible and fiberboard 1.06 0.74,
1.51
Outdoor air intake strategy3
unconditioned and
with intake fan 1.00 1.00
conditioned and
with intake fan 1.46 0.78,
2.75 0.75 0.25, 2.24
unconditioned and
with no intake fan 1.72 1.00,
2.98 0.94 0.45, 1.95

30
Weekly, Building-Related Symptom Outcomes
Lower Respiratory Cough Upper
Respiratory Irritated or Itching Eyes
Fatigue or Difficulty
Concentrating Headache Irritated or
Itching Skin
Risk Factor OR 95% CI OR 95%
CI OR 95% CI OR 95%
CI OR 95% CI OR 95%
CI OR 95% CI
Floor area per operable window
<600 sq m/ operable
window 1.00
>=600 sq m/ operable
window or none 1.85* 1.24,
2.76
HVAC condition, maintenance, or operation
Central humidification system4
no humidification system 1.00 1.00 1.00 1.00 1.00 1.00
humidified, maintenance/ condition good to fair
1.09 0.61, 1.94 1.14 0.84,
1.55 0.91 0.64, 1.29 0.79 0.56,
1.10 1.34 0.98, 1.85 0.47* 0.23,
0.96
humidified, maintenance/ condition poor
1.31 0.79, 2.17 1.49* 1.09,
2.05 1.46* 1.05, 2.03 1.67* 1.23,
2.26 1.34 0.97, 1.85 1.65* 1.02,
2.68
31
Weekly, Building-Related Symptom Outcomes
Lower Respiratory Cough Upper
Respiratory Irritated or Itching Eyes
Fatigue or Difficulty
Concentrating Headache Irritated or
Itching Skin
Risk Factor OR 95% CI OR 95%
CI OR 95% CI OR 95%
CI OR 95% CI OR 95%
CI OR 95% CI
Cleanliness/condition of air handler components (average for components)5
good to fair 1.00 1.00 1.00 1.00 1.00
fair 0.81 0.53, 1.23 0.84 0.56,
1.27 0.75* 0.59, 0.96 0.74* 0.59,
0.93 0.74* 0.58, 0.94
fair to poor 1.11 0.75, 1.65 1.16 0.75,
1.78 1.01 0.78, 1.32 0.87 0.67,
1.13 0.95 0.72, 1.25
Liner condition in air handler housing and duct
good 1.00 1.00
fair or poor 1.15 0.81, 1.65 1.43* 1.13,
1.83
Operational condition of air handling system components based on inspection (average for components)6
good to fair 1.00 1.00
fair 1.13 0.91, 1.41 1.20 0.95,
1.51
fair to poor 0.70* 0.49, 0.98 0.76 0.54,
1.09

32
Weekly, Building-Related Symptom Outcomes
Lower Respiratory Cough Upper
Respiratory Irritated or Itching Eyes
Fatigue or Difficulty
Concentrating Headache Irritated or
Itching Skin
Risk Factor OR 95% CI OR 95%
CI OR 95% CI OR 95%
CI OR 95% CI OR 95%
CI OR 95% CI
Frequency of cleaning of cooling coils and condensate drain pans
semi-annually or more 1.00 1.00 1.00 1.00
annually 1.92 0.89, 4.15 1.67* 1.15,
2.41 1.36 0.97, 1.91 1.57* 1.09,
2.25
as needed or none 1.56 0.71, 3.42 1.48* 1.01,
2.17 1.13 0.80, 1.59 1.47* 1.03,
2.11
Frequency of cleaning of cooling tower
no cooling tower 1.00
semi-annually or more 1.29 0.81,
2.05
annually 1.06 0.70, 1.62
as needed or none 0.53 0.25, 1.10
33
Weekly, Building-Related Symptom Outcomes
Lower Respiratory Cough Upper
Respiratory Irritated or Itching Eyes
Fatigue or Difficulty
Concentrating Headache Irritated or
Itching Skin
Risk Factor OR 95% CI OR 95%
CI OR 95% CI OR 95%
CI OR 95% CI OR 95%
CI OR 95% CI
Frequency of scheduled inspection of HVAC components (average for components)7
semi-quarterly or more 1.00 1.00 1.00 1.00 1.00
quarterly to annually 1.17 0.80, 1.70 0.75 0.52,
1.07 0.94 0.76, 1.17 1.08 0.85,
1.36 0.75* 0.61, 0.91
as needed or none 1.50 0.95, 2.37 1.48 0.98,
2.24 1.60* 1.21, 2.10 2.18* 1.55,
3.06 0.88 0.67, 1.16
Frequency of replacement of panel filters
semi-quarterly or more 1.00 1.00
quarterly or semi- annually 1.02 0.76,
1.36 1.18 0.89, 1.56
annually or less 1.07 0.72, 1.59 0.84 0.59,
1.20
Average weekday hours of ventilation operation
24 hr 1.00 1.00 1.00 1.00
13-20 hr 0.80 0.53, 1.20 0.90 0.71,
1.15 0.88 0.70, 1.09 0.93 0.74,
1.17 0.67 0.45, 1.02
10-12 hr 1.18 0.79, 1.77 1.12 0.87,
1.45 1.32* 1.05, 1.66 1.21 0.94,
1.54 1.19 0.77, 1.84

34
Weekly, Building-Related Symptom Outcomes
Lower Respiratory Cough Upper
Respiratory Irritated or Itching Eyes
Fatigue or Difficulty
Concentrating Headache Irritated or
Itching Skin
Risk Factor OR 95% CI OR 95%
CI OR 95% CI OR 95%
CI OR 95% CI OR 95%
CI OR 95% CI
Number of observations (occupants) in final model 4,022 3,987 3,718 3,688 4,106 4,018 3,884
Number of buildings in final model 95 92 85 84 95 95 95
* P-value <0.05 1 For each of the seven symptom outcomes, all potential risk factors in this Table are included simultaneously in one model, along with confounding variables selected
during model construction. Potential confounding variables include environmental variables (temperature, humidity ratio, ventilation rate, season of study, and age of building) and personal variables (gender, age, education, smoking status, asthma, mold allergy, hay fever, type of workstation, comfort of chair, satisfaction with work station, job satisfaction, job demand, job conflict, and years worked in building).
2 Local cooling coils refer to the presence of any type of system with cooling coils in the study space, with or without a drain pan, including those described as air water induction units, fan coil units, individual room packaged AC units, heat pumps, or other unitary systems.
3 Conditioned means that the outdoor air is filtered, and possibly dehumidified, heated, or cooled before delivery to the air handler, whereas unconditioned denotes lack of these features. Intake fan denotes a separate fan to bring in the required amount of outdoor air; with no intake fan, outdoor air is drawn in by suction induced by the supply fan.
4 See Table 2, footnote 3. 5 See Table 2, footnote 4. 6 See Table 2, footnote 5. 7 See Table 2, footnote 6.
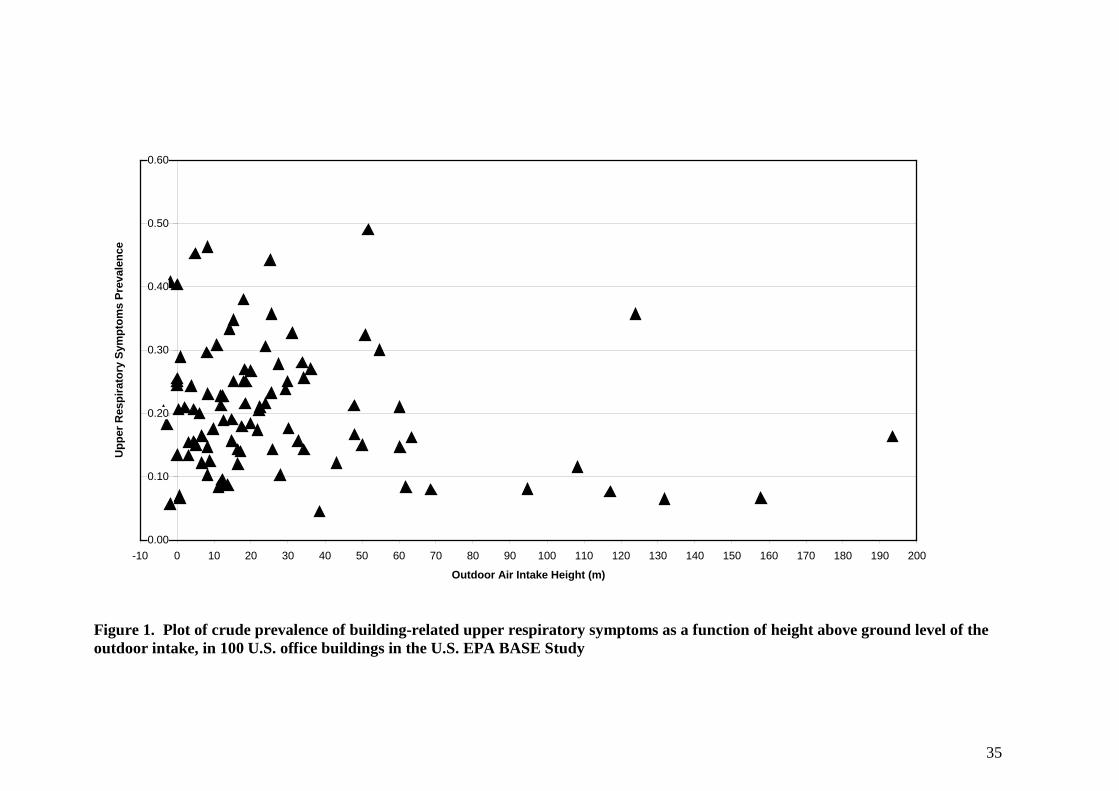
35
0.00
0.10
0.20
0.30
0.40
0.50
0.60
-10 0 10 20 30 40 50 60 70 80 90 100 110 120 130 140 150 160 170 180 190 200
Outdoor Air Intake Height (m)
Upp
er R
espi
rato
ry S
ympt
oms
Prev
alen
ce
Figure 1. Plot of crude prevalence of building-related upper respiratory symptoms as a function of height above ground level of the outdoor intake, in 100 U.S. office buildings in the U.S. EPA BASE Study

36
0.0
0.5
1.0
1.5
2.0
2.5
3.0
-10 0 10 20 30 40 50 60 70 80 90 100 110 120 130 140 150 160 170 180 190 200
Outdoor Air Intake Height (m)
Ave
rage
Out
door
o-X
ylen
e C
once
ntra
tion
(ppb
)
Figure 2. Plot of average outdoor concentration of o-xylene (sampled with SUMMA canisters) as a function of height above ground level of the outdoor intake, in 96 mechanically ventilated U.S. office buildings in the U.S. EPA BASE Study
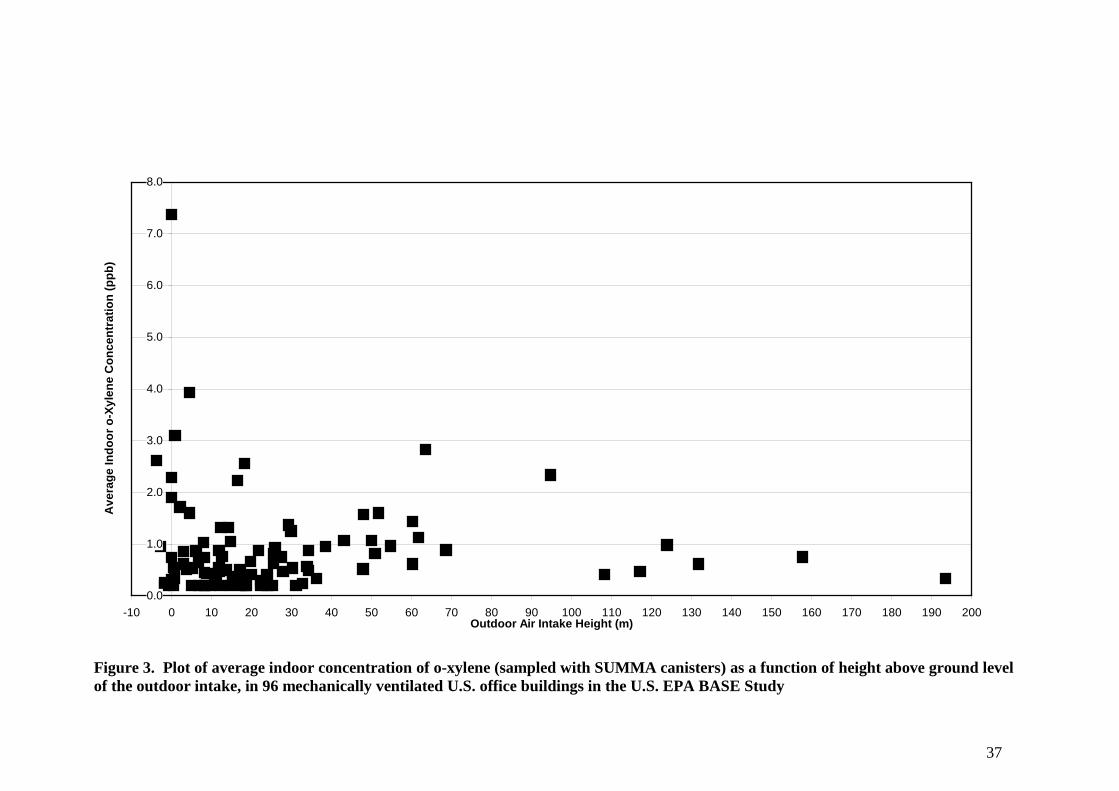
37
0.0
1.0
2.0
3.0
4.0
5.0
6.0
7.0
8.0
-10 0 10 20 30 40 50 60 70 80 90 100 110 120 130 140 150 160 170 180 190 200Outdoor Air Intake Height (m)
Ave
rage
Indo
or o
-Xyl
ene
Con
cent
ratio
n (p
pb)
Figure 3. Plot of average indoor concentration of o-xylene (sampled with SUMMA canisters) as a function of height above ground level of the outdoor intake, in 96 mechanically ventilated U.S. office buildings in the U.S. EPA BASE Study

38
0.0
1.0
2.0
3.0
4.0
5.0
6.0
7.0
8.0
0 1 2 3
Average Outdoor o-Xylene Concentration (ppb)
Ave
rage
Indo
or o
-Xyl
ene
Con
cent
ratio
n (p
pb)
Figure 4. Plot with estimated linear trend line for average indoor concentration of o-xylene as a function of average outdoor concentration (sampled with SUMMA canisters), in 96 mechanically ventilated U.S. office buildings in the U.S. EPA BASE Study

39