risk factors of spontaneous preterm birth
TRANSCRIPT

Risk factors of spontaneous preterm birth
Karoliina Torp
Bachelor of Medicine
Espoo 1.6.2011
Study
Supervisor: Nanna Sarvilinna, MD, PhD
UNIVERSITY OF HELSINKI
Faculty of Medicine
i
HELSINGIN YLIOPISTO HELSINGFORS UNIVERSITET
Tiedekunta/Osasto Fakultet/Sektion – Faculty
Faculty of Medicine Laitos Institution – Department
TekijäFörfattare – Author
Karoliina Torp Työn nimi Arbetets itle – Title
Risk factors of spontaneous preterm birth Oppiaine Läroämne – Subject
Medicine, Obstetrics Työn laji Arbetets art – Level
Study Aika Datum – Month and year
June 2011 Sivumäärä-Sidoantal - Number of pages 23
Tiivistelmä Referat – Abstract
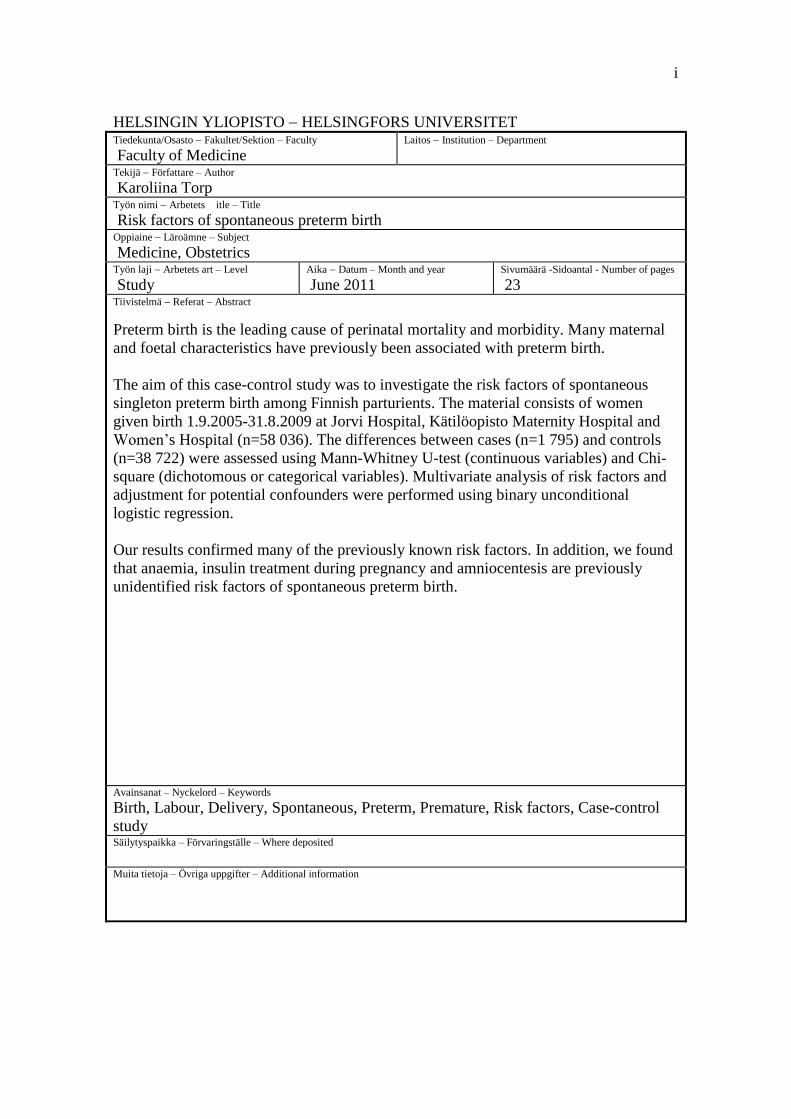
Preterm birth is the leading cause of perinatal mortality and morbidity. Many maternal
and foetal characteristics have previously been associated with preterm birth.
The aim of this case-control study was to investigate the risk factors of spontaneous
singleton preterm birth among Finnish parturients. The material consists of women
given birth 1.9.2005-31.8.2009 at Jorvi Hospital, Kätilöopisto Maternity Hospital and
Women’s Hospital (n=58 036). The differences between cases (n=1 795) and controls
(n=38 722) were assessed using Mann-Whitney U-test (continuous variables) and Chi-
square (dichotomous or categorical variables). Multivariate analysis of risk factors and
adjustment for potential confounders were performed using binary unconditional
logistic regression.
Our results confirmed many of the previously known risk factors. In addition, we found
that anaemia, insulin treatment during pregnancy and amniocentesis are previously
unidentified risk factors of spontaneous preterm birth.
Avainsanat – Nyckelord – Keywords
Birth, Labour, Delivery, Spontaneous, Preterm, Premature, Risk factors, Case-control
study Säilytyspaikka – Förvaringställe – Where deposited
Muita tietoja – Övriga uppgifter – Additional information

ii
1 Introduction…………………………………………………………………………....1
1.1 Risk factors of preterm birth..................................................................2
2 Material and Methods…………………………………………………………………5
Table 1…………………………………………………………...………..6
Table 2…………………………………………………………………….7
3 Results…………………………………………………………………………………8
Table 3…………………………………………………………………….8
Table 4…………………………………………………………………...11
4 Discussion……………………………………………………………………………14
References……………………………………………………………………………...18
Appendix 1……………………………………………………………………………. 20

1
1 Introduction
Preterm birth is defined as delivery before 37 weeks of gestation. The cut-off between
spontaneous abortion and extremely preterm birth is at 22 weeks of gestation. Preterm
births can be subdivided according to the gestational age into extremely preterm (less
than 28 weeks of gestation), severely preterm (28-31 weeks), moderately preterm (32-
33 weeks) and late preterm (at 34-36 weeks) (1).
In the USA the preterm delivery rate is 12-13%, but in Europe and other developed
countries 5-9% (1-3). In Finland the corresponding number was 5.7% in 2009 (4). In
industrialized countries the rate has risen despite of increased knowledge of risk factors
and mechanisms related to preterm birth, partly due to an increase in medically
indicated preterm births (1-3,5). In Finland the rate has been stable; preterm deliveries
increased from 5.6% in 1987 to 6.2% in 1999, but have then decreased (4).
Up to 75% of perinatal mortality and more than half of the long-time morbidity is due to
preterm births (1,3). Perinatal mortality is one of the lowest in the world in Finland, and
has decreased from 8.7% in 1987 to 5.0% in 2009 (4).
The obstetric precursors leading to preterm birth are iatrogenic delivery or Caesarean
section for maternal or foetal indications and spontaneous preterm labour, including
preterm labour with intact membranes and preterm premature rupture of membranes
(pPROM). About 30-35% of preterm births are iatrogenic, 40-45% are spontaneous
preterm labours and 25-30% follow pPROM (1,2).
Preterm premature rupture of membranes (pPROM) is defined as spontaneous rupture
of the membranes at less than 37 weeks of gestation. Most often the cause of the
membrane rupture is unknown, but especially infections, which are often asymptomatic,
and exposure to tobacco are associated with pPROM. One common complication of
pPROM is the development of an intrauterine infection, which usually leads to
spontaneous onset of labour.(1)
2
1.1 Risk factors of preterm birth
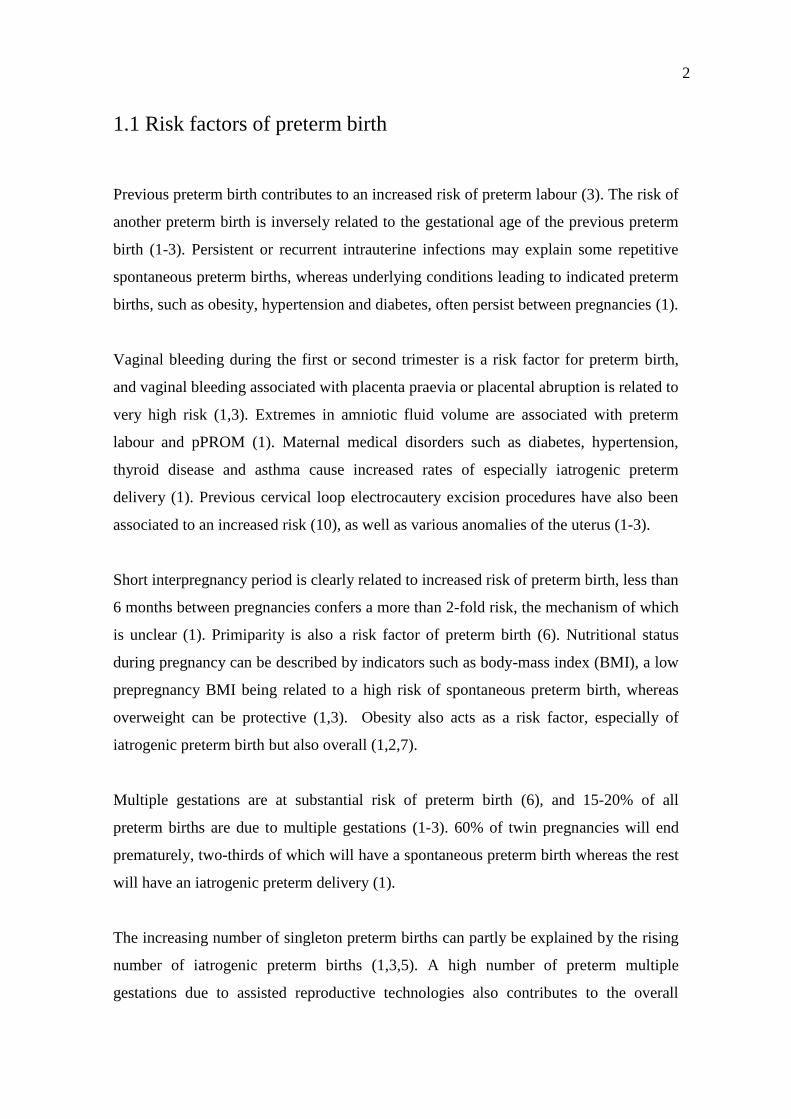
Previous preterm birth contributes to an increased risk of preterm labour (3). The risk of
another preterm birth is inversely related to the gestational age of the previous preterm
birth (1-3). Persistent or recurrent intrauterine infections may explain some repetitive
spontaneous preterm births, whereas underlying conditions leading to indicated preterm
births, such as obesity, hypertension and diabetes, often persist between pregnancies (1).
Vaginal bleeding during the first or second trimester is a risk factor for preterm birth,
and vaginal bleeding associated with placenta praevia or placental abruption is related to
very high risk (1,3). Extremes in amniotic fluid volume are associated with preterm
labour and pPROM (1). Maternal medical disorders such as diabetes, hypertension,
thyroid disease and asthma cause increased rates of especially iatrogenic preterm
delivery (1). Previous cervical loop electrocautery excision procedures have also been
associated to an increased risk (10), as well as various anomalies of the uterus (1-3).
Short interpregnancy period is clearly related to increased risk of preterm birth, less than
6 months between pregnancies confers a more than 2-fold risk, the mechanism of which
is unclear (1). Primiparity is also a risk factor of preterm birth (6). Nutritional status
during pregnancy can be described by indicators such as body-mass index (BMI), a low
prepregnancy BMI being related to a high risk of spontaneous preterm birth, whereas
overweight can be protective (1,3). Obesity also acts as a risk factor, especially of
iatrogenic preterm birth but also overall (1,2,7).
Multiple gestations are at substantial risk of preterm birth (6), and 15-20% of all
preterm births are due to multiple gestations (1-3). 60% of twin pregnancies will end
prematurely, two-thirds of which will have a spontaneous preterm birth whereas the rest
will have an iatrogenic preterm delivery (1).
The increasing number of singleton preterm births can partly be explained by the rising
number of iatrogenic preterm births (1,3,5). A high number of preterm multiple
gestations due to assisted reproductive technologies also contributes to the overall
3
increase, but even singleton pregnancies after in-vitro fertilisation (IVF) are at increased
risk of preterm birth (1-3,6,8). Preterm delivery rates may also have risen due to the
increase of the routine determination of gestational age by ultrasound, giving a lower
gestational age estimate than the traditional the last normal menstrual period -based
calculation (9).
An infection is involved in up to 40% of preterm births (1-3). Several other types of
infections such as pneumonia, appendicitis, pyelonephritis and asymptomatic
bacteriuria are also associated with preterm delivery (1,2). The mechanisms by which
intrauterine infections lead to preterm labour are related to activation of the immune
system, causing release of inflammatory chemokines and cytokines, stimulating the
production of prostaglandins (1,3). This leads to stimulation of uterine contractility and
degradation of extracellular matrix in the foetal membranes leading to pPROM (1,3).
In addition, pregnancy history, present pregnancy characteristics, maternal demographic
characteristics, nutritional status, psychological characteristics, uterine contractions and
cervical length as well as biological and genetic markers have been associated with
preterm birth (1,3). In US and UK black (Afro-Caribbean and African-American)
women are reported to be at higher risk of preterm birth than white women (1,3,5).
Other maternal demographic characteristics associated with preterm birth are low
socioeconomic and educational status, low and high maternal ages and single marital
status (1-3,6). The type of work and level of physical activity is not consistently related
to the rate of preterm birth, but hard physical work and working long hours are probably
related to increased risk (1). Experiencing high psychological or social stress is
associated with almost 2-fold risk of preterm birth (1).
Smoking causes a higher risk of preterm birth (1-3,6). The mechanism is unclear, but
both nicotine and carbon monoxide are powerful vasoconstrictors and associated with
placental damage and decreased uteroplacental blood flow (1). Smoking also stimulates
the systemic inflammatory response, which could be one of the contributing factors
(1,2).

4
Genetic factors are related to the risk of preterm birth by multiple mechanisms (1-3).
Polymorphism in cytokine and prostaglandin production, variation in cytokine
metabolism, predisposition to multiple gestation and pre-eclampsia have been suggested
to be possible mechanisms (1-3).
The rates of preterm birth have not decreased significantly. The pathway leading to
labour initiation is still not very well understood, and therefore neither is the
pathogenesis of preterm labour. It is thought to be a syndrome initiated by multiple
mechanisms involving infection or inflammation, uteroplacental ischaemia or
haemorrhage, uterine overdistension, stress and other immunologically mediated
processes (1-3). In most cases a precise mechanism cannot be established, but multiple
risk factors seem to interact causing a transition from uterine quiescence toward preterm
labour or pPROM, increase of systemic inflammation being one potential mechanism
(1).
Defining the risk factors is a reasonable goal for prediction of preterm birth.
Identification of high-risk pregnancies may allow initiation of risk-specific treatment.
The aim of this study was to get new and up-to-date valid information about the risk
factors of spontaneous preterm birth in a large Finnish material. This information could
be later applied by clinicians in their daily work.
5
2 Material and methods
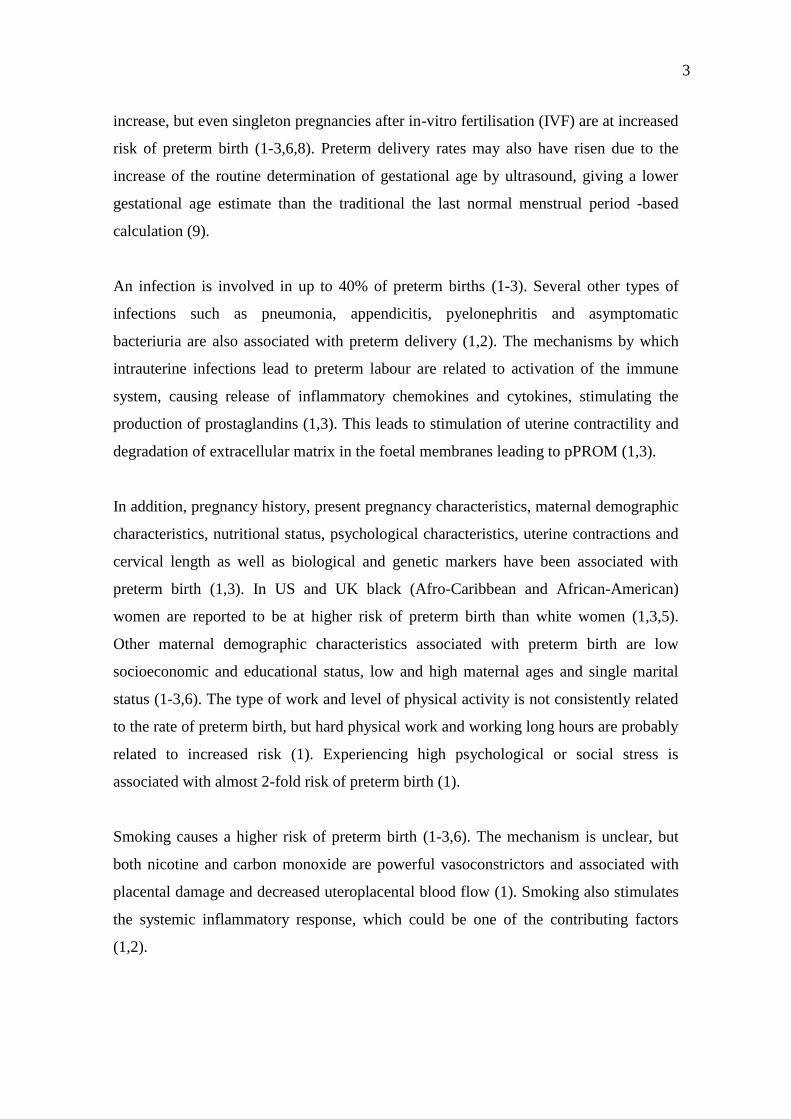
The data was received from the Finnish Medical Birth Register maintained by the
National Institute for Welfare and Health (THL). THL collects data on all births in
Finland (since 1987), small premature infants (since 2004), induced abortions (since
1950) and assisted reproduction (since 1992). The data are mostly received from
hospitals and clinics, being partly complemented with data from Statistics Finland and
the Population Register Centre.
Our aim was to study the risk factors of spontaneous preterm singleton birth. The data
(n=58 036) was collected from Jorvi Hospital, Kätilöopisto Maternity Hospital and
Women’s Hospital and includes all deliveries in these hospitals between 1.9.2005 and
31.8.2009. The data consists of the information on “Notification of born child” -form
(Appendix 1). The form is filled on every born child in Finland. There are no missing
cases in the data, but not all sections of the form are completely filled. The forms are
collected by THL, and the information is transferred into a database. The characteristics
of the whole study population are represented in Table 1.
PPROMs are not separated in the data, hence both preterm labours with intact
membranes as well as pPROMs were included in the study. A few discrepancies among
the reported stillbirths were checked from the patients’ medical records.
Induced labours were determined as prostaglandin use and amniotomy with intended
labour initiation. There were 36 414 amniotomies reported. We were unable to
determine when labour induction was intended without reading each epicrise, which
was not considered reasonable due to the large size of the data. Therefore only
deliveries, in which both amniotomy and induced labour were reported, were excluded
from the data. Induced labours were probably under reported, which results in not all
induced labours being excluded from the study data.

6
Table 1. Characteristics of the data
Kätilöopisto
Maternity hospital
Women’s
hospital
Jorvi
hospital Total %
Deliveries 23128 21224 13684 58036
Singletons 22695 19899 13450 56044 96.57
Twins 433 1298 234 1965 3.39
Triplets 0 27 0 27 0.05
Births 23128 21224 13684 58036
Boys 11802 10974 6997 29773 51.30
Girls 11326 10246 6687 28259 48.69
Uncertain 0 4 0 4 0.01
Live births 23079 21100 13657 57836 99.66
Stillbirths 46 109 24 179 0.31
Died during delivery 1 3 2 6 0.01
Time of death unknown 2 12 1 15 0.03
Spontaneous pregnancy 22074 19058 12974 54106 93.23
Pregnancies with non-spontaneous onset
Embryo transfer 508 1463 410 2381 4.10
Insemination 363 550 224 1137 1.96
Ovulation induction 529 1179 342 2050 3.53
Spontaneous labour 16341 13778 10602 40721 70.17
Induced labour 4048 4412 1958 10418 17.95
Amniotomy 14758 12799 8857 36414 62.74
Prostaglandin 2739 3034 1124 6897 11.88
Oxytocin 2763 3881 1598 8242 14.20
Caesarean section 3687 5350 2017 11054 19.05
Planned 1244 1929 857 4030 6.94
Urgent 2170 3033 1020 6223 10.72
Emergency 273 388 140 801 1.38
Vaginal delivery 16975 13620 10682 41277 71.12
Breech presentation,
breech extraction 165 183 68 416 0.72
Vacuum extraction 2301 2071 917 5289 9.11
7
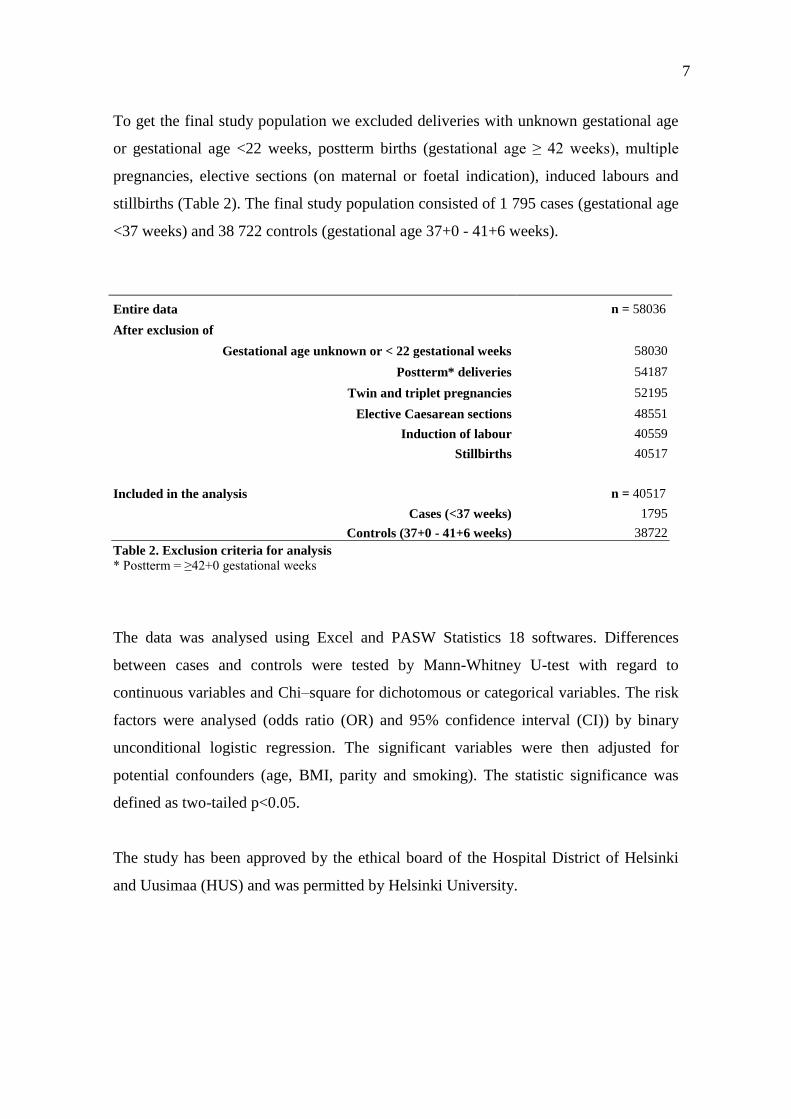
To get the final study population we excluded deliveries with unknown gestational age
or gestational age <22 weeks, postterm births (gestational age ≥ 42 weeks), multiple
pregnancies, elective sections (on maternal or foetal indication), induced labours and
stillbirths (Table 2). The final study population consisted of 1 795 cases (gestational age
<37 weeks) and 38 722 controls (gestational age 37+0 - 41+6 weeks).
The data was analysed using Excel and PASW Statistics 18 softwares. Differences
between cases and controls were tested by Mann-Whitney U-test with regard to
continuous variables and Chi–square for dichotomous or categorical variables. The risk
factors were analysed (odds ratio (OR) and 95% confidence interval (CI)) by binary
unconditional logistic regression. The significant variables were then adjusted for
potential confounders (age, BMI, parity and smoking). The statistic significance was
defined as two-tailed p<0.05.
The study has been approved by the ethical board of the Hospital District of Helsinki
and Uusimaa (HUS) and was permitted by Helsinki University.
Entire data n = 58036
After exclusion of
Gestational age unknown or < 22 gestational weeks 58030
Postterm* deliveries 54187
Twin and triplet pregnancies 52195
Elective Caesarean sections 48551
Induction of labour 40559
Stillbirths 40517
Included in the analysis n = 40517
Cases (<37 weeks) 1795
Controls (37+0 - 41+6 weeks) 38722
Table 2. Exclusion criteria for analysis
* Postterm = ≥42+0 gestational weeks
8
3 Results
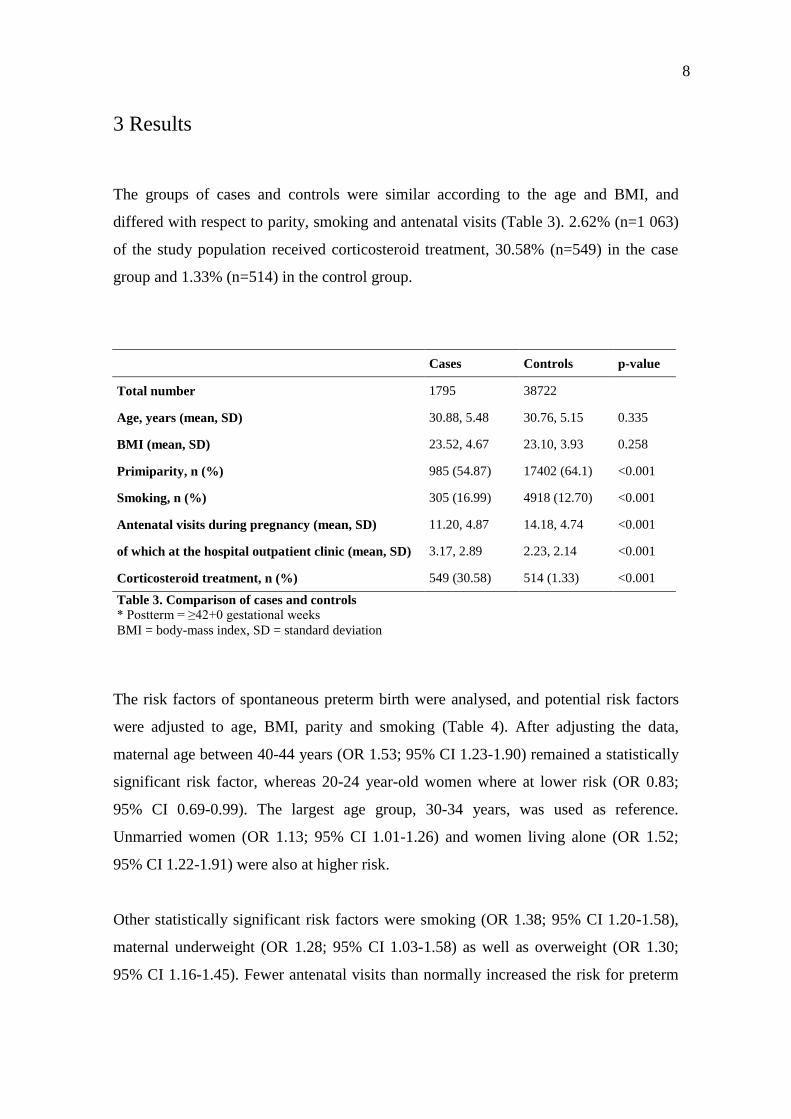
The groups of cases and controls were similar according to the age and BMI, and
differed with respect to parity, smoking and antenatal visits (Table 3). 2.62% (n=1 063)
of the study population received corticosteroid treatment, 30.58% (n=549) in the case
group and 1.33% (n=514) in the control group.
Cases Controls p-value
Total number 1795 38722
Age, years (mean, SD) 30.88, 5.48 30.76, 5.15 0.335
BMI (mean, SD) 23.52, 4.67 23.10, 3.93 0.258
Primiparity, n (%) 985 (54.87) 17402 (64.1) <0.001
Smoking, n (%) 305 (16.99) 4918 (12.70) <0.001
Antenatal visits during pregnancy (mean, SD) 11.20, 4.87 14.18, 4.74 <0.001
of which at the hospital outpatient clinic (mean, SD) 3.17, 2.89 2.23, 2.14 <0.001
Corticosteroid treatment, n (%) 549 (30.58) 514 (1.33) <0.001
Table 3. Comparison of cases and controls
* Postterm = ≥42+0 gestational weeks
BMI = body-mass index, SD = standard deviation
The risk factors of spontaneous preterm birth were analysed, and potential risk factors
were adjusted to age, BMI, parity and smoking (Table 4). After adjusting the data,
maternal age between 40-44 years (OR 1.53; 95% CI 1.23-1.90) remained a statistically
significant risk factor, whereas 20-24 year-old women where at lower risk (OR 0.83;
95% CI 0.69-0.99). The largest age group, 30-34 years, was used as reference.
Unmarried women (OR 1.13; 95% CI 1.01-1.26) and women living alone (OR 1.52;
95% CI 1.22-1.91) were also at higher risk.
Other statistically significant risk factors were smoking (OR 1.38; 95% CI 1.20-1.58),
maternal underweight (OR 1.28; 95% CI 1.03-1.58) as well as overweight (OR 1.30;
95% CI 1.16-1.45). Fewer antenatal visits than normally increased the risk for preterm
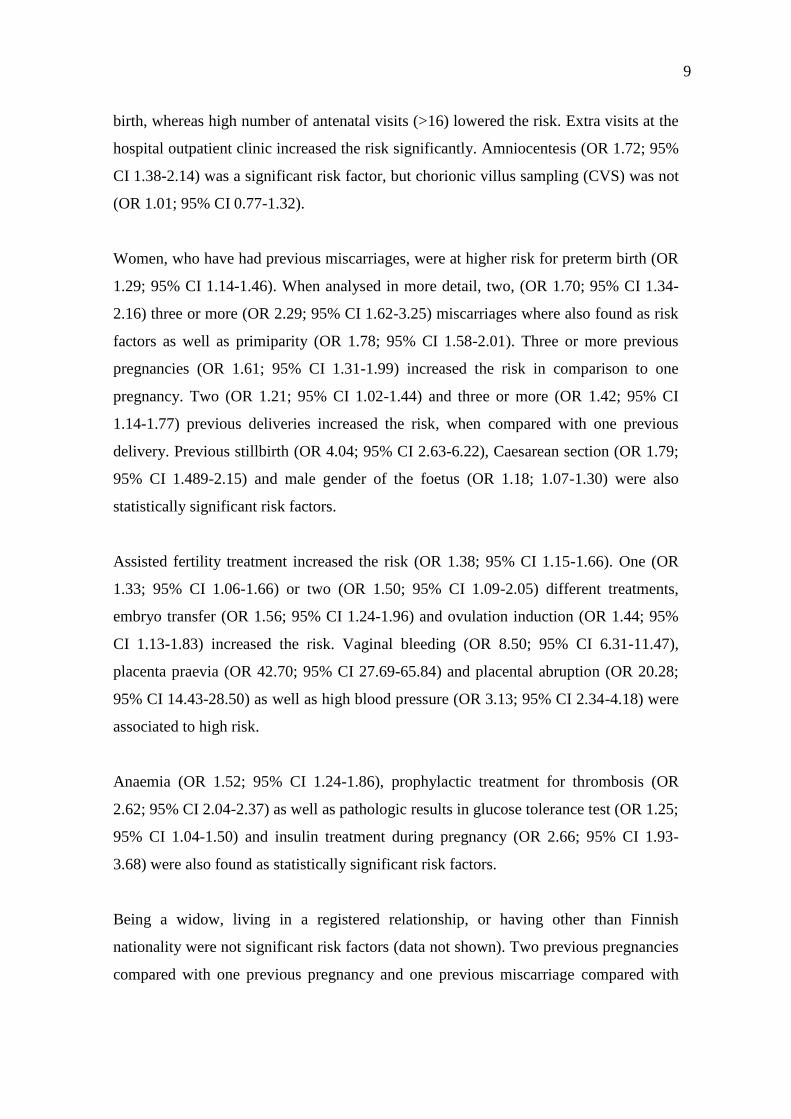
9
birth, whereas high number of antenatal visits (>16) lowered the risk. Extra visits at the
hospital outpatient clinic increased the risk significantly. Amniocentesis (OR 1.72; 95%
CI 1.38-2.14) was a significant risk factor, but chorionic villus sampling (CVS) was not
(OR 1.01; 95% CI 0.77-1.32).
Women, who have had previous miscarriages, were at higher risk for preterm birth (OR
1.29; 95% CI 1.14-1.46). When analysed in more detail, two, (OR 1.70; 95% CI 1.34-
2.16) three or more (OR 2.29; 95% CI 1.62-3.25) miscarriages where also found as risk
factors as well as primiparity (OR 1.78; 95% CI 1.58-2.01). Three or more previous
pregnancies (OR 1.61; 95% CI 1.31-1.99) increased the risk in comparison to one
pregnancy. Two (OR 1.21; 95% CI 1.02-1.44) and three or more (OR 1.42; 95% CI
1.14-1.77) previous deliveries increased the risk, when compared with one previous
delivery. Previous stillbirth (OR 4.04; 95% CI 2.63-6.22), Caesarean section (OR 1.79;
95% CI 1.489-2.15) and male gender of the foetus (OR 1.18; 1.07-1.30) were also
statistically significant risk factors.
Assisted fertility treatment increased the risk (OR 1.38; 95% CI 1.15-1.66). One (OR
1.33; 95% CI 1.06-1.66) or two (OR 1.50; 95% CI 1.09-2.05) different treatments,
embryo transfer (OR 1.56; 95% CI 1.24-1.96) and ovulation induction (OR 1.44; 95%
CI 1.13-1.83) increased the risk. Vaginal bleeding (OR 8.50; 95% CI 6.31-11.47),
placenta praevia (OR 42.70; 95% CI 27.69-65.84) and placental abruption (OR 20.28;
95% CI 14.43-28.50) as well as high blood pressure (OR 3.13; 95% CI 2.34-4.18) were
associated to high risk.
Anaemia (OR 1.52; 95% CI 1.24-1.86), prophylactic treatment for thrombosis (OR
2.62; 95% CI 2.04-2.37) as well as pathologic results in glucose tolerance test (OR 1.25;
95% CI 1.04-1.50) and insulin treatment during pregnancy (OR 2.66; 95% CI 1.93-
3.68) were also found as statistically significant risk factors.
Being a widow, living in a registered relationship, or having other than Finnish
nationality were not significant risk factors (data not shown). Two previous pregnancies
compared with one previous pregnancy and one previous miscarriage compared with

10
none, were also non-significant (data not shown). Previous abortions, extra-uterine
pregnancies and insemination did not have an effect on the risk of spontaneous preterm
birth (data not shown). Furthermore, eclampsia, being divorced and having no previous
pregnancies (compared with one) became non-significant after adjusting the data (Table
4).

11
Variable Cases Controls OR (95% CI) p OR (95% CI)* p
N % N %
Maternal age
≤19 33 1.84 520 1.34 1.444 (1.007-2.071) 0.046 0.917 (0.618-1.362) 0.668
20-24 205 11.42 4138 10.69 1.127 (0.959-1.324) 0.146 0.828 (0.692-0.992) 0.041
25-29 462 25.74 10534 27.20 0.998 (0.883-1.128) 0.971 0.892 (0.785-1.014) 0.081
30-34 639 35.60 14537 37.54 Reference
35-39 339 18.89 7246 18.71 1.064 (0.930-1.218) 0.364 1.116 (0.970-1.284) 0.126
40-44 113 6.30 1677 4.33 1.533 (1.247-1.884) <0.001 1.528 (1.229-1.899) <0.001
45+ 4 0.22 70 0.18 1.300 (0.473-3.572) 0.611 1.412 (0.511-3.902) 0.506
Not known 0 0.00 0 0.00
Marital status
Married 1040 57.94 24676 63.73 Reference
Unmarried 704 39.22 13278 34.29 1.258 (1.141-1.387) <0.001 1.125 (1.009-1.255) 0.034
Widow 2 0.11 13 0.03 3.650 (0.823-16.197) 0.089 3.858 (0.856-17.394) 0.079
Divorced 40 2.23 644 1.66 1.474 (1.064-2.040) 0.019 1.160 (0.804-1.672) 0.427
Registered relationship 1 0.06 43 0.11 0.552 (0.076-4.011) 0.557 0.516 (0.071-3.762) 0.514
Not known 8 0.45 68 0.18
Cohabiting
Yes 1516 84.46 33668 86.95 Reference
No 110 6.13 1287 3.32 1.898 (1.552-2.322) <0.001 1.523 (1.216-1.908) <0.001
Not known 169 9.42 3767 9.73
Smoking
Yes 305 16.99 4918 12.70 1.428 (1.257-1.621) <0.001 1.379 (1.202-1.583) <0.001
No 1430 79.67 32920 85.02 Reference
Not known 60 3.34 884 2.28
Maternal BMI
<18.5 (underweight) 100 5.57 1870 4.83 1.246 (1.005-1.545) 0.044 1.276 (1.032-1.577) 0.025
18.5-24.9 1116 62.17 26421 68.23 Reference
≥25 (overweight) 459 25.57 8474 21.88 1.291 (1.156-1.442) <0.001 1.295 (1.156-1.450) <0.001
Not known 120 6.69 1957 5.05
Antenatal visits (total) Range 0-36 Range 0-88
0-5 164 9.14 2063 5.33 2.184 (1.832-2.604) <0.001 1.998 (1.645-2.426) <0.001
6-10 611 34.04 2595 6.70 6.469 (5.761-7.263) <0.001 7.187 (6.367-8.113) <0.001
11-15 704 39.22 19341 49.95 Reference
16+ 275 15.32 14245 36.79 0.530 (0.461-0.611) <0.001 0.471 (0.407-0.544) <0.001
Not known 41 2.28 478 1.23
Antenatal visits at the
hospital outpatient clinic Range 0-25 Range 0-73
0-5 1481 82.51 35717 92.24 Reference
6-10 226 12.59 2296 5.93 2.374 (2.051-2.748) <0.001 2.254 (1.940-2.619) <0.001
11-15 38 2.12 189 0.49 4.849 (3.409-6.897) <0.001 4.676 (3.264-6.699) <0.001
16+ 8 0.45 33 0.09 5.847 (2.696-12.679) <0.001 5.908 (2.699-12.934) <0.001
Not known 42 2.34 487 1.26
Caesarean sections
Yes 166 9.25 2638 6.81 1.394 (1.182-1.643) <0.001 1.790 (1.491-2.148) <0.001
No 1629 90.75 36084 93.19 Reference
Not known 0 0.00 0 0.00
Table 4. Risk factors of preterm birth
* = Adjusted to age, body-mass index (BMI), parity and smoking, OR = odds ratio, CI = confidence interval.

12
Variable Cases Controls OR (95% CI) p OR (95% CI)* p
N % N %
Previous pregnancies Range
0-11
Range
0-17
Yes 1014 56.49 24812 64.08 Reference
No 764 42.56 13654 35.26 1.369 (1.244-1.507) <0.001 1.006 (0.858-1.180) 0.941
Not known 17 0.95 256 0.66
Previous pregnancies Range 0-11 Range 0-17
0 764 42.56 13654 35.26 1.567 (1.393-1.763) <0.001 1.069 (0.905-1.264) 0.431
1 463 25.79 12969 33.49 Reference
2 251 13.98 6436 16.62 1.092 (0.934-1.277) 0.268 1.143 (0.950-1.374) 0.156
3+ 300 16.71 5407 13.96 1.554 (1.339-1.803) <0.001 1.613 (1.305-1.993) <0.001
Not known 17 0.95 256 0.66
Previous deliveries Range 0-11 Range 0-15
Yes 793 44.18 13654 35.26 Reference
No 985 54.87 24812 64.08 1.504 (1.366-1.654) <0.001 1.639 (1.478-1.818) <0.001
Not known 17 0.95 256 0.66
Previous deliveries Range 0-11 Range 0-15
0 985 54.87 17402 44.94 1.692 (1.513-1.892) <0.001 1.783 (1.584-2.008) <0.001
1 474 26.41 14168 36.59 Reference
2 200 11.14 4701 12.14 1.272 (1.074-1.505) 0.005 1.210 (1.015-1.443) 0.034
3+ 119 6.63 2195 5.67 1.62 (1.319-1.991) <0.001 1.422 (1.142-1.770) 0.002
Not known 17 0.95 256 0.66
Miscarriages Range 0-6 Range 0-7
Yes 376 20.95 6709 17.33 1.269 (1.129-1.427) <0.001 1.292 (1.141-1.463) <0.001
No 1402 78.11 31757 82.01 Reference
Not known 17 0.95 256 0.66
Miscarriages Range 0-6 Range 0-7
0 1402 78.11 31757 82.01 Reference
1 255 14.21 5159 13.32 1.120 (0.977-1.284) 0.105 1.132 (0.980-1.308) 0.092
2 83 4.62 1165 3.01 1.614 (1.283-2.029) <0.001 1.702 (1.341-2.161) <0.001
3+ 38 2.12 385 0.99 2.236 (1.595-3.133) <0.001 2.292 (1.618-3.249) <0.001
Not known 17 0.95 256 0.66
Stillbirths Range 0-3 Range 0-4
Yes 27 1.50 166 0.43 3.558 (2.362-5.358) <0.001 4.044 (2.627-6.223) <0.001
No 1751 97.55 38300 98.91 Reference
Not known 17 0.95 256 0.66
Amniocentesis
Yes 102 5.68 1213 3.13 1.863 (1.513-2.293) <0.001 1.716 (1.375-2.141) <0.001
No 1693 94.32 37509 96.87 Reference
Not known 0 0.00 0 0.00
Gender
Male 992 55.26 19753 51.01 1.186 (1.079-1.305) <0.001 1.178 (1.067-1.300) 0.001
Female 803 44.74 18969 48.99 Reference
Uncertain 0 0.00 0 0.00
Glucose tolerance test
Pathological 147 8.19 2429 6.27 1.333 (1.120-1.585) 0.001 1.250 (1.044-1.498) 0.015
Normal 1648 91.81 36293 93.73 Reference
Not known 0 0.00 0 0.00
Insulin treatment
Yes 45 2.51 351 0.91 2.811 (2.054-3.848) <0.001 2.664 (1.928-3.682) <0.001
No 1750 97.49 38371 99.09 Reference
Not known 0 0.00 0 0.00
Table 4. Risk factors of preterm birth, continued
* = Adjusted to age, body-mass index (BMI), parity and smoking, OR = odds ratio, CI = confidence interval.

13
Variable Cases Controls OR (95% CI) p OR (95% CI)* p
N % N %
Prophylactic treatment
for thrombosis
Yes 75 4.18 615 1.59 2.702 (2.116-3.450) <0.001 2.623 (2.041-3.372) <0.001
No 1720 95.82 38107 98.41 Reference
Not known 0 0.00 0 0.00
Infertility treatment
Yes 140 7.80 2079 5.37 1.491 (1.248-1.782) <0.001 1.377 (1.145-1.655) 0.001
No 1655 92.20 36643 94.63 Reference
Not known 0 0.00 0 0.00
Infertility treatment
1 89 4.96 1394 3.60 1.414 (1.135-1.761) 0.002 1.329 (1.060-1.664) 0.014
2 44 2.45 585 1.51 1.665 (1.221-2.271) 0.001 1.498 (1.092-2.054) 0.012
3 7 0.39 100 0.26 1.550 (0.719-3.340) 0.263 1.322 (0.611-2.862) 0.478
No treatment 1655 92.20 36643 94.63 Reference
Not known 0 0.00 0 0.00
Embryo transfer
Yes 90 5.01 1143 2.95 1.735 (1.393-2.163) <0.001 1.560 (1.242-1.960) <0.001
No 1705 94.99 37579 97.05 Reference
Not known 0 0.00 0 0.00
Ovulation induction
Yes 76 4.23 1068 2.76 1.559 (1.229-1.977) <0.001 1.436 (1.128-1.828) 0.003
No 1719 95.77 37654 97.24 Reference
Not known 0 0.00 0 0.00
Anaemia
Yes 112 6.24 1677 4.33 1.470 (1.207-1.791) <0.001 1.522 (1.244-1.862) <0.001
No 1683 93.76 37045 95.67 Reference
Not known 0 0.00 0 0.00
Vaginal bleeding
Yes 66 3.68 165 0.43 8.920 (6.678-11.915) <0.001 8.504 (6.305-11.469) <0.001
No 1729 96.32 38557 99.57 Reference
Not known 0 0.00 0 0.00
Placenta praevia
Yes 61 3.40 36 0.09 37.804 (24.97-57.233) <0.001 42.697 (27.688-65.841) <0.001
No 1734 96.60 38686 99.91 Reference
Not known 0 0.00 0 0.00
Placental abruption 68 3.79
Yes 1727 96.21 75 0.19 20.289 (14.562-28.270) <0.001 20.283 (14.433-28.504) <0.001
No 0 0.00 38647 99.81 Reference
Not known 0 0.00
High blood pressure
Yes 61 3.40 373 0.96 3.617 (2.747-4.761) <0.001 3.125 (2.335-4.181) <0.001
No 1734 96.60 38349 99.04 Reference
Not known 0 0.00 0 0.00
Eclampsia
Yes 2 0.11 5 0.01 8.637 (1.675-44.550) 0.010 3.613 (0.414-31.542) 0.245
No 1793 99.89 38717 99.99 Reference
Not known 0 0.00 0 0.00
Table 4. Risk factors of preterm birth, continued
* = Adjusted to age, body-mass index (BMI), parity and smoking, OR = odds ratio, CI = confidence interval.

14
4 Discussion
Multiple gestations and previous preterm birth have been known to be the two major
risk factors of preterm birth (1-3,6). Vaginal bleeding during the first and second
trimester has also been shown to be a very important risk factor (1,3). In our study,
vaginal bleeding, placenta praevia and placental abruption increased the risk as much as
8.5-, 42- and 20-fold, respectively. Multiple gestations were not included in the study,
because we wanted to study spontaneous preterm singleton deliveries. Moreover,
previous preterm births were not reported in the study data, and could hence not be
studied.
Previous stillbirths increased the risk of preterm delivery to over 4-fold. Possible
explanations include underlying factors previously leading to stillbirth, as well as
behavioural and life style factors. Known risk factors of stillbirth are maternal age >35
years, smoking and overweight or obesity (BMI >25) as well as primiparity, placental
pathology, hypertension and pre-existing diabetes (14). Risk factors of miscarriage are
much the same as those of stillbirth. Two previous miscarriages increased the risk 1.7-
fold, three or more miscarriages even more. Possible explanations include the risk
factors as well as the underlying factors leading to miscarriage.
Previous Caesarean sections are considered a risk when vaginal delivery is planned.
Previous Caesarean section increased the risk of preterm birth with 79%. This is
understandable due to occurred scarring and damage of the uterus, as well as placental
implantation disorders.
Consistent with previous studies (1-3,6,8), assisted fertility treatment increased the risk
of preterm birth. We found ovulation induction and embryo transfer as significant risk
factors, whereas insemination was statistically insignificant, probably due to very few
cases in our data, less than 2% among cases and controls. Possible explanations for the
increased risk include underlying factors of infertility, possible medical illness causing
it, the medical procedure of IVF, increased surveillance and/or intervention prompting
preterm birth or combination of these (8).

15
15
Primiparity has been considered a risk factor and our findings were in consistence with
previous studies (6). In our study primiparity increased the risk of preterm birth with 64-
78% (p<0.001) compared with those with one previous delivery.
It has earlier been noted that male foetuses are at higher risk of preterm birth (15). They
are also at higher risk of malformations, miscarriage and Caesarean section (15). Our
results are consistent with these findings. The underlying explanation remains unknown.
Prophylactic treatment for thrombosis using low-molecular-weight-heparin (LMWH)
has been considered safe. However, we found that LMWH treatment increased the risk
of preterm birth 2.6-fold. Sørensen et al. have showed an increase (OR 1.95, after
adjustment 2.11) in the risk of preterm birth due to exposure to LMWH, but the result
remained statistically non-significant (95% CI 0.89-4.28 and 0.96-4.65) (16). However,
the number of women, who received LMWH and who delivered prematurely was very
small (only seven). Isma et al. recently studied dalteparin use during pregnancy and they
found that dalteparin increased the risk of preterm birth from 5.9% to 11.5% (p=0.002)
(17). Possible reasons for the increased risk include underlying factors leading to
thrombosis, increased risk of bleeding complications and the LMWH and its effects.
Maternal demographic characteristics have been associated with increased risk of
preterm birth (1,3). In our study unmarried women had a slightly increased risk
compared with married women, 13% even after adjustment. Living alone increased the
risk by 52%, most of these women also being most likely unmarried. Some of the
explaining factors could be higher level of psychological and perhaps even physical
stress and lack of support.
In consistence with previous studies (1-3,6), smoking increased the risk with 38%. The
mechanism is unclear, but likely mechanisms involve placental damage, decreased
uteroplacental blood flow and systemic inflammatory response (1).
16
In Finland gravidas have normally around 10 antenatal visits with midwife or nurse and
2-3 antenatal doctors’ appointments during pregnancy, in total 11-15 appointments.
According to guidelines made by STAKES (present THL) pregnant women are
recommend to have 3 doctors’ appointments and in total 7-15 appointments during a
pregnancy (18). In our study the antenatal visits at the hospital outpatient clinic can be
considered as doctors’ appointments. Hence it is clear that more doctors’ visits increase
the risk for preterm birth, since they only occur due to complications and in high risk
pregnancies. Extra appointments with midwife or nurse lower the risk, which is likely
due to more effective surveillance of normal pregnancies. Less than 6 appointments
increased the risk more than 2-fold, when again 6-10 appointments increased the risk
even up to over 7-fold, this is perhaps due to the fact that the pregnancy ends sooner
than planned and hence not all visits have yet occurred – most preterm pregnancies
simply end up in this group. Our results give valuable information about the Finnish
maternity clinic work and the guidelines in practice.
To our knowledge, anaemia, amniocentesis and insulin treatment during pregnancy have
not previously been identified as risk factors of preterm birth. Anaemia has been
associated with foetal growth restriction, but we found that anaemia during pregnancy
increased the risk of preterm birth 1.5-fold. The underlying mechanisms could be
similar to those of smoking, such as lower oxygen level leading to placental ischaemia.
Amniocentesis and chorionic villus sampling have been reported to slightly increase the
risk of miscarriage (13). In our study amniocentesis was associated with 1.7-fold
increased risk of spontaneous preterm birth, whereas chorionic villus sampling was not.
The latter could be due to small number of cases (n=63 among cases, n=1239 among
controls) in the data.
As has earlier been reported, low BMI before pregnancy is a risk factor for preterm birth
(1,3). We received similar results. There has been various results about the outcomes of
maternal overweight (1,2,7). We found that overweight is a risk factor of preterm birth,
actually even more so than underweight (OR 1.29 vs. 1.25, p<0.001 vs. p=0.044). Over-

17
weight itself is a well-acknowledged risk factor of high blood pressure, eclampsia and
diabetes, which all are previously known risk factors for preterm birth (1).
We also found that high blood pressure and pathologic glucose tolerance test result were
significant risk factors for preterm birth. It has previously been noted that diabetes is a
risk factor itself (1). We found that insulin treatment during pregnancy increased the
risk at least 2.6-fold. Pathologic result in glucose tolerance test also increased the risk
1.3-fold. The mild cases of gestational diabetes are usually treated with diet, while the
more severe cases are given insulin treatment. It looks like pathologic result in glucose
tolerance test itself is not very important risk factor, since only some of those women
get insulin treatment. It is either the severity of the diabetes resulting in need of insulin
treatment or the insulin treatment itself (or both) that causes the increased risk.
However, in our study we could not specify the type of diabetes (type 1, 2 or
gestational).
The strength of this study is the large number of patients, almost 60 000, which equals
one years’ deliveries in the whole country. The data is retrospective, but recently
collected, and it is considered very reliable (12). There is a nominal possibility that the
typed data contains human errors. There are no missing cases in the data, but not all
sections of the form are completely filled, which is considered a weakness of this
material.
In summary, we analyzed several potential risk factors of spontaneous preterm birth.
Our results confirmed many of the previously known risk factors, and three new risk
factors, anaemia, amniocentesis and insulin treatment during pregnancy, were also
identified. However, more research is still required in order to identify high-risk
pregnancies and to prevent mortality and morbidity due to preterm birth.

18
References
(1) Goldenberg RL, Culhane JF, Iams JD, Romero R. Epidemiology and causes of
preterm birth. Lancet 2008;371:75-84.
(2) Kurki T. Ennenaikaisensynnytyksen ehkäisyn mahdollisuudet. SLL 2008;63:1053-
1057.
(3) Menon R. Spontaneous preterm birth, a clinical dilemma: etiologic,
pathophysiologic and genetic heterogeneities and racial disparity. Acta Obstet Gynecol
Scand 2008;87:590-600.
(4) Synnytykset ja vastasyntyneet 2009 - Förlossningar och nyfödda 2009 - Births and
newborns 2009. Statistical Summary 26/2010, 12.10.2010. Official Statistics of Finland,
Health 2010. THL.
(5) Ananth CV, Joseph KS, Oyelese Y, Demissie K, Vintzileos AM. Trends in Preterm
Birth and Perinatal Mortality Among Singletons: United States, 1989 Through 2000.
Obstetrics & Gynecology 2005 May;105(5, Part 1):1084-1091.
(6) Jakobsson M, Gissler M, Paavonen J, Tapper AM. The incidence of preterm
deliveries decreases in Finland. BJOG 2008;115:38-43.
(7) McDonald SD, Han Z, Mulla S, Beyene J, Knowledge Synthesis Group. Overweight
and obesity in mothers and risk of preterm birth and low birth weight infants: systematic
review and meta-analyses. BMJ 2010 Jul 20;341:c3428.
(8) McDonald SD, Han Z, Mulla S, Murphy KE, Beyene J, Ohlsson A, et al. Preterm
birth and low birth weight among in vitro fertilization singletons: a systematic review
and meta-analyses. Eur J Obstet Gynecol Reprod Biol 2009;146:138-148.
(9) Yang H, Kramer M, S., Platt R, W., Blondel B, et al. How does early ultrasound
scan estimation of gestational age lead to higher rates of preterm birth? American
Journal of Obstetrics & Gynecology 2002 March;186(3):433-437.

19
(10) Jakobsson M, Gissler M, Paavonen J, Tapper AM. Loop electrosurgical excision
procedure and the risk for preterm birth. Obstet Gynecol 2009;114:504-510.
(11) Available at: http://www.thl.fi/en_US/web/en.
(12) Gissler M, Teperi J, Hemminki E, Merilainen J. Data quality after restructuring a
national medical registry. Scand J Soc Med 1995 Mar;23(1):75-80.
(13) Tabor A, Alfirevic Z. Update on procedure-related risks for prenatal diagnosis
techniques. Fetal Diagn Ther 2010;27(1):1-7.
(14) Flenady V, Koopmans L, Middleton P, Froen JF, Smith GC, Gibbons K, et al.
Major risk factors for stillbirth in high-income countries: a systematic review and meta-
analysis. Lancet 2011 Apr 16;377(9774):1331-1340.
(15) Brettell R, Yeh PS, Impey LWM. Examination of the Association Between Male
Gender and Preterm Delivery. Obstet Gynecol Surv 2009 April;64(4):221-223.
(16) Sorensen HT, Johnsen SP, Larsen H, Pedersen L, Nielsen GL, Moller M. Birth
outcomes in pregnant women treated with low-molecular-weight heparin. Acta Obstet
Gynecol Scand 2000 August;79(8):655-659.
(17) Isma N, Svensson PJ, Lindblad B, Lindqvist PG. The effect of low molecular
weight heparin (dalteparin) on duration and initiation of labour. J Thromb Thrombolysis
2010 Aug;30(2):149-153.
(18) Stakesin perhesuunnittelun ja äitiyshuollon asiantuntijaryhmä. Seulontatutkimukset
ja yhteistyö äitiyshuollossa, suositukset 1999. STAKES oppaita 34, STAKES 1999.
Available at: http://www.stakes.fi/verkkojulkaisut/Muut/op34_1999.pdf.

20
Appendix 1