risk management in variable annuities in japan mgt... · risk management in variable annuities in...
TRANSCRIPT

Risk Management in Variable Annuities in Japan
Kunihiko Iinuma, FIAJ
Andrew Linfoot, FIAA

2
Overview
•
Products and Market•
Capital Market Pricing Model•
Risk Management Issues
3
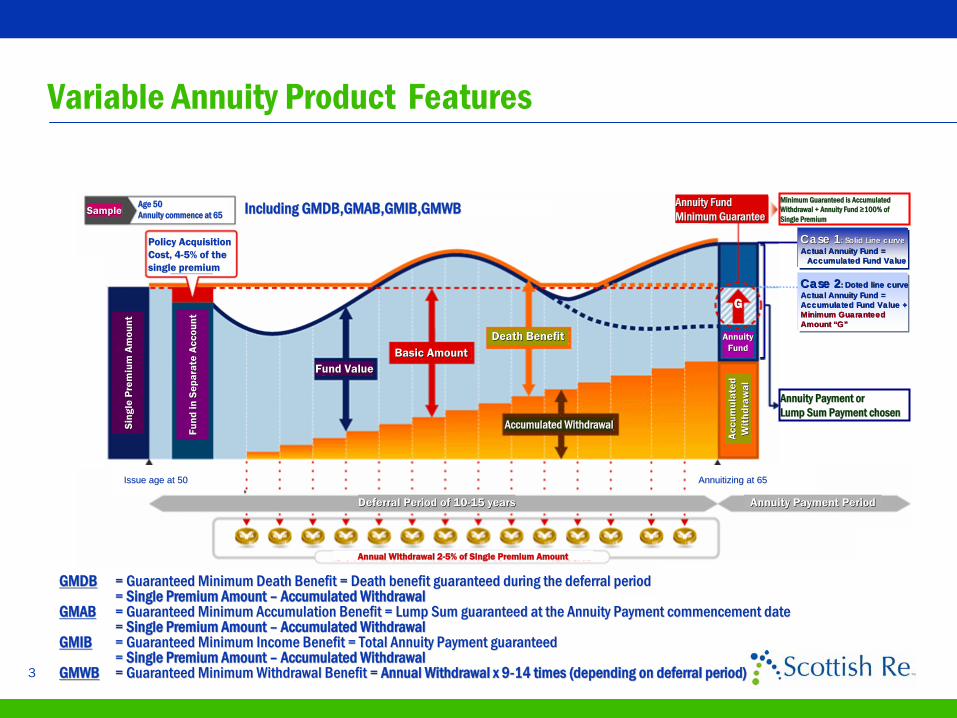
Variable Annuity Product
Features
Policy AcquisitionPolicy AcquisitionCost, 4Cost, 4--5% of the 5% of the single premiumsingle premium
Fund
in S
epar
ate
Acc
ount
Fund
in S
epar
ate
Acc
ount
Sing
le P
rem
ium
Am
ount
Sing
le P
rem
ium
Am
ount
Fund ValueFund Value
Accumulated WithdrawalAccumulated Withdrawal
Deferral Period of 10Deferral Period of 10--15 years15 years
Annual Withdrawal 2Annual Withdrawal 2--5% of Single Premium Amount5% of Single Premium Amount
Acc
umul
ated
A
ccum
ulat
ed
Wit
hdra
wal
Wit
hdra
wal
AnnuityAnnuityFundFund
Age 50Age 50Annuity commence at 65Annuity commence at 65SampleSample
Annuity FundAnnuity FundMinimum GuaranteeMinimum Guarantee
Basic AmountBasic AmountDeath BenefitDeath Benefit
Case 1Case 1: Solid Line curve: Solid Line curveActual Annuity Fund = Actual Annuity Fund =
Accumulated Fund ValueAccumulated Fund Value
Case 2Case 2: Doted line curve: Doted line curveActual Annuity Fund = Actual Annuity Fund = Accumulated Fund Value +Accumulated Fund Value +Minimum Guaranteed Minimum Guaranteed Amount Amount ““GG””
GG
Minimum Guaranteed is Accumulated Minimum Guaranteed is Accumulated Withdrawal + Annuity Fund Withdrawal + Annuity Fund ≥≥100% of 100% of Single PremiumSingle Premium
Annuity Payment orAnnuity Payment orLump Sum Payment chosenLump Sum Payment chosen
Annuity Payment PeriodAnnuity Payment Period
GMDBGMDB
= Guaranteed Minimum Death Benefit = Death benefit guaranteed du= Guaranteed Minimum Death Benefit = Death benefit guaranteed during the deferral period ring the deferral period = = Single Premium Amount Single Premium Amount ––
Accumulated WithdrawalAccumulated WithdrawalGMABGMAB
= Guaranteed Minimum Accumulation Benefit = Lump Sum guaranteed = Guaranteed Minimum Accumulation Benefit = Lump Sum guaranteed at the Annuity Payment commencement date at the Annuity Payment commencement date = = Single Premium Amount Single Premium Amount ––
Accumulated WithdrawalAccumulated WithdrawalGMIBGMIB
= Guaranteed Minimum Income Benefit = Total Annuity Payment guar= Guaranteed Minimum Income Benefit = Total Annuity Payment guaranteed anteed = = Single Premium Amount Single Premium Amount ––
Accumulated WithdrawalAccumulated WithdrawalGMWBGMWB
= Guaranteed Minimum Withdrawal Benefit = = Guaranteed Minimum Withdrawal Benefit = Annual Withdrawal x 9Annual Withdrawal x 9--14 times (depending on deferral period)14 times (depending on deferral period)
Including GMDB,GMAB,GMIB,GMWBIncluding GMDB,GMAB,GMIB,GMWB
Issue age at 50Issue age at 50 Annuitizing at 65Annuitizing at 65

4
New Product Features
Initial Fund(96%)
FundValue
Year
Scenario1: Reached the target (Knock-out)
T=10-15Hit knock out >3
90% of Single premium
Scenario2: has not reached the target until the end of deferral period
death death
GMAB Loss exposure at T -maturity of deferral period
GMDB Loss exposure when deaths are occurred
Products have evolved from the simple GMDB & GMAB features to include more complex options.Example: Target Option rider
Dynamic hedgingDynamic hedging
Single premium(100%)
Target level (120%)
Deferral Period (10-15 years)
Annuity starts orReceive lump sum of maximum of Fund Value or 90% of the Single Premium
Annuity starts immediately
5
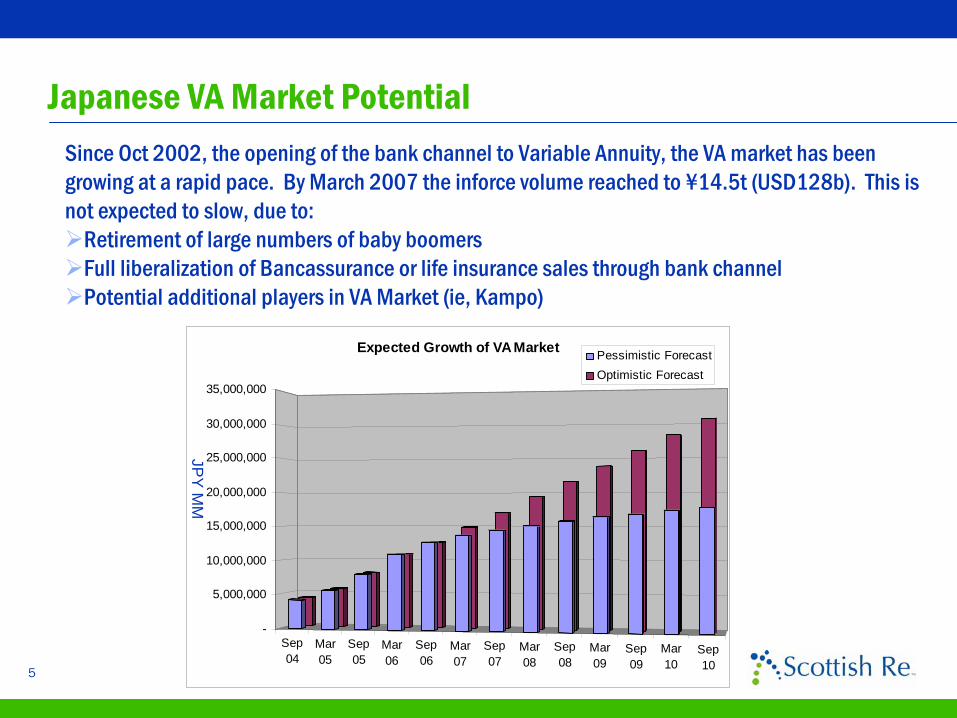
Japanese VA Market Potential
Sep04
Mar05
Sep05
Mar06
Sep06
Mar07
Sep07
Mar08
Sep08
Mar09
Sep09
Mar10
Sep10
-
5,000,000
10,000,000
15,000,000
20,000,000
25,000,000
30,000,000
35,000,000
Expected Growth of VA Market Pessimistic ForecastOptimistic Forecast
JPY
MM
Since Oct 2002, the opening of the bank channel to Variable Annuity, the VA market has been growing at a rapid pace. By March 2007 the inforce
volume reached to ¥14.5t (USD128b). This is not expected to slow, due to:
Retirement of large numbers of baby boomersFull liberalization of Bancassurance or life insurance sales through bank channelPotential additional players in VA Market (ie, Kampo)
6
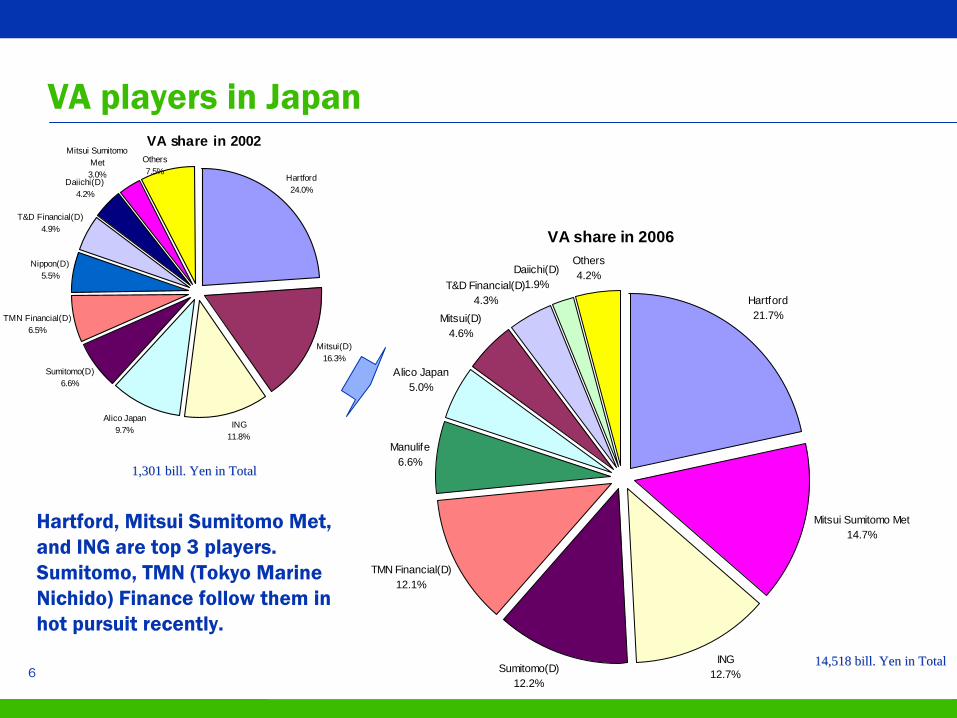
VA players in Japan
VA share in 2006
Hartford21.7%
Mitsui Sumitomo Met14.7%
ING12.7%Sumitomo(D)
12.2%
TMN Financial(D)12.1%
Alico Japan5.0%
Mitsui(D)4.6%
T&D Financial(D)4.3%
Daiichi(D)1.9%
Others4.2%
Manulife6.6%
VA share in 2002
Hartford24.0%
Mitsui(D)16.3%
ING11.8%
Alico Japan9.7%
Sumitomo(D)6.6%
TMN Financial(D)6.5%
Nippon(D)5.5%
T&D Financial(D)4.9%
Daiichi(D)4.2%
Mitsui Sumitomo Met3.0%
Others7.5%
1,301 bill. Yen in Total1,301 bill. Yen in Total
14,518 bill. Yen in Total14,518 bill. Yen in Total
Hartford, Mitsui Sumitomo Met, and ING are top 3 players. Sumitomo, TMN (Tokyo Marine Nichido) Finance follow them in hot pursuit recently.
7
Overview
•
Products and Market•
Capital Market Pricing Model•
Risk Management Issues
8
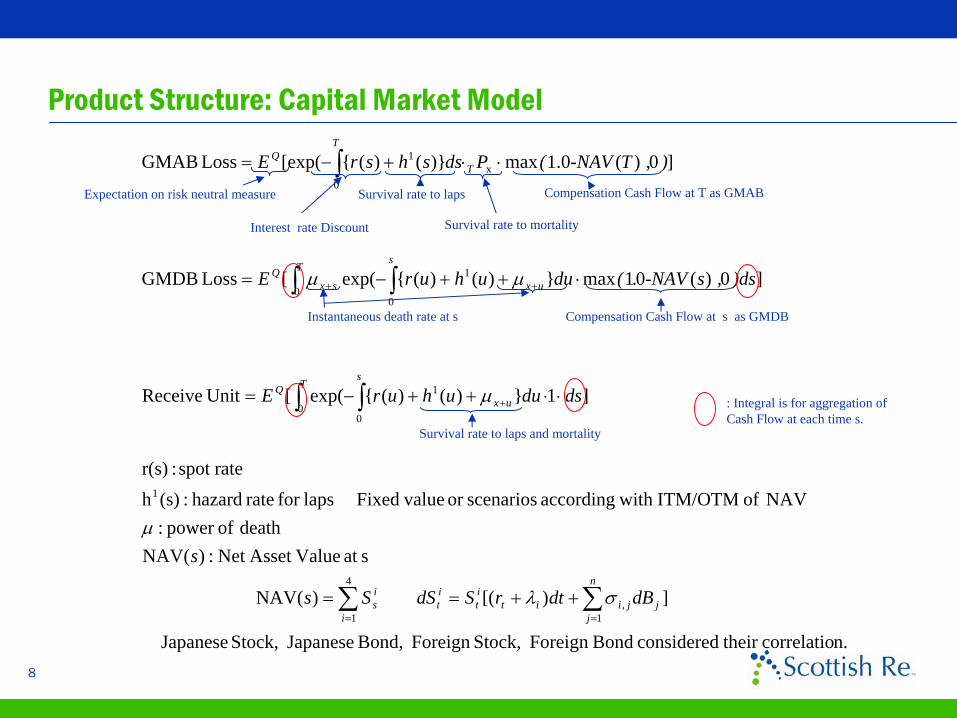
Product Structure: Capital Market Model
n.correlatio their considered BondForeign Stock,Foreign Bond, Japanese Stock, Japanese
])[( )(NAV
sat ValueAsset Net :)(NAVdeath ofpower :
NAV of ITM/OTM with according scenariosor valueFixed lapsfor rate hazard:(s)h ratespot :r(s)
]1})()({exp([ UnitReceive
]0)(01max})()({exp([Loss GMDB
]0)(0.1max)}()({[exp(Loss GMAB
1,
4
1
1
00
1
0
1
0
x0
1
j
n
jjiit
it
it
i
is
Ts
uxQ
s
ux
T
sxQ
T
TQ
dBdtrSdSSs
s
dsduuhurE
)ds ,s-NAV.(duuhurE
) ,T-NAV(PdsshsrE
∑∑
∫ ∫
∫∫
∫
==
+
++
++==
⋅⋅++−=
⋅++−=
⋅⋅+−=
σλ
μ
μ
μμ
Expectation on risk neutral measure
Interest rate Discount
Survival rate to laps
Survival rate to mortality
Compensation Cash Flow at T as GMAB
Instantaneous death rate at s Compensation Cash Flow at s as GMDB
Survival rate to laps and mortality
: Integral is for aggregation of Cash Flow at each time s.
9
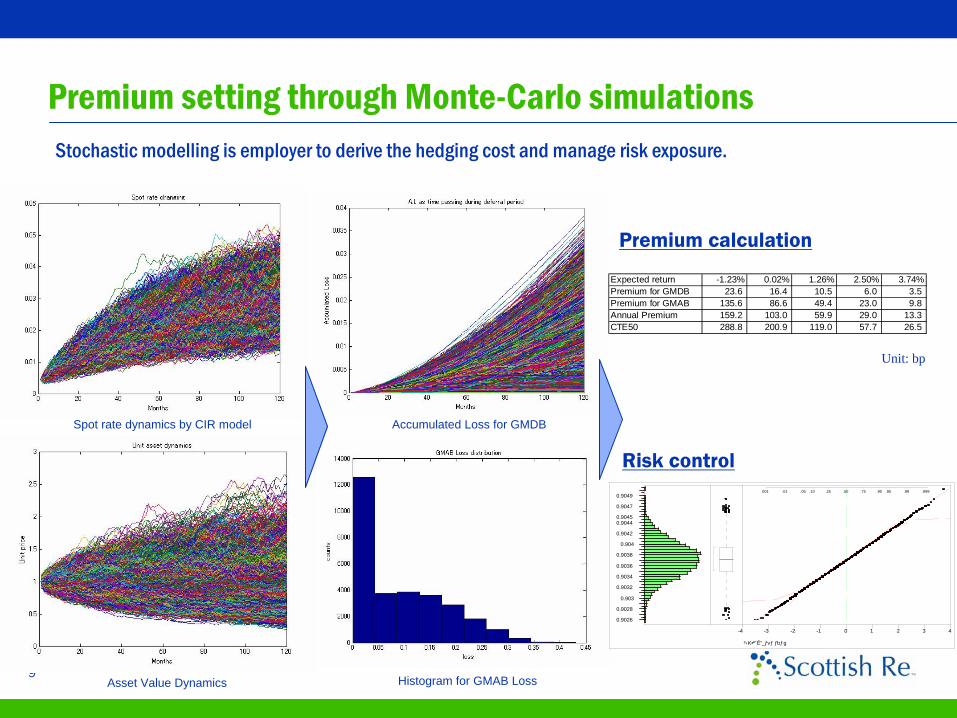
Premium setting through Monte-Carlo simulationsStochastic modelling
is employer to derive the hedging cost and manage risk exposure.
Spot rate dynamics by CIR model
Asset Value Dynamics
Accumulated Loss for GMDB
Histogram for GMAB Loss
Expected return -1.23% 0.02% 1.26% 2.50% 3.74%Premium for GMDB 23.6 16.4 10.5 6.0 3.5Premium for GMAB 135.6 86.6 49.4 23.0 9.8Annual Premium 159.2 103.0 59.9 29.0 13.3CTE50 288.8 200.9 119.0 57.7 26.5
0.9026
0.9028
0.903
0.9032
0.9034
0.9036
0.9038
0.904
0.9042
0.90440.9045
0.9047
0.9049.001 .01 .05 .10 .25 .50 .75 .90 .95 .99 .999
-4 -3 -2 -1 0 1 2 3 4
� �³‹K•ªˆÊ“_ƒvƒ ƒbƒg
Premium calculation
Risk control
Unit: bp
10
Overview
•
Products and Market•
Capital Market Pricing Model•
Risk Management Issues
11
VA Risk Management Complexities
•
Multiple and complex risks exist and are compounded.
•
Typical Actuarial methods cannot control GMxB
risks because,1.Market fluctuation risk is not stabilized by following “Big numbers’
rule”
even if a lot of contracts will be gathered (risks are not independent).2.Actuarial mathematics based on a deterministic or a static approach to risks are hardly applied to uncertain feature in time series.3.The volatility level is relatively higher than traditional insurance risks (market risk).
•
Furthermore, hedging instruments such as capital markets derivatives cannot be applied as there is no consideration of insurance risk nor customers’
behaviours. (Instruments in capital market are based on ideals such as a complete market, no arbitrage, abundant capability, but insurance risks are entirely different from this basis)
•
The interface community between Actuaries and “Quants”
has not been developed before appearances of new product like VA which is in the middle of these 2 markets
12
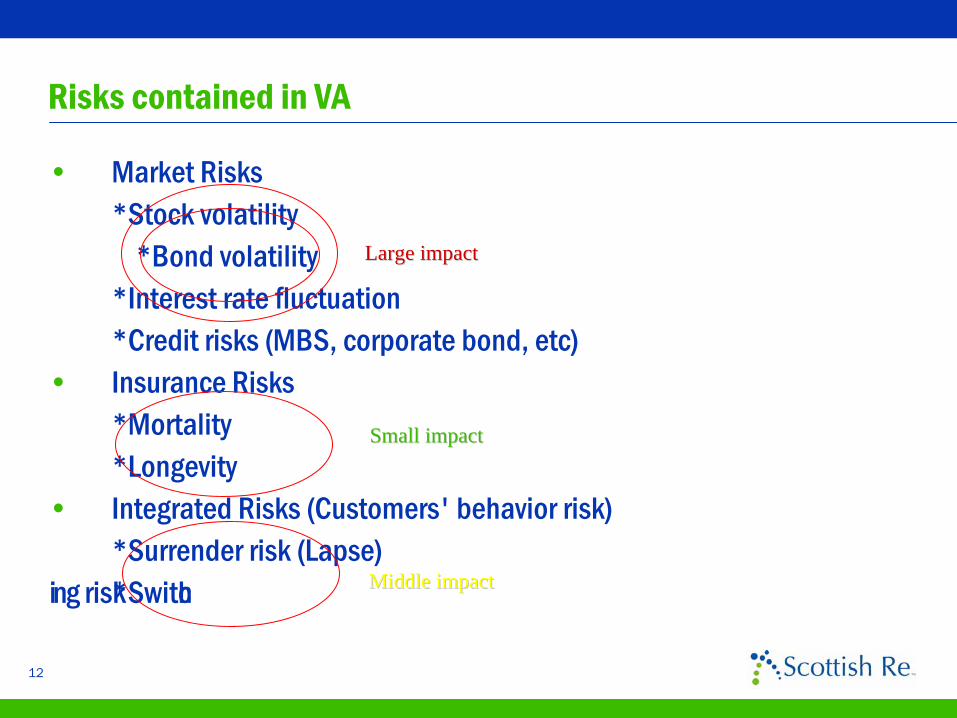
Risks contained in VA
• Market Risks*Stock volatility
*Bond volatility*Interest rate fluctuation*Credit risks (MBS, corporate bond, etc)
• Insurance Risks*Mortality*Longevity
• Integrated Risks (Customers' behavior risk)*Surrender risk (Lapse) *Switching r
i
sk
Large impactLarge impact
Middle impactMiddle impact
Small impactSmall impact
13
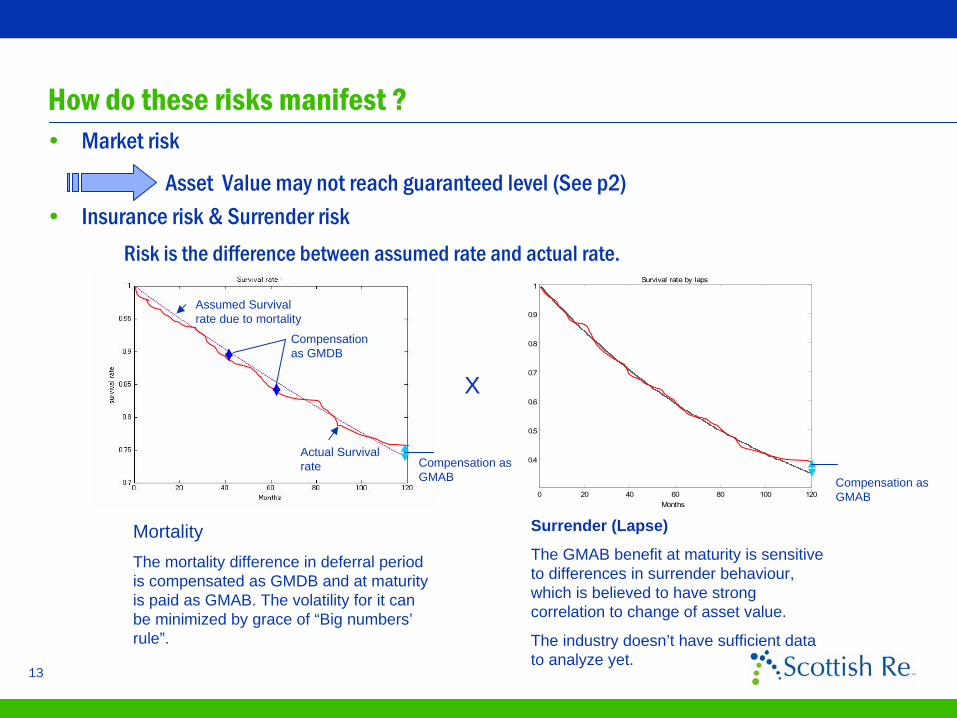
How do these risks manifest ?•
Market risk
Asset Value may not reach guaranteed level (See p2)•
Insurance risk & Surrender riskRisk is the difference between assumed rate and actual rate.
Assumed Survival rate due to mortality
Actual Survival rate
Compensation as GMDB
Compensation as GMAB
0 20 40 60 80 100 120
0.4
0.5
0.6
0.7
0.8
0.9
1
Months
Survival rate by laps
X
MortalityThe mortality difference in deferral period is compensated as GMDB and at maturity is paid as GMAB. The volatility for it can be minimized by grace of “Big numbers’ rule”.
Surrender (Lapse)
The GMAB benefit at maturity is sensitive to differences in surrender behaviour, which is believed to have strong correlation to change of asset value.
The industry doesn’t have sufficient data to analyze yet.
Compensation as GMAB
14
Difficulties for managing Surrender risk•
What makes it hard to make a model for Japanese customers’
Surrender activity.
1. Insufficient data has accumulated in Japan – Only 5 years’ experience(Investment market has been flat for last 5 years )
2. Japanese consumer behavior with financial products is different from that of US or Europe. Hence, transferring the model from there may not be appropriate.
3. The typical VA customer is from the ‘silver generation’ which is different from the customer buying investment products.
4. The existence of surrender charge (penalty) makes sensitivity to potential factors, interest rate, stock price ,etc. lower than would otherwise be the case.
5. VA is not a pure capital market product with no arbitrage, complete market, etc therefore regarding it simply as a derivative is inadequate.
•
However, ignoring this risk is dangerous as:
1. Large deviations from the assumed survival rate at maturity could cause severe GMAB lossed to the insurance company.
2. Using a fixed surrender rate might result in “over-hedging” or “under-hedging”

15
Trial to manage surrender risk –
Dynamic lapse approach
0 20 40 60 80 100 1200.7
0.75
0.8
0.85
0.9
0.95
1
Months
Survival rate by laps
0 20 40 60 80 100 1200.65
0.7
0.75
0.8
0.85
0.9
0.95
1
Months
Survival rate by laps
0 20 40 60 80 100 1200.55
0.6
0.65
0.7
0.75
0.8
0.85
0.9
0.95
1
Months
Survival rate by laps
Fixed Laps rate Fixed Laps rate –– 3%3%
•
Persistency is thought to be negatively correlated to asset values.
ITM 2.0% OTM 4.0%ITM 2.0% OTM 4.0% ITM 1.0% OTM 5.0%ITM 1.0% OTM 5.0%
Assumption: The contracts will lapse at higher rates when asset value is larger than initial value. (OTM)
The contracts will lapse at lower rates when asset value is smaller than initial value. (ITM)
Through the simulation, profitability change can be predicted
for managing risk

16
Hedging of market risk in Japan
•
Market risk hedge solutions are not common because of difficulty
of control, lack of providers, restricted regulation.
•
Major foreign insurance companies cede out to their parent companies.
•
Domestic insurance companies have retained with high reserving imposed by FSA
•
Investment Banks are eager to sell their financial products but the cost level seems to be higher than expected cost level of insurance company.
•
Recently, Millea
holdings announced to establish VA reinsurance company with JP Morgan. This kind of movement will be followed in several years.
17
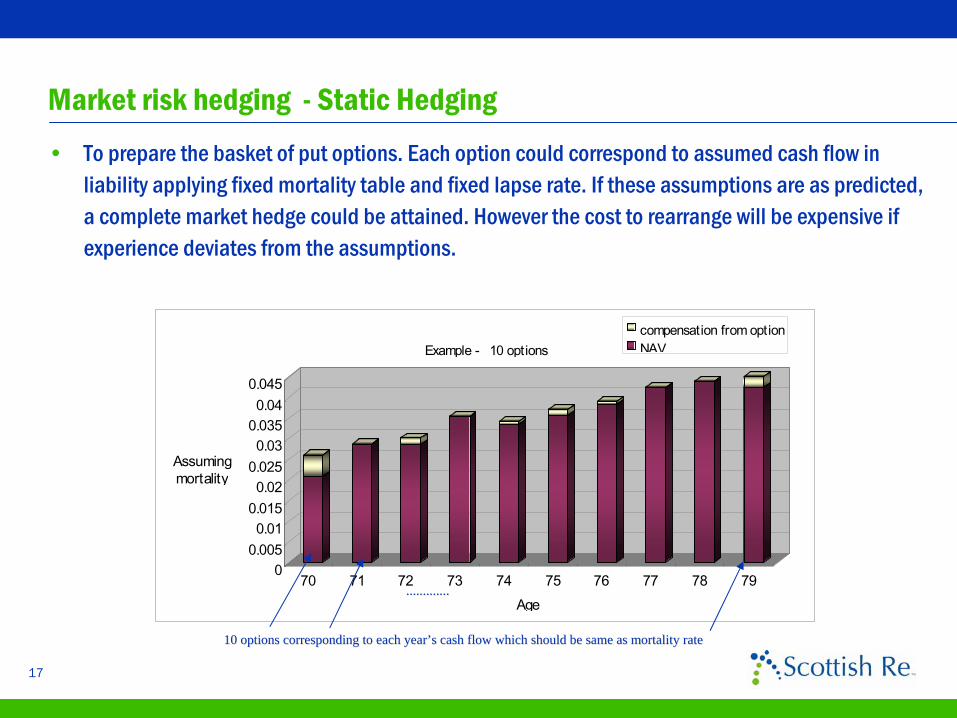
Market risk hedging -
Static Hedging•
To prepare the basket of put options. Each option could correspond to assumed cash flow in liability applying fixed mortality table and fixed lapse rate. If these assumptions are as predicted, a complete market hedge could be attained. However the cost to rearrange will be expensive if experience deviates from the assumptions.
00.0050.01
0.0150.02
0.0250.03
0.0350.04
0.045
Assumingmortality
70 71 72 73 74 75 76 77 78 79Age
Example - 10 optionscompensation from optionNAV
..........................
10 options corresponding to each year10 options corresponding to each year’’s cash flow which should be same as mortality rate s cash flow which should be same as mortality rate
18
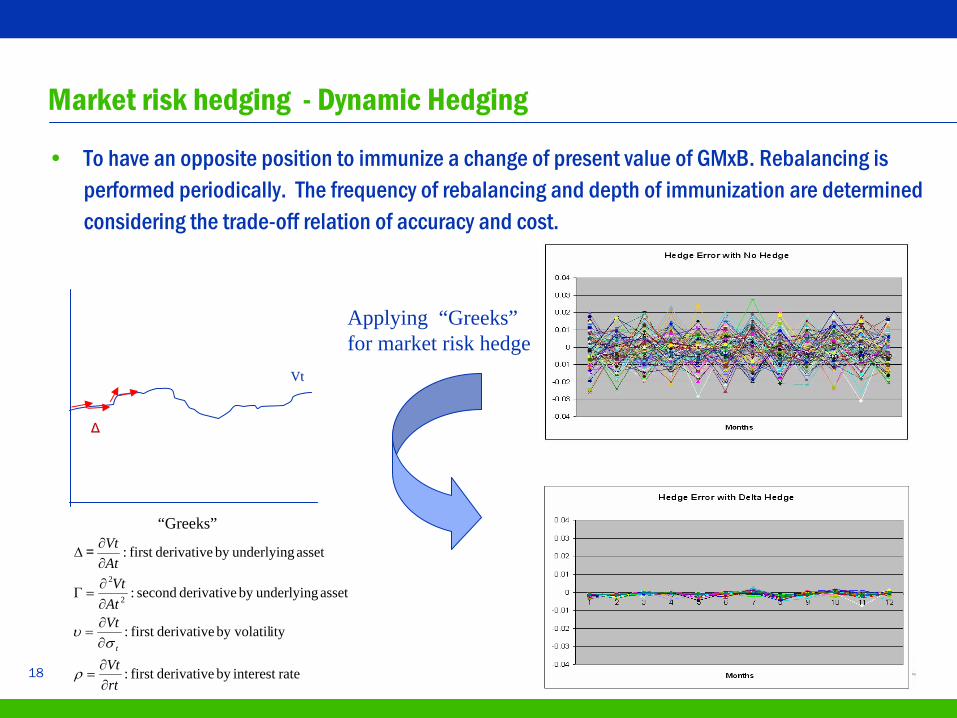
Market risk hedging -
Dynamic Hedging
•
To have an opposite position to immunize a change of present value of GMxB. Rebalancing is performed periodically. The frequency of rebalancing and depth of immunization are determined considering the trade-off relation of accuracy and cost.
rateinterest by derivativefirst :
ityby volatil derivativefirst :
asset underlyingby derivative second:
asset underlyingby derivativefirst :
2
2
rtVt
VtAtVt
AtVt
t
∂∂
=
∂∂
=
∂∂
=Γ
∂∂
Δ
ρ
συ
=
ΔΔ
VtVt
Applying “Greeks” for market risk hedge
“Greeks”

19
Potential Future Developments•
Trial approach for modeling customers’
behaviors (Lapse)
∏∑=
=
=T
iN
jj
i
x
xL1
1)exp(
)exp(
β
β
To adapt survival analysis to each customer segment.
1.
When customers’
behavior depends only on passed time “t”
=>Kaplan-Meier estimation
2.
When customers’
behavior depends on several dynamic factors.
=>Proportional hazard rate model
∫−=t
us
t duxthP0
0 ))exp()(exp( β
Parameters are calibrated through maximizing log likelihood or AIC
Continuous survival rate on lapse

20
Potential Future Developments
•
Feasibility of securitization as a funding vehicle
To transfer market risk and combined risk (surrender risk) to the capital market is a potential key response to the change of insurance industry in Japan, considering its huge capacity and efficiency of capital market.
Funds
InvestorsSPV Principal
Redemption
Premium α
coupon c
c+α-β
Remained principalcompensation
K
Trigger events
T
Reinsurancecompany
Guaranteefacility
guarantee fee
βcompensation
Insurancecompany
Reinsurance premium α’
Loss compensation
Normal situation
Event happens

21
The End
Thanks for your attention

10th Global Conference of Actuaries
About the Authors : Andrew Linfoot Andrew Linfoot is the Regional Director, Asia Pacific of Scottish Re, and the Principal Officer of the Singapore Branch. Having worked with other life reinsurers in Asia since 1996, Andrew joined Scottish Re in 2005 to establish its operations in the region. Prior to his life reinsurance career, Andrew spent several years in pensions consulting with a large life office in Australia. A Fellow of the Institute of Actuaries of Australia since 1995, Andrew is actively involved in industry activities, and is the longest serving President of the Singapore Actuarial Society. Andrew currently sits on the Executive Board of the East Asian Actuarial Congress and the Board of Examiners of the Singapore College of Insurers. Andrew is a frequent speaker at conferences in the region on topics of capital and risk management, and is a keen reader, golfer and musician. Andrew has a Bachelor of Economics, Masters of Business Administration, and three children (not in order of importance). Kunihiko IInuma Kunihiko joined Scottish Re as senior actuarial consultant in October 2006 with bringing variety of local actuarial knowledge extended to the financial engineering and responsible for all actuarial and planning task for Japan Representative Office. He is the fellow of IAJ (Institute of Actuary of Japan) and an examination committee member since 2002 and also completing his PhD of Applied Statistics. Prior to Scottish Re Kunihiko was the ALM department head for MassMutual Japan. He also have a non-life experience and served in Ace Insurance and Zurich Insurance Company. He has a BS in Mathematics from Keio university and MBA in Financial Engineering from Hitotsubashi university.
158