risk, uncertainty and entrepreneurship: evidence from …ftp.iza.org/dp8577.pdf · risk,...
TRANSCRIPT

DI
SC
US
SI
ON
P
AP
ER
S
ER
IE
S
Forschungsinstitut zur Zukunft der ArbeitInstitute for the Study of Labor
Risk, Uncertainty and Entrepreneurship:Evidence from a Lab-in-the-Field Experiment
IZA DP No. 8577
October 2014
Martin KoudstaalRandolph SloofMirjam van Praag
Risk, Uncertainty and Entrepreneurship: Evidence from a Lab-in-the-Field Experiment
Martin Koudstaal University of Amsterdam and Tinbergen Institute
Randolph Sloof University of Amsterdam and Tinbergen Institute
Mirjam van Praag
Copenhagen Business School, Tinbergen Institute and IZA
Discussion Paper No. 8577 October 2014
IZA
P.O. Box 7240 53072 Bonn
Germany
Phone: +49-228-3894-0 Fax: +49-228-3894-180
E-mail: [email protected]
Any opinions expressed here are those of the author(s) and not those of IZA. Research published in this series may include views on policy, but the institute itself takes no institutional policy positions. The IZA research network is committed to the IZA Guiding Principles of Research Integrity. The Institute for the Study of Labor (IZA) in Bonn is a local and virtual international research center and a place of communication between science, politics and business. IZA is an independent nonprofit organization supported by Deutsche Post Foundation. The center is associated with the University of Bonn and offers a stimulating research environment through its international network, workshops and conferences, data service, project support, research visits and doctoral program. IZA engages in (i) original and internationally competitive research in all fields of labor economics, (ii) development of policy concepts, and (iii) dissemination of research results and concepts to the interested public. IZA Discussion Papers often represent preliminary work and are circulated to encourage discussion. Citation of such a paper should account for its provisional character. A revised version may be available directly from the author.
IZA Discussion Paper No. 8577 October 2014
ABSTRACT
Risk, Uncertainty and Entrepreneurship: Evidence from a Lab-in-the-Field Experiment*
Theory predicts that entrepreneurs have distinct attitudes towards risk and uncertainty, but empirical evidence is mixed. To better understand the unique behavioral characteristics of entrepreneurs and the causes of these mixed results, we perform a large ‘lab-in-the-field’ experiment comparing entrepreneurs to managers – a suitable comparison group – and employees (n = 2288). The results indicate that entrepreneurs perceive themselves as less risk averse than managers and employees, in line with common wisdom. However, when using experimental incentivized measures, the differences are subtler. Entrepreneurs are only found to be unique in their lower degree of loss aversion, and not in their risk or ambiguity aversion. This combination of results might be explained by our finding that perceived risk attitude is not only correlated to risk aversion but also to loss aversion. Overall, we therefore suggest using a broader definition of risk that captures this unique feature of entrepreneurs; their willingness to risk losses. JEL Classification: L26, C93, D03, M13 Keywords: entrepreneurs, managers, risk aversion, loss aversion, ambiguity aversion,
lab-in-the-field experiment Corresponding author: Mirjam van Praag Copenhagen Business School Kilevej 14a 2000, Frederiksberg Denmark E-mail: [email protected]
* Previous versions of this paper have been presented at seminars and workshops at the Hebrew University, Copenhagen Business School and SAID Business School of the University of Oxford.

1. Introduction
One of the most salient dimensions of entrepreneurship is risk and uncertainty. Economic theorypredicts that entrepreneurs, as business owning residual claimants, are less averse towards risk anduncertainty than others (Cantillon, 1755; Knight, 1921; Kirzner, 1973 and Kihlstrom and Laffont,1979). Entrepreneurs assume business risks in the most uncertain environments. Their income,wealth, satisfaction and social status are dependent on the outcomes of their decisions in uncertainsituations.1 On top of that, most of the entrepreneurs’ investment portfolios are totally undiver-sified (Moskowitz and Vissing-Jorgensen, 2002), also due to capital constraints in the market forentrepreneurial finance.2 Notwithstanding this theoretical prediction, the body of empirical evi-dence on risk, uncertainty and entrepreneurship is rather mixed (see Holm et al., 2013, AppendixTable). To reconcile these earlier findings we conduct a lab-in-the-field experiment among 910entrepreneurs, 397 managers and 981 employees in the Netherlands.
The recent study by Holm et al. (2013) is most related to ours. They also perform a large-scalelab-in-the-field experiment with incentives to determine how attitudes towards risk and uncertaintydistinguish entrepreneurs from others. They distinguish between strategic and non-strategic risk.Strategic risk covers measures of trust and competition. Non-strategic risk is measured in termsof risk aversion and ambiguity aversion. They find that entrepreneurs are more willing to assumestrategic risk but are not more willing to assume risks lacking a strategic, interactive character. Ourstudy is distinct from theirs in three ways. First, we compare entrepreneurs (in a Western countryas opposed to China) to managers as well as employees and not to the local population at large.Second we use both a survey-based and an experimental, incentivized measure of risk aversion.Third, we also measure loss aversion and find that this is the most important difference betweenentrepreneurs and managers in the domain of risk and uncertainty.
More generally, our study can be characterized by the following four distinguishing features.First, we elicit peoples’ risk attitudes using two different measures: one is an ‘objective’ measurewhich is incentived and experimental, based on a multiple pricelist (MPL) elicitation method (inthe style of Holt and Laury, 2002). The other is ‘subjective’, i.e., survey-based and self-assessed(Dohmen et al., 2011). Both are well-established within their categories and have been extensivelyvalidated and used.3 So far, studies testing differences in risk attitudes between entrepreneurs andothers have either used an incentivized experimental measure in the Holt and Laury style, or a non-incentivized self-assessed survey-based measure in the spirit of Dohmen et al., 2011). Interestingly,
1For further references, see e.g., Cantillon (1755); Say (1803); Knight (1921); Petersen and Rajan (1994); Bergerand Udell (1998); Heaton and Lucas (2000); Moskowitz and Vissing-Jorgensen (2002); Gentry and Hubbard (2004);Heaton and Lucas (2004) and Parker (2009).
2E.g., Evans and Jovanovic (1989); Holtz-Eakin et al. (1994a,b); Hvide and Møen (2010); Fairlie and Krashinsky(2012) and Schmalz et al. (2013).
3See Filippin and Crosetto (2014) for a meta-analysis of studies using the Holt and Laury measure to relate riskto gender. For a validity test of the Dohmen et al. (2011) measure, see Dohmen et al. (2007), Bonin et al. (2007),Caliendo et al. (2009), Lonnqvist et al. (2011) and Beauchamp et al. (2012). Overall, the Dohmen question scoreshighly on re-test reliability within-person and has been shown to be virtually stable over re-test intervals rangingfrom three weeks up to almost two years (see Dohmen et al., 2007, and Lonnqvist et al., 2011). However, a recentstudy by Brachert and Hyll (2014) shows that occupational choices may affect the Dohmen test outcomes.
2

all studies using experimental measures of risk aversion find no differences between entrepreneursand the control group, whereas most of the other studies do find differences supporting the commonwisdom that entrepreneurs are less risk averse. By using both measures we can contribute to theexplanation of the mixed findings so far.4
Second, besides comparing entrepreneurs and others with respect to risk, we also try to un-derstand in what related aspects entrepreneurs and managers are different. We consider both lossaversion, allowing an asymmetric effect of losses and gains on peoples’ utility, and ambiguity aver-sion, i.e. probabilities are unknown and there is genuine uncertainty in the Knightian sense.5 Byrelating the three incentivized experimental measures of uncertainty (risk, loss and ambiguity aver-sion) to the survey-based self-assessed measure of risk aversion we can extend our understandingof the relationship between objective and subjective measures of risk. For instance, we find thatsubjects’ views of what is risk aversion is in fact a mixture of what economists call risk, loss andambiguity aversion.
Third, we use a double control group. Instead of comparing entrepreneurs with the generalpopulation, we use two tightly defined control groups, viz. managers and employees.6 We are espe-cially interested in the first control group. Behavioral characteristics of managers and entrepreneurshave been compared in various studies (e.g. Brockhaus, 1980; Schere, 1982; Begley, 1995; Busenitzand Barney, 1997 and Stewart Jr. et al., 1999), because the two groups are arguably very similar.Both are responsible for strategic and complex decisions and are managing the employees in theircompanies (if any). Therefore they are likely to be similar in terms of many observable aspects,such as education, age, and labor market participation. We indeed observe that the managers andentrepreneurs in our sample are very similar, whereas the differences in background characteris-tics with employees are sizeable. If these differences extend to unobserved characteristics, such asmotivation, perseverance or wealth, no fair comparison can be made between entrepreneurs andnon-entrepreneurs. Therefore, employing two relatively similar control groups allows for a cleanertest of behavorial differences between entrepreneurs and others. Using the two control groups may
4Examples of studies using Holt and Laury style elicitation of risk attitude are Elston and Harrison, 2006; Mackoand Tyszka, 2009; Sandri et al., 2010; Burmeister-Lamp et al., 2012 and Holm et al. (2013). Examples of studies onrisk and entrepreneurship using non-experimental measures of risk attitude are Hull et al., 1980; Brockhaus, 1980;Caird, 1991; Begley, 1995; Koh, 1996; Sarasvathy et al., 1998; Stewart Jr. et al., 1999; Van Praag and Cramer, 2001;Uusitalo, 2001; Cramer et al., 2002; Djankov et al., 2006, 2007 and Caliendo et al. (2010).
5Gächter et al. (2010) is the only study we are aware of that also compares the degree of loss aversion acrossoccupational groups. They find that entrepreneurs are less loss averse on average than others in the risky choicecategory. Moreover, managers appear less loss averse than blue-collar workers but not than white-collar workers. Thedegree of ambiguity aversion of entrepreneurs has been compared to students and non-entrepreneurs by Koh (1996),Macko and Tyszka (2009) and Holm et al. (2013) and with managers by Schere (1982). With the exception of Holmet al. (2013), who do not report a significant difference, the general finding seems to be that entrepreneurs are betterable to cope with ambiguous situations than both managers and non-entrepreneurs are.
6Many studies have used rather unspecified control groups, such as Van Praag and Cramer (2001); Uusitalo (2001);Cramer et al. (2002); Elston and Harrison (2006); Djankov et al. (2006, 2007); Macko and Tyszka (2009); Caliendoet al. (2010); Sandri et al. (2010); Burmeister-Lamp et al. (2012) and Holm et al. (2013).
3

also show to what extent differences are related to the control group used.7,8
Fourth, following the debate in the literature about who can be considered an entrepreneur (seefor instance Parker, 2009; Levine and Rubinstein, 2012 or Henrekson and Sanandaji, 2014), weverify our main findings by using various alternative definitions of the entrepreneur. In our basicsample, an ‘entrepreneur’ is someone who founded, inherited or has taken over a company that s/heis currently (co-)managing and of which s/he has at least 5% of the shares.9 We use alternativesubsamples that are based on ‘stricter’ definitions of entrepreneurship (see Lindquist et al., 2013), i.e.those that are arguably more successful and thus more similar to the ‘Schumpeterian’ entrepreneur.Subsamples used incude: (i) incorporated entrepreneurs (Levine and Rubinstein, 2012), making upalmost half of the sample, (ii) entrepreneurs with an above median number of employees and (iii)entrepreneurs with above average income. In comparable ways, we also use various more selectivedefinitions of our control groups. Managers in the basic sample are defined as employees in firmsnot started up by the respondent, and having at least two direct reports under their responsibility.The stricter definitions limit the sample to: (i) CEOs (17%), (ii) managers with an above mediannumber of direct reports and (iii) managers with above median income. Finally, employees are thepeople who work in organizations and do not belong to the groups of entrepreneurs and managers(when using the baseline, i.e., least ‘strict’ definitions for entrepreneurs and managers).
Our findings tell the following story. Entrepreneurs perceive themselves as more risk tolerantthan managers who see themselves, in turn, as being more risk tolerant than employees. Thisranking is consistent with most of the previous studies using subjective measures of risk. However,based on the objective MPL risk aversion measure, entrepreneurs and managers have similar riskattitudes, but are both less risk averse than employees. When analyzing the differences in loss andambiguity aversion across the three groups, we show that loss aversion is the missing piece. Whereasall three groups have similar degrees of ambiguity aversion, entrepreneurs have a significant lowerlevel of loss aversion than the two other groups. We reconcile these different findings by relatingthe subjective risk measure to all three experimental measures. All three appear to be stronglyrelated to what people self-assess to be their risk attitude. Respondents thus have a notion of ‘risk’that is different from economists, and more a mixture of risk and uncertainty. Hence, not onlycould a distinct degree of risk aversion of managers and entrepreneurs explain the differences intheir self-assessed risk attitude, these differences may also relate to differences in loss or ambiguityaversion. All these results are independent of the various definitions we use of entrepreneurs and
7Many studies that have compared entrepreneurs and managers are relatively old and rely on small samples andself-assessed measures of risk attitude. The overall findings are mixed, too. Brockhaus (1980) and Busenitz andBarney (1997) found no differences between the two groups, whereas both Begley (1995) and Stewart Jr. et al. (1999)report lower levels of risk aversion among entrepreneurs than managers. Furthermore, a meta-analytical reviewby Stewart Jr. and Roth (2001) concludes that managers are more risk averse than entrepreneurs, although thisconclusion is challenged by Miner and Raju (2004) who conclude that the role of risk propensity in entrepreneurshipremains unresolved.
8In a comparison of managers and employees, Graham et al. (2013) show that managers have a lower risk aversionthan employees.
9Five percent is the cutoff ownership that the tax authority calls ‘a substantial interest’. However, we find that88% (65%) of the entrepreneurs in our sample holds at least 30% (51%) of the company shares.
4

managers. In some cases, limiting the sample to more successful entrepreneurs even strengthens theresults.
Our two main conclusions are basically two sides of the same coin. First, entrepreneurs do differfrom managers and employees in their attitude towards risk and uncertainty, but in a rather subtleway. Second, subjective self-assessed measures of risk attitude measure more than the economists’strict notion of risk aversion alone. The distinguishing trait of entrepreneurs thus becomes apparentonly after realizing that there is more to risk and uncertainty than risk aversion per se.
We think it is rather intuitive that entrepreneurs are indeed different from managers in theway they deal with risk and uncertainty and that the difference is related to how losses ‘loomlarger than corresponding gains’ (Kahneman and Tversky, 1979, 1984; Tversky and Kahneman,1992). The entrepreneur’s position is one in which much more is at stake to be lost than in therole of a manager. However, our study cannot reveal why entrepreneurs are found to be lessloss averse than managers. Although the general consensus tends to be that preferences in thedomain of risk and uncertainty are stable (see e.g. Borghans et al., 2008, Sahm, 2012, and Fouargeet al., 2014), a recent study by Brachert and Hyll (2014) cast serious doubt on the stability ofthese preferences. Therefore, the descriptive nature of the study prevents us from drawing causalconclusions. Entrepreneurs might either be less loss averse types or might become less loss aversewhen becoming an entrepreneur. In a similar vein, a managerial context might also affect managerialloss aversion considering the asymmetry in blame and credit within organizations (Swalm, 1966;Kahneman and Lovallo, 1993). We acknowledge that this is a limitation of our study. However,this limitation notwithstanding, we believe that our study not only contributes to the literature byfurther clarifying the unique behavioral features of entrepreneurs in comparison with managers andemployees, but also by offering an explanation for the previous mixed results in this area.
In what follows, Section 2 discusses design and measurement issues. In Section 3 we present thedescriptive statistics of our sample. Section 4 reports the empirical findings. Section 5 provides adiscussion and conclusion.
2. Measurement and sampling
2.1 Measurement of risk, loss and ambiguity aversion
Entrepreneurship is associated with risk bearing, uncertainty, gains and losses. The classic economistsand philosophers who laid the foundation of thinking about entrepreneurship all but Schumpeterdefined the entrepreneur either as a risk bearer (Cantillon, 1755; Say, 1803; Marshall, 1930), anuncertainty bearer (Knight, 1921), or as agents who are less inclined to avoid losses (Knight, 1921;Marshall, 1930).10 Intuitively these three different concepts can be understood as follows.
10The earliest philosophic thinker about entrepreneurship Cantillon (1755) defined the entrepreneur as a risk beareras a consequence of buying and selling at uncertain prices. Say’s entrepreneur (1803) is a risk bearer because of the riskof losing capital and reputation due to the likelihood of failure. Hence, Say defines entrepreneurship in terms of the
5
Risk aversion is a concept with a very specific meaning in economics. It is the willingness ofpeople to sacrifice expected payoffs to circumvent taking risks. In other words, it measures theextent to which the utility of a guaranteed payoff (for instance 50) is higher than the utility derivedfrom a proposition with the same expected reward obtained with risk (for instance 100 with 50%probability and 0 with 50% probability). Risk aversion is involved in decision making situationswhere a probability can be assigned to each possible outcome of the situation.
Loss aversion refers to the notion that decision makers prefer to avoid losses over acquiringgains. Loss aversion was first demonstrated by Kahneman and Tversky in their prospect theory(Kahneman and Tversky, 1979, 1984). Loss aversion implies that losing 50 will decrease utility orsatisfaction by more than the increase in utility or satisfaction that is associated with a (windfall)gain of 50. Loss aversion explains the well-known endowment effect (Kahneman et al., 1990) thatpeople value the goods and assets they own higher than identical goods and assets they do not own.
Ambiguity aversion is also known as uncertainty aversion and refers to a preference for riskswith known probabilities over and above risks with unknown probabilities (true Knightian uncer-tainty), e.g., Ellsberg (1961) and Holm et al. (2013). Ambiguous events have a greater degree ofuncertainty than risky events because not only is the outcome uncertain, but also the probabilityof the realization of that outcome and, as a consequence, the expected payoff.
Risk aversion
To measure risk aversion empirically, we rely on two measures. The first experimental, choice-basedmeasure is obtained by using the multiple price list (MPL) format of Dohmen et al. (2010), whichoriginates from Holt and Laury (2002). Participants are confronted with a list of ten decisionsbetween two options: a risky one with known probabilities (Option A) and a safe one (Option B).In each of the ten cases option A corresponds to gaining €300 with a 50% chance or gaining €0with a 50% chance . The safe option B on the other hand gradually increases from €25 to €250 (seeFigure 1). Instead of asking each participant to reveal their preferences for every decision, we askedeach participant to indicate their switching point.11 For example, a possible answer that could beselected was “I prefer Option A in decision 1 and Option B in 2-10”. Risk-neutrality is implied inthis setup by a switching point from Option A to Option B at the 6th decision (€150 for sure).
The second, survey-based measure of risk aversion is copied from Dohmen et al. (2011). Par-
risk of losses rather than of gains. Marshall’s view on entrepreneurship (1930) is the most common one: entrepreneursare responsible for assuming the business risks associated with their enterprise. Marshall also acknowledges that afew extremely high prices will have a disproportionately great attractive force (Marshall, 1930, p. 554) “because risklovers are more attracted by the prospects of a great success than they are deterred by the fear of failure” . Thus,also Marshall pays particular attention to loss aversion. Knight (1921) was the first to explicitly distinguish betweenrisk and true uncertainty (ambiguity). He defines the entrepreneur as the particular kind of individual who bearsuncertainty because business decisions practically never concern calculable probabilities (Van Praag, 1999, p. 322).
11Others have also adapted MPL formats eliciting a switching point from the respondents rather than having themmake separate and similar decisions in a row (see e.g. Dohmen et al., 2011 and Gneezy and Pietrasz, 2014). We optedfor using switching points because the experiment includes multiple MPL formats and we assume that entrepreneurs,managers and employees are time-constrained (more so than students in a laboratory who have given up the hour ofthe experiment anyway).
6
ticipants indicate their self-perceived willingness to take risks in general, as well as in the twosub-domains of career and financial matters. We employed a 0-10 scale, where 0 stood for “Not atall willing to take risks” and 10 for “Very willing to take risks”.12
< INSERT FIGURE 1 HERE >
Loss aversion
Loss aversion is measured by means of the MPL applied by Fehr and Goette (2007) and Gächteret al. (2010), which in essence is like the Holt and Laury price list but also includes negative payoffs.In this case, Option A consists of a 50% probability of receiving €6 and a 50% probability of losingan amount between €1 - €10. When selecting the safe Option B, participants receive €0 (see Figure2). Again, we are interested in the respondents’ switching points.
Overall, the small stakes in these lotteries ensure that risk aversion cannot convincingly explainthe choice behavior in these decisions, as risk aversion in such small-stake lotteries would implyextreme degrees of risk aversion in high-stake gambles (e.g. Rabin, 2000; Wakker, 2005; Fehr andGoette, 2007 and Wakker, 2010). Rabin (2000) therefore argues that under expected utility theory,people should be risk neutral in such small stakes gambles. We emphasize in our survey that se-lecting Option A entails a real loss of money.
< INSERT FIGURE 2 HERE >
Ambiguity aversion
Our measure of ambiguity aversion is taken from Fox and Tversky (1995) and Gneezy and Pietrasz(2014) and uses an MPL structure again. In each of the ten decisions, we present participants withan Urn A with 50 red balls and 50 black balls, and an Urn B which has an unknown distributionof red and black balls. The selection of Urn A pays off €300 if a red ball is drawn and €0 if it isblack. If participants choose to select Urn B, payments vary between €250 and €475 if a red ballis drawn and is €0 in the case of a black ball, see Figure 3.
< INSERT FIGURE 3 HERE >
12In the design of the questionnaire, this question was widely spaced from the incentivized risk measure, whichcame first. The question about willingness to take risk in general is of main interest, the ones about career andfinancial matters are used for robustness checks.
7

2.2 Sampling
According to Holm et al. (2013, p. 1676), obtaining a large-scale experiment involving hundreds ofentrepreneurs and managers “...would be a demanding undertaking anywhere in the world. Ownersand CEOs of established firms are rarely willing to devote their scarce time to time-consumingacademic studies.” They observe that some earlier studies solved this problem by studying theself-employed, others by using small (convenience) samples, whereas they themselves have goneto China to perform an incentivized experiment with affordable monetary awards. Their sampleincludes 700 private enterprises, excluding start-ups and small-scale household firms, and a randomsample of 200 individuals as control group. They note that their control group is not ideal and that“...the ideal control group would be one that is identical to the entrepreneurs except that they arenot entrepreneurs” (p. 1677).
We took a different route to obtain a large-scale sample in a Western country (the Netherlands),including a control group that is rather similar to the group of entrepreneurs. We decided to bringthe lab to the field and obtain responses from participants online. This practice is not uncommonwhen aiming for a substantial response from the field (see e.g., DeMartino and Barbato, 2003; Blockand Koellinger, 2009; Graham et al., 2013). We were able to reach qualifying participants throughour extensive network of the Amsterdam Center for Entrepreneurship (ACE). For entrepreneurs, wecollaborated with “Synpact”, a company that has the digital Rolodex of a random selection of smalland medium sized enterprises, including 15,000 entrepreneurs in the Netherlands. The Rolodex issupported by frequent contacts through a wide variety of training programs and conferences. The15,000 entrepreneurs all received an invitation to participate in the online research.13 For managers,we collaborated with a large and highly reputed training center (“De Baak”), which is part of thelargest and influential employers’ organization (“VNO-NCW, MKB-Nederland”) in the Netherlands.The training center was willing to send our invitation to participate in the research to all managersthey have in file, a total of 5,888. The same invitation was sent to a sample of 7,850 employees, whichwere recruited via a Dutch market research agency with access to over 70,000 Dutch employees.
Invitations to participate were sent out to the groups of entrepreneurs and managers on October1 (Round 1) and to the employees on November 4 (Round 2). All groups had exactly 14 days torespond and non-respondents at that stage received a reminder after 7 days. Out of all people whoreceived the mailing, 910 entrepreneurs, 397 managers and 981 employees completed the survey.Response rates were thus in the range of 6-12%. These are comparable to the European responserates in e.g. Graham et al. (2013). A comparison of respondents with non-respondents based on theavailable observables (age and gender) yields no significant differences for entrepreneurs and man-agers. For the responding employees, however, females were slightly oversampled (53% versus 47%).
Incentives
Respondents were requested to first complete two parts of incentivized games and then fill out13See Appendix A for the translated letter.
8
the survey, including the subjective measure of risk aversion and several background questions.14
All participants first received instructions about what to expect in general and about the rewardstructure. Instructions also included examples to get familiar with the experimental setup. The totalquestionnaire took on average 14 minutes, including possible breaks that people took while online.Except for the general risk question, all decisions in our survey were made incentive compatibleand thus had real financial consequences if one was a selected as prize winner. This was clearlycommunicated.
Incentives are such that participants can earn a maximum of €675 (€200 in Part 1 and €475in Part 2) and a minimum of €90 (€100 in Part 1 and -€10 in Part 2), depending on their choicesand luck. The luck component consist of three elements. First, decisions involve a random drawwhenever a participant selects a risky or ambiguous option. Second, in each of the two parts, onlyone decision is randomly selected for payment. Such a procedure is quite common in the literature(see e.g. Laury, 2006 and Dohmen et al., 2011) and is according to Azrieli et al. (2012) the onlyincentive-compatible way to utilize the MPL method. Third, only a random selection of participantsare selected as winners and actually paid out. Given a limited budget and the income levels of theparticipants we chose to pay out substantial (instead of very small) amounts to a few (instead ofall) randomly selected participants.15 In round 1 we randomly selected two winners from each day’scompleted participants’ files in the first week and one winner per day in the second week. Thisresulted in 21 prize winners in round 1 in total. In the second round, we paid out five participants.Overall, chances of getting paid out were 1/62 in the first round and 1/196 in the second round.This was unknown to the participants (and ourselves) beforehand.
Draw and payment schedule
To foster trust, all prize winners as well as all other random draws were performed by a civil-lawnotary who also monitored a legitimate course of the payouts. The procedure at the notary was asfollows. Before the start of the experiment, it was agreed that we would pay out the 15th and 30thparticipant of each day in the first week and the 15th participant of each day in the second week.The daily rankings were established based on the registered end time of each survey. Furthermore,we also determined a payment schedule prior to the experiment which outlined the two winningchoices in Part 1 and Part 2 for each prize winner and whether s/he was lucky when taking therisky option. The most involved part was to settle the ambiguity in our ambiguity aversion measure.Here we took two draws from two urns with 101 numbers (0 until 100). The first draw rendered abenchmark number that corresponded to the percentage of winning (e.g. 88 leads to an 88% chanceof winning). The second draw from the other urn determined if a participant was lucky, whichoccurred whenever the second number was lower than or equal to the first number. Overall, theseseries of draws yielded a payment schedule that was accustomed to every choice a prize winner could
14The first part of incentivizes gameswas designed to obtain proxies for overoptimism while the second part aimedat eliciting preferences such as risk and loss aversion. This paper only reports about the second part.
15Laury (2006) finds evidence that the two payment procedures lead to similar results.
9

make. The notary’s official statement on the draws (in Dutch) is available upon request.
Default definitions of entrepreneurs, managers and employees
The qualifying characteristics for inclusion in the entrepreneur sample were: all people who havefounded, inherited or taken over a company that they are currently (co-)managing. We also classifiedparticipants as ‘entrepreneurs’ who obtained firm ownership over a company within 5 years afterstart-up and who are currently its (co-)manager. Individuals qualify for inclusion in the sample of‘managers’ if they are employed by an organization that they did not start up themselves and haveat least two subordinates for whom they are directly responsible. We also classify project managersas ’managers’ in case they have overall responsibility for their projects and at least two directreporting lines. People belong to the group of ‘employees’ if they are employed by an organizationand do not belong to the first two groups.16
2.3 Descriptive statistics
Panel A in Table 1 shows the sample descriptive statistics (N = 2288) of the measures of risk,loss and ambiguity aversion. Panel B reports the correlations between these variables,. For easeof presentation we have reversely coded the survey measure of risk, such that a higher value nowimplies a stronger aversion to risk. Note, however, that the levels of the different measures in panelA are not directly comparable.
Panel B shows that most of the correlations between the measures are rather low. The corre-lation with the highest absolute value is the one between the two measures of risk attitude. Thesurvey-based measure of risk attitude is also correlated significantly with both loss and ambiguityaversion, but to a lower degree. The low correlations between the three experimental measuressupport the idea that these measures capture distinct behavorial aspects of risk and uncertainty.
< INSERT TABLE 1 HERE >
Table 2 shows the descriptive statistics of some characteristics that are used to define strictersubsamples of (more successful) entrepreneurs and managers. Panel A shows the income distri-bution of each of the three samples according to the answer categories used in the questionnaire.Entrepreneurs are over-represented in both tails of the income distribution relative to managers,which is a common observation (Hamilton, 2000). We do not observe substantial differences betweenthe average level of the entrepreneurial and managerial incomes, though. Both are higher than the
16Participants who are both entrepreneurs and managers or employees, and therefore eligible for multiple subsam-ples, were instructed to select the one generating most of their income. With the exception of 12 participants, theseinstructions were followed up adequately.
10
income level of employees. For entrepreneurs and managers, the median income is in the category of€50,001-€75,000.. For employees the median value falls in a lower category, i.e., €25,001-€50,000,which is in line with the modal income of €33,500 in the Netherlands in 2013. For all groups wewill analyze subsamples of above median income earners.
Panel B shows that 82% of the entrepreneurs in our sample are the founder of their firms, acommonly used stricter definition of entrepreneurs. 14% of the firms have been acquired through atakeover and in 4% of the cases, the entrepreneurs have bought themselves into the business theycurrently (co-)manage within five years after its start-up. For managers we are interested in sub-samples of CEOs (17%) and all managers except those who are responsible for projects rather thanpeople (82%).
< INSERT TABLE 2 HERE >
Panel C shows that 20% (38%) of the entrepreneurs are currently managing and leading youngfirms in their start-up (survival) phase. Some studies define entrepreneurs exclusively as theowner/managers of start-ups (e.g., Brockhaus, 1980; Busenitz and Barney, 1997), whereas otherstudies explicitly take them out (Holm et al., 2013). We shall use the same distinctions to test therobustness of our results against using various definitions of the entrepreneur. Panel C also showsthat almost half of the entrepreneur sample consists of incorporated business owners. This enablesus to limit the sample of entrepreneurs to incorporated business owners consistent with, for instance,Levine and Rubinstein (2012). The right handside of Panel C shows the age and size distributionsof the firms that managers and employees work for. As expected these distributions are similar, butdifferent from the ones of entrepreneurial firms. The latter are younger (see panel C) and smaller(see Panel D). As a robustness check we shall split the sample of managers according to the age andsize distribution of their firms. Managers in smaller and younger, i.e., more entrepreneurial firms,may be more similar to entrepreneurs.
Panel D of Table 2 shows the distribution of the number of employees supervised by entrepreneursand managers. 17% of the entrepreneurs have zero employees and 43% have at most one. We alsoconsider a stricter definition of entrepreneurship based on the number of employees they employ(cf. e.g. Tag et al., 2013) and do the same for managers.
Table 3 compares background characteristics of the three subsamples. Entrepreneurs and man-agers are similar in terms of the most commonly used background characteristics: their age, thepercentage of females as well as their experience and educational background. Employees are dif-ferent in terms of their background characteristics compared to the other two groups: they aresomewhat younger (mean age is 41), more likely to be female and they have lower educationaldegrees on average.
11

< INSERT TABLE 3 HERE >
3. Results
3.1 Main results
To get a first impression of our main findings, Table 4 and Figure 4 show the means and distributionsof the four measures of risk and uncertainty for each of the three groups of interest.
< INSERT TABLE 4 HERE >
The first column in Table 4 shows that entrepreneurs subjectively assess themselves as lessrisk averse than managers. Managers, in turn, rate themselves as less risk averse than employees,leading to a significant difference of the coefficients.17 Two sample t-tests confirm that the differencesbetween entrepreneurs and employees, entrepreneurs and managers, and managers and employeesare all highly significant ( p < 0.001 in all cases). Ranksum and Kolmogorov-Smirnov tests generatethe same results.
The second column shows that the experimental measure of risk aversion is not significantlylower for entrepreneurs when compared to managers, although both entrepreneurs and managers aresignificantly less risk averse than employees.18 The rest of the table reveals that the raw differencesin terms of loss aversion show a similar pattern: entrepreneurs are least loss averse, followed bymanagers and employees. Here the difference between entrepreneurs and managers is significant atthe 5% level, whereas the difference between managers and employees is not (p = 0.08).19 The lastcolumn of Table 4 reveals an unexpected pattern: entrepreneurs and managers, who are equallyambiguity averse, are more ambiguity averse than employees.
The CDF plots in Figure 4 provide further insight into the distributions of each of the measures.Starting with the subjective risk aversion plot on the top left, one can observe that the peak ofthe distribution of entrepreneurs is shifted to the left relative to the one of managers and employ-ees, thus suggesting that most entrepreneurs have a lower value of risk aversion than managersand employees. As witnessed in Table 4 as well, a slightly different pattern arises in the objectiverisk aversion measure (top right), where the distributions of entrepreneurs and managers are moresimilar. Turning to loss aversion (bottom left), we find that the distributions appear graphically
17The same results are obtained for the other domains measured, i.e., financial risk and career risk.18In terms of the certainty equivalences per group; we find that the average CE category is equal to €125 - €150
for entrepreneurs and managers and equal to €100 - €125 for employees. As expected, all average values are belowthe expected value of €150. The associated CRRA coefficients (but see Rabin, 2000, for a criticism of this approach)would be approximately 0 - 0.21 for entrepreneurs and managers and 0.21 - 0.37 for employees, the latter being inline with the lower bound of the study of Holt and Laury (2002) among students.
19In terms of loss aversion coefficients per group; we find that the average coefficient is equal to 1.11 for en-trepreneurs, 1.18 for managers and 1.23 for employees. For the sake of comparison, this is in the lower part of theinterquartile range of Gächter et al. (2010).
12

more like a mix of the subjective and objective risk aversion measures, with the distributions ofentrepreneurs and managers being more distinct again. Finally, the ambiguity aversion distributionsof all groups (bottom right) are harder to distinguish. Yet the figure confirms that employees appearslightly less ambiguity averse than the other two groups across the board. Moreover, the graphs alsoillustrate that the majority of participants (± 30%) always refrained from the ambiguous optionand rather preferred the risky one.
< INSERT FIGURE 4 HERE >
In Table 5 the output of ordered probit regressions for each of the four behavorial variables isdepicted. Control variables such as age, gender, education, experience and income are included.Columns ‘a’ show the results excluding some arguably endogenous variables, i.e., education, expe-rience and income, whereas columns ‘b’ include those as explanatory variables (analogous to e.g.Dohmen et al., 2010).
< INSERT TABLE 5 HERE >
Table 5 paints a similar picture as Table 4. The first estimation equation shows that en-trepreneurs view themselves as less risk averse than managers (see the Wald test in the last row ofthe table), whereas both entrepreneurs and managers are less risk averse than employees. Thesefindings are largely consistent with previous studies using survey-based measures of risk aversion.The second set of estimates supports the view arisen from Table 4 that entrepreneurs are makingsimilar decisions as managers when taking risky decisions in an experimental and incentived envi-ronment. Although they perceive themselves as more risk-taking than managers, they are thus notreally. Again we find that both entrepreneurs and managers are less risk averse than employees withsimilar background characteristics. The third set of results shows that one behavioral characteristicis unique for entrepreneurs: a lower level of loss aversion than both managers and employees. Thefourth and final set of results indicate that the differences between employees on the one hand andentrepreneurs and managers on the other hand in terms of ambiguity aversion disappear when in-cluding more controls in the equation. Apparently, entrepreneurs, managers and employees that arecomparable in terms of their age, gender, education, income and experience don’t show differencesin their attitudes towards ambiguity. This result was also obtained by Holm et al. (2013).
The control variables also have different associations with the survey-based measure of risk thanwith all three experimental measures. Older people claim to be less willing to take risks in general(consistent with Dohmen et al. 2011) but none of the three experimental measures is significantlyassociated with age. Females are less risk taking according to the survey-based measure (also con-sistent with Dohmen et al., 2011) but the choice based measures are no different for females than for
13
males. The latter result is largely consistent with the conclusions from a recent meta-analysis aboutgender differences in risk attitudes elicited by this type of games (Filippin and Crosetto, 2014).20
In an effort to reconcile the abovementioned findings, we have also directly compared the sub-jective and objective measures of risk and ambiguity. Table 6 shows that the subjective assessmentsof respondents’ risk attitudes are not only correlated with the experimental risk measure, but alsowith loss and ambiguity aversion.21 All three coefficients in the ordered probit regression on riskattitude are highly significant and have the expected positive sign. The measure of risk has thehighest association with the self-assessed risk attitude, but both loss and ambiguity aversion playa significant part too in the explanation of the self-assessed value. The result is the same bothwithout (column 1) and with (column 2) controls for entrepreneur and managers. In column 3 allthree coefficients are calculated separately for managers and entrepreneurs by including interactionswith these dummy indicators. The benchmark is the subsample of employees. The associationsbetween the subjective assessment of risk and the objective measures are similar for managers andemployees; the coefficients of the interacted variables with ‘manager’ all lack statistical significance.However, for entrepreneurs there are some notable differences. The association with risk aversionis lower than for the rest of the sample, although the relationship remains significantly differentfrom zero. The latter does not hold for ambiguity aversion, though; here a similar test shows thatfor entrepreneurs we cannot reject the null hypothesis that ambiguity aversion does not impactwillingness to take risks. All in all, the results in column 3 indicate that entrepreneurs base theirself-assessment of risk appetite on their loss aversion, more than on their risk or ambiguity aversion.For managers and employees this is not the case. A low level of loss aversion is thus a distinguishingfeature of entrepreneurs and they associate this with having a higher risk appetite than others.
< INSERT TABLE 6 HERE >
Overall we draw two conclusions from this analysis: (1) subjective assessments of risk attitudeproxy for more than just risk aversion and (2) there is a greater divergence between subjective assess-ments of risk attitude and behavioral observations for entrepreneurs than for others. Entrepreneursassociate loss aversion with risk aversion.
20Also for education we find the expected negative effect using the survey-based Dohmen measure of risk appetite,(cf. Harrison et al., 2007), but no significant effect when using any of the experimental measures. People with higherincomes view themselves as less risk-averse (by comparison; in Dohmen et al., 2010 the effect of household income isthe same but just insignificant). Interestingly, higher income people are less loss averse according to the experimentalmeasure but not less risk or ambiguity averse. These results are not included in the table.
21See also Ding et al. (2010) and Willebrands et al. (2012) for other work on subjective vis-à-vis objective riskmeasures.
14

3.2 Robustness Checks
In this section we will first test to what extent the results remain the same when using stricterdefinitions of entrepreneurs and managers.22 Table 7 displays the main result of Table 5, usingvarious alternative definitions. Thus, each coefficient is obtained in a separate regression (see Table5 for the specifics of these regressions).
< INSERT TABLE 7 HERE >
For entrepreneurs we use a set of stricter definitions in congruence with the literature mentionedearlier in Section 3. We use the subsets of: (i) entrepreneurs with an incorporated firm, therebymainly excluding the own-account self-employed, (ii) entrepreneurs with an above median numberof fulltime equivalent employees in their company, (iii) entrepreneurs with above median incomes,(iv) entrepreneurs that have founded their business, instead of obtaining it through takeover orbuy-in, (v) entrepreneurs in the survival phase (firm age 5 years) and (vi) entrepreneurs pasttheir survival phase (firm age > 5 years).23 Panel A of Table 7 shows the results of confronting thedata with these alternative definitions of the entrepreneur. For managers and employees we employthe original samples. The last line in Panel A shows the result of Table 5 again.
The panel shows a clear pattern consistent with the findings in Table 5. Whatever definitionof the entrepreneur is used, they assess themselves as more risk taking than both managers andentrepreneurs. Using objective measures of risk and uncertainty, the data show again that en-trepreneurs and managers are equally risk averse, but less so than employees. The only notableand significant difference with the benchmark appears when limiting the sample to incorporatedentrepreneurs. They are significantly less risk averse than both managers and employees.24 Lossaversion is the one behavorial feature that distinguishes entrepreneurs from managers. The results inTable 5 turn out to be robust against using various stricter definitions of (successful) entrepreneur-ship.
Panel B of Table 7 shows the results when varying the definition of a manager while keepingthe baseline samples of entrepreneurs and employees. Again we find that the main results remain,irrespective of the definition used. We restrict the sample to: (vii) CEOs or general managers (asopposed to project managers), (viii) CEOs exclusively, (ix) managers with more than the mediumnumber of direct reports, (x) managers with bove median managerial income, and (xi) managers in
22Table 2 shows that the samples of entrepreneurs, managers and, to a lesser extent, employees are suitable for thecreation of subsamples based on stricter, alternative, also commonly used defitions of entrepreneurs, managers andemployees.
23We also analyzed subsamples of entrepreneurs based on their share ownership (for instance a minimum of 30%or 50%), leaving the main result unchanged.
24To support this finding we ran similar regressions using only the sample of entrepreneurs. The regression outputsconfirm that incorporated as well as above median income earning entrepreneurs are significantly less risk averse thanother entrepreneurs at the 10% level.
15

firms that are older than 15 years. The stricter definitions used do not only restrict the sample tomore successful managers but also, in some cases, to managers that can reasonably be expected tobe more different from entrepreneurs than average, such as the ones employed in older firms. Again,the last line of the panel shows the result for managers copied from Table 5, i.e., the benchmark.
Panel C finally tests some of the alternative definitions against each other. Whether we compareentrepreneurs of incorporated firms (i) with CEOs (viiii), or whether we compare entrepreneurs (ii)and managers (ix) with larger spans of control, or higher than median incomes ((iii) versus (x)), theresults remain very similar to the main findings according to the Wald statistics in each of thesecases.25
Another robustness check is based on the idea that many people are belonging to one of thegroups at the time of measurement, but may have been part of another group in the past. In otherwords, the distinction between the three groups in terms of typology is not black-white. Possibly,the differences between the ‘pure’ groups are larger when taking into account that some individualsbelong to ‘gray’ areas. Appendix B reports the results from analyses that take this into account.Appendix Table B1 shows that 71% of the entrepreneurs in the sample have been managers in thepast and 9% is currently wage employee or manager besides being a business owner. Moreover 17(10)% of the managers (employees) is also an entrepreneur on the side, whereas 12 (9)% of themanagers (employees) have been so in the past. Apparently, people move out of and especially intoentrepreneurship in the course of their professional lives. Appendix Table B2 shows that the effectsfound in Table 5 (and 7) do not change when accounting for past and current positions in the othergroups. The coefficients of the controls that distinguish the gray groups from the ‘pure’ groups havethe expected signs (diminishing the main effect), but they are not significant.
4. Conclusion
Common wisdom and economic theory alike portray entrepreneurs as a truly distinct breed. Mostnotably, the stereotype is that entrepreneurs, as business owning residual claimants, are more willingand better able to cope with risk and uncertainty. Existing empirical studies that ask entrepreneursand non-entrepreneurs to subjectively self-assess their attitude towards risk and uncertainty, indeedby and large confirm this conventional wisdom; entrepreneurs take themselves as being more willingto take risks than non-entrepreneurs are. Other studies that employ incentivized choice-basedmeasures of risk aversion, however, find little differences between entrepreneurs and the comparisongroup employed. These opposing findings immediately raise the question of whether entrepreneurs’more positive attitude towards risk is merely a common (mis)perception, or whether they have trulydistinct preferences.
25We also employed a stricter definition of employees by limiting that subsample to above median income earners(effectively cutting off the lowest category of the 26% of wage employees earning incomes lower then 25,000 euro’s,see Table 2). Again the results were the same.
16
In this paper we report the results from a lab-in-the-field experiment that sheds light on thismatter. Our experiment has a number of distinguishing features. First of all, it is relatively large insize with 2288 respondents overall, including 910 entrepreneurs. Second, we compare entrepreneurswith two well-defined control groups, viz. managers and employees. Entrepreneurs and managers arevery similar in terms of background characteristics and arguably also in terms of the professional de-cisions and tasks they face, including managing the employees they direct. Yet as residual claimantsonly entrepreneurs directly feel the financial consequences of the decisions they take. Especially thisdifference is thought to draw people with distinct risk preferences into entrepreneurship. Differencesbetween entrepreneurs and employees (both in terms of background characteristics and professionalactivities) are more pronounced. Third, we collect a large variety of background characteristicsand measures of individual ‘success’. This allows us to zoom in on particular subsamples, usingmore stringent definitions of both entrepreneurs and managers based on being ‘more succussful’.Last, we include both a subjective, survey-based measure of risk attitude, as well as incentivized,choice-based measures of risk related preferences. This allows us to compare subjective perceptionsof risk attitude with objectives measures based on actual choices with true financial consequences.Besides a standard measure of risk aversion, we also include measures of loss aversion and ambiguityaversion.
In line with previous studies and conventional wisdom, the entrepreneurs in our sample on av-erage perceive themselves as being more risk tolerant than the other respondents. This not onlyholds with respect to the employees in our sample, but also in regard to the more comparablecontrol group of managers. Based on the incentived choice-based measure of risk aversion, how-ever, entrepreneurs are equally risk averse as managers (with employees being significantly morerisk averse). The different perceptions of entrepreneurs and managers thus cannot be explained bydifferences in risk aversion as narrowly defined by economists. Rather, our results show that thesedifferent perceptions mainly result from significant differences in attitudes towards losses; managersare significantly more loss averse than entrepreneurs are (with employees in turn being more lossaverse than managers, although not significantly). The three groups do not differ in terms of am-biguity aversion. These findings are largely independent of the definition of who is an entrepreneurand who is a manager. If anything, limiting the sample to more successful entrepreneurs somewhatstrengthens our results.
When self-assessing their ‘willingness to take risks in general’ on a 0 to 10 scale, respondents ap-pear to have a broader notion of ‘risk’ in mind than the narrow risk aversion measure of economists.Besides risk aversion, also ambiguity and loss aversion play an important role in shaping individualperceptions. For the perceived difference between entrepreneurs and managers, loss aversion turnsout to be key. Managers are on average more inclined to avoid losses than entrepreneurs are, leadingto a lower self-assessed willingness to take risks.
Overall we conclude that, when it comes to attitudes towards risk and uncertainty, entrepreneursare different but in a rather subtle way. The Merriam-Webster dictionary website defines an en-trepreneur as "...a person who starts a business and is willing to risk loss in order to make money".
17

In terms of their willingness to risk losses, entrepreneurs indeed appear to be distinct.
References
Azrieli, Y., C.P. Chambers, P.J. Healy. 2012. Incentives in experiments: a theoretical analysis. OhioState University Working Paper .
Beauchamp, J., D. Cesarini, M. Johannesson. 2012. The psychometric properties of measures ofeconomic risk preferences. mimeo .
Begley, T. M. 1995. Using founder status, age of firm, and company growth rate as the basis fordistinguishing entrepreneurs from managers of small businesses. Journal of Business Venturing10 pp. 249–263.
Berger, A. N., G. F. Udell. 1998. The economics of small business finance: The roles of privateequity and debt markets in the financial growth cycle. Journal of Banking and Finance 22 pp.613–673.
Block, J., P. Koellinger. 2009. I can’t get no satisfaction - necessity entrepreneurship and proceduralutility. Kyklos 62(2) pp. 191–209.
Bonin, H., T. Dohmen, A. Falk, D. Huffman, U. Sunde. 2007. Cross-sectional earnings risk andoccupational sorting: The role of risk attitudes. Labour Economics 14(6) pp. 926–937.
Borghans, L., A. Duckworth, J. Heckman, B. Ter Weel. 2008. The economics and psychology ofpersonality traits. Journal of Human Resources 43(4) pp. 972–1059.
Brachert, M., W. Hyll. 2014. On the stability of preferences: Repercussions of entrepreneurship onrisk attitudes. SOEPpaper No. 667 .
Brockhaus, R.H. 1980. Risk taking propensity of entrepreneurs. The Academy of ManagementJournal 23 pp. 509–520.
Burmeister-Lamp, K., M. Levesque, C. Schade. 2012. Are entrepreneurs influenced by risk attitude,regulatory focus or both? an experiment on entrepreneurs’ time allocation. Journal of BusinessVenturing 27(4) pp. 456–476.
Busenitz, L.W., J.B. Barney. 1997. Differences between entrepreneurs and managers in large orga-nizations: biases and heuristics in strategic decision-making. Journal of Business Venturing 12
pp. 9–30.Caird, S. 1991. The enterprise tendency of occupational groups. International Small Business
Journal 9(4) pp. 75–91.Caliendo, M., F. Fossen, A. Kritikos. 2009. Risk attitudes of nascent entrepreneurs: New evidence
from an experimentally-validated survey. Small Business Economics 32(2) pp. 153–167.Caliendo, M., F. Fossen, A. Kritikos. 2010. The impact of risk attitudes on entrepreneurial survival.
Journal of Economic Behavior & Organization 76(1) pp. 45–63.Cantillon, R. 1755. Essai Sur la Nature Général . London Macmillan.Cramer, J. S., J. Hartog, N. Jonker, C. M. Van Praag. 2002. Low risk aversion encourages the choice
for entrepreneurship: an empirical test of a truism. Journal of Economic Behavior & Organization48(1) pp. 29–36.
DeMartino, R., R. Barbato. 2003. Differences between women and men mba entrepreneurs: explor-ing family flexibility and wealth creation as career motivators. Journal of Business Venturing18(6) pp. 815–832.
Ding, X., J. Hartog, Y. Sun. 2010. Can we measure individual risk attitudes in a survey? IZAdiscussion paper No. 4807 .
Djankov, S., Y. Qian, G. Roland, E. Zhuravskaya. 2006. Who are china’s entrepreneurs? American
18

Economic Review Papers and Proceedings 96(2) pp. 348–352.Djankov, S., Y. Qian, G. Roland, E. Zhuravskaya. 2007. What makes a successful entrepreneur?
evidence from brazil. Working Paper 0104, Center for Economic and Financial Research .Dohmen, T., A. Falk, D. Huffman, U. Sunde. 2010. Are risk aversion and impatience related to
cognitive ability? American Economic Review 100(3) pp. 1238–1260.Dohmen, T., A. Falk, D. Huffman, U. Sunde, J. Schupp, G. G. Wagner. 2007. The measurement
and stability of risk attitudes. mimeo .Dohmen, T., A. Falk, D. Huffman, U. Sunde, J. Schupp, G. G. Wagner. 2011. Individual risk
attitudes: Measurement, determinants and behavioral consequences. Journal of the EuropeanEconomic Association 9(3) pp. 522–550.
Ellsberg, D. 1961. Risk, ambiguity, and the savage axioms. The Quarterly Journal of Economics75 pp. 643–669.
Elston, J.A., Rutström E.E. Harrison, G.W. 2006. Experimental economics, entrepreneurs and theentry decision. Working Paper No. 6, University of Central Florida .
Evans, D.S., B. Jovanovic. 1989. An estimated model of entrepreneurial choice under liquidityconstraints. Journal of Political Economy 97 pp. 808–827.
Fairlie, R.W., H.A. Krashinsky. 2012. Liquidity constraints, household wealth, and entrepreneurshiprevisited. Review of Income and Wealth, International Association for Research in Income andWealth, 58(2) pp. 279–306.
Fehr, E., L. Goette. 2007. Do workers work more if wages are high? evidence from a randomizedfield experiment. The American Economic Review 97(1) pp. 298–317.
Filippin, A., P. Crosetto. 2014. A reconsideration of gender differences in risk attitudes. IZAdiscussion paper No. 8184 .
Fouarge, D., B. Kriechel, T. Dohmen. 2014. Occupational sorting of school graduates: The role ofeconomic preferences. IZA working paper No. 8355 .
Fox, C.R., A. Tversky. 1995. Ambiguity aversion and comparative ignorance. The Quarterly Journalof Economics 110(3) pp. 585–603.
Gächter, S., E.J. Johnson, A. Herrmann. 2010. Individual-level loss aversion in riskless and riskychoices. CeDEx discussion paper series, No. 2010-20 .
Gentry, W.M., R.G. Hubbard. 2004. Entrepreneurship and household saving. Advances in EconomicAnalysis and Policy 4(1) article 8.
Gneezy, U., A. Pietrasz. 2014. When half of the men are more competitive than all women. ASSAdiscussion paper, Philadelphia .
Graham, J.R., C.R. Harvey, M. Puri. 2013. Managerial attitudes and corporate actions. Journal ofFinancial Economics 109 pp. 103–121.
Hamilton, B.H. 2000. Does entrepreneurship pay? an empirical analysis of the returns to self-employment. Journal of Political Economy 108(3) pp. 604–631.
Harrison, G.W., M.I. Lau, E. Rutström. 2007. Estimating risk attitudes in denmark: A fieldexperiment. The Scandinavian Journal of Economics 109(2) pp. 341–368.
Heaton, J. C., D. J. Lucas. 2004. Capital structure: Hurdle rates and portfolio choice interactionsin an entrepreneurial firm. Working Paper, Northwestern University .
Heaton, J.C., D.J. Lucas. 2000. Portfolio choice in the presence of background risk. EconomicJournal 110(460) pp. 1–26.
Henrekson, M., T. Sanandaji. 2014. Small business activity does not measure entrepreneurship.Proceedings of the National Academy of Sciences pp. 1760–1765.
Holm, H.J., S. Opper, V. Nee. 2013. Entrepreneurs under uncertainty: An economic experiment inchina. Management Science 59(7) pp. 1671–1687.
Holt, C.A., S.K. Laury. 2002. Risk aversion and incentive effects. The American Economic Review
19
92(5) pp. 1644–1655.Holtz-Eakin, D., D Joulfaian, H.S. Rosen. 1994a. Entrepreneurial decisions and liquidity constraints.
RAND Journal of Economics 25 334–347.Holtz-Eakin, D., D Joulfaian, H.S. Rosen. 1994b. Sticking it out: entrepreneurial survival and
liquidity constraints. Journal of Political Economy 102 53–75.Hull, D., J. Bosley, G. Udell. 1980. Renewing the hunt for heffalump: Identifying potential en-
trepreneurs by personality characteristics. Journal of Small Business Management 18(1) pp.11–18.
Hvide, H.K., J. Møen. 2010. Lean and hungry or fat and content? entrepreneurs’ wealth andstart-up performance. Management Science 56(8) pp. 1242–1258.
Kahneman, D., J.L. Knetsch, R.H. Thaler. 1990. Experimental tests of the endowment effect andthe coase theorem. Journal of Political Economy 98(6) pp. 1325–1348.
Kahneman, D., D. Lovallo. 1993. Timid choices and bold forecasts: A cognitive perspective on risktaking. Management Science 39(1) pp. 17–31.
Kahneman, D., A. Tversky. 1979. Prospect theory: An analysis of decision under risk. Econometrica47 pp. 263–291.
Kahneman, D., A. Tversky. 1984. Choices, values, and frames. American Psychologist 39(4) pp.341–350.
Kihlstrom, R.E., J.-J. Laffont. 1979. A general equilibrium entrepreneurial theory of firm formationbased on risk aversion. Journal of Political Economy 87(4) pp. 719–748.
Kirzner, I. 1973. Competition and Entrepreneurship. University of Chicago Press.Knight, F.H. 1921. Risk, uncertainty, and profit . Houghton Mifflin Company (Boston).Koh, H. C. 1996. Testing hypotheses of entrepreneurial characteristics: a study of hong kong mba
students. Journal of Managerial Psychology 11 pp. 12–25.Laury, S. L. 2006. Pay one or pay all: Random selection of one choice for payment. Andrew Young
School of Policy Studies Research Paper Series No. 06-13 .Levine, R., Y. Rubinstein. 2012. Does entrepreneurship pay? the michael bloombergs, the hot dog
vendors, and the returns to self-employment. mimeo .Lindquist, M., J. Sol, C.M. van Praag. 2013. Why do entrepreneurial parents have entrepreneurial
children? Journal of Labor Economics (forthcoming) .Lonnqvist, J.E., M. Verkasalo, G. Walkowitz, P.C. Wichardt. 2011. Measuring individual risk
attitudes in the lab: task or ask? an empirical comparison. mimeo .Macko, A., T. Tyszka. 2009. Entrepreneurship and risk taking. Applied Psychology 58(3) pp.
469–487.Marshall, A. 1930. Principles of Economics. London Macmillan.Miner, J.B., N.S. Raju. 2004. Risk propensity differences between managers and entrepreneurs and
between low- and high-growth entrepreneurs: A reply in a more conservative vein. Journal ofApplied Psychology 89(1) pp. 3–13.
Moskowitz, T.J., A. Vissing-Jorgensen. 2002. The returns to entrepreneurial investment: A privateequity premium puzzle? American Economic Review 92(4) pp. 745–778.
Parker, S.C. 2009. The Economics of Entrepreneurship. University Press, Cambridge.Petersen, M. A., R. G. Rajan. 1994. The benefits of lending relationships: Evidence from small
business data. Journal of Finance 49 pp. 3–37.Rabin, M. 2000. Risk aversion and expected-utility theory: A calibration theorem. Econometrica
68 pp. 1281–1292.Sahm, C. 2012. How much does risk tolerance change? Quarterly Journal of Finance 2(4).Sandri, S., C. Schade, O. Musshoff, M. Odening. 2010. Holding on for too long? an experimen-
tal study on inertia in entrepreneurs’ and non-entrepreneurs’ disinvestment choices. Journal of
20

Economic Behavior & Organization 76(1) pp. 30–44.Sarasvathy, D.K., H. Simon, L. Lave. 1998. Perceiving and managing business risks: Differences
between entrepreneurs and bankers. Journal of Economic Behavior & Organization 33(2) pp.207–222.
Say, J.-B. 1803. A Treatise on Political Economy or the Production, Distribution and Consumptionof Wealth. A.M. Kelley Publishers, New York.
Schere, J.L. 1982. Tolerance of ambiguity as discriminating variable between entrepreneurs andmanagers. Academy of Management Best Paper Proceedings 42 pp. 404–408.
Schmalz, M.C., D.A. Sraer, D. Thesmar. 2013. Household collateral and entrepreneurship. NBERWorking Paper No. w19680 .
Stewart Jr., W. H., P. L. Roth. 2001. Risk propensity differences between entrepreneurs and man-agers: a meta-analytic review. Journal of Applied Psychology 86(1) pp. 145–153.
Stewart Jr., W. H., W.E. Watson, J.C. Carland, J.W. Carland. 1999. A proclivity for entrepreneur-ship: A comparison of entrepreneurs, small business owners, and cooperate managers. Journal ofBusiness Venturing 14(2) pp. 189–214.
Swalm, R.O. 1966. Utility theory (insights into risk taking). Harvard Business Review 44(6) pp.123 – 136.
Tag, J., T. Astebro, P. Thompson. 2013. Hierarchies, the small firm effect, and entrepreneurship:Evidence from swedish microdata. IFN Working Paper No. 954 .
Tversky, A., D. Kahneman. 1992. Advances in prospect theory: Cumulative representation ofuncertainty. Journal of Risk and Uncertainty 5(4) pp. 297–323.
Uusitalo, R. 2001. Homo entreprenaurus? Applied Economics 33(13) pp. 1631–1638.Van Praag, C. M., J. S. Cramer. 2001. The roots of entrepreneurship and labour demand: individual
ability and low risk aversion. Economica 68 pp. 45–62.Van Praag, C.M. 1999. Some classic views on entrepreneurship. The Economist 147(3) pp. 311–335.Wakker, P. P. 2005. Formalizing reference dependence and initial wealth in rabin’s calibration
theorem. Working Paper, Erasmus University Rotterdam .Wakker, P. P. 2010. Prospect theory: For risk and ambiguity . Cambridge University Press, Cam-
bridge.Willebrands, D., J. Lammers, J. Hartog. 2012. A successful businessman is not a gambler; risk
attitude and business performance among small enterprises in nigeria. Journal of EconomicPsychology 22(2) pp. 342–354.
21

Tables
Table 1: Descriptive Statistics of the Measures of Risk, Loss, and Ambiguity Aversion
Panel A: Means Observations Mean St. dev. Minimum Maximum
Risk Aversion- Survey measure1 2288 3.67 1.79 0 10- Experimental measure 2288 5.38 2.76 0 10
Loss Aversion 2288 5.05 2.65 0 10
Ambiguity Aversion 2288 5.74 3.64 0 10
Panel B: Correlations Risk Aversion Risk Aversion Loss Aversion Ambiguity AversionSurvey (S) orExperimental (E) (S) (E) (E) (E)
Risk Aversion- Survey measure1 -- Experimental measure 0.17 -
Loss Aversion 0.12 0.05 -
Ambiguity Aversion 0.05 -0.05 -0.01 -
1 Reverse coded measure of “Willingness to take risks”
This table shows the descriptive statistics of the two measures of risk aversion, loss aversion and ambiguity aversion.The survey measure of risk aversion is a reverse coded measure of the original self-reported willingness to take risks.In the reverse coded survey measure, 0 corresponds to the highest level of wilingness to take risks and 10 the lowest.The experimental measure of risk aversion is equal to the number of safe decisions made in the 10 decisions, andranges from 0 to 10. Hence, more risk averse participants have a higher score. Similarly, loss aversion measures thenumber of safe decisions made in the loss aversion multiple price list (range: 0-10). Ambiguity aversion (range:0-10) is equal to a participant’s number of non-ambiguous decisions in the multiple price list for ambiguity. Thehigher the value, the more ambiguity averse is the person.
22
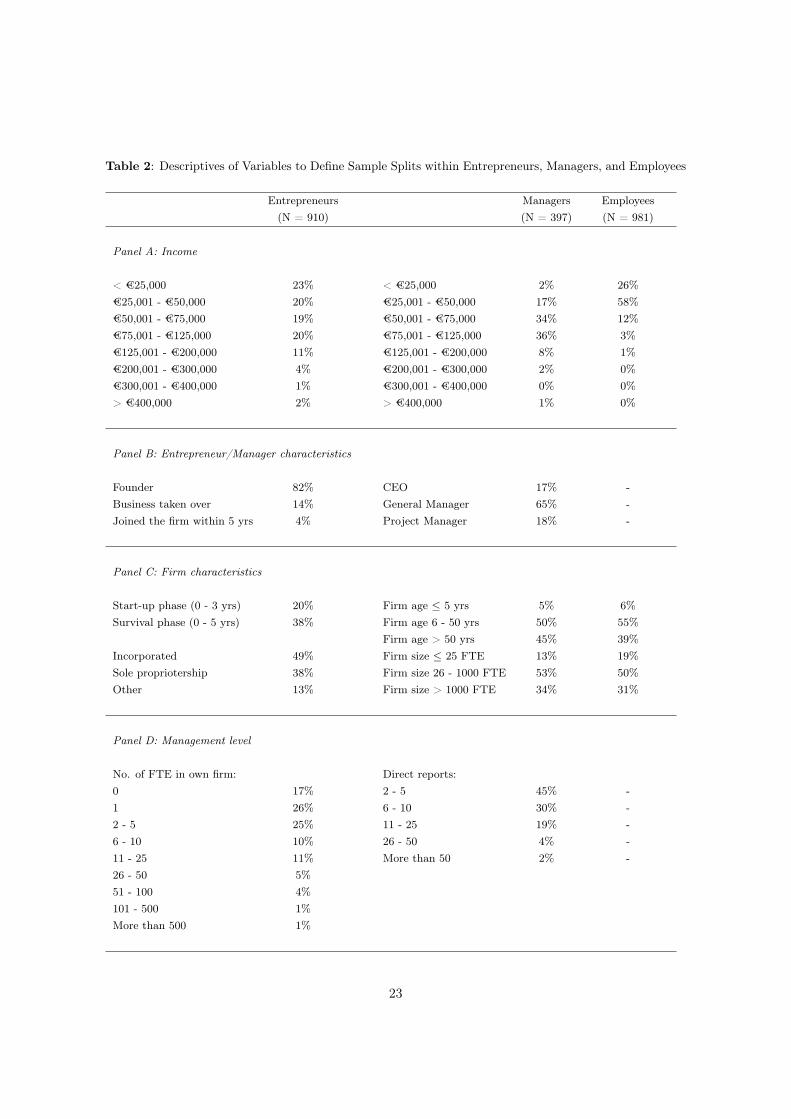
Table 2: Descriptives of Variables to Define Sample Splits within Entrepreneurs, Managers, and Employees
Entrepreneurs Managers Employees(N = 910) (N = 397) (N = 981)
Panel A: Income
< €25,000 23% < €25,000 2% 26%€25,001 - €50,000 20% €25,001 - €50,000 17% 58%€50,001 - €75,000 19% €50,001 - €75,000 34% 12%€75,001 - €125,000 20% €75,001 - €125,000 36% 3%€125,001 - €200,000 11% €125,001 - €200,000 8% 1%€200,001 - €300,000 4% €200,001 - €300,000 2% 0%€300,001 - €400,000 1% €300,001 - €400,000 0% 0%> €400,000 2% > €400,000 1% 0%
Panel B: Entrepreneur/Manager characteristics
Founder 82% CEO 17% -Business taken over 14% General Manager 65% -Joined the firm within 5 yrs 4% Project Manager 18% -
Panel C: Firm characteristics
Start-up phase (0 - 3 yrs) 20% Firm age 5 yrs 5% 6%Survival phase (0 - 5 yrs) 38% Firm age 6 - 50 yrs 50% 55%
Firm age > 50 yrs 45% 39%Incorporated 49% Firm size 25 FTE 13% 19%Sole propriotership 38% Firm size 26 - 1000 FTE 53% 50%Other 13% Firm size > 1000 FTE 34% 31%
Panel D: Management level
No. of FTE in own firm: Direct reports:0 17% 2 - 5 45% -1 26% 6 - 10 30% -2 - 5 25% 11 - 25 19% -6 - 10 10% 26 - 50 4% -11 - 25 11% More than 50 2% -26 - 50 5%51 - 100 4%101 - 500 1%More than 500 1%
23

Table 3: Background Characteristics of Entrepreneurs, Managers, and Employees
Entrepreneurs Managers Employees
Age 47.36 a 46.45 c 41.24 a,c
Female (dummy) 0.25 a 0.28 c 0.53 a,c
Education (highest degree): d f d,f
- High School 4% 2% 3%- Lower intermediate vocational degree 12% 11% 34%- College education 46% 42% 42%- University education 38% 45% 21%
Number of observations 910 397 981
a) Significant difference between entrepreneurs and employees at the 5% level (two-sample t-test)b) Significant difference between entrepreneurs and managers at the 5% level (two-sample t-test)c) Significant difference between managers and employees at the 5% level (two-sample t-test)d) Significant difference between entrepreneurs and employees at the 5% level (Kolmogorov-Smirnov test)e) Significant difference between entrepreneurs and managers at the 5% level (Kolmogorov-Smirnov test)f) Significant difference between managers and employees at the 5% level (Kolmogorov-Smirnov test)
24

Table 4: Raw Differences in Risk, Loss, and Ambiguity Aversion of Entrepreneurs, Managers andEmployees
Risk Risk Loss AmbiguityAversion Aversion Aversion Aversion
Survey (S) or
Experimental (E) (S) (E) (E) (E)
Entrepreneurs 3.10 a,b 5.03 a 4.77 a,b 5.88 a
Managers 3.69 b,c 5.17 c 5.08 b 5.90 c
Employees 4.20 a,c 5.78 a,c 5.29 a 5.54 a,c
a) Significant difference between entrepreneurs and employees at the 5% level (two-sample t-test)b) Significant difference between entrepreneurs and managers at the 5% level (two-sample t-test)c) Significant difference between managers and employees at the 5% level (two-sample t-test)
See the note below Table 1 for the definitions of the variables.
25

Table 5: Risk -, Loss - , and Ambiguity Aversion of Entrepreneurs, Managers and Employees
(1a) (1b) (2a) (2b) (3a) (3b) (4a) (4b)Dep. variable: Risk Risk Risk Risk Loss Loss Ambiguity Ambiguity
Aversion Aversion Aversion Aversion Aversion Aversion Aversion AversionSurvey (S) or
Experimental (E) (S) (S) (E) (E) (E) (E) (E) (E)
Entrepreneur -0.655⇤⇤⇤ -0.650⇤⇤⇤ -0.261⇤⇤⇤ -0.282⇤⇤⇤ -0.200⇤⇤⇤ -0.207⇤⇤⇤ 0.104⇤⇤ 0.0198[-12.43] [-9.23] [-5.05] [-4.03] [-3.89] [-3.06] [1.99] [0.29]
Manager -0.256⇤⇤⇤ -0.203⇤⇤⇤ -0.203⇤⇤⇤ -0.254⇤⇤⇤ -0.0929 -0.0176 0.120⇤ 0.0484[4.23] [-2.63] [-3.32] [-3.29] [-1.52] [-0.23] [1.88] [0.59]
Age 0.0299⇤⇤ 0.0368⇤⇤ -0.0206 -0.0269⇤ -0.0128 -0.00815 0.00616 0.0102[2.20] [2.28] [-1.51] [-1.68] [-0.98] [-0.54] [0.47] [0.69]
Age squared -0.000237 0.000275 0.000246 0.000320⇤ 0.000154 0.000117 -0.000112 -0.000153[-1.57] [1.59] [1.60] [1.81] [1.03] [0.69] [-0.76] [-0.95]
Female 0.234⇤⇤⇤ 0.134⇤⇤ 0.0311 -0.00121 0.0612 0.0365 -0.00155 -0.0113[4.98] [2.49] [0.66] [-0.02] [1.31] [0.66] [-0.03] [-0.21]
Controls for NO YES NO YES NO YES NO YESeducation,experience,and income
N 2288 1805 2288 1805 2288 1805 2288 1805Log lik. -4235.2 -3307.9 -5055.4 -3956.6 -4920.8 -3848.6 -4919.7 -3826.6
ENT=MAN1 < 0.001*** < 0.001*** 0.31 0.60 0.06* < 0.01*** 0.80 0.36
1) This row reports the p-values of Wald tests on �(ENTREPRENEUR) = �(MANAGER).
Most variables have been defined earlier. The categorical variables ‘education’ and ‘income’ have been summarizedinto one variable instead of using a set of dummies. the education variable takes on the value 0 if the highestattained level is high school or lower, 1 if secondary education is obtained at a higher level, 2 if a participant hascollege education and 3 if the participant has a university degree. Income has been collapsed into one continuousvariable of which the natural log has been taken, using the midpoints of the categories (and 1 million euro for theupper category). Experience measures the years of experience as entrepreneur, manager, and employee, respectively.Significance at the 10% level is denoted by *, 5% by **, and 1% by ***, with t-statistics reported in parentheses.Standard errors are robust.
26
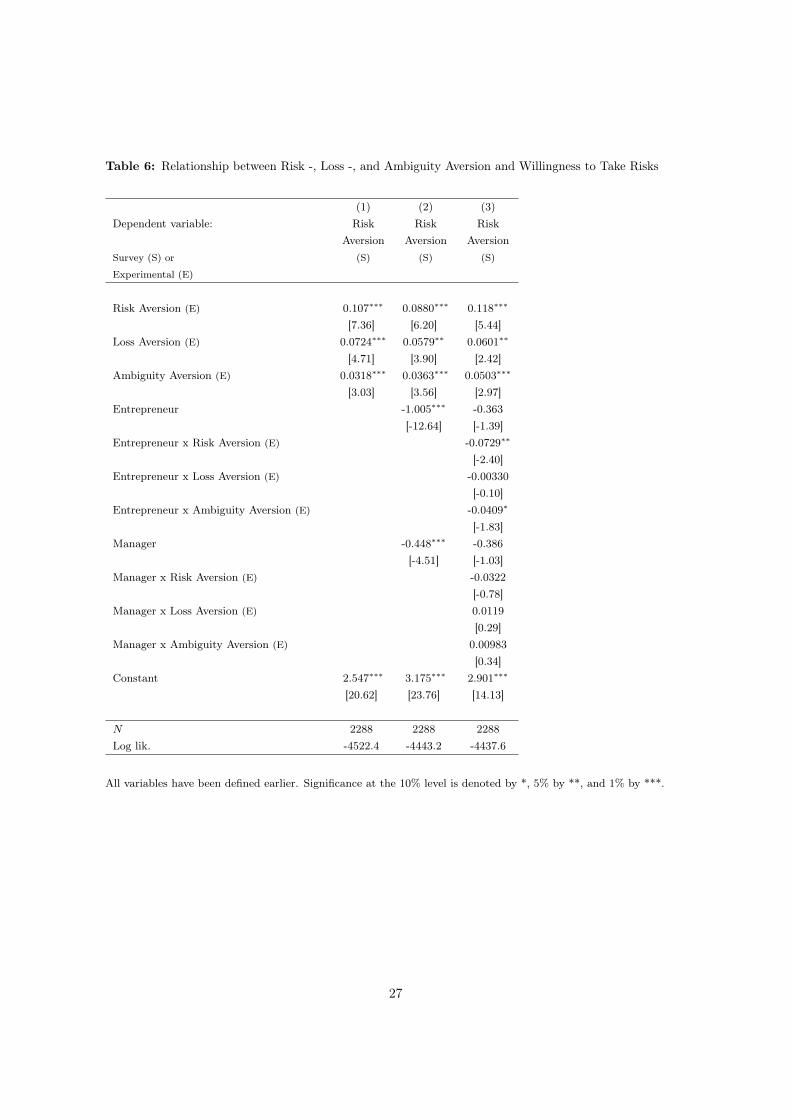
Table 6: Relationship between Risk -, Loss -, and Ambiguity Aversion and Willingness to Take Risks
(1) (2) (3)Dependent variable: Risk Risk Risk
Aversion Aversion AversionSurvey (S) or (S) (S) (S)
Experimental (E)
Risk Aversion (E) 0.107⇤⇤⇤ 0.0880⇤⇤⇤ 0.118⇤⇤⇤
[7.36] [6.20] [5.44]Loss Aversion (E) 0.0724⇤⇤⇤ 0.0579⇤⇤ 0.0601⇤⇤
[4.71] [3.90] [2.42]Ambiguity Aversion (E) 0.0318⇤⇤⇤ 0.0363⇤⇤⇤ 0.0503⇤⇤⇤
[3.03] [3.56] [2.97]Entrepreneur -1.005⇤⇤⇤ -0.363
[-12.64] [-1.39]Entrepreneur x Risk Aversion (E) -0.0729⇤⇤
[-2.40]Entrepreneur x Loss Aversion (E) -0.00330
[-0.10]Entrepreneur x Ambiguity Aversion (E) -0.0409⇤
[-1.83]Manager -0.448⇤⇤⇤ -0.386
[-4.51] [-1.03]Manager x Risk Aversion (E) -0.0322
[-0.78]Manager x Loss Aversion (E) 0.0119
[0.29]Manager x Ambiguity Aversion (E) 0.00983
[0.34]Constant 2.547⇤⇤⇤ 3.175⇤⇤⇤ 2.901⇤⇤⇤
[20.62] [23.76] [14.13]
N 2288 2288 2288Log lik. -4522.4 -4443.2 -4437.6
All variables have been defined earlier. Significance at the 10% level is denoted by *, 5% by **, and 1% by ***.
27

Table 7: Differences in Risk Attitude using Stricter Definitions of Entrepreneurs and Managers
(1) (2) (3) (4)Dependent variable: Risk Risk Loss Ambiguity
Aversion Aversion Aversion AversionSurvey (S) or (S) (E) (E) (E)
Experimental (E)
Panel A: Subsets of Entrepreneurs,
all Managers & Employees
i) Incorporated (N = 446) -0.702 a,b -0.442 a,b -0.400 a,b 0.0772[-7.84] [-3.78] [-3.43] [0.65]
ii) Above median no. of employees (N = 401) -0.730 a,b -0.282 a -0.270 a,b 0.0831[-7.41] [-2.59] [-2.46] [0.75]
iii) Above median ent. income (N = 377) -0.613 a,b -0.404 a,b -0.109 -0.119[-5.63] [-3.86] [-1.60] [-0.91]
iv) Founder (N = 757) -0.598 a,b -0.218 a -0.280 a,b 0.0107[-7.71] [-2.81] [-3.68] [0.75]
v) In survival phase (firm age 5 years, N= 347) -0.640 a,b -0.257 a -0.258 a,b -0.0421[-6.01] [-2.54] [-2.65] [-0.39]
vi) Not in survival phase (firm age > 5 years, N= 563) -0.611 a,b -0.239 a -0.249 a,b -0.00130[-7.44] [-2.88] [-2.98] [-0.02]
�(entrepreneur) in table 5: -0.614 a,b -0.254 a -0.251 a,b 0.00279
Panel B: Subsets of Managers,
all Entrepreneurs & Employees
vii) CEO or general manager (N = 324) -0.218 b,c -0.274 c -0.0442 b -0.00621[-2.53] [-3.27] [0.52] [-0.08]
viii) CEO (N = 66) -0.319 b,c -0.367 c -0.0203 b -0.0866[-2.40] [-2.57] [-0.40] [-0.55]
ix) Above median no. of dir. reports (N = 219) -0.197 b,c -0.259 c -0.0484 0.0830[-2.31] [-3.04] [-0.49] [0.79]
x) Above median man. income (N = 155) -0.202 b,c -0.370 c -0.00958 b 0.00935[-1.97] [-3.22] [-0.06] [0.07]
xi) Manager in a firm that is > 15 years old (N = 316) -0.195 b,c -0.247 c -0.0330 b 0.125[-2.22] [-2.86] [-0.38] [1.35]
�(manager) in table 5: -0.194 b,c -0.219 c -0.0101 b 0.0715
Panel C: Combinations of A&B
i) vs. viii); p-values Wald tests < 0.001 0.57 0.01 0.67ii) vs. ix); p-values Wald tests < 0.001 0.59 0.17 0.73iii) vs. x); p-values Wald tests < 0.001 0.25 0.04 0.46
Control variables YES YES YES YESa) Significant difference between (subset of) entrepreneurs and employees at the 5% level (Wald test)
b) Significant difference between (subset of) entrepreneurs and (subset of) managers at the 5% level (Wald test)
c) Significant difference between (subset of) managers and employees at the 5% level (Wald test)
28

APPENDICES
Appendix A: Example Survey Cover Letter (translated)
Dear relation of ACE,
Since its establishment in 2006, the Amsterdam Center for Entrepreneurship (ACE) has been con-ducting high-quality research in the field of entrepreneurship. We aim to continue this ambitioninto the future.
That’s why we have initiated a new large-scale study in collaboration with Synpact and VNO-NCW De Baak, which explores differences in decision-making between entrepreneurs, managersand employees.We would greatly appreciate it if you would be willing to participate in our new unique study,which includes making choices that have real financial consequences. While your participation willpredominantly be an important contribution to science, the results of this research will also be usedto develop training material for entrepreneurs, managers and employees.
Our questionnaire is online and will take no longer than 20 minutes of your time. Depending onyour decisions and luck, you can win an amount up to €675 if you are selected as a prize winner.To avoid any conflicts of interest, a civil-law notary will monitor the drawing of the prize winners,and will make sure that the draw obliges with all legal requirements.
We are very enthusiastic about the value of such insights and we strongly believe that the studyoutcomes can also be beneficial for you. We will therefore offer interested respondents the opportu-nity to receive a free individual report containing the main results of this study. However, for thisreport to be really valuable we need the participation of many people. That is, we need you.
We look forward to hearing from you. To participate please click on the link below:
https://uvafeb.qualtrics.com/SE/?SID=SV_2mnigp2XTFh3xXL
Can we kindly request you to finalize the survey before October 16th? Since VNO-NCW De Baak,Synpact and ACE are jointly sending out this survey, it might be that cross-postings will occur.Our sincere apologies for this in advance. We only require your participation once.
29

Appendix B1: Cross-Occupational Experience of Entrepreneurs, Managers and Employees
Entrepreneur Manager Employee
% with Managerial Experience in the past 70.7 - -Level of past Managerial Experience (scale: 1-5) 1.72 - -% that is also Employee now 9.0 - -% that is also Entrepreneur now - 16.9 10.1Level of current entrepreneurial experience (scale: 1-8) - 1.81 1.33% with entrepreneurial experience in the past - 12.1 8.9Level of past entrepreneurial experience (scale: 1-8) - 2.33 1.71
The ‘level of managerial experience’ is measured based on a question about the number of directly reportingsubordinates when and if entrepreneurs were managers beforehand. The answering categories that we coded 1 to 5,respectively, are 2-5 // 6-10 // 11-25 // 26-50 // More than 50. The ‘level of entrepreneurial experience’ measureis based on the categorized answers to managers and employees how many fulltime equivalent people they employedwhen they were entrepreneurs. This question was posed only to those who had been entrepreneurs in the past.Answer categories were: 0 // 1-4 // 5-10 // 11-25 // 26-100 // 101-250 // 251-1,000 // More than 1,000 employees.The first answer (0) corresponds with a value of 1, the second answer (1-4) with a value of 2, and so on.
30

Appendix B2: Cross-Occupational Experience and Risk, Loss and Ambiguity Aversion
(1) (2) (3)Dependent variable: Risk Loss Ambiguity
Aversion Aversion AversionSurvey (S) or
Experimental (E) (E) (E) (E)
Entrepreneur -0.351⇤⇤⇤ -0.257⇤⇤⇤ 0.0621[-4.30] [-3.27] [0.75]
Entrepreneur x Also employee (YES=1; NO=0) 0.198 -0.165 0.0205[1.64] [-1.25] [0.15]
Entrepreneur x Level of past mgmt experience 0.0315 0.0355 -0.0525⇤
(=0 if none) [1.24] [1.36] [-1.80]
Manager -0.264⇤⇤⇤ -0.00826 -0.0309[-3.16] [-0.10] [-0.34]
Manager x Also entrepreneur (YES=1; NO=0) 0.0679 -0.0556 0.0599[0.47] [-0.45] [0.42]
Manager x Level of past ent. experience 0.00435 -0.0169 0.0740(=0 if none) [0.08] [-0.37] [1.22]
Employee x Also entrepreneur (YES=1; NO=0) -0.127 -0.126 -0.0921[-1.09] [-1.25] [-0.81]
Employee x Level of past ent. experience 0.00542 0.0113 -0.0436(=0 if none) [0.21] [0.37] [-1.53]
Control variables YES YES YES
N 1805 1805 1805Log lik. -3967.6 -3863.3 -3837.4
Entrepreneur = Manager1 0.31 < 0.01*** 0.33
1) This reports the p-value of the Wald test ’entrepreneur’ = ’manager’.
This table reports risk -, loss -, and ambiguity aversion of enterpreneurs, managers and employees, including controlsfor cross-occupational experiences and interactions. All variables have been defined in Appendix Table B or before.Control variables are the same as in Table 5. Significance at the 10% level is denoted by *, 5% by **, and 1% by ***,with t-statistics reported in parentheses. Standard errors are robust.
31

Figures
Figure 1: Measure of Risk Aversion
32

Figure 2: Measure of Loss Aversion
33

Figure 3: Measure of Ambiguity Aversion
34

Figure 4: CDFs per measure per group
35