risks of mould growth in different building structures
TRANSCRIPT

Proceedings of the International Conference „Innovative Materials, Structures and Technologies”
114
doi: 10.7250/iscconstrs.2014.19
RISKS OF MOULD GROWTH IN DIFFERENT BUILDING STRUCTURES
Ansis Ozoliņš1, Andris Jakovičs2
3Laboratory for mathematical Modelling of Technological and Environmental Processes, University of Latvia,
Zellu Str. 8, LV-1002 Riga, Latvia
E-mail:[email protected] (corresponding author); [email protected]
Abstract. In the current paper the impact of real Latvian climate conditions on a variety of building constructions is
inspected. The influence of the humidity on buildings’ sustainability in three different building units has been appraised.
Condensate risks in a multi-layer wall are analyzed by transient outdoor climatic conditions. Risks of mould growth are
discussed in detail taking into account the properties of building materials, dependence of humidity on temperature and
season. The effect of vapour barrier is analyzed from several aspects. Theoretical analysis has been done based on real
test stands built in Riga. Some experimental results are obtained.
Keywords: moisture, multi-layer wall, mould growth, test stands.
Introduction
An analysis of sustainability of different building
solutions is necessary. One of the factors that may have a
negative influence on the sustainability of the buildings is
moisture. U-value could significantly increase due to the
water content in the building construction, therefore,
building energy consumption could also increase.
Condensate formation in the building construction can
cause a serious damage. Mould growth which may result
from high moisture also has a negative influence on the
building sustainability and human health. Mould, decay
and insect damage in buildings is caused when moisture
exceeds the tolerance of structures, which may be a
critical factor for durability and usage of different
building materials.
Risks of mould growth have been intensively analyzed
over the last years. The influence of relative humidity and
temperature on mould growth, on several microfungi and
mycelium in different types of building materials was
investigated in (Isaksson, Thelandersson, Extrand-Tobin,
Johansson 2010; Thelandersson, Isaksson 2013; Viitanen
et al. 2011; Sedlbauer, Krus, Zillig, Kunzel 2001; Johansson,
Bok, Ekstrand-Tobin 2013; Nielsen, Holm, Uttrup, Nielsen
2004; Johansson, P., Extrand-Tobin, Svensson, Bok 2012).
Paper (Mundt-Petersen, Wallenten, Toratti, Heikkinen
2012) presents folos 2D visual mould chart taken int
account t the influence of duration on mould growth and
decline of mould growththat illustrates how it is possible
to use the known models of mould growth in the practical
moisture safety design processes. Report (Mundt-
Petersen, Harderup 2013) uses the mould chart ato
analyze the risk of mould growth in the walls consisting
of insulation material and wood. Literature overview
about moisture safety in wood frame constructions is
given in(Mundt-Petersen, Harderup 2013). In (Vahid,
Kjellstrom, Kalagasidis 2012), mould growth risks were
investigated in the ventilated attics in Sweden.
Comparison of the measured and calculated relative
humidity in building constructions was done in
(Hagerstedt, Harderup 2011; Hagerstedt, Harderup 2011;
Hagerstedt, Arfvidsson 2010; Hagerstedt, Harderup 2010).
Since the critical conditions for mould growth in
different building materials have been widely researched
in the laboratory conditions, it will be interesting to
analyze moisture risks in the real building structures in the
real climatic conditions. Although these investigations
about moisture risks in building constructions have been
done nowadays, experiments that compare different
building structures with similar conditions (orientation,
size, room volume, placement of windows and doors,
loft, floor, roof, etc.) are rarely conducted. Moreover, this
type of analysis for the Latvian climatic conditions has
still not been performed. Therefore, the theoretical and
experimental analyses of moisture risks in different
building solutions of external walls are recommended in
the conditions of the Latvian climate.
Fig. 1. Polygon of test stands.
To achieve the goal, five test stands of houses have
been built for the first time in Riga, Latvia (see Fig. 1),
and these stands can help to verify moisture risks and
sustainability of the solutions developed for the
constructions of external walls, which are mainly
produced from the local raw materials (ceramic blocks,
foam concrete, wood, plywood, fibrolite, granules,
sawdust plates etc.), in the conditions of Latvian climate.
Overall, the main goals of the current work are to
estimate the risk of condensate formation and mould
growth for different building constructions with similar
U-value in the real Latvian climatic conditions in the long
term, using the real polygon of the test stands. More
information about test stands and online results are
available in (EEM, 2013).
115
1. Description of 3 test stands
Experimental results of moisture risks in the building
constructions have been obtained from the test stands of
houses. All of them have the same orientation, net
volume (27 m3), roof inclination, foundation depth over
the ground. Construction floors and roofs are also of the
same kind. Windows are added in the south wall for
analysis of the influence of solar radiation on the heating
and cooling energy and indoor thermal comfort
conditions. The only significant difference between the
test stands is building components used in the
construction of the wall.
Three building constructions of multi-layer walls have
been analyzed. The layers of the walls are listed in the
direction from outdoors to indoors (see Table 1). The
material data is obtained from software WUFI, which has
been used in the simulations, material database and some
data is provided by the manufacturers (Aeroc, 2013;
Paroc, 2013). U-values with the thermal “boundary
layers” of air are estimated approximately for wet
conditions taking into account the change of thermal
conductivity due to moisture. It is assumed that the
convective heat transfer coefficient outdoors and indoors
is constant 7.8 W/(m2K) due to the ventilated facade.
Table 1. Description of building construction walls
Test stands Thickness
Thermal
conductivit
y
Water vapour
diffusion
resistance
factor
M W/(m·K) [-]
Stand of
plywood
Outside
Ventilated
facade
Plywood 0.02 0.17 700
Mineral wool 0.2 0.036 1
Plywood 0.02 0.17 700
Fibrolite 0.075 0.068 2
Lime plaster 0.015 0.7 7
U-value 0.13-0.14 W/(m2K)
Stand of
wooden logs
Ventilated
facade
Wooden logs 0.2 0.13 130
Mineral wool 0.2 0.036 1
Wooden log 0.04 0.13 130
U-value 0.13-0.14 W/(m2K)
Stand of
aerated
concrete
Ventilated
facade
Wind
protection slab 0.03 0.034 1
Mineral wool 0.05 0.036 1
Lime plaster 0.015 0.7 7
Aerated
concrete 0.375 0.072 4
Lime plaster 0.015 0.7 7
U- value ≈0.14 W/(m2K)
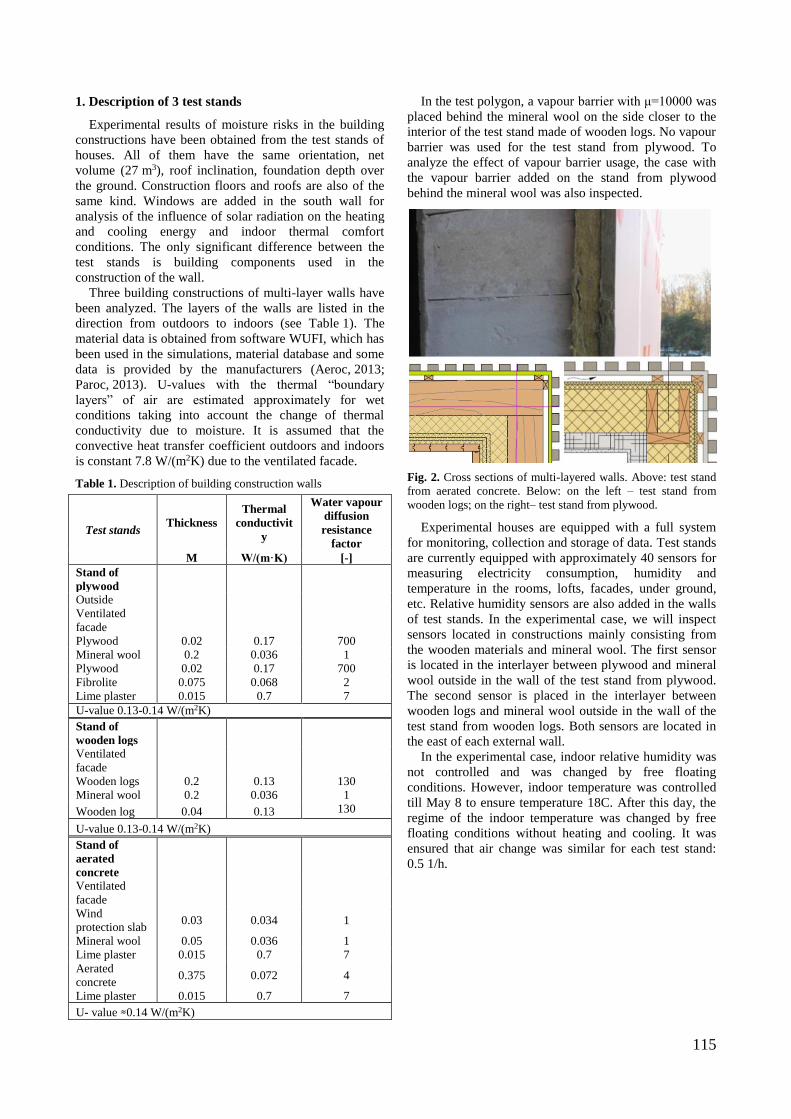
In the test polygon, a vapour barrier with μ=10000 was
placed behind the mineral wool on the side closer to the
interior of the test stand made of wooden logs. No vapour
barrier was used for the test stand from plywood. To
analyze the effect of vapour barrier usage, the case with
the vapour barrier added on the stand from plywood
behind the mineral wool was also inspected.
Fig. 2. Cross sections of multi-layered walls. Above: test stand
from aerated concrete. Below: on the left – test stand from
wooden logs; on the right– test stand from plywood.
Experimental houses are equipped with a full system
for monitoring, collection and storage of data. Test stands
are currently equipped with approximately 40 sensors for
measuring electricity consumption, humidity and
temperature in the rooms, lofts, facades, under ground,
etc. Relative humidity sensors are also added in the walls
of test stands. In the experimental case, we will inspect
sensors located in constructions mainly consisting from
the wooden materials and mineral wool. The first sensor
is located in the interlayer between plywood and mineral
wool outside in the wall of the test stand from plywood.
The second sensor is placed in the interlayer between
wooden logs and mineral wool outside in the wall of the
test stand from wooden logs. Both sensors are located in
the east of each external wall.
In the experimental case, indoor relative humidity was
not controlled and was changed by free floating
conditions. However, indoor temperature was controlled
till May 8 to ensure temperature 18C. After this day, the
regime of the indoor temperature was changed by free
floating conditions without heating and cooling. It was
ensured that air change was similar for each test stand:
0.5 1/h.
116
2. Weather data
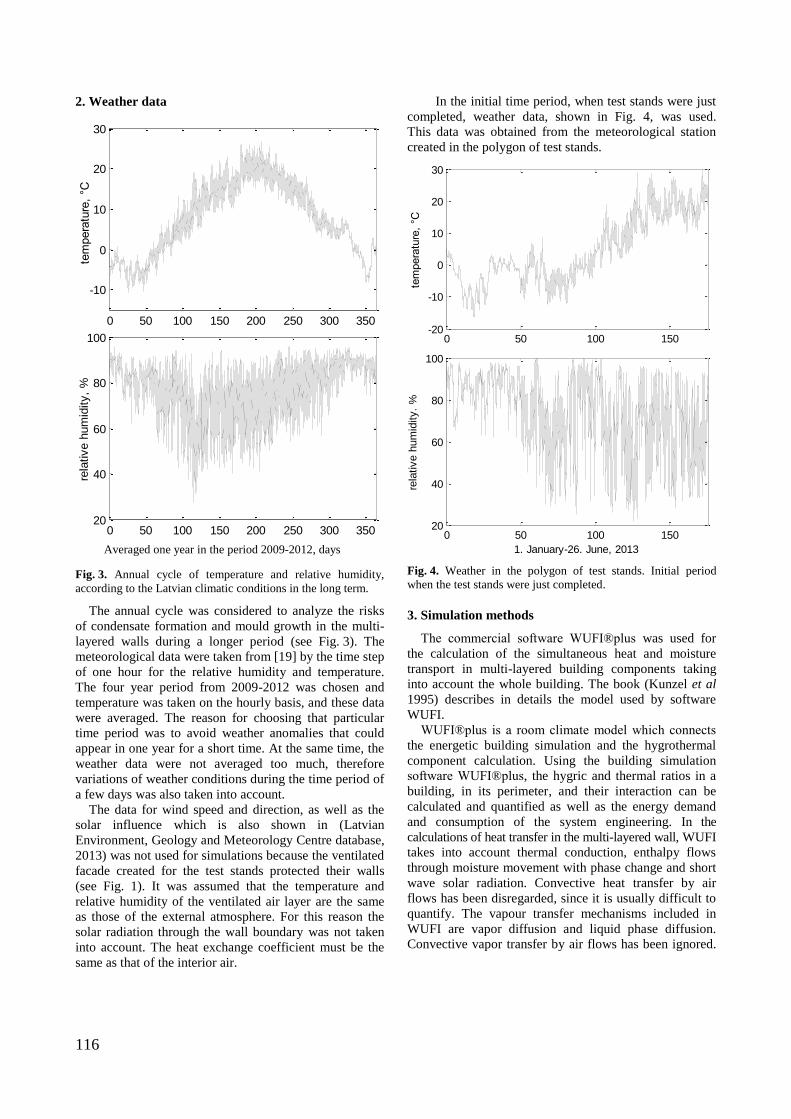
Fig. 3. Annual cycle of temperature and relative humidity,
according to the Latvian climatic conditions in the long term.
The annual cycle was considered to analyze the risks
of condensate formation and mould growth in the multi-
layered walls during a longer period (see Fig. 3). The
meteorological data were taken from [19] by the time step
of one hour for the relative humidity and temperature.
The four year period from 2009-2012 was chosen and
temperature was taken on the hourly basis, and these data
were averaged. The reason for choosing that particular
time period was to avoid weather anomalies that could
appear in one year for a short time. At the same time, the
weather data were not averaged too much, therefore
variations of weather conditions during the time period of
a few days was also taken into account.
The data for wind speed and direction, as well as the
solar influence which is also shown in (Latvian
Environment, Geology and Meteorology Centre database,
2013) was not used for simulations because the ventilated
facade created for the test stands protected their walls
(see Fig. 1). It was assumed that the temperature and
relative humidity of the ventilated air layer are the same
as those of the external atmosphere. For this reason the
solar radiation through the wall boundary was not taken
into account. The heat exchange coefficient must be the
same as that of the interior air.
In the initial time period, when test stands were just
completed, weather data, shown in Fig. 4, was used.
This data was obtained from the meteorological station
created in the polygon of test stands.
Fig. 4. Weather in the polygon of test stands. Initial period
when the test stands were just completed.
3. Simulation methods
The commercial software WUFI®plus was used for
the calculation of the simultaneous heat and moisture
transport in multi-layered building components taking
into account the whole building. The book (Kunzel et al
1995) describes in details the model used by software
WUFI.
WUFI®plus is a room climate model which connects
the energetic building simulation and the hygrothermal
component calculation. Using the building simulation
software WUFI®plus, the hygric and thermal ratios in a
building, in its perimeter, and their interaction can be
calculated and quantified as well as the energy demand
and consumption of the system engineering. In the
calculations of heat transfer in the multi-layered wall, WUFI
takes into account thermal conduction, enthalpy flows
through moisture movement with phase change and short
wave solar radiation. Convective heat transfer by air
flows has been disregarded, since it is usually difficult to
quantify. The vapour transfer mechanisms included in
WUFI are vapor diffusion and liquid phase diffusion.
Convective vapor transfer by air flows has been ignored.
0 50 100 150 200 250 300 350
-10
0
10
20
30
tem
pera
ture
, °C
0 50 100 150 200 250 300 35020
40
60
80
100
time, days
rela
tive h
um
idity,
%
0 50 100 150-20
-10
0
10
20
30
tem
pera
ture
, °C
0 50 100 15020
40
60
80
100
rela
tive h
um
idity.
%
1. January-26. June, 2013Averaged one year in the period 2009-2012, days

117
The liquid transfer mechanisms taken into account are
capillary conduction and surface diffusion. Seepage flow
through gravitation, hydraulic flow through pressure
differentials, as well as electrokinetic and osmotic effects
have not been included. WUFI takes into account the
hourly outdoor climate values.
4. Results and discussions
In this section, two cases are analyzed: long term
climatic conditions and the initial time period, when test
stands were just completed. Experimental results are
given in the second case.
4.1. Moisture risks in the multi-layared walls during a
longer time period
The results were obtained under the assumption that
the indoor temperature and relative humidity are +20°C
and 50%, respectively. The outdoor temperature and
relative humidity are changing by annual cycles (see
Fig. 2).
Fig. 5. Relative humidity curve (left) and relative humidity
versus temperature in a specific place of the building wall
(right). Vapour barrier is added on (c), (d), (e), (f) behind the
mineral wool toward the interior of the stand. Dotted curve on
(b), (d), (f) corresponds to the dashed line in (a), (c), (e),
respectively.
For the calculation of the relative humidity in 3 test
stands (see Table 1), the commercial software
WUFI®plus was used. The results presented below were
obtained during one year, which is the 6th year after five
years from the initiation of calculations, when some
building materials could have been wetter. The maximum
and minimum relative humidity and the relative humidity
in an average winter (for the purposes of the simulation it
is assumed that the winter period lasts from December 1
to February 28) are calculated in the building
construction.
The indications in days are the mould germination
time, e.g., generalized isopleths system for spore
germination. The number of days indicated marks the
duration after which the first germination takes place.
Lower limiting humidity level (LIM) shows the critical
conditions for mould growth, see Fig. 5b, d, f, thicker
solid line (Viitanen et al. 2011). Below LIM there is no
biological activity. It is taken into account that LIM
differs for biodegradable substrates (plywood, wooden
logs) and porous materials (mineral wool). Dots in
Fig. 5b, d, f represent the humidity versus temperature
relation in the annual cycle by a three hour time step.
Figure 5a shows that the test stand from plywood
without the vapour barrier has a high risk of condensate
formation. Vapour barrier effectively neutralizes this risk
in the interlayer adjacent to the external layer, however,
the risks of condensate formation and mould growth
increase in the interlayer between the mineral wool and
the plywood inside (see Fig. 5e, dashed line), that is
explained by the fact that vapour comes in the direction
from the outside to the inside in summer. Fig. 5e shows
that the usage of vapour barrier can give an ambiguous
effect. However, this risk is not so high in the reviewed
case, e. g., total time when humidity can reach or exceed
the limiting curve is only 70 hours. At the same time, it is
expected that the relative humidity inside would be
higher than 50% in summer, if cooling systems are not
used, therefore the maximum relative humidity could be
higher in a real situation. The risk of mould growth could
also increase in summer if a stronger vapour barrier is
used.
0 10 20 30
20
40
60
80
100
0 10 20 30
20
40
60
80
100
0 10 20 30
20
40
60
80
100
0 5 10 15 20 2570
75
80
85
90
0 5 10 15 20 2570
75
80
85
90
0 5 10 15 20 2570
75
80
85
90
data1
max and
min humidity
average humidity
in winter
critical place
humidity vs temperature
lower limitig humidity level
germiantion curves
LIM
16d
LIM
16d
8d
4d
2d
LIM
Test stand from plywood
layer thickness, cm temperature, °C
(f)
(e)
(c)
(d)
(b) (a)
rela
tiv
e h
um
idit
y,
%

118
Fig. 6. Relative humidity curve (left) and relative humidity
versus temperature in a specific place of the building wall
(right). Vapour barrier is added on (c), (d), behind the mineral
wool toward the interior of the stand. Dotted curve on (b), (d)
corresponds to the dashed line in (a), (c), respectively.
Fig. 6 shows that the vapour barrier effectively
neutralizes the risks of condensate (Fig. 6a against Fig. 6c)
and mould growth (Fig. 6b against Fig. 6d) in the test
stand from wooden logs. Maximal relative humidity is
increased in the interlayer between the mineral wool and
wooden log inside, however the risk of mould growth is
not significantly in this case. Fig. 6c also shows that the
level of relative humidity is changing insignificantly in
the most part of wooden log outside due to a high water
vapour diffuse resistance factor characteristic of wooden
logs (see Table 1), therefore vapour diffuses slowly
through the building construction.
Fig. 7. Relative humidity curve (left) and relative humidity
versus temperature in a specific place of the building wall
(right). Dotted curve on (b) corresponds to the dashed line in (a)
where wind protection slab is placed adjacently to the mineral
wool layer.
In case of the test stand from aerated concrete, the
highest relative humidity is observed on the wind
protection slab outside (see Fig. 7a). However, the lowest
temperature prevails in this place. The risks of mould
growth are insignificant for the test stand from aerated
concrete (see Fig. 7b). This can be explained with high
vapour permeability of insulation materials and aerated
concrete that allows vapour to diffuse relatively quickly
through insulation materials, therefore the relative
humidity is higher only in the winter period, when the
temperature is low and risks of mould growth are lower
due to a low outdoor temperature.
4.2. Some experimental results on moisture in building
constructions
Tests stands of houses were completed in December,
2012. Some sensors were installed in the walls of each
test stand, and results started to appear in April. Test
stands mainly consisting of wooden materials and
mineral wool are investigated in this section due to the
highest moisture risks. Numerical results are obtained by
software WUFI taking building geometry, weather data,
boundary conditions on the wall, air change coefficients
etc, as close as possible to real tests stands. Dots in
Fig. 8, 9, 10, 11 represent the humidity versus temperature
relation in the annual cycle by a one hour time step.
Fig. 8. The dynamics of relative humidity in a specific place of
the building wall (see Fig. 5a, vertical dashed line) .
The difference between numerical results and
experimental results (see Fig. 8) can be explained with
inaccurately estimated diffusion resistance factor μ for
wooden logs (see Table 1), which can be lesser in the real
situation. μ value can also be lesser for the vapour barrier
incorporated in the test stand from wooden logs.
Therefore, vapours can diffuse quicker through the
insulation materials and minimal value of relative
humidity is lower in the test stand from wooden logs. Fig.
8 also demonstrates that the relative humidity changed
from 93% to 66% during the period of 80 days, and this
result significantly differs from the numerical result (see
Fig. 6), where the amplitude was only 5%. This can
indicate that drying happens in wooden logs due to the
higher moisture in the initial time period. As it was
expected from theoretical simulations (see Fig. 6d),
relative humidity is lower in summer.
0 10 20 30 40
20
40
60
80
100
0 10 20 30 40
20
40
60
80
100
0 10 2070
75
80
85
90
0 10 2070
75
80
85
90
humidity vs temperature
lower limiting humidity level
0 10 2070
75
80
85
90
0 10 20 30 40
20
40
60
80
100
data1
max and min humidity
average humidity
in winter
critical place
8d
4d
16d
LIM
LIM
LIM
0 10 20 30 40
20
40
60
80
100
max. and min. humidity
average humidity in winter
0 10 2070
75
80
85
90
LIM
humidity vs T
100 110 120 130 140 150 160 17060
70
80
90
100
numerical results
experimentalresults
Test stand from wooden logs
Test stand from aerated concrete
layer thickness, cm
layer thickness, cm
temperature, °C
temperature, °C
(b)
(a)
(a)
(b)
(d)
(c)
April 8 – June 27, days
Test stand from wooden logs
rela
tiv
e h
um
idit
y,
%
rela
tiv
e h
um
idit
y,
%
rela
tiv
e h
um
idit
y,
%

119
Fig. 9. Experimental results. Relative humidity versus
temperature in a specific place of the building wall (see Fig. 5a,
vertical dashed line)
Fig. 9 demonstrates that the risks of mould growth are
high in the initial time period although numerical
simulations showed (see Fig. 6d) that risks of mould
growth is low in the long term.
Fig. 10. The dynamics or relative humidity in a specific place of
the building wall (see Fig. 6a, vertical dashed line).
Numerical results differ from the experimental results
(see Fig. 10). It can be explained by the fact that relative
humidity obtained from simulations is taken exactly from
the interlayer adjacent to the external layer of the
plywood house. However, the sensor can be placed not
exactly in the interlayer, and that can slightly decrease the
maximal value of relative humidity (see Fig. 5, dashed
line). Nevertheless, numerical and experimental results
are compatible enough for the test stand from plywood
(see Fig. 10).
Fig. 11. Experimental results. Relative humidity versus temperature
in a specific place of the building wall (see Fig. 6a, vertical
dashed line).
Fig. 11 demonstrates that spore germination process
occurred in the test stand from plywood. Relative
humidity was above the lower limiting humidity level
during almost the entire time period from May 9 to
June 26 (see Fig. 11). That means that spore germination
process definitely occurred in the test stand. That result
coincides quite well with the theoretical simulation for a
long time period (see Fig. 5). This result shows that
moisture damages can appear if vapour barrier is not used
in the test stand from plywood.
Conclusions
The current work demonstrates that moisture can have
a negative influence on the building construction, e.g., the
constructions which consist of wooden materials. The
construction that consists of wooden logs is particularly
prone to that risk due to relatively low water vapour
permeability.
The vapour barrier can effectively decrease the risk of
condensate formation and mould growth. However, the
role of vapour barrier usage is ambiguous and potentially
can heighten the risk of mould growth in the insulation
material in the direction towards interior. In the observed
cases, this risk was insignificant.
Experimental results demonstrate that critical conditions
for mould growth are overreached for both tests stands
consisting of wooden materials and mineral wool. Even
the usage of the vapour barrier does not help the test
stand consisting of wooden logs.
0 5 10 15 20 25 3065
70
75
80
85
90
95
humidity vs temperature
lower limiting humidity level
germination curves
LIM
16d
8d
4d
2d
130 140 150 160 17070
75
80
85
90
95
experimental results
numerical results
5 10 15 20 25 30 35
75
80
85
90
humidity vs temperature
lower limiting humidity level
germination curves
LIM
16d
8d
4d
2d
May 9 – June 26, days
temperature, °C
temperature, °C
Test stand from plywood
Test stand from plywood: May 9 – June 26 Test stand from wooden logs: April 8 – June
27
rela
tiv
e h
um
idit
y,
%
rela
tiv
e h
um
idit
y,
%
rela
tiv
e h
um
idit
y,
%

120
The current experimental results concerned the initial
time period, when tests stands were just completed. In
future, the collecting of experimental data will continue,
and that will allow analyzing the risks of mould growth in
building constructions in the long term. The next
experimental results will give a possibility to confirm or
decline the hypothesis that the risks of mould growth are
higher for constructions consisting of wooden logs and
mineral wool in the initial time period.
References
Isaksson, T.; Thelandersson, S.; Extrand-Tobin, A.; Johansson, P.,
2010. Critical conditions for onset of mould growth under
varying climate conditions. Building and Environment, 45,
pp. 1712-1721. Available at:
http://www.sciencedirect.com/science/article/pii/S0360132310
000351#
http://dx.doi.org/10.1016/j.buildenv.2010.01.023
Thelandersson, S.; Isaksson, T., 2013. Mould resistance design
(MRD) model for evaluation of risk for microbial growth
under varying climate conditions. Building and Environment,
65, pp.18-25. Available at:
http://www.sciencedirect.com/science/article/pii/S036013231
3000966
http://dx.doi.org/10.1016/j.buildenv.2013.03.016
Viitanen, H., 2011. Moisture and Bio-Deterioration Risk of
Building Materials and Structures, Mass Transfer - Advanced
Aspects, Dr. Hironori Nakajima (Ed.),
ISBN: 978-953-307-636-2, InTech, Available at:
http://cdn.intechopen.com/pdfs/23535/InTech-
Moisture_and_bio_deterioration_risk_of_building_materials
_and_structures.pdf
Sedlbauer, K.; Krus, M.; Zillig, W.; Kunzel, H. M., 2001. Mold
Growth Prediction by Computational Simulation. Fraunhofer
Institute for Building Physics.
Johansson, P.; Bok, G.; Ekstrand-Tobin, A., 2013. The effect of
cycle moisture and temperature on mould growth on wood
compared to steady state conditions. Building and
Environment, 65, pp.178-184. Available at:
http://www.sciencedirect.com/science/article/pii/S036013231
3000267#
http://dx.doi.org/10.1016/j.buildenv.2013.04.004
Nielsen, K. F.; Holm, G.; Uttrup, L.P.; Nielsen, P.A., 2004.
Mould growth on building materials under low water
activities. Influence of humidity and temperature on fungal
growth and secondary metabolism. International
Biodeterioration & Biodegradation, 54, pp. 325-336. Available
at:http://www.sciencedirect.com/science/article/pii/S0964830
504000782
http://dx.doi.org/10.1016/j.ibiod.2004.05.002
Johansson, P.; Extrand-Tobin, A.; Svensson, T.; Bok, G., 2012.
Laboratory study to determine the critical moisture level for
mould growth on building materials. International
Biodeterioration & Biodegradation, 73, pp. 23-32. Available
at:http://www.sciencedirect.com/science/article/pii/S0964830
512001230
http://dx.doi.org/10.1016/j.ibiod.2012.05.014
Mundt-Petersen, S. O.; Wallenten, P.; Toratti, T.; Heikkinen, J.,
2012. Moisture risk evaluation and determination of required
measures to avoid mould damage using the Folos 2D visual
mould chart. Thermopysics 2012 – 17th International Meeting
of Thermophysical Society, 31 October – 2 November, 2012,
Podkylava, Slovakia.
Mundt-Petersen, S. O.; Harderup, et al., 2013. Blind evaluation
of the hygrothermal calculation tool WUFI 5.0 using field
measurements and determination of factors affecting the
moisture safety. Building Physics LTH. Licentiate thesis.
Available at:
http://www.byfy.lth.se/fileadmin/byfy/files/TVBH-
3000pdf/TVBH-3059SOMPlic_web.pdf
Mundt-Petersen, S. O.; Harderup, L. E., 2013. Moisture safety
in wood frame constructions – What do we know today? – A
Literature overview. Sustainable Building Conference 2013 –
SB13, 22-24 May, 2013, Oulu, Finland.
Vahid, M., N.; Kjellstrom, E.; Kalagasidis, A., S., 2012.
Assessment of hygrothermal performance and mould growth
risk in ventilated attics in respect to possible climate changes
in Sweden. Building and Environment, 55, pp.96-109.
Available at:
http://www.sciencedirect.com/science/article/pii/S036013231
200039X#
Hagerstedt, S. O.; Harderup, L. E., 2011. Comparison of
measured and calculated temperature and relative humidity
with varied and constant air flow in the facade air gap. 9th
Nordic Symposium on building Physics NSB. 29 May –
2 June, 2011, Tampere, Finland.
Hagerstedt, S. O.; Harderup, L. E., 2011. Control of moisture
safety design by comparison between calculations and
measurements in passive house walls made of wood.
XII DBMC – International Conference on Durability of
Building Materials and Components, 12-15 April, 2011,
Porto, Portugal.
Hagerstedt, S. O.; Arfvidsson, J., 2010. Comparison of field
measurements and calculations of relative humidity and
temperature in wood framed walls. Thermophysics 2010 –
15th International Meeting of Thermophysical Society,
2-5 November, 2010, Valtice, Czech Republic.
Hagerstedt, S. O.; Harderup, L. E., 2010. Importance of a proper
applied airflow in the facade air gap when moisture and
temperature are calculated in wood framed walls.
5th International Symposium on Building and Ductwork Air‐tightness, 21-22 October, 2010, Copenhagen/Lynby, Denmark.
EEM, 2013. Test stand energy efficiency monitoring project.
[Online] Available at: http://www.eem.lv
Aeroc., 2013. Available at:
http://www.aeroc.lv/index.php?page=783&lang=lat
Paroc., 2013. Available at: http://www.paroc.lv/
Latvian Environment, Geology and Meteorology Centre,
database., 2013. Available at:
http://www.meteo.lv/meteorologija-datu-meklesana/?nid=461
Kunzel, H. M. et al., 1995. Simultaneus heat and moisture
transport in building components. Fraunhofer Institute of
Building Physics.
Acknowledgements
The current work was supported by the European
Regional Development Fund in Latvia within the project
No. 2011/0003/2DP/2.1.1.1.0/10/APIA/VIAA/041.