ritis website technical manual
TRANSCRIPT

8/3/2019 RITIS Website Technical Manual
http://slidepdf.com/reader/full/ritis-website-technical-manual 1/39
RITISWebsite
TechnicalManual
V1.0
Submitted to-
ForEnglish 393
November 19, 2007
By-

8/3/2019 RITIS Website Technical Manual
http://slidepdf.com/reader/full/ritis-website-technical-manual 2/39
--College Park MD, 20740November 21, 2007
-Center for Advanced Transportation Technology5000 College Ave. Suite 3103College Park, MD 20740
Dear Mr. -:
Here is the initial version (v1.0) of the manual, RITIS Website TechnicalManual. The RITIS website has become a powerful set of tools with manycomplex features and options that require a relatively high level of familiarityand general technical experience to use. In order to alleviate any possibleconfusion surrounding the operation of the various components of the
website for traffic management center operators throughout the WashingtonD.C. metropolitan area, this manual was written as a guide to its proper use.It includes complete written explanations for different sections of the sitewith step-by-step instructions for completing common tasks within them, andassociated figures illustrating the processes.
While this version of the manual covers the operation of nearly all of themajor sections of the site, the next version will include additional materialthat discusses the traffic data query tool, graph usage, and those sections of the site currently under construction that have placeholders in this version of the manual. During the time I was interacting with different features of thesite in order to write this document, I discovered several bugs and errors in
the system that should be addressed as soon as possible. Some of the moreserious errors actually prevented my access to features of the data archivethat I needed to explain in this manual. Hopefully we can schedule a meetingshortly to discuss these issues and have them resolved.
Though I was able to write most of this version of the manual from my ownpersonal experience in using and developing the website, it could not havebeen completed without the assistance of yourself and the helpful employeesat the CATT Lab. I would personally like to thank you for the in-depthwalkthrough of the website and sit-down time you were able to provideduring our meeting. Please extend my thanks to the employees as well.
Working on this version of the manual was an enjoyable experience thatgreatly improved my understanding of the different components of the entireRITIS project and its accompanying website. I am confident that the finishedmanual will provide the detailed information necessary to answer allquestions that may arise about the website. If you have any concerns orquestions please contact me anytime by phone at 240-446-8749 or throughe-mail at [email protected].

8/3/2019 RITIS Website Technical Manual
http://slidepdf.com/reader/full/ritis-website-technical-manual 3/39
Sincerely,
-
iii

8/3/2019 RITIS Website Technical Manual
http://slidepdf.com/reader/full/ritis-website-technical-manual 4/39
Table of Contents
iv

8/3/2019 RITIS Website Technical Manual
http://slidepdf.com/reader/full/ritis-website-technical-manual 5/39
Figure 2 - : Login Form 2 ....................................................... viii
Figure 2 - : RITIS Password Reset 3 ....................................... viii
Table 3 - : Legend of Shared Transportation System Status
Icons 3 .................................................................................viii
Figure 3 - : Left portion of Incident List 4 ............................... viii
Figure 3 - : Right portion of Incident List 4 ............................ viii
Figure 3 - : Preview of Sorting Columns 5 .............................. viii
Figure 3 - : Timeline Links in Incident List 6 ........................... viii
Figure 3 - : Collapsed Timeline 6 ........................................... viii
Figure 3 - 6: Lane Status 7 .................................................... viii
Figure 3 - 7: Speed Data 8 .................................................... viii
Figure 3 - 8: Timeline with Speed and Volume Data 8 ............. viii
Figure 3 - 9: Timeline Titlebar Icons 9 .................................... viii
Figure 3 - 10: Traffic Map after Initial Load 10 ....................... viii
Table 3 - : Map Layer Descriptions 10 .................................... viii
Figure 3 - 11: Using the Zoom-Box Tool 12 ............................. viii
Figure 3 - 12: Legend for Traffic Map 12 ................................ viii
Figure 3 - 13: Open Layer List 13 ........................................... viii
Figure 3 - 14: Unmapped Incidents List 14 ............................. viii
Figure 3 - 15: Information Popup Window Example for Incidents,
Events, and Alerts 16 ............................................................ viii
Figure 3 - 16: The Three types of Traffic Detector Popup
Windows 17 ......................................................................... viii
Figure 4 - : Address Book Sorting Headers 18 ........................ viii
Figure 4 - : Sorting by Location 18 ......................................... viii
Figure 4 - : Sorting by Agency 18 .......................................... viii
Figure 6 - 1: Data Selections 20 ............................................ viii
Figure 6 - 2: Graph Options 20 .............................................. viii
Figure 6 - 3: Filters 21 .......................................................... viii
Figure 6 - 4: Filters with Calendar 22 ..................................... viii
Figure 6 - 5: Table of Results 23 ............................................ viii Figure 6 - 6: Save Popup 23 .................................................. viii
Figure 7 - : Performance Measure Divisions 25 ....................... viii
Figure 7 - : Specifying the Performance Time Period 25 ......... viii
Figure 7 - : Calendar 26 ........................................................ viii
Figure 7 - : Menu of Performance Measure Options 26 ........... viii
Figure 7 - : Performance Measures Titlebar 26 ....................... viii
v

8/3/2019 RITIS Website Technical Manual
http://slidepdf.com/reader/full/ritis-website-technical-manual 6/39
Figure 9 - : User Profile Settings 27 ......................................... ix
Figure 9 - : Editing Users 28 .................................................... ix
Figure 9 - : Adding New Users 28 ............................................ ix
Figure 9 - : Access Levels 28 ................................................... ix
1 Introduction & Background Information ............................... 11.1 RITIS & the RITIS Website ............................................................. 1
2 Login Page .........................................................................22.1 Logging In .................................................................................... 2
2.2 Resetting Your Password .............................................................. 2
3 Transportation System Status ............................................. 33.1 Incidents List ............................................................................... 4
3.1.1 Sorting the Incidents List .................................................................. 5
3.1.2 Accessing the Timeline Display ......................................................... 5
3.1.2.6 Using the Icons on the Timeline Display.......................................................... 8
3.2 Traffic Map .................................................................................. 9
3.2.1 Navigating the Map ......................................................................... 103.2.2 The Legend ..................................................................................... 12
3.2.3 The Layer List ................................................................................. 13
3.2.4 The Unmapped Incidents List ........................................................... 14
3.2.5 Accessing Detailed Information from Icons ....................................... 15
4 Address Book ...................................................................184.1 Sort by Location ......................................................................... 18
4.2 Sort by Agency Type ................................................................... 18
5 Data Feeds .......................................................................19
6 Data Archive .....................................................................196.1 Incident Data Query Tool............................................................. 19
6.1.1 Querying (Searching) the Incident Data Archive ................................ 20
6.1.2 Using the Table of Results ............................................................... 22
6.1.3 Printing & Saving Information .......................................................... 23
6.2 Traffic Data Query Tool............................................................... 24
7 Performance Measures ..................................................... 257.1 Generating a Report .................................................................. 25
7.2 Pre-generated Report ................................................................. 25
7.3 Selecting the data range ............................................................. 25
7.4 Report Controls .......................................................................... 268 Reading Room ..................................................................26
9 User Settings ................................................................... 279.1 Change Password ....................................................................... 27
9.2 User Management ...................................................................... 27
9.2.1 Editing Users .................................................................................. 27
9.2.2 Creating a New User ........................................................................ 28
10.1 Glossary ................................................................................... 29
vi

8/3/2019 RITIS Website Technical Manual
http://slidepdf.com/reader/full/ritis-website-technical-manual 7/39
List of Figures & Tables
vi

8/3/2019 RITIS Website Technical Manual
http://slidepdf.com/reader/full/ritis-website-technical-manual 8/39
Figure 2 - : Login Form............................................................2
Figure 2 - : RITIS Password Reset.............................................3
Table 3 - : Legend of Shared Transportation System Status
Icons......................................................................................3
Figure 3 - : Left portion of Incident List....................................4
Figure 3 - : Right portion of Incident List..................................4
Figure 3 - : Preview of Sorting Columns....................................5
Figure 3 - : Timeline Links in Incident List................................6
Figure 3 - : Collapsed Timeline.................................................6
Figure 3 - 6: Lane Status.........................................................7
Figure 3 - 7: Speed Data..........................................................8
Figure 3 - 8: Timeline with Speed and Volume Data..................8
Figure 3 - 9: Timeline Titlebar Icons.........................................9
Figure 3 - 10: Traffic Map after Initial Load.............................10
Table 3 - : Map Layer Descriptions.........................................10
Figure 3 - 11: Using the Zoom-Box Tool..................................12
Figure 3 - 12: Legend for Traffic Map.....................................12
Figure 3 - 13: Open Layer List................................................13
Figure 3 - 14: Unmapped Incidents List..................................14
Figure 3 - 15: Information Popup Window Example for Incidents,
Events, and Alerts.................................................................16
Figure 3 - 16: The Three types of Traffic Detector Popup
Windows...............................................................................17
Figure 4 - : Address Book Sorting Headers..............................18
Figure 4 - : Sorting by Location..............................................18
Figure 4 - : Sorting by Agency................................................18
Figure 6 - 1: Data Selections..................................................20
Figure 6 - 2: Graph Options....................................................20
Figure 6 - 3: Filters................................................................21
Figure 6 - 4: Filters with Calendar..........................................22
Figure 6 - 5: Table of Results.................................................23Figure 6 - 6: Save Popup........................................................23
Figure 7 - : Performance Measure Divisions............................25
Figure 7 - : Specifying the Performance Time Period...............25
Figure 7 - : Calendar..............................................................26
Figure 7 - : Menu of Performance Measure Options.................26
Figure 7 - : Performance Measures Titlebar............................26
viii

8/3/2019 RITIS Website Technical Manual
http://slidepdf.com/reader/full/ritis-website-technical-manual 9/39
Figure 9 - : User Profile Settings............................................27
Figure 9 - : Editing Users.......................................................28
Figure 9 - : Adding New Users................................................28
Figure 9 - : Access Levels.......................................................28
ix

8/3/2019 RITIS Website Technical Manual
http://slidepdf.com/reader/full/ritis-website-technical-manual 10/39
RITIS Website Technical Manual
1 Introduction & Background
Information
The RITIS Website Technical Manual is the complete written companion to using theapplications embedded within the website of the Regional Integrated TransportationInformation System. It was originally requested to serve as a detailedinstructional/reference guide for new traffic management center operators surrounding theWashington D.C. metropolitan area that will use this system’s website. In addition, it willboth alleviate some of the current confusion of previous website users and provide thedevelopers of the website with specifications for the new features currently beingimplemented. Through the use of detailed explanations in combination with step-by-stepinstructions and diagramed figures, the manual clearly explains the purpose of each sectionof the website as well as how to properly operate the tools and features embedded
amongst the content. This manual is also written for several audiences that may not have agreat deal of experience working with the RITIS system or completing common computer-related tasks. As a result, the instructions in the manual are broken down into sets of verybasic steps that can be followed by all potential users accessing the site. It is organized sothat the major sections, and many of the subsections, found throughout the documentmirror the same organizational divisions of the website itself. In addition, an image of whatthe actual navigation bar from the website looks like when browsing a particular webpage isincluded at the top of the corresponding sections in the manual. By incorporating this imagebelow the headers of major sections the manual becomes much easier to reference andunderstand while actually browsing the site at the same time.
Remember: The “Click” action used throughout this manual refers to the standard left-
click of nearly all two-button computer mice. If the right mouse button needs to be clickedinstead of the left mouse button then it will be explicitly stated as “Right-Click.” The“Double-click” action is achieved by clicking the left mouse button twice in rapid successionwithout moving the mouse pointer.
1.1 RITIS & the RITIS Website
The Regionally Integrated Transportation Information System, or RITIS for short, is a $1.9million dollar ongoing project developed at the Center for Advanced Transportation
Technology (CATT) laboratory in College Park, MD. The major idea behind the developmentof RITIS is that the integration of traffic and transportation management data from the
participating organizations currently monitoring this information in Virginia, Maryland, andWashington D.C will improve general transportation efficiency, safety, and security.Currently, the information from these various organizations is stored and maintained locallyin formats that are often incompatible with one another, making it especially difficult fortraffic management centers in these areas to quickly and effectively coordinate theirefforts. With RITIS, however, this scatter data is fused into a single standardized source toprovide an enhanced overall view of the region’s transportation network that can be used toimprove operations and emergency response preparedness, support general transportationmanagement, and provide travelers with accurate regional information. The RITIS websiteserves as the central interface for accessing the consolidation of live and archived trafficand incident data for travelers, traveler information service providers, and participating
1
8/3/2019 RITIS Website Technical Manual
http://slidepdf.com/reader/full/ritis-website-technical-manual 11/39
agencies that cannot already access RITIS data from their native systems. In addition toproviding contact information for all participating agencies, the site incorporates anautomatically updated list of all current traffic-related incidents and associated information,an interactive informational map system displaying live RITIS data, a powerful set of toolsthat can be used to query and analyze previously collected data stored in the archive, andseveral collections of automatically generated performance reports concerning variousaspects of the transportation network. The proper use of these various applications,including their numerous features and options, is the focus of the remainder of this
technical manual.2 Login Page
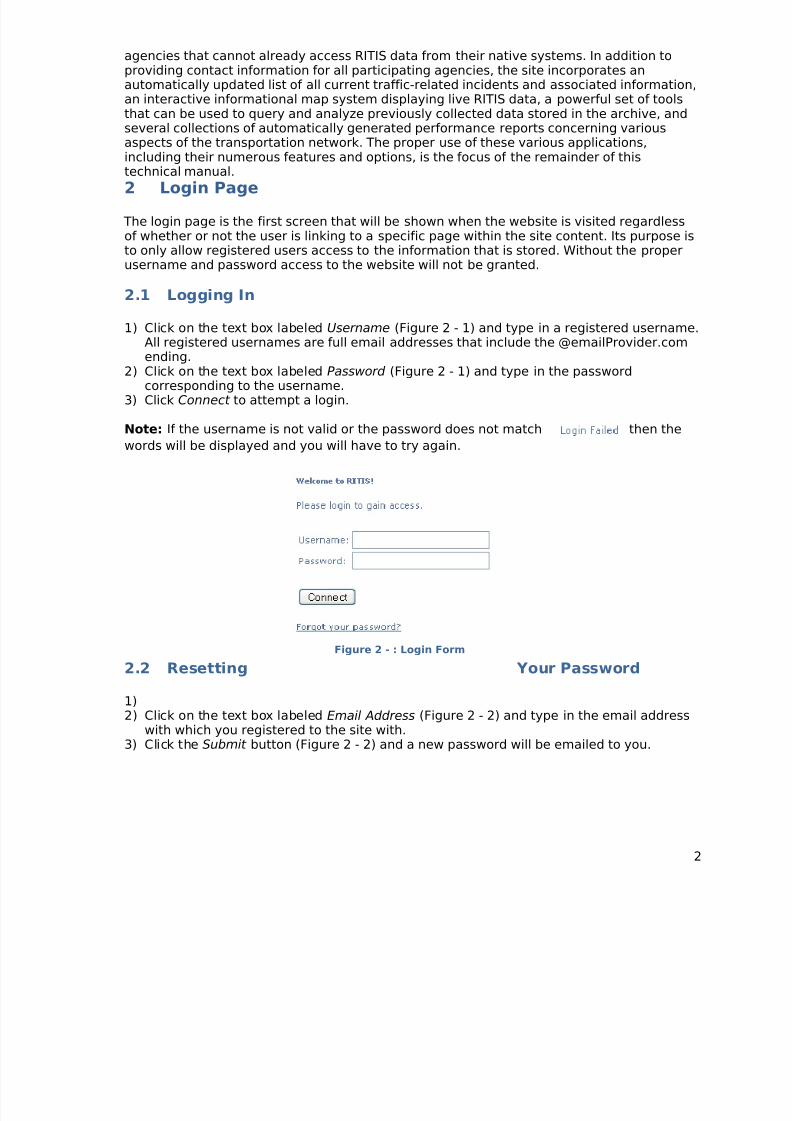
The login page is the first screen that will be shown when the website is visited regardlessof whether or not the user is linking to a specific page within the site content. Its purpose isto only allow registered users access to the information that is stored. Without the properusername and password access to the website will not be granted.
2.1 Logging In
1) Click on the text box labeled Username (Figure 2 - 1) and type in a registered username.
All registered usernames are full email addresses that include the @emailProvider.comending.
2) Click on the text box labeled Password (Figure 2 - 1) and type in the passwordcorresponding to the username.
3) Click Connect to attempt a login.
Note: If the username is not valid or the password does not match then the
words will be displayed and you will have to try again.
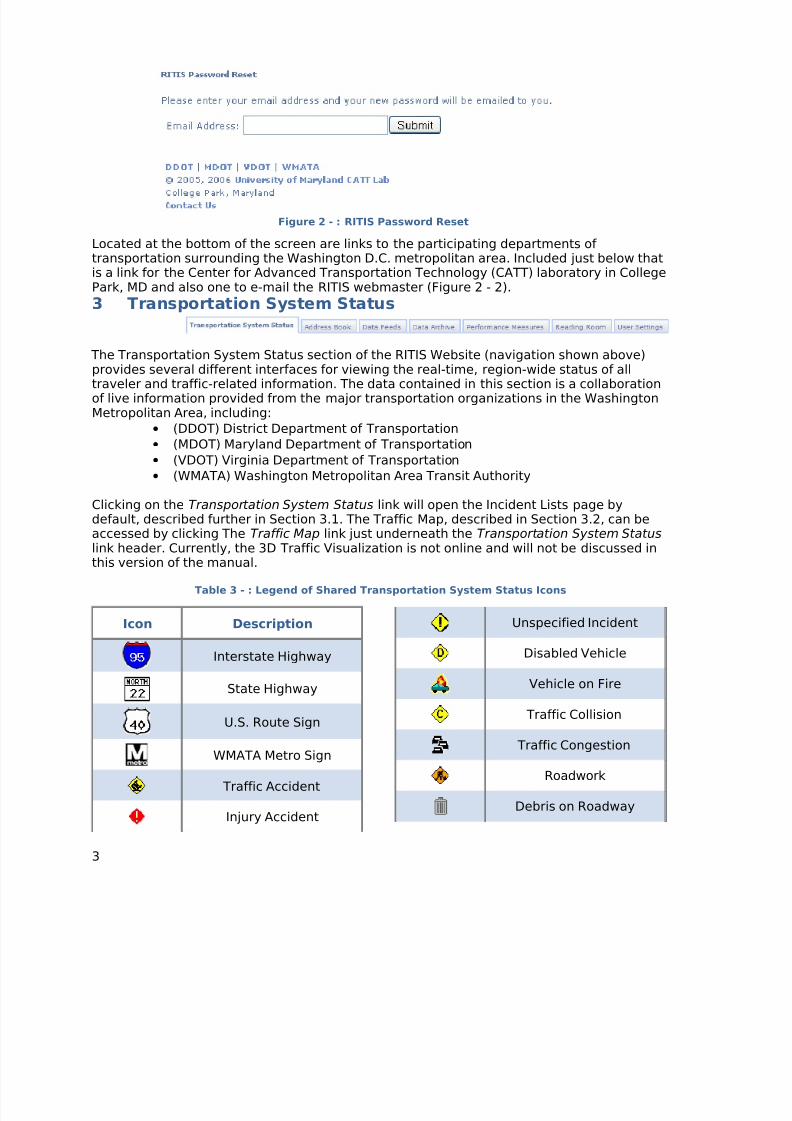
2.2 Resetting Your Password
1)2) Click on the text box labeled Email Address (Figure 2 - 2) and type in the email address
with which you registered to the site with.3) Click the Submit button (Figure 2 - 2) and a new password will be emailed to you.
2
Figure 2 - : Login Form
8/3/2019 RITIS Website Technical Manual
http://slidepdf.com/reader/full/ritis-website-technical-manual 12/39
Located at the bottom of the screen are links to the participating departments of transportation surrounding the Washington D.C. metropolitan area. Included just below thatis a link for the Center for Advanced Transportation Technology (CATT) laboratory in CollegePark, MD and also one to e-mail the RITIS webmaster (Figure 2 - 2).
3 Transportation System Status
The Transportation System Status section of the RITIS Website (navigation shown above)provides several different interfaces for viewing the real-time, region-wide status of alltraveler and traffic-related information. The data contained in this section is a collaborationof live information provided from the major transportation organizations in the WashingtonMetropolitan Area, including:
• (DDOT) District Department of Transportation
• (MDOT) Maryland Department of Transportation
• (VDOT) Virginia Department of Transportation
• (WMATA) Washington Metropolitan Area Transit Authority
Clicking on the Transportation System Status link will open the Incident Lists page by
default, described further in Section 3.1. The Traffic Map, described in Section 3.2, can beaccessed by clicking The Traffic Map link just underneath the Transportation System Statuslink header. Currently, the 3D Traffic Visualization is not online and will not be discussed inthis version of the manual.
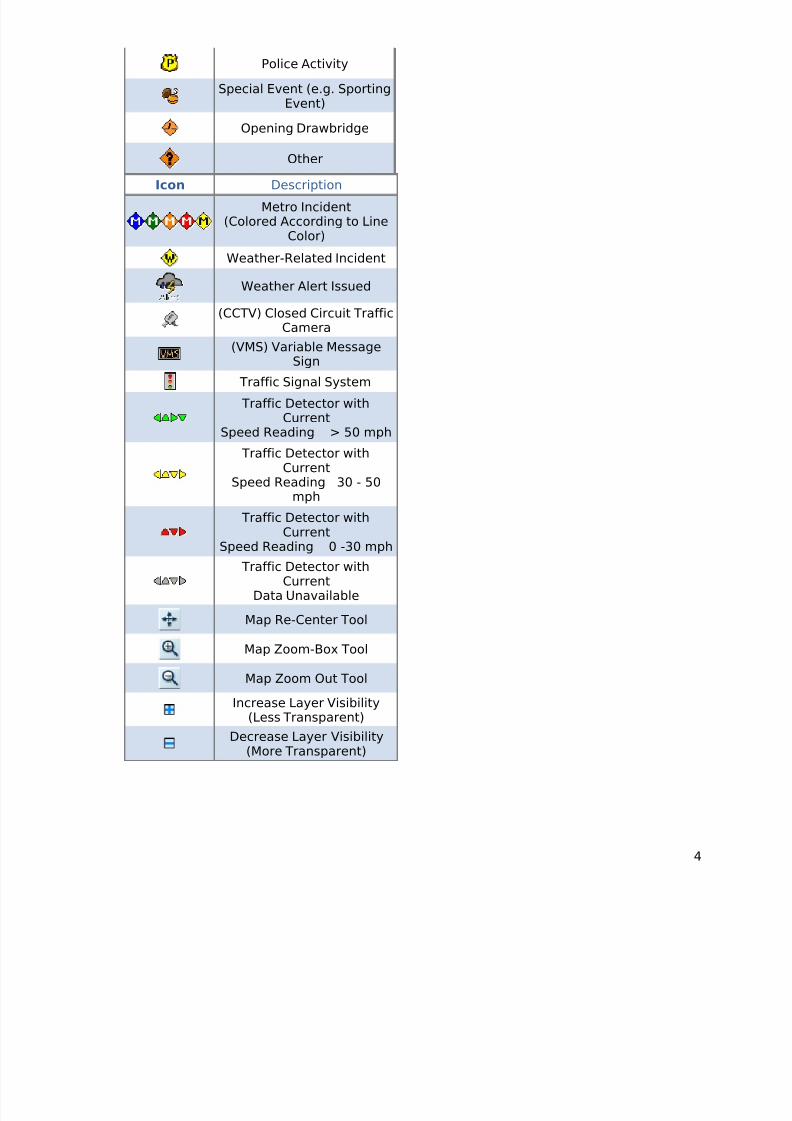
Table 3 - : Legend of Shared Transportation System Status Icons
Icon Description
Interstate Highway
State Highway
U.S. Route Sign
WMATA Metro Sign
Traffic Accident
Injury Accident
Unspecified Incident
Disabled Vehicle
Vehicle on Fire
Traffic Collision
Traffic Congestion
Roadwork
Debris on Roadway
3
Figure 2 - : RITIS Password Reset
8/3/2019 RITIS Website Technical Manual
http://slidepdf.com/reader/full/ritis-website-technical-manual 13/39
Police Activity
Special Event (e.g. SportingEvent)
Opening Drawbridge
Other
Icon Description
Metro Incident(Colored According to Line
Color)
Weather-Related Incident
Weather Alert Issued
(CCTV) Closed Circuit TrafficCamera
(VMS) Variable MessageSign
Traffic Signal System
Traffic Detector withCurrent
Speed Reading > 50 mph
Traffic Detector withCurrent
Speed Reading 30 - 50mph
Traffic Detector withCurrent
Speed Reading 0 -30 mph
Traffic Detector withCurrent
Data Unavailable
Map Re-Center Tool
Map Zoom-Box Tool
Map Zoom Out Tool
Increase Layer Visibility(Less Transparent)
Decrease Layer Visibility(More Transparent)
4
8/3/2019 RITIS Website Technical Manual
http://slidepdf.com/reader/full/ritis-website-technical-manual 14/39
3.1 Incidents List
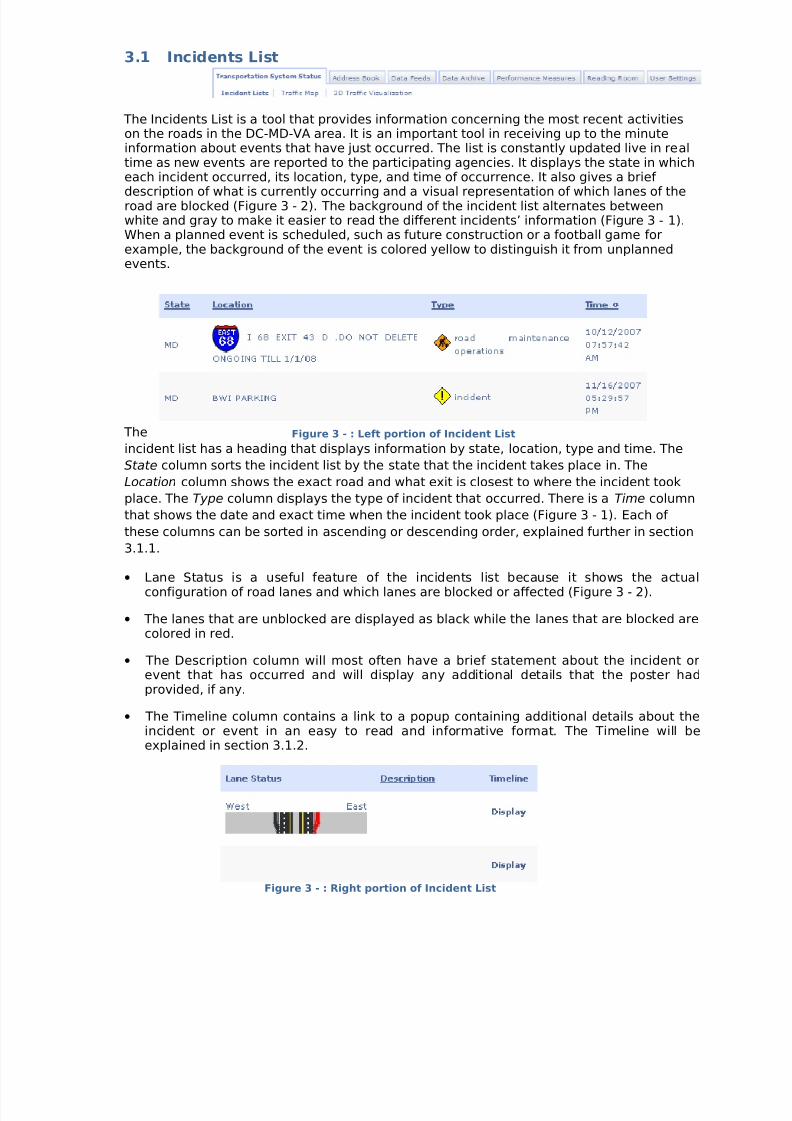
The Incidents List is a tool that provides information concerning the most recent activitieson the roads in the DC-MD-VA area. It is an important tool in receiving up to the minuteinformation about events that have just occurred. The list is constantly updated live in realtime as new events are reported to the participating agencies. It displays the state in whicheach incident occurred, its location, type, and time of occurrence. It also gives a brief description of what is currently occurring and a visual representation of which lanes of theroad are blocked (Figure 3 - 2). The background of the incident list alternates betweenwhite and gray to make it easier to read the different incidents’ information (Figure 3 - 1).When a planned event is scheduled, such as future construction or a football game forexample, the background of the event is colored yellow to distinguish it from unplannedevents.
The
incident list has a heading that displays information by state, location, type and time. The
State column sorts the incident list by the state that the incident takes place in. The
Location column shows the exact road and what exit is closest to where the incident took
place. The Type column displays the type of incident that occurred. There is a Time column
that shows the date and exact time when the incident took place (Figure 3 - 1). Each of these columns can be sorted in ascending or descending order, explained further in section
3.1.1.
• Lane Status is a useful feature of the incidents list because it shows the actuaconfiguration of road lanes and which lanes are blocked or affected (Figure 3 - 2).
• The lanes that are unblocked are displayed as black while the lanes that are blocked arecolored in red.
• The Description column will most often have a brief statement about the incident orevent that has occurred and will display any additional details that the poster had
provided, if any.
• The Timeline column contains a link to a popup containing additional details about theincident or event in an easy to read and informative format. The Timeline will beexplained in section 3.1.2.
Figure 3 - : Left portion of Incident List
Figure 3 - : Right portion of Incident List
8/3/2019 RITIS Website Technical Manual
http://slidepdf.com/reader/full/ritis-website-technical-manual 15/39
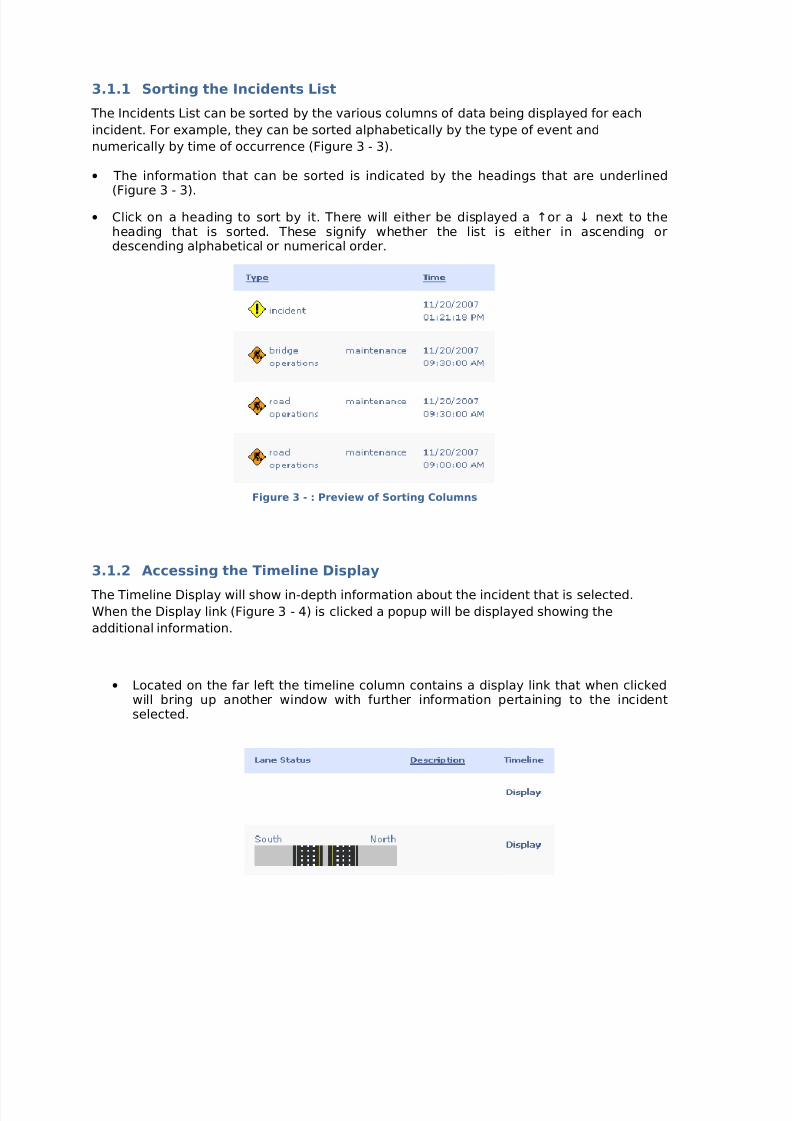
3.1.1 Sorting the Incidents List
The Incidents List can be sorted by the various columns of data being displayed for each
incident. For example, they can be sorted alphabetically by the type of event and
numerically by time of occurrence (Figure 3 - 3).
• The information that can be sorted is indicated by the headings that are underlined(Figure 3 - 3).
• Click on a heading to sort by it. There will either be displayed a ↑or a ↓ next to theheading that is sorted. These signify whether the list is either in ascending ordescending alphabetical or numerical order.
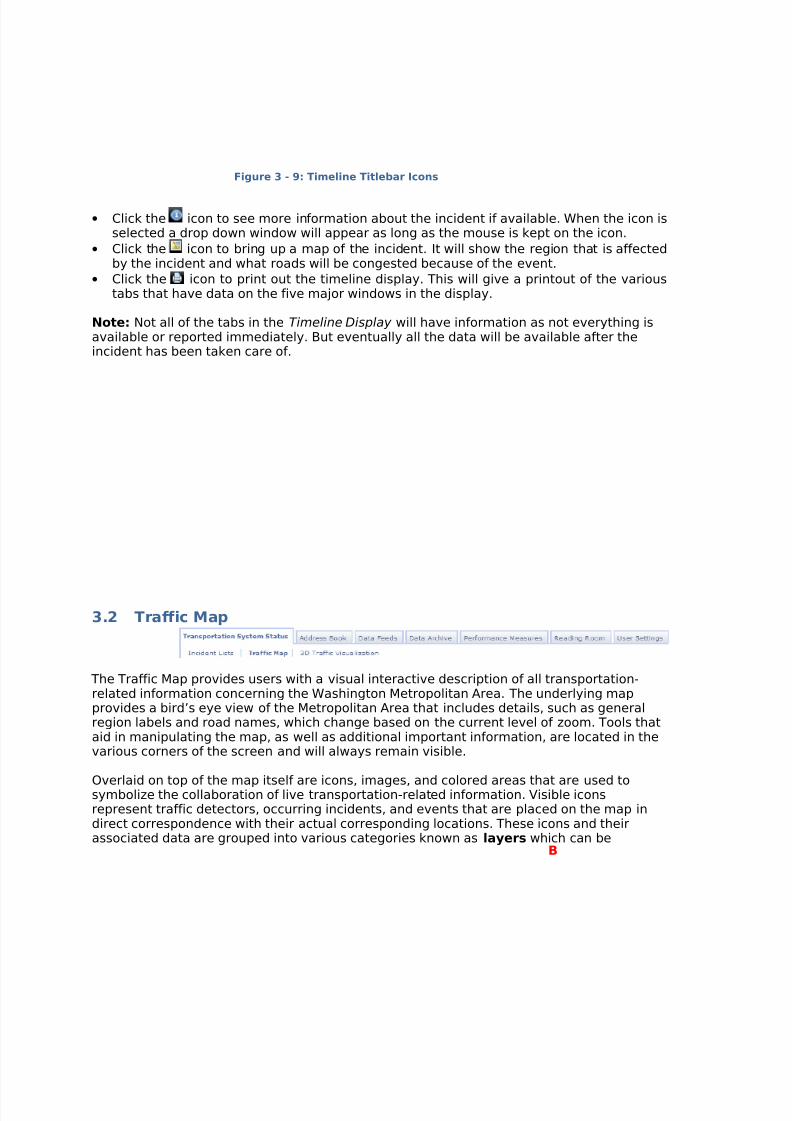
3.1.2 Accessing the Timeline Display
The Timeline Display will show in-depth information about the incident that is selected.
When the Display link (Figure 3 - 4) is clicked a popup will be displayed showing the
additional information.
•
Located on the far left the timeline column contains a display link that when clickedwill bring up another window with further information pertaining to the incidentselected.
Figure 3 - : Preview of Sorting Columns

8/3/2019 RITIS Website Technical Manual
http://slidepdf.com/reader/full/ritis-website-technical-manual 16/39
At the top of the popup the incident location is displayed and also what happened. There
are several different tabs that can be clicked on to expand. These will bring more
information about the incident.
The features on the Time Line display are used by clicking on the icon on the left side of the display box (Figure 3 - 5 A). When this icon is pressed the arrow will point downwardsand data for the incident will be shown (Figure 3 - 6). The various panes of information areused to find out what response units made it out to the scene, how many lanes are closed,and how the traffic is progressing through the area of the incident.
3.1.2.1 Using the Responders Tool. This tab displays the response units that have
arrived at the scene.
1) Click on the icon that is next to the tab labeled Responders (Figure 3 - 5 A). A window
will drop down revealing more information about the response units.
2) Using the mouse hover over the various dots that are located in the window. This will
display information about when the response units arrived on the scene.
Note: The table shows when each type of response unit first arrived and the length of time
that the response unit was present at the scene of the incident.
3.1.2.2 Using the Lane Status Tool. This tab displays a picture of the road andshows which lanes are open and which ones are closed.
1) Click on the icon that is next to the tab labeled Lane Status (Figure 3 - 5 B). A windowwill drop down revealing more information about the lanes of the road on which theincident has occurred.
Figure 3 - : Timeline Links in Incident List
Figure 3 - : Collapsed Timeline
A
B
C
D
E

8/3/2019 RITIS Website Technical Manual
http://slidepdf.com/reader/full/ritis-website-technical-manual 17/39
2) By moving the mouse over a specified lane it will display how long the lane has beenopen or how long it has been closed (Figure 3 - 6).
3.1.2.3 Using the VMS Messages Tool. Stands for variable message signs; these
are the signs that signal to drivers if there is an accident up ahead or to turn to a particular
radio station for more information.
1) Click on the icon next to the VMS Messages tab (Figure 3 - 5 C) to view informationabout VMS messages.
2) This tab will go into detail about any messages that were put on display on the Variable
Message Signs (VMS) on major roads in the DC-MD-VA area.
3.1.2.4 Using the Speed Data Tool. This graph shows the traffic flow over the
most recent time interval.
1) Click on the icon next to the tab labeled Speed Data (Figure 3 - 5 D). A window will
drop down revealing a graph of the traffic flow over a given interval of time.
2) Hover over the graph with the mouse to show a window containing the x and x axis’
mouse coordinate (Figure 3 -7). The graph shows traffic flow on the y axis and is colored
to show the speed that the traffic is moving at.
Figure 3 - 6: Lane Status

8/3/2019 RITIS Website Technical Manual
http://slidepdf.com/reader/full/ritis-website-technical-manual 18/39
Note: In the table showing in Figure 3 - 7 there is an edit button, this button is onlyavailable to certain registered users and is responsible for accessing databases of the CATTLab.
3.1.2.5 Using the Volume Data Tool. This window shows the volume of traffic that
is present.
1) Click on the icon that is next to the tab labeled Volume Data (Figure 3 - 5 E). A window
will drop down displaying the data on the volume of traffic that is on the selected road.
2) With the mouse scroll onto the graph to see the amount of traffic that is flowing on the
road (Figure 3 - 8). This graph is similar to the Speed Data window and is color coded to
represent the amount of
traffic also.
Note: In the table shown inFigure 3 - 8 there is an edit button, this button is only available to certain registered usersand is responsible for accessing databases of the CATT Lab.
3.1.2.6 Using the Icons on the Timeline Display.
The icons on the Time Line display are used by clicking on them; they are located on thetop right corner of the display box (Figure 3 - 9 A).By moving the mouse over these icons andclicking it will bring up additional information aboutthe selected incident.
A
Figure 3 - 7: Speed Data
Figure 3 - 8: Timeline with Speed and Volume Data
8/3/2019 RITIS Website Technical Manual
http://slidepdf.com/reader/full/ritis-website-technical-manual 19/39
• Click the icon to see more information about the incident if available. When the icon isselected a drop down window will appear as long as the mouse is kept on the icon.
• Click the icon to bring up a map of the incident. It will show the region that is affectedby the incident and what roads will be congested because of the event.
• Click the icon to print out the timeline display. This will give a printout of the varioustabs that have data on the five major windows in the display.
Note: Not all of the tabs in the Timeline Display will have information as not everything isavailable or reported immediately. But eventually all the data will be available after theincident has been taken care of.
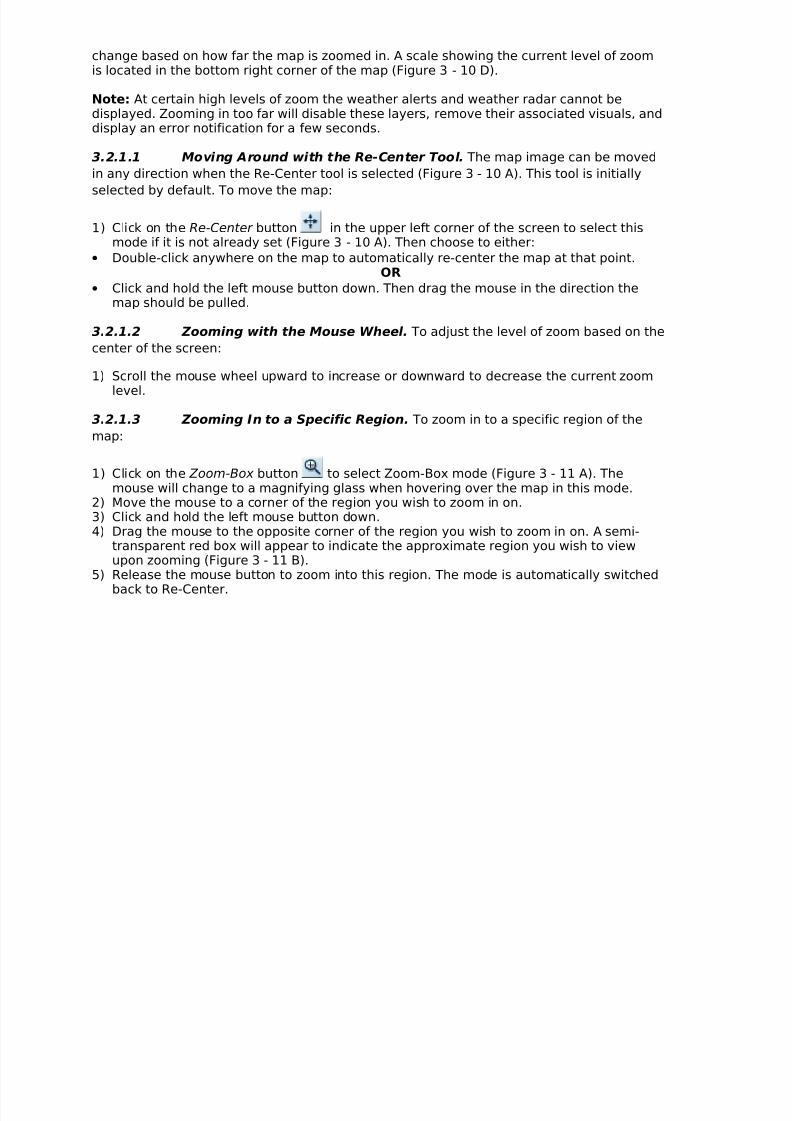
3.2 Traffic Map
The Traffic Map provides users with a visual interactive description of all transportation-
related information concerning the Washington Metropolitan Area. The underlying mapprovides a bird’s eye view of the Metropolitan Area that includes details, such as generalregion labels and road names, which change based on the current level of zoom. Tools thataid in manipulating the map, as well as additional important information, are located in thevarious corners of the screen and will always remain visible.
Overlaid on top of the map itself are icons, images, and colored areas that are used tosymbolize the collaboration of live transportation-related information. Visible iconsrepresent traffic detectors, occurring incidents, and events that are placed on the map indirect correspondence with their actual corresponding locations. These icons and theirassociated data are grouped into various categories known as layers which can be
B
Figure 3 - 9: Timeline Titlebar Icons

8/3/2019 RITIS Website Technical Manual
http://slidepdf.com/reader/full/ritis-website-technical-manual 20/39
individually modified for easier viewing. A description of all accessible layers is providedbelow in Table 3 - 2.
Figure 3 - 10: Traffic Map after Initial Load
Warning: This tool will not function properly unless popup windows are enabled in yourinternet browser. See your browser documentation for information on how to enable popupwindows.
Layer Name Description
Planned Events The set of icons on the map that stand for events and incidentsthat have not yet occurred and are set to begin sometime in the
future (e.g. Football games).
Incidents and
Events
The set of icons on the map symbolizing all of the currently active
and live traffic-related incidents with specified locations (e.g. CarAccidents).
MDOT Detectors The set of various colored caret-shaped icons representing the
traffic detectors monitored by the Maryland Department of Transportation.
VDOT Detectors The set of various colored caret-shaped icons representing the
traffic detectors monitored by the Virginia Department of Transportation.
Weather Alerts The set of semi-transparent red county overlays and weather
icons that are placed directly on top of any county currentlyreceiving weather alerts.
Weather Radar A live radar image of weather conditions for the WashingtonMetropolitan Area
Table 3 - : Map Layer Descriptions
3.2.1 Navigating the Map
In order to provide the various levels of detail and multiple perspectives needed toappropriately view the transportation-related data, the Traffic Map can be moved in anydirection and zoomed to an infinite number of levels. The amount of detail present in theunderlying map image, as well as the appearance of county, city, and street names, will
CA
DE
8/3/2019 RITIS Website Technical Manual
http://slidepdf.com/reader/full/ritis-website-technical-manual 21/39
change based on how far the map is zoomed in. A scale showing the current level of zoomis located in the bottom right corner of the map (Figure 3 - 10 D). Note: At certain high levels of zoom the weather alerts and weather radar cannot bedisplayed. Zooming in too far will disable these layers, remove their associated visuals, anddisplay an error notification for a few seconds.
3.2.1.1 Moving Around with the Re-Center Tool. The map image can be moved
in any direction when the Re-Center tool is selected (Figure 3 - 10 A). This tool is initiallyselected by default. To move the map:
1) Click on the Re-Center button in the upper left corner of the screen to select thismode if it is not already set (Figure 3 - 10 A). Then choose to either:
• Double-click anywhere on the map to automatically re-center the map at that point.OR
• Click and hold the left mouse button down. Then drag the mouse in the direction themap should be pulled.
3.2.1.2 Zooming with the Mouse Wheel. To adjust the level of zoom based on the
center of the screen:
1) Scroll the mouse wheel upward to increase or downward to decrease the current zoomlevel.
3.2.1.3 Zooming In to a Specific Region. To zoom in to a specific region of the
map:
1) Click on the Zoom-Box button to select Zoom-Box mode (Figure 3 - 11 A). Themouse will change to a magnifying glass when hovering over the map in this mode.
2) Move the mouse to a corner of the region you wish to zoom in on.
3) Click and hold the left mouse button down.4) Drag the mouse to the opposite corner of the region you wish to zoom in on. A semi-
transparent red box will appear to indicate the approximate region you wish to viewupon zooming (Figure 3 - 11 B).
5) Release the mouse button to zoom into this region. The mode is automatically switchedback to Re-Center.

8/3/2019 RITIS Website Technical Manual
http://slidepdf.com/reader/full/ritis-website-technical-manual 22/39
Figure 3 - 11: Using the Zoom-Box Tool
3.2.1.4 Zooming Out. To zoom out from the center of the screen:
1) Click on the Zoom-Out button located in the upper-left corner of the map (Figure 3 -11 A). The mode is then automatically switched back to Re-Center.
3.2.2 The Legend
The Legend is located in the bottom left corner of the map and is initially in its compressedhidden state. When opened, the legend provides the user with a quick glance at importantmap-related information:
• The type of clickable icons that mayappear on the map (Figure 3 - 12 A). Alldetectors, alerts, and traffic camera iconsare also clickable.
• A scale indicating the range of colors usedto illustrate levels of precipitation in theweather radar image. The light blue on theleft is the lightest level of precipitationwhile the dark purple on the right is theheaviest (Figure 3 - 12 B).
• An association between the colors of detector icons and the current average traffic
speeds monitored by that detector (Figure 3 - 12 C).
3.2.2.1 Viewing/Hiding the Legend. The legend can remain in its initial closed
state to reduce the amount of clutter on the screen or be fully expanded and visible when
desired. To do this, either:
• Click the Show Legend button in the bottom left corner of the map to make the legendvisible (Figure 3 - 10 E).
Figure 3 - 12: Legend for Traffic Map
A
B
A
B
C
D

8/3/2019 RITIS Website Technical Manual
http://slidepdf.com/reader/full/ritis-website-technical-manual 23/39
OR
• Click the Hide Legend button at the top of the legend overlay to make it retract andclose (Figure 3 - 12 D).
3.2.3 The Layer List
The Layer List is located in the upper right corner of the screen and is initially loaded in its
compact hidden state (Figure 3 - 10 B). When opened, this overlay provides access to thecontrols that manipulate each of the individual layers described in Table 3 - 2.
The ordering of the layers in this list determines the depth of that layer when it is displayedon the map. In other words, if icons from separate layers overlap when they are displayedon the map, the ordering of the layers in the Layer List determines which icon will bedisplayed on top of the other.
Note: The Weather Radar layer at the bottom of the list, when enabled, will always have itscontent on top of all other layers despite its unchanging position. The white background of this list entry indicates that it cannot be reordered like the other layers when adjustinglayer depth.
When a layer goes offline due to missing live data its associated icons will be removed fromthe map and an appropriate message displayed in the Layer List. When it comes backonline, the layer will revert to its previous state before going offline. If the Layer List isclosed when either a layer goes on or offline, the text of the Show Layer List button willchange to indicate what has happened until it is clicked to expand the list.
3.2.3.1 Viewing/Hiding the Layer List. The
Layer List can stay in its initial hidden state to
increase map visibility or be opened when access to
the layer controls are necessary. To do this, either:
• Click the Show Layer List button in the upper rightcorner of the map to make the list visible (Figure 3- 10 B).
OR
• Click the Hide Layer List button at the bottom of the list overlay to make it retract and close.(Figure 3 - 13 D).
3.2.3.2 Enabling/Disabling Layers.
Individual layers can either be disabled to remove all
of the associated map content or enabled to have it
displayed. To enable or disable a layer:
1) Click on the checkbox next to the layer name to
enable
or disable that particular layer (Figure 3 - 13 A).
3.2.3.3 Adjusting Layer Transparency. The transparency of all map content
associated with a particular layer can be set to one of five different percentage levels
(Figure 3 - 13 B). To adjust the transparency of a layer, either:
A
D
C
B
Figure 3 - 13: Open Layer List
E
8/3/2019 RITIS Website Technical Manual
http://slidepdf.com/reader/full/ritis-website-technical-manual 24/39
• Click the button to decrease the visibility of the layer content by making it moretransparent.
OR
• Click the button to increase the visibility of the layer content by making it lesstransparent.
3.2.3.4 Adjusting Layer Depth. The ordering of overlapping layer content, known
as layer depth, can be set by adjusting the order of the layers in the Layer List. Layers
higher in the list (closer to the top) will have their associated content displayed on top of
the content for layers lower in the list. To adjust the depth of a layer:
1) Move the mouse over the layer entry you wish to adjust in the list. It will turn yellow(Figure 3 - 13 C).
2) Click and hold the left mouse button down.3) Drag the layer entry either upwards or downwards to adjust its position in the list. The
other layers will automatically adjust their position and depth to give a preview of whatthe new ordering would look like.
4) Release the mouse button once the layer is in the desired position to set the ordering.
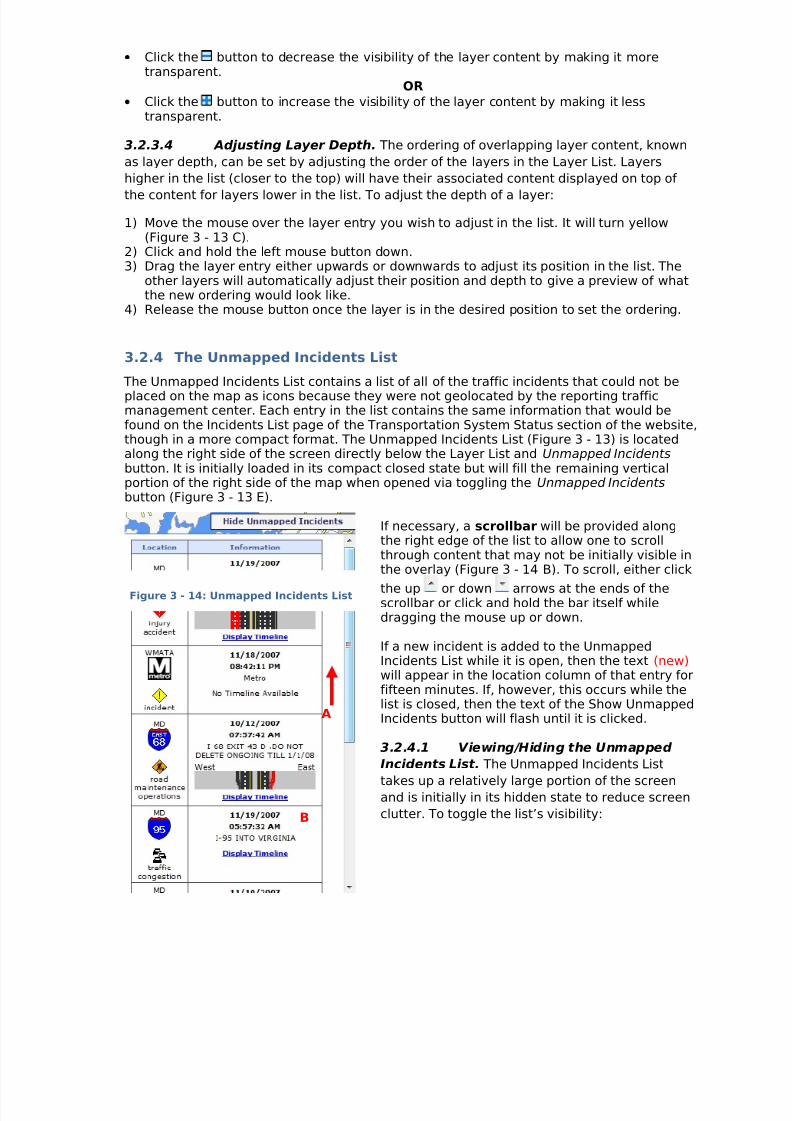
3.2.4 The Unmapped Incidents List
The Unmapped Incidents List contains a list of all of the traffic incidents that could not beplaced on the map as icons because they were not geolocated by the reporting trafficmanagement center. Each entry in the list contains the same information that would befound on the Incidents List page of the Transportation System Status section of the website,though in a more compact format. The Unmapped Incidents List (Figure 3 - 13) is locatedalong the right side of the screen directly below the Layer List and Unmapped Incidentsbutton. It is initially loaded in its compact closed state but will fill the remaining verticalportion of the right side of the map when opened via toggling the Unmapped Incidentsbutton (Figure 3 - 13 E).
If necessary, a scrollbar will be provided alongthe right edge of the list to allow one to scrollthrough content that may not be initially visible inthe overlay (Figure 3 - 14 B). To scroll, either click
the up or down arrows at the ends of thescrollbar or click and hold the bar itself whiledragging the mouse up or down.
If a new incident is added to the UnmappedIncidents List while it is open, then the text (new)will appear in the location column of that entry for
fifteen minutes. If, however, this occurs while thelist is closed, then the text of the Show UnmappedIncidents button will flash until it is clicked.
3.2.4.1 Viewing/Hiding the Unmapped
Incidents List. The Unmapped Incidents List
takes up a relatively large portion of the screen
and is initially in its hidden state to reduce screen
clutter. To toggle the list’s visibility:
Figure 3 - 14: Unmapped Incidents List
A
B
8/3/2019 RITIS Website Technical Manual
http://slidepdf.com/reader/full/ritis-website-technical-manual 25/39
1) Click the button labeled either Showor Hide Unmapped Incidents on the right sideof the screen (Figure 3 -14 A) to make theUnmapped Incident List(Figure 3 - 14) appear ordisappear below
appropriately. 3.2.4.2 Sorting the List. The list of unmapped incidents can be sorted by the
location, type, time, and state parameters that are visible as links above the top of the
table containing the data. To sort the list:
1) Click the desired link at the very top of thelist to sort the data in ascending order by thatcategory.2) If desired, click the link to toggle betweenascending ↑ and decreasing ↓ order for thesort.
3.2.5 Accessing Detailed Information from Icons
All icons visible on the map, except those indicating road names or metro rails, aregeolocated symbols that give some indication of what current information is being gatheredconcerning that area. In addition, all icons referred to above can be clicked in order to openan in-map semi-transparent popup window explaining the details associated with that icon(e.g. exact traffic detector measurements). Sections 3.2.5.3 – 3.2.5.5 explain the differenttypes of informational popup windows that can be accessed from traffic map icons.
When an icon is first placed on the map for an incident within the last fifteen minutes, it will
blink to indicate its new status. Unless otherwise noted, popup windows display liveinformation and are updated on frequent intervals alongside the icons on the map.
Note: The popup windows referred to throughout section 3.2.5, unless explicitly stated,are really just formatted tables of information opened within the map application itself andare not actual browser popup windows.
3.2.5.1 Opening/Closing Information Popups. All clickable icons on the map have
additional hidden data that can be made opened or closed at any time, and will remain
opened regardless of layer status. To do this, either:
•
Click the desired icon to open a semi-transparent popup window containing additionalrelated information.OR
• Click the in the upper right corner of an open information popup window to close it(Figure 3 - 15 A).
Warning: Changing the zoom level of the map in either direction will automatically close allopen information popup windows. Take care not to accidentally scroll the mouse wheel andcause popups to be temporarily lost.
8/3/2019 RITIS Website Technical Manual
http://slidepdf.com/reader/full/ritis-website-technical-manual 26/39
3.2.5.2 Moving Information Popups. All popup windows are initially opened with a
corner touching the icon that triggered it (Figure 3 - 15 C), though they can be moved to
anywhere on the map. To move an open popup window, either:
1) Move the mouse to an empty portion of the title bar of the popup to be moved (Figure 3- 15 B), not the .
2) Click and hold the left mouse button down.3) Drag the mouse, and now also the popup window, to the desired location on the map.
4) Release the mouse button to place the popup.OR
1) Click the icon associated with an open popup to instantly move the window back to itsoriginal position.
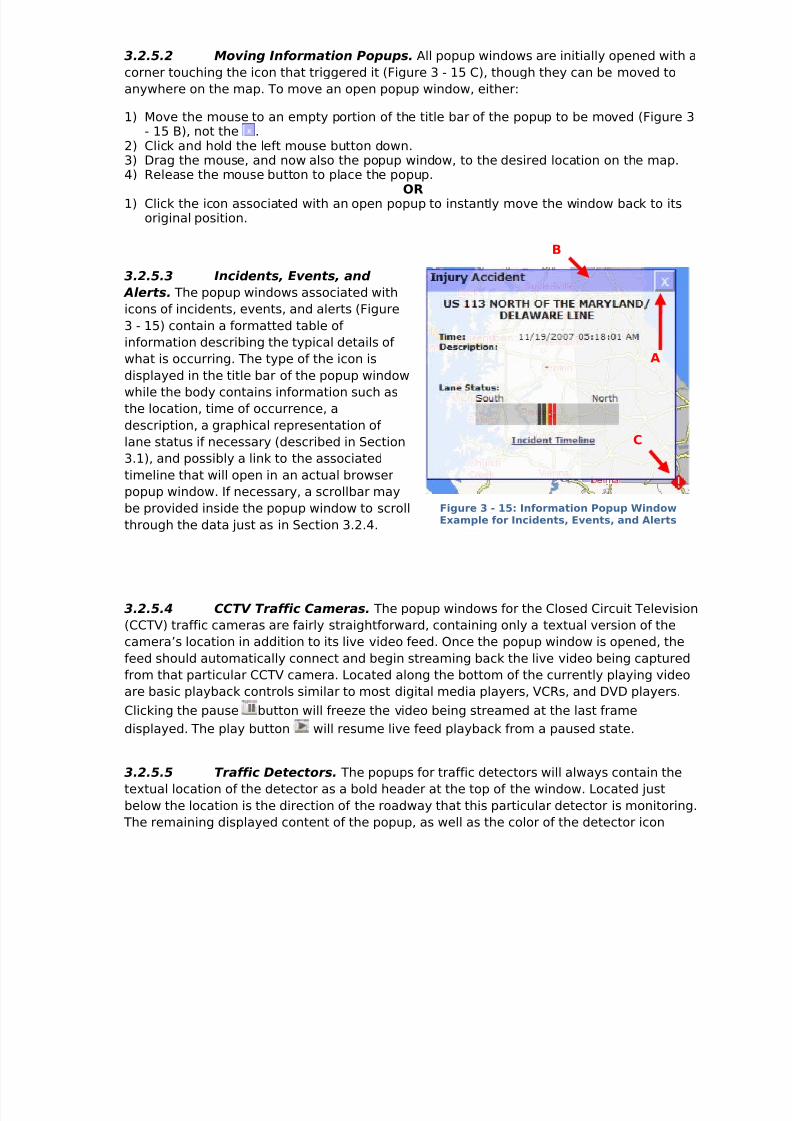
3.2.5.3 Incidents, Events, and
Alerts. The popup windows associated with
icons of incidents, events, and alerts (Figure
3 - 15) contain a formatted table of
information describing the typical details of what is occurring. The type of the icon is
displayed in the title bar of the popup window
while the body contains information such as
the location, time of occurrence, a
description, a graphical representation of
lane status if necessary (described in Section
3.1), and possibly a link to the associated
timeline that will open in an actual browser
popup window. If necessary, a scrollbar may
be provided inside the popup window to scroll
through the data just as in Section 3.2.4.
3.2.5.4 CCTV Traffic Cameras. The popup windows for the Closed Circuit Television
(CCTV) traffic cameras are fairly straightforward, containing only a textual version of the
camera’s location in addition to its live video feed. Once the popup window is opened, the
feed should automatically connect and begin streaming back the live video being captured
from that particular CCTV camera. Located along the bottom of the currently playing video
are basic playback controls similar to most digital media players, VCRs, and DVD players.
Clicking the pause button will freeze the video being streamed at the last frame
displayed. The play button will resume live feed playback from a paused state.
3.2.5.5 Traffic Detectors. The popups for traffic detectors will always contain the
textual location of the detector as a bold header at the top of the window. Located just
below the location is the direction of the roadway that this particular detector is monitoring.
The remaining displayed content of the popup, as well as the color of the detector icon
Figure 3 - 15: Information Popup Window
Example for Incidents, Events, and Alerts
C
A
B

8/3/2019 RITIS Website Technical Manual
http://slidepdf.com/reader/full/ritis-website-technical-manual 27/39
itself, will vary based on the status of the detector examined. The detector popups are
automatically resized based on the latest available data and thus should never require a
scrollbar in order to view the entirety of its content. The different types of detectors and
popups are described below:
Figure 3 - 16: The Three types of Traffic Detector Popup Windows
• Colored Detectors: All non-grey colored detector icons have received valid data withinthe last fifteen minutes and will display a summary of the last updated time, averagespeed, and average volume of the traffic passing this point (Figure 3 - 16 A). A smallgraph depicting this detector’s measured speed and volume of traffic over the past
twelve hours will appear in the popup window below the summary (Figure 3 - 16 B). Thissmaller graph can be clicked to open an expanded version in a new opaque popupwindow for easier viewing. The color of the detector is determined by the currentaverage speed reading as indicated on the map legend (described in Section 3.2.2) andstated below:
• : Current average speed reading > 50 mph
• : Current average speed reading 30 – 50 mph
• : Current average speed reading 0 – 30 mph
• Grey Detectors: A detector will turn grey once it has not received valid data for fifteenminutes. When this occurs, the summary of live speed and volume measurements in thepopup window is replaced by a red message indicating the time that valid data was last
received (Figure 3 - 16 C). However, the small graph depicting collected traffic data overthe last twelve hours will remain visible and functional in these popup windows just asdescribed above for colored detectors. Only when the grey detector has not receivedvalid data over the past twelve hours will the graph also be removed from the popup(Figure 3 - 16 D).
• : Current average speed data unavailable
A: Normal Colored C: Grey Detector with
Valid Data Older than
D: Normal Colored
B
8/3/2019 RITIS Website Technical Manual
http://slidepdf.com/reader/full/ritis-website-technical-manual 28/39
4 Address Book
The address book is designed to be a reference guide for the major response units in the
DC-MD-VA area. The list includes police officers, fire fighters and utility/maintenance
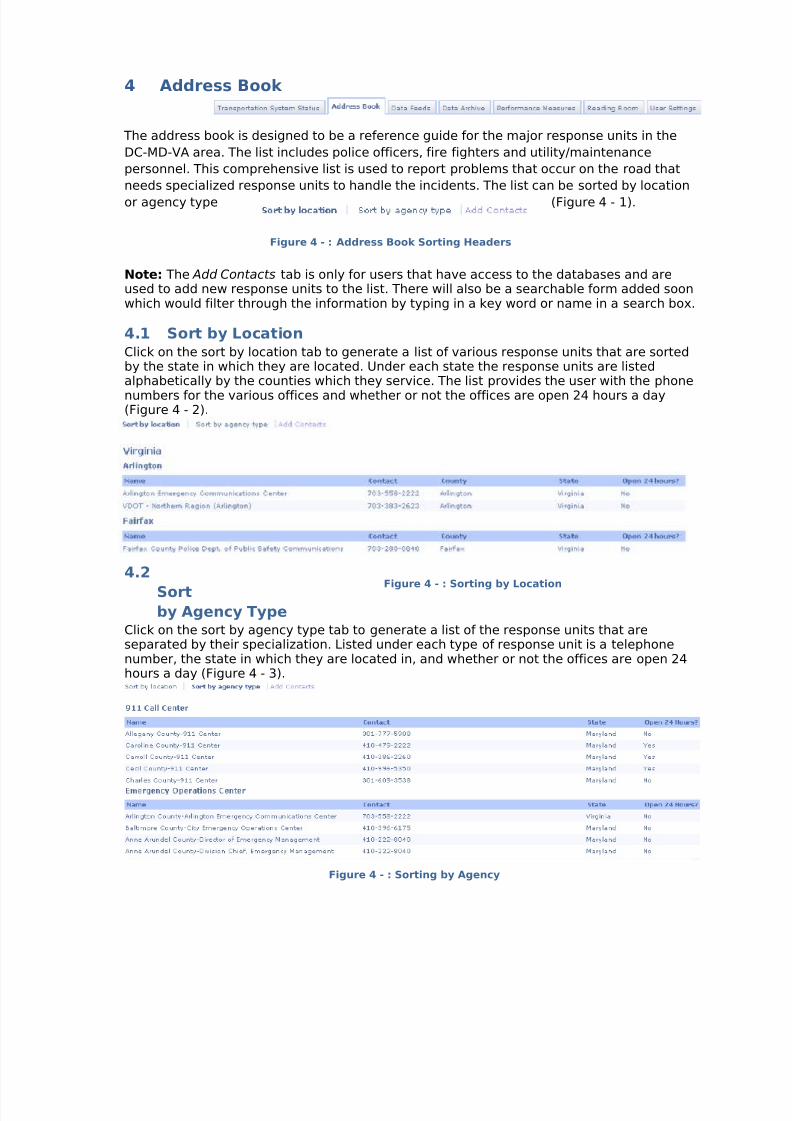
personnel. This comprehensive list is used to report problems that occur on the road thatneeds specialized response units to handle the incidents. The list can be sorted by location
or agency type (Figure 4 - 1).
Note: The Add Contacts tab is only for users that have access to the databases and areused to add new response units to the list. There will also be a searchable form added soonwhich would filter through the information by typing in a key word or name in a search box.
4.1 Sort by LocationClick on the sort by location tab to generate a list of various response units that are sortedby the state in which they are located. Under each state the response units are listedalphabetically by the counties which they service. The list provides the user with the phonenumbers for the various offices and whether or not the offices are open 24 hours a day(Figure 4 - 2).
4.2
Sort
by Agency TypeClick on the sort by agency type tab to generate a list of the response units that areseparated by their specialization. Listed under each type of response unit is a telephonenumber, the state in which they are located in, and whether or not the offices are open 24hours a day (Figure 4 - 3).
Figure 4 - : Address Book Sorting Headers
Figure 4 - : Sorting by Location
Figure 4 - : Sorting by Agency
8/3/2019 RITIS Website Technical Manual
http://slidepdf.com/reader/full/ritis-website-technical-manual 29/39
5 Data Feeds
Important: The Data Feeds section of the website is currently under construction and thuscannot be explained in this version of the manual.
When completed, this section of the website will offer a basic description of the available
data feeds that the RITIS project is receiving, including the various traffic data and incidentdata feeds from different traffic management centers as well as the weather advisories withDoppler radar from the National Weather Service. It will include information about how thedata feeds are formatted, if they are available for use, and also how to subscribe them. Aninteractive form allowing users to actually subscribe to the data feeds from this page of thesite may also be included.
6 Data Archive
The Data Archive section of the RITIS Website provides the region’s transportationoperation and research community with a powerful set of tools for both querying the
archive of information gathered from the various areas and performing secondary analysison the returned results. The archived transportation-related data collaborated fromdifferent agencies around the Washington Metropolitan area will serve as a rich source forboth traditional and innovative regional transportation analyses. In addition, the informationstored in the archives is a valuable record of decisions made and actions taken in responseto incidents and other scenarios that have occurred throughout this region.
Clicking on the Data Archive link will open the Incident Data Query Tool page by default,which is described further in Section 6.1. The Traffic Data Query Tool, described in Section6.2, can be accessed by clicking The Traffic Data Query Tool link just underneath the Data
Archive link header. As of this time, the Large Dataset Download subsection of the DataArchive Is under construction and will not be discussed in this version of the manual.
Warning: Both of the query tools mentioned in Section 6 of the manual are Adobe FlashApplications that require the free installation of Adobe Flash Player 9 or higher to properlyfunction. The latest version of the Flash Player client software can be found at:http://www.adobe.com/products/flashplayer/
6.1 Incident Data Query Tool
The Incident Data Query Tool is a part of the interface system that allows traffic engineersand researchers to easily browse through and visualize all of the incident-relatedinformation that has been consolidated in the RITIS data archives. Through the variousoptions available, analysts can quickly retrieve sets of data based on the different specifiedlevels of spatial and temporal aggregation. In other words, information can easily beaccessed in groups that are based on the time and/or location in which the incidents hadoccurred.
Warning: This tool will not function properly unless popup windows are enabled in yourinternet browser. See your browser documentation for information on how to enable popupwindows.

8/3/2019 RITIS Website Technical Manual
http://slidepdf.com/reader/full/ritis-website-technical-manual 30/39
6.1.1 Querying (Searching) the Incident Data Archive
The query form of the tool allows the user to send a request to the database for specificinformation to be returned (i.e. to search through the database). Through its differentpanels, a user can select the format and options of the data being returned. The number of results can be narrowed by specifying the source database of the information and selecting
a specific time and place of occurrence. To query the archive click on the Query tab at thetop of the tool, then:
6.1.1.1 Set the Data Selections. Specify the source of the data queried and the
format of the results:
1) Click on the name of the database which most likely contains the desired information inthe Databases panel of the query tool (Figure 6 - 1 A). The database that is currentlyselected will be indicated with a light blue rectangular background to the text. Thedatabases are:
a. (CHART) Maryland Coordinated Highways Action Response Team
b. (VDOT) Virginia Department of Transportationc. (DDOT) District Department of Transportation (Washington D.C.)
2) Click anywhere on the Display Results As drop-downmenu to expand the list of possible formats the datacan be returned as (Figure 6 - 1 B).
3) Click on the data format you want to select for theresults.
Important: The information can be returned as a table,viewed as 2-dimensional or 3-dimensional graphs, or
downloaded in either Excel or CSV format. If the format isselected to be a 2-D or 3-D Graph then the Graph Optionspanel will appear and readers should skip ahead to step6. Otherwise, if a non-graph format is selected, readersshould complete steps 4 and 5, then skip ahead to step12 without completing any of section 6.1.1.2.
4) Click on the Data drop-down menu (Figure 6 - 1 C).5) Click on the appropriate name to select whether data should include all traffic-related
events (such as baseball games) or only trafficincidents.
6.1.1.2 Set the Graph Options. If a graph will be
returned, specify the type and units of data for the axes
of the graph:
6) Click on the X-Axisdrop-down menuto expand it(Figure 6 - 2 A).
7) Click on the desired measurement from the list to beplotted on this axis of the returned graph.
Figure 6 - 1: Data Selections
B
C
A
C
B
A
Figure 6 - 2: Graph Options

8/3/2019 RITIS Website Technical Manual
http://slidepdf.com/reader/full/ritis-website-technical-manual 31/39
8) If a new drop-down menu appears underneath your axis selection, click on it to view thelist of possible unit types.
9) Click on the desired unit of measurement for the axis(Figure 6 - 2 B).
10) Repeat steps 6 - 8 for the y-axis drop-down menu(Figure 6 - 2 C).
11) If a 3D-Graph is to be returned, repeat steps 6 - 8 for the z-axis drop-down menu.
6.1.1.3 Set the Filters. To narrow the number of
returned results by their location and time of occurrence:
12) Click on the Corridor drop-down menu button toexpand its options (Figure 6 - 3 A). A scrollbar isprovided to allow one to scroll through all possibleoptions (Figure 6 - 3 B). If necessary, see Section 3.2.4for more information on using scrollbars.
13) Click to select the desired road that all returnedincidents will have occurred on.
14) If the desired road is not present in the menu, select
Other… at the bottom, and type the name of the roadused to narrow results in the Corridor text field (Figure6 - 3 C).
15) Click anywhere inside the From field (Figure 6 - 4 A)to make the calendar appear just to the right.
16) Use the calendar to select the earliest date for possiblereturned incidents (Figure 6 - 4 B).
a. Click the left and right arrows in the title bar to adjust the month. Leftmoves toward January, Right toward December.b. Click the small black up and down arrows in the title bar to adjust the year.c. Click on the number of the day you wish to select.
17) Click anywhere inside the To field located just below the From field.18) Use the calendar, as in step 16 above, to select the latest date for possible returned
incidents.
19) Click the checkboxes on or off to select whether or not holidays and/or test
events should be excluded from the results (Figure 6 - 4 C). The on setting willexclude/omit the specified data.
20) Click the Submit button to query the database with all of the options just set.
Note: If any parameters areinconsistent or invalid, such ashaving the From date set laterthan the To date, an error
message will popup indicatingthe problem. If this occurs, click theok button, make the necessarychanges to resolve the problem, andresubmit the query.
Figure 6 - 3: Filters
A
BC

8/3/2019 RITIS Website Technical Manual
http://slidepdf.com/reader/full/ritis-website-technical-manual 32/39
6.1.2 Using the Table of Results
The results of a query to the database are usually returned in a tabular format so that theycan be sorted in various ways and the individual incident data further examined. To viewthe table of results returned from a query, click the Table tab located just to the right of theQuery tab at the very top of the tool.
Note: The tool automatically switches to the Table tab when the submit button is firstclicked for a query.
6.1.2.1 Sorting Incidents. The returned list of incidents can be sorted by the
source, event type, location, time opened , time closed, and duration parameters that are
specified as headers in the table. To sort:
1) Move the mouse over the header at the top of the column of the category you wish to
sort the data by. The background of the category header will change to blue as themouse hovers over it.2) Click the header to sort the data in ascending order by that category. (Figure 6 - 5 A).3) If desired, click the header to toggle between ascending ↑ and decreasing ↓ order for
the sort.
6.1.2.2 Examining Individual Incident Data. Each incident may or may not have an
associated event log, response table, and/or a timeline that can be accessed through this table. To further
examine an incident:
1) Click on the particular incident in the table that you wish to examine. It will turn blue toindicate that it is selected.
2) Click on the desired button at the bottom of the table to view that particular incident’sevent log, response table, or timeline (Figure 6 - 5 B).
a. A popup window will open with the desired informationb. Both the event log and response table can be sorted, saved, and printed in the
same manner as the general table of results just discussed.c. The popup can be closed by clicking the X in the top right corner of the popup
window.
Note: Clicking a button at the bottom of the results table without first selecting an incident,or when selecting an incident with missing information, will result in an error messageappearing on screen. If this occurs, click the ok button to return to the table.
AB
C
Figure 6 - 4: Filters with Calendar

8/3/2019 RITIS Website Technical Manual
http://slidepdf.com/reader/full/ritis-website-technical-manual 33/39
6.1.3 Printing & Saving InformationIn the results table, event log, response table, and other sections of the Incident Data Query
Tool, the current information being displayed can be downloaded and saved into a file of two different formats or transformed into a printer-friendly version for printing.
6.1.3.1 Printing Information. Information that can be transformed into a printer-
friendly version for printing will have a printer icon visible at the top (Figure 6 - 5 D). To
print available information:
1) Click on the printer icon located at the top (Figure 6 - 5 D). A popup window will openwith the data displayed in a printer-friendly format.
2) Right-Click anywhere inside the newly opened popup window.3) Click on the Print option.4) A computer-specific printing prompt will appear. Generally, select Ok or Print to begin
printing.
6.1.3.2 Saving Information. Data that can be saved into a file will have a disk icon
(Figure 6 - 5 C). To save:
1) Click on the disc icon located just above the table of data being saved (Figure 6 - 5 C). Apopup with save options will appear on the screen (Figure6 - 6).
3) Click on the Select File Type drop-down menu to view the
list of possible save formats (Figure 6 - 6 A).4) Click on the desired format of the saved file to select it.5) Click the Ok button (Figure 6 - 6 C).6) A browser-specific download prompt will appear.
Note: Click the cancel button or the X in the top right cornerof the save popup window (Figure 6 - 6 B) to cancel the savingprocess and close the popup window at any time.
C AD
Figure 6 - 5: Table of Results
Figure 6 - 6: Save Popup
B
BA
C

8/3/2019 RITIS Website Technical Manual
http://slidepdf.com/reader/full/ritis-website-technical-manual 34/39
6.2 Traffic Data Query Tool
Important: The Traffic Data Query Tool was not functioning properly at the time of writingthis version of the manual. Its usage will be explained in the final version of the RITIS
Technical Manual.

8/3/2019 RITIS Website Technical Manual
http://slidepdf.com/reader/full/ritis-website-technical-manual 35/39
7 Performance Measures
The Performance Measures is an important tool that is used to generate reports on pasttraffic data. It features an interactive module that allows for easy access various types of data and is simple to navigate. It can generate reports based upon a date interval and ituses this to compare traffic history. This tool accesses a large database that storesinformation on traffic up to five years ago. This tool is helpful in comparing past traffic datato the present data.
7.1 Generating a Report1) Click a tab on the module to select the region desired (Figure 7 - 1). This will then
display two drop down menus which will sort the data that would like to have a reporton.
7.2
Pre-generated Report1) Select a year by clicking on the number of a year (Figure 7 - 2 A) on the pre-generated
report window to access data from that specific year that you selected.2) Press Submit (Figure 7 - 2 B) to generate a report on that year.
7.3 Selecting the data range
1) Click on the icon next to the From text box (Figure 7 - 2 C) and a calendar will bedisplayed (Figure 7 - 3).
2) Select a date by using the left and right arrows (Figure 7 - 3 A) to navigate between themonths and the up and down arrows (Figure 7 - 3 B) to navigate through the years. Withthe mouse click on the date desired and this will be the starting date of the report.
3) Repeat this process in the text box labeled To so that an end date will be selected.
Figure 7 - : Performance Measure Divisions
Figure 7 - : Specifying the Performance Time Period
B
C
A
8/3/2019 RITIS Website Technical Manual
http://slidepdf.com/reader/full/ritis-website-technical-manual 36/39
4) Press Submit (Figure 7 - 2 B) to generate a report thatshows traffic data based on your starting and endingdate.
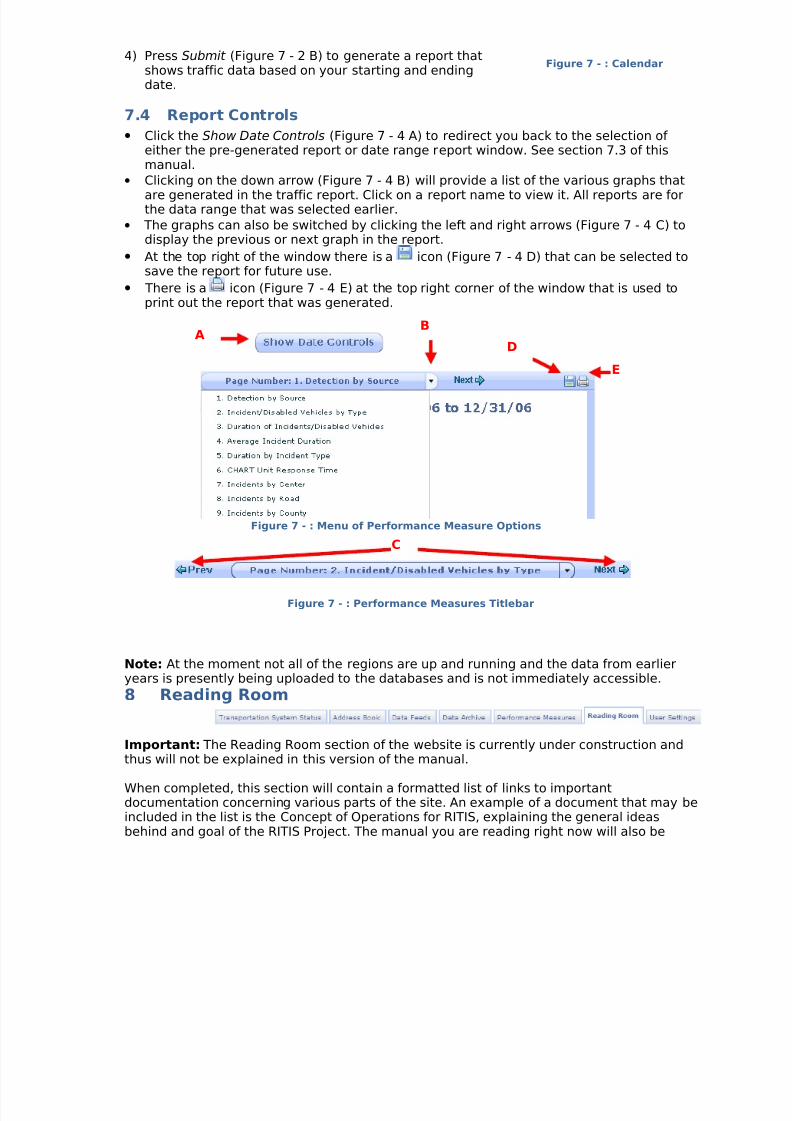
7.4 Report Controls
• Click the Show Date Controls (Figure 7 - 4 A) to redirect you back to the selection of either the pre-generated report or date range report window. See section 7.3 of thismanual.
• Clicking on the down arrow (Figure 7 - 4 B) will provide a list of the various graphs thatare generated in the traffic report. Click on a report name to view it. All reports are forthe data range that was selected earlier.
• The graphs can also be switched by clicking the left and right arrows (Figure 7 - 4 C) todisplay the previous or next graph in the report.
• At the top right of the window there is a icon (Figure 7 - 4 D) that can be selected tosave the report for future use.
• There is a icon (Figure 7 - 4 E) at the top right corner of the window that is used toprint out the report that was generated.
Note: At the moment not all of the regions are up and running and the data from earlieryears is presently being uploaded to the databases and is not immediately accessible.
8 Reading Room
Important: The Reading Room section of the website is currently under construction andthus will not be explained in this version of the manual.
When completed, this section will contain a formatted list of links to importantdocumentation concerning various parts of the site. An example of a document that may beincluded in the list is the Concept of Operations for RITIS, explaining the general ideasbehind and goal of the RITIS Project. The manual you are reading right now will also be
Figure 7 - : Calendar
Figure 7 - : Menu of Performance Measure Options
Figure 7 - : Performance Measures Titlebar
D
E
A
C
B
8/3/2019 RITIS Website Technical Manual
http://slidepdf.com/reader/full/ritis-website-technical-manual 37/39
posted here. Though the list will most likely not be very long, it will include options to sortthe document entries.
9 User Settings
The user settings feature on this website is designed for those who wish to change theirpassword. It is also for administrators that have full access to the databases to edit ordelete registered users of the website. The user settings will be further developed so thatsettings for the incident map will also be saved.
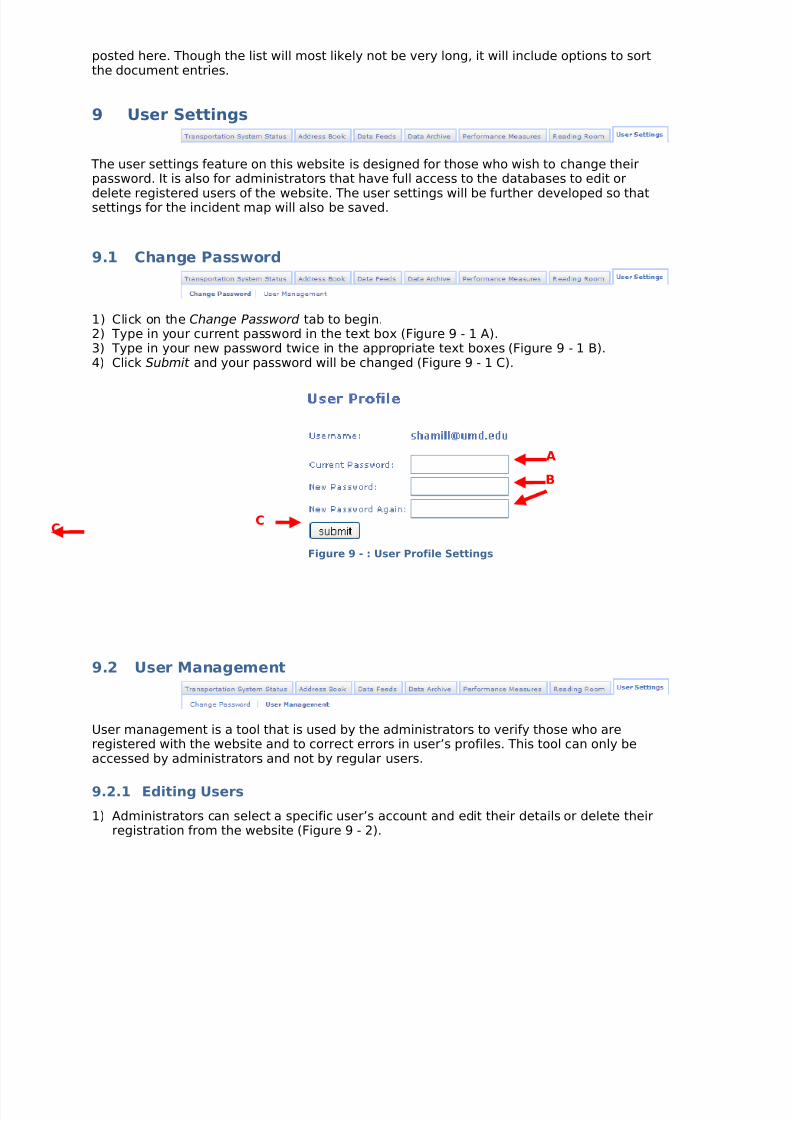
9.1 Change Password
1) Click on the Change Password tab to begin.2) Type in your current password in the text box (Figure 9 - 1 A).
3) Type in your new password twice in the appropriate text boxes (Figure 9 - 1 B).4) Click Submit and your password will be changed (Figure 9 - 1 C).
9.2 User Management
User management is a tool that is used by the administrators to verify those who areregistered with the website and to correct errors in user’s profiles. This tool can only beaccessed by administrators and not by regular users.
9.2.1 Editing Users
1) Administrators can select a specific user’s account and edit their details or delete theirregistration from the website (Figure 9 - 2).
A
B
Figure 9 - : User Profile Settings
C

8/3/2019 RITIS Website Technical Manual
http://slidepdf.com/reader/full/ritis-website-technical-manual 38/39
9.2.2 Creating a New User
2) Administrations can also create a new user by entering in a username, full name, accesslevel, and password (Figure 9 - 3). Regular users do not have access to create newaccounts.
• Registered users have 3 different access levels; guest, privileged, and admin (Figure 9 -
4).
• This is done to make sure that regular users cannot change settings on the databases
and that guests do not have access to the privileged information.
Figure 9 - : Editing Users
Figure 9 - : Adding New Users
Figure 9 - : AccessLevels
8/3/2019 RITIS Website Technical Manual
http://slidepdf.com/reader/full/ritis-website-technical-manual 39/39
10 Appendix
10.1 Glossary
Address Book – Reference guide for major response units
CATT – Center for Advanced Transportation Technology
Data Archive – Archive of traffic-related information
Data Feeds – Basic feeds of traffic and incident data
Incident Data Query Tool – Search engine for incident-related information
Incidents List – Provides most recent incidents in Metro area
Performance Measures – Generates reports based on traffic history
Reading Room – Place for links and references on traffic data
RITIS – Regional Integrated Transportation Information System
Traffic Data Query Tool – Search engine for traffic-related information
Traffic Map – Visual interactive description of traffic-related information
Transportation System Status – Interface for real-time traffic-related information
User Settings – Helps the user feel more comfortable with website