riverbed extraction and physico-chemical parameters … extraction and physico... · riverbed...
TRANSCRIPT

RIVERBED EXTRACTION AND PHYSICO-CHEMICAL
PARAMETERS OF TINAU RIVER, NEPAL.
KHET RAJ DAHAL1*, SUBODH SHARMA2 , ROSHAN MAN BAJRACHARYA3
1*. Ph. D. Scholar, Kathmandu University, Dhulikhel, Kavre, Nepal.
2. Professor, Kathmandu University, Dhulikhel, Kavre, Nepal.
3. Professor, Kathmandu University, Dhulikhel, Kavre, Nepal.
Author of Correspondance: Khet Raj Dahal.
E-mail of Corresponding Author: [email protected]

OUTLINE OF THE PRESENTATION
• INTRODUCTION
• MATERIALS AND METHODS
• RESULTS AND DISCUSSIONS
• CONCLUSIONS
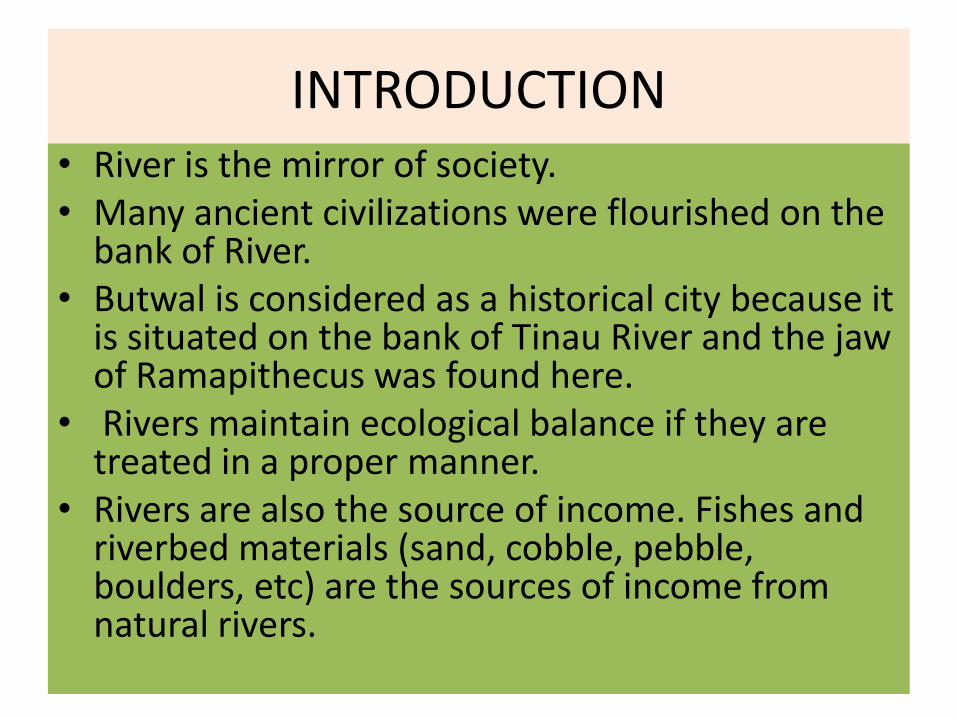
INTRODUCTION • River is the mirror of society. • Many ancient civilizations were flourished on the
bank of River. • Butwal is considered as a historical city because it
is situated on the bank of Tinau River and the jaw of Ramapithecus was found here.
• Rivers maintain ecological balance if they are treated in a proper manner.
• Rivers are also the source of income. Fishes and riverbed materials (sand, cobble, pebble, boulders, etc) are the sources of income from natural rivers.

INTRODUCTION…….. • Bio-diversity of the aquatic environment and the physico-chemical parameters
are inter-related.
• In an aquatic ecosystem, zoo-planktons play an important role.
• Fishes eat zooplanktons as their favorite food. These are the environmental sensitive and show the changes if there is any disturbances in their habitat.
• For example, if there is any disturbance in their habitat, zoo-planktons change their species and number.
• Thus the change in abundance, species and communities is an indication of aquatic habitat disturbance (Sharma et al., 1999).
• Similarly these ecosystems can be adversely impacted by other factors too.
• If there is any health stressor in the aquatic environment, it can deteriorate the bio-diversity of the environment (O.K. Adeyemo et al., 2008).

INTRODUCTION……..
• Riverbed extraction can destroy the vegetative cover of the banks.
• The vegetative cover provides the shelter for many aquatic lives.
• It also protects the river banks and pollution directly entering into the river.
• The extraction of riverbed materials can change the river morphology in the long run (htpp://www.riverbeb_mining_guidelines).

MATERIALS AND METHODS • Selection of the reach of the River • Selection of sampling stations • Selection of seasons: June, September, December
and March • Selection of the parameter : EC, Pb, Fe, NH4, P,
NO3, As, and TDS • Used SPSS 15 for analysis • collected data from concerned agency for income
generation from the RBMs (i.e. DDC, VDCs, Municipalities, Crusher
Associations)

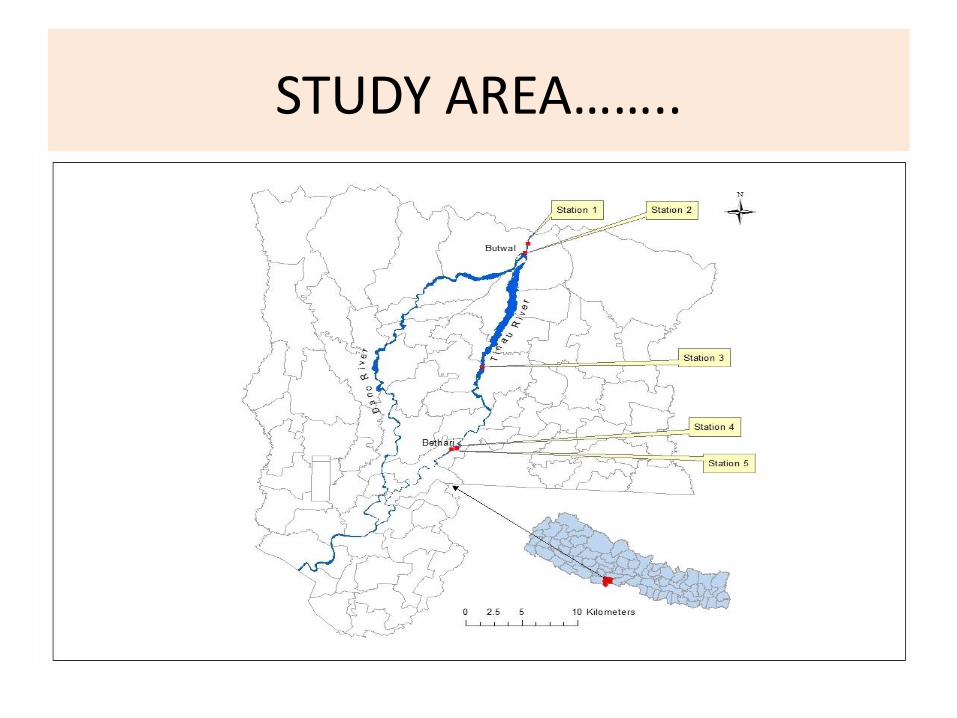
STUDY AREA
• The study was carried out in the Tinau River, Rupandehi District, Western Development Region of Nepal.
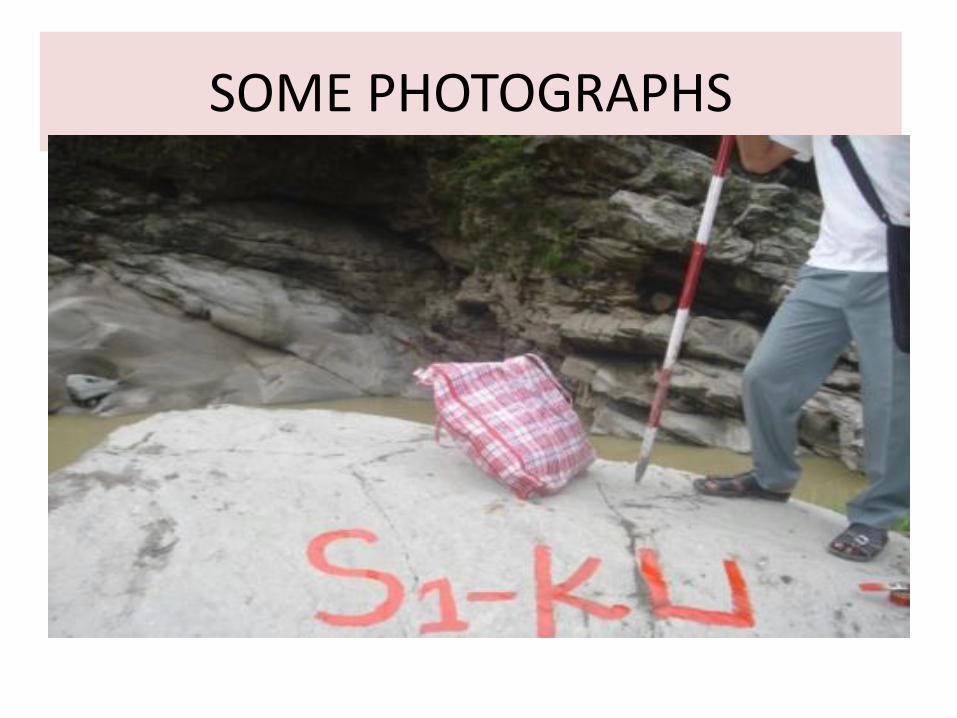
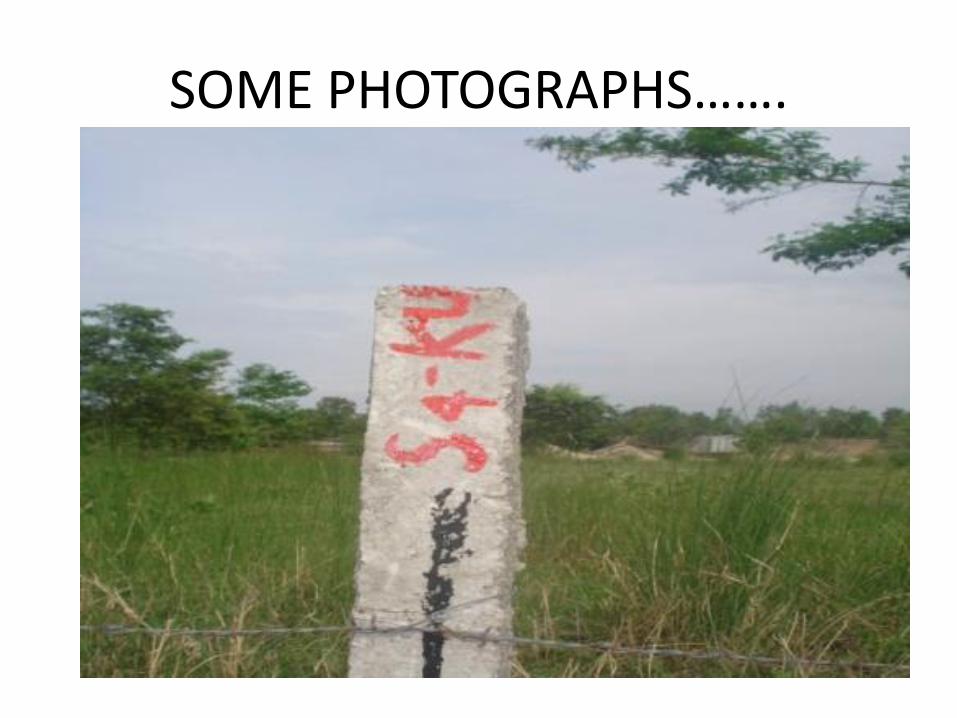
• The stations were marked with red enamel paint From S1-KU to S5- KU .

STUDY AREA……..
STUDY AREA……..
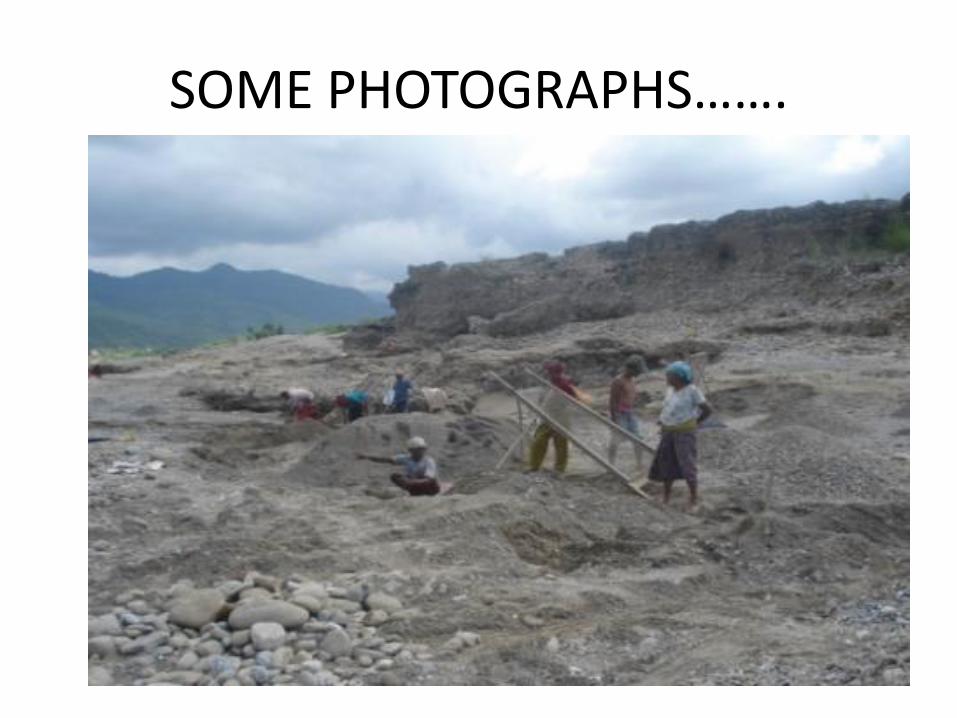
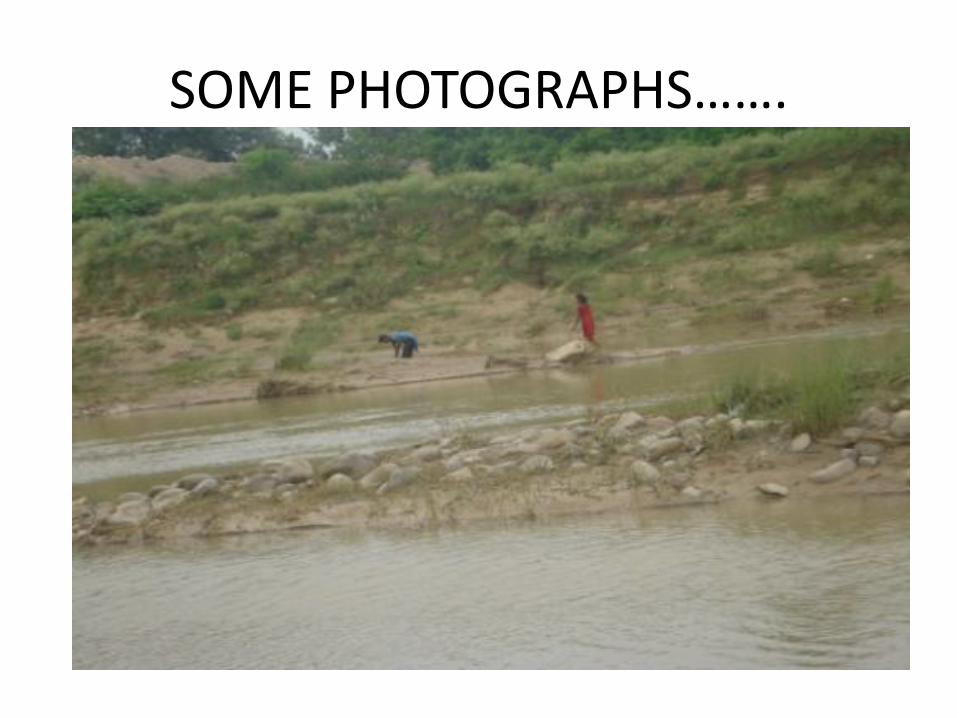
SOME PHOTOGRAPHS

SOME PHOTOGRAPHS……..

SOME PHOTOGRAPHS…….

SOME PHOTOGRAPHS……

SOME PHOTOGRAPHS…….

SOME PHOTOGRAPHS…….
SOME PHOTOGRAPHS…….
SOME PHOTOGRAPHS…….

SOME PHOTOGRAPHS…….
SOME PHOTOGRAPHS…….

RESULTS AND DISCUSSIONS
82
84
86
88
90
92
94
96
98
100
June September December March
μ S
/cm
Season
ELECTRICAL CONDUCTIVITY
Station 1
Station 2
Station 3
Station 4
Station 5

EC ……
• The result shows that the values of EC are greater in station 5 in all seasons. And it has also showed that the values of EC are in similar increasing order from station 1 to station 5 in all seasons.

EC….. • EC ranges 88 μ S/cm to 98 μ S/cm with an overall mean of 94 μ S/cm. Statistical
calculation has showed that the seasonal variance of the value is 0.798, which is statistically not significant.
• The EC has a negative correlation with P, As and positive correlation with Pb, pH, Fe, NH4, NO3 and TDS. But the degree of correlation is very poor and statistically these are not -significant.
• Generally the EC of river water increases if there is high concentration of salt solution. Poor irrigation management industrial effluent discharges and runoff can be the major sources of EC in natural streams or rivers
• Tinau is located at the side of Butwal city and the municipal sewerage system joins to the River without any treatment. Thus there is a great possibility of dissolved salts coming from the different sources into the river system.
• Jha (2006) measured the EC 72.3 μ S/cm. But the measurement of EC was done in this study and found 94 μ S/cm.
• The permissible limit of EC in natural water as recommended by Stevens Water Monitoring Systems is between 0.001 to 0.1 S/m.
• There may be various causes of increment of EC. But one of the major causes is regarded as massive riverbed extraction.

Pb
0
0.01
0.02
0.03
0.04
0.05
0.06
0.07
0.08
June September December March
mg/
l
Season
LEAD
Station 1
Station 2
Station 3
Station 4
Station 5

Pb….
• The value of Lead is maximum in season 3 (December) of station 5. The minimum value is in station -1 of season- 4 (March).
• Statistical calculation has shown that the value of Pb ranges from 0.008 to 0.075 mg/l with a minimum value of 0.023 mg/l.
• Pb negatively correlates with P, pH, Fe, As, and positively correlates with EC, NH4, NO3, and TDS. It has strong negative correlation with P.
• The seasonal variance of Pb is 0.01, which is significant. Similarly the site specific variance of Pb is 0.413, which is not significant.
• Pb is poisonous. The source of Pb is pesticides, petrol and other insecticides. There are various causes of increase of Pb in the Tinau River, but one of the causes is considered as the increase in riverbed extraction.
• WHO's standard has prescribed the permissible limit of Pb in drinking water is 0.01 mg/l. But it has not still recommended the permissible value of Pb in fresh water bodies (WHO, 1993).
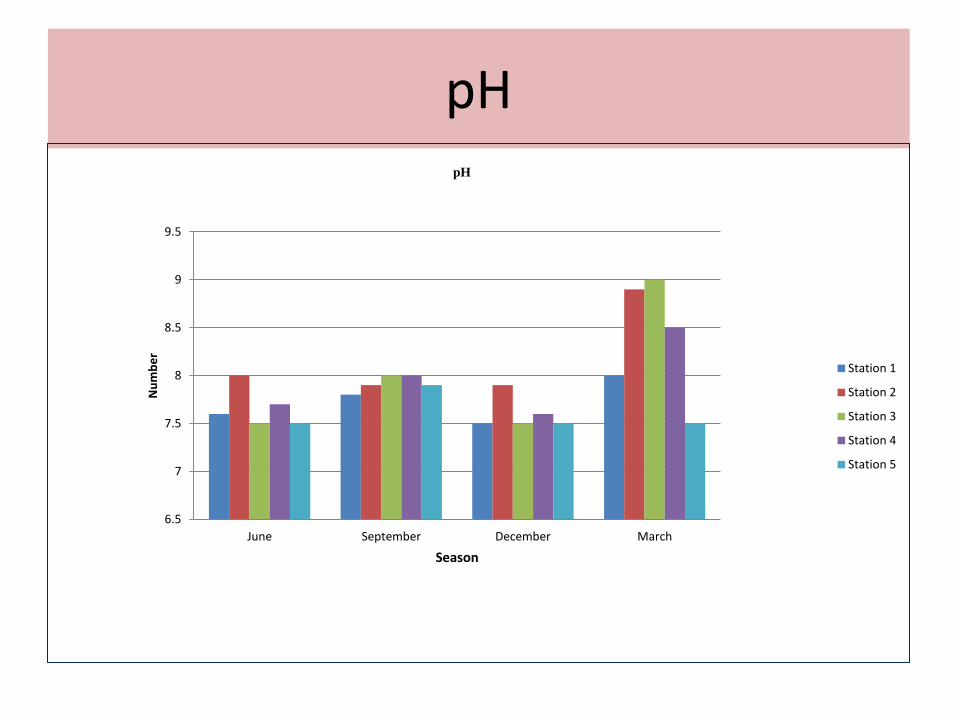
pH
6.5
7
7.5
8
8.5
9
9.5
June September December March
Nu
mb
er
Season
pH
Station 1
Station 2
Station 3
Station 4
Station 5

pH…. • The pH of the sample differs from station to station.
But the highest value is in the month of March. • Statistical calculation has shown that the pH ranges
from 7.5 to 9 with an overall mean of 7.89. • The seasonal test of variance is 0.01, which is
statistically significant. • pH positively correlates with EC, Fe, NH4, P, NO3, As
and negatively correlates with Pb and TDS. • The site specific variance of Ph is calculated as 0.413,
which is statistically not significant. • pH affects organisms of river water(Wang et al., 2002).
pH value between 6.5 - 8.2 is recommended for sustainable life of river organisms (Murdoch et al., 2001).

pH….
Jha (2006) measured the pH value 8.5 in the same station of the Tinau River. Now the average value is 7.89.
The substrate was massively extracted during the study period of Jha (2004-2005).
Sharma (1996) measured the average pH 8.29 at the same station of the Tinau River.

Fe
0
0.1
0.2
0.3
0.4
0.5
0.6
0.7
June September December March
mg/
l
Season
IRON
Station 1
Station 2
Station 3
Station 4
Station 5

Fe… • . The value of Fe ranges from 0.01 to 0.6 mg/l with an overall mean
of the samples is 0.28. • The seasonal variance of Fe (i.e. seasonal P value) is 0.027, which is
statistically significant. • The site specific variance of Fe is calculated as 0.852, which is
statistically not significant. • Fe positively correlates with EC, pH, NH4, NO3, As, TDS and
negatively correlates with Pb and P. But it has strong positive correlation with NH4.
• The source of Iron (Fe) is iron pipe from acid rain, electric board, etc. If the riverbed materials are extracted, the quantity of Fe will be increased if it presents in mineral form of the river water.
• The permissible value of Fe in fresh water bodies is 0.5-50 mg/l. Thus this value does not exceed the permissible value of WHO (WHO, 1993).

PHOSPHOROUS (P)
0
0.5
1
1.5
2
2.5
June September December March
mg/
l
Season
PHOSPHOROUS
Station 1
Station 2
Station 3
Station 4
Station 5
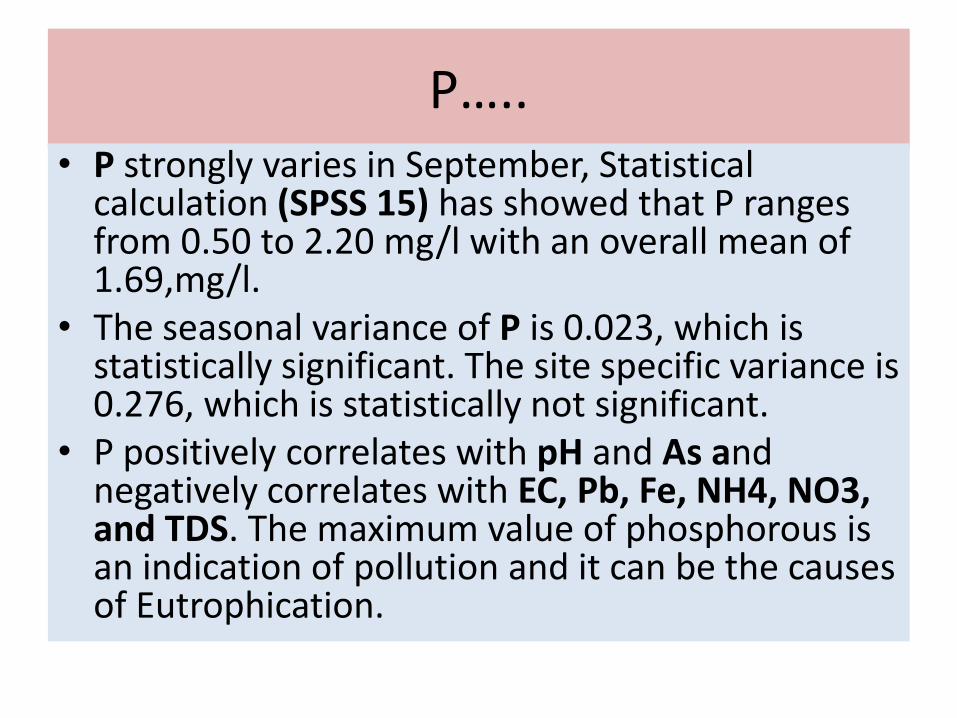
P….. • P strongly varies in September, Statistical
calculation (SPSS 15) has showed that P ranges from 0.50 to 2.20 mg/l with an overall mean of 1.69,mg/l.
• The seasonal variance of P is 0.023, which is statistically significant. The site specific variance is 0.276, which is statistically not significant.
• P positively correlates with pH and As and negatively correlates with EC, Pb, Fe, NH4, NO3, and TDS. The maximum value of phosphorous is an indication of pollution and it can be the causes of Eutrophication.
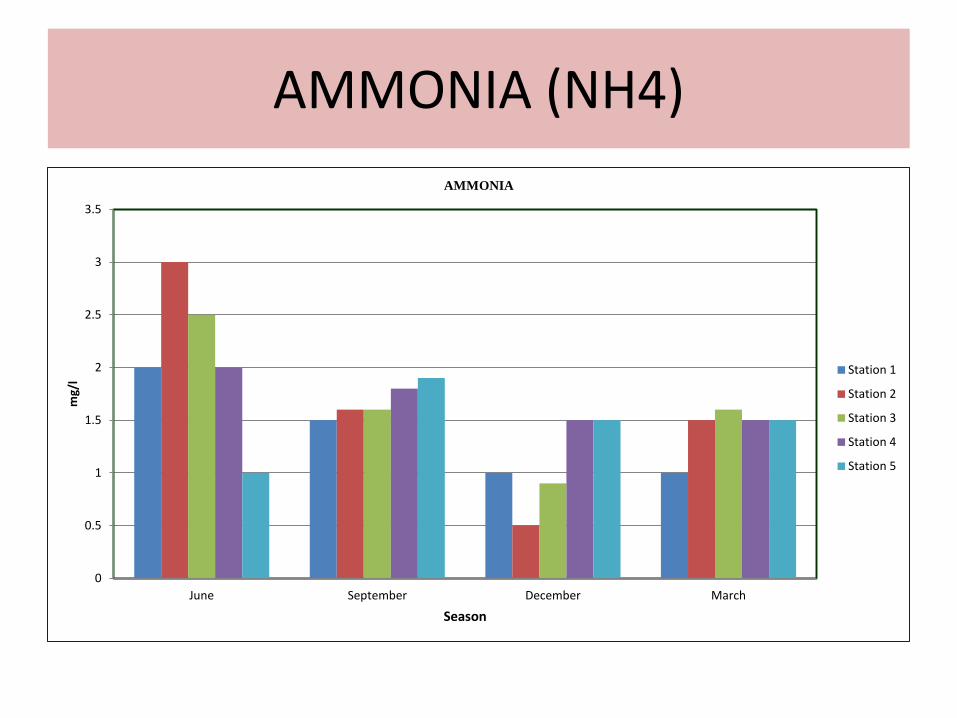
AMMONIA (NH4)
0
0.5
1
1.5
2
2.5
3
3.5
June September December March
mg/
l
Season
AMMONIA
Station 1
Station 2
Station 3
Station 4
Station 5
NH4….. • The statistical calculation in SPSS 15 has shown that the value of
NH4 ranges from 0.50 to 3mg/l with an overall mean of 1.57 mg/l. • Seasonal variance is 0.017 which is statistically significant. • The site specific variance is 0.934, which is not significant. • NH4 positively correlates with EC, Pb, pH, Fe, NO3, As and TDS. And
negatively correlates with P. But it has strong positive correlation with Fe and TDS.
• The maximum permissible limit of NH4 is 0.2-0.3 mg/l for natural fresh water (WHO, 1993).
• The average mean of the study area (1.57mg/l) exceeds the permissible value of WHO (0.2-0.3 mg/l).
• Riverbed extraction can be the cause of increment of NH4 in the study area.
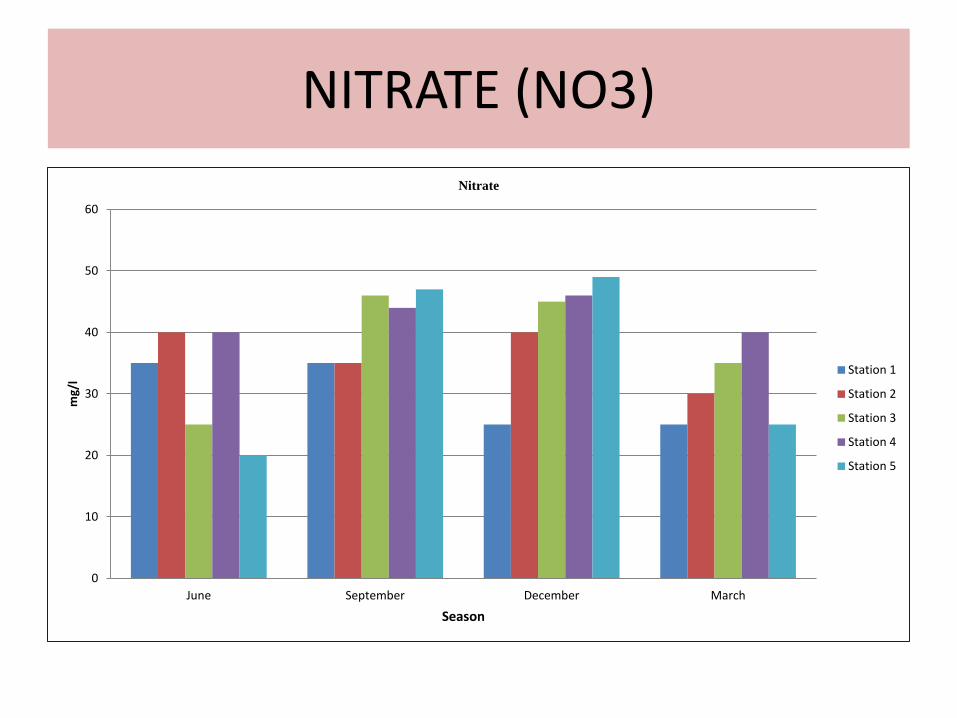
NITRATE (NO3)
0
10
20
30
40
50
60
June September December March
mg/
l
Season
Nitrate
Station 1
Station 2
Station 3
Station 4
Station 5

NO3…. • Statistical calculation (SPSS 15) has shown that the value of NO3 ranges
from 20 to 49 mg/l with an overall mean of 36.35 mg/l. • Seasonal variance of NO3 is 0.096, which is not significant. • Similarly the site specific variance of NO3 is 0.41, which is also not
significant. • NO3 positively correlates with EC, Pb, pH, Fe, NH4, As and TDS but
negatively correlates with P. • The sources of nitrate (NO3) are : human waste, animal waste, plant
decay, fertilizer plant, livestocks, runoff, septic tanks, sewage discharges, and so on.
• The river water containing5mg/l indicates that the pollution is man- made (http://www.stevenswaterquality.com).
• WHO has not prepared the guidelines for NO3 for fresh water streams/Rivers. But the permissible limit of NO3 is 50 mg/l for drinking water (http://www.lenntech.com/applications/drinking/standards/who-s-drinking-water-standards.htm#ixzz1uumMIeRr).
• High level of nitrate is toxic. The effects of high-level nitrate consumption are the cause of Methemoglobinemia. The effects of nitrate are more harmful to infants.

ARSENIC (As)
0
0.02
0.04
0.06
0.08
0.1
0.12
June September December March
mg/
l
ARSENIC
Station 1
Station 2
Station 3
Station 4
Station 5
As…. • It seasonally varies but the greatest value has achieved in
September. • The value of As ranges from 0 to 0.1 mg/l with an overall mean of
0.02. • The value of seasonal variance is 0.071, which is statistically not
significant. Similarly the site specific variance of As is 0.936, which is also not significant.
• It positively correlates with pH, Fe, P, NH4 NO3, and negatively correlates with EC, Pb, and TDS.
• As is poisonous. The source of Arsenic (As) is mountains/rocks. In Nepal, Siwalik hill is the source of As.
• The permissible limit of As is 0.01 for drinking water (WHO, 993). • The maximum use of As can cause skin cancer. • As is in deposit form and when riverbed is extracted it appears in
the surface water. Thus As appeared in the natural water (Tinau).
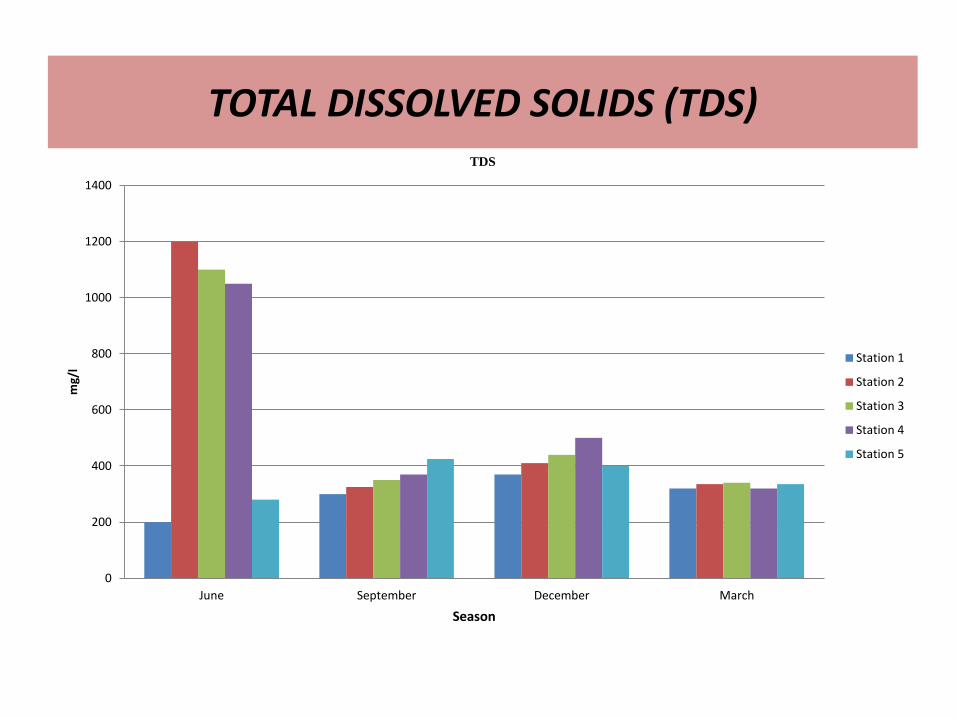
TOTAL DISSOLVED SOLIDS (TDS)
0
200
400
600
800
1000
1200
1400
June September December March
mg/
l
Season
TDS
Station 1
Station 2
Station 3
Station 4
Station 5

TOTAL DISSOLVED SOLIDS (TDS)…..
• The results of the parameter TDS have been presented in the fig. 10. The statistical calculation (SPSS 15) has shown that the value of TDS ranges from 200 to 1200 mg/l with an overall mean of 468.50 mg/l.
• The value of seasonal variance of TDS is 0.043, which is significant and the value of site specific variance is 0.559, which is not significant.
• TDS has a positive correlation with EC, Pb, Fe, NH4, NO3 and negative correlation with pH, P and As. But it has a strong positive correlation with NH4.
• Pollution is the main cause of total dissolved solids. There are other causes of TDS in the river water e.g. sewage discharge, runoff, irrigation water leaching, landslides and so on. But anthropogenic activity like riverbed extraction is one of the vital causes of TDS in the Tinau River.
• When extraction activities increase, ultimately the level of TDS increases.

ECONOMIC BENEFIT FROM RIVER BED MATERIALS
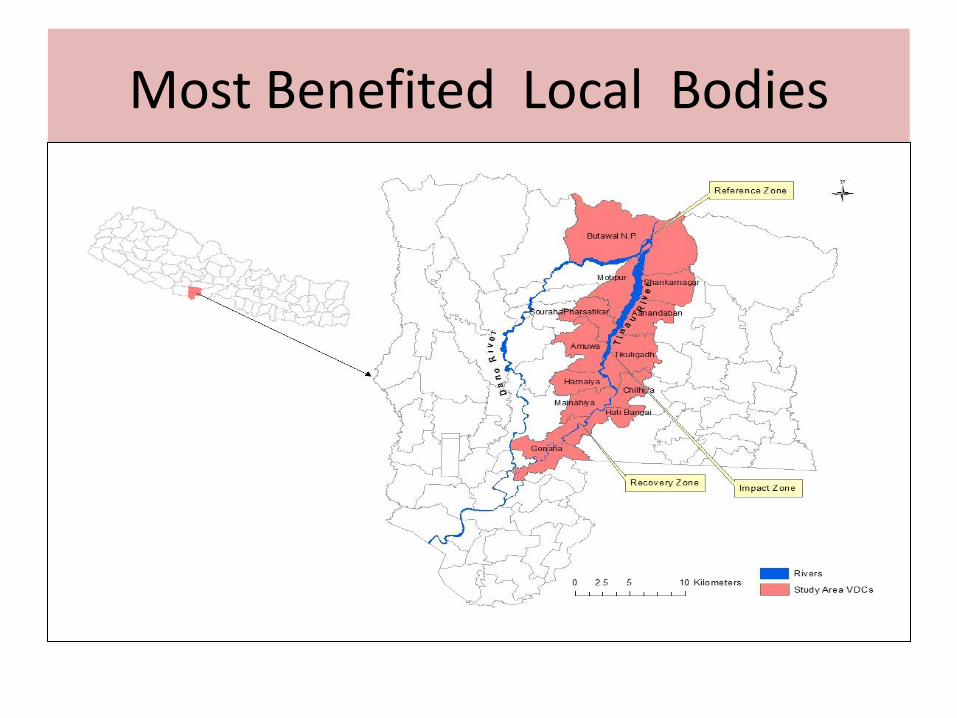
Most Benefited Local Bodies
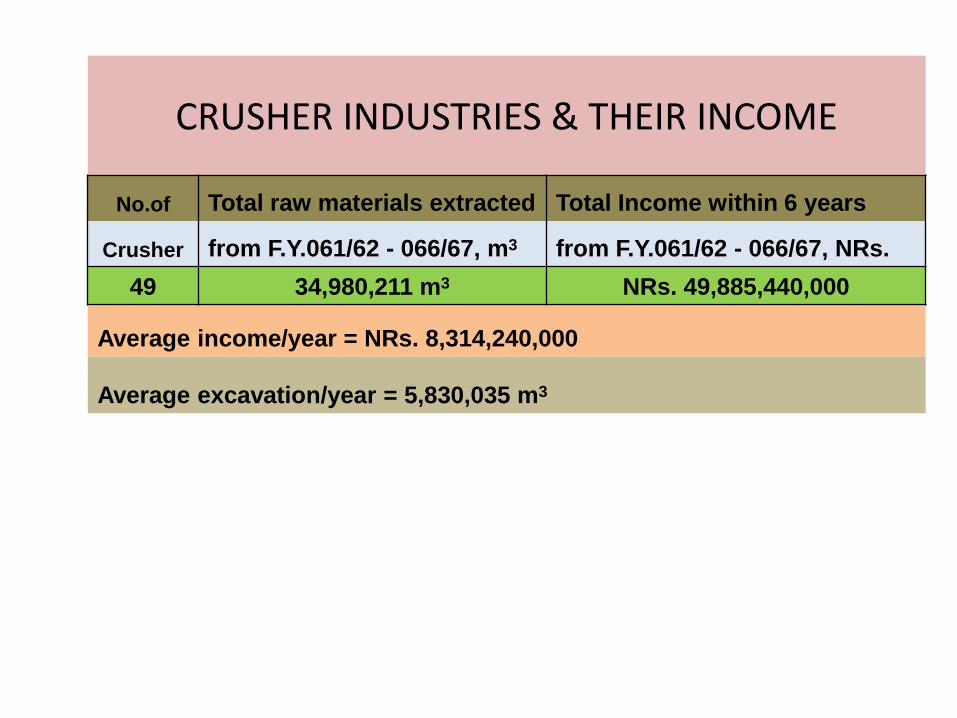
CRUSHER INDUSTRIES & THEIR INCOME
No.of Total raw materials extracted Total Income within 6 years
Crusher from F.Y.061/62 - 066/67, m3 from F.Y.061/62 - 066/67, NRs.
49 34,980,211 m3 NRs. 49,885,440,000
Average income/year = NRs. 8,314,240,000
Average excavation/year = 5,830,035 m3

ESTABLISHMENT OF CRUSHER
INDUSTRIES No. of crusher
Fiscal Year established
045/46 2
047/48 1
048/49 2
051/52 1
052/53 4
053/54 1
054/55 2
055/56 2
058/59 1
059/60 4
060/61 7
061/62 3
062/63 1
063/64 2
064/65 8
065/66 4
066/67 4
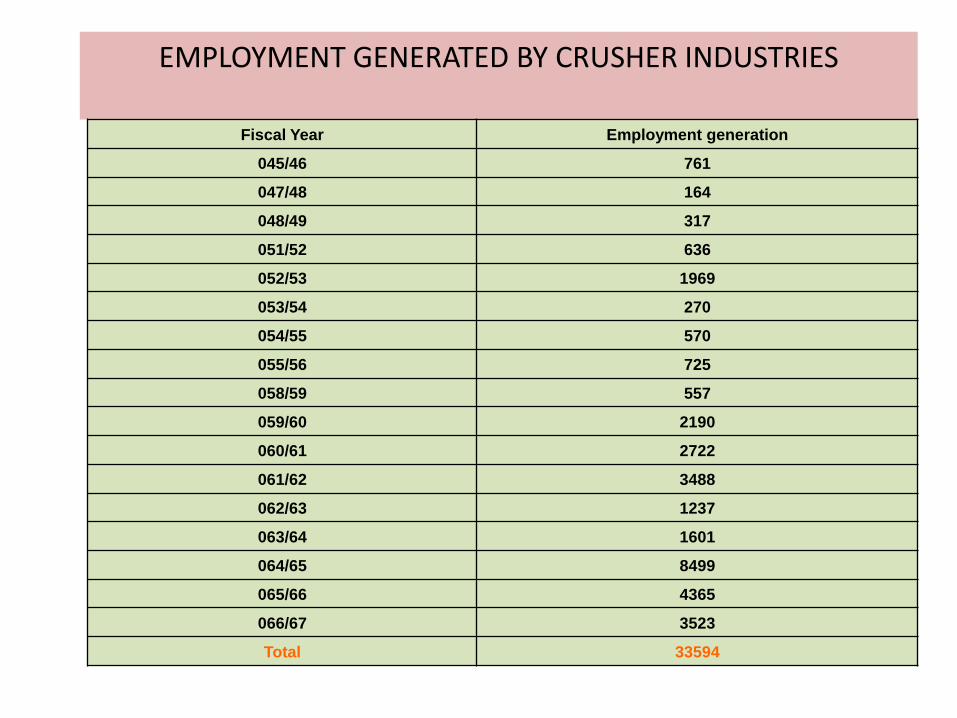
EMPLOYMENT GENERATED BY CRUSHER INDUSTRIES
Fiscal Year Employment generation
045/46 761
047/48 164
048/49 317
051/52 636
052/53 1969
053/54 270
054/55 570
055/56 725
058/59 557
059/60 2190
060/61 2722
061/62 3488
062/63 1237
063/64 1601
064/65 8499
065/66 4365
066/67 3523
Total 33594

INCOME GENERATED BY V.D.C./MUNICIPALITY FROM RIVER BED MATERIALS
Income
s.n. Fiscal Year V.D.C. D.D.C. Total Tax charged by V.D.C. via road for F.Year 067/068
1 061/062 425850 1018232 1444082 Tractor @ Rs. 60/trip
2 062/063 594346 418857 1013203 Tipper @ Rs. 200/trip
3 063/064 1959648 1437620 3397268
4 064/065 1892775 1334000 3226775 Tax charged by D.D.C. via road for F.Year 067/068
5 065/066 855950 671000 1526950 .@ Rs. 2/cft.
6 066/067 2142000 1534500 3676500
Total 7,870,569 6,414,209 14,284,778
1. Paschim Amawa V.D.C.
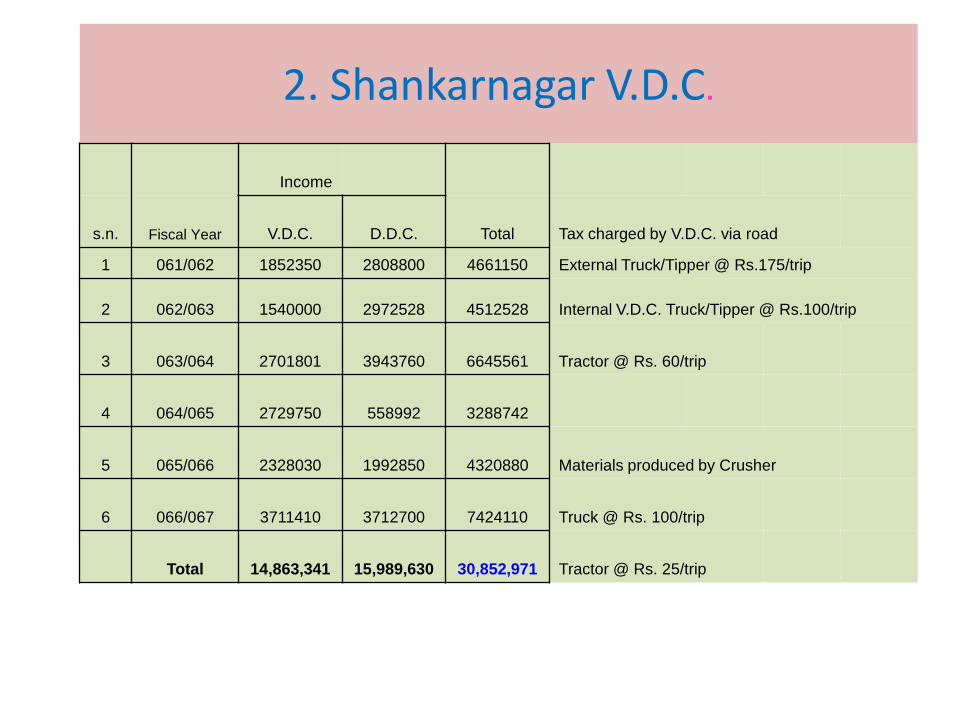
2. Shankarnagar V.D.C.
Income
s.n. Fiscal Year V.D.C. D.D.C. Total Tax charged by V.D.C. via road
1 061/062 1852350 2808800 4661150 External Truck/Tipper @ Rs.175/trip
2 062/063 1540000 2972528 4512528 Internal V.D.C. Truck/Tipper @ Rs.100/trip
3 063/064 2701801 3943760 6645561 Tractor @ Rs. 60/trip
4 064/065 2729750 558992 3288742
5 065/066 2328030 1992850 4320880 Materials produced by Crusher
6 066/067 3711410 3712700 7424110 Truck @ Rs. 100/trip
Total 14,863,341 15,989,630 30,852,971 Tractor @ Rs. 25/trip

3. Aanandaban V.D.C.
Income
s.n. Fiscal Year V.D.C. D.D.C. Total
Tax charged by V.D.C. via road for F.Year
067/068
1 061/062 1833530 2864000 4697530 Tractor @ Rs. 75/trip
2 062/063 2849999 2748400 5598399 Tipper @ Rs. 150/trip
3 063/064 2924000 2779860 5703860
4 064/065 4256000 3668000 7924000
5 065/066 6224953 1733000 7957953
Tax charged by D.D.C. via road for F.Year
067/068
6 066/067 5664265 5001000 10665265 .@ Rs. 2/cft.
Total 23,752,747 18,794,260 42,547,007

4. Tikuligadh V.D.C.
Income
s.n.
Fiscal
Year V.D.C. D.D.C. Total
Tax charged by V.D.C. via road for F.Year
067/068
1 061/062 1911000 2649000 4560000 Tractor @ Rs. 60/trip
2 062/063 1850000 1838000 3688000 Tipper @ Rs. 200/trip
3 063/064 2800000 1683700 4483700
4 064/065 4500000 2200000 6700000
5 065/066 5400000 2796000 8196000
Tax charged by D.D.C. via road for F.Year
067/068
6 066/067 5850090 3330000 9180090 Outside D.D.C. .@ Rs.2/cft.
Total 22,311,090 14,496,700 36,807,790 Inside D.D.C. .@ Rs.1.5/cft.

5. Chilhiya V.D.C.
Income
s.n. Fiscal Year V.D.C. D.D.C. Total
1 061/062 450000 355000 805000
2 062/063 698550 548282 1246832
3 063/064 773000 544753 1317753
4 064/065 910425 550000 1460425
5 065/066 1155000 570000 1725000
6 066/067 1174000 1257000 2431000
Total 4,710,975 3,470,035 8,181,010
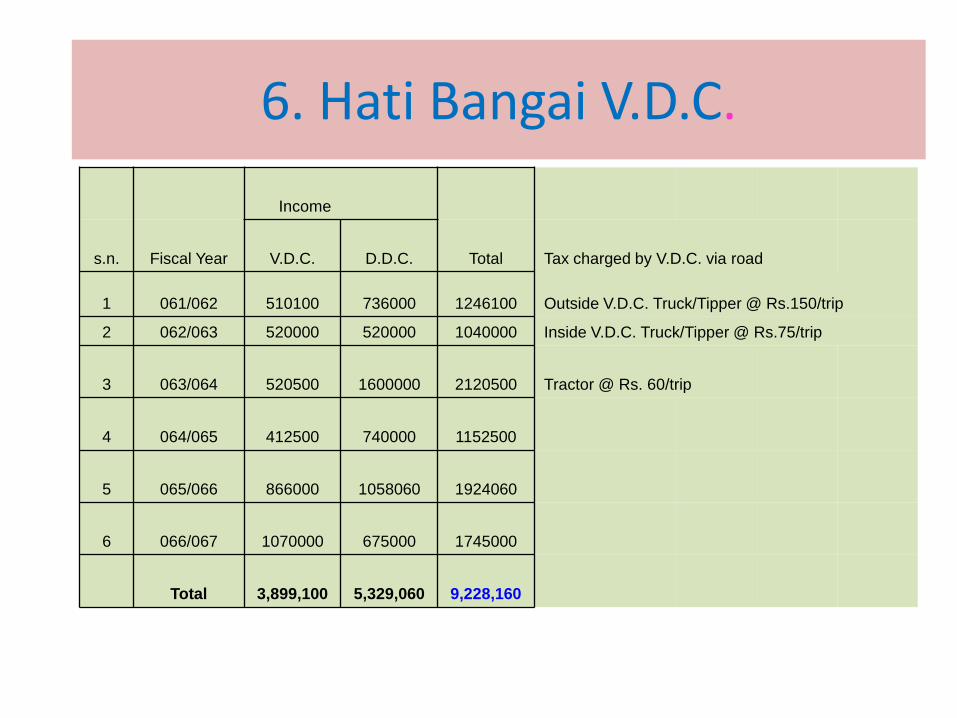
6. Hati Bangai V.D.C.
Income
s.n. Fiscal Year V.D.C. D.D.C. Total Tax charged by V.D.C. via road
1 061/062 510100 736000 1246100 Outside V.D.C. Truck/Tipper @ Rs.150/trip
2 062/063 520000 520000 1040000 Inside V.D.C. Truck/Tipper @ Rs.75/trip
3 063/064 520500 1600000 2120500 Tractor @ Rs. 60/trip
4 064/065 412500 740000 1152500
5 065/066 866000 1058060 1924060
6 066/067 1070000 675000 1745000
Total 3,899,100 5,329,060 9,228,160

7. Motipur V.D.C.
Income
s.n. Fiscal Year V.D.C. D.D.C. Total Tax charged by V.D.C. via road
1 061/062 237688 313000 550688 Outside V.D.C. Truck/Tipper @ Rs.175/trip
2 062/063 438250 330688 768938 Inside V.D.C. Truck/Tipper @ Rs.100/trip
3 063/064 750300 621270 1371570 Tractor @ Rs. 60/trip
4 064/065 850000 917000 1767000
5 065/066 1052159 406000 1458159 Tax charged by D.D.C. via road
6 066/067 1064200 711000 1775200 Outside D.D.C. Truck/Tipper @ Rs.175/trip
Total 4,392,597 3,298,958 7,691,555 Inside D.D.C. Truck/Tipper @ Rs.150/trip
Tractor @ Rs. 60/trip
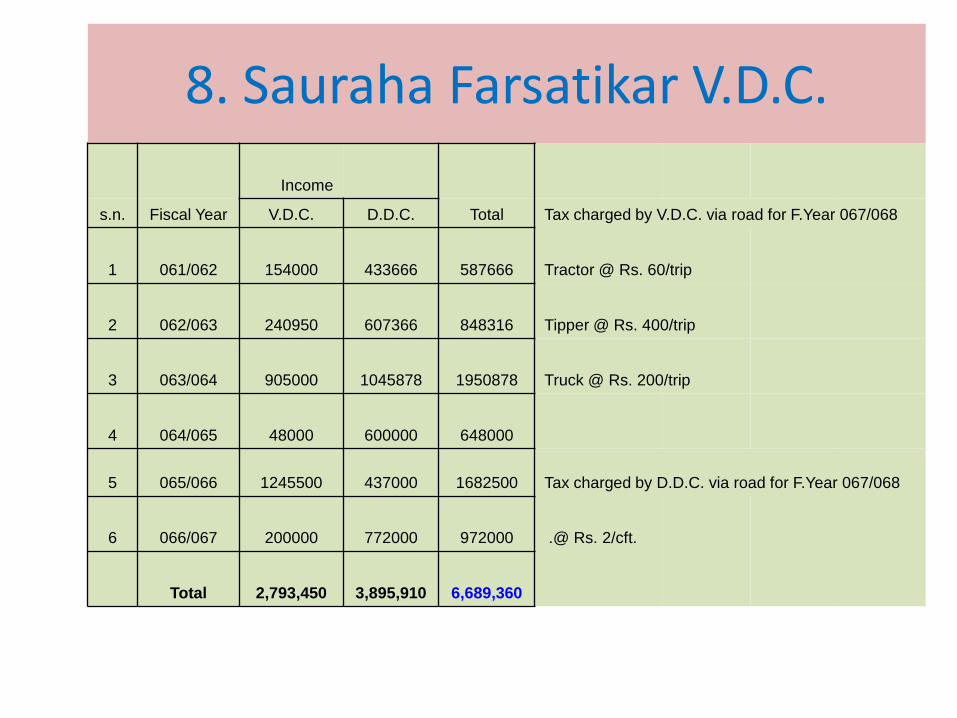
8. Sauraha Farsatikar V.D.C.
Income
s.n. Fiscal Year V.D.C. D.D.C. Total Tax charged by V.D.C. via road for F.Year 067/068
1 061/062 154000 433666 587666 Tractor @ Rs. 60/trip
2 062/063 240950 607366 848316 Tipper @ Rs. 400/trip
3 063/064 905000 1045878 1950878 Truck @ Rs. 200/trip
4 064/065 48000 600000 648000
5 065/066 1245500 437000 1682500 Tax charged by D.D.C. via road for F.Year 067/068
6 066/067 200000 772000 972000 .@ Rs. 2/cft.
Total 2,793,450 3,895,910 6,689,360

9. Mainahiya V.D.C. Income
s.n. Fiscal Year V.D.C. D.D.C. Total
1 061/062 127900 239000 366900
2 062/063 86422 37200 123622
3 063/064 100300 330615 430915
4 064/065 115065 333334 448399
5 065/066 151516 417000 568516
6 066/067 75000 197000 272000
Total 656,203 1,554,149 2,210,352

10.Gonaha V.D.C. Income
s.n. Fiscal Year V.D.C. D.D.C. Total
1 061/062 162500 287200 449700
2 062/063 309245 161372 470617
3 063/064 75055.5 394453 469508.5
4 064/065 100000 289667 389667
5 065/066 1845200 475000 2320200
6 066/067 1795000 550000 2345000
Total 4287001 2157692 64,44,693
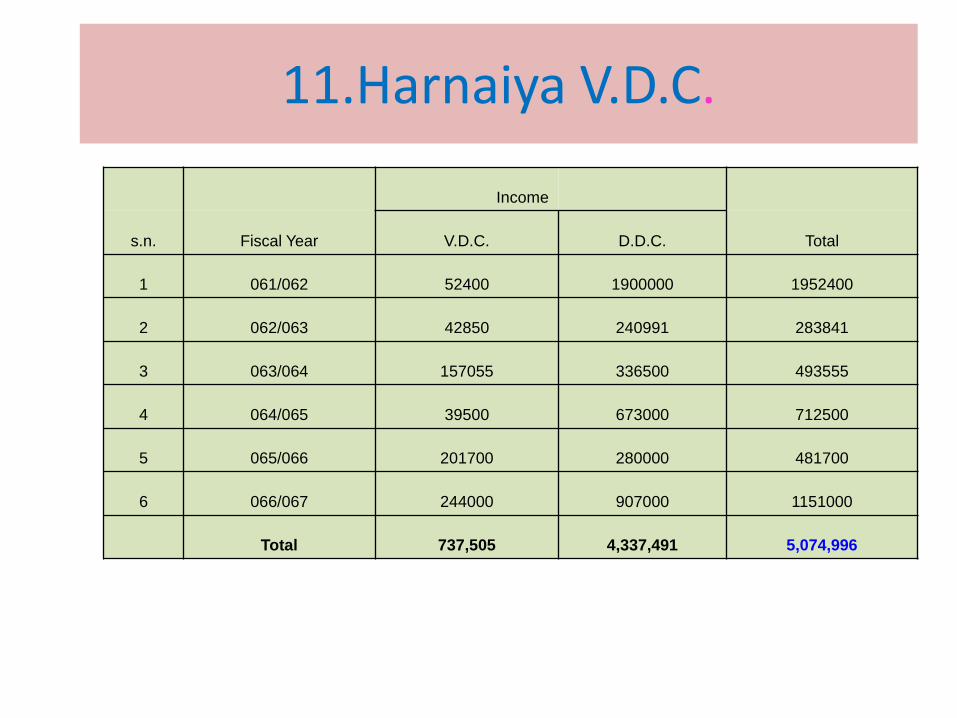
11.Harnaiya V.D.C.
Income
s.n. Fiscal Year V.D.C. D.D.C. Total
1 061/062 52400 1900000 1952400
2 062/063 42850 240991 283841
3 063/064 157055 336500 493555
4 064/065 39500 673000 712500
5 065/066 201700 280000 481700
6 066/067 244000 907000 1151000
Total 737,505 4,337,491 5,074,996

12. Butwal Municipality
Income
s.
n
.
Fiscal
Year Municipality D.D.C. Total Budget
1 061/062 0 5159200 5159200 75098308
2 062/063 0 3602000 3602000 75915110
Ward no. 13,14,15 River Control & Road
Construction Consumer Committee
3 063/064 0 5627759 5627759 96363923
4 064/065 2196120 4046000 6242120 77479638 Ward no. 13 Manbir Garbuja
5 065/066 1928654 3100000 5028654 162355008 Ward no. 14 Baburam Dhakal
6 066/067 1758658 1185000 2943658 155145847 Ward no. 15 Hem Bahadur Rana
Total 5,883,432 2,2719,959 28,603,391 642,357,837
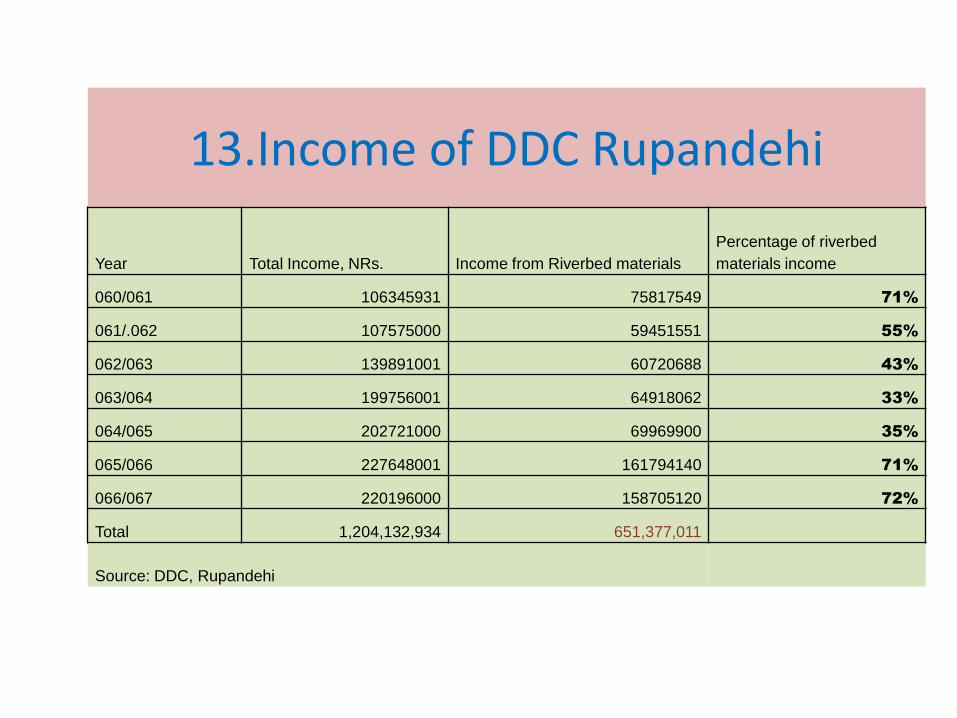
13.Income of DDC Rupandehi
Year Total Income, NRs. Income from Riverbed materials
Percentage of riverbed
materials income
060/061 106345931 75817549 71%
061/.062 107575000 59451551 55%
062/063 139891001 60720688 43%
063/064 199756001 64918062 33%
064/065 202721000 69969900 35%
065/066 227648001 161794140 71%
066/067 220196000 158705120 72%
Total 1,204,132,934 651,377,011
Source: DDC, Rupandehi

Cross-Section of Tinau River

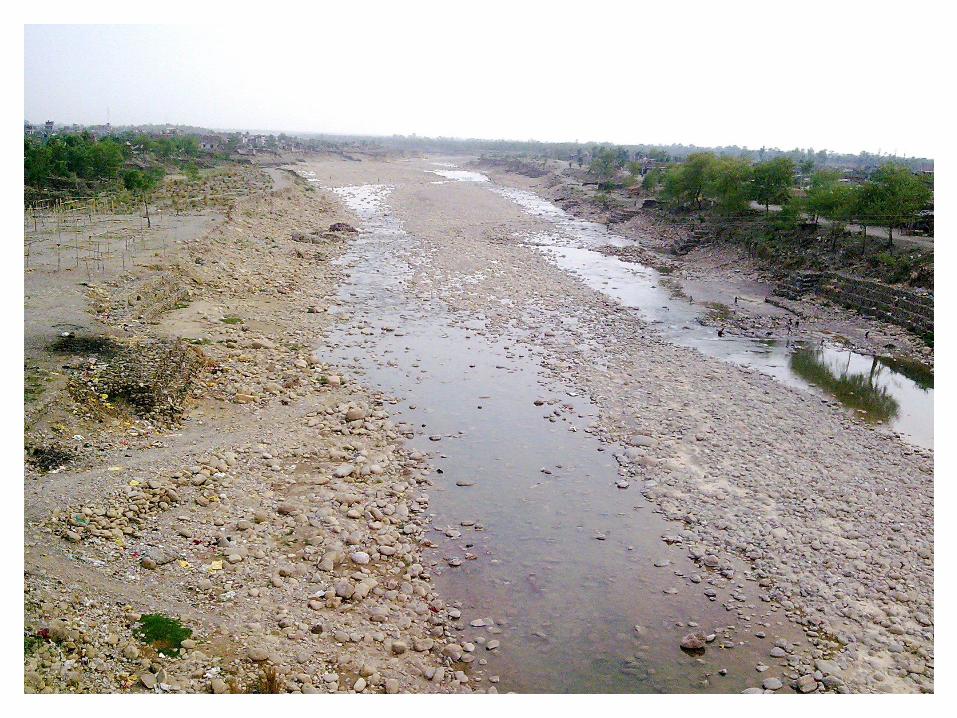
Recent Photos of Tinau River
Graphs - Bad
January February March April
Blue Balls 20.4 27.4 90 20.4
Red Balls 30.6 38.6 34.6 31.6

Items Sold in First Quarter of 2002
0
10
20
30
40
50
60
70
80
90
100
January February March April
Blue Balls
Red Balls

20.4
27.4
90
20.4
30.6
38.6
34.631.6
0
10
20
30
40
50
60
70
80
90
100
January February March April
Blue Balls
Red Balls

Graphs - Bad
• Minor gridlines are unnecessary
• Font is too small
• Colours are illogical
• Title is missing
• Shading is distracting


CONCLUSIONS •The River is deepening and the health of the river is damaged. •There is a an encroachment by landless people. They have occupied the terrace deposit, where the riverbed materials could be extracted. •The extraction has been done in an uncontrolled way. •Many hydraulic structures in the Tinau river have been damaged. •The River morphology has been changed. •The extraction activities has also changed the physico-chemical parameters of the river.

THANK YOU FOR YOUR ATTENTATION