riverside expressway transport investigation and network .../media/projects/r/riverside... · the...
TRANSCRIPT

Department of Transport and Main Roads, Riverside Expressway Transport Investigation and Network Analysis, 2010
Transport and Main Roads
Riverside Expressway Transport
Investigation and Network Analysis
A focus on how people changed and reacted
RETINA report
April 2010

Department of Transport and Main Roads, Riverside Expressway Transport Investigation and Network Analysis, 2010
On 26 March 2009 Queensland Transport and the Department of Main Roads merged to form the Department of Transport and Main Roads. This report has been written using the agency names and governance arrangements in place at the time of the Riverside Expressway closure in October 2006.
State of Queensland (Department of Transport and Main Roads) 2009
Excerpts from this publication may be reproduced, with appropriate acknowledgement, as permitted under the Copyright Act 1968.

Department of Transport and Main Roads, Riverside Expressway Transport Investigation and Network Analysis, 2010
Message from the Director-General
The Queensland Government is committed to managing traffic congestion throughout Queensland, especially within the Brisbane central business district. Traffic congestion poses a number of economic, social and environmental costs. In addressing traffic congestion, we are ensuring that our Smart State productivity is not adversely affected, people get to work in reasonable time and air and noise pollution is reduced.
Through balancing infrastructure and services and planning and policy, the Department of Transport and Main Roads is helping to ensure that our transport infrastructure reduces these impacts and creates a comfortable balance between transport modes.
In an effort to measure and further understand these costs and the affect that traffic congestion has on the citizens of Brisbane, the then Queensland Transport and Main Roads in conjunction with other state and local government agencies led an investigation into the affects of the Riverside Expressway closures on traffic patterns and travel behaviour. The investigation also measured agency responses in coordinating the closure.
The closure represented a major coordination challenge but also provided an opportunity to better understand the role that Queensland’s busiest road plays in south east Queensland’s transport system. The investigation and analysis will assist the Queensland Government in understanding how and why people make travel choices according to the options available to them.
The Queensland Government and other agencies and organisations will be able to better understand the challenges that they will face and tailor policy initiatives to reorganise traffic patterns, promote the use of public transport and manage congestion on Queensland roads.
This report is offered in the spirit of a working report and resource for others to augment and build upon through their actions.
David Stewart
Director-General
Department of Transport and Main Roads
i

Department of Transport and Main Roads, Riverside Expressway Transport Investigation and Network Analysis, 2010
Executive summary
The closure of Brisbane city’s Riverside Expressway (REX) between 17 October and 20 October 2006 provided a unique insight into the capacity of greater Brisbane’s transport and traffic network to respond to a major incident or infrastructure failure.
The Riverside Expressway Transport Investigation and Network Analysis (RETINA) reviewed data from a variety of sources collected during and after the event. A range of findings and observations regarding the closure’s impact, including the response of affected citizens, management and transport agencies and the transport system as a whole is documented in this report.
The RETINA Report also reviews similar events in Australia and overseas and considers the findings of travel behaviour change research and the role of intelligent transport systems (ITS) in incident management.
Below is a summary of the main findings:
Management Impacts
Surveys conducted indicated that 71 per cent of the greater Brisbane population were unaffected by the REX closure.
94 per cent of those affected, supported the actions taken to ensure public safety by closing REX.
The road network in and surrounding the central business district (CBD) is ordinarily at capacity during peak periods.
Most commuters new to public transport chose the rail rather than the bus network.
Public transport operators acted quickly to deploy additional services and optimise infrastructure usage during the closures.
The level of public transport capacity was able to be increased during the closure by altering vehicle maintenance schedules and crew relief working hours but this was only sustainable for a limited period of time.
Based on a comparison of people movement capacities by mode, a major CBD rail disruption may result in more severe road congestion compared to a major CBD road closure.
Management Agencies
The Brisbane Metropolitan Transport Management Centre (BMTMC) played a fundamental role in: - monitoring and assisting road and bus operations - communicating to motorists and the public - providing updates on changed conditions to agencies involved in road operations.
transport agencies to manage incidents.
would improve consistency of responses and communications.
agencies.
ii

Department of Transport and Main Roads, Riverside Expressway Transport Investigation and Network Analysis, 2010
Mode Shift
Both survey and patronage data showed that overall public transport patronage increased by approximately eight and a half per cent during the closures.
Survey data showed an increase in walking and cycling.
Road counter data showed that during the temporary closure there was:
- very little change in traffic north of the Brisbane River - a significant increase in traffic south of the Brisbane River - a significant increase in traffic within the Brisbane CBD - increases of between 10 and 20 per cent on the major arterials within one kilometre of the CBD - the Gateway Motorway and some eastern arterial roads were also affected - most roads outside the CBD’s one kilometre radius generally experienced little impact.
The public communication strategy implemented by Queensland Transport, Main Roads and Brisbane City Council was important in assisting people choose alternatives to their regular motor vehicle trip.
Household travel surveys conducted after the closure showed that the TravelSmart program helped to reduce the extent of additional congestion during the closures:
- previous TravelSmart participants were more able and willing to change their travel behaviour - this may have contributed to the reduced extent of impacts on the northside where TravelSmart had previously been implemented.
With current Brisbane travel patterns, almost half of all motor vehicle trips could change mode with only minor inconvenience (subject to peak public transport capacity).
Travel Behaviour Trends
Many people surveyed during the closure intended to continue their new travel behaviour in the long term however analysis of public transport patronage data sets shows that most of the increased public transport shift was not maintained in the long term.
Analysis of the road traffic data shows that travel patterns virtually revert to prior levels when network links are reopened.
Case study reviews of similar events around the world showed that effects of the Riverside Expressway closure followed a similar pattern where public transport, walking and cycling modes increased and where employers helped manage traffic demand by offering flexible work arrangements.
Media
Surveys found that media was a key tool in informing the public and encouraging them to use public transport.
Media releases and 'direct to public communication' did not receive as much coverage as structural problems and traffic delays.
There was an absence of a designated single contact point for public communication.
25 per cent of media reports were negative, 65 per cent neutral and 10 per cent positive.
iii

Department of Transport and Main Roads, Riverside Expressway Transport Investigation and Network Analysis, 2010
Table of contents
Message from the Director-General iExecutive summary iiTable of contents 1List of figures 4List of tables 4
1.0 Introduction to RETINA 61.1 Purpose 61.1.1 Genesis of the investigation 61.1.2 Objectives 61.2 Methodology 71.2.1 Scope 71.2.2 Stakeholders 71.2.3 Research 81.2.4 Information Sources 81.3 Setting the scene 91.3.1 Locality description 91.3.2 People movements 101.3.3 Event description 101.4 Event timeline 11
2.0 Agency incident response 122.1 Introduction 122.2 Purpose and objectives 122.3 Methodology 122.3.1 Agencies involved in the review 122.3.2 Issue-specific groups, committees and centres involved in the review 122.3.3 Inter-agency agreements considered in the review 13
2.4.1 Network operations, internal communication and traffic management activity 132.4.2 Network operations, internal communications and traffic management observations 152.4.3 Policies and practices: application 162.4.4 Policies and practices: observations 172.4.5 Public communication activity 172.4.6 Public communication observations 19
3.0 Media incident responses 193.1 Introduction 203.2 Media Monitors media analysis 203.2.1 Objectives 203.2.2 Methodology 20
3.3 Internal media analysis 233.3.1 Objectives 233.3.2 Methodology 23
3.4 Media and communication activity timeline 263.4.1 Objectives 263.4.2 Methodology 26
3.5 Conclusions 28
1

Department of Transport and Main Roads, Riverside Expressway Transport Investigation and Network Analysis, 2010
4.0 Network impact analysis 284.1 Introduction 294.2 Purpose and objectives 294.3 Road analysis 294.3.1 Objectives 294.3.2 Methodology 29
4.4 Public transport 354.4.1 Objectives 354.4.2 Methodology 354.4.3 QR 374.4.4 Brisbane Transport (BT) buses 384.4.5 South East Busway (SEB) 38
4.5 Overall patronage assessment 394.5.1 Constraints 394.5.2 Patronage analysis 394.5.3 Patronage retention 414.6 Conclusions 414.6.1 Traffic 414.6.2 Public transport 41
5.0 Case study learnings 425.1 Introduction 425.2 Purpose and objectives 425.3 Methodology 425.4 Case studies 435.4.1 2006 Laval overpass collapse (Montreal) 425.4.2 2001 9/11 attacks (New York) 435.4.3 1997 Hammersmith Bridge closure (London, UK) 435.4.4 1995 Hanshin Awaji earthquake (Kobe) 465.4.5 1994 Northridge earthquake (Los Angeles) 465.4.6 1975 Tasman Bridge collapse (Hobart) 485.4.7 List of articles cited in case studies 495.5 Conclusions 495.5.1 Agency responses 505.5.2 Travel behaviours 50
6.0 Travel behaviour analysis 516.1 Introduction 516.2 Potentials analysis 516.2.1 Objectives 516.2.2 Methodology 51
6.3 TravelSmart survey 556.3.1 Objectives 556.3.2 Methodology 55
6.3.4 Comparing Brisbane North to Greater Brisbane 596.3.5 Conclusions 60
2

Department of Transport and Main Roads, Riverside Expressway Transport Investigation and Network Analysis, 2010
7.0 Stakeholder perspectives 61
7.1 Introduction 617.2 Purpose and objectives 617.3 Methodology 61
7.4.1 Positive feedback 627.4.2 Concerns 687.5 Conclusions 62
8.0 Travel demand strategy: flexible work policies 63
8.1 Introduction 638.2 Purpose and objectives 638.3 Methodology 63
8.5 Conclusions 649.0 Community perspectives 64
9.1 Introduction 649.2 Purpose and objectives 659.3 Methodology 659.3.1 Stage one of the survey 659.3.2 Stage two of the survey 659.3.3 Total survey sample 65
9.4.1 Awareness of and support for the closures 669.4.2 When and how residents were most affected 669.4.3 What residents did about it 679.4.4 Overall support for government strategies 689.4.5 Preferred information source 689.4.6 Travel behaviour following the reopening 699.5 Conclusions 69
10.0 RETINA summary and conclusions 7010.1 Travel behaviour change 7010.1.1 Ability to change behaviour quickly 7010.1.2 Travel pattern reversion 7110.1.3 Walking and cycling 71
10.1.5 The role of High Occupancy Vehicles (HOVs) 7110.2 Road transport and traffic management 7210.2.1 Inter-agency communication and cooperation 7210.2.2 Brisbane Metropolitan Transport Management Centre (BMTMC) 7210.2.3 Traffic Management Plans (TMPs) 7210.2.4 Public transport 7310.3 Role of ITS in incident detection, response and management 7310.3.1 Detection, verification and monitoring of incidents 7410.3.2 Travel time information 7410.3.3 Traffic signal coordination 7510.4 Transport network capacity 7510.5 Public communications and media coverage 76
3

Department of Transport and Main Roads, Riverside Expressway Transport Investigation and Network Analysis, 2010
List of figures
List of tables
4

Department of Transport and Main Roads, Riverside Expressway Transport Investigation and Network Analysis, 2010
List of acronyms
5

Department of Transport and Main Roads, Riverside Expressway Transport Investigation and Network Analysis, 2010
1.0 Introduction to RETINA
The RETINA report is the culmination of a series of transport and behavioural studies which assessed the impact of the REX closures on 17 October 2006 and re-opening on 20 October 2006.
The report outlines the findings, conclusions and recommendations from the research and covers the following areas:
incident management
involvement of government agencies
media coverage
network impacts
global experience
public transport usage during and post event
stakeholder and community perceptions.
1.1 Purpose
1.1.1 Genesis of the investigation
Queensland Transport (QT) appointed a project team in late October 2006 to document public transport usage prior to, during and immediately following the closures, and to consider future usage and travel behaviour as a result of the incident.
The scope of the research was later broadened (following a multi-agency meeting on October 30 2006) to include operational incident management and future planning recommendations.
1.1.2 Objectives
This investigation was designed to:
map and analyse agency responses
review the traffic volumes following the closure and subsequent impact on the network
review the impact of the closure on trip decisions
understand changed travel behaviour during and after the closure period
understand key stakeholder attitudes and opportunities to reduce any negative impacts in the future
review media responses during and after the closure period to identify future communication and media opportunities
review similar events from a global perspective, subsequent behaviour change, best practice incident response and infrastructure capacity issues.
6

Department of Transport and Main Roads, Riverside Expressway Transport Investigation and Network Analysis, 2010
1.2 Methodology
1.2.1 Scope
Primarily the investigations:sampled populations in the Brisbane CBD, certain northern Brisbane suburbs and the Brisbane Statistical Division (BSD)
utilised a number of other data sets and information sources
concentrated on the period of time immediately prior to the closure (17 October 2006) through to immediately after the re-opening of the ramps to light traffic (evening of 20 October 2006)
considered all modes of travel (private and commercial motor vehicles, bus, train, ferry, motorbike, cycling and walking).
The investigations did not include a technical infrastructure analysis of the Riverside Expressway structure.
1.2.2 Stakeholders
Below is a list of the key government stakeholders involved or interested in the outcomes of the investigations.
QT, including TransLinkMR, including RoadTek and Queensland Motorways Limited (QML)BCC, including Brisbane Transport (BT)Brisbane Metropolitan Transport Management Centre (BMTMC) (BT, QT, TransLink and MR)Office of Economic and Statistical Research, Queensland TreasuryQueensland Police Service (QPS)Queensland Ambulance Service (QAS)
Queensland Rail (QR)Tourism Queensland (TQ)Southern Regional Organisation of Councils (SouthROC)Ipswich City Council (ICC).
Other organisations consulted and who contributed to this report include:
Airtrain Citylink Limited (Airtrain)Brisbane Airport Corporation (BAC)Brisbane Development Association (BDA)Brisbane MarketingBicycle QueenslandChartered Institute of Logistics and TransportCommerce QueenslandQueensland Trucking AssociationRACQSouthbank CorporationTaxi Council QueenslandUniversity of Queensland (UQ).
7

Department of Transport and Main Roads, Riverside Expressway Transport Investigation and Network Analysis, 2010
1.2.3 Research
Six specific bodies of work were defined and endorsed at the multi-agency meeting in December 2006 by Colin Jensen,
follows:
map and analyse agency responses
review changed traffic volumes and patterns during the closure and the impact on people's trip decisions
understand people's changed travel behaviour during and after the closure period
understand key stakeholder attitudes and opportunities to support changed travel behaviour in the future
review media responses during and after the closure period to identify future communication and messaging media opportunities
review similar events from a global perspective, subsequent behaviour change, best practice incident response and infrastructure capacity issues.
The RETINA project team members were selected for their specific backgrounds and skill sets that enabled them to quickly and comprehensively gather information and research and develop observations. The team consisted of staff and consultants from policy, operational, communication, technical and strategic backgrounds.
1.2.4 Information Sources
Figure 1 shows the range of information sets used to construct the RETINA report. The complete AC Nielsen Survey, Behaviour Changes in Brisbane North, Potentials Analysis and Media Monitors Media Analysis reports are included in full in the Technical Appendices.
Figure 1 – Information sets analysed as part of RETINA
8

Department of Transport and Main Roads, Riverside Expressway Transport Investigation and Network Analysis, 2010
1.3 Setting the scene
1.3.1 Locality description
The Brisbane River bisects greater Brisbane into roughly two equal halves and, due to its numerous meanders, forms the most significant natural barrier for north-south and east-west movements in Brisbane. The CBD itself sits on the northern
Brisbane and Milton/Auchenflower).
There are 13 bridge crossings of the Brisbane River in the metropolitan area. Six of these are within one kilometre of the General Post Office (GPO), comprising:
one dedicated to rail (Merivale Bridge)one dedicated to the active transport modes of walking and cycling (Goodwill Bridge)one for vehicles only (Captain Cook Bridge)three multi-modal (Story, Victoria and William Jolly Bridges).
The Riverside Expressway connects the CBD to the Pacific Motorway (via the Captain Cook Bridge) on the south side, to the northern bank of the river and tracks in an east west direction. The Riverside Expressway has numerous ingresses and egresses with the CBD and then becomes Coronation Drive to the west of the CBD.
The other seven bridges and their positions relative to the CBD are:
Eleanor Schonell Bridge - public and active transport modes only (four kilometres south-west)
Centenary Bridge - all modes except rail (11 kilometres south-west).
1.3.2 People movements
The Household Travel Survey 2003/04 revealed that on an average weekday there were approximately 5.5 million private person trips a day in the BSD across all modes. About 5.5 per cent (305 000) of these private person trips were to the Greater CBD. The most recent comprehensive mode split data is from the 2006 ABS Census - Journey to Work data sets. They show that on a typical weekday private journeys to the greater CBD are apportioned:
48.1 per cent to public transport44.9 per cent to motor vehicle5.0 per cent to walking1.7 per cent to cycling0.3 per cent to other.
Capitan Cook Bridge/REX carries about 150 000 vehicles per day which equates to about 180 000 people movements in total. In addition, over 618 scheduled bus services use the REX both ways on a typical weekday which is about 18 000 people movements. In terms of CBD river crossings for buses this places it second behind the Victoria Bridge which carries 4,260 scheduled bus services a weekday both ways equating to over 113 000 people movements.
9

Department of Transport and Main Roads, Riverside Expressway Transport Investigation and Network Analysis, 2010
1.3.3 Event description
MR closed the REX (between Elizabeth and Hale Streets) and both Ann and Alice Street on-ramps at 4:30 pm on 17 October 2006.
This closure was authorised by the Minister for Transport and MR following the discovery by maintenance staff of:
misaligned deck sections on both the Ann and Alice Street on-rampsa hairline crack (0.04mm) in the concrete web (vertical sides) of the Ann Street on-ramp.
The REX was reopened by the Minister to traffic at approximately 11 pm on 20 October 2006 following advice by MR engineers and independent experts that it was safe for vehicles to travel on the REX under the Ann and Alice Street on-ramps.
The on-ramps remained closed while further engineering tests were conducted and were later reopened to light traffic (including buses) on 27 October 2006 at approximately 7.30 pm.
The closures immediately and significantly disrupted traffic flows into and out of the Brisbane CBD and close surrounds and caused congestion on major arterial roads.
Cyclists and pedestrians were redirected from the cycle path below the REX to paths with reduced levels of capacity, convenience and safety.
TransLink worked closely with BT, QR and BCC to provide additional bus, train and ferry services.
The Minister made a number of public announcements, during which he:
acknowledged the inconvenience to the people of Brisbanerequested their patience and understanding encouraged the use of public transport, car-pooling, staggered travel times, flexible work hourssupported traffic control changes to encourage vehicle flows.
BCC worked with MR to ensure coordination and to maximise capacity on locally owned roads.
The closure and reopening of the REX was coordinated by the QT Director-General and Chief Engineer of MR who also coordinated the involvement of other government agencies.
10

Department of Transport and Main Roads, Riverside Expressway Transport Investigation and Network Analysis, 2010
October 14
PMDiscovered rise in deck expansion joints during resurfacing
October 15
PM
light traffic only, effective as at AM October 16
closed
October 16
PMREX reopened to traffic following resurfacing worksPMAnn Street reopened to light traffic. MR prepared brief for BCC
October 17
Hairline crack discovered in Ann Street on-rampPM14:00 Ann Street ramp deemed unsafe MR calls for stakeholder emergency meeting to coordinate full closure of REX
16:30 Implement Traffic Management Plan (TMP)17:10 TransLink Media Release 117:30 MR TMP fully implemented20:30 Debrief TMP with stakeholders reviewed and adjusted responses in Traffic Management Plan (TMP)
October 18
AM
message and work on further communicationsPM MR Traffic Operators Kit distributed to stakeholders TransLink - Media release 2
October 19
AMQML, MR and BCC coordinated restrictions on road-works14:00 Installation of longer term traffic controland pedestrian fencing to REX to free up Queensland Police Service personnel
October 20
BCC Media release18:30 BMTMC discuss re-opening plans with stakehold-ers22:00 Decision made to re-open REX to all traffic at 23:15. Alice and Ann Street ramps remain closed to all traffic.
October 21
Press conference held with Premier and Minister for Transport and MR
October 23
13:00 Debrief held by BMTMC with stakeholders
October 25
PMBriefing called by MR with stakeholders on possible reopening of the ramps to light traffic19:30 Decision to delay reopening plans
October 27
16:00 Advice received to reopen Alice Street and Ann Street ramps to light traffic and buses19:25 Alice Street ramp open to light traffic19:45 Ann Street ramp open to light traffic
October 30
Debrief called by BMTMC with stakeholders
1.4 Event timeline
11

Department of Transport and Main Roads, Riverside Expressway Transport Investigation and Network Analysis, 2010
2.0 Agency incident response
2.1 Introduction
This section evaluates the management of the REX closures and reports, including:which agencies were involved in managing the closures what each agency did to manage the road, transport network and internal communications during the closures what policies and practices were used to assist the management processhow each agency communicated with the public about the closures.
2.2 Purpose and objectives
The purpose of this analysis was to:record the activities and contributions of all agenciesconduct a post-incident assessment of management policies and practices in consultation with all agenciesmake incident management observations that could be considered for future management of transport incidents.
2.3 Methodology
The BMTMC coordinated an initial operational review of how all groups responded to the closure through the members of the Brisbane Incident Management Coordination Group (BIMCG) and other involved agency personnel.
The chronology of agency activity and some background information were collected from personnel from involved agencies. RETINA team members met with agency representatives to clarify, discuss and provide more detail as required.
2.3.1 Agencies involved in the review
MRTransLink BCCQPS
QASQMLAirtrain
2.3.2 Issue-specific groups, committees and centres involved in the review
Brisbane Metropolitan Transport Management Centre (BMTMC)
The BMTMC operates under and is governed by an alliance agreement between BCC and Queensland Government (acting through MR and QT). Their key role is to service the road users and public transport patrons.
Brisbane Incident Management Coordination Group (BIMCG)
The BIMCG sets the policies that coordinate the delivery of multi-agency traffic management operations and includes
Strategic Traffic Incident Management Committee (BSTIMC), which was established under a Memorandum of Understanding (MOU) between BCC, QPS and MR in 2003.
12

Department of Transport and Main Roads, Riverside Expressway Transport Investigation and Network Analysis, 2010
Brisbane Strategic Traffic Incident Management Committee (BSTIMC)
The BSTIMC includes senior executives from each agency and manages the 2003 MOU.
Brisbane City Council Events Operation Centre (EOC)
The EOC coordinates BCC’s response and recovery in the event of a disaster by maintaining communications with the council stakeholders and state authorities. It analyses the needs of affected areas and coordinates the deployment of available resources.
2.3.3 Inter-agency agreements considered in the review
Traffic and Road Use Management Protocol (2003)
This protocol represents a formal agreement between MR, QPS and QT to work closely together and to coordinate traffic and road-use management activities.
Memorandum of Understanding (MOU) on Incident Management (2003)
This MOU guides the working relationship between BCC, QPS and MR during planned closures or unplanned traffic incidents in Brisbane. It is managed by the BSTIMC to ensure rapid and coordinated response to incidents and to keep traffic moving safely.
2.4 FindingsBelow are the summarised findings of each agency’s participation in the management and operation of the road and transport network during the closures.
2.4.1 Network operations, internal communication and traffic management activity
MR
The REX is part of the State controlled road network managed by MR. During the closure the coordination role of incident management and traveller information for the state and local government road network in Brisbane was performed by the BMTMC under direction and in partnership with BCC and MR. The BMTMC was operating temporarily from MR’s HA Lowe Traffic Management Centre (until purpose built premises were completed in December 2006 at Brisbane Square). During the closure the facility’s resources were stretched to capacity. It was also noted that these relationships and incident management processes could be further refined to improve clarity.
Coordination of Response
The Director-General of QT and MR coordinated the overall operational response on behalf of the department and: ensured all stakeholders were kept informed and involved in developing plans to re-open the REX as soon as the risk to the travelling public had been resolvedconducted daily cross-agency working meetings with senior officers to coordinate responses to operational issuesapproved a range of policy decisions to improve traffic flow during the incident, including:removing tolls on the Gateway Bridge during peak periodsopening bus (not Busways) and transit lanes to general traffic.
Traffic Operations
MR Service Level Agreement Manager worked with the BMTMC Director to coordinate all stakeholder briefings and debriefings. These meetings developed traffic management plans and communications responsesPrincipal Engineer (Infrastructure Delivery) provided information directly to the Service Level Agreement Manager on ramp conditions and executive decisionssignal engineers and technical officers controlled traffic flows to and from the motorways to optimise local and through traffic flows MR RoadTek was responsible for labour force and traffic control devices. Additional traffic control was deployed as required using sub-contractors.
13

Department of Transport and Main Roads, Riverside Expressway Transport Investigation and Network Analysis, 2010
BMTMC
the BMTMC Director, along with operations staff, undertook instructions and processes provided by MR and arranged briefings and de-briefings with stakeholders as requestedthe BMTMC provided monitoring and manipulation of Intelligent Traffic Systems provided by Main Roads and BCC. This information helped relevant agencies to communicate with motorists, public transport users, pedestrians and cycliststhe BMTMC undertook a lead role as required by MR Metro District in updating key BCC and MR personnel with information via e-mail, telephone and SMS messaging.
BCC
BCC considered the closure as critical and made the decision to use the EOC to manage the BCC effects of the closure for the city of Brisbane.
Traffic
Attended briefings on network operations involving local government roads.Manually reworked the signal timing plans within the CBD to improve traffic flows. Changes were based on observations via CCTV and reports from bus drivers and the QPS. Introduced parking restrictions to improve the capacity of city roads.Cancelled road permits where possible.
Brisbane Transport (bus)
Attended briefings on network operations involving transport routes.Key operational staff met at the Bus Operations Centre to develop route diversion plans. Key objectives were to:
maintain service integrity where possibleminimise the number of stops and trips missedconduct contingency planningmaximise bus availabilitycomply with legal requirements regarding fatigue management legislation etc.
Other actions to assist operational running included:
increasing resourcing of the Brisbane Transport Network Coordination Group (bus operations)assisting passengers find relocated stops and servicesproviding a liaison officer to the EOCdeferring non-essential maintenance to increase bus availabilityadjusting rosters to increase driver availability while complying with fatigue management requirements.
Ferries
Extra Brisbane ferry services were provided in response to increased passenger demand.
QPS
Attended briefings on network operations.Conducted audits after the initial Tuesday afternoon peak hour to ensure resources were used appropriately, and that safety and traffic flow were the highest priorities.Opened their Major Incident Room to provide information and assistance as required to the BMTMC. Deployed staff to the H.A Lowe Traffic Management Centre to assist BMTMC operators gather and circulate real-time information across agencies.Used CCTV network for police operations during the incident.
14

Department of Transport and Main Roads, Riverside Expressway Transport Investigation and Network Analysis, 2010
QF&RS
Attended briefings on network operations.Liaised with MR and BMTMC to keep emergency response plans current and communication paths open.
QAS
Attended briefings on network operations.
Informed all staff of closures and alternative routes by way of internal memorandum from the Assistant Commissioner of Brisbane Region.
QML
Attended briefings on network operations.Gateway Bridge toll booth operators were stationed in front of the booths to direct free flow movement of traffic during the toll free periods.
TransLink
Attended briefings on network operations involving transport routes.Disseminated information to the public about public transport services and changed traffic conditions. Regularly provided bus and train driver feedback on road and network conditions to BMTMC.Managed overall communications, service increases, bus timetabling and re-routing for all TransLink operators (BT and private operators).Met BT, BCC and QR Citytrain staff to plan longer term strategies should the closures continue.
QR
All available rolling stock was utilised to increase the number of services on the QR Citytrain network.Provided additional train carriages to Airtrain to add capacity.
Airtrain
Engaged additional operations staff to manage increased passenger numbers, maintain passenger safety and customer service levels. Made necessary changes to staff rosters and overtime budgets.
2.4.2 Network operations, internal communications and traffic management observations
Strengths
The overall closure was managed well and the cooperation between agencies was impressive given this was the first time the network had been tested to such an extent. Potential traffic impacts were substantially lessened by the following:
existing TMPs in place as part of the planned maintenance work to resurface the REX (conducted in September
cooperative multi-agency relationships were established at an operational level making the situation easier to manageQPS expertise in incident management contributed to help audit, communicate and amend traffic management decisions as required in consultation with the BMTMCco-location of MR and BCC traffic operations during the incidentCCTV intelligence gathering and reports from QPS and bus driversquick response to deploy additional public transport services and optimal use of network infrastructurestakeholders’ commitment to ensuring the best service delivery in the situationno other major incidents or other major events significantly affecting the network around the CBD during the closure.
15

Department of Transport and Main Roads, Riverside Expressway Transport Investigation and Network Analysis, 2010
Challenges
The incident highlighted the delicate balance required of the transport network to meet the travelling public’s needs. It also indicated that longer term closures would require additional resourcing and long term multi-agency planning. Challenges faced by the agencies include:
Existing construction and maintenance work being carried out on the South East Busway (SEB) reduced its capacity and caused additional delays during the closure. Additionally traffic that normally travelled over the Captain Cook Bridge was diverted via Victoria Bridge.Lack of clarity regarding agency responsibilities and cross agency communication raised questions about:
- who had the decision making responsibility for network operations on both state and local government roads- how best to obtain up to date status of the structural investigations and resulting network impacts.
The role of the BMTMC in managing road based traffic and public transport operations for the greater Brisbane area on behalf of the state and local government alliance members. Some relationships were not identified and maintained during the closure affecting intra- and inter-agency communications:
- areas included BCC media and MR Strategic Risk Management (Corporate Governance) which created delays distributing information - stakeholders such as Airtrain and BAC did not receive information prior to its distribution to the media.
Very little documented planning or operational instruction was undertaken throughout, with options being developed and implemented in response to the changing network conditions. This created difficulties in coordination and relied heavily on stakeholder consistency in understanding and implementation. Timely TMP documentation dissemination also proved difficult as the required resources were limited.Limited existing TMPs in place to use as reference.CCTV and data collection gaps, both public transport and road, across the network limited real-time decision-making opportunities and post event analysis. Communication of reopenings was often at short notice and without consultation with all stakeholders to discuss impacts.No central reference point or system for managing road closures to enable understanding and impacts on decisions made.Signal coordination across the network was not able to respond quickly as MR and BCC run separate systems that don’t communicate directly with each other requiring manual manipulation to alter sequencing.Public transport experienced some network congestion issues.
2.4.3 Policies and practices: application
A number of existing policies and practices were used during the closure.
Existing traffic management plans were used to plan responses to the closure
Existing traffic management plans prepared by MR Traffic Operations were used as a basis for planning traffic diversions.BCC and MR have worked extensively in the past to develop traffic and incident management procedures for BMTMC operations.All agencies related to traffic and incident management participated in the development and adjustment of the traffic management plans.Previously, a series of desktop exercises involving hypothetical scenarios were also undertaken with MR, QPS and BCC.
16

Department of Transport and Main Roads, Riverside Expressway Transport Investigation and Network Analysis, 2010
Existing incident and traffic management procedures used by the BMTMC
The BMTMC performed traffic and incident management procedures and protocols as approved by MR and BCC.Multi agency relationships and arrangements
MR used established relationships to identify an initial stakeholder group for briefings and de-briefings. Other formal agreements used included the MOU on Incident Management in Brisbane between MR, BCC and QPS; Traffic and Road Use Management Protocol and Queensland Traffic Incident Management Strategy.
BCC Event Operations Centre (EOC)
BCC considered the closure as critical and made the decision to use the EOC to manage the BCC effects of the closure.
Public transport planning
Key transport planners and operations staff from TransLink and BT worked together to decide the most suitable course of action, then followed up and updated decisions as the situation changed. Existing incident management plans, developed to respond to specific public transport incidents, were used to guide the responses.
Debriefing Sessions
Most agencies conducted debriefs after the REX had reopened to reflect on their operations, gather learnings and develop recommendations for further investigation.
2.4.4 Policies and practices: observations
Strengths
The established relationships and protocol agreements in place to manage the cross agency cooperation and coordination of traffic incidents in Brisbane helped contribute significantly to management efficiencies.
Challenges
A lack of formal information systems to support network operation and communications, particularly mapping facilities and documentation, impeded timely and accurate information sharing.Lack of knowledge of policy, practices and systems in place within each agency and across agencies to deal with critical incidents, across all disciplines including operations and communications.Inability to adequately classify the incident level and invoke appropriate management systems affected the over-
other services was large and potentially long term.Greater involvement of specialists in critical incident decision making in traffic and transport policy and planning, and the potential impacts, risks and issues, is needed.
2.4.5 Public communication activity
Below are the summarised findings of each agency’s communications activities during the closures. The list of public communication activities is detailed in section 3.0, Media Incident Responses.
17

Department of Transport and Main Roads, Riverside Expressway Transport Investigation and Network Analysis, 2010
MR
MR Metropolitan District Communications Team (Metro Comms) provided up to date media releases as conditions changedMR Media and Government Liaison Branch prepared media materials for public statements by the Minister,
Both groups organised radio interviews about the traffic conditions and encouraged commuters to use public transport.Media enquiries, public phone and email enquiries were dealt with by both Metro Comms and corporate media units.Press conferences were held and photo opportunities provided.MR and QML coordinated information about roadwork restrictions across the network.
Metro Comms also provided:
scripting for BMTMC operators for use on the 13 19 40 hotline and websitemessages for placement on MR and BCC network variable message signs (VMS)regular updates on project and closure information to the Main Roads website emails to all identified stakeholders advising of ramp re-openings information to radio stations and stakeholders of ramp testing closuresdetour maps to stakeholders, including Bicycle Queensland for distribution to members and inclusion on their websitea Traffic Operator’s Kit for all emergency services, police, call rooms (including BCC, QML) and major stakeholders (including the RACQ and taxi services) with detailed information on closures to ensure a uniform message.
BMTMC
The BMTMC updated traveller information on behalf of MR and BCC to:
traffic report line 13 19 40traffic report website 131940.qld.gov.aupermanent and portable VMSmajor radio stations in Brisbane, through an agreement with Australian Traffic Network (ATN) the website http://www.ourbrisbane.com.auABC and community radio.
BCC
Call centre briefings were conducted providing key council messages, public transport, traffic and parking restrictions, alternative routes, cycling and walking, waste collection and BMTMC information.Community announcements were released.
TransLink
TransLink officers were deployed to affected bus stops to advise passengers about service changes.Posters were installed at affected bus stops in the CBD.Media releases were issued and radio interviews conducted.TransLink’s website (http://www.translink.com.au) and call centre was updated as conditions changed. Additional staff were engaged to field enquiries.Public transport messages included with MR public notices.
18

Department of Transport and Main Roads, Riverside Expressway Transport Investigation and Network Analysis, 2010
QPS
QPS officers were located at strategic intersections advising public of closures and restrictions.Media releases (18 and 20 October 2006) were issued advising of closure and repeating MR media release information.
QML
During the Gateway Bridge toll free periods operators were stationed in front of the booths to direct free-flow movement of traffic.VMS displayed traveller information to assist in trip decision making.Media releases were issued and radio interviews conducted.
2.4.6 Public communication observations
Strengths
Public communication paths reflected those used in the planned maintenance work to the REX between September and October 2006 and so were able to be used quickly and effectively. Various media units used a diverse range of media to ensure maximum saturation including radio and press advertising, web announcements, flyers to affected residents, and over 80 VMS.Efficient communication processes in MR Metropolitan District meant that operational information about the closures was communicated quickly to relevant outlets.Ministerial office support and senior MR/QT staff involvement ensured adequate information saturation was achieved.Public showed patience and understanding and adapted well to the short-term situation.
Challenges
Extensive publicity was issued around the closures for safety and maintenance purposes, however television coverage focused on delays.The absence of a designated contact point for public communication created some confusion in the coordination and dissemination of information.Additional VMS (portable and permanent) and other en route traveller information devices would increase the ability to advise travellers of changing road conditions quickly, as did needing to manually change some boards.Media focus remained on the closure even after reopening and on going maintenance information was released by MR and the Minister.
3.0 Media incident responses
3.1 Introduction
This section reviews related media coverage during and after the REX closure and identifies gaps between media coverage and agency communication activity. It summarises the objectives, methodologies and findings for:
Media Monitors media analysisInternal media analysis Media and communication activity timeline.
The purpose of this research was to:
compare what was reported by the media with what media communication was produced by state and local government organisations understand media coverage of agency communication to improve strategic planning and coordination of
communication during future transport network disruptions and travel behaviour change initiatives.
19

Department of Transport and Main Roads, Riverside Expressway Transport Investigation and Network Analysis, 2010
3.2 Media Monitors media analysis
3.2.1 Objectives
The overarching aim of the Media Monitors analysis was to provide a statistically valid, in-depth quantitative analysis on overall media coverage measured in terms of its positioning, prominence, messages communicated and other key variables. (The complete Media Monitors Media Analysis Report is included as Technical Appendix B.)
The objective was to analyse the likely impact and affects of media coverage on the public’s attitude and choice of mode and route during the REX closure.3.2.2 Methodology
QT engaged Media Monitors to provide quantitative information on the volume of media coverage in various regions and coverage by categories, to assist in the evaluation of publicity and planning media strategies.
The period specified for analysis was 17 to 27 October 2006. This allowed the research to capture articles in suburban weekly newspapers, which were published the week after the closure (24 to 26 October 2006).
Media Monitors were requested to research all media coverage by:
type/channelcategory (infrastructure, traffic delays, public transport delays, overcrowding, direction to TransLink website)organisation (Queensland Government, TransLink, QR, BCC, BT, QES, public, other) tone (positive, negative, neutral)media release generated coverageleading medialeading spokesperson.
Specific breakdown by radio station and format was also requested to understand the impact of talkback format in relation to compliments and complaints.
In order to assess how the closure was presented to the public by the media, coverage of leading sub-issues for public transport was requested.
These include:supply of extra services overcrowding on servicestrain delays
3.2.3 Findings
Media Coverage
Media coverage was dominated by syndicated television and radio. A total of 23 radio stations and eight television stations covered the REX closure from 17 to 28 October 2006.
The Media Monitors Media Analysis Report (2006) outlines substantial coverage on Brisbane metropolitan radio including the Mornings and Drive programs, broadcast on ABC 612 Brisbane and 4BC Brisbane respectively. Coverage of the REX closure was also broadcast on prominent television programs including Sunrise on Channel 7, National Nine News and the Today program on Channel 9.
Printed coverage was led by the Courier Mail which published 36 articles reporting the closure of the REX and its ramifications (Media Monitors, 2006:3).
20

Department of Transport and Main Roads, Riverside Expressway Transport Investigation and Network Analysis, 2010
Figure 4 – Coverage
broadcast (radio and television)
Figure 3 – Coverage – press
Figure 2 shows the breakdown of coverage to be 49 per sent (1,597 broadcast summaries) radio; 47 per cent (1,491 broadcast summaries) television and four per cent (112 press articles) press.
The Media Monitors report (2006) notes that both press and broadcast media reflected a similar proportion of category
in media coverage, and infrastructure issues were the main category of coverage. Inspections of the REX by MR and subsequent statements by Minister for Transport and Main Roads Paul Lucas and Premier Peter Beattie had the highest volume of coverage within this category (Media Monitors, 2006:5).
21
Figure 2 – Coverage by media type

Department of Transport and Main Roads, Riverside Expressway Transport Investigation and Network Analysis, 2010
Tone and attitudes
Media Monitors found that when considering all media coverage 65 per cent (2,082 items) was neutral; 25 per cent (812
The report showed that neutral coverage of the REX closure occurred predominantly on radio, and was evidenced by the large volume of factual news reports during the period. It also determined that the majority of press coverage was neutral in tone (Media Monitors, 2006:8).
Whilst the Media Monitors analysis also considered television coverage to be mainly neutral (again reflecting a high volume of news reports) the most unfavourable coverage was on television. Television included reports referencing traffic ‘chaos’ and public transport overcrowding. This was most notable on the syndicated programs such as Sunrise (Channel 7, 19 October 2006) and Today (Channel 9, 18 October 2006) (Media Monitors, 2006:8).
Figure 5 – Tone by media type
Observations
Electronic distribution dominated media coverage: 96 per cent electronic distribution (radio 49 per cent, television 47 per cent); four per cent print distributionElectronic media ran multiple programs and discussion programs throughout the day Radio presented the most neutral and factual coverage
The Queensland Government was the dominant spokesperson in the media, taking four of the top five positions. These Queensland Government spokespersons were:
The Honourable Rachel Nolan, Minister for Transport The Honourable Paul Lucas, Minister for Main Roads
Infrastructure was the dominant category of coverage with issues of public transport overcrowding and delays rating low in comparison. The media gave significantly more coverage to traffic delays than to the provision of extra public transport services.
22

Department of Transport and Main Roads, Riverside Expressway Transport Investigation and Network Analysis, 2010
Observations
Electronic distribution dominated media coverage: 96 per cent electronic distribution (radio 49 per cent, television 47 per cent); four per cent print distributionElectronic media ran multiple programs and discussion programs throughout the day Radio presented the most neutral and factual coverageThe Queensland Government was the dominant spokesperson in the media, taking four of the top five positions. These Queensland Government spokespersons were:
Minister for Transport and Main Roads Paul Lucas Premier Peter Beattie
Infrastructure was the dominant category of coverage with issues of public transport overcrowding and delays rating low in comparisonThe media gave significantly more coverage to traffic delays than to the provision of extra public transport services.
3.3 Internal media analysis
Both quantitative and qualitative data was collected as part of an internal media analysis conducted by QT, as lead agency in the investigation.
3.3.1 Objectives
The objective of the internal quantitative research was to record the quantity and timing of media coverage each key organisation received during the closure period. The research records comments and quotes that were being attributed to organisations in the media. This research allowed us to analyse the coverage resulting from media releases, interviews and statements supplied by the relevant transport organisations during the closure.
3.3.2 Methodology
The research team identified and sourced where possible, all REX media coverage between 17 to 27 October 2006. Press and electronic media articles were sourced via electronic news monitoring systems and through direct print purchase. This did not include print or voice advertisements or traffic reports. Only key radio and television transcripts were acquired and assessed.
Quantitative
A research officer read through radio and television summaries and all print articles and completed a quantitative record of all references to:Portfolio (includes references to Minister)
MRQTTransLinkQRBCCPublic transportRoads.
23

Department of Transport and Main Roads, Riverside Expressway Transport Investigation and Network Analysis, 2010
Data was recorded for each individual channel, per media (radio, print, television) and was analysed by frequency per channel, by day and by category. Media coverage by volume, day, and time was cross referenced with government issued media releases, interviews and advertisements.
Qualitative
Key statements and attitudinal comments were recorded according to the following categories:interest group/organisationstakeholdergeneral public / media vox pops.
The statements and comments were cross referenced with the issued media releases. Media initiated interviews with the Minister, Premier and senior Transport and Main Roads officers was also analysed.
3.3.3 Findings
The qualitative analysis found that: interest group/organisation interviews were 22 per cent positive and 78 per cent negativestakeholder interviews were 51 per cent positive; 46 per cent negative and three per cent neutralgeneral public interviews and media vox pops were 22 per cent positive, 73 per cent negative and five per cent neutral.
Interestingly, the tone reported by the press and electronic broadcast is not substantiated by stakeholder conversations undertaken as a part of the RETINA project (see section 7.0, Stakeholder perspectives).
Inspections by MR and subsequent statements by the Minister and Premier had the highest volume of coverage. Analysis determined that the top three radio categories were: Transport and Main Road Portfolio statements (116 references on 17 stations); public transport statements (45 references on 18 stations); and Roads [including 'traffic delays'] statements (35 references on 11 stations).
Analysis showed that whilst TransLink generated a high volume of media releases with key messages and operational information, it did not receive the coverage afforded to Ministerial media releases or reports which referenced Ministerial comments or endorsements.
This research showed that while operational media releases issued by authorised officers allowed the Minister time to
24

Department of Transport and Main Roads, Riverside Expressway Transport Investigation and Network Analysis, 2010
Figure 6 - Tone and volume by specified press
focus on the issues at hand, these releases were less likely to achieve coverage than those issued by the Minister.
Figure 6 identifies the tone and volume of coverage by local Quest newspapers for each region. The majority of coverage across the regions was either positive or neutral with negative coverage localised to the South East Advertiser and Chermside Northern Chronicle. The South East Advertiser reported on the region most affected by the closure while the Chermside Northern Chronicle result was less expected as traffic impacts and congestion were less evident in this region.
Given the media most often quoted individuals and groups directly affected by the closures, it follows that the media coverage reflects stories of frustration and inconvenience.
The perception created by the media reports of the vast majority of the population being impacted by the closure is in contrast to the findings of the AC Nielsen Riverside Expressway Closure General Population Survey (2007:4), which was commissioned by QT (see Technical Appendix A). AC Nielsen found that affected residents represented only 29 per cent of the greater Brisbane population and that the vast majority of the population were not inconvenienced by the closure (see section 9.0, Community Perspectives).
The AC Nielsen Riverside Expressway Closure General Population Survey (2007:4) also identified that the general public attitude toward the closure was positive or neutral. Of those surveyed, 94 per cent supported the decision to close and 73 per cent supported the way the closure was managed.
It is interesting to note as a part of this research that radio provided the highest volume of coverage that was most neutral and factual. Radio was also identified in the AC Nielsen Riverside Expressway Closure General Population Survey (2007:67) as the most preferred communication channel to receive information in future situations.
25

Department of Transport and Main Roads, Riverside Expressway Transport Investigation and Network Analysis, 2010
3.4 Media and communication activity timeline
3.4.1 Objectives
The objective of preparing a timeline of media and communication activity was to map organisational decisions and communication responses to the changing traffic, transport and technical impacts of the closure.
The timeline plots proactive initiatives and management decisions made in the reactive environment of the closure, and identifies gaps in the communication for future reference. It also gives an insight into the affects of agency communication and the media on traffic routes and flow, commuter travel times and choice of public transport mode.
3.4.2 Methodology
All media releases and agency media communication by MR, QT and BCC were collected, collated and recorded in a chronological timeline for the event.
Where possible the timeline outlines key agency decisions and actions, media announcements and advertising and traffic and transport activities.
3.4.3 Findings
When considering the media and communication material that was made available by MR, TransLink and BCC, it becomes apparent that commercial media coverage was not directly related to the media releases or ‘direct’ to public communication being generated by the agencies.
The agencies were producing continual updates to communicate: REX closure progress alternate road routes organisational strategies such as staggered work hours to ease road and public transport congestionrecommendations to use public transport as an alternative transport mode.
Agency information was delivered via: Executive Officer radio interviews from 17 to 19 October and again on 23 October 2007daily media releases two press conferences up to date information uploaded to agency websites and call centres.
Agency media and communication
Media
Media releases were submitted by the Queensland Government and BCC on four of the five days from 16 to 20 October 2006. The releases ranged from technical and traffic updates and public transport announcements to on road motor vehicle parking restrictions. In total seven media releases were sent to press and posted on respective websites.
Two press conferences were held during the closure on 19 and 21 October 2006. Minister for Transport and Main Roads Paul Lucas, was the key spokesperson for these collaborative MR and TransLink media events.
The Transport and MR Portfolio used the new government media protocols which allowed key senior officials to provide radio interviews on request. MR was conducting radio interviews on a daily basis from 16 to 24 October 2006 (excluding 20 October). TransLink conducted an extensive range of interviews on 18, 19 and 23 October 2006, to keep the public informed of public transport service arrangements and changed conditions.
MR interviews were broadcast up to 30 times a day and QT interviews up to 16 times per day. BCC also recorded significant radio airtime on 18 October, supporting the Queensland government decision to close the REX and commenting on BT bus services and changed traffic conditions.
26

Department of Transport and Main Roads, Riverside Expressway Transport Investigation and Network Analysis, 2010
Advertising
Public notification through advertising was conducted on several levels. MR placed advertisements in the Courier Mail that ran from 18 October to 22 October 2006 as well as in all Quest Newspapers during the week commencing 22 October 2006.
MR also conducted paid radio advertising everyday from 16 to 24 October 2006 to maximise public coverage of the closure, its impacts and mitigation measures that were being put in place to assist the public plan their trips.
TransLink and BCC ran an extensive campaign to target key affected bus stops with posters and displayed public notices. 'Helping hands' staff was also deployed in the CBD and key bus stations to personally notify and assist patrons.
Website and Call centres
Queensland Government agencies updated their websites throughout the day during the period of the closure and restricted access to ramps. Data shows that MR and TransLink website hits spiked considerably during the period of 18 to 21 October 2006.
MR’s 13 19 40 traffic information website (which also included traffic web cameras as well as closure information) increased from 936 on 17 October 2006 to:
21,410 (18 October) 64,796 (19 October)32,323 (20 October)29,284 (21 October)10,696 (22 October)6,500 after the weekend.
TransLink website hits increased from 11,512 on 16 October 2006 to:14,018 (17 October)18,770 (18 October)15,957 (19 October)14,596 (20 October)11,500 (21-22 October)13,441 (23 October).
BCC website recorded 3,012 hits for the week ending 21 October 2006. The following weeks' data recorded 1,100 hits.
Regular scripts were also provided to Main Roads (13 19 40 Hotline) and BCC Call Centres. The TransLink Call Centre received a large volume of calls however the majority of the calls were complex enquiries so a generic script was not able to be used. The services were so popular that, at times, call centres were unable to cope with the volume of calls being received. Media and advertising strategies were then adjusted to direct patrons to the websites for information.
Despite communication efforts by transport related agencies, the primary media focus was on infrastructure and roads.
Public transport behaviour change and service communication became operational in nature by default, relying on established channels of public communication such as websites, call centres and bus stop signage. Website hits and call centre logs from all agencies show these existing communication channels were utilised extensively by the public during the closure period, indicating that information was being sought after and accessed by the public.
Whilst, on one hand, this is a testament to the success and effectiveness of the ongoing service awareness campaigns carried out by transport agencies, those not familiar with public transport may not have had the same level of brand or service understanding required to access the regularly updated website information. This exposes a gap in getting real time information to a target audience that may have no previous knowledge or experience with public transport or the service provided by their agencies during a major incident, when media attention is focused on “newsworthy” coverage rather than public service communication.
27

Department of Transport and Main Roads, Riverside Expressway Transport Investigation and Network Analysis, 2010
3.5 Conclusions
Review and implement integrated and coordinated communication processes, messages and contacts between MR, TransLink in order to maximise coverage of all key portfolio and service messagesThis could include coordinating pre-scripted and pre-approved key message quotes by the Minister at the commencement of incidents/campaign, to be used in subsequent and ongoing releases. These coordinated quotes should be adopted across the portfolio so that agencies are reinforcing each other's key messages and not “competing” for coverageThe need also exists for integrated and coordinated communication processes to be established between local governments and TransLink and MR in particular, in communicating public transport service information and traffic operation informationAll incident management media communication should target radio as the primary source of communicating information and key messages quickly and effectively to the public. Radio interviews by key agency spokespersons should be utilised as a means of increasing volume of coverage and delivering a factual/balanced tone to incident coverageReal time message communication channels should be investigated and could involve:
- Establishing relationships with radio outlets to communicate government information during major incidents and emergencies- SMS messaging to registered public transport users or interested individuals or groups to provide instant information and avoid congestion of call centres and websites- Email alert system to registered public and all government road and transport stakeholders- Networked control of existing real-time message boards including bus stop real-time timetables, Busway real-time timetables, Busway public announcement messaging and VMS boards- Two way radios for all Busway operators to enable direct communication with Busway drivers, particularly after hours when offices are closed
Coordinated media releases, media briefings, media interviews and service announcements should refer public enquiry to the website and warn of possible call centre delaysAll government agencies should review standardising public transport and passenger information to avoid
standard brief with coordinated messages from both agencies sent to call centres.
4.0 Network impact analysis
4.1 Introduction
This section analyses a range of traffic and public transport data to determine how the transport system responded to the closure.The section provides:
analysis of traffic volumes on the road network before and during the closurepublic transport service and patronage analysis for each provideroverall patronage assessment during and after the closurenetwork impact conclusionsrecommendations for managing future closures.
28

Department of Transport and Main Roads, Riverside Expressway Transport Investigation and Network Analysis, 2010
4.2 Purpose and objectives
The purpose of conducting a Network Impacts Analysis was to:
record the impact of the closure on the road networkrecord the management strategies applied by key public transport operatorscapture, interpret and compare patronage figures across modes and over time provide information that may be beneficial in the event that other high capacity links in the network are closed in the future.
4.3 Road analysis
4.3.1 Objectives
The key objective of the study was to analyse the changes in traffic volumes as a result of the closure.
4.3.2 Methodology
The analysis was primarily based on traffic data from counters maintained by MR and BCC.
A broad cross section of the major corridors in greater Brisbane was included in the analysis and
provides an accurate but not complete picture of traffic volumes during the closure (see Tables 1 and 2 for traffic count locations).
Analysis of MR’s traffic data was based on a comparison of data collected on 18 October 2006 with the average traffic for the other Wednesdays in October 2006. It is important to note that MR is responsible for the state controlled road network. With the exception of the Pacific Motorway, the road network generally moves from state control to BCC control closer to Brisbane’s CBD. Consequently MR traffic counters are located further from the CBD, while BCC traffic counters are generally closer to the CBD.
Analysis of BCC traffic data was based on a comparison of data collected during the week of the closure with data collected in the same week in 2004 and 2005. Unfortunately some BCC data, particularly in and around the CBD, was incomplete.
29

Department of Transport and Main Roads, Riverside Expressway Transport Investigation and Network Analysis, 2010
Location of traffic count Percentage Change (+/-) during REX Closure
Abbotsford Road @ Burrows Street, Bowen Hills (BCC) -7.00
Anzac Avenue @ Petrie Street, Petrie (MR) +2.07
Breakfast Creek Road @ Kingsford Smith Drive, Newstead (BCC) -2.50
Bruce Highway @ Dohles Rocks Road, Murrumba Downs/Griffin (MR) -2.13
Bruce Highway @ Gateway Merge, Bald Hills (MR) -0.05
Gympie Road near Darwin @ Aspley (MR) -2.63
Gympie Road near Todds Road, Lawnton (MR) +1.78
Moggill Road near Cedarleigh, Chapel Hill (MR) +0.36
Old Northern Road near Keong , Albany Creek (MR) +1.02
Samford Road near Dawson Parade, Keperra (MR) -0.21
Sandgate Road near Pritchard Street, Virginia (MR) +1.37
+0.73
Table 1 – Traffic comparison analysis for traffic north of the Brisbane River
Table 2 shows the traffic comparison analysis for traffic south of the Brisbane River.
Table 2 – Traffic comparison analysis for traffic south of the Brisbane River
Location of traffic count Percentage Change (+/-) during REX Closure
Beaudesert Road near Boundary Road, Acacia Ridge (MR) +2.73
Gateway Motorway @ Mt Gravatt Capalaba Road, Mackenzie (MR) +5.20
Gateway Motorway @ Bridge toll booths (QML) +11.0
Honour Av near Hurlton, Graceville (BCC) +9.00
+1.37
Ipswich Motorway @ Goodna (MR) +1.28
Logan Road @ Juliette Street, Stones Corner (BCC) +7.00
Logan Road near Marshall Road , Holland Park West (MR) +2.55
Pacific Motorway @ Gaza Road On ramp, Mt Gravatt (MR) -23.93
Pacific Motorway @ Stanley Street On ramp (MR) -69.70
Wynnum Road at Junction Road, Morningside (BCC) +8.20
30
4.3.3 Findings
Table 1 shows very little change in traffic volumes at MR counter locations north of the Brisbane River.

Department of Transport and Main Roads, Riverside Expressway Transport Investigation and Network Analysis, 2010
Table 2, it can be concluded that a majority of commuters travelling to and from the west on the Ipswich Motorway experienced little change. However, there was a significant increase (nine per cent) in the traffic volume using the Walter Taylor Bridge between Chelmer and Indooroopilly. There were also significant increases in traffic volumes on the Gateway Motorway and Wynnum Road and as expected there was also a significant change in traffic in the north-south corridor along the Pacific Motorway.
During the closure, on 18 October 2006, there were approximately 34 000 fewer vehicles on the Pacific Motorway at Gaza Road (8 kilometres from the CBD) than on 11 October. If it is assumed that on average 1.2 people travelled in each vehicle, a total of 41 000 commuters made alternative transport arrangements such as different route, mode, deferment or cancellation of trip.
Table 3 indicates a significant increase in traffic volumes in and around the CBD with an average increase of over 20 per cent on the arterials approaching the CBD.
Table 3 – Traffic comparison analysis of the CBD
Location of traffic count Percentage Change (+/-) during REX Closure
+32.50
Coronation Drive @ Graham Street, Milton (BCC) +45.00
Elizabeth Street On Ramp @ William Street, CBD (BCC) Incomplete data
Grey Street Bridge @ Saul Street, North Quay (BCC) Incomplete data
Kemp Place (North bound), (BCC) +21.60
Margaret Street On ramp @ George Street, CBD (BCC) Incomplete data
Milton Road @ Castlemaine Street, CBD (BCC) +8.00
+21.00
River Terrace @ Main Street, Kangaroo Point (BCC) +19.00
Daily traffic volume data sets for the three week period from Monday 9 October to Sunday 29 October 2006 were also analysed for six key sites across the Main Roads network. The sites were:
When compared with traffic volumes for weeks either side of the closure and generally with traffic from similar periods in the previous two years (2004 and 2005) this analysis provides an appreciation for the magnitude of the impact of the REX closure on traffic volumes on these roads.
31

Department of Transport and Main Roads, Riverside Expressway Transport Investigation and Network Analysis, 2010
Figure 7 – Weekly traffic volumes Pacific Hwy North of Gaza Rd
Figure 8 – Weekly traffic volumes Pacific Hwy at Park Rd
32

Department of Transport and Main Roads, Riverside Expressway Transport Investigation and Network Analysis, 2010
Figure 9 – Weekly traffic volumes Gympie Rd at Darwin St, Aspley
Figure 10 – Weekly traffic volumes at Samford Rd, Dawson Pde, Keperra
33

Department of Transport and Main Roads, Riverside Expressway Transport Investigation and Network Analysis, 2010
Figure 11 – Weekly traffic volumes for Western Arterial at Wardell St
Figure 12 – Weekly traffic volumes, Gateway South at Mount Gravatt, Capalaba Rd
34

Department of Transport and Main Roads, Riverside Expressway Transport Investigation and Network Analysis, 2010
4.4 Public transport
4.4.1 Objectives
To understand how key public transport providers and commuters responded to the closure and what impact their response had on the overall network.
4.4.2 Methodology
The following information was collated and assessed:
Unfortunately there was no pedestrian and cycle data collected during the closure for analysis.
4.4.3 QR
Service Changes
Additional train capacity was introduced to the QR Citytrain network on 18 October 2006. These additional services ceased on 25 October 2006. This additional capacity generally consisted of the following services in both the morning and afternoon peak:
One service to Mitchelton upgraded from three to six carriages
Ipswich LineOne additional six carriage service from City to Corinda One service altered to continue from Darra to Goodna
Cleveland LineThree services upgraded from three to six carriages and altered to stop at all stations to ClevelandOne service altered to continue all stations Manly to Cleveland
Gold Coast/Beenleigh LineTwo Gold Coast and two Beenleigh services upgraded from three to six carriagesOne service altered to continue all stations Kuraby to Beenleigh
Airport LineTwo services upgraded from three to six carriages
Caboolture, Shorncliffe and Doomben servicesNo Alterations.
Over and above these service changes, passenger numbers at stations were monitored by staff and additional services
more frequent stops for express servicesadditional express services to the city when carriages were full.
In real terms this resulted in a potential increase of train patronage per day as shown in Table 4.
35

Department of Transport and Main Roads, Riverside Expressway Transport Investigation and Network Analysis, 2010
Table 4 – Rail capacity added during closure
QR Service Additional Capacity AM peak Additional Capacity PM peak
9 carriages 9 carriages
Ipswich Line 6 carriages 6 carriages
Cleveland Line 9 carriages 9 carriages
Gold Coast / Beenleigh Line 12 carriages 12 carriages
Airport Line 6 carriages 6 carriages
Caboolture, Shorncliffe and Doomben services
Nil Nil
QR ticketing records show there was a 14 per cent increase in ticket sales during the week of the closure. During the closure, typical six carriage configurations were required to accommodate between 850 and 900 passengers. This level of service is more commonly referred to as “crush” levels. By way of comparison non-crush services are typically six carriage configurations that comfortably accommodate approximately 600 to 750 passengers.
Patronage: measurement constraints
While additional capacity was introduced by QR, precise patronage calculations during the closure were unable to be made for the following reasons:
there are no systems in place for recording the numbers of rail passengers by line or stationany valid TransLink ticket was accepted for rail travel during the closure. Consequently, increases in rail ticket sales did not represent the entire increase in rail patronagethe majority of regular rail passengers used seasonal tickets and most of these would have been purchased prior to the closure and be valid during the closure.
Patronage: anecdotal information
Experienced QR staff reported the following observations:the average daily patronage of 160 000 people increased by 20 to 25 per cent during the closure, adding between 32 000 and 40 000 passengers per day, an observation supported by the TransLink data in Table 4substantial increase in passenger numbers was observed specifically along the Ipswich line at Ipswich and
normal peaks between 6.00 am and 9.00 am and 4.30 pm to 7.00 pm were lengthened. There were many people leaving as early as 2.30 pm in the afternoon peak, with the morning peak extending to 10.30 am.
Service sustainability
QR believes the strategies implemented to increase services were not sustainable beyond the closure period for the following reasons:
drivers and guards were at their maximum hours for the monthevery item of available rolling stock was in service. If service levels remained as high for longer periods, failures could be expected due to the reduced opportunities for maintenanceQR surveys indicated passengers were tolerant of the “crush’ conditions early in the week but to the week’s end were becoming less tolerant.
36
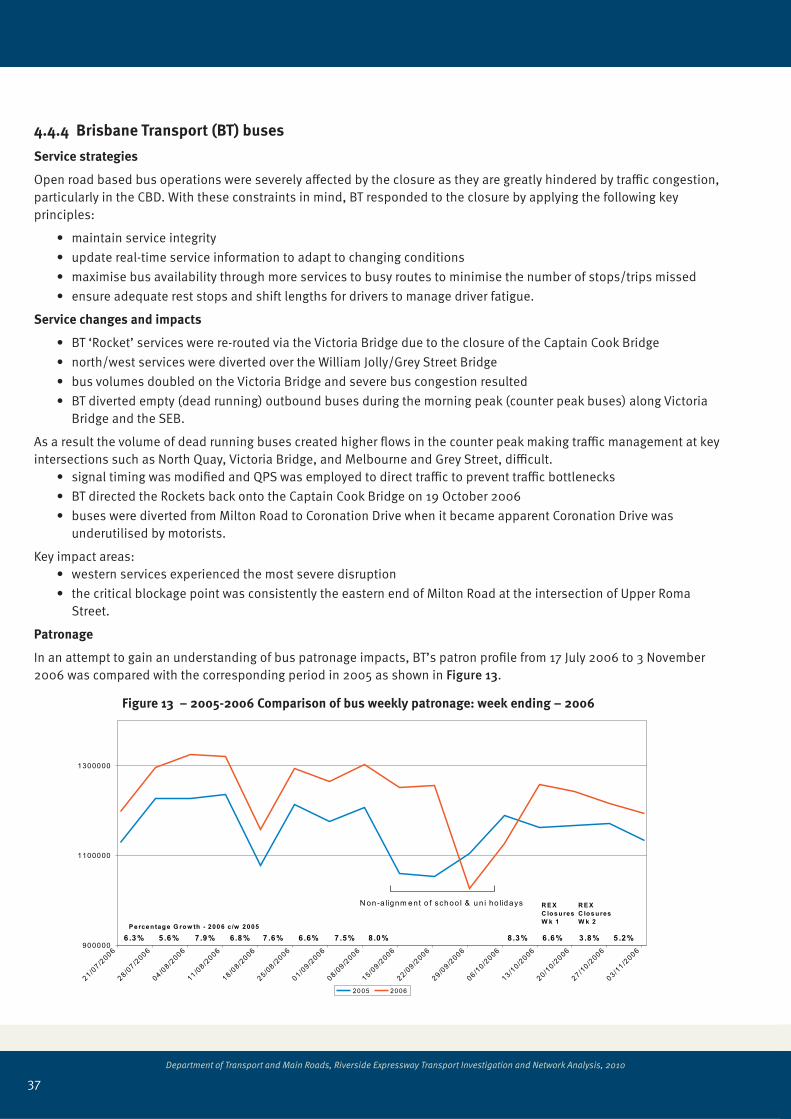
Department of Transport and Main Roads, Riverside Expressway Transport Investigation and Network Analysis, 2010
4.4.4 Brisbane Transport (BT) buses
Service strategies
Open road based bus operations were severely affected by the closure as they are greatly hindered by traffic congestion, particularly in the CBD. With these constraints in mind, BT responded to the closure by applying the following key principles:
maintain service integrityupdate real-time service information to adapt to changing conditions maximise bus availability through more services to busy routes to minimise the number of stops/trips missedensure adequate rest stops and shift lengths for drivers to manage driver fatigue.
Service changes and impacts
BT ‘Rocket’ services were re-routed via the Victoria Bridge due to the closure of the Captain Cook Bridgenorth/west services were diverted over the William Jolly/Grey Street Bridgebus volumes doubled on the Victoria Bridge and severe bus congestion resulted BT diverted empty (dead running) outbound buses during the morning peak (counter peak buses) along Victoria Bridge and the SEB.
As a result the volume of dead running buses created higher flows in the counter peak making traffic management at key intersections such as North Quay, Victoria Bridge, and Melbourne and Grey Street, difficult.
signal timing was modified and QPS was employed to direct traffic to prevent traffic bottlenecks BT directed the Rockets back onto the Captain Cook Bridge on 19 October 2006 buses were diverted from Milton Road to Coronation Drive when it became apparent Coronation Drive was underutilised by motorists.
Key impact areas:western services experienced the most severe disruptionthe critical blockage point was consistently the eastern end of Milton Road at the intersection of Upper Roma Street.
Patronage
In an attempt to gain an understanding of bus patronage impacts, BT’s patron profile from 17 July 2006 to 3 November 2006 was compared with the corresponding period in 2005 as shown in Figure 13.
Figure 13 – 2005-2006 Comparison of bus weekly patronage: week ending – 2006
37

Department of Transport and Main Roads, Riverside Expressway Transport Investigation and Network Analysis, 2010
Determining the cause of impacts on bus patronage during the closure is complicated by a number of factors:
the non-alignment of school and university holidays affecting the four weeks around the closuresthe typical impacts of university exams during October and ensuing pre- and post-Christmas holidaysthe significance of single day events such as pupil free days.
Due to the variance of major event times each year and the impacts of single day events on patronage, weekly or daily analysis and annual comparisons should be treated with caution.
As shown, BT’s annual patronage growth for 2006 prior to the closures was in the range of six to eight per cent. During week one of the closures this growth slowed (compared with the preceding week), and slowed further in week two. This was possibly due to the pupil free day on 23 October 2006.
The analysis of the available data does not show any consistent increase or decrease in bus patronage related to the REX closure.
Patronage: regional assessment
consistently performed above the network average in terms of patronage growth, compared with 2005, and show slightly better performance in the weeks of the closures. More detailed assessment of the 100 series showed a patronage increase in Route 130, however this corresponds with the addition of nine extra peak trips in each direction on 23 October 2006 and is therefore unlikely to be directly related to the closures.Eastern suburb routes (known as the 200 series) performed at or slightly above the average for annual patronage growth.Northside routes (known as the 300 series) performed at or slightly below the average for annual patronage growth.Western routes (known as the 400 series) performed consistently and significantly below the average, particularly in week one of the closures. However a spike in week two was recorded and appears to be the result of the introduction of the Route 444 Moggill BUZ on 23 October 2006, which has experienced a growth in patronage of 40 to 50 per cent.Cityxpress corridors displayed the standard downward trend evident at this time of year.
4.4.5 South East Busway (SEB)
It is evident that the SEB proved invaluable to the overall functioning of the bus network system during the closure. It is estimated that Victoria Bridge carried more than 350 inbound buses (double the usual number of 177 buses) per hour during the closures as a result of BT diversions. As a result of the increased volume the inner part of the SEB did not cope efficiently and bus queues occasionally extended back to Mater Hill Busway Station, which is about two kilometres from the city end of the SEB.
Unrelated to the closure, services operating on the outer SEB beyond Buranda Station were delayed between five and 15 minutes due to ongoing resurfacing works between Greenslopes and Griffith University. Service delays increased total trip times while the variability of the delay is thought to have adversely affected commuter trust in the SEB’s reliability, particularly routes 111 and 160.
4.4.6 Ferries
Additional ferry services were introduced by BCC and analysis indicates that ferry patronage increased by approximately 30per cent during the time of the REX closure when compared with the same days in the week prior to the closure. Although this growth is significant the increase is from a relatively low base and the overall impact on the transport task was relatively small compared to bus and rail.
38

Department of Transport and Main Roads, Riverside Expressway Transport Investigation and Network Analysis, 2010
4.5 Overall patronage assessment
4.5.1 Constraints
collection of patronage data during the closure was secondary to coordinating the overall transport task the use of bus tickets and seasonal tickets for train travel render it virtually impossible to obtain accurate patronage figures for the closure period BT data is highly variable as it is significantly impacted by wet weather, school and university holidays, exam timetables and daily events, thus making it difficult to isolate the effects of specific occurrences.
4.5.2 Patronage analysis
TransLink’s data has been analysed in Table 5 to estimate public transport patronage changes according to mode.
Tuesday
17/10/2006
Wednesday
18/10/2006
Thursday
19/10/2006
Friday
20/10/2006
Change
Percent
Change Change
Percent
Change Change
Percent
Change Change
Percent
Change
Rail 3,802 3.0% 30,890 26% 28,811 24.0% 21,371 20.0%
Bus (BT Only)*
-13,100 -6.0% -4,243 -2% -187 0.0% -837 0.0%
59 0.0% 6047 38% 5991 40.0% 4464 25.0%
Combined -9239 2.4% 32,694 8.3% 34,615 8.7% 24,998 6.5%
Table 5 – Estimated changes to PT patronage during closure
39

Department of Transport and Main Roads, Riverside Expressway Transport Investigation and Network Analysis, 2010
Figure 14 – Public transport mode shift during closure
The data indicates that public transport patronage (not including services other than BT and QR) increased by approxi-mately eight per cent during the closure.
4.5.3 Patronage retention
Table 6 compares patronage figures for the week prior to the closure (week commencing 8 October 2006) with patronage figures three weeks after the closure (week commencing 5 November 2006), to see if commuters retained their use of public transport when the REX was reopened.
Wednesday
8/11/2006
Thursday
9/11/2006
Thursday
9/11/2006
Friday
10/11/2006
Change
Percent
Change Change
Percent
Change Change
Percent
Change Change
Percent
Change
Rail -2378 -1.63% 4835 4% -34 -0.03% 5275 4.93%
Bus (BT Only)*
-8980 -4.06% -15700 -7.04% -11182 -4.93% -6766 -3.0%
-42 -0.24% -1334 -8.28% -603 -3.98% 10 0.06%
Combined -11400 -2.96% -12199 -3.39% -11819 -3.26% -1481 -0.42%
Table 6 – Retention in changes to PT patronage
* The analysis of change undertaken to date has not considered the effect of patronage for other bus operators
Table 6 indicates that there does not appear to be any retention of the increased public transport patronage following the reopening of the REX, except for a slight increase in rail usage. However the reductions in patronage are consistent with the typical decline at this time of year and are not related to the closure.
40
-10000
-5000
0
5000
10000
15000
20000
25000
.
23%
35%
1%
8%
Overall Ferry Bus
Rail
V
V V
V

Department of Transport and Main Roads, Riverside Expressway Transport Investigation and Network Analysis, 2010
4.6 Conclusions
4.6.1 Traffic
The closure of the REX had a major effect on the city road network with traffic increases of between 10 and 20 per cent on the major arterials within one kilometre of the CBD.
The Gateway Motorway and some eastern arterial roads were also affected while most roads outside the CBD’s one kilometre radius generally experienced little impact.
The removal of the Gateway Bridge toll during the closure is responsible (at least in part) to the increase in traffic on the Gateway. The cost to Government in lost revenue which resulted from removal of the tolls for the peak periods for the five days during the closure was in the order of $525 000 excluding GST.
Better collection of traffic data and passenger transport patronage figures in the future will improve understanding of modal shifts. The planned Smart card ticketing system is expected to collect more reliable passenger data on public transport services.
The current road network in and around the CBD is at capacity during peaks and consequently severe congestion results if there is disruption to major transport links, particularly those providing a river crossing into the CBD.
4.6.2 Public transport
Line haul passenger transport services such as Citytrain and the SEB were most effective in getting people in and out of the city. This was reflected in the substantial increase in rail patronage figures.
The increased traffic volumes in and around the CBD had a major effect on bus operations, particularly from the western and northern suburbs and on the Victoria Bridge. Bus figures, although down from the average, were only slightly lower.
When complete, the Inner Northern Busway and the new King George Square Busway Station should improve the bus network. Improved bus access into the city from the western suburbs would also improve reliability.
Although a mode shift from private motor vehicles to public transport during the closure was recorded, the extra rail and bus services introduced to make the shift possible cannot be sustained over time without additional rolling stock and personnel.
Rail contributed more additional capacity to the system during the closure than any other mode. This is because bus and road transport were affected by the increased congestion on the road network.
QR
Without a system to record rail passenger numbers it is not possible to accurately quantify patronage increases during the closure. However, based on ticket sales and staff observations it is apparent that rail played a critical role in compensating for the loss of road network capacity.
QR has limited capacity to sustain an increase in services to the degree achieved during the closure. Existing rolling stock and human resources are already at or nearing capacity and consequently there are insufficient reserves to maintain the higher capacities for prolonged periods.
Bus
There is an observable difference across the four geographic regions. Patronage of the southern and eastern route groups reduced to less than the average. Conversely, the western route group increased to more than the average. However, a comparison of the 2006 closure weeks with 2005 shows a similar above average decline in the western route group, which may be attributed to the impact of the University of Queensland’s pre-exam study period. The decrease in patronage may also be attributed to western region bus services being most affected by traffic delays during the closure.
41

Department of Transport and Main Roads, Riverside Expressway Transport Investigation and Network Analysis, 2010
5.0 Case study learnings
5.1 Introduction
This section reviews the management of six transport network disruptions across Canada, USA, UK, Japan and Australia. This research was conducted to compare the impacts, agency responses and travel behaviour changes with Queensland’s management and experience of the REX closures.
5.2 Purpose and objectives
The purpose of this research was to examine international transport management trends and traffic impact patterns for consideration in future incident management in Queensland.
The review examined international case studies to:understand the responses of government agencies to the event itself and longer term opportunitiesidentify before, during and after incident travel behaviour impacts and trends
compare agency responses, traffic impacts and trends to the REX closure.
5.3 Methodology
International incidents were considered a suitable case study, if they:resulted in the removal of an important transport linkwere caused by disaster, catastrophic failure, major repair or maintenance work or through proactive policies to reduce road spacehad sufficient published research to review.
Each case study was analysed to answer the following questions:what were government agency responses to the incident?what happened to traffic patterns and public transport patronage?how effective were measures to promote the use of alternative transport modes and reduce congestion in the long term?what travel behaviour changes occurred over the short, medium and long term?what happened to traffic patterns when network capacity was restored?are there any implications for future disruptions in Queensland?
The following incidents are reported in reverse chronological order:2006 Laval Overpass collapse (Montreal)2001 9/11 attacks (New York)1997 Hammersmith Bridge closure (London)1995 Hanshin Awaji earthquake (Kobe)1994 Northridge earthquake (Los Angeles)1975 Tasman Bridge collapse (Hobart)
5.4 Case studies
Event descriptions, agency responses and travel behaviour impacts are detailed below for each incident.
5.4.1 2006 Laval overpass collapse (Montreal)
On 30 September 2006, a 65 foot section of a three lane overpass collapsed in Laval on Concorde Boulevard, crossing over Autoroute 19 in Canada. The collapse crushed two vehicles, killing five people and seriously injuring six others who went over the edge. This closed Autoroute 19 for almost four weeks, disabling an important north-south link between Montreal and its northern suburbs. Normal traffic flows along Autoroute 19 amount to 57 000 vehicles per day in both directions (Marotte and Magder, 2006).
42

Department of Transport and Main Roads, Riverside Expressway Transport Investigation and Network Analysis, 2010
Agency responses
Several blocks of concrete had fallen from the overpass prior to its collapse. This concrete debris was cleared but no decision was made to close the overpass or the road beneath it.
In response to the partial collapse of the overpass, the Quebec government instigated several strategies to speed the recovery effort and to minimise inconvenience to commuters.
Emergency procedures focused on rescuing survivors then clearing the scene Detour routes were put in place and commuters were urged to use public transport and to carpool Shuttle bus services were provided to ferry commuters between new park and ride sites and subway stations, which had restricted access due to the road closures Canadian Automobile Association-Quebec (CAA-Quebec), a non-profit organisation, promoted use of their free carpool ride-sharing program which enables the forming of car pooling networks Transit authorities in Laval and Montreal increased services on some routes and extended the reserved bus lanes.
Travel behaviour impacts
The major expressways into Montreal from Laval were gridlocked during the morning peak following the collapse. The peak period started much earlier than usual and was extended in duration. Motorists responded by changing routes (mainly official detour routes), the time they left for work (earlier or later), or the mode they used (bus, subway, etc.).
5.4.2 2001 9/11 attacks (New York)
On 11 September 2001, the World Trade Centre in New York was destroyed, crippling the public transport infrastructure of Lower Manhattan’s major inter-modal transport hub. Highway exits in the immediate area were closed by emergency services and security agencies resulting in traffic chaos. Some streets remained closed for the duration of the clean-up.
New York’s subway network transports over 4.2 million people every work day (US Department of Transportation, 2002). The principal point of access to two subway stations was destroyed in the attacks. Part of a subway tunnel was also destroyed, necessitating re-routing and the cancellation of some services. The Lower Manhattan rail station was seriously damaged. New York buses transport over 2.5 million people every work day, making it the second most popular transit mode in the city. Bus infrastructure was largely unaffected by the attacks.
Agency responses
Agency responses assisted the recovery effort in reducing congestion across the network. Many bridges, tunnels and highways into Manhattan were closed, later being restricted to high occupancy vehicles (HOV) and emergency vehicles during peak periods.
The Department of Transport:
urged people to use bikes, buses, ferries and subwayincreased ferry routes and servicesre-routed trainscommissioned a new ferry terminal to cater for the expected influx of patrons from the closed subway and rail stationsestablished new bus routes and services.
43

Department of Transport and Main Roads, Riverside Expressway Transport Investigation and Network Analysis, 2010
Travel behaviour impacts
The banning of single occupancy vehicles (SOV) on bridges into Manhattan resulted in peak spreading and an estimated 30 per cent reduction in traffic across the road network leading toward Manhattan. There was an estimated 20 per cent decrease in traffic in the Lower Manhattan area itself (US Department of Transportation, 2002).
not change substantially, with losses on some services balancing new patrons on others.
Some subway patrons changed their destination to subway stations that remained open and others used the ferries. The subway also experienced an influx of passengers from the at-grade rail network as the subway still had open stations within walking distance of Lower Manhattan. When the subway tunnel was reopened in September 2002 patronage returned to pre-attack levels.
Many of the streets in Lower Manhattan had chronic pedestrian congestion prior to 11 September 2001. After the attack, pedestrian congestion was reduced due to lower levels of overall activity in the area. Improvements were incorporated into new pedestrian infrastructure to spread the high volumes across broader paths.
5.4.3 1997 Hammersmith Bridge closure (London, UK)
The Hammersmith Bridge in London was closed to private motor vehicles and heavy industrial vehicles in 1997 for repairs, as it was too weak to handle typical traffic levels of 30 000 vehicles a day. The bridge remained open to cyclists, pedestrians, motor bikes, emergency vehicles and buses while the repairs were undertaken (Rees and Williams, 1998).
In addition to the structural repairs, several complementary travel behaviour objectives were associated with closing the bridge to personal vehicle traffic. These were to:
reduce growth in the length of motorised journeysreduce the reliance on the private motor vehicleencourage alternative means of travel which have less environmental impact.
Agency responses
In addition to the closure, government agencies provided extra bus services and modified bus routes. The bridge became significantly more attractive to pedestrians and cyclists as private vehicle traffic was removed.
The bridge was reopened in 1999 to all traffic. In an attempt to maintain increased public transport patronage the local government planned to install new traffic signals and introduce bus priority measures to allow buses to bypass traffic queues. The Hammersmith Bridge was then bombed and closed once again in 2000. It was reopened four months later with a weight restriction of 7.5 tonnes in place.
Travel behaviour impacts
Surveys were conducted before, immediately after and eight months after the bridge closure to identify changes in travel behaviour.
44

Department of Transport and Main Roads, Riverside Expressway Transport Investigation and Network Analysis, 2010
Figure 15 – Changes in work and non-work trips and mode used as a result of bridge closure
Figure 15 shows the proportion of all motor vehicle trips (work and non-work trips) that went to other modes at these times.
Of work-related trips:nine per cent transferred to public transportnine per cent transferred to walking and cyclingothers left work earlier or later, worked from home or rearranged appointments.
Overall, there was a 28 per cent drop in work-related motor vehicle use by respondents.
Travel behaviour change for non-work related trips was larger than for work related trips. Non-work related trips are generally more flexible, with greater opportunities to change the time or destination or to combine the trip with other activities or not make the trip at all.
Of the non-work related trips made:immediately after the restrictions, 21 per cent were not made at allwithin eight months of the closure, 14 per cent had transferred to public transportten per cent transferred to walking and cycling.
Many respondents reported that they changed their shopping locations when the bridge was closed.
There is evidence that some local streets were suffering from increased congestion but the total volume of traffic over the broader network had reduced. Traffic reductions in the local area of up to 30 per cent or 10 000 vehicle trips/day were recorded, against a three to four per cent traffic growth in London over the same period.
Buses benefited with a 37 per cent decrease in wait times and a patronage increase of 23 per cent (1.2 million passengers per year). These benefits were achieved despite the weight restriction allowing only one bus at a time over the bridge in each direction. Patronage increases resulted in more occurrences of overcrowding and an increase of complaints.
Conditions were also significantly improved for pedestrians and cyclists. Each day 1158 cyclists used the bridge up from 815 pre-closure. Before and after pedestrians counts were not undertaken but it was observed that numbers had increased substantially.
45

Department of Transport and Main Roads, Riverside Expressway Transport Investigation and Network Analysis, 2010
5.4.4 1995 Hanshin Awaji earthquake (Kobe)
The Kobe Earthquake occurred in 1995, killing 5,300 people and devastating the densely populated region in Japan. Most of the transport network including all major highways and rail links between Kobe and Osaka were destroyed, causing a dramatic decline in vehicle traffic (Bureau of Transportation Statistics, 1996). The major rail and highway network in the area was fully restored in six months and traffic resumed pre-quake patterns within another month. Prior to the earthquake about 80 per cent of commuting trips were by public transport (Chang and Nojima, 1999).
Agency responses
The rapid replacement of highway and rail infrastructure was the priority management response. During reconstruction, agencies:
restricted many highways to emergency vehiclesestablished exclusive bus lanessubstituted shuttle buses for rail services along damaged rail lines.
The strategies helped to maintain patronage but resulted in significant increases in travel time and reductions in service levels. Priority infrastructure replacement did however allow the recovery to progress quickly, reducing the duration of disruption to travel, trade and daily life.
Travel behaviour impacts
Within the impacted area, activities became more localised and some trips were cancelled. Post incident analysis revealed that non-work travel could be reduced by about 65 per cent for extended periods during transport disruptions, this is accompanied by a shift away from motorised modes to walking and cycling.
People in non-impacted and minor impacted areas showed no significant change in trip frequency but did shorten their trip length.
Only 52 per cent (235,400 out of 449,800) of the average daily vehicle counts were present shortly after the earthquake on all major expressways and alternative routes in and outside the affected area (Chang and Nojima, 1999). This large amount of 'disappearing traffic' is attributed to the substantial decrease in roadway capacity (Cairns et al, 2001). As capacity to highways was replaced, traffic began to return to pre-quake travel patterns and modal share.
5.4.5 1994 Northridge earthquake (Los Angeles)
The Northridge earthquake in Los Angeles in 1994 caused significant damage to four critical freeways (Bureau of Transportation Statistics, 1998). The earthquake occurred on a national holiday, with little traffic on the roads at the time. In the first week of the disaster, many businesses and schools were closed, reducing the demand on
volumes increased steadily as more people returned to work.
The damaged highways had combined average daily trips in 1993 of 645 000 vehicles. In Los Angeles County, approximately 85 per cent of workers commute by private motor vehicles and only 6.5 per cent rely on public transport (US Department of Transportation, 2002, p.4-5).
46

Department of Transport and Main Roads, Riverside Expressway Transport Investigation and Network Analysis, 2010
Agency responses
The Californian Department of Transport (CALTRANS) implemented emergency measures as a priority, followed by transportation recovery plans which included the:
deployment of traffic management teams to inspect and implement closures and detours, remove debris and demolish highwaysestablishment of the CALTRANS traffic management centre (TMC) as the regional communication hub, providing up-to-date information on closures, detours and reconstruction activities distributed through the TMC to public officials, media and other agencies decision to immediately replace damaged highway infrastructure. The TMC sent out messages to persuade commuters to:stagger working hoursavoid the Northridge area completely (long-range travellers not destined for Los Angeles)not drive cars at all if possible.
Intelligent transport systems were used to maximise capacity by adjusting signal timing on detour routes and using VMS and highway advisory radio to communicate traffic information. A number of detours were designated for HOVs to encourage carpooling. These were supported with rideshare matching programs and carpooling networks.
Public transport improvements were implemented to reduce the number of vehicles travelling. These included:
additional rail services along freight rail linesextra rail carriages and busesadditional bus routes and servicesextra park and ride sitesticket price reductionssome free shuttle services provided by businesses for their employees.
Travel behaviour impacts
A range of behaviour changes were recorded on the different highways during reconstruction, the nature of which depended upon the local context.
Along one highway there were limited alternative routes or public transport services available, resulting in significantly increased delays. Delays stabilised after two months as people experimented and gradually found the most viable alternatives. The most common behaviour change was the changing of departure times to before 6.00 am and after 8.00 am and eliminating unnecessary trips (Bureau of Transportation Statistics, 1998).
Another highway had limited alternative routes but was adjacent to a rail line. Rail experienced a significant increase in patronage from 850 passengers to 22 000 a day. The majority of new riders reported intentions to continue using the train to avoid congestion, reduce stress and take advantage of employer incentives. Despite these intentions, patronage decreased steadily as the reconstruction progressed.
Two other highways had many alternative routes available allowing people to continue to drive without excessive inconvenience. This limited the extent of patronage increases for bus services. All detours were relatively well used except for HOV transfers, which were not as high as expected.
Once capacity was restored, traffic patterns reverted to pre-incident levels, with minor residual increases for the alternative modes. The reasons for this pattern include:
the network was reconstructed quickly, preventing establishment of long-term behaviour changes.delays during reconstruction were not generally substantial enough to precipitate a major change in travel modeLos Angeles has decentralised activity centres, requiring diverse travel patterns unsuited to high levels of public transport and HOV use.
47

Department of Transport and Main Roads, Riverside Expressway Transport Investigation and Network Analysis, 2010
5.4.6 1975 Tasman Bridge collapse (Hobart)
On 5 January 1975, the ship ‘Lake Illawarra’ hit the Tasman Bridge and demolished two bridge piers, resulting in the collapse of three spans of the bridge. Seven ship crew members and five motorists were killed.
In 1975 a majority of the population of metropolitan Hobart were concentrated on the western shore of the Derwent River, together with the major commercial and industrial areas. The remaining population lived on the eastern shore. Over 80 per cent of employed eastern shore residents worked on the western shore, using the Tasman Bridge as the primary commute route. In addition to this, the Tasman Bridge carried trunk water and telecommunication infrastructure (Australian Road Research Board, 1998).
Agency responses
Response to the incident was rapid with notification through police, radio, and telephone. Identified internal organisational issues were addressed well but mass coordinated responses were constrained by communication difficulties.
Additional ferries were located and began services the following day. Additional passenger rail and connecting bus services were scheduled. The rapid establishment of alternative transport arrangements significantly reduced the potential short term impact on the community.
A Bailey bridge was constructed after the collapse about six kilometres up the Derwent River. It was hoped that the new bridge would create a more direct link to the CBD, compared with the Bridgewater Bridge which required a 50 kilometres detour. Unfortunately the new location, constrained capacity of the bridge, and poor connecting roads meant it could not fulfil many of the functions of the Tasman Bridge.
Travel behaviour impacts
Total daily person movements across the Derwent River decreased by 30 per cent (10 000 person movements) post collapse. Peak period travel was also reduced and major changes in mode and route of travel occurred. The majority of travellers made multimodal journeys utilising ferries and some travelled via Bridgewater. Hourly ferry capacity increased from 400 to 13,500 through the construction of additional terminals and provision of extra ferries (Australian Road Research Board, 1998). An adjacent sports ground was converted to a car park.
The incident resulted in major increases in traffic flows on roads not designated for such volumes. A number of capacity upgrades were undertaken in response.
Other affects included:premature retirementstransferred employment from one shore to the otherrelocation within multi locational organisationsflexible working arrangements implemented by a number of organisations.
The collapse accelerated the decentralisation of Hobart and the development of a high degree of self-sufficiency on the eastern shore. Over 65 per cent of retail purchases by eastern shore residents pre-collapse were made in the Hobart CBD
outlets with a corresponding increase in the patronage of eastern shore shops. 2A Bailey bridge is a portable pre-fabricated truss bridge, designed for use by military engineering units to bridge up to 60 metre gaps.
When the bridge reopened in October 1977, peak bus patronage rose to 3,375, above the pre-collapse and predicted levels. However, overcrowding was reported and with no supply response, the bus patronage quickly tapered to the capacity of 2,900. Six months after reopening, total peak period cross river trips were still eight per cent less than they had been prior and the number of private motor vehicle trips was 14 per cent lower than previously.
48

Department of Transport and Main Roads, Riverside Expressway Transport Investigation and Network Analysis, 2010
A number of studies into the collapse and response, designed to improve responses to future disruptions, have made recommendations on the:
restriction of private vehicle usealteration of traffic signal phasingencouragement of flexible working hours to reduce peak traffic volumes alteration of bus schedules, with the provision of park and ride facilities, express services and coordination with ferry schedules provision of ferriesupgrading of access to alternate routesestablishment of transit lanes for buses and other high occupancy vehiclespreparation of a development plan for the region to better plan location of facilities and residential growth.
5.4.7 List of articles cited in case studies
US Department of Transportation (2002). Effects of Catastrophic Events on Transportation System Management and Operations – New York City-September 11, 2001
Rees, J. and Williams, T., (1998). Degeneration: Hammersmith Bridge Closure. PTRC Education and Research Service.
Bureau of Transportation Statistics (1996). Transportation Statistics Annual Report 1996. US Department of Transportation
Chang, S. and Nojima, N., (1999). Measuring Post-Disaster Transportation System Performance: The 1995 Kobe Earthquake in Comparative Perspective
Cairns, S., Atkins S. and Goodwin, P. (2001). Disappearing traffic? The Story so far. London: Proceedings of the Institute of Civil Engineers, March 2001.
Bureau of Transportation Statistics (1998). Journal of Transportation and Statistics – Special Issue on the Northbridge Earthquake, Volume 1, Number 2, May 1998. US Department of Transportation.
US Department of Transportation (2002). Effects of Catastrophic Events on Transportation System Management and Operations – Northbridge Earthquake – January 17 1994
Australian Road Research Board (1998). Research Report ARR 313 - Section 2.3: Tasman Bridge Collapse.
5.5 Conclusions
The following observations highlight the most important findings of the international case study research across the areas of how agencies respond and how people modify their travel behaviours to adjust to transport network disruptions.
49

Department of Transport and Main Roads, Riverside Expressway Transport Investigation and Network Analysis, 2010
5.5.1 Agency responses
Safety is the most critical management concern
In times of crisis, all agencies undertake an emergency response first and consider transport network impacts second. Acting to save lives by closing infrastructure as a precaution is the expectation of communities. More serious consequences occur if a vulnerable piece of infrastructure remains in use and fails later, with potential loss of life. The Laval Overpass collapse for example, demonstrated these serious consequences.
Restrict SOV and extend HOV to increase capacity
In all case studies, government agencies instigated some form of discouragement or restriction to single occupant vehicles (SOVs). This often included the introduction or extension of HOV transit and bus lanes and bus priority measures. Public transport services were increased or extended and additional park and ride sites were made available. These responses were aimed at decreasing the number of vehicles and associated congestion across the network. The success of these measures was mixed, dependent on the extent of time savings afforded to the buses and HOVs, the extent of concentrated verses dispersed trip destinations and the availability of additional public transport vehicles and staff.
Real time traffic incident management systems are vital
Intelligent transport systems have been used to reduce congestion during disruptions in the following three ways: Travel time information: inform motorists before and during trips of which routes to use and what to expect Dynamic traffic signal coordination and emergency vehicle access and bus priority (traffic flow priorities). Where adaptive control is available, they have been used to adjust traffic signal timing and priorities to optimise the re-routed traffic flow, minimise delays and reduce the need for police to control intersections Improved incident response and management: rapidly locate and respond appropriately to secondary incidents that would otherwise cause additional delays.
Non-transport organisations help
The media and many other organisations support the efforts of transport agencies to inform travellers of transport options and encourage use of alternative modes. All organisations can adjust their own activities to reduce, relocate or spread demand on the network. Workplaces often provide flexible work arrangements and those with existing travel plans utilise the opportunity to support alternative modes so staff are better able to avoid traffic congestion.
5.5.2 Travel behaviours
People can respond quickly
Behaviour change varied widely because of differences in the extent and nature of disruption and opportunity to utilise alternatives. The most common changes were route changes, retiming of trips (usually earlier) and mode substitutions. People tend to make rational choices based on the perceived opportunities available to them and are able to maintain the new travel behaviour until the capacity is reinstated and a more convenient/shorter trip becomes possible again.
Activities will become more local
The inability to reach some destinations and the inconvenience of travel delays result in more people choosing local destinations. The substitution of local destinations is higher amongst the more discretionary non-work trips and is accompanied by increases in walking and cycling. Convenient and safe local walking and cycling paths and end-of-trip facilities therefore lead to better outcomes when disruptions occur. Improved local walking and cycling paths also improve access to public transport.
50

Department of Transport and Main Roads, Riverside Expressway Transport Investigation and Network Analysis, 2010
51
Most travel behaviours revert to pre-incident levels over time
In all cases, traffic patterns returned to pre-incident levels. This trend suggests that prior transport mode and route choices are/were rational, considering the levels of service offered by different modes.
Some behaviour change is generally maintained, though this varies across the case studies. In Japan, where people tend to regularly use all modes, they reverted to essentially the same travel patterns as pre- earthquake. In the UK and Tasmania where private motor vehicles dominate, public transport experienced increased patronage after reinstatement of the bridges. This highlights the need to increase the number of public transport vehicles and level of service in order to maintain higher patronage and increase its attractiveness to patrons.
Long term disruption creates land use changes
Long term disruptions to transport network links can create land use changes. After the Tasman Bridge collapse, discretionary activities were localised with shopping, recreation and other facilities established within walking and cycling distance of the local catchment. More local facilities further increased walking and cycling, leading to a virtuous cycle, opposite to the general experience of private motor vehicle dependent cities.
6.0 Travel behaviour analysis
6.1 Introduction
This section provides a synopsis of two research projects conducted by SocialData Australia Pty Ltd and reported in the Impacts of Riverside Expressway Closure Report, November 2006 (See technical appendices C and D). They are:
In-Depth Travel Behaviour Analysis Report Brisbane 2005 - the Potentials AnalysisBehavioural Changes in Brisbane North (TravelSmart Area).
The purpose of this research was to improve understanding of:actual and potential travel behaviour changes resulting from the REX closurethe implications of these for future transport network disruptions and travel behaviour change initiatives.
6.2 Potentials analysis
6.2.1 Objectives
The objective of the Potentials Analysis was to analyse households and their trips to determine the theoretical potential for reducing private motor vehicle traffic. This theoretical potential for change in trip numbers can then be compared with observed changes in travel behaviour so that constraints and opportunities for change can be identified in future scenarios.
6.2.2 Methodology
The methodology incorporates a number of research techniques including:self-administered mail back travel surveysin-depth face-to-face interviews using a simulation model.
The model was used to expand the subset of in-depth data collected by previous TravelSmart research projects in the
A situational analysis then compared actual trip behaviour with potential alternatives, considering factors which con-strain or impact on both available choices and perceived utilities.
A total of 6,924 persons were surveyed from households in Aspley, Indooroopilly, Brisbane North, Redlands, Taringa, Toowong and Woolloongabba. While this was not a representative sample of Greater Brisbane, this sample spread and the number of respondents can be considered a reasonable sample of typical Brisbane suburbs to give us a picture of “Brisbane” for purposes of this analysis.

Department of Transport and Main Roads, Riverside Expressway Transport Investigation and Network Analysis, 2010
Figure 16 – Average motor vehicle trips per year – “Brisbane” 2006
Figure 17 shows that over 35 per cent of all motor vehicle trips could be substituted by bicycle trips, 13 per cent by walking and around 18 per cent could be substituted by existing public transport services (some additional peak capacity would be required). People often have more than one mode choice replacement to the private car for a trip (walk or cycle; cycle or bus) and a typical “Brisbanite” will have 1.4 non-car options per replaceable trip.
Figure 17 – Replaceable motor vehicle trips per year - “Brisbane” 2006
52
6.2.3 Findings
Constraints include mobility impairments, luggage requirements and so on. Alternatives are considered viable if:
the trip distance is less than twice the average walk or cycle distancethe door-to-door public transport trip is less than twice the motor vehicle trip time or 20 minutes longer (whichever is the least).
alternative.

Department of Transport and Main Roads, Riverside Expressway Transport Investigation and Network Analysis, 2010
Table 7 shows that 24 per cent of all motor vehicle trips are work commuting and one third (8 per cent) of these can be replaced with an alternative mode. Non-work related motor vehicle trips represent a higher proportion of total travel and
replaceable.
Total %Constraints and/or no
alternative available %
Motor vehicle use solely for subjective
reasons; alternative available %
Work 24 16 8
Shopping, Personal business 32 14 18
Leisure 26 15 11
Escort 13 5 8
Other 5 3 2
Total 100 53 47
Table 7 – Motor vehicle trips by purpose – “Brisbane” 2006
Table 8 shows that about half of all motor vehicle trips made between 5.00 am and 7.00 pm are replaceable. Trips made at night are less able to be replaced. This is due to greater security concerns at night and reduced public transport frequencies.
Table 8 – Motor vehicle trips by time of day – “Brisbane” 2006
Total %Constraints and/or no
alternative available %
Motor vehicle use solely for subjective
reasons; alternative available %
5 am-9 am 21 10 11
9 am-3 pm 40 20 20
3 pm-7 pm 30 16 14
after 7 pm 9 7 2
Total 100 53 47
53

Department of Transport and Main Roads, Riverside Expressway Transport Investigation and Network Analysis, 2010
Table 9 shows that 34 per cent of all motor vehicle trips are less than three kilometres in distance and that over two
long, almost 50 per cent can be replaced. In contrast, 26 per cent of all motor vehicle trips are over ten kilometres in length and less than a fifth (5 per cent) of these can be replaced.
Table 9 – Motor vehicle trips by distance – “Brisbane” 2006
Total %Constraints and/or no
alternative available %
Motor vehicle use solely for subjective
reasons; alternative available %
up to 3.0 km 34 10 24
3.0 to 10.0 km 40 22 18
10.0 km and over 26 21 5
Total 100 53 47
Table 10 shows that 74 per cent and that more than half (38 per cent) of the weekday motor vehicle trips are replaceable while only a third (4 to 5 per cent) of weekend motor vehicle trips have alternatives.
Table 10 – Motor vehicle trips by day – “Brisbane” 2006
Total %Constraints and/or no
alternative available %
Motor vehicle use solely for subjective reasons;
alternative available %
Week Day 74 36 38
Saturday 14 9 5
Sunday 12 8 4
Total 100 53 47
The Potentials Analysis has demonstrated that almost 50 per cent of all motor vehicle trips have the potential to be replaced by public transport, walking or cycling. This could occur without significant change to the existing transport system, as most patronage increases would occur outside the morning peak or act to extend the peak both earlier and later. Given the small proportion of motor vehicle trips over ten kilometres, the impact of road closures would be localised to the immediate vicinity and alternative routes.
Actual travel behaviour is clearly different from theoretical potential, motor vehicle drivers may choose to drive even when alternative modes of transport are available and convenient. This analysis shows that road closures can bring about significant change to travel behaviours if alternative modes are available, without leading to widespread disruption of lifestyle or the economy.
54

Department of Transport and Main Roads, Riverside Expressway Transport Investigation and Network Analysis, 2010
6.3 TravelSmart survey
6.3.1 Objectives
The objective of the TravelSmart Survey was to measure the impacts of the REX closure on households participating in the TravelSmart Brisbane North Project study area. It also assessed the impact of the TravelSmart Project on a participant’s ability to adopt new travel behaviours during the road closures.
6.3.2 Methodology
The survey was conducted by telephone during October and November 2006. There were a total of 4,153 people interviewed from selected suburbs (Nundah, Wavell Heights, Bracken Ridge, Bald Hills, Brighton) in Brisbane North. This target region was a joint QT, BCC and Australian Greenhouse Office initiative, known as the TravelSmart Brisbane North Project (TravelSmart project).
The TravelSmart project was conducted during 2006 and targeted more than 70 000 households from Windsor to Aspley with individualised marketing material relating to alternative transport options. Questions pertaining to the REX closure were added to the project’s final ‘quality control’ survey. The TravelSmart project segmented participating households into three groups. These became known as Groups I, R and N and were used to categorise and interpret data relating to the REX closure.
Group I included households without regular users of public transport, walking or cycling but whose inhabitants were interested in using these modes.
Group R included households with at least one regular user of public transport, walking or cycling.
Group N included households with inhabitants who were not interested or were unable to use alternatives to the motor vehicle.
6.3.3 Findings
The survey findings are categorised according to the I, R and N groups established by the TravelSmart project. Members of groups I and R actively requested and received information about alternative transport modes during the project, while Group N was not interested in receiving any information.
To identify the differences between those who had received alternative transport information before the REX closure and those who had elected not to receive information at all, Groups I and R were tallied together and are compared with Group N.
Table 11 shows the number and percentage of people surveyed from the three groups. Some of the following tables will compare the responses from the 63 per cent serviced in the TravelSmart project with the 37 per cent not serviced.
abs. %
Group I Interested Households 1,736 42
Group R Regularly using environmentally-friendly modes 880 21
Total serviced in TravelSmart 2616 63
Group N Not interested households (not serviced in TravelSmart) 1,537 37
Total 4,153 100
Table 11 – Base population of Brisbane North households surveyed on the Expressway closure
55

Department of Transport and Main Roads, Riverside Expressway Transport Investigation and Network Analysis, 2010
Table 12 shows that about 14 per cent of people in Brisbane North were affected by the REX closure.
Table 12 – Brisbane North population affected by the Riverside Expressway closure
Affected by the closure Total %
Yes 14
No 86
Total 100
Table 13 shows that for those affected by the closure, the vast majority were motor vehicle drivers.
Table 13 – Mode used by the affected Brisbane North population
Mode Used Total %
Motor vehicle as driver 87
Motor vehicle as passenger 5
Public Transport 8
Other 0
Total 100
Table 14 shows 75 per cent of affected trips were for work purposes, however other trip purposes were also affected. This high representation of work trips is attributed to the REX closure being outside of the TravelSmart project area and the road closure’s proximity to the central business and employment district.
Table 14 – Trip purpose of affected trips - Brisbane North population
Trip purpose of affected trips Total %
Work 73
Education 5
Shopping/Services 8
Leisure 14
Total 100
56

Department of Transport and Main Roads, Riverside Expressway Transport Investigation and Network Analysis, 2010
Table 15 shows that 66 per cent of those affected made no changes to their trip. 21 per cent changed mode and 9 per cent changed route, with very few staying at home rather than making the trip at all. Those who had been serviced with information by the TravelSmart project were much more likely to change their travel behaviour in response to the closure.
Table 15 – Behaviour change of the affected Brisbane North population
Total % Changes With TravelSmart % Group N %
21 Changed mode 27 8
12 Public Transport 14 6
3 Walking and Cycling 4 0
3 Motor vehicle as passenger 5 2
3 Motor vehicle as driver 4 0
9 Changed route 10 8
4 Stayed home, cancelled trip 5 3
66 No Change 58 81
100 Total 100 100
Table 16 shows that of those who changed mode from motor vehicle to public transport, 66 per cent had a positive experience. Those who had received TravelSmart project information were two and a half times more likely to report a positive experience, suggesting that they were better informed and possessed a greater understanding of the public transport system.
Table 16 – Experience with public transport of the affected Brisbane North population
Total % Experience with Public Transport % With TravelSmart % Group N %
12 Changed to Public Transport 14 6
8 Positive 10 3
4 Negative 4 3
22 Other Changes 29 13
66 No Change 57 81
100 Total 100 100
57

Department of Transport and Main Roads, Riverside Expressway Transport Investigation and Network Analysis, 2010
Table 17 shows that of those who changed modes from motor vehicle driver, more than 20 per cent continue to use the new mode and another 40 per cent expect to use it more often. Those serviced by the TravelSmart project were much more likely to change mode and to continue to use the new mode once trialling it.
Table 17 – Intention to continue travelling of the affected Brisbane North population
Total %Do you think you will continue that way
of travelling?With TravelSmart % Group N %
18Changed to mode other than motor
vehicle driver23 8
4 Yes, continue 6 1
7 Eventually continue 9 1
7 No, not continue 8 6
16 Other changes 20 11
66 No change 57 81
100 (Base %) 100 100
In addition to the quantitative data outlined above, the following qualitative data was collected from incoming phone calls during the TravelSmart project:
“Hey, I was talking to friends about the Expressway chaos and they said we should have been in the TravelSmart project. We live in Chapel Hill, can we join in too?”
“Thanks for the great gear, nice bag. The timetables were great ...I used the ones you guys sent me when the road was closed, it’s a shame that I didn’t do that earlier. Was great. Brilliant”
“Thanks for that pack I got... I didn’t get around to using the train before ...they really came through with the extra
“I’m telling everyone about the info I got - the train was great when the Expressway was shut down. It was much quicker than driving”
“Just to let you know I tried out the train to avoid the congestion, amazingly easy and quick to get to work”
58

Department of Transport and Main Roads, Riverside Expressway Transport Investigation and Network Analysis, 2010
6.3.4 Comparing Brisbane North to Greater Brisbane
At the same time as the AC Nielsen Riverside Expressway Closure General Population Survey of the Brisbane Statistical Division (Greater Brisbane) was being carried out a survey of residents in the TravelSmart Brisbane North project area was also conducted. This allowed an assessment of the impact of the TravelSmart Project on a participant’s ability to adopt new travel behaviours during the road closures.
Overall Brisbane North residents were less affected by the closure than those of Greater Brisbane. Only 14 per cent of people in Brisbane North were affected by the closure as compared to 29 per cent for the Brisbane Statistical Division. This phenomena correlates with the road traffic data which showed that northside commuters generally were least affected by the closure.
However in Brisbane North 87 per cent of those who were affected and changed were regular car drivers while in Greater Brisbane only 72 per cent of those who were affected and changed were regular car drivers. One might have assumed that northside car drivers would have had less than average incentive to change mode during the closure given they were less affected by the closure.
21 per cent of Brisbane North residents who were affected by the closure changed mode compared to the Greater Brisbane average of 14 per cent. In both cases it was predominantly to public transport.
Those in Brisbane North who had chosen to participate in, and had therefore been serviced with information by, the TravelSmart project in the year prior to the closure made an even stronger mode choice decision (27 per cent which is almost twice the Greater Brisbane average of 14 per cent). Those residents of Brisbane North who specifically did not want to participate in TravelSmart but were affected by the closure were three times less likely to change mode (8 per cent compared to 27 per cent). They were however much closer to making similar levels of mode switch as the general Greater Brisbane population (8 per cent compared to 14 per cent). See Figure 18.
Figure 18 – Mode change during the closures - BSD (Greater Brisbane) v Brisbane North
71 per cent of those whom shifted mode in Greater Brisbane were car drivers
87 per cent of those whom shifted mode in Brisbane North were car drivers
The influence of TravelSmart is considerable given that both the traffic data and the surveys showed that northside com-muters generally were least affected by the closure and would have had less than average incentive to change mode dur-ing the closure. Instead Brisbane North residents made significantly higher mode shifts from their cars to public trans-port and active transport. This suggests that Brisbane North residents were much more aware of their available options and could better tailor their choice to optimise their outcomes.
59

Department of Transport and Main Roads, Riverside Expressway Transport Investigation and Network Analysis, 2010
6.3.5 Conclusions
The TravelSmart survey population lived between three and 15 kilometres north of the road closure. The survey findings can be extrapolated to confirm that only a minority of the population were affected by the road closure and the impacts
experienced some inconvenience. Even though the potential for mode change is close to 50 per cent, only about 20 per cent of affected trips changed mode, with an additional 13 per cent changing route or staying at home. Most of those who changed mode reported a positive experience, with a significant portion continuing to catch public transport, walk or cycle instead of travelling by motor vehicle.
A comparison of those who were provided TravelSmart project information with those who were not demonstrated a clear benefit to those who had participated in the project. The participants were better informed about their travel options and as a result had more positive experiences that encouraged sustained alternative transport use, minimising congestion and other negative impacts associated with the road closure.
When comparing the population of Brisbane North to the general Greater Brisbane population TravelSmart influence is quite pronounced. Residents who were affected in Brisbane North had significantly high rates of shifting out of their cars to public transport and active transport compared to the general Greater Brisbane population.
This research indicates that implementation of TravelSmart based projects in the local area prior to scheduled road closures, construction and or maintenance projects will help the community and as a result, improve the transport system’s ability to cope with the reduction in capacity.
Identifying the household’s transport needs and tailoring information to suit each individual’s circumstances provides a clear benefit to the community and transport system. However, the TravelSmart process requires time and resources for planning and implementation, and is therefore not feasible for unplanned closures.
60

Department of Transport and Main Roads, Riverside Expressway Transport Investigation and Network Analysis, 2010
7.0 Stakeholder perspectives
7.1 Introduction
This section summarises a series of informal conversations with important stakeholders about the impacts and management of the REX closures.
7.2 Purpose and objectives
The purpose of the stakeholder conversations research was to:
inform stakeholders of the RETINAgain stakeholder views on how well the incident was managedopen discussions with stakeholders on broader policy issues.
7.3 Methodology
The targeted stakeholders formed four categories:
Road User GroupsProfessional AssociationsState-Owned CorporationsBusiness Reference Groups.
These groups represent a cross section of the major organisations which have an interest in shaping Brisbane City and was not intended to be an exhaustive list. Stakeholder conversations were conducted with the following organisations as either face-to-face meetings or telephone discussions.
Road user groups
Queensland Trucking AssociationTaxi Council of QueenslandRoyal Automobile Club of Queensland (RACQ)Bicycle Queensland.
Professional associations
Brisbane Development AssociationUrban Development Industry Association.
State-owned corporations
South Bank CorporationPort of Brisbane Corporation.
Business reference group
Commerce QueenslandTourism Queensland
The range of topics discussed with stakeholders included:
provision of trip informationstakeholder initiated strategies to mitigate their own circumstances, if anystakeholder views on how the city would have coped if the closures had have been in place for longer.
The conversations were informal in nature without a set structure to encourage stakeholders to be more open and direct.
61

Department of Transport and Main Roads, Riverside Expressway Transport Investigation and Network Analysis, 2010
7.4 Findings
Stakeholder viewpoints have been reported as a collective and do not necessarily represent the views of any particular stakeholder.
The following is a summary of the positive feedback and concerns received during the conversations.
7.4.1 Positive feedback
Most stakeholders:
appreciated the need for the closure, acknowledging that safety was an imperative over short term congestion
were satisfied with the incident management and the transport information provided
used a number of communication methods to keep their employees informed of the closures and associated impacts.
7.4.2 Concerns
Many stakeholders:
suggested there was a need to provide more alternate routes (although some spare capacity was acknowledged in sections of the road network east of the city)
acknowledged that had the closures gone on for longer the severity of the impacts could have increased
felt the incident highlighted the need for improvements in the city’s multi modal transport system to cater for the growing population.
Some stakeholders:
questioned the timing of the Minister’s public announcement, needing it well before the evening road peak period
suggested a partial ramp closure may have sufficed, given the ramps were reopened to light traffic after about a week of their complete closure
queried why buses were able to use the ramps when heavy vehicles were not
expressed concern for the strain placed on the CBD road network by major road projects.
7.5 Conclusions
A majority of stakeholders were happy with the management of the closure.
Longer term closure would have created more business disruptions.
Stakeholders appreciated being contacted to discuss their views and indicated they would welcome future opportunities to discuss strategic transport planning for the city with the Queensland Government.
62

Department of Transport and Main Roads, Riverside Expressway Transport Investigation and Network Analysis, 2010
8.0 Travel demand strategy: flexible work policies
8.1 Introduction
A review of the Queensland Government’s arrangements regarding flexible work hours was conducted following the REX closure to ascertain what impact these arrangements had or could have on spreading travel demand during peak periods and during critical incidents.
8.2 Purpose and objectives
Of the estimated 86,500 people who work in Brisbane’s CBD, the number of buildings occupied by government agencies suggest that up to 25 per cent of people working in the inner city are public sector employees.
Peak spreading is an appropriate demand management strategy to apply when part of the major road network capacity is reduced.
The application of flexible work hours was reviewed to determine whether or not the opportunity to spread the peak commuter demand on the congested road network was taken.
8.3 Methodology
A survey of inner city Queensland Government agencies was undertaken to determine if agencies affected by the closures took advantage of the flexible work arrangements.
The following workplace arrangements were considered in the survey:
working from home
staggered start and finish times
normal operating hours
accrued time
overtime
time off in lieu.
The following specific questions were included in the survey. The surveys were emailed to the relevant Human Resource Manager or their delegate:
what impact did the closure have on your agency?
how many staff (approximately) were affected and how many took advantage of the flexibilities offered?
were there any unforseen consequences of the closure of the REX or your agency's handling of the difficulties faced?
63

Department of Transport and Main Roads, Riverside Expressway Transport Investigation and Network Analysis, 2010
8.4 Findings
Of the 29 agencies contacted approximately 35 per cent provided a response. The following is an overview of the survey responses:
Almost all agencies implemented flexible work arrangements to allow employees to adjust their working hours around traffic delays. Many staff members took advantage of the options presented to them and expressed their appreciation.
Instead of commuting to the city during the peak periods, employees were allowed to either adjust their start and finish times, work from home, use recreation time, use time off in lieu or work from a regional office.
manager.
Although agencies were advised of the closure, some said it was too late to inform staff appropriately of their flexible work options.
A few agencies commented that the closures had minimal affect on the working patterns of staff which may reflect that a high proportion of staff already used public transport to and from work.
Travel time to meetings outside the CBD increased considerably.
A possible increase in absenteeism was suspected, although exact absenteeism figures have not been determined.
8.5 Conclusions
Using the REX closure as an example, the research has shown that the application of flexible work place arrangements provides the ability for managers to implement effective travel demand strategies to reduce pressure on the road network during peak periods.
It is recommended that:
the application of such arrangements be increased to reduce congestion during the peak demand periods (not just when there is a failure in the road network)
surveys of public sector employees could be undertaken to gain a better understanding of the impact such arrangements will have on the operational performance of the transport system, particularly during the weekday peak periods.
9.0 Community perspectives
9.1 Introduction
This section presents the results of a survey conducted by AC Nielsen and reported in REX Closure General Population Survey Report, January 2007.
The report presents data and analysis from telephone survey responses on the community impacts and attitudes toward the REX closure. The survey was conducted between three and five weeks after the initial event.
64

Department of Transport and Main Roads, Riverside Expressway Transport Investigation and Network Analysis, 2010
9.2 Purpose and objectives
The purpose of the research was to gain a better understanding of the impacts of the REX closure and associated agency actions on community attitudes and travel behaviour. The objectives of the survey were to investigate:
the public’s opinion and level of support for how well the incident was managed
what travel behaviour change resulted from the on-ramp and bikeway closures along the REX
what behaviour change resulting from the closures was sustained
the public’s awareness and travel behaviour following the decision to waive the Gateway Bridge toll
the public’s awareness and travel behaviour following the decision to open bus and transit lanes to single occupancy vehicles (SOVs).
This data and analysis will inform future decisions about effective procedures to manage similar transport events.
9.3 Methodology
A telephone survey of randomly selected residents in the BSD was conducted in two stages and ensured a
16 and 26 November 2006. Interviewing was conducted on weekdays between 4 pm and 9 pm and on the weekends
The survey involved telephoning a random sample of residents to calculate the incidence rate of those affected by the closure. Residents were considered to be affected by the closures if they claimed to have been positively or negatively affected in how, when or where they travelled, and if they were affected on at least one of the three days following the closure (18 to 20 October 2006).
9.3.1 Stage one of the survey
The telephone numbers were generated by random digit dialing. Respondents aged 18 years or older were randomly selected from within the household. A total of 1,340 interviews were conducted, 330 of which were with affected residents.
9.3.2 Stage two of the survey
The telephone numbers were generated by random digit dialing just as in stage one. The person who answered the phone was surveyed providing they lived in the residence and were affected by the road closure.
If they did not meet the basic criteria the survey was offered to another member of the household who did. Stage two was designed to increase the sample size of the affected group to improve data reliability.
9.3.3 Total survey sample
Stage one and two combined samples totalled 1 000 interviews with affected residents. The overall total number of interviews conducted was 2,085 and was weighted by age and gender according to Australian Bureau of Statistics population estimates (June 2006), and by incidence of impact within age and gender categories, based on incidence figures calculated from the stage one sample.
65

Department of Transport and Main Roads, Riverside Expressway Transport Investigation and Network Analysis, 2010
9.4 Findings
The research indicated that of the 1.3 million residents aged 18 years and over in the BSD population, approximately 395 000, or 29 per cent, were affected by the REX closures between 18 and 20 October 2006.
The survey measured the following features of affected residents:awareness of and support for the closureswhen and how they were most affected what they did about it support for management strategiespreferred information sourcetravel behaviour following the reopening.
9.4.1 Awareness of and support for the closures
Figure 19 shows the degree of support amongst affected and aware residents. Of the affected residents, 93 per cent were aware of the closures and of those aware, 94 per cent supported the closures as a safety precaution.
Figure 19 – Community supported closures
Radio and television news broadcasts were the preferred media for information about scheduled or emergency road closures and alternative routes and travel options.
9.4.2 When and how residents were most affected
by the closures than those travelling for other purposes.
Approximately 40 per cent of those whose trip was affected did not cross the river as part of their journey during the
Overall, the majority of those affected experienced a negative change in their trip experience over the Wednesday to
a positive change to their trip experience, of which a shorter trip was the most common experience. Residents who experienced a shorter trip were more likely to have switched transport modes.
66

Department of Transport and Main Roads, Riverside Expressway Transport Investigation and Network Analysis, 2010
9.4.3 What residents did about it
Figure 20 provides a statistical overview on the travel behaviour change of the 29 per cent of Brisbane Statistical Division residents that were affected by the closures.
Figure 20 – Affects of REX, bikeway and ramp closures
Change route
The most common change in actual behaviour was changing the route of the journey but arriving at the same destination.
Bring forward trip
Many of those affected also changed their usual time of travel, most commonly up to one hour earlier than usual. This was more common for morning peak commuters than those commuting during the evening peak.
Postpone trip
Only a few residents (around 8per cent of the affected 29 per cent) postponed or cancelled their trip and/or worked from home during the closures.
Switch mode
Some residents switched modes with almost half of those switching to the train, and a smaller proportion switching from public transport to motor vehicle. The bus grew in popularity day-by-day for those who switched.
Day Affected
WED
(71%)
THUR
(67%)
FRI
(62%)
Positive change in trip experience: 12% 18% 20%
Shorter time for trip 61% 66% 68%
Negative change in trip experience: 85% 79% 81%
Longer time for trip 91% 88% 90%
Route changed, destination same 51% 51% 52%
Time of day travelled changed: 34% 38% 41%
Travelled up to 1 hour earlier 63% 61% 62%
Travel mode changed: 11% 16% 14%
Switched to train 45% 45% 39%
Switched to motor vehicle 12% 15% 16%
Switched to bus 9% 16% 17%
Switched to walking 17% 10% 12%
Switched to ferry/City Cat 12% 10% 8%
Switched to other 5% 4% 7%
2% 2% 2%
Postponed trip 3% 3% 3%
Cancelled trip 5% 3% 4%
Worked at home instead 2% 1% 1%
67

Department of Transport and Main Roads, Riverside Expressway Transport Investigation and Network Analysis, 2010
Figure 21 – Perceptions of incident management
68
9.4.4 Overall support for government strategies
A total 73 per cent of all residents believe the incident was well managed (rating ‘excellent’
Figure 21 shows the degree of support for government strategies.
The majority of residents supported the removal of the Gateway Bridge peak hour toll and the opening of bus and transit lanes to SOVs. However, the effectiveness of each strategy in instigating positive behaviour change is less obvious.
Gateway Bridge toll
About 69 per cent of residents were aware the toll was removed during peak times. Of those aware, 14 per cent would normally use the bridge at these times, but only 12 per cent used it during the closures, and only two per cent of those aware of the removal state this influenced their decision to use the Gateway Bridge. Overall, about 93 per cent of all residents supported the decision to remove the toll during the closures.
Bus and transit lanes opened to SOVs
Only 25 per cent of residents were aware of the bus and transit lane openings to SOV use. Of those aware, only 16 per cent of residents claim to have used the lanes in either a bus or a motor vehicle during the REX closure. Also, only four per cent of those aware state this influenced their decision to use the lanes.
Overall, about 80 per cent of all residents supported the decision to open transit lanes to SOVs during the closure.
9.4.5 Preferred information source
Overall, the most preferred information sources for affected residents were radio and television. Affected residents sourced key information in the following ways:
scheduled road closures: radio (65 per cent), TV (63 per cent)emergency closures: radio (75 per cent), TV (58 per cent)alternative routes/ travel options: radio (59 per cent), TV (46 per cent).

Department of Transport and Main Roads, Riverside Expressway Transport Investigation and Network Analysis, 2010
Figure 22 – Preferred information source
9.4.6 Travel behaviour following the reopening
A total of 33 per cent of affected residents claim to have continued their new travel behaviour one week after the reopening of the Expressway and bikeway. Of these residents, 84 per cent claimed to still be travelling in this way, three to five weeks later, and stated they were likely (rating ‘very’ or ‘quite’) to continue in the future.
Those who continued the new behaviour for some trips (both in the week following reopening and longer) are more likely to have switched modes; whilst those who continued their new behaviour on all trips (both in the short and long terms) are more likely to now be travelling at a different time of day.
9.5 Conclusions
The community survey demonstrated that the community strongly supports interventions in the transport network where safety is at risk, and believes that in general, the responses and communication were well managed by government.
Despite the closure for several days of the most highly used road in Queensland, only 29 per cent of Greater Brisbane's population was affected at all. This indicates that the existing road network is relatively robust and traffic is efficiently dispersed across the region and not overly dependent on a specific link.
The closure of such an important link did create significant impacts throughout the local area and alternative corridors,
accommodate the disruption by changing route, time of travel or mode.
Up to 33 per cent of those who changed their travel behaviour have decided to continue with the new mode, route or time of travel, indicating that a positive experience and learning occurred which modified previous habits.
Despite support for strategies announced by Queensland Government, these do not appear to have had a significant impact on travel decisions. There was at least a high level of awareness in the community of the Gateway Bridge toll removal.
69
Figure 22 shows preferences for the range of information sources.

Department of Transport and Main Roads, Riverside Expressway Transport Investigation and Network Analysis, 2010
70
10.0 RETINA summary and conclusions
Although the closure of the REX was a significant media and public event that caused disruption to a significant number
negative.
This section summarises and concludes the main findings of the RETINA project and consolidates the outcome of the investigations into five main topic areas:
travel behaviour changeroad transport and traffic managementrole of intelligent transport systems in incident detection, management and responsetransport network capacitypublic communications and media response.
The conclusions will be utilised by QT, MR and other stakeholders when reviewing and updating policies strategies, plans and procedures to improve the transport system's preparedness and response capability for any future network disruptions.
10.1 Travel behaviour change
10.1.1 Ability to change behaviour quickly
Subject to some peak hour public transport capacity constraints, 47 per cent of motor vehicle trips in Brisbane can potentially be replaced with other transport modes. In addition, many motor vehicle trips can also change route or time if necessary.
Community survey findings indicate that actual mode change during the closure was about 15 per cent and that affected commuters modified their travel behaviour in the following ways:
about 50 per cent changed routeabout 40 per cent changed their time of travel (most earlier)about 10 per cent changed destination or chose not to make a planned tripabout 15 per cent changed the mode of transport.
Studies of travel behaviour during transport incidents show that people make rational choices based on their perception of available transport options and are able to maintain the new travel behaviour until the incident is over.
Behaviour changes varied widely across case studies because of differences in the extent and nature of disruption and available opportunities to utilise alternatives. The most common changes were route changes, retiming of trips (usually earlier) and mode substitutions.
Many people from northern suburbs of Brisbane participated in a recent TravelSmart Brisbane North project and as a result were better informed and were more likely to try other transport modes, helping to reduce anticipated congestion levels. TravelSmart participants also reported more positive experiences on the new modes and were less likely to revert to using motor vehicles when the expressway reopened.

Department of Transport and Main Roads, Riverside Expressway Transport Investigation and Network Analysis, 2010
10.1.2 Travel pattern reversion
Case studies from around the world showed a general trend for the majority of pre-incident travel patterns to be resumed post incident, although some behaviour change was maintained in the long term in several cases. In Japan, where people tend to regularly use all modes, travel patterns reverted to essentially the same levels as pre-earthquake. In the UK and Tasmania where private motor vehicles dominate, public transport maintained some increased patronage after the reinstatement of each bridge.
behaviour after the expressway and bikeway were reopened. Over 80 per cent of these intended to continue with the new mode in the future.
Contrary to this intention, most of the increased public transport patronage had not been maintained three weeks after the closure.
10.1.3 Walking and cycling
The inability to reach some destinations during a network disruption, travel delays and uncertainty encourage more people to choose local destinations within walking and cycling distance. It can be expected then that patronage to walking and cycling increase during disruptions as more activities are contained to the local area.
Considering that approximately one third of all motor vehicle trips are less than three kilometres in distance, many of these could be replaced by walking or cycling. Insufficient pedestrian and cycle data was collected during the REX closure to confirm the assumption, but there is some anecdotal evidence from news reports suggesting that there was an increase in walking and cycling.
To continue this trend, more and improved walking and cycling paths, improved access to public transport and end of trip facilities are needed.
10.1.4 Flexible work arrangements
Organisations can play a significant role in reducing traffic demand by supporting alternative travel plans and by providing flexible work arrangements. Those organisations with existing travel plans were able to inform staff of ways they could avoid traffic congestion during the closure.
Results from consultation with Queensland Government have shown that the application of flexible work arrangements reduces pressure on the road network during peak periods.
The application of such policies could be increased through mechanisms to reduce congestion.
10.1.5 The role of High Occupancy Vehicles (HOVs)
The case studies highlighted that during the major network restriction event, government agencies instigated some form of discouragement or restriction to single occupant vehicles in order to reduce the extent of congestion across the remainder of the network. This often included the introduction or extension of HOV/transit and/or bus lanes and bus priority measures. Public transport services were generally increased or extended and additional park and ride sites were made available. The success of these measures in the case studies were mixed, dependent on the extent of time savings afforded to the buses and HOVs; the extent of concentrated verses dispersed trip destinations; and the availability of additional public transport vehicles and staff.
During the REX closure, bus and transit lanes were opened to general traffic, in contrast to management practice elsewhere. The delays to buses reduced the number of public transport services despite the additional buses deployed on the road network.
71

Department of Transport and Main Roads, Riverside Expressway Transport Investigation and Network Analysis, 2010
72
10.2 Road transport and traffic management
10.2.1 Inter-agency communication and cooperation
The established relationships and protocol agreements in place to manage the cross agency coordination of traffic incidents in Brisbane contributed significantly to management efficiencies. Some relationships were not identified or maintained during the closure and this affected intra and inter-agency communications.
Difficulties with classifying the incident level and invoking appropriate management systems also affected the overall outcome.
A whole-of-Government framework for managing critical traffic and transport incidents could address these difficulties. The framework would increase the efficiency and effectiveness of incident management and communications and would reduce recovery times by:
identifying specific roles of agency personnel in incidentsclassifying different incidents and agency roles within these classificationsidentifying external impacts in major incident planning policies and practicescreating information inflows from specialists during critical incidents.
10.2.2 Brisbane Metropolitan Transport Management Centre (BMTMC)
The BMTMC played a fundamental role in monitoring and assisting road operations, communicating to motorists and the public, and in providing updates on changed conditions to agencies involved in road operations. A particular advantage was the integration of MR and BCC traffic operations and Bus Operations in the one centre under the Alliance Agreement between Queensland and local government.
However, at the time the BMTMC was a relatively new entity with processes and working arrangements still evolving
regarding the role and status of the various agencies and BMTMC in managing network operations, data provision, and stakeholder and public communications.
10.2.3 Traffic Management Plans (TMPs)
Existing traffic management plans provided a base from which to develop TMPs for the unplanned closure. The TMPs for the planned maintenance work to resurface the REX (scheduled for September to October 2006) and for major events
The TMPs developed for the unplanned closure however, were limited due to difficulties in incorporating specific conditions not identified in previous plans and limited availability of skilled resources. To improve reference materials for unplanned closures, further TMPs for key links and vulnerable assets should be developed in advance.

Department of Transport and Main Roads, Riverside Expressway Transport Investigation and Network Analysis, 2010
10.2.4 Public transport
Public transport operators acted quickly to deploy additional services and optimise network/infrastructure usage during the closures. Additional trains (including carriages, services and modified routes) were added to the normal scheduled services. The morning and afternoon peaks were extended. Despite these measures, severe crowding on trains occurred.
Bus services were increased with additional buses added to many routes. Some routes experienced increased patronage and better performance. Other routes were hindered by fewer services because of longer travel times. The closure of the Captain Cook Bridge and the resulting bus diversion to the SEB significantly increased flows along the Busway and the Victoria Bridge. Buses were hindered by traffic congestion particularly in and around the CBD.
from a relatively low base and therefore is minor compared with the increase in rail patronage.
The natural day-to-day variability of patronage data made it difficult to provide accurate patronage figures. However, overall public transport patronage is estimated to have increased by about eight per cent during the closures. Citytrain was most effective in transporting extra people in and out of the city. The SEB was also effective, but overall buses did not increase patronage because of delays on the congested road network.
The introduction of TransLink's Go card system will improve the availability and accuracy of patronage figures and allow more robust analysis of modal shifts.
10.3 Role of ITS in incident detection, response and management
Clearing of incidents quickly is an increasing priority for the Queensland Government with many of our worst episodes of most congestion resulting from a traffic incident on a major road or intersection. The negative impacts of incidents can be reduced by focusing on:
more rapid responsesgetting traffic moving without compromising safetydiverting traffic where requiredand informing drivers during disruptions.
These strategies are made possible through the use of ITS such as STREAMS and a coordination body, the BMTMC .
ITS enhance capacity of existing infrastructure and improve real time responses and communications during incidents. They have been used to reduce congestion during disruptions and maximise traveller information and flow in the following ways:
Improve incident response and management by rapidly locating and responding appropriately to incidents that would otherwise cause further delaysProvide travel time information to alert motorists before and during trips of which routes to use and traffic conditions to expectCoordinate traffic signals to adjust timing, optimise the re-routed traffic flow and minimise delays.
MR, TransLink, QR and BCC already have substantial investments in some of these initiatives but as the network grows more implementation is required.
73

Department of Transport and Main Roads, Riverside Expressway Transport Investigation and Network Analysis, 2010
74
10.3.1 Detection, verification and monitoring of incidents
Currently MR, BCC and QT have a number of CCTV cameras around the Brisbane area. The closure revealed many “blind spots” in the network, particularly in Brisbane’s north and west (Gympie Road, Western Arterial from Milton Road and Sandgate Road). At these locations the BMTMC was forced to rely on reports from QPS and bus drivers to assess network conditions.
3 STREAMS is Main Roads’ integrated Intelligent Transport System (ITS) platform. STREAMS manages both freeway and surface street traffic. It provides
public transport priority and emergency vehicle priority); Incident Management (incident detection, verification, logging and incident response);
Passenger Information (real time passenger information) and Driver Information (incident reports, traffic conditions and travel times and parking
guidance).
4 The BMTMC operates under and is governed by an alliance agreement between BCC and Queensland Government (acting through the Department of
Main Roads and Queensland Transport). Their key role is to service the road commuters and public transport patrons. There are also Main Roads TMCs
Many agencies acknowledged the CCTV and data collection gaps across the network and reported they would have been
vehicle detection devices could address many of these gaps.
10.3.2 Travel time information
Knowing how long it will take to arrive at a destination depending on which route is taken and when is valuable information for any traveller. Agencies can provide this information via website, radio broadcasts, on VMS (including drive time boards) and/or by phone SMS. These communication mediums could be used to provide public transport variances, road work or road closure information.
Website hits and call centre logs during the REX closure confirmed that these channels were well utilised by the public, but required pre-awareness and/or knowledge of the services (website and information phone number 13 19 40) before information could be accessed. This exposes a gap in the target audience where those that have no previous knowledge or experience with public transport and the traffic/transport information phone lines or websites are excluded from the information.
During the REX closures, various agencies used a diverse range of media to ensure maximum saturation, including radio and press advertising, web announcements, flyers to affected residents and more than 80 VMS.
Radio provided the highest volume, most neutral and factual coverage and was identified in the community survey as the most preferred communication channel to receive information in future situations.
Radio should be the primary media used for communicating information and key messages quickly and effectively to the public.
investigated to improve decision making by providing accurate and authoritative information flows.

Department of Transport and Main Roads, Riverside Expressway Transport Investigation and Network Analysis, 2010
Table 18 – Lane capacity people by mode
Lane TypeEquivalent number of car lanes
in capacity
Capacity in peak direction
(people/hr)
Car lanes* 1 2 000-3 000
Transit/Bus lanes 3 5 000-8 000
Busway 5 10 000-16 500
Heavy Rail 10 20 000-30 000
75
Adapted from The South East
Transit Project Parliamentary
Public Works Committee Report
#39 Jul 1997.
10.3.3 Traffic signal coordination
Traffic signal coordination across the network was not optimal as MR and BCC run separate systems (BCC; BLISS and MR; STREAMS) that do not communicate directly. MR and BCC retimed signals manually to optimise traffic flows where necessary, relying on reports from QPS and bus drivers for information.
One integrated traffic signal system would increase effectiveness in dynamically optimising traffic flows and vehicle prioritisation across the network. MR and BCC are presently negotiating resolution of this issue.
5 BLISS is the traffic signal coordination system that BCC uses at key intersections to monitor traffic volume and change the timing of traffic signals to
ensure the most efficient traffic flow.
10.4 Transport network capacity
Table 18 shows approximate peak people carrying capacities of various transport modes compared with general use car lanes, indicating the ability of other corridors to absorb additional flows when a specific corridor is interrupted.
Actual capacity of existing links is usually constrained by intersections or the approach and exit routes. Capacities for
of public transport vehicles also does not allow for maintenance, so this cannot continue indefinitely.
Increased patronage resulted in high rates of public transport utilisation during peak hours. Lengthy timeframes involved in purchasing more train carriages or buses limited the ability to provide additional services. Existing peak period flows on many public transport corridors are at or near capacity thus limiting their ability to absorb additional movements without peak spreading.
Additional resourcing is required to allow public transport to maintain higher levels of patronage. Bottlenecks and links with no or inadequate alternatives in the public transport network should also be examined to identify how these can be alleviated. During the closures, Victoria Bridge operated at capacity due to diversions elsewhere, carrying more than 350 inbound buses (double usual levels) and close to 20 000 people per hour.
The current road network in and around the CBD operates close to capacity ordinarily, so severe congestion results if there is disruption to a critical link. This is also the case for rail as there are only two rail river crossings in Brisbane and limited corridors for trains from the north. During the closure, most additional public transport patrons travelled on the rail network. Should a major rail link be disrupted in the future, severe road network congestion would result from a shift to road based modes.
The closure of the REX had a major effect on the city’s road network, with traffic increases of between 10 to 20 per cent on the major arterials within one kilometre of the CBD. The Gateway Motorway and some eastern arterial roads were also affected while most roads outside the CBD’s one kilometre radius experienced only minor impacts. A critical blockage point for buses was the eastern end of Milton road at the intersection of Upper Roma Street. Bus services to and from the West experienced the most severe disruption.
The data highlights a need for transport system planning to include consideration of traffic and public transport impacts associated with disruption to the high volume links.

Department of Transport and Main Roads, Riverside Expressway Transport Investigation and Network Analysis, 2010
76
10.5 Public communications and media coverage
Public communication during the closures was delivered via existing communication media established as part of the planned maintenance work to the REX between September and October 2006.
MR Metropolitan District efficiently communicated operational information to relevant outlets. Information saturation through ministerial office support and senior MR/QT staff involvement was a priority communication exercise. TransLink disseminated information to the public about public transport services and changed traffic conditions.
The media and many organisations supported transport agencies in informing travellers of options, encouraging alternative mode use and adjusting their own activities to reduce, relocate or spread the demand.
A majority of the media coverage was not directly related to the media releases or ‘direct to public communication’ being generated by agencies. The media gave significantly more coverage to infrastructure and roads, focusing on traffic delays rather than the provision of public transport. Television focused on these issues even after reopening and ongoing maintenance information was released by the Minister for Transport and Main Roads and MR. Communication of reopening(s) was with short notice and received little coverage from the media.
Public transport service communication became operational in nature relying on websites, call centres and bus stop signage.
The absence of a designated contact point for public communications was identified as causing confusion and may have affected the quality, timeliness and effectiveness of information transmitted.
Despite some of the media focus on congestion, overall there was strong community and stakeholder support for:
the closurethe management of the incidentthe priority measures to ensure public safetythe transport information provided.