rivm rapport 320102002 development and applicability of … · digestion model in assessing the...
TRANSCRIPT
RIVM report 320102002/2004
Development and applicability of an in vitrodigestion model in assessing the bioaccessibilityof contaminants from food
CHM Versantvoort, E van de Kamp,CJM Rompelberg
This investigation has been performed by order and for the account of the Inspectorate forHealth Protection, within the framework of project 320102 (formerly 630030), Developmentand evaluation of in vitro methodologies to assess the internal exposure of man to ingestedcontaminants.
RIVM, P.O. Box 1, 3720 BA Bilthoven, telephone: 31 - 30 - 274 91 11; telefax: 31 - 30 - 274 29 71

- 2 - RIVM report 320102002
Abstract
This report is the fifth report of the project V/320102 (formerly V/630030) entitled:”Development and evaluation of in vitro methodologies to assess the internalexposure of man to ingested contaminants”. In human health risk assessment,ingestion of food is considered a major route of exposure to many contaminants. Thetotal amount of an ingested contaminant (intake) does not always reflect the amountthat is available to the body. Only a certain amount of the contaminant is bioavailable.Bioavailability is a term used to describe the proportion of the ingested contaminant infood that reaches the systemic circulation and can exert its toxic effects. Studies inanimals and humans indicate that the bioavailability of compounds from food can besignificantly different depending on the food source (food product), food processingor food preparation. As a consequence, a contaminant in product A can lead totoxicity whereas the same amount of contaminant in product B will not exert toxiceffects. On the basis of this knowledge we aimed to focus our research ondevelopment of experimental tools for estimating effects of the product onbioavailability of ingested contaminants in humans.
Release of the contaminant from the ingested product in the gastrointestinal tract is aprerequisite for uptake (and bioavailability) of a contaminant in the body. Thedigestion processes in the human gastrointestinal tract can be simulated in a simplifiedmanner with in vitro digestion models. This report describes the development of an invitro digestion model allowing for measurement of release of contaminants from theingested product as an indicator of oral bioavailability. Because food is considered amajor source for exposure to many contaminants, the in vitro digestion model wasused to study the release of contaminants from food products. This in vitro digestionmodel can also be used to examine the effects of food on the oral bioavailability ofingested contaminants from other orally ingested matrices such as soil and toys (seealso RIVM-reports 320102001 and 711701012). The model could also be applied inestimation of bioavailability of bio-active (functional food) components from differentfood products.

RIVM report 320102002 - 3 -
Contents
Samenvatting 5
Summary 7
1. Introduction 9
1.1 General introduction 9
1.2 Aim of this report 10
1.3 Outline of the report 10
1.4 Framework of research on bioaccessibility of contaminants from food 11
2. Oral bioavailability and bioaccessibility 13
2.1 Oral bioavailability: definition 13
2.2 Effect of matrix on bioavailability 132.2.1 Effect of matrix on bioaccessibility 142.2.2 Effect of matrix on absorption and metabolism 142.2.3 Relative bioavailability factor 14
2.3 Bioaccessibility – in vitro digestion models 15
3. Literature research on the development of an in vitro digestion model simulating fedconditions. 17
3.1 Food intake 17
3.2 Mouth 183.2.1 Saliva 18
3.3 Stomach 183.3.1 Residence time – gastric emptying 183.3.2 Gastric pH 18
3.4 Small intestine 183.4.1 Bile secretion 183.4.2 Pancreatic juices 193.4.3 Residence time 193.4.4 Intestinal pH 19
3.5 Volume of food and digestive fluids 19
3.6 Conclusions review: proposal for the in vitro digestion model simulating fed conditions 20
4. Development and optimisation of an in vitro digestion model for fed conditions 21
4.1 Development-starting point in vitro digestion model 214.1.1 Type of matrix and contaminant 214.1.2 Volume of food and digestive fluids 214.1.3 pH drift in the gastric compartment 224.1.4 Handling of the chyme 224.1.5 Experimental starting point for in vitro digestion model representative for fed conditions 23
4.2 Optimisation of in vitro digestion model: Research on effects of several variables onbioaccessibility 24
4.2.1 Effect of the amount of food on bioaccessibility of B[a]P 264.2.2 Variations of experimental conditions of the vitro digestion model 264.2.3 Fasted versus fed conditions 28

- 4 - RIVM report 320102002
4.2.4 Reproducibility of the test procedure 29
4.3 Optimised in vitro digestion model simulating fed conditions. 30
5. Case studies: determination of bioaccessibility from contaminated food products 33
5.1 Cadmium in lettuce and radish. 335.1.1 Experimental 335.1.2 Results: Bioaccessibility of cadmium from lettuce and radish 34
5.2 Aflatoxin B1 in peanut slurries 345.2.1 Experimental 355.2.2 Results: bioaccessibility of aflatoxin B1 from peanut slurries 36
5.3 Ochratoxin A in buckwheat 385.3.1 Experimental 385.3.2 Results: bioaccessibility of ochratoxin A from buckwheat 39
5.4 Discussion on bioaccessibility of contaminants from food products 405.4.1 Bioaccessibility of contaminants from food products 405.4.2 Effect of type of matrix: food versus soil 405.4.3 Concentration of contaminant 40
5.5 Conclusions on bioaccessibility from food products 41
6. (Pre)validation of the in vitro digestion model 43
6.1 Modulators of mycotoxin bioavailability in vivo 43
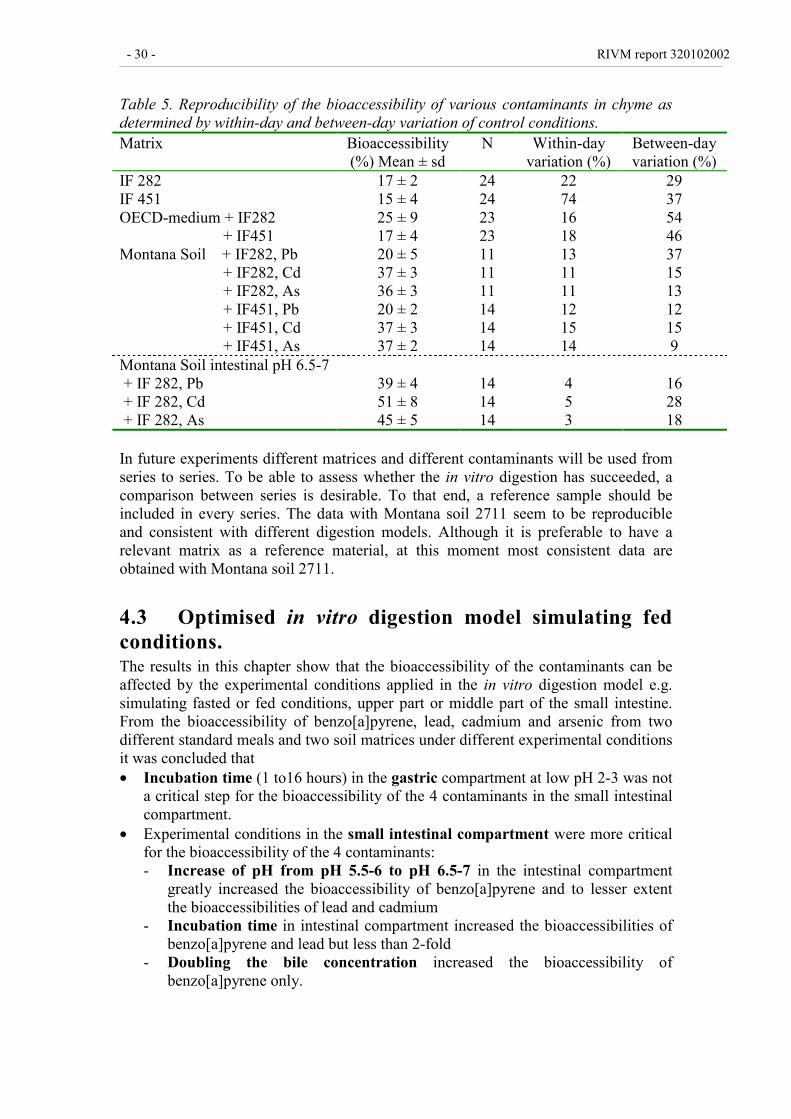
6.2 Modulators of mycotoxin bioaccessibility in vitro 46
6.3 Conclusions 48
7. Applicability of the in vitro digestion model in risk assessment 49
7.1 How can determination of the bioaccessibility of contaminants with an in vitro digestionmodel aid to improvement of health risk assessment? 50
7.1.1 Exposure assessment. 507.1.2 Health risk assessment. 50
7.2 Conclusions 53
References 54
Appendix 1 59

RIVM report 320102002 - 5 -
Samenvatting
Voedsel is een belangrijke bron voor blootstelling aan contaminanten. Bijrisicoschatting van ingeslikte contaminanten is vaak onbekend hoeveel van decontaminant wordt opgenomen in het menselijk lichaam. Alleen het deel van decontaminant dat vrijkomt uit het voedsel (bioaccesibility) en biobeschikbaar is(terecht komt in bloed, organen en weefsels), kan toxiciteit veroorzaken. Debiobeschikbaarheid van een stof is in grote mate afhankelijk van het voedselproduct,waarin het zich bevindt, of van de bereidingswijze van het voedsel. Dit bemoeilijkteen accurate risicoschatting van toxische stoffen in de mens. Daarom zijnmethodieken nodig, waarmee een snelle schatting van het effect van hetvoedselproduct op de orale biobeschikbaarheid van een stof verkregen kan worden.
Een dergelijke methodiek is gevonden in de ontwikkeling van een in vitrodigestiemodel. Met dit model wordt het digestieproces in het maagdarmkanaal opeenvoudige wijze gesimuleerd en kan het effect van een voedselproduct op debiobeschikbaarheid van een stof onderzocht worden. Hierbij wordt het voedselproductwaarin de stof zich bevindt toegevoegd aan het model en wordt gemeten welke fractievan een stof vrijkomt tijdens het digestieproces (bioaccessibility). Alleen deze fractieis beschikbaar voor opname in het lichaam.
In het huidige rapport wordt de ontwikkeling beschreven van een in vitrodigestiemodel dat gebaseerd is op fysiologische omstandigheden in volwassenen nahet eten van een warme maaltijd. Door te eten veranderen allerlei fysiologischeparameters in het maagdarmkanaal. Dit kan tot opmerkelijk verschillen in oralebiobeschikbaarheid van een contaminant leiden. Dit werd geïllustreerd aan de handvan een 8-voudige toename van de bioaccessibility van benzo[a]pyrene uit bodemwanneer gevoede in plaats van nuchtere condities in het maagdarmkanaal gesimuleerdwerden in het in vitro digestiemodel.
De toepasbaarheid van het in vitro digestiemodel werd onderzocht aan de hand vandrie voedselproducten waarin contaminanten waren aangetroffen: cadmium in sla enradijs, aflatoxine B1 in pinda en ochratoxine A in boekweit. De bioaccessibilitieswaren respectievelijk ~60% en 70% voor cadmium uit sla en radijs, ~90% vooraflatoxine B1 uit pinda’s en ~60% voor ochratoxine A uit boekweit.
Als een eerste kwalitatieve validatie van het in vitro digestiemodel, werden effectenvan adsorberende materialen op de bioaccessibility van aflatoxine B1 en ochratoxineA uit voeding vergeleken met de effecten van deze stoffen in proefdieren. Van vijfvan de zes combinaties adsorbent / mycotoxine waren de resultaten verkregen met hetin vitro digestiemodel representatief voor in vivo gegevens in dieren. En geen van deresultaten met aflatoxine B1 en ochratoxine A in het in vitro digestiemodel waren integenspraak met in vivo gegevens.
Conclusies ontwikkeling in vitro digestiemodel. De resultaten laten zien dat hettechnisch haalbaar is om de bioaccessibility van contaminanten uit voedselproductenreproduceerbaar te meten. De bioaccessibility van een contaminant was afhankelijkvan de matrix waarin het zich bevond, en kon beïnvloed worden door de toegepasteexperimentele condities in het digestiemodel, bijvoorbeeld simulatie van nuchtere of

- 6 - RIVM report 320102002
gevoede condities. Niet alle contaminant werd vrijgemaakt uit de voedselproductentijdens het digestieproces. Dit impliceert dat de blootstelling van organen en weefselsaan de contaminant lager is dan de externe blootstelling en de blootstelling aancontaminant dus waarschijnlijk overschat wordt. De resultaten van de kwalitatievevalidatie van het in vitro digestiemodel met aflatoxine B1 en ochratoxine A inaanwezigheid van adsorberende materialen tonen aan dat het in vitro digestiemodeleen waardevol hulpmiddel kan zijn om de in vivo biobeschikbaarheid van stoffen tevoorspellen. Voordat het in vitro digestiemodel gebruikt kan worden in risicoschattingmoet ze verder worden gevalideerd met in vivo data. Toekomstig onderzoek zal zichhierop richten.
Hoe kan het in vitro digestiemodel bijdragen tot een beter risicoschatting? Op ditmoment wordt de humane blootstelling aan een contaminant uit voeding berekenddoor de inname van de contaminant per product bij elkaar op te tellen. Echter debiobeschikbaarheid van de contaminant kan per product verschillend zijn. Door debioaccessibility van de contaminant uit de verschillende voedselproducten te bepalenals mate voor de matrix afhankelijk orale biobeschikbaarheid van de contaminant, kanhet in vitro digestiemodel tot een betere blootstellingsschatting leiden. Ook kan het invitro digestiemodel als hulpmiddel gebruikt worden bij humane risicoschatting. Totnu toe wordt bij humane risicoschatting verondersteld dat de biobeschikbaarheid vaneen contaminant uit een willekeurig product gelijk is aan de biobeschikbaarheid vande contaminant uit de matrix die bij toxiciteitstudies wordt gebruikt. Bijtoxiciteitstudies worden veelal drinkwater, olie of gepelleteerd diervoedsel alsmatrices gebruikt, terwijl mensen oraal worden blootgesteld aan contaminanten uitveel verschillende voedselproducten en eventueel ook uit andere matrices. Door eenrelatieve biobeschikbaarheidsfaktor te bepalen (dit is de ratio van de bioaccessibilityvan een contaminant uit een bepaalde matrix met de bioaccessibility van decontaminant uit de matrix van de toxiciteitstudie) kan het in vitro digestiemodel eenhulpmiddel voor humane risicoschatting zijn.

RIVM report 320102002 - 7 -
Summary
Food is considered a major source of exposure to ingested contaminants. It is oftennot known how much of the ingested contaminant is actually taken up in the humanbody. Only the fraction of the contaminant that is released from the food(bioaccessible) and is bioavailable (concentration in blood, organ and tissues) canexert toxic effects. Studies in experimental animals and humans indicate oralbioavailability of compounds to be dependent on the food product, food processing orfood preparation. This hampers an accurate risk assessment of ingested toxiccompounds in humans. On the basis of this knowledge we aimed to focus our researchon development of experimental tools for estimating effects of the matrix on oralbioavailability of ingested contaminants in humans.
Such a method is found in the development of an in vitro digestion model. With thismodel the digestive processes in the gastrointestinal tract are simulated in a simplifiedmanner, allowing for measurement of the release (bioaccessibility) of ingestedcontaminants from food as an indicator of oral bioavailability. An in vitro model waspreferred over in vivo studies since it reduces the use of experimental animals andfacilitates the possibilities for investigating a large number of samples and variables ina standardised setting.
This report documents the development and optimisation of an in vitro digestionmodel representative of the human physiology of the gastrointestinal tract after eating.The in vitro digestion model simulating fasting conditions, which has been developedpreviously in our laboratory to investigate the bioaccessibility of contaminants fromingested soil [RIVM-report 711701 012], was the starting point for the developmentof the in vitro digestion model simulating fed conditions. Eating food leads tophysiological changes in the gastrointestinal tract, which may have the mostsignificant impact on oral bioavailability. This was demonstrated by 8-fold increase ofthe bioaccessibility of benzo[a]pyrene from soil when fed conditions instead of fastingconditions were simulated in the in vitro digestion model. Conversion from fasted tofed conditions had not much effect on the bioaccessibilities of lead, cadmium andarsenic from soil.
Next, the in vitro digestion model was used in three case studies to determine:1) bioaccessibility of cadmium from lettuce and radish cultured on three differentfields contaminated with cadmium, 2) bioaccessibility of aflatoxin B1 from 9 batchesof peanuts and 3) bioaccessibility of ochratoxin A from two batches of buckwheat.Considerable amounts of cadmium, aflatoxin B1 and ochratoxin A were mobilisedfrom the food matrices during the digestion process. The respective bioaccessibilitieswere ~60% and ~70% for cadmium from lettuce and from radish, ~90% for aflatoxinB1 from peanut slurries, and ~60% for ochratoxin A from buckwheat.
As a first validation of the in vitro digestion model, the effects of adsorbent materialson the bioaccessibility of aflatoxin B1 and ochratoxin A from food were comparedwith in vivo data in experimental animals. In 5 out of 6 combinations of adsorbentsand mycotoxins, the effects of the adsorbents on the bioaccessibility of aflatoxin B1and ochratoxin A in the in vitro digestion model were in agreement with the effects

- 8 - RIVM report 320102002
observed in vivo. None of the effects with the in vitro digestion model disagreed withthe effects observed in vivo.
In conclusion, the experiments showed that it is technically feasible to reproduciblydetermine the bioaccessibility of contaminants from food and other ingested matriceswith an in vitro digestion model. Bioaccessibility of a contaminant was dependent onits matrix and could be affected by the experimental conditions applied in the in vitrodigestion model, e.g. simulating fasted or fed conditions. Not all the contaminantswere released from their matrices during digestion, indicating that internal exposure(oral bioavailability) to the contaminant was lower than the external exposure (intakeof the contaminant). The results of the (pre)validation of the in vitro digestion modelwith adsorbents and bioaccessibility of aflatoxin B1 and ochratoxin A, show the invitro digestion model as a possible powerful tool in predicting in vivo bioavailabilityof compounds. Before the in vitro digestion model can be used in risk assessment, amore quantitative validation of the in vitro digestion model for the in vivo situation inhumans is recommended.
How can an in vitro digestion model contribute to a better risk assessment? Toxicitystudies use typically liquid (drinking water, oil) or food matrices (animal feed),whereas humans are exposed to contaminants from many different food products andeventually other matrices. Currently, human exposure to a contaminant in food iscalculated based on the sum of the intake of the contaminant from each food product.However, the bioavailability of the contaminant from each product can be different.By determining the bioaccessibility of the contaminant from each food product as ameasure of the matrix- or food-product-dependent oral bioavailability of thecontaminant, the in vitro digestion model can be seen as an aid to better exposureassessment of contaminants from food. The in vitro digestion model may also be auseful tool for improving health risk assessment by determination of a relativebioaccessibility factor, i.e. comparison of the bioaccessibility of a contaminant fromthe ingested matrix of interest with the bioaccessibility of the contaminant from thematrix used in the toxicity studies. This relative bioaccessibility factor is likely toreflect the relative oral bioavailability and, consequently, the toxicity of thecontaminant.

RIVM report 320102002 - 9 -
1. Introduction
1.1 General introductionIn human health risk assessment, ingestion of food is considered a major route ofexposure to many contaminants either caused by industrial or environmentalcontamination or as result of production processes. The total amount of an ingestedcontaminant (intake) does not always reflect the amount that is available to the body.Only a certain amount of the contaminant is bioavailable. Bioavailability is a termused to describe the proportion of the ingested contaminant in food that reaches thesystemic circulation and can exert its toxic effects.
Oral bioavailability of a compound can be subdivided in three constituent processes(see figure 1 in chapter 2.1):1. Release of the compound from its matrix in the intestinal lumen (bioaccessibility)2. Transport across intestinal epithelium in the body (intestinal transport)3. Degradation of the compound in the liver (and intestine) (metabolism)
The matrix in which a contaminant is present, for example, food product or liquid canaffect the fraction of contaminant that is released from its matrix during transitthrough the gastrointestinal tract after ingestion. The released fraction of thecontaminant, the bioaccessibility of the contaminant, is available for intestinalabsorption. The subsequent processes affecting the bioavailability of an ingestedcompound are transport across the intestinal epithelium and metabolism in the liver.These two processes depend mainly on compound specific properties, such asmolecular weight, lipophilicity, affinity for P450 etc [Lipinski et al., 1997; Palm etal., 1996]. The matrix itself will not affect the compound specific properties, andtherefore, it is unlikely that the matrix itself will have an effect on the absorption ormetabolism of the contaminant [Versantvoort and Rompelberg, 2001].
Studies in experimental animals and humans suggest that oral bioavailability ofcompounds from food can be significantly different depending on the food source(food product), food processing or food preparation [Wienk et al., 1999; van het Hofet al., 2000]. As a consequence, the intake of a contaminant in food matrix A can leadto toxicity whereas the intake of the same amount of contaminant in food matrix Bwill not exert toxic effects.
Quantification of bioavailability and bioaccessibility is difficult and often hamperedby complex processes comprising digestion. Accurate in vivo experiments in man orexperimental animals can provide the best information on the (relative) bioavailabilityof ingested compounds [Versantvoort et al., 2000]. However, an in vitro technique ispreferred over in vivo studies because it reduces the need to experimental animals andthe vast amount of different products/matrices demand a simple, reproducible andstandardised test procedure.
The digestion processes in the gastrointestinal tract can be simulated in a simplifiedmanner with in vitro digestion models [Garret et al., 1999; Glahn et al., 1996; Ruby etal., 2001; Oomen et al., 2002]. With such an in vitro digestion model, thebioaccessibility of compounds from their matrix during transit in the gastrointestinal
- 10 - RIVM report 320102002
tract can be investigated as an aspect of oral internal exposure to the contaminant. Byexamining the effects of the matrix on the bioaccessibility of ingested contaminantswith an in vitro digestion model, the exposure assessment of man to ingestedcontaminants can be improved.
1.2 Aim of this reportThe general aim of the project is to contribute to improvement of exposure assessmentof ingested contaminants by means of developing experimental tools to estimate theinternal exposure of man to ingested contaminants. Food is considered a major sourcefor exposure to many contaminants. Recently, we have developed in our laboratory anin vitro digestion model to simulate the digestion of contaminated soil by childrenunder fasted conditions [Oomen et al., 2003]. Experience with this in vitro digestionmodel has been acquired during several years [Sips et al., 2001; Oomen et al., 2002;Oomen et al., 2003]. Eating food leads to physiological changes in the gastrointestinaltract, which may have the most significant impact on oral bioavailability [Charman etal., 1997]. Thus, to study bioaccessibility of a contaminant from food, fed conditionsinstead of fasted conditions are required. Therefore, the in vitro digestion model foringestion of soil contaminants by children needs to undergo some changes to mimicthe physiological processes in the gastrointestinal tract of human adults after eatingfood.
The aim of this report is to develop an in vitro digestion model, which can beused to examine the effects of the food matrix on the bioaccessibility of ingestedcontaminants, so that human risk assessment of contaminants in food can beimproved. Thereto the following issues are addressed in this report:1) The in vitro digestion model should fulfill the following criteria:
a) The model has to represent physiology of humans.b) The last compartment of the model is the small intestine as this is the
absorption site of the majority of compounds.c) The experimental conditions should represent a worst-case situation, but this
should be as realistic as possible. This situation may be compound-dependent.d) The test procedure should be easily applicable, robust and reproducible.
2) Simulation of fasted or fed conditions in the in vitro digestion model have beencompared by means of the bioaccessibility of several contaminants.
3) The optimised in vitro digestion model was applied in three case studies toexamine the technical feasibility to determine the bioaccessibility of contaminantsfrom food.
4) (Pre)validation of the in vitro digestion model with in vivo derived data.5) Application of the in vitro digestion model in health risk assessment is discussed.
1.3 Outline of the reportIn chapter 2 an introduction to internal exposure after ingestion (oral bioavailability)and bioaccessibility is given. A summary of the literature review of the effects ofeating food on physiological responses in gastrointestinal tract in the threecompartments mouth, stomach and small intestine is given in this chapter 3. In chapter4 variations in experimental conditions of the in vitro digestion model have beenexamined on the bioaccessibility of various contaminants (lipophilic and metals) and

RIVM report 320102002 - 11 -
different matrices in order to lead to an optimised in vitro digestion model simulatingfed conditions.The optimised in vitro digestion model was applied in three case studies to examineits technical feasibility to determine the bioaccessibility of contaminants from food.The bioaccessibility of cadmium from lettuce and radish cultured on three differentfields contaminated with cadmium, the bioaccessibility of aflatoxin B1 from 9 batchesof peanuts and the bioaccessibility of ochratoxin A from two batches buckwheat weredetermined in chapter 5.In chapter 6, the bioaccessibilities of aflatoxin B1 and ochratoxin A in presence ofadsorbent materials determined with the in vitro digestion model have been comparedwith in vivo data in humans and animals as a first validation of the in vitro digestionmodel.In chapter 7, the applicability of the in vitro digestion model for health riskassessment of ingested contaminants from food is discussed shortly.
1.4 Framework of research on bioaccessibility ofcontaminants from foodThe research on bioaccessibility of contaminants from food is performed in projectV/320102 (formerly V/630030). The overall aim of the project is to develop andevaluate the use of in vitro methodologies to assess the internal exposure of man toingested contaminants. Project V/320102 consists of two lines: research on thebioaccessibility of contaminants from 1) food and 2) toys. The present reportdescribes the development an in vitro digestion model for fed conditions, to assess thebioaccessibility of ingested contaminants from food. In the toy part of the project, invitro digestion models (suck, suck-swallow, swallow variants) have been developedthat simulate the various exposure conditions handling toys (report 320102001).
Project V/320102 is related to project I/320000/16/OB (formerly M/711701/01/OB).In project I/320000/16/OB an in vitro digestion model for contaminants in soil hasbeen developed for one specific purpose: to simulate the ingestion and digestion ofcontaminated soil by children under fasted conditions and experience with the modelhas been acquired during several years. This in vitro digestion model was the startingpoint for the development of the food and toy digestion models. In addition, bothprojects are related in the research on the validation of the models with Pb, becausethe first in vitro - in vivo validation is based on the bioavailability of Pb from soilunder fed and fasted conditions. The in vitro – in vivo validation has been furtheraddressed in milestone “Haalbaarheidsstudie naar validatie van het in vitrodigestiemodel” [Versantvoort and Rompelberg, 2001], milestone“Haalbaarheidsstudie naar combinatie in vitro digestiemodel met in vitro absorptiemodel” [Versantvoort and Rompelberg, 2003], and milestone “Validatie in vitrodigestiemodel in vivo” (to be delivered in 2004).

- 12 - RIVM report 320102002

RIVM report 320102002 - 13 -
2. Oral bioavailability and bioaccessibility
2.1 Oral bioavailability: definitionThe term oral bioavailability knows many interpretations, mostly depending on thefield of research. Oral bioavailability is here defined as the fraction of an externaldose that results in internal exposure (see figure 1). The external dose represents thetotal amount of a contaminant ingested. The contaminant is considered “internal” if itis absorbed from the gastrointestinal tract, transported through the liver into thesystemic circulation, i.e. the central bloodstream.Oral bioavailability consists of three processes that are schematically presented infigure 1. First, the contaminant should be mobilised from its matrix into the juices ofthe gastrointestinal tract. This process is referred to as bioaccessibility. The mobilisedcontaminants can subsequently be transported across the intestinal epithelium into theportal vein. The fraction of the contaminant that passes the liver without beingmetabolised will reach the systemic circulation. Consequently, bioavailability (F) isthe product of bioaccessibility (FB), absorption (FA), and metabolism (FH).
External exposure
small intestineportal vein
liver
Mouth, oesophagus, stomach,small intestine
systemic circulation
Internal exposure
Exposure to an external dose of contaminant in a matrix
FB = Fraction of an external dose released from matrix (bioaccessibility)
FA= Fraction of FB transported across intestinal epithelium
FH = Fraction of FA passing the liver without being metabolised
F = Fraction of external dose reaching systemic circulation = Bioavailable fraction of contaminant
F = FB ×××× FA ×××× FH
Figure 1. Schematic representation of processes determining oral bioavailability.
2.2 Effect of matrix on bioavailabilityThe matrix in which a contaminant is present, for example, food, liquid, soil, toy, canaffect the oral bioavailability of a contaminant. For example, various dietary factorshave an effect on the bioavailability of carotenoids. The bioavailability of ß-carotenefrom vegetables was low (~14%) compared to that of purified ß-carotene added to oilin salad dressing [van het Hof et al., 2000]. The bioavailability of Fe from meat ishigher than from soy or egg [Wienk et al., 1999]. For Pb, it appeared thatbioavailability from soil is considerable lower than bioavailability of lead salts in the

- 14 - RIVM report 320102002
diet [Dieter et al., 1993; Freeman et al., 1996]. The effect of the matrix of ingestionon the different aspects of oral bioavailability, i.e. bioaccessibility, absorption andmetabolism, is addressed in paragraph 2.2.1. and 2.2.2.
2.2.1 Effect of matrix on bioaccessibilityThe matrix in which a contaminant is present plays an important role inbioaccessibility. The matrix affects the fraction of contaminant that is released intodigestive fluid during transit through the gastrointestinal tract after ingestion. Only thecontaminant molecules that are released from the matrix in the small intestine areconsidered to be available for intestinal absorption.Studies with an in vitro digestion model as developed earlier in our laboratory haveshown that a considerable fraction of contaminants remains associated with soilduring digestion [Oomen et al. 2003; Oomen et al. 2002]. Hence, the matrix ofingestion may lower the bioaccessible fraction, i.e. FB < 1, and thus lower internalexposure.
2.2.2 Effect of matrix on absorption and metabolismCompound specific properties, such as molecular weight, lipophilicity, affinity forP450 etc, determine the passage over the intestinal epithelium and the susceptibilityfor metabolism in the liver [Lipinski et al., 1997; Palm et al., 1996]. As the matrixwill not affect the compound specific properties, it is not expected that once releasedfrom the matrix, the matrix itself will have an effect on the absorption or metabolismof the contaminant. Nevertheless, in some cases the matrix of ingestion has beenshown to affect the transport of the contaminant across the intestinal epithelium[Charman et al., 1997; Wienk et al. 1999]. For example, food constituents maycompete with the contaminant for transport across the intestinal epithelium. This islikely the case for minerals and metals. However, as transport across the intestinalepithelium and metabolism in the liver predominantly depend on compound specificproperties, it can be assumed that the matrix of ingestion does not affect the transportacross the intestinal epithelium or the metabolism in the liver.
2.2.3 Relative bioavailability factorThe oral bioavailability is the product of the three processes: bioaccessibility,intestinal transport and metabolism. The contribution of each individual process cannot be determined in human [Versantvoort and Rompelberg, 2001]. For example, amajor problem for validation of the in vitro digestion model against the in vivosituation is that different end-points are considered in vivo and in vitro. In thedigestion model the fraction of the administered dose available for absorption isdetermined. To determine the fraction available for absorption in vivo samples shouldbe taken in the small intestine at different sites and time-points, which is generally notachievable. Therefore, blood concentrations, urine excretion and or animalperformance (e.g. body gain weight, feed intake, mortality) are taken as endpoints forbioavailability of (toxic) compounds. However, by comparising the internal exposureof a compound from two different matrices (e.g. drinking water vs food) or twodifferent physiological conditions (fasted vs fed), a relative oral bioavailability factorcan be determined.

RIVM report 320102002 - 15 -
How could the relative bioavailability factor be determined?This has been described extensively in milestone “Haalbaarheidsstudie naar validatievan het in vitro digestiemodel” [Versantvoort and Rompelberg, 2001] and willaddressed here shortly. Oral bioavailability (F) of an ingested compound is theresultant of the three steps: bioaccessibility (Fb), transport across the intestinalepithelium (Fa), and metabolism (Fh) (see figure 1).
F= Fb x Fa x Fh (1)
The relative bioavailability factor is defined asF relative = F matrix A / F matrix B (2)
and can also be written asF relative = (Fb x Fa x Fh) matrix A / (Fb x Fa x Fh)matrix B (3)
The bioaccessibility of a contaminant, the proportion of the ingested contaminant thathas been released from its matrix during digestion in the gastrointestinal tract, isaffected by its compound specific characteristics, by the matrix in which thecontaminant was ingested and by the digestive processes in the gastrointestinal tract.The other two processes, intestinal transport and metabolism, are mainly affected bythe compound specific characteristics of the contaminant (see chapter 2.2.2). As thematrix will not affect the compound specific properties, it is not expected that oncereleased from the matrix, the matrix itself will have an effect on the absorption ormetabolism of the contaminant.
Hence, assuming that the intestinal transport and metabolism of the compound are notaffected by the matrix of ingestion the relative bioavailability factor can be written as
F relative = (Fb matrix A x Fa x Fh) / (Fb matrix B x Fa x Fh) (4)= Fb matrix A / Fb matrix B (5)
In that case, the difference in bioavailability of a compound from two differentmatrices is reflected by the difference in bioaccessibility of the compound from thetwo matrices.
2.3 Bioaccessibility – in vitro digestion modelsThe last decade there is an increasing interest in the use of in vitro methodologies tostudy the human oral bioavailability of compounds from soil and food [Garret et al.,1999; Glahn et al., 1996; Minekus et al., 1995; Ruby et al., 2001; Oomen et al.,2002]. The mobilisation of a compound from its matrix (bioaccessibility) in thegastrointestinal tract is a dynamic process with continuously changes in physiologicalconditions in the gastrointestinal tract. With in vitro digestion models the digestionprocess in the gastrointestinal tract is simulated in a simplified manner by applyingphysiological based conditions i.e. chemical composition of digestive fluids, pH andresidence time periods typical for each compartment. Most of the in vitro digestionmodels describe a two- (stomach and small intestine) or three-step procedure (mouth,stomach, small intestine or stomach, small and large intestine). This is schematicallyillustrated in figure 2. The bioaccessibility of the contaminant can be determined ineach compartment, however, absorption of compounds takes mainly place in the small

- 16 - RIVM report 320102002
intestine and therefore, the bioaccessibility is mostly only determined in the chyme ofthe small intestine.
contaminated matrix
Stomach gastric juice
duodenal juice +bile
separation
Remaining matrix
bioaccessibility ofcontaminant
analysis
Incubation time
min
hours
hours
chyme
saliva
Small intestine
Mouth
Figure 2. Schematic representation of an in vitro digestion model.The in vitro digestion model describes a three-step procedure simulating the digestiveprocesses in mouth, stomach and small intestine. In each compartment, the matrix isincubated at 37°C for a time relevant for the compartment. The digestion is initiated byaddition of artificial saliva to the contaminated matrix. Subsequently, gastric juices andintestinal fluids are added to simulate the digestive processes in stomach and small intestine,respectively. Thereafter, the concentration of the contaminant in the chyme (intestinalcontent) is determined.

RIVM report 320102002 - 17 -
3. Literature research on the development of anin vitro digestion model simulating fed conditions.Recently, we have developed in our Laboratory of Exposure Assessment an “in vitrodigestion model”, which consists of a three step procedure covering the digestion inmouth, stomach and small intestine [Oomen et al., 2003]. This digestion model hasbeen developed for one specific purpose: to simulate the ingestion and digestion ofcontaminated soil by children. This model is based on the physiology of a child underfasted conditions. Eating food leads to changes in the gastrointestinal tract due to i)secretion of gastric acid and bile and pancreatic fluids, ii) modification of gastric andintestinal motility patterns, and iii) alterations in visceral blood and lymph flow.These changes have the most significant impact on oral bioavailability. Therefore, thein vitro digestion model for ingestion of soil contaminants by children needs toundergo some changes to mimic the physiological processes in the gastrointestinaltract of human adults after eating food.A summary of the literature review on changes in digestive secretions in response offood in the gastrointestinal tract and the residence time of food in the gastrointestinaltract in the three compartments mouth, stomach and small intestine is given in thischapter and described in more detail in appendix 1.
3.1 Food intakeA cooked (evening) meal was chosen as all macronutrients are ingested with a widevariety of food products. Mean intake of energy and macronutrients per cooked mealin men and women in the Netherlands are based on the food consumptionmeasurements (VCP 1997-1998) [1998]. The mean data in Table 2 pg 52-73 of theVCP 1997-1998 were used to calculate the overall means without using a weighingfactor and are shown in table 1. On average, the adult population in the Netherlandsconsumes equal amounts of protein and fat and a double amount of carbohydrateswhen eating a cooked (evening) meal with a mean caloric intake of ~800 kcal (5%percentile and 95% percentile are 299 and 1486 kcal, respectively).
Table 1. Mean intake of energy and nutrients per evening meal in men and womenaged 19-65 in the Netherlands compared with two infant formulas.
Intakecooked meal per
100g
Infant formulasPer 100g
(Olvarit product number)mean 451 282 282 + 2g
oilKcal 106 67 86 103Protein (g) 5.1 3.0 4.1 4.1Carbohydrate (g) 9.8 7.0 11.4 11.4Fat (g) 5.0 3.0 2.6 4.6
As a standard meal for the in vitro digestion model two infant formulas were chosensince the food is ready for consumption and natural products such as meat, vegetablesand potatoes/rice/pasta are the source for protein, carbohydrate and fat content. Theproducts were selected based on the caloric content and composition of the

- 18 - RIVM report 320102002
macronutrients. The infant formulas are low in energy content: 67-86 kcal/100gcompared to the mean VCP intake of 106 kcal/100 g. Product 451 has a compositionof macronutrients (protein/carbohydrate/fat), which is comparable to the mean VCPconsumption. However, the energy content is only 63% of the mean intake. Otherfood products have relatively too many carbohydrates and far too little fat comparedto the adults consumption profile. By addition of 2g oil (fat), product 282 becomescomparable to the mean VCP intake by adults in respect to the energy contentalthough the relative carbohydrate content remains high (carbohydrate: protein = 2.8instead of 1.9).
3.2 Mouth3.2.1 SalivaSour taste, chewing, and smooth objects in the mouth stimulate the saliva production.In rest condition, the flow rate is approximately 0.5 ml/min, which increases 3 to 4-fold upon stimulation with maximal flow rates of 10 ml/min [Guyton, 1991; vanAmerongen et al., 1994]. The composition of the saliva is dependent on the flow rate:at higher flow rates, sodium, calcium, chloride, bicarbonate, (and amylase) increasewhilst phosphate concentrations and mucin decrease and the potassium concentrationsshow little further change.
3.3 Stomach3.3.1 Residence time – gastric emptyingThe gastric emptying is determined by three major factors: the volume of the meal, itsosmotic pressure and its the caloric content of the food. The rates of emptying of thethree major foodstuffs (fat, carbohydrate and protein) are regulated so that equalnumbers of calories are delivered to the duodenum in the same time (2 kcal/min) and[Hunt and Stubbs, 1975]. Fluid meals generally empty from the stomach according tofirst order kinetics with T1/2 ranging from 10-60 min. Solid meals empty from thestomach according to zero order kinetics. Emptying dependent on caloricconcentration (T1/2 ranging from 60 – 277 min) but after a heavy meal completelyemptying of the stomach can take up to 16 hours [Davenport, 1984].
3.3.2 Gastric pHFasting gastric pH is between 1.5 and 2. Upon eating a meal, the gastric pH risestemporary to pH 3-7. During gastric emptying, the gastric pH gradually declines untilthe fasted-state pH environment has been reestablished (usually within 1-2 h afteringestion) [Malagelada et al., 1976; Davenport, 1984; Dressman et al., 1990].
3.4 Small intestine3.4.1 Bile secretionThe gallbladder contracts in a reaction to fat entering the duodenum. This results in apeak concentration of bile in the duodenum followed by a lower “constant” bileconcentration. Bile, mostly produced by the liver, is secreted in the duodenum as longas there is fat in the duodenum. The gallbladder only starts refilling with bile when thestomach is almost empty [Lawson et al., 1983]. The amount of bile secreted by the

RIVM report 320102002 - 19 -
gallbladder depends on the amount and the type of fat in the duodenum. In theproximal small intestine, fasting bile concentrations were in the range 1.5-5 mM (1-3g/l chyme) and increased to 7-15 mM (5-10 g/l chyme) after eating. The bileconcentration was elevated until the food was emptied from the stomach [Brunner etal., 1974].
3.4.2 Pancreatic juicesPancreatic juices are secreted in response to the presence of semi-solid chyme in theduodenum. Bicarbonate is secretion to neutralise the amount of acid entering theduodenum, whereas the enzymes start the digestion of all three major types of food.The enzyme concentration increased 2.5 to 5-fold in the duodenum in the response tofood components [Brunner et al., 1974].
3.4.3 Residence timeThere is little difference in the mean transit times through the small intestine betweenthe fed and fasted states. Mean small intestinal transit time is of the order of 3 hours(range 1 to 6 hours). The flow of intestinal content increases ~ 3-fold after ingestionof food [Malagelada et al., 1984].
3.4.4 Intestinal pHThe pH values in the small intestine gradually increase between duodenum and ileum,from pH 5.5 to 7.5. In the duodenum, the pH after eating is lower 5-5.5 than comparedto the fasted state pH 6. However, in the jejunum no major differences in pH 6-6.5were found upon ingestion of a meal [Gray, 1996; Dressman et al., 1998].
3.5 Volume of food and digestive fluidsThe volume of fluids available in the gastrointestinal tract for a compound to dissolvein is dependent upon the volume of ingested fluids, secretions and water flux acrossthe gut wall. About 2-3 litres are ingested per day, which is in accordance with themean intake of adults in the Netherlands (VCP1997-1998). The ingested volume isreceived together with the endogenous secretions of saliva (~1L), gastric juices (~2L),pancreatic juices (~2L) and bile (~1L) by the first portion of the duodenum [Tortoraand Grabowski, 1996]. These secretions total about 6 litres per day and are essentialfor the normal luminal digestion of foodstuffs. Most of these juices are secretedpostprandially. In addition, the intestine secretes about 1-2 litres per day, to protectthe epithelial cells with mucus and to improve the contact between the luminal contentand the epithelial cells. This fluid is rapidly reabsorbed. In addition, much fluid (7-8litres) is already absorbed in the small intestine. Only about 1.5 litres are presented tothe colon daily, of which about 1.3 litres are absorbed, with the rest forming acomponent of the stool.
Thus, accounting for the absorption of digestive juices during transit, a volume ratioof 1.5 (food intake) : 1 (saliva) : 2 (gastric juice) : 2 (pancreatic juice) : 1 (bile) for thein vitro digestion model in project V/320102 is proposed.

- 20 - RIVM report 320102002
3.6 Conclusions review: proposal for the in vitrodigestion model simulating fed conditionsBased on the physiological data of the literature review, the following adaptations ofthe in vitro digestion model for ingestion of soil contaminants [Oomen et al., 2003] asa result of food intake are shown in Table 2. Unless otherwise stated, it is assumedthat the concentration of ions do not change from the fasted to fed state.
Table 2. Proposal for changes of the in vitro digestion model as result of foodingestion.Digestionphase
Composition Volumeratio
Incubation time
Food intake Standard hot meal:protein/carbo/fat=1/2/1 (w/w/w)
1.5
Saliva Amylase 2x↑, Na+↑, Cl-↑,HCO3
-↑, mucin↓, pH↑1 0-5 min
(fasting 5 min)Stomach Pepsin 2-3x↑
pH 5 (3-7) →(60 min)→ pH 2
(fasting pH 1.5-2)
2 <300 kcal: 2h450-700 kcal: 4-7h>900 kcal: 6-20h(fasting 2h)
Bile Standard meal: ~30 g/lFat meal: ~60 g/l(fasting: 5 g/l)
1
Pancreas Enzymes 2-3x↑, bicarbonate↑Intestinal pH 5-7
2
2h-6h(fasting 2h)
The conditions applied in the in vitro digestion model simulating fasted conditions are givenwithin brackets.

RIVM report 320102002 - 21 -
4. Development and optimisation of an in vitrodigestion model for fed conditionsIn this chapter, experimental conditions in gastric and small intestinal compartmenthave been varied to gain insight in critical conditions in the in vitro digestion modelthat may affect the bioaccessibility of contaminants. Thereto variations inexperimental conditions in gastric and small intestinal compartment have beenexamined on the bioaccessibility of different classes of contaminants (lipophilic andmetals) and different matrices (food and soil). Based on the bioaccessibility data andthe 4 defined criteria (see below), a test procedure for the in vitro digestion modelsimulating fed conditions is proposed.
1) The last compartment of the model is the small intestine as this is the absorptionsite of the majority of compounds.
2) The experimental conditions should represent a worst-case situation, but thisshould be as realistic as possible. This situation may be compound-dependent.
3) The test procedure should be easily applicable, robust and reproducible, so thatapplication of different food products and contaminants will not affect theexperimental conditions in the digestion model (too) much.
4.1 Development-starting point in vitro digestion model4.1.1 Type of matrix and contaminantTwo infant formulas were used as standard food because they are representative forthe mean food intake of adults at a cooked meal (see chapter 3.1) and they havealready been cooked and need only to be reheated. The infant formulas were spikedwith benzo[a]pyrene in sunflower oil. The reasons for choosing benzo[a]pyrene as acontaminant were mainly practical. The issue of benzo[a]pyrene in oil has beenencountered several times by the Inspectorate for Health Protection and the analysisof benzo[a]pyrene in chyme was available. In addition, a soil, OECD-medium,contaminated with benzo[a]pyrene has been used previously in the in vitro digestionmodel representing fasted conditions [Sips et al., 2001]. Therefore, fasted versus fedconditions in the in vitro digestion model could be compared as well as the effect ofdifferent matrices food versus soil on the bioaccessibility of benzo[a]pyrene.
Montana Soil containing the contaminants lead, cadmium and arsenic was alsoincluded since this matrix has been used as reference matrix in the in vitro digestionmodel for fasted conditions and this matrix consists another type of environmentalcontaminants i.e. heavy metals, which are also regularly encountered in food products.
4.1.2 Volume of food and digestive fluidsAccounting for the absorption of digestive juices during transit, a volume ratio of1.5 (food intake): 1 (saliva) : 2 (gastric juice) : 2 (pancreatic juice) : 1 (bile) for the invitro digestion model in project V/320102 is proposed. In practice, this means that inthe intestinal compartment 9 g food, 6 ml saliva, 12 ml gastric fluid, 12 ml pancreaticfluids and 6 ml bile are mixed.

- 22 - RIVM report 320102002
Calculated on basis of the daily volume intake of food and fluids compared to thesecretion of gastrointestinal juices (chapter 3.2.4), 9 g food should be used to simulatethe eating of a cooked meal. Besides simulation of a cooked meal, we aim to developa standard fed condition in the in vitro digestion model to which the food product ofinterest (or other matrix) can be added without too much interference with theexperimental conditions of the in vitro digestion model. Therefore, 4.5 g of the infantformulas is being used to create a standard fed condition, to which the food product ofinterest (or other matrix) can be added.
4.1.3 pH drift in the gastric compartmentTo simulate the initially higher gastric pH 4-5 after eating (chapter 3.2.2), first 3 ml ofgastric juice was added to the mixture of food and saliva. The gastric pH was 4.2 ±0.3. This mixture was then incubated for 1 hour. Thereafter another 9 ml of gastricjuice was added to lower the gastric pH to 2.0 ± 0.3 and again incubated for 1 hour.Addition of other matrices such as Montana Soil increased the pH further to pH 2.5–3.
On the other hand when a contaminated matrix is ingested an hour after eating a meal(“half empty stomach”), the pH is the stomach is already low. Since it is also moreconvenient to add the 12 ml gastric juice at one step, the effect of addition the gastricjuice in one or two steps was determined on the bioaccessibility of benzo[a]pyrenefrom OECD-medium and on the bioaccessibility of lead, cadmium and arsenic fromMontana Soil. Addition of the gastric juice in one or two steps had no effect on thebioaccessibility of benzo[a]pyrene from OECD-medium or on the bioaccessibility oflead, cadmium and arsenic from Montana Soil (data not shown). Therefore, in allfurther experiments 12 ml gastric juice was administered in one step.
4.1.4 Handling of the chymeToday, various in vitro digestion models have been developed to study thebioavailability / bioaccessibility of compounds from either food or soil matrices. Acomparison of the in vitro digestion model for fasted conditions to other digestionmodels was performed in a round-robin study in which the bioaccessibility values ofarsenic, cadmium, and lead of three different soils were compared among fivedifferent in vitro digestion models [Oomen et al., 2002]. Not only the composition ofthe digestive fluids and the incubation time of the in vitro digestion models varied butalso the handling of the chyme. Before the bioaccessibility of the compound in thechyme is determined, the chyme and matrix are separated (see figure 2). Chyme iscentrifuged, or filtrated or dialysed for separation from the matrix [Versantvoort andRompelberg, 2003]. These different manners of separation between in vitro digestionmodels can have profound effects on the bioaccessibility of compounds [Oomen etal., 2002; Garrett et al., 1999] and may hamper the comparison of the bioaccessibilityvalues from one in vitro digestion model to another. Compounds, which formcomplexes with proteins or with mixed bile salt micelles are likely to be lessbioaccessible after dialysis as was shown for the bioaccessibility of iron fromdifferent food products [Glahn et al., 1996; Jovani et al., 2001]. However, mixed bilesalt micelles not only increase the solubility of very lipophilic compounds (and lead)[Oomen, 2000] but also increase the transport of very lipophilic compounds throughthe intestinal epithelium [Charman et al., 1997; Colburn et al., 1985; Friedman andNylund, 1980; Oomen, 2000]. Therefore, the bioaccessibility of lipophilic compoundsafter dialysis may underestimate the fraction of lipophilic compound that is available

RIVM report 320102002 - 23 -
for transport across the intestinal epithelium. By centrifugation or filtration the mixedbile salt micelles remain in the chyme and the bioaccessibility of lipophiliccompounds such as benzo[a]pyrene is likely to be higher. We have chosen to separatethe matrix and chyme by centrifugation at low speed because we assume that allmolecules mobilised from their matrix are in principle available for transport acrossthe intestinal epithelium and thus represents a (realistic) worst-case situation.
Thus, it should be kept in mind that comparison of absolute bioaccessibility valuesobtained with in vitro digestion models from different laboratories may be hamperedby differences in experimental conditions of the in vitro digestion models includingdifferences in separation of the chyme from the matrix (thus differences indetermination of bioaccessibility). Nevertheless, a comparison of bioaccessibility of acompound from one matrix to another matrix is often consistent among differentdigestion models [Oomen et al., 2002; Glahn et al., 1996; Jovani et al., 2001]. Hence,the in vitro digestion model is a promising tool for estimating the effect of theingested matrix on bioaccessibility and thus on oral bioavailability (internal exposure)of a compound.
4.1.5 Experimental starting point for in vitro digestion modelrepresentative for fed conditionsThe general set-up of the digestion model is as follows: the digestion starts byintroducing 6 ml saliva to 4.5 gram (contaminated) standard meal. For comparison offasted and fed conditions other matrices like 0.5 gram OECD-medium or 0.4 gMontana Soil were added. Then 12 ml of gastric juice is added, and the mixture isrotated head-over-heels for 2 hours at 55 rpm. Finally, 12 ml of duodenal juice and 6ml bile are added simultaneously, and the mixture is rotated for another 2 h. The pHof the chyme is determined once more.
All digestive juices are heated to 37 ± 2 °C. Mixing is done in a head-over-heelsrotator that is also heated to 37 ± 2 °C. At the end of the in vitro digestion process, thedigestion tubes are centrifuged for 5 min at 2750 g, yielding the chyme (thesupernatant), and the digested matrix (the pellet).
Compared to the composition of the digestive fluids of the fasted in vitro digestionmodel [Oomen et al., 2003], the composition of saliva, gastric juice, bile andpancreatic juice is changed according to table 2. The digestive juices can be preparedthe day before the actual digestion experiment. Before an experiment it is checked ifthe pH of the chyme (all juices together in the appropriate ratios) is pH >5.

- 24 - RIVM report 320102002
4.2 Optimisation of in vitro digestion model: Researchon effects of several variables on bioaccessibilityThe effect of variations in experimental conditions in stomach and small intestinewithin the physiological windows have been studied on the bioaccessibility ofbenzo[a]pyrene, lead, cadmium and arsenic from two standard meals and from twosoils. The following issues are addressed
1. Amount of food ingested2. Variations of experimental conditions in vitro digestion model:
Incubation time of the gastric compartmentIncubation time of the intestinal compartmentBile concentration in the intestinal compartmentpH in the intestinal compartment
3. Fasted versus fed conditions4. Reproducibility of the test procedure
The experimental conditions of these variables are shown in table 3.The residence time of food in the stomach is much dependent on the caloric contentof the food. The stomach is emptied within 2 hours after eating small amounts offood whereas it can take up to 16 hours after eating a heavy meal. Therefore, theeffect of prolonging the incubation time in the gastric compartment from 2 to 16hours has been examined.In the proximal small intestine, fasting bile concentrations are in the range 1.5-5 mM(1-3 g/l chyme) and increase to 7-15 mM (5-10 g/l chyme) after eating. The higherthe fat content entering the duodenum, the more the gallbladder contracts and thehigher (initial) concentration of bile in the proximal intestine [Brunner et al., 1974;Lawson et al., 1983]. In addition, the bile concentration is higher in the duodenumcompared to the jejunum, whereas more absorption takes place in the jejunum than induodenum (partly due to the longer length and transit time of the jejunum).Therefore, two bile concentrations were tested on the bioaccessibility of severalcontaminants.In the duodenum the intestinal pH ~5.5 is lower than the intestinal pH ~6.5 in thejejunum and ileum pH~7. As absorption of compounds can take place along the smallintestine, in general less is absorbed in the duodenum because of the short length andconsequently short transit time. Therefore, two intestinal pH’s have been tested pH5.5-6, which has also been applied in the in vitro digestion model for fastedconditions [Oomen et al., 2003] and a pH of 6.5-7, which is more representative forthe pH in jejunum and ileum. The pancreas secretes bicarbonate to neutralise theamount of acid entering the small intestine [Brunner et al., 1974]. Therefore, the pHof the chyme was increased by addition of 2 ml of the sodiumbicarbonate solution.Based on the bioaccessibility data and the 4 defined criteria (see 1st paragraph chapter4), a test procedure for the in vitro digestion model simulating fed conditions isproposed.

Table 3. Scheme of variables tested in the in vitro digestion model.Type ofmatrix
Type ofcontaminant
Concentrationcontaminant
(µg/g matrix)*
Contamination Amount offood digested
Incubationtime stomach
Incubationtime intestine
pH intestine Bileconcentrati
on (g/l)StandardmealsIF 451IF 282
Benzo[a]pyrene
2.01.7
Artificial 1g, 4.5g, 9g 2h and 16h 2h and 4h 5.5-6 and6.5-7
30 and 60
OECD-medium
Benzo[a]pyrene 170 Artificial 0.6 g OECD +4.5 g IF
2h and 16h 2h and 4h 5.5-6 and6.5-7
30 and 60
Montana Soil Pb, Cd, As 1162, 105, 42 Historical 0.4 g Montanasoil + 4.5 g IF
2h and 16h 2h and 4h 5.5-6 and6.5-7
30 and 60
LettuceRadish
Cd 0.31, 0.6, 0.730.055, 0.11
Historical 9 g vegetable ±4.5 g IF
2h 2h 6.5-7 30
Peanut slurry Aflatoxin B1 1.5, 2.4, 3.6,6.2, 9.8, 12.1,
13.3, 20.9,36.0#
Historical 0.5 and 4.5gpeanut slurry ±
4.5 g IF
2h 2h and 4h 6.5-7 and5.5-6
30 and 60
Buckwheat Ochratoxin A 7, 20# Historical 1 and 4.5gbuckwheat ±
4.5 g IF
2h 2h and 4h 6.5-7 and5.5-6
30 and 60
* Cadmium concentration per g dry weight vegetable were 7.7, 15.0 and 16.5 µg Cd/g dry weight for lettuce and 1.1 and 2.3 µg Cd/g dry weight radish.#Aflatoxin B1 and ochratoxin A concentrations were in µg/kg

- 26 - RIVM report 320102002
4.2.1 Effect of the amount of food on bioaccessibility of B[a]PThe effect of the amount of food (and the amount of contaminant) on thebioaccessibility of B[a]P from the standard meals was studied by using 1, 4.5 and 9gram contaminated standard meal in the digestion experiments.
Figure 3. Bioaccessibility of B[a]P as a function of amount of food.Data are mean ± sd of two digestion experiments with 4 replicates.
Figure 3 shows that for both standard meals the bioaccessibility of B[a]P was higherwhen 1 g food was used than when more food was used. At 1 gram food not only theamount of food is lower but also the amount of B[a]P is proportionally lower. Byaddition of 1 gram contaminated food to the standard conditions i.e. 4.5 gram not-contaminated food, we could discriminate between an effect by the amount of food oran effect by the amount of contaminant. As the bioaccessibility of B[a]P decreasedwhen 4.5 gram not-contaminated food was included (in total 5.5 g food), the higherbioaccessibility of B[a]P was due to the low amount of food used. Apparently, thedistribution of B[a]P between chyme and matrix was somewhat shifted towards thechyme when small amounts of food were used.
4.2.2 Variations of experimental conditions of the vitro digestionmodelThe results of variations of experimental conditions in vitro digestion model regarding1. Incubation time of the gastric compartment2. Incubation time of the intestinal compartment3. Bile concentration in the intestinal compartment4. pH in the intestinal compartmentare described in the next paragraphs.
4.2.2.1 Incubation time in the gastric compartmentFor none of the 4 matrices, prolongation, from 2 to 16 hours, of the incubation time inthe gastric compartment had an effect on the bioaccessibility of any of thecontaminants (table 4). The experiments with the pH shift in the gastric compartment(chapter 4.1.3) showed that even an incubation period of 1 hour at low pH in the
0
20
40
60
80
100
0 2 4 6 8 10
amount food (gram)
B[a]
P bi
oacc
essi
bilit
y (%
)
IF 282IF 451

RIVM report 320102002 - 27 -
gastric compartment had no effect on the bioaccessibility of benzo[a]pyrene, lead,cadmium and arsenic from their matrix in the chyme.
Table 4. Bioaccessibility (%) of contaminants in chyme: variation of experimentalconditions of the in vitro digestion model.Matrix Contami-
nantControl 16 h
stomach4 h
intestine60 g/l bile pH 7
intestineIF 282 B[a]P 17 ± 2 18 ± 2 42 ± 27 36 ± 5 79 ± 15IF 451 B[a]P 15 ± 4 16 ± 6 18 ± 5 36 ± 3 59 ± 10OECD 282 B[a]P 25 ± 8 24 ± 4 42 ± 5 36 ± 5 43 ± 6OECD 451 B[a]P 17 ± 4 17 ± 2 27 ± 9 33 ± 6 45 ± 7MS 282 Pb 20 ± 5 26 ± 3 36 ± 6 25 ± 2 37 ± 3MS 451 Pb 19 ± 3 22 ± 2 26 ± 2 18 ± 3 27 ± 4MS 282 Cd 38 ± 5 42 ± 5 53 ± 9 44 ± 3 50 ± 5MS 451 Cd 37 ± 5 39 ± 5 45 ± 4 39 ± 5 44 ± 6MS 282 As 36 ± 4 39 ± 5 36 ± 6 38 ± 4 44 ± 5MS 451 As 37 ± 5 40 ± 6 38 ± 4 38 ± 3 44 ± 7Control conditions are: 4.5 g (contaminated) standard meal, 2 h incubation in gastriccompartment, 2 h incubation in intestinal compartment with 30 g/l bile and pH 5-6. Data aremean ± sd of 2 to 9 experiments each performed in 3 to 6 replicates.
4.2.2.2 Incubation time in the intestinal compartmentProlongation of the incubation time from 2 to 4 hours (3h is mean transit time[Malagelada et al., 1984]) in the small intestine increased the bioaccessibilities ofbenzo[a]pyrene, lead and cadmium but not for arsenic (table 4). The increases inbioaccessibility were small (<1.6-fold increase) when standard meal 451 was used andincrements in bioaccessibility of 1.4 to 2.5-fold were measured when standard meal282 was used.
4.2.2.3 Bile concentrationDoubling the bile concentration increased the bioaccessibility of only benzo[a]pyrenewhile it had no effect on the bioaccessibility of the other contaminants (table 4).Benzo[a]pyrene is a very lipophilic compound and solubilisation in aqueous solutionsis greatly increased by the presence of mixed bile salt micelles [Vetter et al., 1985;Wiedemann and Kamel, 2002]. Doubling the bile concentration increases the numberof micelles and thereby the fat solubilising capacity of the chyme for benzo[a]pyrene.
4.2.2.4 pH in the intestinal compartmentThe increase in pH of the chyme to pH 6.5-7 had a major effect on the bioaccessibilityof benzo[a]pyrene. The bioaccessibility of benzo[a]pyrene from food increased 4-foldand from OECD-medium 2-fold. The increase in bioaccessibility of lead, cadmiumand arsenic from Montana Soil was less, 1.6- to 1.2-fold increase, respectively.
The structural characteristics of the mixed bile salt micelles are dependent on ionicstrength and pH of the solution and on the presence of lipid digestion products [Vetteret al., 1985, Charman et al., 1997]. The digestion of lipids may also be improved bythe increase in intestinal pH [Friedman et al., 1980]. The products of lipid digestiondecrease the critical micelle concentration, increase the size of the micelles andincrease the solubilisation capacity of the micelles [Charman et al., 1997; Wiedemannand Kamel, 2002]. Thus, rather than increasing the number of the mixed bile salt

- 28 - RIVM report 320102002
micelles by doubling the bile salt concentration (see above), the solubilisationcharacteristics of the mixed bile salt micelles are changed by the increase in pH with asodiumbicarbonate solution.
As the lipophilic compound benzo[a]pyrene is dependent for it solubilisation on thebile salt mixed micelles, it can be expected that the effects of increasing the pH of thechyme with sodium bicarbonate, are most pronounced on the bioaccessibility ofbenzo[a]pyrene. Previous studies have shown that not only lipophilic compoundsinteract with bile mixed micelles, but lead has been shown to form complexes withproteins and bile in the chyme [Oomen, 2000]. Apparently, the partition of lead andcadmium between matrix and chyme was thus affected that the bioaccessibility oflead and cadmium increased to a small extent.
4.2.3 Fasted versus fed conditionsThe conversion from fasted to fed state was compared for the bioaccessibility of soilcontaminants. The bile concentration simulating fed conditions is 5-fold increased andlipid digestion products are present, thus, the fat solubilisation capacity of the chymeis increased compared to the fasted conditions in the in vitro digestion model.Therefore, it was anticipated that the bioaccessibility of the very lipophilicbenzo[a]pyrene would be highest in chyme with the best fat solubilisation capacity(fed contiditions). Figure 4 shows that changing the experimental conditions fromsimulating the fasted state [Sips et al., 2001] to the fed state increased thebioaccessibility of benzo[a]pyrene from OECD-medium from 5% to 43% at intestinalpH 6.5-7, respectively.
Experimental fasted or fed conditions in the in vitro digestion model did not affect thebioaccessibility of lead, cadmium and arsenic from Montana Soil to a great extent.This came rather as a surprise as the in vivo bioavailability of lead under fastedconditions is 3- to 8-fold higher than under fed conditions [Maddeloni et al., 1998;Graziano et al., 2001; Dieter et al., 1993; Freeman et al., 1996]. The bioaccessibilityof lead (and other heavy metals) is considerably affected by pH values in thegastrointestinal tract [Ruby et al., 1996; Oomen et al., 2002]. A low pH in the gastriccompartment is required for the release of lead from its matrix [see also RIVM report320102001]. The gastric pH is lower for the fasted conditions pH 1.5-2 compared tothe fed conditions pH 2.5-3. Therefore, it was anticipated that the bioaccessibility oflead from Montana Soil was higher under fasted than fed conditions. On the otherhand, in vitro studies have shown that lead forms complexes with proteins and mixedbile salt micelles [Oomen, 2000]. Since the concentration of these complexing agentsin the chyme is higher under fed compared to fasted conditions, a higherbioaccessibility of lead may be anticipated. Apparently, the increase in complexingagents in the chyme simulating fed conditions compensate for the somewhat highergastric pH 2.5-3. Thus, fasted or fed conditions in the in vitro digestion model mayhave profound effects on the bioaccessibility of contaminants. This effect appears tobe compound specific. It can be anticipated that for lipophilic compounds fedconditions will represent worst case.

RIVM report 320102002 - 29 -
Figure 4. Comparison of fasted and fed conditions (intestinal pH 6.5-7) in the in vitrodigestion model on the bioaccessibility of benzo[a]pyrene, lead, cadmium and arsenicfrom soil.
4.2.4 Reproducibility of the test procedureReproducibility of the test procedure was examined by measurements of the pH in thesmall intestinal compartment but also by parameters like within-day and between-dayvariation. To that end, standard meals and OECD-medium spiked withbenzo[a]pyrene and Montana Soil were digested in 3 to 6 fold. Between-day variationwas determined over a period of at least 4 days. Within-day and between-dayvariation was calculated by means of ANOVA. The results are shown in table 5.
The between-day variation varied from 9 % to 54% (mean 25%) and the within dayvariation varied from 3% to 74% (mean 17%) and the between-day variation was ingeneral higher than the within-day variation. The within-day variation was <25%,which is acceptable for such a test procedure (digestion and analysis). Only forstandard meal IF 451 the within-day variation was higher than 25% and even higherthan the between-day variation. The between-day variation of bioaccessibility ofbenzo[a]pyrene from both standard meals as from OECD-medium was higher than forthe 3 other contaminants from Montana Soil. This might be caused by a lesshomogeneous matrix of the standard meals and OECD-medium, which were spiked inthe laboratory, while Montana Soil was historically contaminated and a certifiedmaterial. In addition, the different analysis methods for benzo[a]pyrene and lead,cadmium and arsenic might contribute to a greater variation. The bioaccessibility ofcontaminants from Montana Soil 2711 showed the best reproducibility both atintestinal pH 5.5-6 as at pH 6.5-7. The within day variation and between day variationof Montana Soil were comparable with the in vitro digestion models simulating fastedconditions i.e. the suck-swallow model for toys (wdv 16% and bdv 30%, RIVM-report 320102001) and the in vitro digestion model for soil contaminants (wdv 18 %and bdv 26 %) [Zeilmaker et al., submitted].
0
20
40
60
80
100
B[a]P Pb Cd As
Fasted versus Fed conditions
bioa
cces
sibi
lity
(%)
fasted
IF 282
IF 451
- 30 - RIVM report 320102002
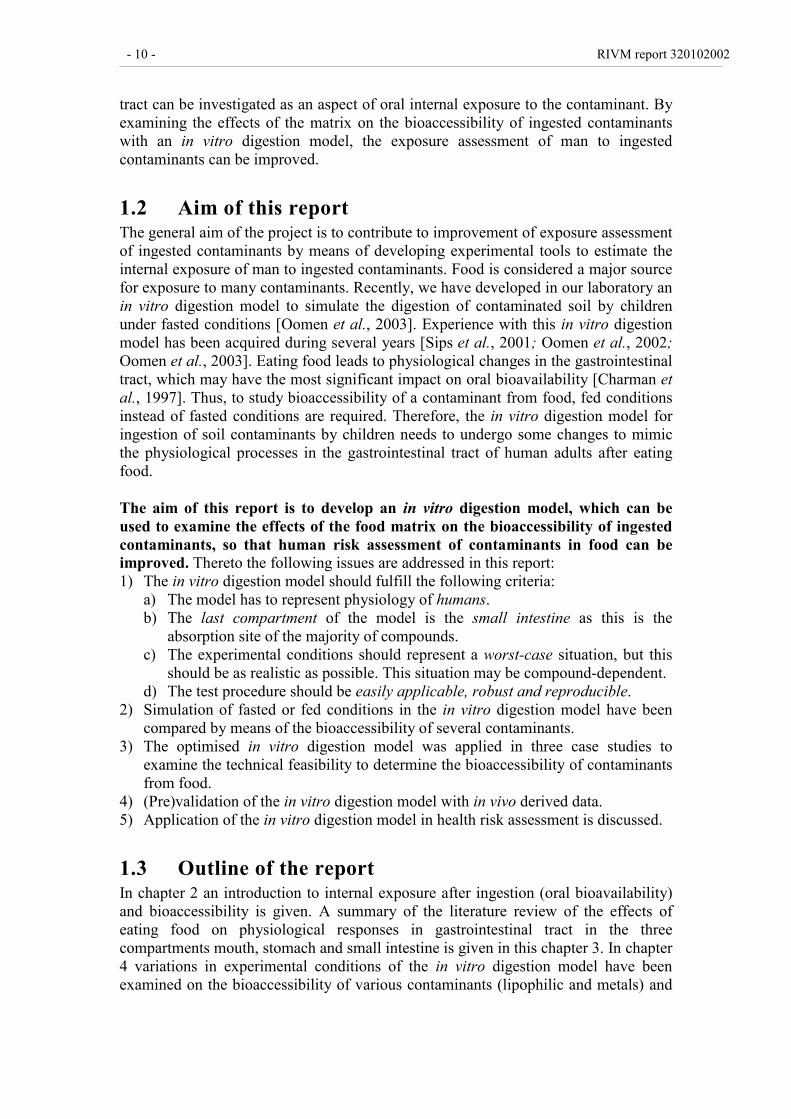
Table 5. Reproducibility of the bioaccessibility of various contaminants in chyme asdetermined by within-day and between-day variation of control conditions.Matrix Bioaccessibility
(%) Mean ± sdN Within-day
variation (%)Between-dayvariation (%)
IF 282IF 451
17 ± 215 ± 4
2424
2274
2937
OECD-medium + IF282 + IF451
25 ± 917 ± 4
2323
1618
5446
Montana Soil + IF282, Pb + IF282, Cd + IF282, As + IF451, Pb + IF451, Cd + IF451, As
20 ± 537 ± 336 ± 320 ± 237 ± 337 ± 2
111111141414
131111121514
37151312159
Montana Soil intestinal pH 6.5-7 + IF 282, Pb + IF 282, Cd + IF 282, As
39 ± 451 ± 845 ± 5
141414
453
162818
In future experiments different matrices and different contaminants will be used fromseries to series. To be able to assess whether the in vitro digestion has succeeded, acomparison between series is desirable. To that end, a reference sample should beincluded in every series. The data with Montana soil 2711 seem to be reproducibleand consistent with different digestion models. Although it is preferable to have arelevant matrix as a reference material, at this moment most consistent data areobtained with Montana soil 2711.
4.3 Optimised in vitro digestion model simulating fedconditions.The results in this chapter show that the bioaccessibility of the contaminants can beaffected by the experimental conditions applied in the in vitro digestion model e.g.simulating fasted or fed conditions, upper part or middle part of the small intestine.From the bioaccessibility of benzo[a]pyrene, lead, cadmium and arsenic from twodifferent standard meals and two soil matrices under different experimental conditionsit was concluded that• Incubation time (1 to16 hours) in the gastric compartment at low pH 2-3 was not
a critical step for the bioaccessibility of the 4 contaminants in the small intestinalcompartment.
• Experimental conditions in the small intestinal compartment were more criticalfor the bioaccessibility of the 4 contaminants:- Increase of pH from pH 5.5-6 to pH 6.5-7 in the intestinal compartment
greatly increased the bioaccessibility of benzo[a]pyrene and to lesser extentthe bioaccessibilities of lead and cadmium
- Incubation time in intestinal compartment increased the bioaccessibilities ofbenzo[a]pyrene and lead but less than 2-fold
- Doubling the bile concentration increased the bioaccessibility ofbenzo[a]pyrene only.

RIVM report 320102002 - 31 -
The two different classes of contaminants (lipophilic organic compounds vs heavymetals/trace elements) were chosen in this study, as food and other matrices arefrequently contaminated with these contaminants. Furthermore, it was anticipated thatdifferent factors may affect the bioaccessibility of both groups of contaminants sincethe oral bioavailability of very lipophilic compounds is in general higher under fedconditions whereas the oral bioavailability of lead for example is higher under fastedconditions [Graziano et al., 2001; Charman et al., 1997].
The experimental conditions at intestinal pH 6.5-7 were chosen as test procedure tosimulate fed conditions in the gastrointestinal tract because• These experimental conditions are representative for jejunum, middle part of the
small intestine, where absorption of most compounds takes place.• The bioaccessibility of all 4 contaminants was highest at pH 6.5-7 in the intestinal
compartment and therefore, these conditions represent the worst-case situation forall 4 contaminants tested (criteria 3).
• At pH 6.5-7 in the intestinal compartment the bioaccessibility of benzo[a]pyrenefrom the standard meals was so high that is unlikely, at this pH, that the amount offood ingested, incubation time and bile concentration will increase thebioaccessibility much more. Therefore, these conditions are likely to represent themost robust conditions (criteria 4).
The test procedure is shown in figure 5.
4.5 g food (IF 282)+ … g matrix of interest
6 ml saliva
12 ml gastric juice
12 ml duodenal juice +6 ml bile (30 g/l) +
2 ml HCO3-
centrifugation
chyme(+digested matrix)
bioaccessibility ofcontaminant
analysis
pH time
5 min
2 h
2 h
pH 6.5 - 7
pH 6.8
pH 2 - 2.5
Fed conditions
Figure 5. Schematic representation of experimental conditions of in vitro digestionmodel simulating fed conditions to use as test procedure.

- 32 - RIVM report 320102002

RIVM report 320102002 - 33 -
5. Case studies: determination of bioaccessibilityfrom contaminated food productsThe technical feasibility of the in vitro digestion model for fed conditions was testedin three case studies by means of determination of the bioaccessibility of 1) cadmiumfrom radish and lettuce grown on contaminated soil, 2) aflatoxin B1 from peanuts and3) ochratoxin A from buckwheat. The experimental conditions are shown in table 3.
5.1 Cadmium in lettuce and radish.Parts of “de Kempen” in the Netherlands and Belgium are polluted with cadmium andzinc due to past industries. In order to test whether the soil still can be used as privatekitchen-gardens, radish and lettuce were cultivated on polluted soil (site 1) and at twosites which had been treated with clay (site 2) or cement (site 3).
To test the feasibility of the in vitro digestion test procedure, the bioaccessibility ofcadmium from lettuce and radish grown on contaminated soil was determined in thiscase study. If it is feasible to determine the bioaccessibility of cadmium, the followingissues are addressed:1. Has the matrix cq. lettuce and radish, effect on the bioaccessibility of cadmium?2. Has the treatment of the soil effect on the bioaccessibility of cadmium from the
crops?3. Has inclusion of a standard meal effect on the bioaccessibility of cadmium from
the crops?
5.1.1 ExperimentalFrom each site, radish (radish did not grow on untreated soil) and lettuce werecollected and handled as follows: roots and tops were removed from the radish andonly the nice leaves of the lettuce were used. Then, the leaves of lettuce and the radishwere carefully washed and homogenates were prepared by using a blender. Thecadmium concentration in the homogenate was determined by destruction and isshown in table 6. As there was not enough lettuce – cement homogenate left, thecadmium concentration in the lettuce was determined in other lettuce leaves than usedfor the digestion experiment. As result, the mass-balance of lettuce grown on cementtreated soil was lower, 64-73%, than the mass-balance for lettuce cultivated onuntreated and clay-treated soil, 87-109%.
As the concentration of cadmium in the homogenates of lettuce and radish was ratherlow, certainly compared to the cadmium concentration found in Montana Soil (seetables 3 and 5), we decided to use 9 gram homogenate instead of 4.5 gram. Thebioaccessibility of cadmium was determined in triplicate for each homogenate inabsence and presence of 4.5 gram standard meal, to examine the effect other foodcomponents on the bioaccessibility of cadmium.
As control for succession of the in vitro digestion procedure, Montana Soil was usedas reference material. The bioaccessibilities of lead, cadmium and arsenic wereconsistent with the results in Table 3.

- 34 - RIVM report 320102002
5.1.2 Results: Bioaccessibility of cadmium from lettuce andradishThe concentration of cadmium in lettuce was higher than the maximum concentrationallowed for human consumption of 0.1-0.2 mg/kg (EU regulations). Similarconcentrations of cadmium were found for crops cultivated on contaminated soil[Cobb et al., 2000]. The concentration of cadmium in chyme could be detected in allcases. In table 6, the bioaccessibility of cadmium after digestion of lettuce and radishin presence or absence of standard meals is shown.
Table 6. Bioaccessibility of cadmium from lettuce and radish.Matrix Contamination level
(µg Cd/ g matrix)1Bioaccessibility of Cd
(%)Mass balance
(%)Lettuce untreated soil + standard meal
0.60 ± 0.08 63 ± 157 ± 2
10996
Lettuce clay treated + standard meal
0.73 ± 0.05 55 ± 249 ± 2
9987
Lettuce cement treated + standard meal
0.31 ± 0.08 45 ± 238 ± 1
7364
Radish clay treated + standard meal
0.11 ± 0.01 66 ± 263 ± 2
124117
Radish cement treated + standard meal
0.055 ± 0.003 69 ± 674 ± 2
113125
The data are mean ± sd of one experiment in triplicate.1 Cadmium concentration per g dry weight crops were 15.0, 16.5 and 7.7 µg Cd/g dry weightfor lettuce, respectively, and 2.3 and 1.1 µg Cd/g dry weight radish.
The results from lettuce grown on soil treated with cement will not be taken intoaccount because the bioaccessibility is likely to be underestimated because thecontamination level was not determined in the same homogenate (see 5.1.1.) and themass balance was clearly lower than the mass balance of the other samples.
A considerable amount of cadmium, but not all, was mobilised from both lettuce andradish during the digestion process. The bioaccessibility of cadmium from lettuceseemed to be slightly lower, between 49% and 63%, than the bioaccessibility fromradish between 63% and 74%.
The bioaccessibility of cadmium was similar in presence or absence of 4.5 gramstandard meal during the digestion procedure.
Treatment of the soil had no effect on the mobilisation of cadmium from lettuce andradish although lettuce and radish cultivated on cement-treated soil accumulated lesscadmium than clay-treated or untreated soil.
5.2 Aflatoxin B1 in peanut slurriesPeanuts are regularly contaminated with aflatoxins at higher concentrations than themaximum levels for human consumption or animal feedings, 2 and 8 µg/kg (EUregulations), respectively. To test the feasibility of the in vitro digestion testprocedure, the bioaccessibility of aflatoxin B1 from peanut slurries was determined inthis case study. The peanut slurries were obtained from the Inspectorate for Health

RIVM report 320102002 - 35 -
Protection of Rotterdam, that sampled peanuts and prepared and analysed the peanutslurries for presence of aflatoxin B1 on a routine basis. The sampled lots wereintended for the Dutch market. Aflatoxin B1 level of the sampled peanut lots werebetween 1.5 and 36 µg/kg.
The following issues were addressed:1. Has the amount of ingested peanut slurry effect on the bioaccessibility of aflatoxin
B1?2. Has the contamination level effect on the bioaccessibility of aflatoxin B1?3. Has inclusion of a standard meal effect on the bioaccessibility of aflatoxin B1
from peanut slurry?4. How robust are the results with the in vitro digestion model? Have experimental
conditions such as doubling the bile concentration, lower intestinal pH and longerincubation tome in the small intestinal compartment effect on the bioaccessibilityof aflatoxin B1 from peanut slurry?
5. What is the reproducibility of measurement of the bioaccessibility of aflatoxinB1?
5.2.1 ExperimentalSampling of the peanuts and analysis of aflatoxin B1 in the peanut samples wascarried out by the Inspectorate for Health Protection of Rotterdam according toEuropean regulations. In short, from the peanuts a slurry was prepared byhomogenization of 1 kg dopped peanuts with 1.5 liter water and 40 g sodium chloridefor 15 min.
Determination of the bioaccessibility of aflatoxin B1 from the peanut slurries was asdescribed in chapter 4.3. Application of 0.5 g and 4.5 g peanut slurry in the in vitrodigestion model corresponds to the consumption of approximately 10 and 100 gpeanuts, respectively.The digestion started by introducing 6 ml saliva to 4.5 gram or 0.5 gram peanut slurry.This was incubated for 5 min. Then 12 ml of gastric juice is added, and the mixturewas incubated for 2 hours at 55 rpm. Finally, 12 ml of duodenal juice, 6 ml bile and 2ml sodium bicarbonate were added simultaneously, and the mixture was rotated foranother 2 h. The pH of the chyme was determined once more. At the end of the invitro digestion process, the digestion tubes were centrifuged for 5 min at 2750 g,yielding the chyme (the supernatant) in which the concentration of aflatoxin B1 wasdetermined.As control for succession of the in vitro digestion procedure, Montana Soil was usedas reference material. The bioaccessibilities of lead, cadmium and arsenic wereconsistent with the results in Table 3.
After purification of the chyme by liquid-liquid extraction procedures, followed by animmuno-affinity column, aflatoxin B1 and ochratoxin A could be detectedsimultaneously by HPLC analysis. Lower limit of quantitation were ~2 pg/ml foraflatoxin B1 and ~10 pg/ml for ochratoxin A [Sizoo and van Egmond, 1997].
In some experiments a food-mix of peanut slurry (0.5 g), buckwheat (1 g) andstandard meal (4.5 g) was prepared to study the effect of a standard meal on the

- 36 - RIVM report 320102002
bioaccessibility of aflatoxin B1 and ochratoxin A at the same time. This food-mix wasalso used to determine the reproducibility of bioaccessibility measurements.
5.2.2 Results: bioaccessibility of aflatoxin B1 from peanutslurries
5.2.2.1 Effect of contamination levelOne of the factors potentially affecting bioaccessibility is the level of contamination.The bioaccessibility of aflatoxin B1 from 9 peanut slurries ranging from 0.6 to 14µg/kg aflatoxin B1 (contamination level peanuts 1.5-36 µg/kg) in the chyme wasdetermined.
Aflatoxin B1 was almost completely mobilised from the peanut slurries duringdigestion. A more or less constant bioaccessibility percentage of 90% at eachcontamination level was found. The mean bioaccessibility of all 9 batches is depictedby the line in figure 6 A. The concentration of aflatoxin B1 in the chyme of the twohighest contaminated peanut slurries was higher than those in the calibration curve,therefore, a smaller volume of chyme was used for analysis. Alterations in theanalysis might contribute to a higher variation in the two highest contaminatedslurries. Therefore, these two peanut slurries have been excluded in calibration of thedose response relationship. In figure 6B, a linear dose proportional relationshipbetween the amount of aflatoxin B1 in the peanuts and the amount of aflatoxin B1mobilised from the peanut slurry in the chyme is demonstrated for the peanut slurries.
0255075
100125150175200
0 5 10 15 20 25 30 35 40
conc aflatoxin in peanut (µg/g)
bioa
cces
sibi
lity
afla
toxi
n (%
)
y = 5,4821x - 2,1953R2 = 0,9908
0
20
40
60
80
0 2 4 6 8 10 12 14
conc aflatoxin in peanuts (µg/g)
conc
afla
toxi
n in
chy
me
(ng/
ml)
A
B
Figure 6. The amount of aflatoxin B1 released in chyme after digestion against theamount of aflatoxin B1 in peanut samples.In figure A, bioaccessibility of 9 batches of peanut slurries are shown. Data are mean ± sd ofone experiment in triplicate. Mean bioaccessibility of all 9 batches is shown by the line. Infigure B, a linear dose-response relation is shown for the 7 lowest contaminated batches ofpeanuts.

RIVM report 320102002 - 37 -
5.2.2.2 Effect of addition of a standard mealTo examine the effect of other food components on the bioaccessibility of aflatoxinB1 from peanut slurries, a food-mix was prepared. Food-mix 1 consisted of 4.5 gstandard meal, 0.5 g peanut slurry from peanuts contaminated at 6 µg/kg and 1 gbuckwheat contaminated with ochratoxin A at 20 µg/kg. The bioaccessibility ofaflatoxin B1 from 6 g food-mix was compared with the bioaccessibility of aflatoxinB1 from 0.5 g corresponding peanut slurry.
The results in table 7 show that the bioaccessibility of aflatoxin B1 was slightly higherwhen a standard meal was added, however, this difference was not significant.
Table 7. Bioaccessibility of aflatoxin B1 from peanut slurry.Sample Amount of aflatoxin
B1 in digestionmodel (ng)
Bioaccessibility(%)
2 g food-mix 1 1 111 ± 136 g food-mix 1 3 104 ± 110.5 g peanut slurry (6 µg/kg) 3 80 ± 184.5 g peanut slurry (6 µg/kg) 27 81 ± 18Effect of addition of standard meals and effect of amount of food ingested on thebioaccessibility of aflatoxin B1. Data are means ± sd of one or two experiments in triplicate.
5.2.2.3 Effect of amount of ingested foodNext the amount of food in the digestion model was varied: 2 and 6 gram food-mix,and 0.5 and 4.5 gram peanut slurry (6 µg/kg peanuts) was used.As shown in table 7, the amount of food had no effect on the bioaccessibility ofaflatoxin B1 from peanut slurries.
Application of 0.5 g and 4.5 g peanut slurry in the in vitro digestion modelcorresponds to the consumption of approximately 10 and 100 g peanuts, respectively.
5.2.2.4 Robustness of the digestion modelTo test the robustness of the digestion model, experimental conditions such as a lowerpH in the small intestinal compartment (representative for duodenum), prolongedincubation time in the small intestinal compartment (4h instead of 2h), and doublingthe bile concentration were varied.None of these variations had an effect on the bioaccessibility of aflatoxin B1 fromfood-mix 1 indicating that the test system is robust.
5.2.2.5 Reproducibility of determination of bioaccessibilityReproducibility of the test procedure was examined by determination of within-dayand between-day variation by means of ANOVA of the bioaccessibility of aflatoxinB1 from food-mix 1 over 3 independent digestion experiments.
Within-day variation was 12% and between-day variation was 11%. Thus, thereproducibility of bioaccessibility measurement of aflatoxin B1 was good andcomparable with the variation found with other contaminants (chapter 4.2.4).

- 38 - RIVM report 320102002
5.3 Ochratoxin A in buckwheatRecently, investigations have been carried out on the occurrence of ochratoxin A ingrain for human consumption and in various types of fodder and grain for animalconsumption [Sizoo and van Egmond, 1997]. The sampled lots were intended for theDutch market. Two batches of buckwheat were encountered to be contaminated withochratoxin A at concentrations of 7 and 20 µg/kg, which is higher than the maximumlevels for human consumption 3-5 µg/kg (EU regulations). The bioaccessibility ofochratoxin A from buckwheat was determined in this case study.
To test the feasibility of the in vitro digestion test procedure, the bioaccessibility ofochratoxin A from buckwheat was determined in this case study. The following issueswere addressed:1. Has the amount of buckwheat effect on the bioaccessibility of ochratoxin A?2. Has the contamination level effect on the bioaccessibility of ochratoxin A?3. Has inclusion of a standard meal effect on the bioaccessibility of ochratoxin A
from buckwheat?4. How robust are the results with the in vitro digestion model? Have experimental
conditions such as doubling the bile concentration, lower intestinal pH and longerincubation tome in the small intestinal compartment effect on the bioaccessibilityof ochratoxin A from buckwheat?
5. What is the reproducibility of the bioaccessibility of ochratoxin A?
5.3.1 ExperimentalDetermination of the bioaccessibility of ochratoxin A from buckwheat was carried outaccording to the test procedure as described in chapter 4.3. The digestion started byintroducing 6 ml saliva to 4.5 gram or 1 gram buckwheat. This was incubated for 5minutes. Then 12 ml of gastric juice is added, and the mixture was incubated for 2hours. Finally, 12 ml of duodenal juice, 6 ml bile and 2 ml sodium bicarbonate wereadded simultaneously, and the mixture was rotated for another 2 hours. The pH of thechyme was determined once more. At the end of the in vitro digestion process, thedigestion tubes were centrifuged for 5 min at 2750 g, yielding the chyme (thesupernatant) in which the concentration of ochratoxin A was determined.As control for succession of the in vitro digestion procedure, Montana Soil was usedas reference material. The bioaccessibilities of lead, cadmium and arsenic wereconsistent with the results in Table 3.
After purification of the chyme by liquid-liquid extraction procedures, followed by animmuno-affinity column aflatoxin B1 and ochratoxin A could be detectedsimultaneously by HPLC analysis. Lower limit of quantitation were ~2 pg/ml foraflatoxin B1 and ~10 pg/ml for ochratoxin A.
In some experiments a food-mix of buckwheat (1 g), peanut slurry (0.5 g), andstandard meal (4.5 g) was prepared to study the effect of a standard meal on thebioaccessibility of aflatoxin B1 and ochratoxin A at the same time. This food-mix wasused to determine the reproducibility of bioaccessibility measurements.

RIVM report 320102002 - 39 -
5.3.2 Results: bioaccessibility of ochratoxin A from buckwheat5.3.2.1 Effect of contamination levelOne of the factors potentially affecting bioaccessibility is the level of contamination.The bioaccessibility of ochratoxin A from 2 batches of buckwheat at concentrations of7 and 20 µg/kg in the chyme was determined.
A considerable amount of ochratoxin A, ~60%, was mobilised from the buckwheatduring digestion but not all ochratoxin A. The bioaccessibility of ochratoxin A fromthe batch of buckwheat of 7 µg/kg showed great variation probably dueinhomogeneity of the batch. It is, however, unlikely that the contamination level willhave a profound effect on the bioaccessibility of ochratoxin A, as the bioaccessibilityof ochratoxin A was not affected by weighing different amounts of food (andconsequently different amounts of ochratoxin A) (Table 8).
Table 8. Bioaccessibility of ochratoxin A from buckwheat.Sample Amount of
ochratoxin A indigestion model (ng)
Bioaccessibility(%)
2 g food-mix 1 7 62 ± 126 g food-mix 1 20 60 ± 101 g buckwheat (20 µg/kg) 20 53 ± 104.5 g buckwheat (20 µg/kg) 90 45 ± 94.5 g buckwheat (7 µg/kg) 32 84 ± 56Effects of contamination level, addition of standard meal and amount of food on thebioaccessibility. Data are means ± sd of one or two experiments in triplicate.
5.3.2.2 Effect of addition of a standard mealTo examine the effect of other food components on the bioaccessibility of ochratoxinA from buckwheat, a food-mix was prepared. Food-mix 1 consisted of 4.5 g standardmeal, 0.5 g peanut slurry from peanuts contaminated at 6 µg/kg and 1 g buckwheatcontaminated with ochratoxin A at 20 µg/kg. The bioaccessibility of ochratoxin Afrom 6 g food-mix was compared with the bioaccessibility of ochratoxin A from 1 gcorresponding buckwheat.
The results are shown in table 8. Addition of a standard meal had no effect on thebioaccessibility of ochratoxin A.
5.3.2.3 Effect of amount of ingested foodNext the amount of food in the digestion model was varied: 2 and 6 gram food-mix,and 0.5 and 4.5 gram buckwheat (20 µg/kg) was used. As shown in table 8, theamount of food had no effect on the bioaccessibility of ochratoxin A from buckwheator food-mix.
5.3.2.4 Robustness of the digestion modelTo test the robustness of the digestion model, experimental conditions such as a lowerpH in the small intestinal compartment (representative for duodenum), prolongedincubation time in the small intestinal compartment (4h instead of 2h), and doublingthe bile concentration were varied.

- 40 - RIVM report 320102002
The bioaccessibility of ochratoxin A was not affected by any of these conditions inthe digestion model showing that the test system is robust.
5.3.2.5 Reproducibility of determination of bioaccessibilityReproducibility of the test procedure was examined by determination of within-dayand between-day variation, by means of ANOVA, of the bioaccessibility ofochratoxin A from food-mix 1 over 3 independent digestion experiments.Within-day variation was 14% and between-day variation was 30%. Thus, thereproducibility of determination of bioaccessibility of ochratoxin A was somewhatless than for aflatoxin B1 but acceptable and comparable with the variation found withother contaminants (chapter 4.2.4).
5.4 Discussion on bioaccessibility of contaminants fromfood products5.4.1 Bioaccessibility of contaminants from food productsThe experiments in this report showed that it is technical feasible to reproduciblydetermine the bioaccessibility of contaminants from food and soil matrices with the invitro digestion model. The bioaccessibilities of benzo[a]pyrene, cadmium, aflatoxinB1 and ochratoxin A from food products were all moderate to high i.e. mean of 69%for benzo[a]pyrene, 62% for cadmium, 91% for aflatoxin B1 and 63% for ochratoxinA indicating that a substantial part of the contaminants is released from the foodmatrix but not all. It is too early to conclude that the bioaccessibility of contaminantsfrom food is always high as not many contaminants and matrices have been tested sofar. Literature data indicate that, for example, the bioavailability of ß-carotene, iron,calcium and folate was highly dependent on the type of food, and co-ingested factorsas other foods or food constituents and food processing [van het Hof et al., 2000;Wienk et al.,1999; Heanay, 2001; Gregory, 2001]. To gain insight in the usefulness ofthe in vitro digestion model for exposure assessment of contaminants from food, morecontaminants should be tested and more food products per contaminant.
5.4.2 Effect of type of matrix: food versus soilThe effect of the matrix is considered by comparison of the bioaccessibilities ofbenzo[a]pyrene and cadmium from food versus soil (tables 4 and 6). Thebioaccessibilities of benzo[a]pyrene and cadmium from food (69% and 62%,respectively) were ~1.4-fold higher than those from soil (44% and 47%, respectively),indicating that the presence of a soil matrix reduced the bioaccessibility ofcontaminants to some extent.
5.4.3 Concentration of contaminantA factor potentially affecting bioaccessibility is the level of contamination. In general,a dose proportional relationship between contamination level and bioavailability istaken as basic assumption. This assumption simplifies risk assessment, since it can beassumed that regardless of the level of contamination, a constant percentage of thecontaminant will be bioaccessible/bioavailable.
A dose proportional relationship was found for the contamination level andbioaccessibility of aflatoxin B1 as is shown in figure 6B. The different amounts of

RIVM report 320102002 - 41 -
benzo[a]pyrene (1.7 µg to 18 µg) and ochratoxin A (7 ng to 90 ng) in food had noeffect on the bioaccessibility of benzo[a]pyrene and ochratoxin A. Furthermore, adose proportional relationship has been found for the contamination level andbioaccessibility of lead from soil [Zeilmaker et al., submitted]. However, precipitationof benzo[a]pyrene from soil was found at high concentrations [Sips et al., 2001].
Thus, except for the bioaccessibility of benzo[a]pyrene from soil, a dose proportionalrelationship between contamination level and bioaccessibility of contaminants wasfound thus far. As the maximum tolerable concentrations of contaminants in food aremuch less than the intervention values in soil (1 ng/g food vs 40 µg/g soil forbenzo[a]pyrene and 0.1-0.5 µ/g food vs 530 µg/g soil for lead), precipitation of acontaminant, as was found for benzo[a]pyrene from soil [Sips et al., 2001], is notlikely to occur for the release of contaminants from food because the concentration ofcontaminants in food is much lower. Therefore, a dose proportional relationship forthe bioaccessibility and concentration of contaminants in food can be expected.
5.5 Conclusions on bioaccessibility from food productsThe optimised in vitro digestion model was applied in three case studies to examineits technical feasibility to determine the bioaccessibility of contaminants from food.The bioaccessibility of cadmium from lettuce and radish cultured on three differentfields contaminated with cadmium were 56% and 68%, respectively, thebioaccessibility of aflatoxin B1 from 9 batches of peanuts was 91% and thebioaccessibility of ochratoxin A from buckwheat was 63%.
Thus, the results showed that it is technically feasible to reproducibly determine thebioaccessibility of contaminants from food with the in vitro digestion model. Notethat the low maximum contaminant concentration in food may demand very sensitiveanalytical techniques to enable the determination of the concentrations ofcontaminants found in chyme because the contaminant concentration is at least 10-fold diluted in the chyme compared to the concentration in food.
Furthermore, the results showed that not all of the contaminants were released fromtheir food matrices during the digestion processes (the bioaccessibility was often lessthan 100%), indicating that the internal exposure to the contaminant is lower than theexternal exposure (intake of contaminant).

- 42 - RIVM report 320102002

RIVM report 320102002 - 43 -
6. (Pre)validation of the in vitro digestion modelThe in vitro digestion model has been based on human physiology. To test thepredictive value of the in vitro digestion model for the in vivo situation, the in vitrodigestion model should be validated with data in man. A major problem for validationof the in vitro digestion model against the in vivo situation is that different end-pointsare considered in vivo and in vitro. In the digestion model the fraction of theadministered dose available for absorption is determined. To determine the fractionavailable for absorption in vivo the small intestine should be sampled at different sitesand time-points, which is generally not achievable. Therefore, blood concentrations,urine excretion and or animal performance (e.g. body gain weight, feed intake,mortality) are taken as endpoints for bioavailability of (toxic) compounds.
Furthermore, validation of the in vitro digestion model with contaminants is difficultbecause human in vivo data with contaminants are scarce. In vivo human data on thebioavailability of lead under fasted and fed conditions are available [Maddeloni et al.,1998; Graziano et al., 2001] and might be useful for validation. However, lead sharestransporters in the intestinal epithelium needed for the absorption of minerals.Therefore, the transport of lead across the intestinal epithelium is likely to be affectedby the presence of food and combination of the in vitro digestion model with the invitro intestinal transport method (Caco-2 cells) may be necessary for a goodvalidation with the in vivo situation [Glahn et al., 1996; Versantvoort and Rompelberg2001, 2003]. More bioavailability studies with contaminants are available withexperimental animals. For example, aflatoxin-induced toxicity can be inhibited bymany different chemopreventive agents with multiple mechanisms of action e.g.modulation of metabolism of aflatoxin with oltipraz, phenolic antioxidants but also byreduction of exposure to aflatoxin with adsorbent materials. An “effective” adsorbentis one that tightly binds the mycotoxin in contaminated feed without dissociating inthe gastrointestinal tract of the animal. The toxin-adsorbent complex passes thenthrough the gastrointestinal tract without absorption and is eliminated via the faeces.This prevents or minimises exposure of animals to mycotoxins. Although often theefficacy of adsorption of mycotoxins has been determined by animal performancerather than by measurements of the mycotoxin concentration in blood or urine, thesestudies can be used to test the predictive value of the in vitro digestion model becauseless mycotoxin should be bioaccessible in the in vitro digestion model when it isbound to a adsorbent.
6.1 Modulators of mycotoxin bioavailability in vivoA worldwide-accepted method for protecting animals against mycotoxicosis is the useof adsorbents such as HSCAS, activated charcoal and special polymers, mixed withthe feed. These adsorbents have been shown to reduce toxicity of and exposure tomycotoxins in several animal species [Philips, 1999; Huwig et al., 2001]. Thefollowing agents representative for the different classes of adsorbents i.e. Myco-AD®an aluminosilicate, activated charcoal and cholestyramine a polymer, have beenselected as modulators to examine the usefulness of the in vitro digestion model as apredictive tool for the in vivo bioavailability of aflatoxin B1 and ochratoxin A. Inaddition, chlorophyllin has been chosen as modulator because an intervention study inhuman volunteers showed a 55% reduction in urinary secretion of aflatoxin

- 44 - RIVM report 320102002
metabolites [Egner et al., 2001]. It was suggested that the absorption of aflatoxin B1was reduced due to formation of a tight complex with chlorophyllin. The mechanismof action by which the adsorbents affect the bioavailability of aflatoxin B1 andochratoxin A, and what can be expected for the effect on the bioaccessibility ofaflatoxin B1 and ochratoxin A in the in vitro digestion model is discussed below andsummarised in Table 9.
Table 9. In vivo modulation of bioavailability of aflatoxin B1 and ochratoxin A:Predictive effect of adsorbents on the bioaccessibility of aflatoxin B1 and ochratoxinA in the in vitro digestion model.Adsorbent Mycotoxin Effect Species Predictive effect on
bioaccessibilityActivated charcoal Aflatoxin
OchratoxinYesYes
Poultry, goatPig, rat
DecreaseDecrease
Aluminosilicate(Myco-AD®)
AflatoxinOchratoxin
YesNoYes
Rat, poultry, pigPig, poultryIn vitro binding
DecreaseNo effect
Cholestyramine AflatoxinOchratoxin
?YesNo
no informationRat, micePig
?Decrease
Chlorophyllin AflatoxinOchratoxin
Yes?
Human, ratno information
Decrease or no effect?
Activated charcoal.Activated charcoal is used in man and animals as an antidote against poisoning.Activated charcoal is a non-soluble powder with an extraordinarily large surface areaand pore volume that gives it a unique adsorption capacity. At high concentrations ofactivated charcoal (10% w/w food) activity against mycotoxicosis has beendemonstrated with aflatoxin B1 in goats and ochratoxin A in pigs [Plank et al., 1990;references in Huwig et al., 2001]. At lower concentrations (<1% w/w), which showactivity in aqueous solutions, no activity against mycotoxicosis was found [seereferences in Huwig et al., 2001; Rotter et al., 1989]. The high concentrations ofactivated charcoal needed in vivo might be due to the fact that activated charcoal is arelatively unspecific adsorbent and, hence essential nutrients are also absorbed. As theconcentration of nutrients in food/feed is much higher compared to those of themycotoxin, mostly nutrients will be adsorbed to the activated charcoal. Indeed,addition of food to the aqueous solution greatly reduced the binding capacity ofactivated charcoal to ochratoxin A [Rotter et al., 1989].
To assess the bioaccessibility of contaminants from food products with the in vitrodigestion model, 4.5 g standard meal is included beside the food product of interest(see figure chapter 4.3). Therefore, a high concentration of activated charcoal (10%w/w) has been chosen to use in the in vitro digestion model. This concentration hasbeen proven activity against aflatoxin B1 and ochratoxin A toxicity in animals, andtherefore the bioaccessibility of both aflatoxin B1 and ochratoxin A is anticipated todecrease to a great extent in presence of activated charcoal.

RIVM report 320102002 - 45 -
AluminosilicatesAluminosilicates are the preferred adsorbents in reduction of mycotoxicosis inanimals. Aluminosilicates, mainly zeolites, hydrated sodium calcium aluminosilicates(HSCAS) and aluminosilicate-containing clays are a common anti-caking additive inanimal feeds. In vitro binding experiments show that HSCAS can bind a broadspectrum of mycotoxins including aflatoxin B1 and ochratoxin A [Philips, 1999;Huwig et al., 2001; Diaz et al., 2002]. Furthermore, no nutrient interactions have beenreported with HSCAS at the 0.5% level in the diet. Therefore, HSCAS seem to bemore selective adsorbing agents than activated charcoal. Numerous in vivo studieshave shown that HSCAS at 0.5-1% w/w reduce the exposure to aflatoxin B1 invarious species, however, do not exert effect on other mycotoxins [Philips, 1999;Huwig et al., 2001]. Thus in vivo, HSCAS are selective in adsorption of aflatoxins(and not ochratoxin A) in the gastrointestinal tract.
Myco-AD® , a formulated HSCAS clay, is a commercial mycotoxin adsorbent for alltypes of feed. The recommended dose is to mix it with feed at 0.25% w/w. As most invivo studies have used 0.5%w/w food, this concentration was used in the in vitrodigestion model. This concentration has been proven active against to both aflatoxinB1 and ochratoxin A in aqueous solution, in vivo only effective against aflatoxin B1.As the fluids used in the in vitro digestion model are simulating the situation in vivo, adecrease in bioaccessibility of aflatoxin B1 but no decrease in bioaccessibility ofochratoxin A is expected in presence of Myco- AD®.
ChlorophyllinAn intervention study in human volunteers with chlorophyllin showed a 55%reduction in urinary secretion of aflatoxin metabolites [Egner et al., 2001]. Similarresults have been observed in rat and rainbow trout [Kensler et al., 1998; Breinholt etal., 1995]. Although the precise mechanism of action is not yet fully understood, it isassumed that the absorption of aflatoxin B1 was reduced due to formation of a tightcomplex with chlorophyllin.
When this chlorophyllin-aflatoxin complex is insoluble, a decrease in bioaccessibilityof aflatoxin B1 is expected in the in vitro digestion model. Is the complex soluble,then the bioaccessibility of aflatoxin B1 may remain unchanged. No information oncombination of chlorophyllin and ochratoxin A was found.
CholestyramineCholestyramine has been used for over 20 years in the clinic for reduction of lowdensity lipoproteins and cholesterol. Cholestyramine is an anion exchange resin andbinds bile acids in the gastrointestinal tract. At high cholestyramine concentrations,the absorption of fat-soluble vitamins can be decreased because the bile acidsnecessary for the absorption of fat-soluble vitamins, are adsorbed to the resin.Cholestyramine can act as a binding agent in in vitro binding assays for themycotoxins ochratoxin A, zearalenone and fumonisins [Kerkadi et al., 1999; Huwiget al., 2001]. At 1% w/w only a very small effect of cholestryamine on the ochratoxinconcentration in blood, bile and tissue was measured in pigs [reference in Huwig etal., 2001]. On the other hand, cholestyramine (0.5-5% w/w) added to the diet greatlydecreased the exposure to ochratoxin A and fumonisins in rats [Madhyastha et al.,1992; Kerkadi et al., 1998].
- 46 - RIVM report 320102002
Cholestyramine was added at 5%w/w (300 mg cholestyramine per 6 g food food-mix)in the in vitro digestion model because this cholestyramine concentration has beenshown to decrease the exposure to ochratoxin A in vivo [Kerkadi et al., 1998]. Adecrease in bioaccessibility of ochratoxin A in presence of cholestyramine isexpected. The effect of cholestyramine on the bioaccessibility of aflatoxin B1 isunknown as no information on the interaction of aflatoxin B1 and cholestyramine wasfound.
6.2 Modulators of mycotoxin bioaccessibility in vitroTo assess the bioaccessibility of contaminants from food products with the in vitrodigestion model, 4.5 g standard meal is included beside the food product of interest(see figure 5, chapter 4.3). Two food-mixes (see chapter 5.2.1) with two differentbatches of peanut (6 and 12 µg/g) and buckwheat (7 and 20 µg/g) were used toexamine the bioaccessibility of aflatoxin B1 and ochratoxin A in presence of anadsorbent. Effects of the adsorbents on the bioaccessibility of aflatoxin B1 andochratoxin A from food-mix 1 is shown in figure 7. The bioaccessibility foundwithout an adsorbent added is defined as 100%. The effect of an adsorbent isexpressed as
bioaccessibility in presence of adsorbent : bioaccessibility without adsorbent * 100%.
020406080
100120
contr
ol
charc
oal
myco-A
D
chlor
ophy
llin
chole
styram
ine
Effe
ct m
odul
ator
s%
of c
ontr
ol
aflatoxin B1ochratoxin A
Figure 7. Effect of adsorbents on the in vitro bioaccessibility of aflatoxin B1 andochratoxin A from food-mix 1 as determined with the in vitro digestion model.The following amounts of adsorbents were added to 6 g food-mix: 600 mg charcoal (10%w/w food), 30 mg myco-AD® (0.5% w/w food), 3 mg chlorophyllin, and 300 mgcholestyramine (5% w/w food).
Charcoal greatly reduced the bioaccessibility of both aflatoxin B1 and ochratoxin Ato less than 20% of control bioaccessibility. This was expected because at thisconcentration charcoal reduced the ochratoxin A levels with 50% to 80% in pig[Plank et al., 1990] and mortal effects of aflatoxin in goat and mink were abolished[Huwig et al., 2001; Bonna et al., 1991].
The aluminosilicate Myco-AD® decreased the bioaccessibility of only aflatoxin B1without affecting the bioaccessibility of ochratoxin A. These results are also inagreement with the effects of HSCAS on aflatoxin B1 (positive effect) and ochratoxin

RIVM report 320102002 - 47 -
A (no effect) in rat, poultry and pig [Plank et al., 1990; Philips 1999; Huwig et al.,2001].
Chlorophyllin is supposed to reduce the absorption of aflatoxin B1 by complexation[Egner et al., 2001; Kensler et al., 1998; Breinholt et al., 1995]. However, addition ofchlorophyllin had no significant effect on the bioaccessibility of either aflatoxin B1 orochratoxin A. A lower absorption might be due to a lower bioaccessibility or due to aslower transport across the intestinal epithelium. Whether chlorophyllin is affectingthe passage of the gastrointestinal epithelium of aflatoxin B1 could be examined bymeasurement of the transport of aflatoxin B1 with the in vitro intestinal transportmethod (Caco-2 cells) [Versantvoort et al., 2000]. As the mechanism of action ofchlorophyllin is not yet fully understood, the results of chlorophyllin on thebioaccessibility of aflatoxin B1 can not considered as positive or negative for thevalidation of the in vitro digestion model.
Cholestyramine decreased the bioaccessibility of aflatoxin B1 to a small extent andgreatly reduced the bioaccessibility of ochratoxin A to less than 20% of the controlbioaccessibility. This is in agreement with in vivo data in rats where cholestyraminereduced the bioavailability of ochratoxin A 2- to 5-fold [Madhyastha et al., 1992;Kerkadi et al., 1998].
Effects of the adsorbents on the bioaccessibility of aflatoxin B1 and ochratoxin Afrom food-mix 1 and food-mix 2 were the same (see Table 10). Furthermore, theeffects of the adsorbents were also reproducible as the standard deviation of the twoexperiments in triplicate (n=6) is small.
Table 10. Effect of adsorbents on the in vitro bioaccessibility of aflatoxin B1 andochratoxin A.
Bioaccessibility % of controlAflatoxin B1 Ochratoxin A
Adsorbent Food-mix 1 Food-mix 2 Food-mix 1 Food-mix 2Control 100 ± 11 100 ± 8 100 ± 14 100 ± 6Charcoal 4 ± 1 2 ± 1 12 ± 3 16 ± 5Myco-AD® 17 ± 13 12 ± 8 95 ± 13 107 ± 11Chlorophyllin 89 ± 12 93 ± 8 86 ± 14 94 ± 21Cholestryamine 62 ± 6 60 ± 7 14 ± 4 13 ± 5Data are mean ± sd of 2 digestion experiments each performed in triplicate. The followingamounts of adsorbents were added to 6 g food-mix: 600 mg charcoal (10% w/w food), 30 mgmyco-AD® (0.5% w/w food), 3 mg chlorophyllin (chlorophyllin : aflatoxin = >100000 : 1),and 300 mg cholestyramine (5% w/w food).
In conclusion, in 5 out of 6 combinations of adsorbents and mycotoxins the effects ofthe adsorbents on the bioaccessibility of aflatoxin and ochratoxin in the in vitrodigestion model were in agreement with the effects observed in vivo. And none of theeffects with the in vitro digestion model were in disagreement with the effectsobserved in vivo.

- 48 - RIVM report 320102002
6.3 ConclusionsA first validation of the in vitro digestion model has been presented in this chapter.The bioaccessibilities of aflatoxin B1 and ochratoxin A in presence of 4 differentadsorbents were in 5 out of 6 situations predictive for the in vivo situation. The sixthcase showed no effect of chlorophyllin on the bioaccessibility of aflatoxin B1 whereasin vivo a 2-fold reduction was observed in humans. However, the mechanism bywhich chlorophyllin reduces aflatoxin B1 bioavailability in vivo are not fullyunderstood and when the transport of aflatoxin B1 across the intestinal epithelium isdecreased in presence of chlorophyllin, no effect on the bioaccessibility of aflatoxinB1 can be expected. Thus, the results with adsorbents on the bioaccessibility ofaflatoxin B1 and ochratoxin A show that the in vitro digestion model can be apowerful tool to predict in vivo bioavailability of compounds.
Before the in vitro digestion models can be implemented as a tool in risk assessment,a more quantitative validation of the in vitro digestion model for the in vivo situationin man is recommended. As human in vivo bioavailability data of contaminants arerare, studies with vitamins or minerals such as ß-carotene, iron, calcium and folatefrom different food sources or food processing could be useful because in vivo studiesin humans are available of these compounds.

RIVM report 320102002 - 49 -
7. Applicability of the in vitro digestion model inrisk assessmentThe general aim of the project is to contribute to improvement of exposure assessmentof ingested contaminants by means of developing an experimental tool to estimate theinternal exposure of man to ingested contaminants. The last decade there is anincreasing interest in the use of in vitro methodologies to study the human oralbioavailability of compounds from soil and food [Garret et al., 1999; Glahn et al.,1996; Minekus et al., 1995; Ruby et al., 2001; Oomen et al., 2002]. Most of the invitro digestion models describe a two- (stomach and small intestine) or three-stepprocedure (mouth, stomach, small intestine or stomach, small and large intestine). Thebioaccessibility of the contaminant can be determined in each compartment, however,absorption of compounds takes mainly place in the small intestine and therefore, thebioaccessibility is mostly only determined in the chyme of the small intestine.Sometimes the bioaccessibility is not determined directly in the chyme but afterdialysis [Glahn et al., 1996; Minekus et al., 1995]. As described in chapter 4.1.4 thismay influence the bioaccessibility of compounds.
The mobilisation of a compound from its matrix (bioaccessibility) in thegastrointestinal tract is a dynamic process with continuously changes in physiologicalconditions in the gastrointestinal tract. Most of the models are static models, whichmeans that transition of one compartment to the other is instantaneously. The modelof TNO introduced by Minekus et al. [1995] peristaltic movement is simulated andpH and water absorption are continuously monitored and controlled. This dynamicmodel is also a multi-compartmental model including the stomach and small intestinalparts jejunum and ileum (if required also colon) but not the mouth.
What methodology is best is strongly dependent on what information is required. Forscreening purposes, the model should be simple, cheap, able to handle many samplesand result in overestimation of worst case situation (EPA-tests, Ruby, dissolutiontests). The dynamic model can provide detailed information on the release of acompound from its matrix. This model requires advanced laboratory equipment and istherefore not easily introduced in an arbitrary laboratory setting. Furthermore, onlysmall sized samples (homogenised) can be introduced in this model and one matrixcan be analysed per day and, therefore, the model is less suitable for handling manysamples.
Aiming at a test procedure to apply on a random matrix (food, consumer products,soil) for random compounds, the digestion model should easily be manipulated tomimic various conditions. The results in this project (reports 320102-001 and 320102-002) with the in vitro digestion models simulating fasted and fed conditions showedthat the physiologically based in vitro digestion model is a promising tool forestimating the effect of the ingestion matrix (food, soil and toys) on bioaccessibility ofcontaminants. The method is based on head-over-heels rotation, which can easilyimplemented in a laboratory setting and showed reasonable interlaboratoryreproducibility [Könemann et al., 1998].

- 50 - RIVM report 320102002
7.1 How can determination of the bioaccessibility ofcontaminants with an in vitro digestion model aid toimprovement of health risk assessment?7.1.1 Exposure assessment.To date, exposure assessment to a contaminant from food is calculated based on thesum of intake (external exposure) of contaminant per food product rather than on thetotal internal exposure, whereas the internal exposure is correlated with toxicity of thecontaminant. Contaminants are present in many different ingested (food) products andthe total oral exposure to the contaminant is the sum of the bioavailability of thecontaminant from each product. The bioaccessible fraction is considered to representthe maximum amount of contaminant available for absorption in the body, thus, theoral bioavailability can never be higher than the bioaccessibility. Hence, abioaccessibility of less than 100% implies that the internal exposure to thecontaminant is lower than the external exposure and that consequently the internalexposure to the contaminant is overestimated.
The results in this project showed that the bioaccessibility was dependent on thematrix and that not all of the contaminants were released from their matrix duringdigestion. The results should be interpreted with care as not many contaminants andmatrices have been tested so far. Further determination of the bioaccessibility ofcontaminants from different food products is a next step to examine the effect of thefood product on the bioaccessibility of contaminants. Also studies described inliterature indicate that the oral bioavailability of a contaminant from food can bedependent on its matrix of ingestion [Dieter et al., 1993; Freeman et al.,1996; van hetHof et al., 2000; Wienk et al., 1999; Gregory, 2001; Heanay, 2001]. Therefore, the invitro digestion model could improve exposure assessment by taking into account thebioaccessibility of the contaminant from each product as a maximum measure for oralbioavailability in calculation of the total internal exposure to the contaminant(Σ(intake contaminant x Fb)per product).
Besides unintentionally presence of contaminants in food, bio-active components e.g.anti-oxidants, vitamins, iodine, minerals are added to food products. For thesecomponents, bioavailability is key to the effectiveness of the components. The in vitrodigestion model could be used to determine the bioaccessibility as part of thebioavailability of the bio-active (functional food) component from different foodproducts.
7.1.2 Health risk assessment.Up till now in risk assessment, the oral bioavailability of a contaminant from anarbitrary ingested matrix (e.g. food, toy, soil) is assumed to equal the oralbioavailability from the matrix applied in toxicity studies. NOAELs and consequentlyADIs for contaminants are based on matrices used in toxicity studies. In toxicitystudies typically liquid (drinking water, oil) and food matrices (pelleted animal feed)are employed, whereas man is exposed to contaminants present in many differentingested food products. Studies in experimental animals and humans indicate that oralbioavailability of compounds is dependent on its matrix [Dieter et al., 1993; Freemanet al.,1996; van het Hof et al., 2000; Wienk et al., 1999; Gregory, 2001; Heanay,2001]. As a consequence, a contaminant in matrix A can lead to toxicity whereas the

RIVM report 320102002 - 51 -
same amount of contaminant in matrix B will not exert toxic effects. Introduction of arelative bioavailability factor for a contaminant, i.e. the bioavailability of thecontaminant from the matrix of interest with respect to the bioavailability thecontaminant from the matrix used in toxicity studies [Versantvoort and Rompelberg,2001; van het Hof et al., 2000], would therefore contribute to more accurate healthrisk assessment.
7.1.2.1 Determination of a relative bioavailability factorDetermination of a relative bioavailability factor has been described in milestone“Haalbaarheidsstudie naar validatie van het in vitro digestiemodel” [Versantvoort andRompelberg, 2001] and the theory of oral bioavailability is described in chapter 2.Oral bioavailability of an ingested compound is the resultant of the three stepsbioaccessibility, transport across the intestinal epithelium and metabolism. Assumingthat the matrix of ingestion does not affect intestinal transport and metabolism of thecompound (see chapter 2), the relative bioavailability factor of a compound (F relative =F matrix of interest / F matrix tox study) is reflected by the difference in bioaccessibility of thecompound from the two different matrices (Fb matrix of interest / Fb matrix tox study).
In figure 7 a schematic design how to handle the determination of the relativebioavailability factor is given. Often in toxicity studies, concentrations of thecompound in urine or faeces are measured rather than the oral bioavailability of thecompound. Therefore, usually the bioaccessibility of the contaminant both from thematrix of interest and from the matrix used in toxicity studies should be determinedexperimentally.
F matrix tox study known?
Fa and Fh known?
Determine Fb matrix of interestwith in vitro digestion modelCalculate Fb matrix of tox study
Determine Fbmatrix of interest and Fb matrix tox studywith in vitro digestion model
Calculate F relative= F matrix of interest / F matrix tox study
Calculate F matrix of interest= Fb matrix of interest x Fa x Fh
Calculate F relative= Fb matrix of interest / Fb matrix tox study
no yes
yesno
Figure 7. A schematic design for determination of the relative bioavailability factor(Frelative).Fb, Fa, Fh are defined as the fraction of the compound that is bioaccessible, transported acrossthe gastro-intestinal wall, and not metabolised in the liver, respectively (see figure 1).

- 52 - RIVM report 320102002
7.1.2.2 What matrices are being used in toxicity studies?Frequently used matrices in toxicity studies in experimental animals are drinkingwater (e.g. heavy metals in rats), oil (e.g. NOAEL of benzo[a]pyrene in rats has beenbased on gavage with soy oil), and feed (e.g. phtalate has been added to standard feedpellets in toxicity study in rats). With epidemiological studies in humans, thecontaminant has often been ingested either by drinking water and/or by food (e.g.lead, cadmium in human). Notice that administration in drinking water without foodsupply within half an hour after administration of the drinking water, implies fastedconditions in the gastrointestinal tract whereas administration with feed and foodresults in fed conditions.
For a contaminant administered in solution as it is with drinking water, thebioaccessibility of the contaminant is assumed to be 100%. The contaminant does notneed to be mobilised from its matrix because it is already in solution and henceavailable for absorption in the intestine. After ingestion of other matrices such as feed,food, soil and toys, the contaminant may be partially or totally released from theirmatrix during digestion in the gastrointestinal tract. Only the bioaccessible fraction isavailable for transport across the intestinal epithelium into the body and cancontribute to internal exposure.
7.1.2.3 Matrices which have been used with the in vitro digestion model.In this study, the bioaccessibilities of benzo[a]pyrene, cadmium, aflatoxin B1 andochratoxin A from food products were moderate to high: 69% for benzo[a]pyrene,62% for cadmium, ~90% for aflatoxin B1 and ~60% for ochratoxin A indicating thatfor most contaminants a substantial part of the contaminants is released from the foodmatrix but not all. It is too early to conclude that the bioaccessibility of contaminantsfrom food is always high and that consequently comparison with the matrix used intoxicity studies is not necessary because not many contaminants and matrices havebeen tested so far. Furthermore, literature data indicate that, for example, thebioavailability of ß-carotene, iron, calcium and folate was highly dependent on thetype of food, and co-ingested factors as other foods or food constituents and foodprocessing [van het Hof et al., 2000; Heanay, 2001; Gregory, 2001]. In this projectthe impact of the matrix on the bioaccessibility was illustrated by the 1.4-fold lowerbioaccessibility of benzo[a]pyrene and cadmium from soil compared to food butespecially by the great differences in bioaccessibility of lead (bioaccessibility variedfrom 1.6% to 51%) from 4 different toy matrices [RIVM-report 320102001, Oomen etal., 2003]. Here it is evident that comparison of the bioaccessibility of the matrix ofinterest with the matrix used in toxicity studies will aid to a better exposure and hencerisk assessment.
To gain insight in the usefulness of the in vitro digestion model for risk assessment,bioaccessibility of contaminants from matrices used in toxicity studies should bedetermined, for example, the bioaccessibility of benzo[a]pyrene from soy oil, lead,cadmium and arsenic in drinking water (fasted conditions) and food (fed conditions)and compared with the bioaccessibility of the contaminant from different matrices.

RIVM report 320102002 - 53 -
7.2 ConclusionsThe experiments in this report and previous reports show that it is technically feasibleto reproducibly determine the bioaccessibility of contaminants from food, soil and toymatrices with an in vitro digestion model. Only a fraction of the contaminants wasreleased from the matrix during digestion in most cases. These results indicate that theinternal exposure (oral bioavailability) to the contaminant is lower than the externalexposure (intake of the contaminant) implying that exposure is overestimated.
Contaminants may be present in many different food products. The total oral exposureto the contaminant is the sum of the bioavailability of the contaminant from eachproduct. As the bioavailability of the contaminant can be dependent on its matrix ofingestion, the in vitro digestion model can improve exposure assessment by takinginto account the bioaccessibility of the contaminant from each product in calculationof the total exposure to the contaminant.
Furthermore, the in vitro digestion model could be a useful tool to improve health riskassessment by determination of a relative bioaccessibility factor, i.e. comparison ofthe bioaccessibility of a contaminant from the ingested matrix of interest with thebioaccessibility of the contaminant from the matrix used in the toxicity studies. Thisrelative bioaccessibility factor is likely to reflect the relative oral bioavailability of thecontaminant.
Before the digestion models can be used in risk assessment, the in vitro digestionmodels should be validated with in vivo derived data. The results with adsorbentmaterials on the bioaccessibility of aflatoxin B1 and ochratoxin A (chapter 6) showthat the in vitro digestion model can be a powerful tool to predict in vivobioavailability of compounds. Sometimes combination with an in vitro intestinaltransport model may be necessary for a good validation. Therefore, further researchshould be focussed on the validation of the in vitro digestion models.

- 54 - RIVM report 320102002
ReferencesBonna RJ, Aulerich RJ, Bursian SJ, Poppenga RH, Braselton WE, Watson GL (1991)
Efficacy of hydrated sodium calcium aluminosilicate and activated charcoal inreducing the toxicity of dietary aflatxoin in mink. Arch Environ ContamToxicol., 20: 441-447
Breinholt V, Hendricks J, Pereira C, Arbogast D, Bailey G (1995) Dietarychlorophyllin is a potent inhibiotr of aflatoxin B1 hepatocarcinogenesis inrainbow trout. Cancer res., 55: 57-62
Brunner H, Northfield TC, Hofmann AF, Go VLW, Summerskill WHJ (1974) Gastricemptying and secretion of bile acids, cholesterol, and pancreatic enzymesduring digestion. Duodenal perfusion studies in healthy subjects. Mayo Clin.Proc., 49: 851-860
Charman WN, Porter CJH, Mithani S, Dressman JB (1997) Physicochemical andphysiological mechanisms for the effects of food on drug absorption: the roleof lipids and pH. J. Pharm. Sci. 86:269-282
Cobb GP, Sands K, Waters M, Wixson BG, Dorward-King E (2000) Accumulationof heavy metals by vegetables grown in mine wastes. Environ. Tox.Chem., 19:600-607
Colburn WA, Gibson, DM, Rodriguez LC, Bugge CJL, Blumenthal HP (1985) Effectof meals on the kinetics of etretinate. J. Clin. Pharmacol., 25: 583-589
Davenport HW. Physiology of the digestive tract. 3rd Ed. Yearbook medicalpublishers, Chicago, 1984. Chapter 13: Gastric digestion and emptying;absorption.
Dieter MP, Matthews HB, Jeffcoat RA, Moseman RF (1993) Comparison of leadbioavailability in F344 rats fed lead acetate, lead oxide, lead sulfide, or leadore concentrate from Skagway, Alaska. J. Toxicol. Environ. Health 39:79-93
Dressman JB, Berardi RR, Dermentzoglou LC, Russell TL, Schmaltz SP, Barnett JL,Jarvenpaa KM (1990) Upper gastrointestinal (GI) pH in young, healthy menand women. Pharm. Res., 7: 756-761
Dressman JB, Amidon GL, Reppas C, Shah VP (1998) Dissolution testing as aprognostic tool for oral drug absorption: immediate release dosage forms.Pharm. Res., 15: 11-22
Egner PA, Wang J-B, Zhu Y-R, Zhang B-C, Wu Y, Zhang Q-N, Qian G-S, Kuang S-Y, Gange SJ, Jacobson LP, Helzlsouer KJ, Bailey GS, Groopman JD, KenslerTW (2001) Chlorophyllin intervantion reduces aflatoxin-DNA adducts inindividuala at high risk for liver cancer. Proc. Natl, Acad. Sci USA, 98: (25)14601-14606
Freeman GB, Dill JA, Johnson JD, Kurtz PJ, Parham F, Matthews HB (1996)Comparative absorption of lead from contaminated soil and lead salts by

RIVM report 320102002 - 55 -
weanling Fisher 344 rats. Fundam. Appl. Toxicol. 33:109-119
Friedman HI and Nylund B (1980). Intestinal fat digestion, absorption and transport.Am. J. Clin. Nutrition, 33: 1108-1139
Garret DA, Failla ML, Sarama RJ (1999) Development of an in vitro digestionmethod to assess carotenoid bioavailability from meals. J Agric Food Chem.47: 4301-4309
Glahn RP, Wien EM, van Campen DR, Miller DD (1996) Caco-2 cell iron uptakefrom meat and casein digests paralells in vivo studies: use of a novel in vitromethod for rapid estimation of iron bioavailability. J Nutr. 126: 332-339
Gray VA. Change of pH requirements for simulated intestinal fluid TS (1996)Pharmacopeial Forum, 22: 1943-1945
Graziano JH, Lolacono NJ, Maddaloni M, Blum CC (2001) Assessing the oralbioavailability of lead in soil in humans. Toxicological Sciences, Suppl.Society of Toxicology 2001 annual meeting. 60: 331
Gregory JF Case study: folate bioavailability (2001) J. of Nutrition, 131: 1376S-1382S
Guyton AC (1991) Textbook of medical physiology. W.B. Saunders Company,Philadelphia, USA
Heaney RP (2001) Factors influencing the measurement of bioavailability, takingcalcium as a model. J. of Nutrition 131: 1344S-11348S
van het Hof KH, West CE, Weststrate JA, Hautvast JGAJ (2000) Dietary factors thataffect the bioavailability of carotenoids. J. of Nutrition, 130: 503-506
Hunt JN, Stubbs DF (1975) The volume and energy content of meals as determinantsof gastric emptying. J. Physiol., 245: 209-225
Huwig A, Freimund S, Käppeli O, Dutler H (2001) Mycotoxin detoxification ofanimal feed by different adsorbents. Toxicol., Lett., 122: 179-188
Jovani M, Barbera R, Farré, Martin de Aguilera E (2001) Calcium, iron, and zincuptake from digests of infant formulas by Caco-2 cells. J.Agric.Food Chem.,49: 3480-3485
Kensler TW, Groopman JD, Rebuck BD (1998) Use of aflatoxin adducts asintermediate endpoints to assess the effecicay of chemopreventiveinterventions in animals and man. Mutat. Res., 402: 165-172
Kerkadi AA, Barriault C, Tuchweber B, Frohlicj AA, Marquardt RR, Bouchard G,Yousef IM (1998) Dietary cholestyramine reduces ochratoxin A-inducednephrotoxicity in the rat by decreasing plasma levels and enhancing fecalexcretion of the toxin. J. Toxicol. Environ. Health, 53: 231-250, 1998
Könemann WH (1998) Phthalate release from soft PVC baby toys; Report from the

- 56 - RIVM report 320102002
Dutch Consensus Group. Report no 613320002. National Institute of PublicHealth and the Environment, Bilthoven, The Netherlands.
Lawson M, Everson GT, Klingensmith W, Kern F Jr. (1983) Coordination of gastricand gallbladder emptying after ingestion of a regular meal. Gastroenterology,85: 866-870
Lipinski CA, Lombardo F, Dominy BW, Feeney PJ (1997) Experimental andcomputational approaches to estimate solubility and permeability in drugdiscovery and development settings. Adv.Drug Del. Rev. 23: 3-25
Maddaloni M, lolacono N, Manton W, Blum C, Drexler J, Graziano J (1998)Bioavailability of soilborne lead in adults, by stable isotope dilution, Environ.Health Perspec. 106 (Suppl 6): 1589-1593
Madhyastha MS, Frohlich AA, Marquardt RR (1992) Effect of dietary cholestyramineon the elimination pattern of ochratoxin A in rats. Food Chem Toxicol., 30:709-714
Malagelada J-R, Longstreth GF, Summerskill WHJ, Go VLW (1976) Measurement ofgastric functions during digestion of ordinary solid meals in man.Gastroenterology, 70: 203-210
Malagelada J-R, Robertson JS, Brown ML, Remington M, Duenes JA, ThomfodeGM, Carryer PW (1984) Intestinal transit of solid and liquid components of ameal in health. Gastroeneterology, 87: 1255-1263
Minekus M, Marteau P, Havenaar R, Huis in ‘t Veld JHJ (1995) Amulticompartmental dynamic computer controlled model simulating thestomach and small intestine. ATLA 23: 197-209
Van Nieuw Amerongen A, Michels LFE, Veerman ECI, Vissink A (1994) Speekselen mondgezondheid. Amsterdam: VU uitgeverij
Oomen AG (2000) Determinants of oral bioavailability of soil-borne contaminants.PhD Thesis. Utrecht University, Utrecht, The Netherlands.
Oomen AG, Hack A, Minekus M, Zeijdner E, Cornelis C, Schoeters G, Verstraete W,Wiele TVd, Wragg J, Rompelberg CJM, Sips AJAM, Wijnen JV (2002)Comparison of five in vitro digestion models to study the bioaccessibility ofsoil contaminants. Environ. Sci. Technol. 36:3326-3334
Oomen AG, Rompelberg CJM, Bruil MA, Dobbe CJG, Pereboom DPKH, Sips AJAM(2003) Development of an in vitro digestion model for estimation ofbioaccessibility of soil contaminants. Arch. Environ. Contam. Toxicol.44:281-287
Oomen AG, KVan Twillert K, Hofhuis MFA, Rompelberg CJM, and VersantvoortCHM (2003) Development and suitability of in vitro digestion modelssimulating swallowing and/or sucking to assess bioaccessibility of lead fromtoy matrices. RIVM report 320102001

RIVM report 320102002 - 57 -
Oomen AG, Rompelberg CJM, Van de Kamp E, Pereboom DPKH, de Zwart LL, SipsAJAM Effect of Bile Type on the Bioaccessibility of Soil Contaminants in anin vitro Digestion Model. Archives of contamination and toxicology,provisionally accepted
Palm K, Luthman K, Ungell AL, Strandlund G, Artursson P (1996) Correlation ofdrug absorption with molecular surface properties. J Pharm Sci, 85: 32-39
Philips TD (1999) Dietary clay in the chemoprevention of aflatoxin-induced disease.Toxicological Sciences, 52 (suppl): 118-126
Plank G, Bauer J, Grunkemeier A, Fischer S, Gedek B, Berner H (1990) Theprotective effect of adsorbents against ochratoxin A in swine. Tierarstl prax.,18: 483-489
Rotard W, Chritmann W, Knoth W, Mailahn W (1995) Determination of absorptionavailability of PCDD/PCDF from "Kieselrot" (Red Slag) in the digestive tract -Simulation of the digestion of technogenic soil. Z Umweltchem Okotox., 7: 3-9
Rotter RG, frohlich AA, Marquardt RR (1989) Influence of dietary charcoal onochratoxin A toxicity in Leghorn chicks. Can J Vet Res., 53: 449-453
Ruby MV (2001) The development and validation of an in vitro method for assessingthe oral bioavailability of metals in soil. Toxicological Sciences, Suppl.Society of Toxicology 2001 annual meeting. 60: 331
Sips AJAM, Bruil MA, Dobbe, CJG, van de Kamp E, Oomen AG, Pereboom DPKH,Rompelberg CJM, Zeilmaker MJ (2001) Bioaccessibility of contaminantsfrom ingested soil in humans. Method and research on the bioaccessibility oflead and benzo[a]pyrene. RIVM report 711701012
Sizoo EA, van Egmond HP (1997) Investigations on the occurence of ochratoxin A inanimal feeding-stuffs and cereals; samples drawn in the Netherlands in 1995,RIVM report 3888020 013
Tortora GJ and Grabowski SR (1996) Principles of anatomy and physiology, EighthEdition, HarperCollins Publishers Inc.
Versantvoort CHM, Rompelberg, CJM, Sips AJAM (2000) Methodologies to studyhuman intestinal absorption. A review. RIVM report 630030001
Versantvoort CHM, Rompelberg CJM (2001) Briefrapport 630030:Haalbaarheidsstudie naar validatie van het in vitro digestiemodel.
Versantvoort CHM, Rompelberg CJM (2003) Briefrapport 630030: Het bepalen vanorale biobeschikbaarheid met behulp van in vitro methodieken.Haalbaarheidsstudie naar koppeling van het in vitro digestiemodel met het invitro Caco-2 darmtransportmodel.
Vetter RD, Carey MC, Patton JS (1985) Coassimilation of dietary fat andbenzo[a]pyrene in the small intestine: an absorption model using the killifish.J. of Lipid Research, 26: 428-434

- 58 - RIVM report 320102002
Wiedemann TS and Kamel L (2002) Examination of the solubilization of drugs bybile salt micelles. J. Pharm. Sci., 91: 1743-1764
Wienk KJH, Marx JJM, Beynen AC (1999) The concept of iron bioavailability and itsassessment. Eur. J. Nutr., 38:51-75
Zeilmaker MJ, Oomen AG, De Zwart LL, Duits M, Van Eijkeren JCH, Sips AJAM(In preparation) Mathematical modeling of in vitro human bioaccessibility oflead from soil in relation to the level of contamination, submitted.
Zo eet Nederland. Resultaten van de voedselconsumptiepeiling 1997-1998,Voedingscentrum, Den Haag, 1998

RIVM report 320102002 59
Appendix 1Physiological changes in the gastrointestinal tract in response to food. Development ofan in vitro digestion model to mimic the fed state in adults.C. Versantvoort, E. van de Kamp, L de Zwart, A. Sips, C. Rompelberg, March 2001
ContentsSAMENVATTING 60
1 INTRODUCTION 62
2 SECRETION OF GASTROINTESTINAL JUICES 63
3 SALIVA 65
4 STOMACH 67
4.1 GASTRIC SECRETION 674.2 GASTRIC PH 674.3 GASTRIC EMPTYING 68
5 SMALL INTESTINE 71
5.1 SECRETION OF BILE 715.2 SECRETION OF PANCREATIC FLUIDS 725.3 TRANSIT TIME 735.4 SMALL INTESTINAL PH 75
6 FOOD 76
6.1 FOOD CONSUMPTION 766.2 DIGESTION 766.3 ABSORPTION OF NUTRIENTS 776.4 IMPACT OF DIFFERENCES IN PRE- AND POSTPRANDIAL GASTROINTESTINAL STATE ON BIOACCESSIBILITYOF COMPOUNDS. 78
7 PROPOSAL FOR IN VITRO DIGESTION MODEL TO MIMIC THE FASTED AND FED STATEIN HUMANS 80
7.1 VOLUMES OF INGESTED AND SECRETED FLUIDS 807.2 CHANGES IN THE IN VITRO DIGESTION MODEL AS RESULT OF FOOD 81
REFERENCES 85

- 60 - RIVM report 320102002
Samenvatting
Met behulp van een “in vitro digestiemodel”, een methode waarmee op een vereenvoudigdewijze het digestieproces nagebootst wordt, kan op een relatief goedkope en snelle manier eenschatting van de orale biobeschikbaarheid van een stof verkregen worden. Een in vitrodigestiemodel kan daarom een hulpmiddel zijn bij risicobeoordeling van orale inname vancontaminanten. De orale biobeschikbaarheid van contaminanten kan opmerkelijk verschillenals de contaminant op een nuchtere maag of met voeding ingenomen wordt ten gevolge vanfysiologische veranderingen in het maagdarmkanaal. Contaminanten worden vaak onderwisselende condities ingeslikt, wat gevolgen kan hebben voor de toxiciteit van decontaminant. Het digestiemodel dat in ons laboratorium is ontwikkeld, is gebaseerd op defysiologische condities van een kind onder nuchtere omstandigheden. We willen ditdigestiemodel nu toepasbaar maken om de bioaccessibility van contaminanten in voeding tebestuderen. Aangezien bij de risicoschatting van contaminanten in voeding vooral naarlevenslange blootstelling (chronische toxiciteit) wordt gekeken is de doelgroep niet een kindmaar een volwassene. Hierdoor zal het huidige digestiemodel aangepast moeten worden omde fysiologische processen in het maagdarmkanaal van volwassenen na het eten van voedingte simuleren.
Veranderingen in de orale biobeschikbaarheid van stoffen door voeding kan het gevolg zijnvan fysische en chemische interaktie tussen de stof en specifieke voedselcomponenten maaris meestal het gevolg van veranderingen in de secretie van de maagdarmsappen en/ofverandering in de verblijtijftijd in het maagdarmkanaal. Aangezien de absorptie van stoffenmet name plaatsvindt in de dunne darm, moet de stof al vrijgekomen zijn uit zijn matrix in dedunne darm. Daarom beperken we ons tot de fysiologische veranderingen in het traject vanmond tot en met dunne darm. Dit document is bedoeld als werkdocument om op grond vanliteratuurgegevens tot een voorstel voor aanpassingen van het digestiemodel te komen om defysiologische processen in het maagdarmkanaal onder invloed van voeding te simuleren.
De secretie van speeksel, maagsap, gal en pancreassap in respectievelijk de mond, maag enduodenum, wordt gestimuleerd door voedsel consumptie. Zowel de hoeveelheidgeproduceerd als ook de samenstelling van de sappen verandert door voedsel consumptie.Vaak wordt juist die hoeveelheid sap geproduceerd die nodig is voor de vertering van devoeding. Andere belangrijke veranderingen zijn de verhoging van de maag pH door het etenvan voeding van pH 1.5 (nuchter) tot pH 3-7 (+voeding) en de verblijftijd van de voeding inde maag. Daarentegen verandert de pH en de verblijftijd in de dunne darm nauwelijks inaanwezigheid van voeding. De veranderingen in secretie van de maagdarmsappen en deverblijftijden zijn in detail bediscusieerd in hoofdstukken 3 tot en met 6. Gebaseerd op dezeliteratuur gegevens is een voorstel gemaakt hoe het digestiemodel aan te passen voorvoeding. Dit is in de onderstaande tabel weergegeven.

RIVM report 320102002 - 61 -
Voorstel voor aanpassingen voor het in vitro digestiemodel ten gevolge van voedsel inname.Digestie fase Verandering in samenstelling Volume
verhoudingIncubatie tijd
Voeding Standaard warme maaltijd:eiwit/koolhydraat/vet=1/2/1(w/w/w)
1.5 nvt
Speeksel Amylase 2x↑, Na+↑, Cl-↑,HCO3
-↑, mucin 2x↓, pH 7-7.41 0-5 minuten
Maag Pepsine 2-3x↑pH 5 (3-7) →(60-120 min)→ pH 2
2 2uur: <300 kcal4-7 uur: 450-700 kcal6-20 uur: >900 kcal
Gal Standaard maaltijd: 8 mMVetrijke maaltijd: 15 mM
1
Pancreas Enzymen 2-3x↑, bicarbonate↑ 22 – 4 uur

- 62 - RIVM report 320102002
1 IntroductionImplementation of comprehensive methods capable of predicting human oral
absorption in risk assessment of orally ingested toxicants, would provide information thatcould speed up and contribute to a more rational and optimised health risk assessment.Recently, we have developed in our Laboratory of Exposure Assessment and EnvironmentalEpidemiology an “in vitro digestion model”, which mimics in a simplified manner thedigestion processes in the gastrointestinal tract. In this way the release of a compound fromits matrix in the gastrointestinal tract can be studied. Only the fraction of the compound thatis released (bioaccessibility) is available for absorption in the small intestine. This in vitrodigestion model may provide an important tool for (ad hoc) health risk assessment practicesince a rapid indication of the bioaccessibility of a compound can be obtained with model.This digestion model has been developed for one specific purpose: to simulate the ingestionand digestion of contaminated soil by children (project M711701/01/FF). This model is basedon the physiology of a child under fasted conditions [34]. We now like to apply the digestionmodel for examining the bioaccessibility of toxic compounds that have been ingested with ameal in adults. Therefore, the digestion model may need to undergo some changes to mimicthe physiological processes in the gastrointestinal tract of human adults after eating a meal.
The presence of food within the gastrointestinal tract can markedly alter the oralbioavailability of compounds via changes in the rate and/or extent of absorption, presystemicmetabolism, and systemic clearance of the compound. These changes can lead to variations intoxicity profiles because contaminants are often ingested under conditions of varying foodand fluid intake. Physical and chemical interactions may occur between compounds andspecific food components but altered postprandial absorption is generally a function of thechanges associated with conversion from the fasted to the fed state. Changes due to i)secretion of gastric acid and bile and pancreatic fluids, ii) modification of gastric andintestinal motility patterns, and iii) alterations in visceral blood and lymph flow have the mostsignificant impact on absorption.
In this paper, we have reviewed the physiological changes that occur in thepostprandial gastrointestinal tract of adults. Absorption of compounds occurs mainly in thesmall intestine and as release from its matrix is a prerequisite to intestinal absorption, thecompound should be bioaccessible in the small intestine. Therefore, we have confined us tothe tract mouth to small intestine and not included the large intestine. This information willprovide us a framework to adjust the early-developed in vitro digestion model for examiningthe effects of food on the bioaccessibility of compounds in adults.

RIVM report 320102002 - 63 -
2 Secretion of gastrointestinal juicesThroughout the gastrointestinal tract secretory glands are present that subserve two primaryfunctions: first, digestive enzymes are secreted in most areas from the mouth to the distal endof the ileum. Second, mucous glands, from the mouth to the anus, provide mucus forlubrication and protection of all parts of the gastrointestinal tract.
Most digestive secretions are formed only in response of food in the gastrointestinal tract, andthe quantity secreted in each segment of the tract is almost exactly the amount needed forproper digestion. Furthermore, in some parts of the gastrointestinal tract even the types ofenzymes and other constituents are varied in accordance with the types of food present. Thedigestive secretions in response of food in the gastrointestinal tract and the residence time offood in the gastrointestinal tract are discussed in more detail in the next chapters 3-7.
Table 2.1. Daily volumes of fluids ingested, secreted, absorbed and excreted from thegastrointestinal tract.
Gastrointestinal juices Volume ingested and secreted(liters)
Volumeabsorbed and
excreted(liters)
Refs. [35] [27] [22] [26] [35] [27]Ingestion of food/liquid 2.3 2-32 2Saliva 1 1 11 1Gastric juices 2 1.5 21 2.5Bile 1 1 0.6 0.5Pancreatic juices 2 1 1-2 1.5Intestinal juices 1 1 8.3 7-8Brunner’s glands 0.2 0.2Crypts of Lieberkühn 1.8 1.8Large intestine 0.2 0.2 0.9 +
0.11.6 +0.1
1Saliva and gastric juices together amount 3-3.5 liters.2Based on the daily secreted (6.5 L), absorbed (8.6-9.6 L) and excreted volumes (0.1 L), the daily ingestion offluids was calculated to be 2 to 3 L.
Saliva is a fluid that is continuously secreted into the mouth. It helps clean the mouth andteeth. Ordinarily, just enough saliva is produced to keep the mucous membranes of the mouthand pharynx moist. When food enters the mouth, however, secretion of saliva increases. Itlubricates, dissolves, and begins the breakdown of the food.
In the stomach food, saliva, and gastric juices are mixed to form a semi-solid chyme. TheHCl secreted in the gastric juices kills bacteria and denaturates proteins. Enzymes in thegastric juices begin the digestion of proteins and aid the digestion of triglycerides.
Pancreatic juice is secreted most abundantly in response to the presence of semi-solid chymein the duodenum. Pancreatic juice contains enzymes for digesting all three major types ofmacronutrients (protein, fat, carbohydrate). It also contains large quantities of bicarbonateions, which play an important role in neutralising the acid semi-solid chyme emptied by thestomach into the duodenum.

- 64 - RIVM report 320102002
The gallbladder empties its store of concentrated bile into the duodenum when fatty foodsenter the duodenum. Bile acids in the bile play an important role in fat digestion andabsorption. First, bile acids help to emulsify the large fat particles of the food into manyminute particles that can be attacked by the lipases secreted in the pancreatic juice. Andsecond, bile acids aid in the transport and absorption of the digested fat end products to andthrough the intestinal mucosal membrane. Furthermore, bile serves as a means for excretionof several waste products from the blood.
The function of the mucus secreted by Brunner’s glands is to protect the duodenal wall fromdigestion by the gastric juice. The glands secrete mucus in a rapid response to irritatingstimuli to protect the mucosa of the duodenum. Located on the entire surface of the smallintestine are small pits called crypts of Lieberkühn. The intestinal secretions are formed bythe epithelial cells in these crypts at a rate of about 1-1.8 L/day [22, 26, 27, 35]. Thesecretions are almost pure extracellular fluid and have a slightly alkaline pH in the range of7.5 to 8.0. The fluid is rapidly reabsorbed by the villi [26]. This circulation of fluid from thecrypts to the villi obviously supplies a watery vehicle for absorption of substances from thechyme as it comes in contact with the villi, which is one of the primary functions of the smallintestine.
The small intestine normally absorbs each day several hundred grams of carbohydrates, 100gor more of fat, 50 to100 g of amino acids, 50 to 100 g ions, and 7 to 8 liters of water. As aresult 1.5 L of chyme passes through the ileocecal valve into the large intestine each day [27,35]. Most of the water and electrolytes are absorbed in the colon, leaving less than 100 ml offluid to be excreted in the faeces.
Conclusions. The volume of fluids available in the gastrointestinal tract for a compound todissolve in is dependent upon the volume of ingested fluids, secretions and water flux acrossthe gut wall. About 2-3 liters are ingested per day, which is in accordance with the meanintake of adults in the Netherlands [36]. The ingested volume is received together with theendogenous secretions of saliva, gastric juices, pancreatic juices and bile by the first portionof the duodenum. These secretions total about 6 liters per day and are essential for the normalluminal digestion of foodstuffs. Most of these juices are secreted postprandially. In addition,the intestine secretes about 1-2 liters per day, to protect the epithelial cells with mucus and toimprove the contact between the luminal content and the epithelial cells. This fluid is rapidlyreabsorbed. In addition, much fluid (7-8 liters) is already absorbed in the small intestine.Only about 1.5 liters are presented to the colon daily, of which about 1.3 liters are absorbed,with the rest forming a component of the stool.

RIVM report 320102002 - 65 -
3 SalivaSaliva is a fluid that is continuously secreted into the mouth. It helps to keep the mouth andteeth clean. Ordinarily, just enough saliva is produced to keep the mucous membranes of themouth and pharynx moist. When food enters the mouth, however, secretion of salivaincreases. It lubricates, dissolves, and starts the breakdown of nutrients. The effects of foodon the composition and rate of secretion of saliva are summarised in Table 3.1.
Table 3.1. Composition of saliva in rest and stimulated conditions.rest Stimulated
RefsConc(mM)
[37] [39] [45] [27] [47] [28] [49] [37] [40] [45] [27] [47] [28] [49]
K+ 25 30 45 30 >20 18 20 20 20 13Na+ 10 10 3 10 3 85 70-
9060 90 55-
84Ca2+ 2 2 2 2 1.5-
21 1-2 2
Cl- 10-25
15 23-31
10 16 50 50-70
28 45 23-40
HCO3- 10 10 3 10 <3 70 50-
7020-30
55 50
PO43- 5 5.5 2 7 5.5-
144 2-5 5
SCN- 5.5 2-5 1Ureum 3.3 3 2.5Amylase
4EU
0.3-1g/l
Mucin 0.3 1921
0.3 724
pH 6.2-7.4
6.0-7.4
5.6 7.4 7.6 7.6
Rateml/min
0.6 0.4 0.5 0.1 1-10
1.1 0.9 2-10
6
Saliva is secreted into the mouth by the salivary glands. Saliva contains two major types ofprotein secretion: 1) a serous secretion containing an α-amylase for digestion of starches,primarily secreted by the parotid glands, and 2) mucous secretion containing mucin forlubricating purposes secreted by the submandibular and sublingal glands. The daily secretionof saliva normally ranges between 800 and 1500 ml. Saliva pH can range between 6.2 and 7.4(6.35-6.85 [35, 46]), with the higher pH exhibited upon increased secretion [37, 46]. Underbasal conditions about 0.5 ml/min of saliva (mainly mucous type) is produced [27, 37, 41, 44,45, 46]. Upon stimulation such as the presence of a sour taste or smooth objects in the mouth,saliva secretion is increased 4- to 20- fold [27, 42, 45]. The contribution of each gland tosaliva varies with the flow rate: at rest 23% of saliva is produced by the parotid glands whichmay increase up to 50% at a stimulated flow rate [refs in 37]. Furthermore, the activereabsorption of sodium and chloride is decreased in response to a faster flow rate. In generalat higher flow rates, sodium, calcium, chloride, bicarbonate, and protein concentrations(correlated with amylase activity [44]) increase whilst phosphate concentrations and mucin

- 66 - RIVM report 320102002
[45] decrease and the potassium concentrations show little further change (see Table 3.1).Although an increase in amylase activity is in accordance with the higher contribution of theparotid gland to the whole saliva, it was not measured in the literature summarised here. Theconcentration of mucin is higher in young adults, 18-35y, compared to older >65y individuals[45]. In both groups, chewing stimulation decreased the mucin concentration by 50% (Table3.1). The salivary amylase in the swallowed food may continue to act on starches in thestomach for about another hour before the stomach acids inactivate it [35].
Conclusions. Sour taste, chewing, and smooth objects in the mouth stimulate the salivaproduction. In rest condition, the flow rate is approximately 0.5 ml/min, which increases 3 to4-fold upon stimulation with maximal flow rates of 10 ml/min. The composition of the salivais dependent on the flow rate: at higher flow rates, sodium, calcium, chloride, bicarbonate,(and amylase) increase whilst phosphate concentrations and mucin decrease and thepotassium concentrations show little further change.

RIVM report 320102002 - 67 -
4 StomachThe major function of the stomach is to temporarily store food and release it slowly into theduodenum. It processes the food to a semi-solid chyme, which enables better contact with themucous membrane of the intestine, thereby facilitating absorption of nutrients. Gastric aciditykills bacteria and denaturates proteins. Pepsin begins the digestion of proteins and gastriclipase aids digestion of triglycerides.
4.1 Gastric secretionIn the fasted state, basal gastric acid secretion is 2-4 mmol/h (~60 ml) in men and slightlylower in women [28, 50, 51]. The parietal cells in the human stomach produce HCl at aconcentration of 27-40 mM unstimulated but at a concentration of 98-102 mM understimulated conditions [52]. The rate of secretion may increase from 1 ml/min under fastedconditions to 10-50 ml/min immediately after food ingestion [52, 53]. The secretion of acidicfluid continues a slower rate ~ 3ml/min until the stomach is emptied [9, 28, 53]. The majorphysiological stimulus for acid secretion is the ingestion of food, especially if the meal has ahigh protein content. The protein component of the meal possesses the greatest bufferingcapacity.
Pepsins are secreted as their inactive precursors, pepsinogens. Acid automatically cleavesinactive pepsinogen to active pesin and also provides the optimum pH for pepsin activity[51]. Pepsin self-catalyses the formation of additional pepsin from pepsinogen. Pepsinactivity is almost completely abolished above pH 5 as these enzymes are denaturated athigher pH. Human pepsins are endopetidases, and hydrolyse several peptide bonds within theinterior of ingeted protein molecules to form polypeptides but little free amino acid. Pepsinsecretion increases in response to food ingestion [53].
Mucous cells secrete mucus. The major components of mucus are galactose, N-acetylglucosamine and fructose. Mucus protects the gastric mucosa from autodigestion by thepepsin and acid combination in the stomach. It contains bicarbonate, which serves to raise thelocal pH at the site of the epithelium without raising the bulk pH. This produces additionalprotection by inactivating pepsin.
4.2 Gastric pHFasting gastric pH has been well studied, and the generally accepted value is between 1.5 and2 [9, 15, 22, 29, 53]. The gastric pH in the fasted state can fluctuate on a minute-to-minutebasis over a range between pH 1 and pH 7, but in healthy, young subjects the fasting pH was<3 for 90% of the time. Eating of a meal results in a transit rise in gastric pH to pH 3-7 inspite of increased gastric acid secretion, due to the diluting and buffering effect of theingested food components. The stomach volume in fasted state is 20-30 ml [15, 28]. Aftergastric emptying occurs, the gastric pH gradually declines until the fasted-state pHenvironment has been reestablished (usually within 1-2h after ingestion) [29]. The decline ingastric pH is a function of both the ability of the meal to stimulate gastric acid secretion andthe rate at which the meal is emptied from the stomach. Similar profiles were observed inhealthy elderly subjects [54]. However, the time required for gastric pH to return to pH 2 wassignificantly longer when compared with the younger subjects.

- 68 - RIVM report 320102002
Table 4.1. Gastric pH in healthy subjects in preprandial and postprandial state.Preprandial Postprandial
pH Initial pH Time to return to ≤pH 2 (hours)
Number ofsubjects
Reference
6.5 2 1 91.7 5.0 1.8 24 551.5 7 2.5 1 281.5 3.5 1.5 6 571.8 5.0 1.8 10 53
Conclusion. Fasting gastric pH is between 1.5 and 2. Upon eating a meal, the gastric pH risestemporary to pH 3-7. During gastric emptying, the gastric pH gradually declines until thefasted-state pH environment has been reestablished (usually within 1-2 h after ingestion).
4.3 Gastric emptyingStomach emptying is controlled to a great extent by feedback signals from the duodenum.These feedback inhibitory mechanisms slow down the rate of gastric emptying when 1) toomuch chyme is already in the small intestine or 2) the chyme is excessively acid (<pH 3.5),contains too much unprocessed protein or fat, is hypotonic or hypertonic, or is irritating. Inthis context, the following three factors of food ingestion have a major effect on the rate ofgastric emptying: the volume of the meal, its osmotic pressure and its chemical composition.With liquid meals, the rate of emptying is greatest when the volume is greatest, and thatmeans that emptying is fastest at the beginning of digestion of a meal [56]. The fast initialgastric emptying after ingestion of a meal 10-40 ml/min [ref in 22, 28, 56] is followed by amore slow emptying rate of 2-4 ml/min [9, 28, 53]. Low caloric fluids empty from thestomach according to first order kinetics with T1/2 ranging from 10-60 min [5, 12, 18, 28, 30,57]. Consequently, the greatest bulk of gastric content of a liquid meal is delivered to theduodenum before much gastric acidification has occurred.
Composition of the food is important for gastric emptying. The rates of emptying of the threemajor foodstuffs in liquid form are regulated so that equal numbers of calories are deliveredto the duodenum in the same time (2 kcal/min [38, ref 44 in 22]. At a calorie density of 1kcal/ml, about 2-2.5 ml/min are emptied, whereas at 0.2 kcal/ml, about 10 ml/min areemptied [ref 44 in 22]. There are roughly 9 kcal in a gram fat and 4 kcal in a gram ofcarbohydrate or protein. Consequently, an emulsion of 4 g of fat is emptied in the same timeas a solution of 9 g of carbohydrate or protein. Because fat contains the most calories pergram, meals composed largely of fat of any kind may remain in the stomach 20 h [28].Furthermore, it was shown that gastric concentrations of fat and protein may behave in adifferent way due to separation of the liquid test meal in the stomach into two phases, onelower, containing water, sugar, and PEG, and one upper where fat was concentrated [9]. Thisresulted in a much faster emptying of sugar T1/2 was 52 min than for fat T1/2 was 154 min.Furthermore, the digestion products of fat, carbohydrate and protein are the compounds thataffect the receptors in the duodenum, which in turn control the rate of emptying.
The last factor affecting gastric emptying is the osmotic pressure of the meal. The duodenumadjusts the osmotic pressure of its content to isotonicity. This was also found for the osmolarconcentration in the jejunum, which was rather constant around 300 mosm/l despite ingestionof a liquid test meal of 940 mosm/l [9]. In accomplishing isotonicity, gastric emptying is

RIVM report 320102002 - 69 -
regulated by the osmotic pressure of duodenal contents. Therefore, a meal with a higherosmotic pressure will be emptied slower.
Table 4.2 Gastric emptying of liquid and solid phases in the fed state.Food Gastric emptying Ref.
Kcal Liquid/solid Determined by T½ (min) kinetics Completeempty(min)
610 Solid Foodcomponent
linear 285 6
~286 Liquid Glucose/PEGFat
52154
exponential 9
530 Solid
Liquid
Radioactivemarkers
114(men)160
(women)~ 60
Linear
Linear
exponential
12
492661930
Liquid 51CrCl3 138156222
exponential 13
196621
1920196621
1920
Solid
Liquid
Colloid-labeledmarker
Radioactivemarker
771452774081
178
Linear
exponential
58
208 Solidsolid
13070-117
Refsin30
400900
Scintigraphy,0.7-1.2 mm
pellets
119255
Refin30
Semi-Solid(mashedpotatomeal)
Tomographyand
scintigraphy
60 linear 120 min 57
Much information on gastric emptying in the fed state is obtained by gamma-scintigraphy ofsmall pellets or tablets [3, 5, 16, ref 57 in 22] or radio-labeled food [6, 58], or bygastrointestinal tubes in the duodenum and/ or stomach [9, 12, 13, 58]. Half-emptying times(or complete emptying) for solid and liquid meals are summarised in Table 4.2. Solid meals(and nutrient fluids) empty from the stomach according to zero order kinetics, with emptyingdependent on caloric concentration, as was described above for liquid meals. In the distalstomach the particle size of ingested food is reduced to a fluid-like consistency. The size ofthe food particles, which are emptied into the duodenum, is mostly < 2 mm. Because the mealemptying depends on the calorie content, the size of the meal is very important
Consequences for the bioaccessibility of compounds. Generally, delayed gastric emptying hasthe potential to increase absorption of poorly water-soluble compounds by increasing the time

- 70 - RIVM report 320102002
available for dissolution. For acid-labile and ionizable compounds, food increases theresidence time in the acidic environment, which impacts on solubility and stability issues.However, the increase in stomach pH in response to food ingestion makes it difficult topredict the likely overall effect on bioaccessibility. Following a liquid meal, much of the mealis released in the duodenum before acidification of the stomach occurs. This would haveconsequences for compounds that are released from their matrix at low pH.
Conclusions. The gastric emptying is determined by three major factors: the volume of themeal, its osmotic pressure and its the caloric content of the food. The rates of emptying of thethree major foodstuffs (fat, carbohydrate and protein) are regulated so that equal numbers ofcalories are delivered to the duodenum in the same time (2 kcal/min). Fluid meal generallyempty from the stomach according to first order kinetics with T1/2 ranging from 10-60 min.Solid meals empty from the stomach according to zero order kinetics, with emptyingdependent on caloric concentration (T1/2 ranging from 60 – 277 min).

RIVM report 320102002 - 71 -
5 Small intestine5.1 Secretion of bileGallbladder volume, emptying, and refilling was measured by real-time ultrasonography afteringestion of a standard breakfast (40% fat) in 12 healthy men and women. Gallbladderemptying was biphasic: 50% emptying the first 30 min after ingestion of the meal followedby a 3-fold slower emptying. The gallbladder volume remained small until refilling began 4hafter ingestion of the food when gastric emptying neared completion (~13% remained) [6]. Inanother study in 18 healthy volunteers, the gallbladder volume was reduced by 23% and 59%after ingestion of medium chain triglyceride and long chain triglyceride meals, respectively[21].
The bile concentration in the distal duodenum or jejunum was determined using intestinalperfusion techniques. Fasting bile concentrations were in the range 1.5-5 mM in the proximalsmall intestine (Table 5.1). Although fasting bile concentrations were determined after anovernight fast, the stomach was not always completely empty [13], which might result inhigher fasting bile concentrations. Bile concentrations vary widely between individuals butaverage values are similar in the duodenum and jejunum. Levels fall rapidly in the ileumwhere bile salts are absorbed by an active transport mechanism. Although very low, the bilesalt concentration delivered to the colon may significant increase after ingestion of a meal[10].
After eating, the bile output and luminal concentrations were highest in the duodenum 30 minafter ingestion of the meal (contraction of gallbladder), followed by a lower rather constantbile concentration, which declined when the stomach was almost empty [13]. Total dailyoutput increased with the calorie content of the test meal, which was related to the emptyingof the stomach [13]. Comparing the effects of ingesting medium chain triglyceride and longchain triglyceride meals, the jejunal bile acid concentrations increased significantly moreafter the ingestion of long chain triglyceride [21]. However, in another study using mediumchain triglycerides as the main source of fat content [13], bile acid secretion increased within60 min after ingestion of the meal. Overall, mean bile concentrations in the proximal smallintestine vary between 7 and 15 mM after eating as summarised in Table 5.1.
Conclusions. The gallbladder contracts in a reaction to fat entering the duodenum. Thisresults in a peak concentration of bile in the duodenum followed by a lower “constant” bileconcentration. Bile, mostly produced by the liver, is secreted in the duodenum as long asthere is fat in the duodenum. The gallbladder only starts refilling with bile when the stomachis almost empty [6]. The amount of bile secreted by the gallbladder depends on the amountand the type of fat in the duodenum. In the proximal small intestine, fasting bileconcentrations were in the range 1.5-5 mM and increased to 7-15 mM after eating. The bileconcentration was elevated until the food was emptied from the stomach.

- 72 - RIVM report 320102002
Table 5.1 Bile concentrations in the distal duodenum and proximal jejunum.Preprandial state Postprandial state
Bile1,4
(mM)Bilemeasured
Flow2
(ml/min)Ref Bile4
(mM)Bilemeasured
Flow(ml/min)
Ref
1.6 (d) 11-13µmol/min
6.9 10 10.6 (d) 120µmol/min
11.3 10
5.2±2.3(d)
20 14.5(5.2-39.6) (d)
20
2.7-4 (d) 7-10µmol/kg/h
2 19 8-21 (d) 20.8-54.9µmol/kg/h
3 19
1.7 (d)3.3 (d)
393
µmol/kg/h
23
13 7 (d) 18µmol/kg/h
3 13
4 (j) 21 15.25 (j)5.05 (j)
21
12 (d)8.8 (j)
33µmol/min
3.75 7
1 To calculate the bile concentration, it was assumed that the mean body weight was 70 kg. Then the bileconcentration (in mM) was calculated by dividing the bile flow (in µmol/min) over the jejunal flow rate(ml/min).2 The jejunal flow rate was assumed to be 1 ml/min in the fasted state and 3 ml/min in fed state, respectively[22]. A higher flow rate has been used to calculate the bile concentration when the perfusion rate was higherthan the above mentioned flow rates. The flow rates were measured in reference [10].3 Stomach was not completely empty.4Bile concentration was determined in distal duodenum (d) or in jejunum (j)5 Jejunal bile concentration after ingestion of long chain triglyceride and medium chain triglyceride meals were15.2 mM and 5.0 mM, respectively.
5.2 Secretion of pancreatic fluidsPancreatic juice is secreted most abundantly in response to the presence of semi-solid chymein the duodenum. Pancreatic juice contains enzymes for digesting all three major types offood. It also contains large quantities of bicarbonate ions, which play an important role inneutralising the acid semi-solid chyme emptied by the stomach into the duodenum. Theexocrine secretions of the pancreas consist of a high-volume aqueous secretion containingbicarbonate and a low-volume aqueous secretion containing digestive enzymes. The basalflow rate of bicarbonate secretion typically increased from 0.3 ml/min to 4.0 ml/min duringstimulation [ref 165 in 8]. When the flow rate was at a lower value of 0.6 ml/min, theconcentration of bicarbonate was ~25 mEq/L, resulting in a secretion rate of ~1 mEq/h. [ref166 in 8]. The pH of the alkaline fluid entering the duodenum at high output rates is ~8 [ref192 in 8]. The secretion of bicarbonate is largely regulated by the amount of acid entering theduodenum. The activity of lipase is 7 to 10-fold higher than the activity of amylase [7, 9], butthe concentrations of all digestive enzymes in the duodenum increased 2.5 to 5-fold inresponse to stimulation/eating [7, 10, 13]. The concentration of the enzymes in the duodenumwas independent of the caloric intake [10], but increased with caloric content when thecalories were infused directly into the duodenum [7]. This supports the theory that equalnumbers of calories are emptied from the stomach into the duodenum (Chapter 4).
Conclusions. Pancreatic juices are secreted in response to the presence of semi-solid chymein the duodenum. Bicarbonate is secretion to neutralise the amount of acid entering the

RIVM report 320102002 - 73 -
duodenum, whereas the enzymes start the digestion of all three major types of food. Theenzyme concentration increased 2.5 to 5-fold in the duodenum in the response to foodcomponents.
5.3 Transit timeThe small intestinal transit times of various studies are shown in table 5.2. In general, there islittle difference in the mean transit times through the small intestine between the fed andfasted states. Malgelada et al. [59] showed that the intestinal residence profiles for liquid andsolid components of a meal were not significantly different, and that the transit time was inthe order of one to three hours. The Nottingham Group has undertaken various transit studieson a large number of volunteers. The overall mean small intestinal transit time was of theorder of 3-4 hours with a standard deviation of 1 hour [57].
Various techniques have been used to determine the gastrointestinal transit of foodstuffs andmore particularly, pharmaceutical dosage forms. In early studies, radiography was used. Aseries of X-rays was taken of a radiolabeled dosage, for example by inclusion of bariumsulphate, in order to monitor the transit of the dosage form through the different regions ofthe small intestine. The hydrogen breath test relies upon the metabolism of certaincarbohydrate materials, for example lactulose, by the microbial flora within the caecum andlarge intestine. Osmotic effects of the administered material and bacterial overflow in theterminal ileum may cause underestimation of transit times. By using intubation-perfusiontechniques, the small intestinal content can be aspirated at different locations in the smallintestine. In this manner the transit time between aspiration points, with a well-knowndistance from each other, can be calculated. The transit time may be affected by a highperfusion rate. In the γ-scintigraphic method, the dosage from is labelled with a small amountof suitable gamma emitting radionuclide (technetium-99m or indium-111) and the transit ofthe material followed using a conventional gamma camera. The presence of the dosage formin the stomach and its gastric emptying can be well defined and its arrival in the ileocaecalregion is also easy to assess. It is normal practice to take the time for 50% gastric emptyingand the time for 50% colonic filling and to use the difference between these two numbers as atime for small intestinal transit. Small intestinal transit times determined by these techniquesin human subjects are summarised in table 5.2.
Flow of intestinal content in the fasted state is largely intermittent with peaks of flowassociated with passage of an activity front through the segment. Values stay largely between0 and 2 ml/min, with an average of 0.7 ml/min in the jejunum and 0.43 ml/min in the ileum[ref 46 in 22]. After eating, flow rates increase to average of about 3 ml/min and 2 ml/min,respectively, with values ranging from 0-7 ml/min [ref 46 in 22]. A similar jejunal flow rateof 3 ml/min after ingestion of a liquid meal [9]. In another study [21], the postprandial ilealflow was 0.8 ml/min and 2 ml/min after ingestion of medium chain triglyceride and longchain triglyceride meals, respectively.

- 74 - RIVM report 320102002
Table 5.2. Small intestinal transit times.Transit time(min)
Technique Ref
Fasted fed241267
245265
light density pelletshigh density pellets
γ-scintigraphy 3
2401
1981liquid markertablet
γ-scintigraphy 5, 18
74(women)
38 (men)
Lactulose H2 excretion 6
209182
PelletTablet
γ-scintigraphy 16
60 phenol red perfused intubation 21180 radiolabeled foodstuff 59
68-1362
73126
156-228
PEG 400
Barium sulphatePellets
perfused intubationH2 excretion
X-rayγ-scintigraphy
57
1In the presence of high concentrations of mannitol or sodium acid pyrophosphate but not in the presence ofsucrose, the small intestinal transit was significantly reduced.2 For calculation of the small intestinal transit time, it was assumed that the length of jejunum is 2.4 m andlength of ileum is 3.6 m [57 pg 49]. Assuming that the jejunum is about 1 m long and the ileum measures about2 m [35], the small intestinal transit time is ~70 min.
Conclusions. There is little difference in the mean transit times through the small intestinebetween the fed and fasted states. Mean small intestinal transit time is of the order of 3 hours(range 1 to 6 hours). The flow of intestinal content increases ~ 3-fold after ingestion of food.

RIVM report 320102002 - 75 -
5.4 Small intestinal pHReported regional intestinal pH values in healthy human subjects in preprandial andpostprandial states are compiled in Table 5.3. The intestinal pH values are considerablyhigher than gastric pH values due to the neutralization of incoming acid with bicarbonatesecreted by the pancreas. Furthermore, the pH values increase gradually between theduodenum and ileum. In the postprandial state, the pH in the duodenum is lower than that inthe fasted state. No major differences in pH values were found in the jejunum and the ileumupon meal ingestion.
Table 5.3. pH in the small intestine in healthy humans in the preprandial and postprandialstate. [refs in 22, and in 11].
Intestinal site Preprandial pH Postprandial pHDuodenum (mid-distal) 4.9
6.16.36.4
5.25.45.1
Jejunum 4.4 – 6.56.6
5.2 – 6.06.2
Ileum 6.56.8 – 8.07.4
6.8 – 7.86.8 – 8.07.5
Conclusions. The pH values in the small intestine gradually increase between duodenum andileum, from pH 5.5 to 7.5. In the duodenum, the pH after eating is lower 5-5.5 than comparedto the fasted state pH 6. However, in the jejunum no major differences in pH 6-6.5 werefound upon ingestion of a meal.

- 76 - RIVM report 320102002
6 Food6.1 Food intake for a hot meal by adults in the NetherlandsMean intake of energy and macronutrients per hot meal in men and women in theNetherlands are based on the food consumption measurements (VCP) [36]. The mean data inTable 2 pages 52-73 of the VCP were used to calculate the overall means without using aweighing factor. Based on the individual intake of a hot meal, the median and the 5 and 95percentile were calculated 736 kcal, 299 kcal and 1486 kcal, respectively. These values canbe used to estimate a hot meal with low caloric intake, which will have a short residence timein the stomach, and a hot meal with high caloric intake, which will have a long residence timein the stomach (Table 4.2). These values will be used to estimate the amount of food to beused in the in vtiro digestion model to simulate a low, normal and high food intake.
Table 6.1. Mean intake of energy and nutrients per hot meal in men and women aged 19-65in the Netherlands.
Intake hot meal Intake hot meal per 100gMean mean
Kcal 816 106Protein (g) 39 5.1Carbohydrate (g) 75 9.8Fat (g) 39 5.0Water (g) 604 78.8Fiber (g) 9 1.2Total weight (g) 766 100
6.2 Digestion of macronutrientsCarbohydrate digestion. In the mouth, salivary amylase converts starch (polysaccharide) intosmaller fragments of starch. Salivary amylase may continue in the stomach for a while, aslong as the pH is high, so that up to 35% to 48% of starch can be broken down into smallerfragments in the stomach [28]. The acidic pH of the stomach destroys salivary amylase andblocks its activity. Thus few starches are reduced to maltose by the time chyme leaves thestomach. Those starches not already broken down into di- or trisaccharides or α-dextrins (5-10 glucose units) are cleaved by pancreatic amylase. Amylase acts on both glycogen andstarches but not on cellulose. Brush border enzymes digest the di-, trisaccharides, and the α-dextrins into monosaccharides, which can be absorbed.
Protein digestion. In the stomach, pepsin converts proteins to peptides (small fragments ofproteins). When radioiodinated human serum albumin (RISA) was added to a liquid mealtaken by normal men, samples recovered by tube from the region of the pylorus contained 85-90% of the administered 131-I in a form precipitable by 5% phosphotungstic acid. Thismeans that the largest part of protein digestion occurs beyond the stomach [28]. Enzymes inpancreatic juice, trypsin, chymotrypsin, carboxypeptidase and elastase, continue to breakdown proteins into peptides. Protein digestion is completed by the peptidases in the brushborder (aminopeptidase and dipeptidase).
Lipid digestion. Lipid digestion is the result of three sequential processes involving i)dispersion of fat globules into a coarse emulsion of high surface area, ii) enzymatichydrolysis of the fatty acid glyceryl esters (primarily triglyceride lipid), and iii) dispersion of

RIVM report 320102002 - 77 -
the products of lipid digestion into an absorbable form. In an adult, most lipid digestionoccurs in the small intestine, although some occurs in the stomach through the action oflingual and gastric lipases.i) Lingual lipase secreted by the salivary gland and gastric lipase secreted by the gastric
mucosa are responsible for initiating hydrolysis of ingested triglyceride to thecorresponding diglyceride and fatty acid within the stomach. Liberation of theseamphiphilic lipid digestion products, in combination with the shear produced by antralcontraction and gastric emptying, facilitates formation of a crude emulsion thatempties into the duodenum.
ii) The presence of lipid in the duodenum stimulates secretion of bile salts, biliary lipids,and pancreatic juice. Biliary lipids adsorb to the surface of the crude emulsion,stabilising it and further reducing droplet size to about 1 mm. Subsequently, themajority of triglyceride hydrolysis occurs under the action of pancreatic lipase, whichrequires the presence of colipase to be active in the presence of bile salts. It is aninterfacial enzyme that acts at the surface of the emulsified triglyceride droplets toquantitatively produce the corresponding 2-monoglyceride and two fatty acids. Thesedigestion products are effective emulsifying agents, and because fatty acid promotesbinding of the lipase/colipase complex to the emulsion surface, the lipolytic process isessentially selfpromoting.
iii) Phospholipids are hydrolysed to the corresponding lysophospholipids byphospholipase A2 prior to absorption, and in quantitative terms, the majority ofphospholipid reaches the gastrointestinal tract via biliary secretion with only modestinputs from dietary sources.
Conclusions. Although the chyme entering the small intestine contains partially digestedcarbohydrates, proteins and lipids, the completion of the digestion of carbohydrates, proteinsand lipids is a collective effort of pancreatic juice, bile, and intestinal juice in the smallintestine.
6.3 Absorption of nutrientsDigestion of food from the mouth through the small intestine is directed toward changingfood into forms that can pass through the epithelial cells lining the mucosa into theunderlying blood and lymphatic vessels. These forms are monosaccharides (glucose, fructose,and galactose) from carbohydrates; single amino acids, dipeptides and tripeptides fromproteins; and fatty acids, glycerol, and monoglycerides from triglycerides. Facilitateddiffusion or active transport mediates absorption of monosaccharides. Most proteins areabsorbed as amino acids or di/tripeptides by active transport processes that occur mainly inthe duodenum and jejunum. About half of the absorbed amino acids are present in food,whereas the other half comes from proteins in digestive juices and dead cells that slough offthe mucosal surface. Although the specific absorption mechanisms have not been elucidated,the common role of mixed micellar phase in solubilising poorly water-soluble lipid digestionproducts and providing a concentration gradient for absorption of monomeric lipids isgenerally accepted [see refs in 8]. Micelles are not absorbed intact and lipids are thought tobe absorbed from a monomolecular intermicellar phase. In support of the importance of theintermicellar phase, concentrations of cholesterol several times higher than the saturatedaqueous solubility can be achieved in the intermicellar environment. The dissociation ofmonomolecular lipid from the mixed micellar phase prior to absorption may be stimulated bya microclimate of lower pH associated with the absorptive site. Although evidence is

- 78 - RIVM report 320102002
mounting to suggest that uptake of lipid digestion products may not be entirely via simplediffusion, further work is required to clearly define the factors and processes involved.
About 90% of all absorption of nutrients takes place in the small intestine. The other 10%occurs in the stomach and large intestine. Any undigested or unabsorbed material left in thesmall intestine passes on to the large intestine. By infusion of proportions of protein, fat, andcarbohydrate directly into the duodenum, it was found that fat is more rapidly absorbed thancarbohydrate or protein [7]. Within the first 60 cm of the small intestine (mean transit time 31min), about 80% of protein and more than 90% of carbohydrate and fat was absorbed. Inanother study, the absorption of sugar, fat, and protein were determined during passage ofupper 75 cm of the small intestine in a healthy volunteer [9]. Less fat (53.1%) was absorbedthan sugar (81.5%) in the upper 75 cm of the small intestine during 4 hours after consumptionof the liquid meal. The lower fraction of fat absorbed during this period was mostly due to thedelayed gastric emptying of fat compared to sugar.
Conclusions. Approximately 90% of all absorption of nutrients occurs in the duodenum andjejunum.
6.4 Impact of differences in pre- and postprandial gastrointestinal state onbioaccessibility of compounds.
Although physical and chemical interactions may occur between compounds and specificfood components, altered postprandial absorption is generally a function of the changesassociated with conversionfrom the fasted to the fed state. Changes due to to i) secretion ofgastric acid and bile and pancreatic fluids, ii) modification of gastric and intestinal motilitypatterns, and iii) alterations in visceral blood and lymph flow have the most significantimpact on absorption.
The pH differences in the contents of the upper gastrointesinal tract between fed and fastedstates can influence the dissolution and absorption of weakly and acidic and basiccompounds. The dissolution rate of weak bases is typically greater in gastric fluids than in theintestine in the fasted state, whereas that of weak acids is at a minimum in the stomach andincreases as undissolved compound is transported to the less acidic regions of the intestine.Therefore, elevation of gastric pH following a meal may enhance the dissolution of a weakacid in the stomach but inhibit that of a weak base. Furthermore, because food inhibits therate of gastric emptying, prolonged retention in the stomach may increase the proportion ofcompound that dissolves prior to passage into the small intestine. The primary site of drugabsorption is usually the small intestine because of its greater mucosal surface area and rangeof transport mechanisms, so the class of compounds most vulnerable to pH-related changesin post-prandial absorption are poorly water-soluble weak bases.
Lipids are a major constituent of food that can inluence the absorption of compounds.Ingested lipid decreases gastric motility, and the presence of lipid digestion products withinthe upper small intestine induces secretion of biliary and pancreatic fluids that dramaticallyalter the luminal environment. The presence of bile may improve the bioavailability of poorlywater soluble compounds by enhancing the rate of dissolution and/ or solubility. An increasein the rate of dissolution can occur by an effective increase in surface area (enhanced wetting)or an increase n solubility via micellar solubilisation. Hasegawa et al. [ref 140 in 8], studiedthe effect of food on the bioavailability of nicotinate prodrug of vitamin E (alpha-tocopheryl

RIVM report 320102002 - 79 -
nicotinate) in humans. The oral bioavailability was 28-fold increased due to improveddissolution and solubilisation. Oral bioavailability of etrinate increased 3-5 fold whenadministered with a high fat meal or milk compared with fasted administration (Refs 146 and147 in 8]. The amount of parent compound increased whereas the metabolism of etrinateseemed to be reduced. Another factor affecting the postprandial absorption of highlylipophilic compounds is the stimulation of lymphatic transport. The rate of fluid transport inthe intestinal lymphatics is ~0.2% (v/v) compared with portal blood [ref 132 in 8].Consequently, the major factors for lymphatic transport to be significant contributor tobioavailability include coadministraiton of a lipid source, metabolic stability, and sufficientlyhigh lipophilicity. In terms of a “ball mark” estimate, the log P of the compound needs to be>5, with a triglyceride solubility of at least 50 mg/ml, before lymphatic transport is likely tobe a major contributor to bioavailability [refs 116 and 133 in 8]. Examples of compounds thatare transported (to varying degrees) by the intestinal lymphatics include lipophilic vitaminsand vitamin derivatives, xenobiotics such as DDT and related analogues, benzo-[a]-pyrene,and numerous lipophilic prodrugs [Refs 25, 118, 127, 128, 129, 130 in 8].

- 80 - RIVM report 320102002
7 Proposal for In vitro digestion model to mimic thefasted and fed state in humans.
The in vitro digestion model, developed in our laboratory, is based on the model described byRotard et al. [33]. This model simulates the physiological conditions of the gastrointestinaltract from mouth to the small intestine in the fasted state. As described in the previouschapters, ingestion of food greatly affects the physiological conditions in the gastrointestinaltract. Therefore, the in vitro digestion model will have to undergo some alterations tosimulate the fed state of the gastrointestinal tract. Possible changes compared to the present invitro digestion model and compared to the recipes described by Rotard et al. [33] areindicated in chapters 7.1 and 7.2.
7.1 Volumes of ingested and secreted fluids
The volume of fluids available in the gastrointestinal tract for a compound to dissolve in isdependent upon the volume of ingested fluids, secretions and water flux across the gut wall.About 2-3 liters are ingested per day, which is in accordance with the mean intake (2.4 liters)by adults in the Netherlands [36]. The ingested volume is received together with theendogenous secretions of saliva, gastric juices, pancreatic juices and bile by the first portionof the duodenum. These endogenous secretions total about 6 liters per day and are essentialfor the normal luminal digestion of foodstuffs. Most of these juices are secretedpostprandially. In addition, the small intestine secretes about 1-2 liters per day, to protect theepithelial cells with mucus and to improve the contact between the luminal content and theepithelial cells. The volume of the small intestinal secretions was taken into account in the invitro digestion model developed for ingestion of soil by children. However, the compositionof the pancreatic/small intestinal juice did not change from the pancreatic juice. As the fluidsecreted by the small intestine is rapidly reabsorbed [27] and already much fluid is absorbedin the small intestine (Table 2.1, chapter 2), it was now discussed not to take these volumes(fully) into account for the total volume available for a compound to be released in from itsmatrix. It is, therefore, proposed to use the daily-secreted volumes described by Tortora [35]as the basis for the in vitro digestion models in project V/630030. The same ratio of secretedfluids has been used by Rotard et al. [33].
Table7.1. Comparison of the volumes (to be) used in the in vitro digestion model with thedaily volumes of fluids ingested and secreted from the gastrointestinal tract according toTortora.Compartment
Volume in liters
Tortora[35]
Rotard[33]
FastedChild“soil”model[34]
FastedAdult1
FedAdult1
Ingestion of food/liquid 2.3 1.5 (1-2)Saliva 1 1 1 1 1Gastric juices 2 2 1.5 2 2Bile 1 1 1 1 1 (0.5-1)Pancreatic juice 2 2 3 2 21 Proposal for ratio of the volumes in each compartment to be used in project V/630030.

RIVM report 320102002 - 81 -
Although the daily mean volume of food and liquids ingested, as determined by watercontent, is 2.4 liters for adult man and women (19-65 years), half of the daily volume intakeis consumed in between meals (1.2 liter) [36]. On the other hand, most of the gastrointestinaldigestion juices are secreted in reaction to food consumption. As the water content in the hotmeal is ~80%, a total weight of food ingested per day can be calculated of 1.2 liters x100%/80% is 1.5 kg (liters). We propose, therefore, to use the following weight (volume)ratios: food/saliva/gastric juice/ bile/pancreatic juice is 1.5/1/2/1/2 (see Table 7.1). To applyin the in vitro digestion model, the unit is 6 g (cq 6 ml) so that it is estimated that a doubleamount of food can be used in our system (max of 60 ml).
7.2 Proposed alterations of the in vitro digestion model as result of foodFor fasted conditions in adults the ration of secreted fluids is according to Tortora and Rotard(Table 7.1). The major changes in composition of the fluids, volume ratio, and incubationtime of the various steps in the in vitro digestion model as result of food are shown in Table7.2. These changes are based on the physiological data reviewed in Chapters 2-6. Unlessotherwise stated, it is assumed that the concentration of ions do not change from the fasted tofed state. The changes are shorlty discussed below and are compared to other in vitrodigestion models.
Table 7.2 Proposal for changes of the in vitro digestion model as result of food ingestion.Digestion phase Composition Volume Incubation timeFood Standard:
protein/carbo/fat=1/2/1 (w/w/w)1.5
Saliva Amylase 2x↑, Na+↑, Cl-↑,HCO3
-↑, mucin↓, pH↑ (lipase)1 0-5 min
Stomach Pepsin 2-3x↑pH 5 (3-7) →(60-120 min)→pH2
2 <300 kcal: 2h450-700 kcal: 4-7h>900 kcal: 6-20h
Bile Standard meal: 8 mMFat meal: 15 mM
1
Pancreas Enzymes 2-3x↑, bicarbonate↑(mucin)
2
2h
Food. On average, the adult population in the Netherlands consumes equal amounts ofprotein and fat and a double amount of carbohydrates when eating a warm (evening) meal(see Chapter 6.1, Table 6.1). By reducing the intake (reducing the ratio of volume of food) alow caloric meal can be obtained. A high caloric meal can be obtained by doubling theamount of food intake or by addition of extra oil to the standard meal. We thought of usingOlvarit infant formulas as a standard meal since the food is ready for use and natural productssuch as meat, vegetables and potatoes/rice/pasta are the source for protein, carbohydrate andfat contents. A selection of Olvarit infant formula products is shown in table 7.3. Theproducts were selected based on the caloric content and composition of the macronutrients.All the Olvarit infant formula products are low in energy content: 280 kJ-359 kJ compared tothe mean VCP intake of 445 kJ/100 g. Product 451 has a composition of macronutrients(protein/carbohydrate/fat), which is comparbale to the mean consumption. However, theenergy content is only 63% of the mean intake. The other food products have relatively toomany carbohydrates and far too little fat compared to our consumption profile. By addition of2-2.5 g oil (fat) the products 404, 452, 455 and 282 are comparable: the energy content is

- 82 - RIVM report 320102002
within 5-105 of the mean VCP intake, however, the relative carbohydrate content remainshigh (carbohydrate: protein = 2.5-2.9 instead of 1.9). Product 224 has the right proportion ofthe macronutrients, after 1 g fat is added, but 15% less energy content than the mean VCPintake. Table 7.3. Composition of macronutrients in several Olvarit infant formulas (analysis per100g food). Food (productnumber)
kJ Protein Gram
Carbohydrate Gram
Fat Gram
Remark
Meanintake VCP
445 5.1 9.8 5.0 1.2 g fiber
451 280 3.0 7.0 3.0 404 340
434 4.0 4.0
11.5 11.5
2.0 4.5
Addition of2.5 g fat
224 350 388
4.5 4.5
9.0 9.0
3.5 4.5
Addition of1 g fat
452 350 425
4.0 4.0
11.0 11.0
2.5 4.5
Addition of2 g fat
455 330 424
4.4 4.4
11.0 11.0
2.0 4.5
Too muchfiber? Addition of2.5 g fat
282 359 434
4.1 4.1
11.4 11.4
2.6 4.6
Addition of2 g fat
The Olvarit infant formulas (> 15 months) contain 3 to 4.5 mg protein / 100g. This is lowerthan the mean intake of protein by adults during the hot meal (5.1 g protein/100g, Table 7.3).Based on the protein content in Olvarit food products, a protein concentration of 10-15 mg /ml stomach content is calculated ((1.5/4.5)x(3-4g/100g)). This protein concentration per totalvolume in the stomach is rather low but within the range compared to in vivo studies: 10-15mg protein / ml (9 g protein / 300 ml food + 300-600 ml gastric secretions) [9], 37-50 mgprotein/ml (33.3 g protein / 300 ml food + 300-600 ml gastric secretions) [12], 28 mg/ml (16g protein / 540 ml gastric emptying) [21].
Compared to other in vitro digestion models, the protein content per total gastric volume was38 mg protein / ml (4 g protein / 10.5 ml) [31]. Based on dry matter / gastric volume 58 mg/ml (7 g dry matter /120 ml) [32A], and 200 mg/ml (60 g dry matter / 300 ml) [Minekuschapter 4] compared to our proposal 47 mg/ml (14 g dry matter / 100 g food x 1.5/4.5). Inconclusion, the protein and dry matter content is, although low, in a similar range as other invitro digestion models use.
Saliva. The composition of saliva under stimulated conditions can be changed as wasproposed by Marieke Hofhuis. The concentrations of potassium, phosphate and thiocyanatecan be kept the same. Although I have thus far no numbers for the change in amylase activitywhen a stimulated saliva is produced, several papers mention that amylase is increased,

RIVM report 320102002 - 83 -
which is in accordance with the doubled contribution of the parotid glands to the whole saliva(Chapter 3). The concentration of mucin may be reduced compared to resting conditions [45].The saliva pH under stimulated conditions is slightly increased compared to restingconditions (Chapter 3). Therefore, the saliva pH may be increased to pH 6.8 ± 0.2. Thus, thecomposition of saliva to simulate stimulated conditions is proposed to change as follows: Na+
(57 mM), Cl- (37 mM), and HCO3- (20 mM), amylase (290 mg/1000 ml), mucin 25 mg /
1000 ml), and pH 6.8 ± 0.2.
Alternatively, lipase may be added to the saliva to start the digestion of lipids (see chapter 3)and the incubation time with saliva may be reduced to 0 min. In the time all the tubes arefilled with saliva, the tubes have incubated for a few minutes with saliva. As the pH in thestomach in the fed state is much higher than in the fasted state, digestion of carbohydrates byamylase may continue in the stomach until the pH is lowered to a pH of 2. For practicalreasons, all the tubes can be filled with saliva and immediately after that add the first portionof gastric juice.
Stomach. Pepsin secretion increases in response to food ingestion [53]. Several other in vitrodigestion models use 1 mg/ml [32], 1.25 mg/ml [24, 31], 3 mg/ml [30], whereas we use 1 mgpepsin/ml gastric juice, which is subsequently diluted by saliva resulting in 0.67 mgpepsin/ml. The concentration of pepsin will be even further diluted by addition of food.Therefore, the concentration of pepsin in the gastric juice should be 3-fold increased.
The initial high stomach pH after eating is caused by dilution of the gastric volume by thefood and saliva and by the H+ binding capacity of the food. The gastric volume under fastedconditions is only 20-30 ml [15, 28], but gastric secretions are increased in response to food.This can be simulated by an initial addition of a small volume of gastric juice, for example0.5 unit (3 ml), followed by the rest of the gastric juice (1.5 unit, 9 ml) after 60-120 min. Inthis way, the initial high stomach pH (pH 5 ± 2) followed by a lower stomach pH (pH 2) mayalso be simulated.
Bile. In the proximal small intestine, bile concentrations under fasting conditions were in therange of 1.5-5 mM and increased to 7-15 mM after eating (Chapter 5, Table 5.1). The bileconcentration was elevated until the food was emptied from the stomach. The secretion ofbile is dependent on the amount and type of fat (Chapter 5.1). The concentration of bile in the“soil”digestion model is 1.7 mM (1.8 g bile = 3.6 mmol/300 ml x 9 ml/58.5 ml), which iswithin the range of bile concentration in the fasted state (Chapter 5.1). It is proposed toincrease the concentration of bile to 8 mM in the chyme after eating a standard meal and to15 mM after eating a fat meal. Thus, the concentrations of bile in the bile solutions should be60 mM (8x1 vol/ 7.5 vol) and 112.5 mM, respectively. The bovine bile is a mixture ofglycine and taurine conjugated salts and, therefore, a mean molecular weight of bile salts of500 can be calculated. This results in weighing 3 g and 5.6 g bile / 100 ml bile solution toobtain 8 mM and 15 mM bile in the chyme, respectively. By proceeding this way, the actualbile salt concentration in the chyme will be lower since the exact bile salt concentration in thecommercial bile extract is unknown but is garantueed to be higher than 55% according to theproduct sheet of Sigma. In other in vitro digestion models the concentration of bilemimicking the fed state was 10 mM in jejunum [2], 5.8 - 7.8 mM [32A en 32B], 4 mM [31],3 mM [30], 1 mM (fasting conditions) [33], 2.8 mM [24].
Pancreatic juice. Pancreatic juices are secreted in response to the presence of semi-solidchyme in the duodenum. The amount of bicarbonate secreted is as much as is needed to

- 84 - RIVM report 320102002
neutralise the amount of acid entering the duodenum. The concentration of bicarbonate islikely to be increased but the amount depends on the H+ binding capacity of the gastriccontent that is emptied in the duodenum (thus likely to depend on the type of food and theamount of food).
The concentrations of digestive enzymes increased 2.5 to 5-fold in the duodenum in theresponse to food components (Chapter 5.2). In the pancreatic secretions, the activity of lipaseis 6 to 10-fold higher than the activity of amylase [7,9,10,13]. In the porcine pancreatin,which is added in the digestion model, the activity of amylase is higher than the activity oflipase. Humans with pancreas insufficiency (not included insulin) are supplied withpancreatine pellets from porcine origin [61]. In these pellets the activity of lipase is similar toor slightly higher than the activity of amylase [61]. Besides pancreatin also lipase is added inthe digestion model, which more than doubles the lipase activity (from 8.3 U/ml to 19.8U/ml) in the chyme. This activity is 15 to 100-fold lower than reported in vivo [7, 9, 10, 13].However, in other in vitro digestion models similar concentrations of pancreatin were used tomimick the fed state (in mg but corrected for USP activity): 3.9 mg/ml [32A en 32B], 1.32mg/ml [31], 1 mg/ml [30], 1 mg/ml (fasting conditions) [33], 2 mg/ml [24]. Although thisdifference in activity with the in vivo situation, we propose, based on the 2.5 to 5-foldincrease in vivo in response to food, to increase the amount of pancreatin to 3 mg/ml chymeand to increase the amount of lipase to 0.5 mg/ml chyme. The amount of lipase may befurther increased to 1 mg/ml in case of a fat, high caloric meal. Furthermore, mucin may beadded to the pancreatic juice to simulate the secretion of mucus by the Brunner glands in thesmall intestine (chapter 2).

RIVM report 320102002 - 85 -
References1 Food-effect bioavailability and bioequivalence studies. Draft Guidance. US Department of
Health and Human Services, Food and Drug Administration, Center for Drug Evaluation andResearch (CDER), October 1997
2 Development and validation of a dynamic model of the gastrointestinal tract. Post-DocteralThesis. M. Minekus, 1998
3 JE Devereux, JM Newton, MB Short. The influnce of density on the gastrointestinal transit ofpellets. J. Pharm. Pharmacol., 42: 500-501, 1990
4 BN Singh. Effects of food on clinical pharmacokinetics. Drug disposition. Clin.Pharmacokinet.,37 (3) 213-255, 1999
5 DA Adkin, SS Davis, RA Sparrow, PD Huckle, AJ Phillips, IR Wilding. The effects ofpharmaceutical excipients on small intestinal transit. Br. J. Clin. Pharmac., 39: 381-387, 1995
6 M Lawson, GT Everson, W Klingensmith, F Kern, Jr. Coordination of gastric and gallbladderemptying after ingestion of a regular meal. Gastroenterology, 85: 866-870, 1983
7 G Holtmann, DG Kelly, B Sternby, EP DiMagno. Survival of human pancreatic enzymesduring small bowel transit: effect of nutrients, bile acids, and enzymes. Am. J. Physiol., 273:G553-G558, 1997
8 WN Charman, CJH Porter, S Mithani, JB Dressman. Physicochemical and physiologicalmechanisms for the effects of food on drug absorption: the role of lipids and pH. J. Pharm.Sci., 86: 269-281, 1997
9 C Johansson, HO Lagerlöf, K Ekelund, N Kulsdom, I Larsson, B Nylind. Studies ofgastrointestinal interactions. III Determination of gastric secretion, intestinal absorption,intestinal transit time and flow of water in man. Scand. J. Gastroent., 7: 489-499, 1972
10 OB Schaffalitzky de Muckadell, O Olsen, P Cantor, E Magid. Pancreas, 1: 536-543, 198611 VA Gray. Change of pH requirements for simulated intestinal fluid TS. Pharmacopeial
Forum, 22: 1943-1945, 199612 R Notivol, I Carrio, L Cano, M Estorch, F Vilardell. Gastric emptying of solid and liquid
meals in healthy young subjects. Scand. J. Gastroenterol.., 19: 1107-1113, 198413 H Brunner, TC Northfield, AF Hofmann, VLW Go, WHJ Summerskill. Gastric emptying and
secretion of bile acids, cholesterol, and pancreatic enzymes during digestion. Duodenalperfusion studies in healthy subjects. Mayo Clin. Proc., 49: 851-860, 1974
14 D Fleisher, C Li, Y Zhou, L-H Pao, A Karim. Drug, meal and formulation interactionsinfluencing drug absorption after oral administration. Clinical implications. Drug Interactions.Clin Pharmacokinet 36: 233-254, 1999
15 D Hörter, JB Dressman. Influence of physicochemical properties on dissolution of drugs inthe gastrointestinal tract. Adv. Drug Del. Rev., 25: 3-14, 1997
16 AJ Coupe, SS Davis, IR Wilding. Variation in gastrointestinal transit of pharmaceuticaldosage forms in healthy subjects. Pharm. Res., 8: 360-364, 1991
17 TC Northfield, I McColl. Postprandial concentrations of free and conjugated bile acids downthe length of the normal human small intestine. Gut, 14: 513-518, 1973
18 FN Christensen, SS Davis, JG Hardy, MJ Taylor, DR Whalley, CG Wilson. The use ofgamma scintigraphy to follow the gastrointestinal transit of pharmaceutical formulations. J.Pharm. Pharmacol., 37: 91-95, 1985
19 TC Northfield, AF Hofmann. Biliary lipid output during three meals and an overnight fast.Relationship to bile acid pool size and cholesterol saturation of bile in gallstone and controlsubjects. Gut, 16: 1-17, 1975
20 O Fausa. Duodenal bile acids after a test meal. Scand. J. Gastroent., 9: 567-570, 197421 SD Ladas, PET Isaacs, GM Murphy, GE Sladen. Comparison of the effects of medium and
long chain triglyceride containing liquid meals on gall bladder and small intestinal function innormal man. Gut, 25: 405-411, 1984
22 JB Dressman, GL Amidon, C Reppas, VP Shah. Dissolution testing as a prognostic tool fororal drug absorption: immediate release dosage forms. Pharm. Res., 15: 11-22, 1998

- 86 - RIVM report 320102002
23 MV Ruby, A Davis, JH Kempton, JW Drexler, PD Bergstrom. Lead bioavailability:dissolution kinetics under stimulated gastric conditions. Environ. Sci. Technol., 26: 1242-1248, 1992
24 MV Ruby, A Davis, TE Link, R Schoof RL Chaney, GB Freeman, P Bergstrom.Development of an in vitro screening test to evaluate the in vivo bioaccessibility of ingestedmine-waste lead. Environ. Sci. Technol., 27: 2870-2877, 1993
25 RP Glahn, OA Lee, A Yeung, MI Goldman, DD Miller. Caco-2 cell ferritin formationpredicts nonradiolabeled food iron availability in an in vitro digestion/Caco-2 cell culturemodel. J. Nutr., 128: 1555-1561, 1998
26 JA Bernards, LN Bouman. Fysiologie van de mens. 6th ed. Houten: Bohn Stafleu vanLoghum, 1994. (Vegetatieve fysiologie/bouwstofwisseling)
27 AC Guyton. Textbook of medical physiology. Eighth edition, 1991, Philadelphia USA, WBSaunders Company
28 HW Davenport. Physiology of the digestive tract. 3rd Ed. Yearbook medical publishers,Chicago, 1984. (Chapter 13: Gastric digestion and emptying; absorption.)
29 JB Dressman. Comparison of canine and human gastrointestinal physiology. Pharm. Res., 3:123-131, 1986
30 G Zarate, AP Chaia, S Gonzalez, G Oliver. Viability and ß-galactosidase activity of dairypropionibacteria subjected to digestion by artificial gastric and intestinal fluids. J. Foodprotection, 63: 1214-1221, 2000
31 RP Glahn, EM Wien, DR van Campen, DD Miller. Caco-2 cell iron uptake from meat andcasein digests parallels in vivo studies: use of a novel in vitro method for rapid estimation ofiron bioavavilability. J. Nutr. 126: 332-339, 1996
32 A Hack, F Selenka. Mobilization of PAH and PCB from contaminated soil using a digestivetract model. Tox. Letters, 88: 199-210, 1996
33 W Rotard, W Christmann, W Knoth, W Mailahn. Bestimmung der resorptionsverfügbarenPCDD/PCDF aus kieselrot. Simulation der digestion mit böden. UWSF – Z. Umweltchem.Ökotox, 7: 3-9, 1995
34 AJAM Sips, MA Bruil, CJG Dobbe, E van de Kamp, DPKH Pereboom, AG Oomen, CJMRompelberg, MJ Zeilmaker. Bioaccessibility of contaminants from ingested soil in humans. I.Project definition, optimization of an in vitro digestion model, bioaccessibility of lead andbenzo[a]pyrene. Report no 711701 012. National Institute of public Health and theEnvironment, Bilthoven the Netherlands, 2001
35 GJ Tortora and SR Grabowski. Principles of anatomy and physiology, Eighth Edition,HarperCollins Publishers Inc., 1996
36 Zo eet Nederland. Resultaten van de voedselconsumptiepeiling 1997-1998, Voedingscentrum,Den Haag, 1998
37 KM Höld, D de Boer, J Zuidema, RAA Maes. Saliva as an analytical tool in toxicology.(15/03/1999) [Web Page]. Available at http://big.stpt.usf.edu/~journal/hold.html
38 JN Hunt, DF Stubbs. The volume and energy content of meals as determinants of gastricemptying. J. Physiol., 245: 209-225, 1975
39 E Salvolini, L Mazzanti, D Martarelli, R di Giorgio, G Fratto, G Curatola. Changes in thecomposition of human unstimulated whole saliva with age. Aging Clin. Exp. Res., 11: 119-122, 1999
40 U Kedjarune, P Migasena, S Chanbumrung, P Pongpaew, R Tungtrongchitr. Flow rate andcomposition of whole saliva in children from rural and urban Thailand with different cariesprevalence and dietary intake. Caries Res., 31: 148-154, 1997
41 C-K. Yeh, DA Johnson, MWJ Dodds. Impact of aging on human salivary gland function: acommunity-based study. Aging Clin. Exp. Res., 10: 421-428, 1998
42 JF Prinz, PW Lucas. An optimization model for mastication and swallowing in mammals.Proc.R.Soc.Lond.264: 1715-1721, 1997
43 =3744 YMC Henskens, PAMvan den Keijbus, ECI Veerman, GA van der Weijden, MF
Timmerman, CM Snoek, U van der Velden, AV Nieuw Amerongen. Protein composition ofwhole and parotid saliva in healthy and periodontitis subjects

RIVM report 320102002 - 87 -
45 M Navazesh, RA Mulligan, V Kipnis, PA Denny, PC Denny. Comparison of whole salivaflow rates and mucin concentrations in healthy Caucasian young and aged adults. J. Dent.Res., 71: 1275-1278, 1992
46 JL Chicharro, A Lucia, M Perez, AF Vaquero, R Urena. Saliva composition and excercise.Sports Med. 26: 17-27, 1998
47 A Van Nieuw Amerongen, LFE Michels, ECI Veerman, A Vissink. Speeksel enmondgezondheid. Amsterdam: VU uitgeverij, 1994
48 =2849 Geigy Scientific Tables. 8 ed. C Lentner and K Diem, J Seldrup, Basle: CIBA-Geigy, 198150 M Feldman, G Barnett. Dig. Dis. Sci., 36: 866-869, 199151 CG Wilson and N Wahington. Physiological pharmaceutics. Biological barriers to drug
absorption. Ellis Horwood Limited, Chischester, England, 198952 =4953 J-R Malagelada, GF Longstreth, WHJ Summerskill, VLW Go. Measurement of gastric
functions during digestion of ordinary solid meals in man. Gastroenterology, 70: 203-210,1976
54 TL Russell, RR Berardi, JL Barnett, LC Dermentzoglou, KM Jarvenpaa, SP Schmaltz, JBDressman. Pharm. Res., 10: 187-196, 1993
55 JB Dressman, RR Berardi, LC Dermentzoglou, TL Russell, SP Schmaltz, JL Barnett, KMJarvenpaa. Upper gastrointestinal (GI) pH in young, healthy men and women. Pharm. Res., 7:756-761, 1990
56 JN Hunt, WR Spurrell. The pattern of emptying of the human stomach. J. Physiol., 113: 157-168, 1951
57 Drug delivery to the gastrointestinal tract. Eds JG Hardy, SS Davis, CG Wilson, EllisHorwood Limited, Chichester England,1989
58 JG Moore, PE Christian, RE Coleman. Gastric emptying of varying meal weight andcomposition in man. Evaluation by dual liquid- and solid-phase isotopic method. Dig. Dis.Sci., 26: 16-22, 1981
59 J-R Malagelada, JS Robertson, ML Brown, M Remington, JA Duenes, GM Thomfode, PWCarryer. Intestinal transit of solid and liquid components of a meal in health.Gastroeneterology, 87: 1255-1263, 1984
60 M Rowland and TN Tozer. Clinical Pharmacokinetics. Concepts and applications, 2nd
edition.Lea & Febiger, Philadelphia London,1989.61 Repertorium 94/95 Overzicht van door het college ter beoordeling van geneesmiddelen
geregistreerde informatieteksten van farmaceutische spécialités. SDU, Den Haag, 1994