rjhopkins black carbon - university of north texas
TRANSCRIPT
Chemical Bonding and Structural Information of
Black Carbon Reference Materials and Individual Carbonaceous Atmospheric Aerosols
Rebecca J. Hopkins†, Alexei V. Tivanski†, Bryan D. Marten‡ and Mary K. Gilles*,†
†*Chemical Sciences Division, Lawrence Berkeley National Laboratory, 1 Cyclotron Road,
Berkeley, CA 94720, USA. ‡Lowell High School, 1101 Eucalyptus Drive, San Francisco, CA 94132, USA.
*Corresponding author: Mary K. Gilles email [email protected]
Abstract
The carbon-to-oxygen ratios and graphitic nature of a range of black carbon standard reference materials
(BC SRMs), high molecular mass humic-like substances (HULIS) and atmospheric particles are
examined using scanning transmission X-ray microscopy (STXM) coupled with near edge X-ray
absorption fine structure (NEXAFS) spectroscopy. Using STXM/NEXAFS, individual particles with
diameter >100 nm are studied, thus the diversity of atmospheric particles collected during a variety of
field missions is assessed. Applying a semi-quantitative peak fitting method to the NEXAFS spectra
enables a comparison of BC SRMs and HULIS to particles originating from anthropogenic combustion
and biomass burns, thus allowing determination of the suitability of these materials for representing
atmospheric particles. Anthropogenic combustion and biomass burn particles can be distinguished from
one another using both chemical bonding and structural ordering information. While anthropogenic
combustion particles are characterized by a high proportion of aromatic-C, the presence of
benzoquinone and are highly structurally ordered, biomass burn particles exhibit lower structural
ordering, a smaller proportion of aromatic-C and contain a much higher proportion of oxygenated
functional groups.
Key Words: Aerosol, black carbon, NEXAFS, HULIS, biomass burn, soot.

2
1. Introduction
Carbonaceous aerosols are emitted into Earth’s atmosphere from natural and anthropogenic
sources, which include biomass burning, natural fires and the combustion of coals, diesel and jet fuels.
Aerosols that contain “black carbon” (BC), commonly referred to as soot and identified as a light-
absorbing component of aerosols, play an important role in influencing the radiative properties of
Earth’s atmosphere, through both direct and indirect effects. The direct effect describes the scattering
and absorption of solar radiation by aerosol particles. The indirect effect describes the contribution
particles make to the radiation budget when they act as cloud condensation nuclei (CCN) and become
activated to form cloud droplets in supersaturated water vapor. This process increases the surface area of
aqueous aerosol that can reflect radiation away from Earth’s surface. The direct and indirect effects lead
to a warming and cooling of the atmosphere, respectively. The interplay of these two effects is a topic of
debate. While some researchers calculate a positive forcing from BC [Chung and Seinfeld, 2005;
Jacobson, 2004], the overall effect of increasing aerosol concentration in the atmosphere remains
unclear [Jones, et al., 2005]. The uncertain role of BC in global climate change is due to the strong
dependence of radiative forcing on its chemical and physical properties. Wide variations in these
properties are observed, including the mixing state of BC [Jacobson, 2001] and its distribution and
residence time in the atmosphere.
Newly generated carbonaceous particles are initially hydrophobic, but reaction with atmospheric
gaseous species such as NO2, SO2, HNO3 and H2SO4 transforms their surfaces into hydrophilic reaction
sites that can readily absorb water. This in turn affects cloud formation rates [Chughtai, et al., 1996;
Chughtai, et al., 1999a; Chughtai, et al., 1999b; Rogaski, et al., 1997]. Uptake of water depends on the
chemical properties of the surface. Surface properties vary as a function of combustion conditions, fuel
composition and surface oxidation of BC in air. More efficient combustion regimes lead to greater
abundances of oxygen and defective structures at the particles interface, promoting higher chemical
reactivity [Chughtai, et al., 2002; Su, et al., 2004]. An important step in quantifying the magnitude of
the indirect effect is to measure the uptake coefficient of water onto BC particles (γBC) [Chughtai, et al.,
1996; Chughtai, et al., 1999a; Chughtai, et al., 1999b; Rogaski, et al., 1997; Wyslouzil, et al., 1994].
Determining the variability of γBC requires understanding the fundamental differences between BC
reference materials used in the laboratory and BC particles in the atmosphere. The process of
atmospheric aging should also be considered, as it will lead to a variation of atmospheric BC.
3
The term BC is used to describe the light-absorbing component of submicron aerosol, typically
measured at a single wavelength (550 nm). This has generally been attributed to soot, which is known
from Raman spectroscopy to have a graphitic-like structure [Mertes, et al., 2004; Rosen and Novakov,
1977]. Soot cannot be considered as pure graphite, as it contains species other than elemental carbon and
displays different electronic properties and structure [Andreae and Gelencser, 2006; Bond and
Bergstrom, 2006]. A recent publication noted that certain organic compounds may contribute to light
absorption in atmospheric aerosol, prompting a review of this definition of BC [Andreae and Gelencser,
2006]. Laboratory measurements and field studies indicate that a variety of carbonaceous atmospheric
aerosol absorb light over a large spectral range [Havers, et al., 1998; Hoffer, et al., 2006; Mukai and
Ambe, 1986]. In addition to BC that strongly absorbs 550 nm light, some organic aerosols can efficiently
absorb light in the near UV region of the spectrum. This organic material, tentatively termed “brown
carbon” due to its yellowish/brown appearance, is likened to natural humic or fulvic acids, more
generally termed as high molecular mass humic-like substances (HULIS) [Havers, et al., 1998; Kiss, et
al., 2001; Krivacsy, et al., 2001; Krivacsy, et al., 2000; Zappoli, et al., 1999]. HULIS found in
atmospheric aerosol is thought to originate directly from biomass burning or decomposition, in addition
to heterogeneous reactions from dienes in the presence of sulfuric acid [Andreae and Gelencser, 2006;
Limbeck, et al., 2003].
Various soot surrogates are employed in the laboratory as atmospheric BC mimics. These
surrogates can be assigned to several classes as determined by their elemental composition, particle size
and morphology. Soot produced from hydrocarbon combustion is one class of materials studied here.
Particles generated in diffusion flames (ethylene, methane and n-hexane) and diesel exhaust soot are
examined. n-hexane soot is composed of between 87 – 95% carbon and contains a variety of oxygen
containing functional groups, including alkyl ketones, aryl ethers, anhydrides and substituted aromatic
groups [Akhter, et al., 1985]. The International Steering Committee for Black Carbon Reference
Materials (ISCBCRM) recommends n-hexane soot as a suitable standard to represent atmospheric BC,
due to chemical and physical similarities and because of the significant characterization and reactivity
data in the literature [Akhter, et al., 1985; Chughtai, et al., 2002; Chughtai, et al., 1999a; Chughtai, et
al., 1999b; Goldberg, 1985; Masiello and Schmidt, 1999]. Graphites represent the second class of soot
surrogates studied. This work considers two graphitic materials; carbon soot from resistively heated
graphite and micronized graphite. Highly oriented pyrolytic graphite is highly absorbing and inert under
atmospheric conditions [Bond and Bergstrom, 2006]. It is essentially a highly ordered periodic stack of
graphene sheets comprised of a hexagonal lattice of carbon with strong sp2 bonding, thus representing

4
100% sp2 hybridization. Highly oriented pyrolytic graphite is used here for comparison purposes, not as
a potential laboratory surrogate. The final class of materials can be described as having an amorphous
structure. Two types of materials studied in this paper are amorphous carbon and Palas soot. Amorphous
carbon has a mixture of sp2 and sp3 bonds and displays no long-range order. Palas soot is generated by
spark discharge between graphitic electrodes and also has a disordered structure [Wentzel, et al., 2003].
Characterization of light absorbing atmospheric particles, their variation, and identification of
suitable reference materials to serve as laboratory surrogates is the subject of this work. The approach is
to study a variety of laboratory generated and commercially available soot samples and HULIS using
scanning transmission X-ray microscopy (STXM) with near-edge X-ray absorption fine structure
(NEXAFS) spectroscopy at the carbon (C) and oxygen (O) K-edges and compare these to atmospheric
particles collected during various field campaigns. While this method highlights differences in chemical
functional groups and structural ordering, it does not provide any information on the optical properties
of these materials. This would be an additional verification of the suitability of a given soot standard.
STXM/NEXAFS is a novel synchrotron based technique that enables X-ray absorption spectra to
be recorded from single particles with diameters > 100 nm, while simultaneously recording images with
high spatial resolution (~ 35 nm). The higher spatial resolution of high resolution transmission electron
microscopy (~ 0.2 nm) and scanning electron microscopy (~ 10 nm) can provide more detailed
information on particle morphology [Laskin, et al., 2006; Posfai, et al., 2004]. However,
STXM/NEXAFS can spatially map differences in local chemical bonding, enabling chemical
heterogeneity to be determined. This offers advantages over techniques previously used to study
chemical bonding in atmospheric particles that examine bulk samples [Mertes, et al., 2004; Sze, et al.,
2001]. An extensive guide to NEXAFS spectroscopy is in existence [Stöhr, 2003] and also a review of
NEXAFS spectroscopy related to environmental studies [Myneni, 2002], in addition to the application of
the technique to carbonaceous particulate matter [Braun, et al., 2004; di Stasio and Braun, 2006] and
atmospheric particles [Maria, et al., 2004; Russell, et al., 2002], thus only a brief outline of the
technique is presented here. In NEXAFS spectroscopy, X-rays incident upon a sample are absorbed
through excitations of core electrons into an unoccupied molecular orbital, resulting in considerable fine
structure above the absorption edge. NEXAFS is element specific as the X-ray absorption edges of
different elements occur at different energies. Furthermore, NEXAFS spectra display sensitivity to the
local bonding environment of the absorbing atom and can be considered fingerprints of particular
carbonaceous compounds. Information on a samples structural ordering is obtained from exciton peaks

5
in the NEXAFS spectrum and by calculating the degree of sp2 hybridization. NEXAFS spectroscopy is
therefore a highly suitable technique for studying the similarities and differences of a variety of BC
reference materials and atmospheric particles.
2. The Experimental Technique
STXM studies were performed on solid carbonaceous samples at the Advanced Light Source
(ALS) Berkeley, CA. Soot samples studied include resistively heated graphite, micronized graphite, soot
produced from ethylene, methane and n-hexane diffusion flames, diesel exhaust soot, Palas soot and
amorphous carbon. Resistively heated graphite and amorphous carbon were purchased from Sigma
Aldrich. Ethylene soot was obtained from an ethylene/air diffusion flame produced with ethylene and air
flow rates of 3.7 – 4.3 cm3 s-1 and 458 cm3 s-1, respectively [Michelson, et al., 2007]. Methane and air
flow rates of 12.8 cm3 s-1 and 233 cm3 s-1, respectively, were used to produce methane soot from an
inverted methane/air diffusion flame. n-hexane soot, produced from a diffusion flame under quiescent
conditions was supplied by ISCBCRM. The diesel soot NEXAFS spectrum was supplied by A. Braun
[Braun, et al., 2004; di Stasio and Braun, 2006] and was acquired from NIST SRM 1650 purchased
from NIST in Gaithersburg, MD, USA [Huggins, et al., 2000]. HULIS samples, including Suwannee
River Fulvic acid 1S101F, Suwannee River humic acid 2S101H and Suwannee River aquatic NOM
1R101N were purchased from the international humic substances society, MN, USA. Atmospheric
samples include NIST SRM 1649a, an urban dust purchased from NIST [Currie, et al., 2002]. In
addition, particles were collected during various field campaigns, namely the Megacity Initiative: Local
and Global Research Observations (MILAGRO), Aerosol Characterization Experiment (ACE-Asia) and
biomass burns sampled in Yosemite National Park, CA and Flagstaff, AZ.
Thin coatings of surrogate soot and NIST SRM 1650 samples were deposited onto Si3N4
windows to avoid total absorption of the X-ray beam, enabling a transmission signal to be recorded. This
was achieved by applying gentle contact between the crushed powder sample and the Si3N4 window and
subsequently removing any loose, excess sample. Atmospheric samples were collected directly onto
holey carbon coated TEM grids and Si3N4 windows using either a Time-Resolved Aerosol Collector
(TRAC) [Laskin, et al., 2003] or by direct impaction from an aerosol inlet [Russell, et al., 2002]. Two
samples, methane flame and biomass burn particles collected in Flagstaff, AZ, were collected onto
quartz filters.
6
Substrates containing the particulate matter were transferred to the STXM chamber. The
chamber was flushed with helium and maintained at atmospheric pressure, minimizing the loss of
volatile or semi-volatile organic components from the samples. Particles with sufficient optical thickness
to allow transmission of the X-ray beam were chosen for study and NEXAFS spectra were acquired over
the C (280 – 320 eV) and O (525 – 555 eV) K-edges. Locating regions of the sample with an appropriate
optical thickness was often difficult. NEXAFS spectra of BC SRMs were averaged over either a region
with agglomerated particles or multiple small particles. The Palas soot spectrum was obtained from 13
distinct particles with diameter ≤ 450 nm; ethylene flame soot was measured more than 20 times
[Michelson, et al., 2007]; the n-hexane spectrum was obtained from the edge portions (0.4 µm × 0.6 µm)
of a large agglomerate; the methane flame soot, amorphous carbon, micronised graphite and resistively
heated graphite spectra were averaged over a region (~ 0.3 µm × 0.3 µm). To ensure a linear regime for
the spectra, only regions with OD < 1.2 were included in the averaging process. Averaging over several
particles or multiple regions of agglomerates minimizes uncertainty arising from variations between
particles. Since the agglomerates or multiple particles would have varying orientations with respect to
the incident radiation, this also eliminates polarization effects. The ACE-Asia, MILAGRO and NIST
urban dust 1649a spectra were obtained by averaging over an entire particle, typically ≥ 1 µm in
diameter. Over 120 tar ball particles with diameter in the range 150 – 500 nm were measured from the
Yosemite sample. These tar balls display a characteristic NEXAFS spectrum [Tivanski, et al.,
submitted]. The Flagstaff, AZ, biomass burn spectrum was recorded from a single particle ~ 2 µm
diameter due to the sparse loading of this sample.
Two STXM instruments are operational at the ALS and they are located at beamlines 5.3.2 and
11.0.2. Beamline 5.3.2 is a bending magnet beamline that produces horizontally polarized radiation. It
uses a spherical grating monochromator to tune the X-ray energy over the range 250 – 600 eV
[Warwick, et al., 2002]. This monochromator is optimized at the C 1s absorption edge, providing an
energy resolution of 100 meV. Beamline 11.0.2 is an undulator beamline operating with a plane grating
monochromator, with two gratings ruled with 150 and 1200 grooves mm-1. The polarization of this
beamline can be varied, but was typically used in the horizontal orientation. This beamline operates over
the energy range 200 – 1900 eV, offering considerably more flux than beamline 5.3.2 due to the
undulator insertion device (1 × 10¹² – 1 × 10¹³ versus 1 × 10⁷ photons s-1 at 1.9 GeV, 400 mA).
However, the zone plate focuses only a small percentage of this light onto the sample. As beamline
11.0.2 provides a higher flux, data acquisition times are typically shorter. The energy scale of the
7
NEXAFS spectra were calibrated using known CO2 transitions (3s (v=0) and 3p (v=0)) [Ma, et al.,
1991].
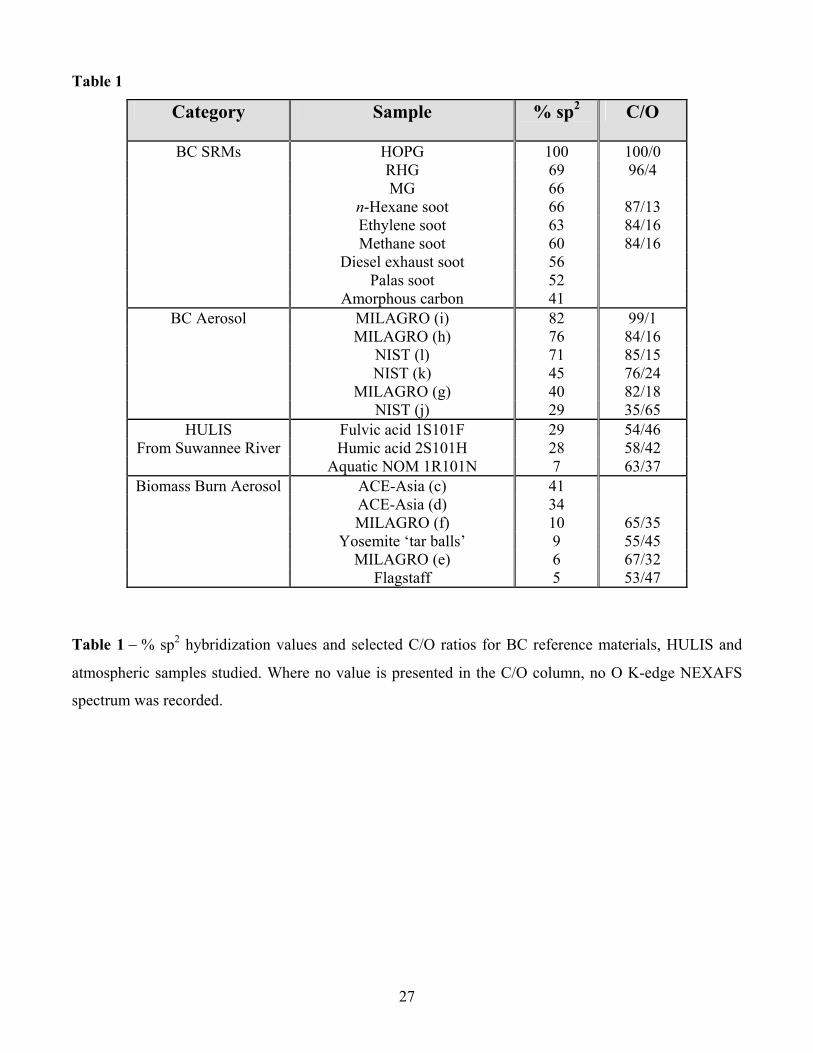
A schematic diagram illustrating the key STXM components is presented in Figure 1. The X-ray
beam enters the STXM chamber through a 50 nm thick Si3N4 window, which isolates the instrument
from the ultrahigh vacuum of the beamline. A custom made Fresnel zone plate, engineered at the Centre
for X-Ray Optics, Lawrence Berkeley National Laboratory, focuses the X-ray beam to a diffraction
limited spot size, typically 35 nm for these experiments. The beam stop at the centre of the zone plate
prevents unfocused radiation from reaching the sample and an order selective aperture eliminates higher
order diffracted light, permitting only the first order diffracted light to reach the sample. The STXM runs
in multiple modes allowing images, spectra and stacks to be recorded. The intensity of X-rays
transmitted through the sample at a fixed energy is measured as the sample is raster scanned to record an
image. Transmission spectra are collected by varying the monochromator energy at a fixed sample
position. Sequences of images are acquired at closely spaced energies to record a stack of images. A
stack is essentially a three dimensional map in position, energy and transmission. NEXAFS spectra from
individual pixels or particular regions of interest on the sample image are extracted from the stack,
enabling spatial mapping of chemical bonding information [Hitchcock, et al., 2001]. This technique is
operated in the transmission mode in this work; therefore the resultant signal is recorded from an entire
particle representing an average of both surface and bulk properties.
The transmitted signal is converted to optical density (OD) and is dependent upon sample
thickness, density and composition as described below:
dIIOD µρ=−=0
ln (1)
where 0I is the incident photon flux intensity, d is the sample thickness, µ is the mass absorption
coefficient and ρ is the density of the sample material. 0I is determined by selecting a sample free
region of the substrate. All spectra recorded in this study are scaled to a thickness of 100 nm and density
of 1.8 g cm-3 using carbon mass absorption coefficients calculated from data supplied by the Centre for
X-Ray Optics. This scaling process essentially normalizes the spectra to the same total carbon content,
thus allowing a meaningful comparison of the samples studied.
8
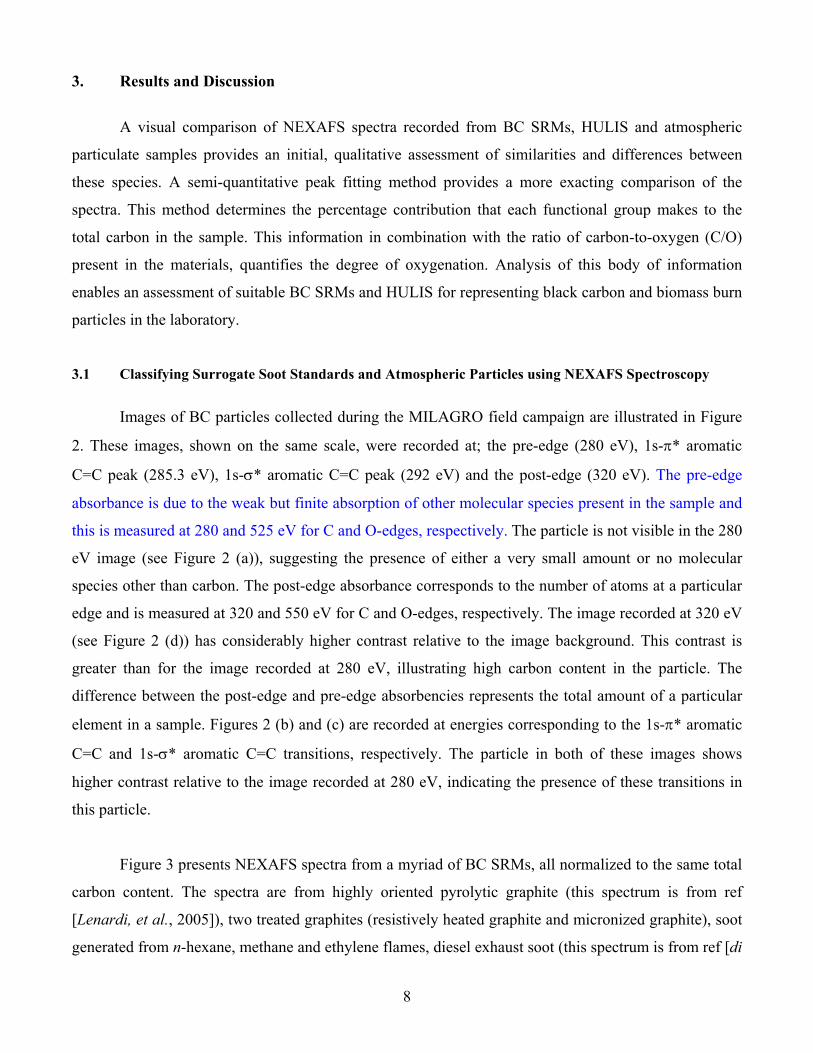
3. Results and Discussion
A visual comparison of NEXAFS spectra recorded from BC SRMs, HULIS and atmospheric
particulate samples provides an initial, qualitative assessment of similarities and differences between
these species. A semi-quantitative peak fitting method provides a more exacting comparison of the
spectra. This method determines the percentage contribution that each functional group makes to the
total carbon in the sample. This information in combination with the ratio of carbon-to-oxygen (C/O)
present in the materials, quantifies the degree of oxygenation. Analysis of this body of information
enables an assessment of suitable BC SRMs and HULIS for representing black carbon and biomass burn
particles in the laboratory.
3.1 Classifying Surrogate Soot Standards and Atmospheric Particles using NEXAFS Spectroscopy
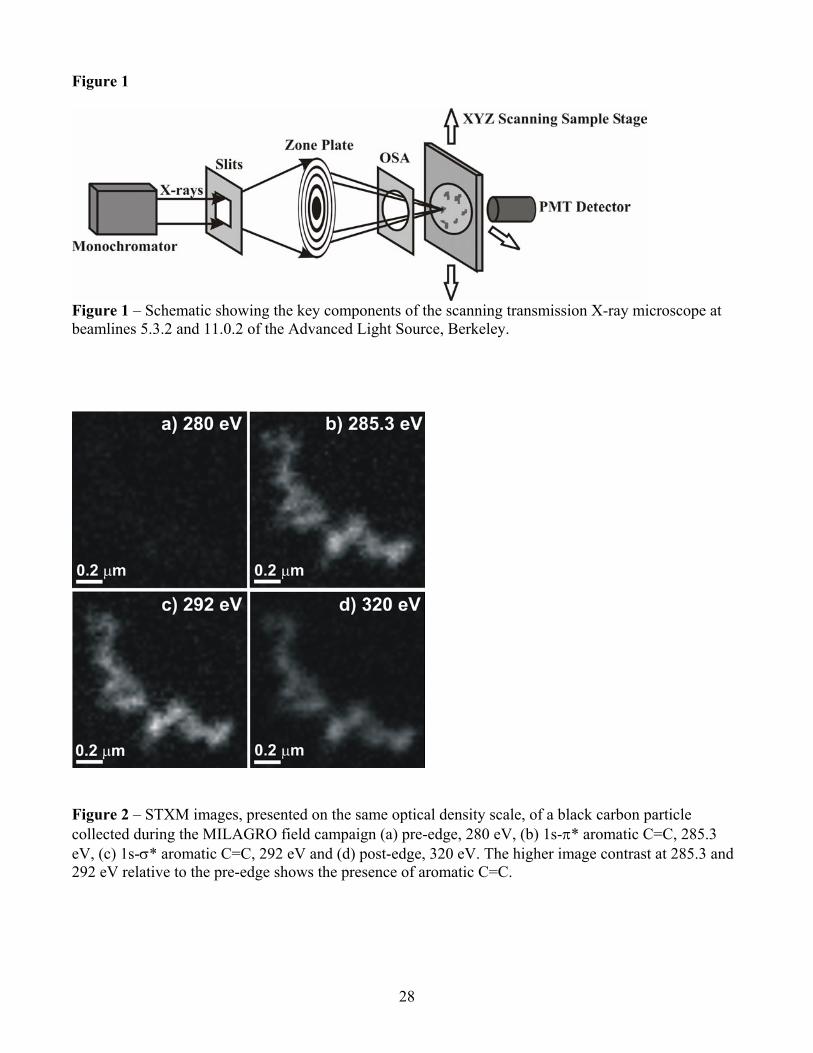
Images of BC particles collected during the MILAGRO field campaign are illustrated in Figure
2. These images, shown on the same scale, were recorded at; the pre-edge (280 eV), 1s-π* aromatic
C=C peak (285.3 eV), 1s-σ* aromatic C=C peak (292 eV) and the post-edge (320 eV). The pre-edge
absorbance is due to the weak but finite absorption of other molecular species present in the sample and
this is measured at 280 and 525 eV for C and O-edges, respectively. The particle is not visible in the 280
eV image (see Figure 2 (a)), suggesting the presence of either a very small amount or no molecular
species other than carbon. The post-edge absorbance corresponds to the number of atoms at a particular
edge and is measured at 320 and 550 eV for C and O-edges, respectively. The image recorded at 320 eV
(see Figure 2 (d)) has considerably higher contrast relative to the image background. This contrast is
greater than for the image recorded at 280 eV, illustrating high carbon content in the particle. The
difference between the post-edge and pre-edge absorbencies represents the total amount of a particular
element in a sample. Figures 2 (b) and (c) are recorded at energies corresponding to the 1s-π* aromatic
C=C and 1s-σ* aromatic C=C transitions, respectively. The particle in both of these images shows
higher contrast relative to the image recorded at 280 eV, indicating the presence of these transitions in
this particle.
Figure 3 presents NEXAFS spectra from a myriad of BC SRMs, all normalized to the same total
carbon content. The spectra are from highly oriented pyrolytic graphite (this spectrum is from ref
[Lenardi, et al., 2005]), two treated graphites (resistively heated graphite and micronized graphite), soot
generated from n-hexane, methane and ethylene flames, diesel exhaust soot (this spectrum is from ref [di
9
Stasio and Braun, 2006]), Palas soot and amorphous carbon. The differing graphitic nature of these soot
samples is dependent upon the conditions of the combustion process in which they were formed. The
general process is believed to result from polycyclic aromatic hydrocarbons (PAHs) undergoing
nucleation to produce soot nuclei [Richter and Howard, 2000], which then grow in mass due to addition
of gas-phase species and small PAHs. Another potential mechanism involves reactive coagulation via
particle-particle collisions. Amorphous polyaromatic carbon is then believed to undergo
dehydrogenation, resulting in ring condensation and fusion leading to partial micro structural ordering
and progressively higher degrees of graphitization. The spectrum of highly oriented pyrolytic graphite
recorded at the magic angle is use to calculate the sp2 content of BC SRMs using a method outlined
below [Lenardi, et al., 2005].
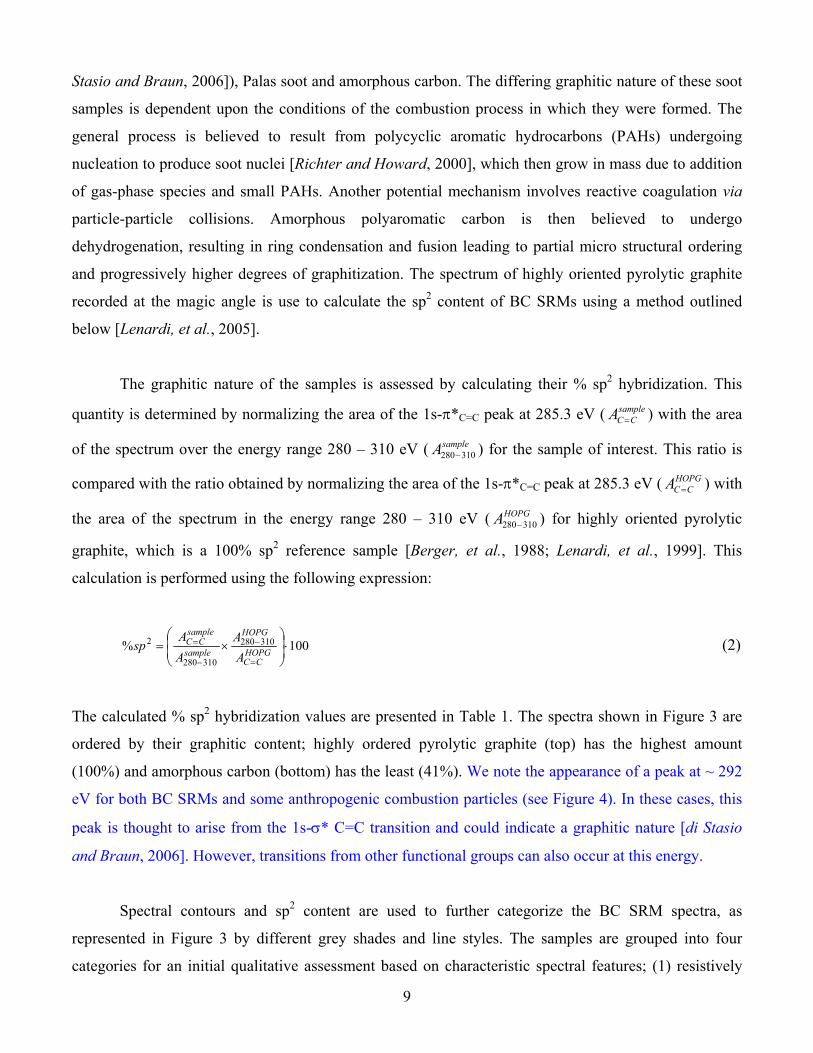
The graphitic nature of the samples is assessed by calculating their % sp2 hybridization. This
quantity is determined by normalizing the area of the 1s-π*C=C peak at 285.3 eV ( sampleCCA = ) with the area
of the spectrum over the energy range 280 – 310 eV ( sampleA 310280− ) for the sample of interest. This ratio is
compared with the ratio obtained by normalizing the area of the 1s-π*C=C peak at 285.3 eV ( HOPGCCA = ) with
the area of the spectrum in the energy range 280 – 310 eV ( HOPGA 310280− ) for highly oriented pyrolytic
graphite, which is a 100% sp2 reference sample [Berger, et al., 1988; Lenardi, et al., 1999]. This
calculation is performed using the following expression:
100% 310280
310280
2 ⋅
×=
=
−
−
=HOPG
CC
HOPG
sample
sampleCC
AA
AA
sp (2)
The calculated % sp2 hybridization values are presented in Table 1. The spectra shown in Figure 3 are
ordered by their graphitic content; highly ordered pyrolytic graphite (top) has the highest amount
(100%) and amorphous carbon (bottom) has the least (41%). We note the appearance of a peak at ~ 292
eV for both BC SRMs and some anthropogenic combustion particles (see Figure 4). In these cases, this
peak is thought to arise from the 1s-σ* C=C transition and could indicate a graphitic nature [di Stasio
and Braun, 2006]. However, transitions from other functional groups can also occur at this energy.
Spectral contours and sp2 content are used to further categorize the BC SRM spectra, as
represented in Figure 3 by different grey shades and line styles. The samples are grouped into four
categories for an initial qualitative assessment based on characteristic spectral features; (1) resistively

10
heated graphite and micronized graphite, (2) n-hexane, methane, ethylene and diesel exhaust soot, (3)
Palas soot and (4) amorphous carbon. The highly oriented pyrolytic graphite spectrum displays two
pronounced peaks arising from 1s-π* and 1s-σ* C=C bonds at 285.3 and 292 eV, respectively. In
addition, a sharp exciton peak at 291 eV induced by the long range order present in graphite is observed
[Coffman, et al., 1996]. The appearance of an exciton peak and 100% sp2 bonding are unique features of
highly oriented pyrolytic graphite.
Resistively heated graphite and micronized graphite constitute category (1). They exhibit similar
spectral contours with well defined peaks at 285.3 eV and poorly separated absorption features from 286
− 290 eV. No exciton peak is observed, suggesting either the absence of long range order, or less
ordering than is observed for highly oriented pyrolytic graphite. The three flame generated soot samples
(category (2)) appear similar, with sp2 hybridization values consistent within 6%. The low intensity of
the 286 – 290 eV energy regions with respect to the 285 and 292 eV peaks is a feature observed for all
three of the flame soot spectra. This low intensity region reflects the relatively small contribution from
oxygen containing functional groups. The NEXAFS spectrum of diesel exhaust soot resembles the flame
soot samples with the exception of the 286 – 290 eV region, which appears more prominent. A shoulder
at 291 eV is evident in the diesel exhaust soot spectrum. This could be an exciton peak, suggesting the
presence of some long range order [Sasaki, et al., 1997]. However, the calculated % sp2 hybridization
value for diesel exhaust soot is 56%. This is considerably lower than for highly oriented pyrolytic
graphite, suggesting it is a less graphitic carbonaceous material. A decrease in intensity at energies > 292
eV distinguishes the flame soot and diesel exhaust spectra from that of resistively heated graphite and
micronized graphite, for which increased absorption above this energy is observed. Palas soot (category
(3)) has a distinctly different NEXAFS spectrum from the other samples, even though it displays a % sp2
value of 52%, similar to that of diesel soot. In contrast to the other samples, there is no sharp rise from
290 eV to the 292 eV peak. Also, the 286 – 290 eV region has stronger intensity than the 285 eV peak.
Amorphous carbon (category (4)) has a spectral contour similar to resistively heated graphite and
micronized graphite. An increase in intensity at energies > 292 eV is observed. However, amorphous
carbon has a % sp2 value that is ~ 25% lower; therefore it is placed in a separate category.
NEXAFS spectra recorded from atmospheric particles originating from anthropogenic
combustion and biomass burn sources are illustrated in Figure 4. These spectra are grouped according to
field campaign and ordered with the largest graphitic content at the top. These samples are selected to
demonstrate the variability in atmospheric particle composition between locations and also at a

11
particular location at a given time. Samples include the NIST 1649a SRM, particles collected during the
MILAGRO and ACE-Asia field campaigns, ‘tar balls’ collected in Yosemite National Park, CA
[Tivanski, et al., submitted] and a biomass burn event in Flagstaff, AZ.
The NIST 1649a SRM was collected in the Washington, DC area for a 12 month period during
1976-77. This sample is intended to represent atmospheric particulate matter collected from an urban
area, but without being representative of the area where it was collected [Currie, et al., 2002]. NIST
1649a SRM is recommended by the ISCBCRM as a representative atmospheric BC sample [Masiello
and Schmidt, 1999]. This standard is the subject of an inter-comparison study and contains several
species including PAHs, polychlorinated biphenyls, chlorinated pesticides, polychlorinated dibenzo-p-
dioxins and dibenzofurans, 32 different inorganic constituents and carbonate [Currie, et al., 2002].
Although much work has been performed to characterize the chemical composition of NIST 1649a
SRM, no work to date has studied this sample on a single particle basis using NEXAFS spectroscopy.
The spectra labeled as (j), (k) and (l) in Figure 4 are from individual particles present in the same
NIST 1649a SRM sample. The spectra display similar features with a distinct C=C aromatic peak at
285.3 eV, a prominent 286 – 290 eV region with poorly separated absorption features (attributed to a
variety of functional groups) and a rise in absorbance at energies higher than 290 eV. The % sp2 content
varies from 29 to 71%. Although the NIST 1649a SRM was mixed thoroughly, heterogeneity of small
samples has been identified as an issue [Currie, et al., 2002]. Individual particles are sampled using
STXM/NEXAFS, so this technique is very sensitive to inhomogeneities present in the sample. Some
similarities between NIST 1649a SRM and the flame and diesel exhaust samples are evident from a
visual comparison of the C K-edge NEXAFS spectra.
The MILAGRO field campaign took place in Mexico City during March 2006. The samples
studied here were collected in the northern part of the city, approximately 20 km from the city centre. It
is possible that the combustion of gasoline and diesel fuel may influence the sample, in addition to
industrial sources. The five MILAGRO spectra presented in Figure 4 were measured from individual
particles collected within a time window of 1.5 hours during peak traffic conditions. The recorded
spectra are labeled from (e)-(i) in Figure 4. Particles known to originate from biomass burn sources
provide a contrast with the urban NIST and MILAGRO particles. During the ACE-Asia campaign,
particles were collected on a day when mixed combustion sources influenced the aircraft sampling
location (flight RF15) [Maria, et al., 2004]. Highly spherical ‘tar balls’ generated from forest fires in

12
Oregon were sampled during the Yosemite Aerosol Characterization Study (YACS) in summer 2002.
These particles are thought to evolve in aging biomass smoke. The mechanism is believed to involve
rapid polymerization of OH radicals present in the atmosphere with phenolic acids generated during the
burning of biomass, producing high molecular weight spherical particles [Posfai, et al., 2004]. Tar balls
were present during episodes of high particle light scattering coefficients occurring in mid-August (day
of year, DOY, 228-229) and they absorb light in the UV and near-IR region of the electromagnetic
spectrum, as determined by a dual wavelength aethalometer (λ = 370 and 880 nm) [Hand, et al., 2005].
Additionally, particles collected during a biomass burn event in Flagstaff, AZ are examined.
MILAGRO (i) and (h) display similar spectral contours. They resemble flame and diesel exhaust
soot (category (2)) and possibly spectra from categories (1) and (4) as determined by the low intensity
286 – 290 eV region. However, the % sp2 values for MILAGRO (i) and (h) are higher than for all of the
surrogate soot samples studied, 82 and 76%, respectively. MILAGRO (g) has a spectral contour
intermediate between the flame and diesel exhaust soot with a lower % sp2 value of 40%. MILAGRO (e)
and (f) exhibit further reduced % sp2 hybridization values of 6 and 10%, respectively and display spectra
unlike flame/diesel soot. Application of the MOZART model predicts biomass burn influence on the
sampling site during particle collection. The range of spectral contours observed from the MILAGRO
campaign could arise due to influence by different combustion sources, including biomass burning. This
range could also indicate atmospheric aging, which would affect the degree of oxidation of these
particles.
Biomass burn particles exhibit spectra unlike the surrogate soot, NIST 1649a SRM and some of
the MILAGRO particles. NEXAFS spectra from biomass burn particles display spectral characteristics
similar to the three HULIS studied, namely Suwannee River aquatic NOM 1R101N, Suwannee River
humic acid 2S101H and Suwannee River fulvic acid 1S101F (see Figure 5). Both biomass burn particles
and HULIS display an aromatic carbon peak at around 285 eV. This spectral feature is narrower and
less intense compared with the BC SRMs. In addition, well resolved absorption features are present
between 286 – 290 eV, whereas this range generally appears congested in the spectra of anthropogenic
particles. The % sp2 values of the biomass burn samples are variable between locations, but generally
much lower than those of BC SRMs. The ACE-Asia particles display the highest % sp2 values of 34 and
41%. Tar balls and particles from the Flagstaff, AZ biomass burn are calculated as 9 and 5% sp2
hybridized, respectively, significantly lower than the BC SRMs and some MILAGRO spectra. The %
sp2 values are calculated as 7, 28 and 29% for Suwannee River aquatic NOM 1R101N, Suwannee River

13
humic acid 2S101H and Suwannee River fulvic acid 1S101F, respectively. This indicates that these
HULIS do not possess a graphite-like structure as observed for the majority of the BC SRMs.
3.2 Semi-quantitative Comparison of Surrogate Soot Standards and Atmospheric Particles
NEXAFS spectra recorded from BC SRMs, HULIS and atmospheric particles are deconvoluted
into Gaussian peaks, providing a semi-quantitative method for comparing these samples. Spectral fitting
is achieved using an arctangent function for the ionization step at 290.3 eV with a FWHM of 1 eV and
Gaussian peaks with variable FWHM, representing the main 1s-π* and 1s-σ* transitions below 292 eV.
In addition, two Gaussian functions are employed to simulate σ* transitions above the ionization step.
The maxima of these peaks are around 292 and 295 eV with FWHM of ≤ 3.5 eV and ≤ 5 eV,
respectively. A spectral fitting program optimizes the fit by minimizing the χ2 value. Spectral fitting
enables determination of the dominant transitions, some of which are not evident from an initial
inspection of the spectral contour. A semi-quantitative analysis is performed for the main transitions
below 292 eV by calculating the percentage that each functional group contributes to the total carbon
present in the sample. This is determined by calculating the ratio of the integral of the individual π* or
σ* peaks to the integral of the spectrum over the energy range 280 – 320 eV.
This method is considered semi-quantitative for several reasons. Firstly, an error in the spectral
fit due to the overlap of multiple peaks is anticipated, but quantification of this is non-trivial. This is
minimized by 1) fitting the spectrum with the fewest number of peaks needed to obtain a good quality fit
and 2) fixing peak energies at the peak maxima of prominent spectral features. The quality of the
spectral fit is assessed by calculating the deviation of the simulated fit from the actual spectrum. This is
determined in all cases to be < 1%. These identical criteria are employed in the fitting process for each
spectrum. Although the reported compositions may not be treated as absolute due to the potential error
described above, it is assumed reasonable to compare relative compositions. Evidence to support this
arises from agreement between the calculated amount of carbon and oxygen present in a number of
samples and the proportion of oxygenated functional groups predicted by the semi-quantitative spectral
fitting method. An additional uncertainty arises due to ambiguous peak assignments in regions of the C
and O K-edge NEXAFS spectra. Multiple transitions can occur at similar energies, resulting in potential
contribution from multiple functional groups to a given peak. However, comparison of transitions
occurring in both the C and O NEXAFS spectra can sometimes confirm the presence of certain

14
functional groups. Where ambiguity in the assignment of peaks arises, all of the potential candidates are
provided.
Spectral fits of C K-edge NEXAFS spectra of a surrogate soot (ethylene soot) and biomass burn
sample (Flagstaff, AZ) are displayed in Figure 6 for comparison. A number of sharp resonances are
identified by the spectral fitting process. The apportionment of the functional groups differs significantly
between the two samples. Several resonance transitions are common to both of these spectra, appearing
at 285.3, 286.7, 287.4, 288.5 and 289.5 eV. An additional resonance is unique to each of the spectra;
ethylene soot exhibits a peak at 284.2 eV and the biomass burn particle displays a distinct peak at 290.5
eV.
The 1s-π* C=C peak at 285.3 eV originates from either protonated/alkylated or carbon
substituted aromatic-C and is herein referred to as aromatic-C [Urquhart, et al., 2000]. An asymmetry in
this peak is observed in the ethylene soot spectrum. The prominent shoulder is evident at the low energy
side of the peak maximum. This shoulder is fit with a peak centered at 284.2 eV and assigned as a
resonance transition arising from the aromatic carbon atoms in benzoquinone. This has been observed
previously in soot generated from an ethylene flame [di Stasio and Braun, 2006]. The two carbonyl
groups attached to the benzene ring in benzoquinone gives rise to an additional resonance at around 286
eV [di Stasio and Braun, 2006]. This resonance is shifted to higher energy relative to the 284.2 eV peak
due to the polarization of the C=O bond caused by the electronegativity difference between the carbon
and oxygen atoms. The congestion of peaks in the spectral region above 286 eV makes it difficult to
determine the contribution of this benzoquinone resonance at 286 eV. The peaks at 286.7, 287.4, 289.5
and 290.5 eV could contain contributions from several functional groups, which have overlapping
resonances in these regions. However, apart from the peak at 287.4 eV, all of the overlapping functional
groups are from a type of carbon-oxygen bond. The 1s-π* resonance at 286.7 eV could be either O-
substituted aromatic carbon, as in the case of phenol or aryl ether (referred to as phenolic-C herein)
[Cody, et al., 1995] or a ketone carbonyl group. The peak at 287.4 eV corresponds to a 1s-σ* transition
from aliphatic carbon atoms or a 1s-π* transition from aromatic carbonyl groups [Cody, et al., 1998] and
the 1s-π* resonance at 288.5 eV is unambiguously assigned as carboxyl carbon [Urquhart, et al., 1999].
The peak at 289.5 arises from transitions taking place for O-substituted alkyl carbon atoms, including
alcohol groups [Scheinost, et al., 2001] or carbonyl groups [Urquhart and Ade, 2002]. Finally, at 290.5
eV, the carbon atoms in carbonyl groups (possibly carbonate) show absorption [Urquhart and Ade,
2002], but this transition is only observed in the biomass burn particle spectrum.

15
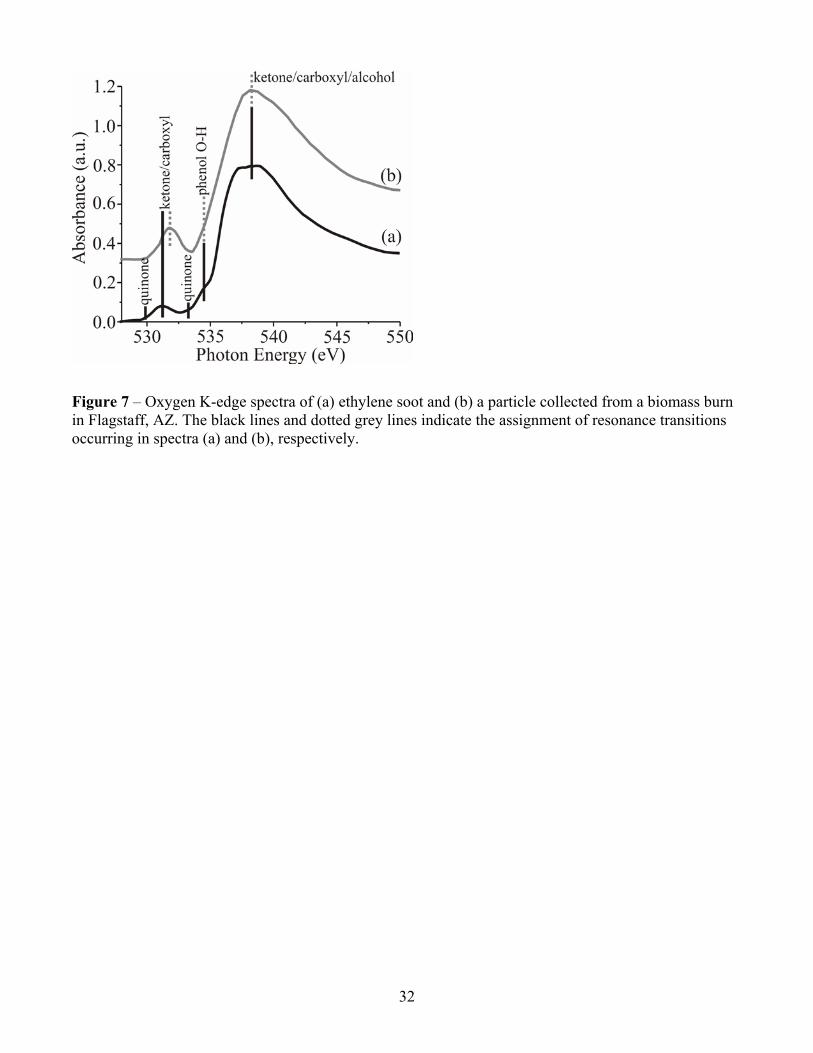
Figure 7 illustrates O K-edge NEXAFS spectra recorded from ethylene soot and a biomass burn
particle collected in Flagstaff, AZ. These spectra are used to support some of the assignments considered
above in the C K-edge NEXAFS spectra. Although O K-edge NEXAFS spectra are generally composed
of broader resonances than observed at the C K-edge, it is still possible to extract functional group
information. A broad 1s-σ* transition centered at ~ 538 eV is common to both the ethylene soot and
biomass burn particle spectra. This peak may contain contributions from ketone, alcohol and phenol
functional groups. A small, narrower peak attributed to overlapping 1s-π* resonances is present in both
spectra, appearing in the energy range 529.9 – 533.5 eV. However, this peak appears broader in the
ethylene soot spectrum and the peak maximum is shifted to lower energy. This peak broadening
indicates the contribution from multiple functional groups including a C=O resonance from
benzoquinone at 529.9 eV, confirming the assignment made in the corresponding carbon spectrum. Both
ketone and carboxyl functional groups give rise to resonances between 531 – 532 eV. The 1s-π*
resonances appearing in both the ethylene soot and biomass burn particle spectra could result from
various proportions of both of these functional groups. The shoulder at 534.5 eV that appears more
prominent in the ethylene soot spectrum, is assigned to a 1s-σ* O-H transition in phenol [Myneni, 2002].
This supports the assignment of phenol in the carbon spectrum.
A visual inspection of the C K-edge spectra presented in Figure 6 suggests that the ethylene soot
spectrum is dominated by the aromatic carbon peak. Smaller fractions of oxygen containing functional
groups are present compared to the biomass burn particle spectrum. This observation is supported by
calculated C/O ratios for both samples (see Table 1). The C/O ratios of ethylene soot and biomass burn
particle collected in Flagstaff, AZ are calculated as 84/16 and 53/47, respectively. This result supports
the assignment of additional oxygen-containing functional groups in the biomass burn particle spectrum.
The total amount of carbon and oxygen present in the sample is calculated using the following equation:
dZODZOD
xx
OOC
CCO
C
O
µµ
= (3)
where xC and xO are the number of carbon and oxygen atoms present, respectively. ZC and ZO are the
atomic mass of carbon and oxygen, respectively. ODC and ODO are determined from the difference
between the pre-edge and post-edge absorptions in the NEXAFS spectra for carbon and oxygen,
respectively. Mass absorption coefficients for atomic carbon (µC) and oxygen (µO) are calculated from

16
atomic scattering factors [Henke, et al., 1982]. The difference in mass absorption coefficients for carbon
and oxygen are 3.8×104 cm2/g (280-320 eV) and 2×104 cm2/g (525-550 eV), respectively. The thickness
of the materials is assumed to be constant. This method yields C/O ratios that agree well with
independent measurements presented in the literature. For example, the C/O ratio derived calculated
here for n-hexane is 87/13. This compares well with reported elemental compositions of between 87%
C, 11% O and 92.5% C, 6% O [Akhter, et al., 1985].
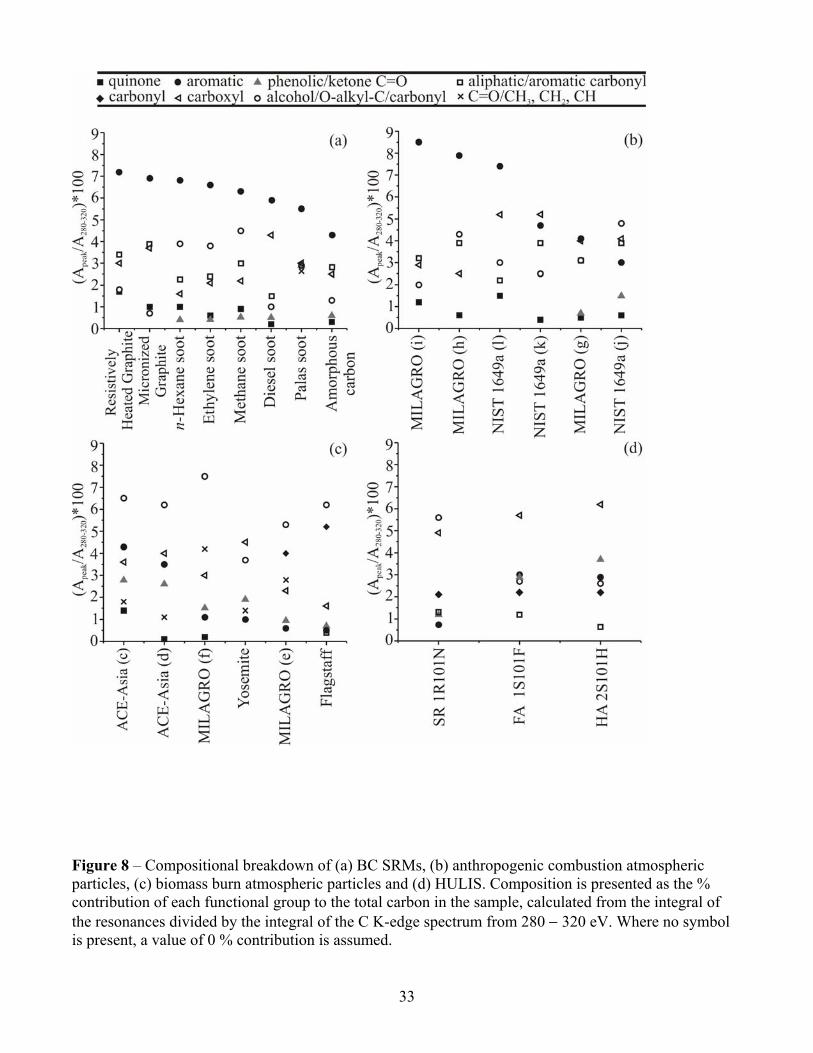
Detailed compositional breakdowns determined from spectral fitting of the C K-edge NEXAFS
spectra are displayed in Figures 8. These results are presented in four plots to differentiate between the
BC SRMs (Figure 8(a)), anthropogenic combustion atmospheric particles (Figure 8(b)), biomass burn
atmospheric particles (Figure 8(c)) and HULIS samples (Figure 8(d)). Figure 8(a) shows that generally,
BC SRMs are highly carbonaceous materials with smaller amounts of oxygen containing functional
groups than HULIS and biomass burn particles. BC SRMs are distinguished by their high aromatic-C
content and the presence of benzoquinone. The relative proportion of functional groups varies between
the BC SRMs studied. However, we show that the variation within BC SRMs is less than the variation
observed between combustion influenced particles in the atmosphere. The following section uses these
differences to characterize these materials, enabling comparison of SRMs with atmospheric samples.
Resistively heated graphite and micronized graphite are less oxidized than the other BC SRMs,
as evident by low amounts of the alcohol/O-alkyl-C functional group and supported by a C/O ratio of
96/4. This high carbon content may indicate that the 287.4 eV peak results from aliphatic-C, rather than
the alternative assignment of aromatic carbonyl. The compositional breakdowns for all three flame soot
samples are very similar to one another. These materials are more oxygenated than the graphite samples,
as reflected by their lower C/O ratios (see Table 1). The flame soot samples are characterized by a
higher amount of alcohol/O-alkyl-C and a smaller amount of carboxyl; this apportionment is reversed
for diesel soot. Diesel soot contains less oxygen than the flame soot samples, as evident from
comparison of their spectral contours (see Figure 3). The energy region between 288.6 – 290.2 eV where
peaks from oxygenated functional groups are located is of lower intensity than for the flame soot
samples.
Palas soot displays a spectral breakdown significantly different from the other BC SRMs studied,
exhibiting no contribution from benzoquinone and a much larger contribution from phenolic-C/aromatic
carbonyl. In addition, a contribution from C=O/CH3, CH2, CH arises, which is not observed in the other
17
surrogate soot samples. Palas soot is further characterized by the presence of an equal quantity of
alcohol/O-alkyl-C and carboxyl functional groups. Amorphous carbon displays a similar composition to
resistively heated graphite and micronized graphite, with comparable amounts of aliphatic-C/aromatic
carbonyl, carboxyl and alcohol/O-alkyl-C functional groups. However, the phenolic-C/aromatic
carbonyl functional group is also observed in amorphous carbon. The % sp2 value is much lower for
amorphous carbon than for either of the graphites, illustrating that amorphous carbon is a more
disordered material [Bond and Bergstrom, 2006].
Figure 8(b) presents compositional breakdowns for anthropogenic combustion particles.
Atmospheric samples are put into this classification based on their spectral appearance and
compositional breakdown. The spectral contours of MILAGRO (i), (h) and (g) and NIST (j)-(l) are
similar to the graphites, flame generated soot and amorphous carbon (see Figure 4). Similar spectral
features include a dominant aromatic-C peak at around 285 eV and a region of comparatively low
intensity in the range 286 – 290 eV, signifying the presence of a small proportion of oxygen containing
functional groups. The compositional breakdown of MILAGRO (i) is most like resistively heated
graphite and amorphous carbon. This is characterized by the presence of relatively small amounts of
oxygen containing functional groups and a higher proportion of aromatic-C and aliphatic groups.
MILAGRO (i) displays a similar C/O ratio to resistively heated graphite (99/1 and 96/4, respectively).
However, it contains a higher percentage of aromatic-C than resistively heated graphite, which is
reflected by its higher % sp2 value (82% and 69%, respectively). This data suggests that although
MILAGRO (i) has a chemical composition similar to resistively heated graphite, it displays structural
ordering intermediate between resistively heated graphite and highly ordered pyrolytic graphite (100%
sp2).
MILAGRO (h) has a compositional breakdown most similar to the flame generated soot. This is
characterized by the presence of a larger amount of alcohol/O-alkyl-C than carboxyl and an intermediate
amount of aliphatic/aromatic carbonyl. A small amount of phenolic-C/ketone C=O is present in the
flame generated soot samples (0.5%), but MILAGRO (h) does not contain this functional group. The
C/O ratios of MILAGRO (h) and the flame generated soot are also very similar (see Table 1). However,
MILAGRO (h) is more graphitic than the flame generated soot, as demonstrated by its % sp2 value that
is ~ 13% higher. NIST (k) and (l) both contain a higher percentage of carboxyl than alcohol/O-alkyl-C,
which is a characteristic of diesel soot. However, the compositional breakdowns show that these
atmospheric samples are significantly more oxygenated than diesel soot and display C/O ratios similar to
18
the flame generated soot. NIST (l) displays greater structural ordering than both diesel soot and the
flame generated soot, as demonstrated by a sp2 value of 71%.
The compositional breakdown of MILAGRO (g) is different to all of the BC SRMs. A lower
amount of aromatic-C and a higher presence of oxygen containing functional groups are observed.
Although this sample has a C/O ratio similar to the flame generated soot, it is only 40% sp2 hybridized
and therefore more structurally disordered than the majority of BC SRMs. NIST (j) displays an even
lower percentage of aromatic-C than MILAGRO (g). This sample is highly oxygenated, displaying a
C/O ratio of 35/65 and contains a higher proportion of phenolic-C/ketone C=O compared to the BC
SRMs. NIST (j) is structurally disordered with a sp2 value of only 29%.
In summary, there is a considerable amount of variation in the degree of oxidation, relative
amounts of functional groups present and % sp2 hybridization values for the anthropogenic combustion
particles. Some atmospheric particles display compositional breakdowns similar to those of BC SRMs,
while others appear more oxygenated. This may be due to atmospheric aging or contributions from
combustion sources that are not as well represented by the BC SRMs studied. Another similarity with
the BC SRMs is the presence benzoquinone.
The compositional breakdowns of biomass burn particles are illustrated in Figure 8(c). Some of
these samples were collected at source and therefore definitely originated from biomass burns (Flagstaff,
Yosemite). However, other samples (ACE Asia (c) and (d) and MILAGRO (e) and (f)) are ambient
samples. They are placed in this category based on meteorology information, which suggests some
influence from biomass burn sources. A comparison of Figures 8(a) and (c) suggest that the BC SRMs
and biomass burn particles contain similar functional groups, but in different proportions. The biomass
burn particles are highly oxygenated and contain functional groups that are not observed in the BC
SRMs, such as carbonyl-C. The derived C/O ratios presented in Table 1 confirm the difference in
oxygenation between the biomass burn particles and BC SRMs.
The dominant functional group for most biomass burn particles is alcohol/O-alkyl-C, rather than
aromatic-C as observed for the BC SRMs. The biomass burn particles studied contain higher amounts of
phenolic-C/ketone C=O compared with the BC SRMs and anthropogenic combustion particles. This
observation is reasonable, as a variety of phenolic compounds, including guaiacols, catechols and
syringols, are known to form during the combustion of biomass, mainly from lignin pyrolysis [Fine, et

19
al., 2001; Rogge, et al., 1998]. The % sp2 hybridization values for the biomass burn particles are
generally much lower than for the BC SRMs. This demonstrates that biomass burn particles do not
display a high degree of structural ordering, unlike some anthropogenic combustion particles.
The particles that definitely originate from biomass burn sources contain no benzoquinone.
Backward trajectory calculations show that ACE Asia (c) and (d) were influenced by mixed combustion
sources [Maria, et al., 2004]. The influence of both anthropogenic and biomass burn combustion is
evident in the compositional breakdown of these samples. Anthropogenic combustion is evident from a
high percentage of aromatic-C compared to pure biomass burn particles, in addition to the presence of
benzoquinone. Biomass burn influence is evident from the high proportion of oxygen containing
functional groups present. The MILAGRO (f) spectrum also shows the presence of benzoquinone,
which may suggest that this sample was subject to influences from both combustion and biomass burn
sources.
Tar balls collected in Yosemite National Park, CA, exhibit a considerably different
compositional breakdown compared to particles generated during a biomass burn in Flagstaff, AZ,
despite their similar C/O ratio and sp2 hybridization values (Yosemite - 55/45 (9%), Flagstaff - 53/47
(5%)). Variation in the relative proportion and type of functional groups present in both samples is
observed. The functional group C=O/CH3, CH2, CH is present exclusively in tar balls, whereas
carbonyl-C and aliphatic-C are observed in the particles collected in Flagstaff, AZ.
Figure 8(d) presents the compositional breakdowns for the three HULIS studied. Much like the
biomass burn particles, oxygenated functional groups dominate the spectral breakdown as supported by
C/O ratios of 63/37, 54/46 and 58/42 for Suwannee River aquatic NOM 1R101N, Suwannee River
fulvic acid and humic acid, respectively. These C/O ratios are in good agreement with elemental
compositions measured independently [International Humic Substances Society]. The fulvic and humic
acids exhibit very similar compositional breakdowns to one another, with the carboxyl functional group
dominating. Phenolic-C/ketone C=O is present in higher proportions than observed in the pure biomass
burning particles (Yosemite and Flagstaff) and a greater amount of aromatic-C is present. The same
functional groups are present all three HULIS samples, but the relative proportion of these differs.
Alcohol/O-alkyl-C is the dominant functional group in the Suwannee River aquatic NOM sample, while
carboxyl is most prevalent in the Suwannee River fulvic and humic acid samples. Aromatic-C is present
in much lower quantities in the Suwannee River aquatic NOM, which is consistent with the pure

20
biomass burn samples. Suwannee River aquatic NOM also has a sp2 hybridization value of 7%, which is
more comparable with the biomass burn samples. This value is considerably lower than for the
Suwannee River humic and fulvic acids, 28 and 29%, respectively. Benzoquinone is not present in the
three HULIS samples studied.
Overall, the biomass burn particles studied are better represented by HULIS than BC SRMs. This
is determined by greater similarities in C/O ratios, % sp2 hybridization values and higher amounts of
oxygenated functional groups and lower amounts of aromatic-C. However, the relative proportions of
the functional groups present in the HULIS and biomass burn particles studied differs. Humic and fulvic
acids are not a single chemical species, but rather a very complex mix of natural material, which exhibit
an extremely wide range of physical and chemical properties. Therefore, it is no surprise that these do
not provide an exact match to atmospheric biomass burn aerosol, which itself is variable. HULIS is
effectively part of the starting material, which then undergoes combustion to produce biomass burn
aerosol. Therefore, it should be expected that chemical evolution during the combustion process will
result in differences in the relative amounts of functional groups present in both species.
4. Concluding Remarks
We demonstrate that STXM coupled with NEXAFS spectroscopy provides a unique method for
performing detailed studies of local chemical bonding, C/O ratios and structural ordering of single
atmospheric particles, BC and HULIS SRMs. Comparison of NEXAFS spectral signatures enables
assessment of the suitability of SRMs for representing the diverse range of atmospheric particles
sampled. This diversity is present for particles sampled during different field campaigns and at one
location over a short time period. This may be due to the influence of different sources as well as the
complicated and undefined process of atmospheric aging. As a result, no one standard provides a unique
representation of a certain class of atmospheric particles. However, it is possible to categorize
atmospheric particles by the dominant functional groups present, the degree of sp2 hybridization and
their C/O ratios. Using these criteria, it may be possible to differentiate between BC and biomass burn
atmospheric particles.
BC atmospheric particles are characterized by a high proportion of the aromatic-C functional
group, the presence of benzoquinone, high % sp2 hybridization (indicating some structural ordering) and
higher C/O ratios than for biomass burn particles. In contrast, biomass burn particles have lower

21
amounts of aromatic-C, low % sp2 hybridization and high oxygenation relative to BC particles. More
specifically, we deduce that a high proportion of the BC atmospheric particles display characteristic
features similar to flame generated soot, while others appear similar to resistively heated graphite and
diesel soot. The biomass burn particles studied here display compositions and structural ordering
dissimilar to the BC SRMs studied and are better represented by HULIS. Figure 9 illustrates these
conclusions by plotting the mean percentage contribution of each functional group to the total carbon in
the sample. Quinone-C, aromatic-C and the sum of all oxygen containing functional groups are
presented for the four classes of materials. As there is some ambiguity about the assignment of the
aliphatic-C/aromatic carbonyl functional group at 287.4 eV, this transition is assumed to contribute fully
to the sum of the oxygen containing functional groups in Figure 9; therefore the data presents an upper
limit.
This combined data supports the recommendation by the ISCBCRM of n-hexane soot as a SRM
for atmospheric BC. However, HULIS may provide a better representation of some biomass burn
particles. Knowledge of other structural and chemical properties in addition to those studied here (light
scattering and absorption properties, surface functionality, and porosity to name a few), are important
for the recommendation of a SRM to represent atmospheric aerosol. Recent work by Kirchstetter and
Novakov suggests the use of soot produced in an inverted methane/air diffusion flame for evaluating BC
light absorption measurement methods. This soot is uniquely composed of BC, with a reported single
scattering albedo of 0.15 and a mass absorption efficiency of 8.5 m2 g-1 [Kirchstetter and Novakov,
submitted]. This soot was studied here is representative of some atmospheric BC, thus it may be a useful
BC SRM.
Acknowledgements
This work was supported by the U.S. Department of Energy’s Atmospheric Science Program
(Office of Science, BER) and the Division of Chemical Science, Geoscience, Bioscience, Materials
Science and the Office of Basic Energy Sciences, of the U.S. Department of Energy at the Advanced
Light Source and Lawrence Berkeley National Laboratory under contract number DE-AC03-76S00098.
ALS beamline scientists T. Tyliszczak and A. L. D. Kilcoyne are thanked for support at beamlines
11.0.2 and 5.3.2, respectively. M. Gershenzon, J. L. Hand, T. W. Kirchstetter, A. Laskin, H. A.
Michelson, K. A. Prather, M. S. Robinson, L. M. Russell and D. M. Smith are gratefully acknowledged
for supplying samples. A. Braun and C. Lenardi are thanked for the use of NEXAFS spectra they
recorded. B. D. M acknowledges support from the Laboratory Science Teacher Professional
22
Development Program, Office of Science, U.S. Department of Energy. L. M. Russell acknowledges
support for collection of ACE-Asia samples, which was provided by NSF grant ATM-0002035.
References Akhter, M. S., Chughtai, A. R. & Smith, D. M. (1985), The structure of hexane soot I: Spectroscopic studies, Applied Spectroscopy, 39, 143-153. Andreae, M. O. & Gelencser, A. (2006), Black carbon or brown carbon? The nature of light-absorbing carbonaceous aerosols, Atmospheric Chemistry and Physics, 6, 3131-3148. Berger, S. D., McKenzie, D. R. & Martin, P. J. (1988), EELS analysis of vacuum arc-deposited diamond-like films, Philosophical Magazine Letters, 57, 285-290. Bond, T. C. & Bergstrom, R. W. (2006), Light absorption by carbonaceous particles: An investigative review, Aerosol Science and Technology, 40, 27-67. Braun, A., Shah, N., Huggins, F. E., Huffman, G. P., Wirick, S., Jacobsen, C., Kelly, K. & Sarofim, A. F. (2004), A study of diesel PM with X-ray microspectroscopy, Fuel, 83, 997-1000. Chughtai, A. R., Brooks, M. E. & Smith, D. M. (1996), Hydration of black carbon, Journal of Geophysical Research-Atmospheres, 101, 19505-19514. Chughtai, A. R., Kim, J. M. & Smith, D. M. (2002), The effect of air/fuel ratio on properties and reactivity of combustion soots, Journal of Atmospheric Chemistry, 43, 21-43. Chughtai, A. R., Miller, N. J., Smith, D. M. & Pitts, J. R. (1999a), Carbonaceous particle hydration III, Journal of Atmospheric Chemistry, 34, 259-279. Chughtai, A. R., Williams, G. R., Atteya, M. M. O., Miller, N. J. & Smith, D. M. (1999b), Carbonaceous particle hydration, Atmospheric Environment, 33, 2679-2687. Chung, S. H. & Seinfeld, J. H. (2005), Climate response of direct radiative forcing of anthropogenic black carbon, Journal of Geophysical Research-Atmospheres, 110, doi:10.1029/2004JD005441. Cody, G. D., Ade, H., Wirick, S., Mitchell, G. D. & Davis, A. (1998), Determination of chemical-structural changes in vitrinite accompanying luminescence alteration using C-NEXAFS analysis, Organic Geochemistry, 28, 441-455. Cody, G. D., Botto, R. E., Ade, H., Behal, S., Disko, M. & Wirick, S. (1995), Inner-shell spectroscopy and imaging of a subbituminous coal: in-situ analysis of organic and inorganic microstructure using C(1s)-NEXAFS, Ca(2p)-NEXAFS, and C1(2s)-NEXAFS, Energy & Fuels, 9, 525-533. Coffman, F. L., Cao, R., Pianetta, P. A., Kapoor, S., Kelly, M. & Terminello, L. J. (1996), Near-edge X-ray absorption of carbon materials for determining bond hybridization in mixed sp2/sp3 bonded materials, Applied Physics Letters, 69, 568-570.
23
Currie, L. A., Benner, B. A., Kessler, J. D., Klinedinst, D. B., Klouda, G. A., Marolf, J. V., Slater, J. F., Wise, S. A., Cachier, H., Cary, R., Chow, J. C., Watson, J., Druffel, E. R. M., Masiello, C. A., Eglinton, T. I., Pearson, A., Reddy, C. M., Gustafsson, O., Quinn, J. G., Hartmann, P. C., Hedges, J. I., Prentice, K. M., Kirchstetter, T. W., Novakov, T., Puxbaum, H. & Schmid, H. (2002), A critical evaluation of interlaboratory data on total, elemental, and isotopic carbon in the carbonaceous particle reference material, NIST SRM 1649a, Journal of Research of the National Institute of Standards and Technology, 107, 279-298. di Stasio, S. & Braun, A. (2006), Comparative NEXAFS study on soot obtained from an ethylene/air flame, a diesel engine, and graphite, Energy & Fuels, 20, 187-194. Fine, P. M., Cass, G. R. & Simoneit, B. R. T. (2001), Chemical characterization of fine particle emissions from fireplace combustion of woods grown in the northeastern United States, Environmental Science & Technology, 35, 2665-2675. Goldberg, E. D. (1985), Black carbon in the environment, Wiley, New York. Hand, J. L., Malm, W. C., Laskin, A., Day, D., Lee, T., Wang, C., Carrico, C., Carrillo, J., Cowin, J. P., Collett, J. & Iedema, M. J. (2005), Optical, physical, and chemical properties of tar balls observed during the Yosemite Aerosol Characterization Study, Journal of Geophysical Research-Atmospheres, 110, doi:10.1029/2004JD005728. Havers, N., Burba, P., Lambert, J. & Klockow, D. (1998), Spectroscopic characterization of humic-like substances in airborne particulate matter, Journal of Atmospheric Chemistry, 29, 45-54. Henke, B. L., Lee, P., Tanaka, T. J., Shimabukuro, R. L. & Fuikawa, B. K. (1982), Low-energy X-ray interaction coefficients: Photoabsorption, scattering, and reflection : E = 100-2000 eV Z = 1-94, Atomic Data and Nuclear Data Tables, 27, 1-144. Hitchcock, A. P., Koprinarov, I., Tylisczcak, T., Rightor, E. G., Mitchell, G. E., Dineen, M. T., Hayes, F., Lidy, W., Priester, R. D., Urquhart, S. G., Smith, A. P. & Ade, H. (2001), Optimization of scanning transmission X-ray microscopy for the identification and quantitation of reinforcing particles in polyurethanes, Ultramicroscopy, 88, 33-49. Hoffer, A., Gelencser, A., Guyon, P., Kiss, G., Schmid, O., Frank, G. P., Artaxo, P. & Andreae, M. O. (2006), Optical properties of humic-like substances (HULIS) in biomass-burning aerosols, Atmospheric Chemistry and Physics, 6, 3563-3570. Huggins, F. E., Huffman, G. P. & Robertson, J. D. (2000), Speciation of elements in NIST particulate matter SRMs 1648 and 1650, Journal of Hazardous Materials, 74, 1-23. International Humic Substances Society http://www.ihss.gatech.edu/. Jacobson, M. Z. (2001), Strong radiative heating due to the mixing state of black carbon in atmospheric aerosols, Nature, 409, 695-697. Jacobson, M. Z. (2004), Climate response of fossil fuel and biofuel soot, accounting for soot's feedback to snow and sea ice albedo and emissivity, Journal of Geophysical Research-Atmospheres, 109, doi:10.1029/2004JD004945.

24
Jones, G. S., Jones, A., Roberts, D. L., Stott, P. A. & Williams, K. D. (2005), Sensitivity of global-scale climate change attribution results to inclusion of fossil fuel black carbon aerosol, Geophysical Research Letters, 32, doi:10.1029/2005GL023370. Kirchstetter, T. W. & Novakov, T. (submitted), Controlled generation of black carbon particles from a diffusion flame and applications in evaluating BC measurement methods, Atmos. Environ. Kiss, G., Varga, B., Gelencser, A., Krivacsy, Z., Molnar, A., Alsberg, T., Persson, L., Hansson, H. C. & Facchini, M. C. (2001), Characterisation of polar organic compounds in fog water, Atmospheric Environment, 35, 2193-2200. Krivacsy, Z., Gelencser, A., Kiss, G., Meszaros, E., Molnar, A., Hoffer, A., Meszaros, T., Sarvari, Z., Temesi, D., Varga, B., Baltensperger, U., Nyeki, S. & Weingartner, E. (2001), Study on the chemical character of water soluble organic compounds in fine atmospheric aerosol at the Jungfraujoch, Journal of Atmospheric Chemistry, 39, 235-259. Krivacsy, Z., Kiss, G., Varga, B., Galambos, I., Sarvari, Z., Gelencser, A., Molnar, A., Fuzzi, S., Facchini, M. C., Zappoli, S., Andracchio, A., Alsberg, T., Hansson, H. C. & Persson, L. (2000), Study of humic-like substances in fog and interstitial aerosol by size-exclusion chromatography and capillary electrophoresis, Atmospheric Environment, 34, 4273-4281. Laskin, A., Cowin, J. P. & Iedema, M. J. (2006), Analysis of individual environmental particles using modern methods of electron microscopy and X-ray microanalysis, Journal of Electron Spectroscopy and Related Phenomena, 150, 260-274. Laskin, A., Iedema, M. J. & Cowin, J. P. (2003), Time-resolved aerosol collector for CCSEM/EDX single-particle analysis, Aerosol Science and Technology, 37, 246-260. Lenardi, C., Marino, M., Barborini, E., Piseri, P. & Milani, P. (2005), Evaluation of hydrogen chemisorption in nanostructured carbon films by near edge X-ray absorption spectroscopy, European Physical Journal B, 46, 441-447. Lenardi, C., Piseri, P., Briois, V., Bottani, C. E., Bassi, A. L. & Milani, P. (1999), Near-edge X-ray absorption fine structure and Raman characterization of amorphous and nanostructured carbon films, Journal of Applied Physics, 85, 7159-7167. Limbeck, A., Kulmala, M. & Puxbaum, H. (2003), Secondary organic aerosol formation in the atmosphere via heterogeneous reaction of gaseous isoprene on acidic particles, Geophysical Research Letters, 30, doi:10.1029/2003GL017738. Ma, Y., Chen, C. T., Meigs, G., Randall, K. & Sette, F. (1991), High-resolution K-shell photoabsorption measurements of simple molecules, Physical Review A, 44, 1848-1858. Maria, S. F., Russell, L. M., Gilles, M. K. & Myneni, S. C. B. (2004), Organic aerosol growth mechanisms and their climate-forcing implications, Science, 306, 1921-1924. Masiello, C. & Schmidt, M. W. I. (1999), International Steering Committee for Black Carbon Reference Materials, (http://www.du.edu/~dwismith/bcsteer.html.

25
Mertes, S., Dippel, B. & Schwarzenbock, A. (2004), Quantification of graphitic carbon in atmospheric aerosol particles by Raman spectroscopy and first application for the determination of mass absorption efficiencies, Journal of Aerosol Science, 35, 347-361. Michelson, H. A., Tivanski, A. V., van Poppel, L., Dansson, M. A., Gilles, M. K. & Buseck, P. (2007), New particle formation from pulsed laser irradiation of soot aggregates studied with SMPS, TEM, NEXAFS and modeling, Applied Optics, 46, 959-977. Mukai, H. & Ambe, Y. (1986), Characterization of a humic-like brown substance in airborne particulate matter and tentative identification of its origin, Atmospheric Environment, 20, 813-819. Myneni, S. C. B. (2002), Soft X-ray spectroscopy and spectromicroscopy studies of organic molecules in the environment, in Applications of Synchrotron Radiation in Low-Temperature Geochemistry and Environmental Sciences, edited, pp. 485-579, Mineralogical Soc America, Washington. Posfai, M., Gelencser, A., Simonics, R., Arato, K., Li, J., Hobbs, P. V. & Buseck, P. R. (2004), Atmospheric tar balls: Particles from biomass and biofuel burning, Journal of Geophysical Research-Atmospheres, 109, doi:10.1029/2003JD004169. Richter, H. & Howard, J. B. (2000), Formation of polycyclic aromatic hydrocarbons and their growth to soot - a review of chemical reaction pathways, Progress in Energy and Combustion Science, 26, 565-608. Rogaski, C. A., Golden, D. M. & Williams, L. R. (1997), Reactive uptake and hydration experiments on amorphous carbon treated with NO2, SO2, O3, HNO3, and H2SO4, Geophysical Research Letters, 24, 381-384. Rogge, W. F., Hildemann, L. M., Mazurek, M. A., Cass, G. R. & Simoneit, B. R. T. (1998), Sources of fine organic aerosol. 9. Pine, oak and synthetic log combustion in residential fireplaces, Environmental Science & Technology, 32, 13-22. Rosen, H. & Novakov, T. (1977), Raman scattering and characterization of atmospheric aerosol particles, Nature, 266, 708-710. Russell, L. M., Maria, S. F. & Myneni, S. C. B. (2002), Mapping organic coatings on atmospheric particles, Geophysical Research Letters, 29, doi:10.1029/2002GL014874. Sasaki, J., Aschmann, S. M., Kwok, E. S. C., Atkinson, R. & Arey, J. (1997), Products of the gas-phase OH and NO3 radical-initiated reactions of naphthalene, Environmental Science & Technology, 31, 3173-3179. Scheinost, A. C., Kretzschmar, R., Christl, I. & Jacobsen, C. (2001), Humic substances: structures, models and functions, Royal Society of Chemistry, Cambridge. Stöhr, J. (2003), NEXAFS Spectroscopy, First ed., Springer-Verlag, Berlin Heidelberg.

26
Su, D. S., Muller, J. O., Jentoft, R. E., Rothe, D., Jacob, E. & Schlogl, R. (2004), Fullerene-like soot from EuroIV diesel engine: consequences for catalytic automotive pollution control, Topics in Catalysis, 30-31, 241-245. Sze, S. K., Siddique, N., Sloan, J. J. & Escribano, R. (2001), Raman spectroscopic characterization of carbonaceous aerosols, Atmospheric Environment, 35, 561-568. Tivanski, A. V., Hopkins, R. J. & Gilles, M. K. (submitted), Oxygenated interface on biomass burn tar balls determined by single particle scanning transmission X-ray microscopy, Journal of Physical Chemistry A. Urquhart, S. G. & Ade, H. (2002), Trends in the carbonyl core (C 1s, O 1s) -> pi*c=o transition in the near-edge X-ray absorption fine structure spectra of organic molecules, Journal of Physical Chemistry B, 106, 8531-8538. Urquhart, S. G., Ade, H., Rafailovich, M., Sokolov, J. S. & Zhang, Y. (2000), Chemical and vibronic effects in the high-resolution near-edge X-ray absorption fine structure spectra of polystyrene isotopomers, Chemical Physics Letters, 322, 412-418. Urquhart, S. G., Smith, A. P., Ade, H. W., Hitchcock, A. P., Rightor, E. G. & Lidy, W. (1999), Near-edge X-ray absorption fine structure spectroscopy of MDI and TDI polyurethane polymers, Journal of Physical Chemistry B, 103, 4603-4610. Warwick, T., Ade, H., Kilcoyne, D., Kritscher, M., Tylisczcak, T., Fakra, S., Hitchcock, A., Hitchcock, P. & Padmore, H. (2002), A new bend-magnet beamline for scanning transmission X-ray microscopy at the Advanced Light Source, Journal of Synchrotron Radiation, 9, 254-257. Wentzel, M., Gorzawski, H., Naumann, K. H., Saathoff, H. & Weinbruch, S. (2003), Transmission electron microscopical and aerosol dynamical characterization of soot aerosols, Journal of Aerosol Science, 34, 1347-1370. Wyslouzil, B. E., Carleton, K. L., Sonnenfroh, D. M., Rawlins, W. T. & Arnold, S. (1994), Observation of hydration of single, modified carbon aerosols, Geophysical Research Letters, 21, 2107-2110. Zappoli, S., Andracchio, A., Fuzzi, S., Facchini, M. C., Gelencser, A., Kiss, G., Krivacsy, Z., Molnar, A., Meszaros, E., Hansson, H. C., Rosman, K. & Zebuhr, Y. (1999), Inorganic, organic and macromolecular components of fine aerosol in different areas of Europe in relation to their water solubility, Atmospheric Environment, 33, 2733-2743.
27
Table 1
Category Sample % sp2
C/O
BC SRMs HOPG 100 100/0 RHG 69 96/4 MG 66 n-Hexane soot 66 87/13 Ethylene soot 63 84/16 Methane soot 60 84/16 Diesel exhaust soot 56 Palas soot 52 Amorphous carbon 41
BC Aerosol MILAGRO (i) 82 99/1 MILAGRO (h) 76 84/16 NIST (l) 71 85/15 NIST (k) 45 76/24 MILAGRO (g) 40 82/18 NIST (j) 29 35/65
HULIS Fulvic acid 1S101F 29 54/46 From Suwannee River Humic acid 2S101H 28 58/42
Aquatic NOM 1R101N 7 63/37 Biomass Burn Aerosol ACE-Asia (c) 41
ACE-Asia (d) 34 MILAGRO (f) 10 65/35 Yosemite ‘tar balls’ 9 55/45 MILAGRO (e) 6 67/32 Flagstaff 5 53/47
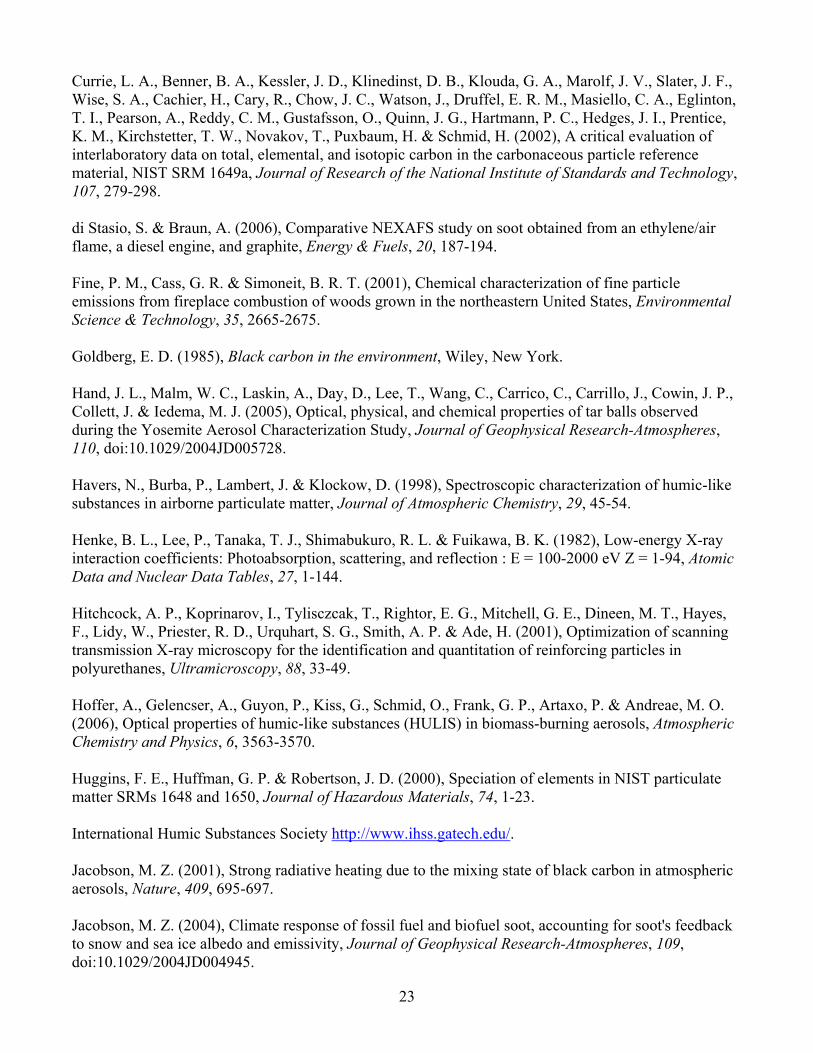
Table 1 − % sp2 hybridization values and selected C/O ratios for BC reference materials, HULIS and
atmospheric samples studied. Where no value is presented in the C/O column, no O K-edge NEXAFS
spectrum was recorded.
28
Figure 1
Figure 1 – Schematic showing the key components of the scanning transmission X-ray microscope at beamlines 5.3.2 and 11.0.2 of the Advanced Light Source, Berkeley.
Figure 2 – STXM images, presented on the same optical density scale, of a black carbon particle collected during the MILAGRO field campaign (a) pre-edge, 280 eV, (b) 1s-π* aromatic C=C, 285.3 eV, (c) 1s-σ* aromatic C=C, 292 eV and (d) post-edge, 320 eV. The higher image contrast at 285.3 and 292 eV relative to the pre-edge shows the presence of aromatic C=C.

29
Figure 3 − Carbon K-edge NEXAFS spectra of surrogate soot samples (a) amorphous carbon, (b) Palas soot, (c) diesel exhaust soot [di Stasio and Braun, 2006], (d) methane soot, (e) ethylene soot, (f) n-hexane soot, (g) micronized graphite, (h) resistively heated graphite, (i) highly oriented pyrolytic graphite [Lenardi, et al., 2005]. Spectra with similar contours are categorized using dotted and dashed lines in addition to different grey shades (see text for full details).

30
Figure 4 – Carbon K-edge NEXAFS spectra of atmospheric samples (a) Flagstaff, AZ, (b) Yosemite National Park, CA, (c) and (d) ACE Asia, (e), (f), (g), (h), and (i) MILAGRO and (j), (k) and (l) NIST.

31
Figure 5 – Carbon K-edge NEXAFS spectra of HULIS standards (a) Suwannee River aquatic NOM 1R101N, (b) Suwannee River humic acid 2S101H and (c) Suwannee River fulvic acid 1S101F.
Figure 6 – Carbon K-edge NEXAFS spectra and peak assignments of (a) ethylene soot and (b) a particle collected from Flagstaff, AZ. Different grey shades and line styles indicate specific peak assignments in the spectral fit.
32
Figure 7 – Oxygen K-edge spectra of (a) ethylene soot and (b) a particle collected from a biomass burn in Flagstaff, AZ. The black lines and dotted grey lines indicate the assignment of resonance transitions occurring in spectra (a) and (b), respectively.
33
Figure 8 – Compositional breakdown of (a) BC SRMs, (b) anthropogenic combustion atmospheric particles, (c) biomass burn atmospheric particles and (d) HULIS. Composition is presented as the % contribution of each functional group to the total carbon in the sample, calculated from the integral of the resonances divided by the integral of the C K-edge spectrum from 280 − 320 eV. Where no symbol is present, a value of 0 % contribution is assumed.

34
Figure 9
Figure 9 − Summary of the compositional breakdowns shown in Figures 8(a) – (d) for the four classes
of materials studied (BC SRMs, BC particles, HULIS and biomass burn particles). The mean percentage
that each functional group contributes to the total carbon in the sample is plotted for the four classes of
materials for quinone, aromatic and the sum of all oxygen containing functional groups.