rlw analytics, inc., coincidence factor study, residential and
TRANSCRIPT

Coincidence Factor Study Residential and Commercial Industrial Lighting Measures
Prepared for; New England State Program Working
Group (SPWG)
For use as an Energy Efficiency Measures/Programs
Reference Document for the ISO Forward Capacity Market (FCM)
Spring 2007
Prepared for: New England State
Program Working Group (SPWG)
Prepared by:
179 Main Street
Middletown, CT 06457 (860) 346-5001
Acknowledgement:
The authors wish to thank all of the people at the State Program Working Group (SPWG), Northeast Energy Efficiency Partnership (NEEP) who took the time to support and help with this study. Regrettably, we cannot thank everyone individually, but we do want to acknowledge the contributions made by Julie Michaels, Jeff Schlegel Tom Belair, Carol White, Chris Neme and Ralph Prahl. The data, insight, and support provided by these individuals helped to establish the foundation for this report. RLW assumes sole responsibility for any errors or omissions in this report.
Table of Contents
EXECUTIVE SUMMARY ..................................................................................................................... I Residential Lighting Coincidence Factor Results .......................................................................II Commercial & Industrial Lighting Coincidence Factor Results .................................................V Commercial & Industrial Occupancy Sensor Coincidence Factor Results ............................... IX Program Level C&I Lighting CF Calculations.........................................................................XII On-Peak Large and Small C&I Lighting Coincidence Factors ...............................................XIII Seasonal Peak Large and Small C&I Lighting Coincidence Factors ......................................XIII Comparison of On-Peak and Seasonal Peak CFs for C&I Lighting....................................... XIV Commercial & Industrial Interactive Demand Coincidence Factors........................................XV Combined C&I Lighting and Interactive Demand Coincidence Factors............................... XVII
1 INTRODUCTION ........................................................................................................................ 1 1.1 Primary Goals and Objectives........................................................................................ 1
2 DESCRIPTION AND METHODOLOGY......................................................................................... 2 3 CALCULATING SEASONAL PEAK PERFORMANCE HOURS........................................................ 4 4 CALCULATION OF CRITICAL PEAK PERFORMANCE HOURS..................................................... 6 5 RESIDENTIAL LIGHTING COINCIDENCE FACTOR ANALYSIS ................................................... 8
5.1 Available Primary Metered Data for Residential Lighting ............................................ 8 5.2 Analysis of Weighted vs. Un-weighted Residential Lighting Data ............................... 9 5.3 Residential Lighting On-Peak Coincidence Factors .................................................... 11 5.4 Calculating Residential Lighting Seasonal Peak Coincidence Factors ........................ 12 5.5 Comparison of Residential Lighting On-Peak and Seasonal Peak Results.................. 13
6 COMMERCIAL AND INDUSTRIAL LIGHTING ........................................................................... 15 6.1 C&I Lighting Logger Data........................................................................................... 15 6.2 Commercial & Industrial Lighting Profiles ................................................................. 16 6.3 Commercial & Industrial Lighting Coincidence Factors ............................................. 18 6.4 On-Peak C&I Lighting Coincidence Factors ............................................................... 18 6.5 Seasonal Peak C&I Lighting Coincidence Factors ...................................................... 19 6.6 Comparison of On-Peak and Seasonal Peak C&I Lighting CFs.................................. 21 6.7 Commercial & Industrial Occupancy Sensor Coincidence Factors ............................. 22 6.8 On-Peak C&I Occupancy Sensor Coincidence Factors ............................................... 23 6.9 Seasonal Peak C&I Occupancy Sensor Coincidence Factors ...................................... 24 6.10 Comparison of On-Peak and Seasonal Peak C&I Occupancy Sensor CFs.................. 26 6.11 C&I Lighting Interactive Effects ................................................................................. 27
7 ADDRESSING STATISTICAL SAMPLING BIAS AND MEASUREMENT ERROR ........................... 29 7.1 Accuracy and Calibration of Measurement Tools ....................................................... 29 7.2 Measurement Error ...................................................................................................... 30 7.3 Sensor Placement Bias ................................................................................................. 31 7.4 Sample Selection Bias.................................................................................................. 33 7.5 Other Possible Bias ...................................................................................................... 34 7.6 Bias Summary.............................................................................................................. 35
8 PROGRAM LEVEL C&I LIGHTING CF CALCULATIONS .......................................................... 36 8.1 C&I Lighting Data by Program ................................................................................... 36

8.2 Comparison of C&I Lighting Profiles.......................................................................... 36 8.3 Large and Small C&I Lighting Coincidence Factors................................................... 37 8.4 On-Peak Large and Small C&I Lighting Coincidence Factors.................................... 37 8.5 Seasonal Peak Large and Small C&I Lighting Coincidence Factors........................... 38 8.6 Comparison of On-Peak and Seasonal Peak CFs for C&I Lighting ............................ 39 8.7 Commercial & Industrial Interactive Demand Coincidence Factors ........................... 40 8.8 Combined C&I Lighting and Interactive Demand Coincidence Factors ..................... 43
APPENDIX A – DATA SOURCES ..................................................................................................... 45 Residential Lighting Logger Data Sources................................................................................ 46 Commercial & Industrial Lighting Logger Data Sources ......................................................... 47
Index of Tables
Table 1: Seasonal Peak Forecasts.................................................................................................... 4 Table 2: Analysis of Post SMD Critical Peak Performance Hours ................................................. 8 Table 3: Residential Logger Data.................................................................................................... 9 Table 4: Seasonal Residential Logger Data..................................................................................... 9 Table 5: Summer On-Peak CFs and Relative Precisions Residential Lighting............................. 11 Table 6: Winter On-Peak CFs and Relative Precisions Residential Lighting ............................... 12 Table 7: Summer Seasonal Peak Coincidence Factors Residential Lighting ................................ 12 Table 8: Winter Seasonal Peak Coincidence Factors Residential Lighting ................................. 13 Table 9: Comparison of Summer On-Peak and Seasonal Peak CFs Residential Lighting............ 13 Table 10: Comparison of Winter On-Peak and Seasonal Peak CFs Residential Lighting ............ 14 Table 11: C&I Lighting Logger Data ............................................................................................ 15 Table 12: Summer On-Peak Coincidence Factors C&I Lighting................................................. 18 Table 13: Winter On-Peak Coincidence Factors C&I Lighting ................................................... 19 Table 14: Summer Seasonal Peak Coincidence Factors C&I Lighting......................................... 20 Table 15: Winter Seasonal Peak Coincidence Factors C&I Lighting ........................................... 21 Table 16: Comparison of Summer On-Peak and Seasonal Peak CFs C&I Lighting..................... 22 Table 17: Comparison of Winter On-Peak and Seasonal Peak CFs C&I Lighting ....................... 22 Table 18: Summer On-Peak Coincidence Factors C&I Occupancy Sensors ............................... 23 Table 19: Winter On-Peak Coincidence Factors C&I Occupancy Sensors.................................. 24 Table 20: Summer Seasonal Peak Coincidence Factors C&I Occupancy Sensors ....................... 25 Table 21: Winter Seasonal Peak Coincidence Factors C&I Occupancy Sensors.......................... 26 Table 22: Comparison of Summer On-Peak and Seasonal Peak CFs Occupancy Sensors .......... 26 Table 23: Comparison of Winter On-Peak and Seasonal Peak CFs Occupancy Sensors.............. 27 Table 24: C&I Lighting Data Sources........................................................................................... 36 Table 25: Summer On-Peak Coincidence Factors Large and Small C&I Lighting...................... 38 Table 26: Winter On-Peak Coincidence Factors Large and Small C&I Lighting ........................ 38 Table 27: Summer Seasonal Peak Coincidence Factors Large and Small C&I Lighting.............. 39 Table 28: Winter Seasonal Peak Coincidence Factors Large and Small C&I Lighting ................ 39 Table 29: Comparison of Summer On-Peak and Seasonal Peak CFs C&I Lighting..................... 40 Table 30: Comparison of Winter On-Peak and Seasonal Peak CFs C&I Lighting ....................... 40 Table 31: Interactive Summer On-Peak Coincidence Factors C&I Lighting............................... 42 Table 32: Interactive Winter On-Peak Coincidence Factors C&I Lighting ................................. 42 Table 33: Interactive Summer Seasonal Peak Coincidence Factors C&I Lighting...................... 43 Table 34: Interactive Winter Seasonal Peak Coincidence Factors C&I Lighting ........................ 43 Table 35: Combined Summer On-Peak Coincidence Factors C&I Lighting ............................... 44 Table 36: Combined Winter On-Peak Coincidence Factors C&I Lighting.................................. 44 Table 37: Combined Summer Seasonal Peak Coincidence Factors C&I Lighting ...................... 44
Table 38: Combined Winter Seasonal Peak Coincidence Factors C&I Lighting......................... 44
Index of Figures Figure 1: Distribution of Summer Seasonal Peak Hours................................................................. 5 Figure 2: Distribution of Winter Seasonal Peak Hours ................................................................... 6 Figure 3: Frequency of OP 4 Events by Year.................................................................................. 7 Figure 4: Comparison of Un-weighted and Weighted Summer Lighting Profiles ....................... 10 Figure 5: Comparison of Un-weighted and Weighted Winter Lighting Profiles .......................... 11 Figure 6: C&I Profiles for Non-Occupancy Sensor Lighting....................................................... 16 Figure 7: C&I Profiles for Occupancy Sensor Controlled Lighting.............................................. 17 Figure 8: Testing and Replacement of Lighting Logger Battery................................................... 30 Figure 9: Lighting Logger Installation and Calibration................................................................ 31 Figure 10: Comparison of Large C&I and Small C&I Lighting Profiles ..................................... 37

NECPUC New England State Working Group 2007 Coincidence Factor Study_________________________________________ Page I
_____________________________________________________________________________
March 25, 2007 Final REPORT
Executive Summary
The New England State Program Working Group (SPWG)1 contracted with RLW to calculate
coincidence factors for residential and commercial and industrial lighting measures that could be
consistently applied to energy efficiency programs that may bid into the ISO-NE Forward
Capacity Market (FCM) in any of the New England states. As directed by the SPWG, the focus
of this effort was on lighting measures.
Resulting coincidence factors presented in this report were developed to work as common values
accepted by all New England states for the FCM that can be applied or used as appropriate for
measures installed by energy efficiency programs in the New England states that have supported
this research effort.
This section of the report describes the analytical results and conclusions for the calculation of the
Coincidence Factors (CFs) for the Residential and Commercial and Industrial Lighting measures.
Energy Efficiency demand reductions can be classified in the Forward Capacity Market (FCM) as
one of three different types of assets, based upon the performance hours that will be used for
evaluation. The most straight forward type of asset is On-Peak, because the performance hours
are fixed and defined as follows:
• Summer On-Peak: average weekday from 1-5 PM throughout June, July and August.
• Winter On-Peak: average weekday from 5-7 PM throughout December and January.
ISO-NE hourly load data and forecast data were obtained for the past several years from recent
energy efficiency program evaluations throughout New England, as described in Appendix A.
They were analyzed to determine Seasonal Peak performance hours and Critical Peak
performance hours which are defined as follows:
• Seasonal Peak Hours occur when Real Time load is equal to or greater than 90% of the
50/50 seasonal peak load forecast during Summer (June – August) or Winter (December
and January) months.
1 Represented by the state regulatory agencies (CT DPUC, Maine PUC, MA DOER, NH PUC, RI PUC, and VT PSB) and associated energy efficiency program administrators (Cape Light Compact, Efficiency Maine, Efficiency Vermont, National Grid (MA, NH & RI), Northeast Utilities (CT&MA), NSTAR, PSNH, United Illuminating, and Unitil (MA&NH)).
NECPUC New England State Working Group 2007 Coincidence Factor Study_________________________________________Page II
_____________________________________________________________________________
March 25, 2007 Final REPORT
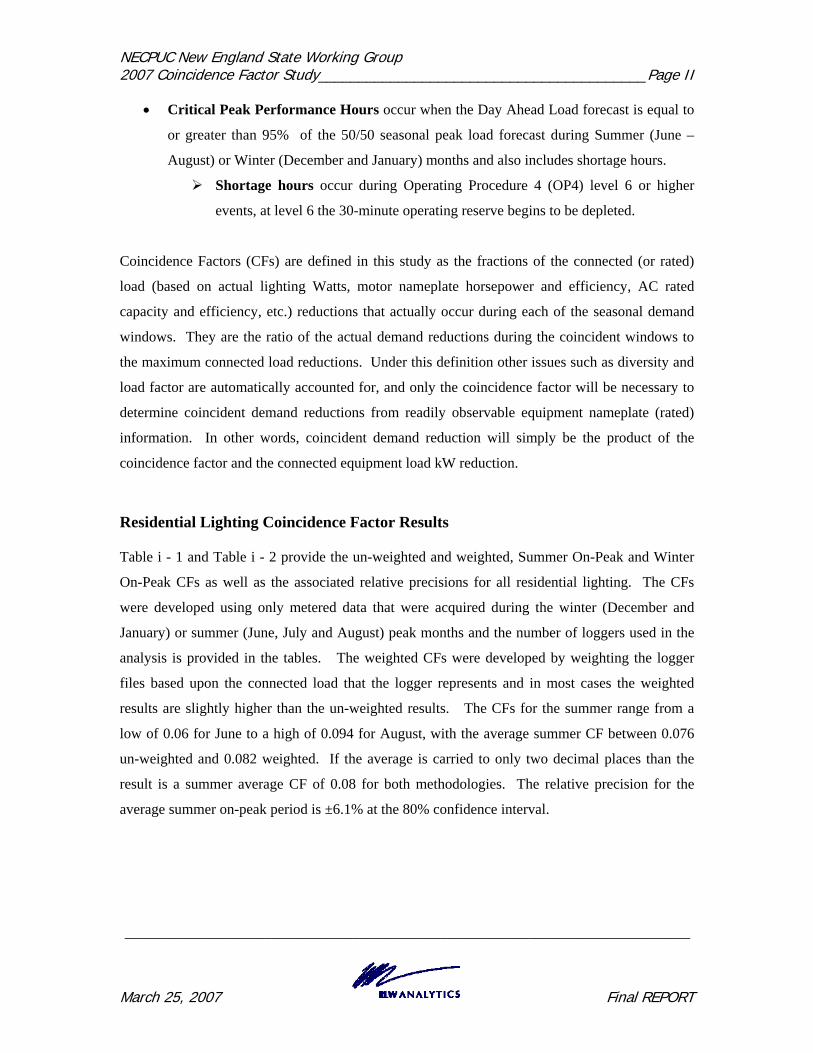
• Critical Peak Performance Hours occur when the Day Ahead Load forecast is equal to
or greater than 95% of the 50/50 seasonal peak load forecast during Summer (June –
August) or Winter (December and January) months and also includes shortage hours.
Shortage hours occur during Operating Procedure 4 (OP4) level 6 or higher
events, at level 6 the 30-minute operating reserve begins to be depleted.
Coincidence Factors (CFs) are defined in this study as the fractions of the connected (or rated)
load (based on actual lighting Watts, motor nameplate horsepower and efficiency, AC rated
capacity and efficiency, etc.) reductions that actually occur during each of the seasonal demand
windows. They are the ratio of the actual demand reductions during the coincident windows to
the maximum connected load reductions. Under this definition other issues such as diversity and
load factor are automatically accounted for, and only the coincidence factor will be necessary to
determine coincident demand reductions from readily observable equipment nameplate (rated)
information. In other words, coincident demand reduction will simply be the product of the
coincidence factor and the connected equipment load kW reduction.
Residential Lighting Coincidence Factor Results
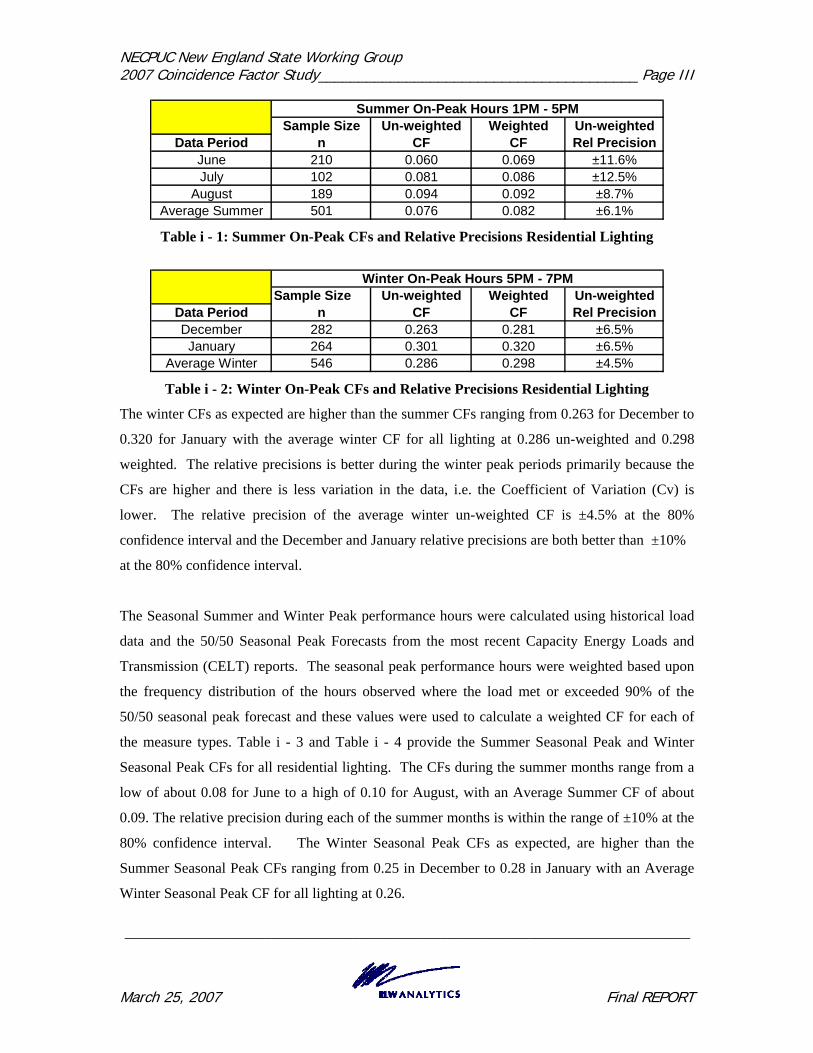
Table i - 1 and Table i - 2 provide the un-weighted and weighted, Summer On-Peak and Winter
On-Peak CFs as well as the associated relative precisions for all residential lighting. The CFs
were developed using only metered data that were acquired during the winter (December and
January) or summer (June, July and August) peak months and the number of loggers used in the
analysis is provided in the tables. The weighted CFs were developed by weighting the logger
files based upon the connected load that the logger represents and in most cases the weighted
results are slightly higher than the un-weighted results. The CFs for the summer range from a
low of 0.06 for June to a high of 0.094 for August, with the average summer CF between 0.076
un-weighted and 0.082 weighted. If the average is carried to only two decimal places than the
result is a summer average CF of 0.08 for both methodologies. The relative precision for the
average summer on-peak period is ±6.1% at the 80% confidence interval.
NECPUC New England State Working Group 2007 Coincidence Factor Study________________________________________ Page III
_____________________________________________________________________________
March 25, 2007 Final REPORT
Sample Size Un-weighted Weighted Un-weightedData Period n CF CF Rel Precision
June 210 0.060 0.069 ±11.6%July 102 0.081 0.086 ±12.5%
August 189 0.094 0.092 ±8.7%Average Summer 501 0.076 0.082 ±6.1%
Summer On-Peak Hours 1PM - 5PM
Table i - 1: Summer On-Peak CFs and Relative Precisions Residential Lighting
Sample Size Un-weighted Weighted Un-weightedData Period n CF CF Rel PrecisionDecember 282 0.263 0.281 ±6.5%January 264 0.301 0.320 ±6.5%
Average Winter 546 0.286 0.298 ±4.5%
Winter On-Peak Hours 5PM - 7PM
Table i - 2: Winter On-Peak CFs and Relative Precisions Residential Lighting
The winter CFs as expected are higher than the summer CFs ranging from 0.263 for December to
0.320 for January with the average winter CF for all lighting at 0.286 un-weighted and 0.298
weighted. The relative precisions is better during the winter peak periods primarily because the
CFs are higher and there is less variation in the data, i.e. the Coefficient of Variation (Cv) is
lower. The relative precision of the average winter un-weighted CF is ±4.5% at the 80%
confidence interval and the December and January relative precisions are both better than ±10%
at the 80% confidence interval.
The Seasonal Summer and Winter Peak performance hours were calculated using historical load
data and the 50/50 Seasonal Peak Forecasts from the most recent Capacity Energy Loads and
Transmission (CELT) reports. The seasonal peak performance hours were weighted based upon
the frequency distribution of the hours observed where the load met or exceeded 90% of the
50/50 seasonal peak forecast and these values were used to calculate a weighted CF for each of
the measure types. Table i - 3 and Table i - 4 provide the Summer Seasonal Peak and Winter
Seasonal Peak CFs for all residential lighting. The CFs during the summer months range from a
low of about 0.08 for June to a high of 0.10 for August, with an Average Summer CF of about
0.09. The relative precision during each of the summer months is within the range of ±10% at the
80% confidence interval. The Winter Seasonal Peak CFs as expected, are higher than the
Summer Seasonal Peak CFs ranging from 0.25 in December to 0.28 in January with an Average
Winter Seasonal Peak CF for all lighting at 0.26.

NECPUC New England State Working Group 2007 Coincidence Factor Study________________________________________ Page IV
_____________________________________________________________________________
March 25, 2007 Final REPORT
Sample Size Un-weighted Calculated CalculatedData Period n CF CV Rel Precision
June 210 0.075 2.275 ±6.3%July 102 0.091 1.884 ±5.3%
August 189 0.104 1.747 ±5.2%Average Summer 501 0.088 1.967 ±3.6%
Summer Seasonal Peak Hours (90% of 50/50 Peak)
Table i - 3: Summer Seasonal Peak CFs and Relative Precisions Residential Lighting
Sample Size Un-weighted Calculated CalculatedData Period n CF CV Rel PrecisionDecember 282 0.249 1.23 ±4.5%January 264 0.279 1.19 ±4.5%
Average Winter 546 0.264 1.21 ±3.2%
Winter Seasonal Peak Hours (90% of 50/50 peak)
Table i - 4: Winter Seasonal Peak CFs and Relative Precisions Residential Lighting
Table i - 5 and Table i - 6 presents a comparison of the CFs calculated for the On-Peak
Performance hours and the Seasonal Peak Performance hours for both the summer and winter
periods. The results show that the Summer Seasonal Peak CF increases over the Summer On-
Peak for each month during the summer period and the Average Summer CF increases by 16%
from 0.076 to 0.088. The increase is due to a wider range of hours being included in the weighted
average calculation including more evening hours, when the CFs are higher. The reverse is true
for the Winter Seasonal Peak CFs, which is lower than the Winter On-Peak CFs with the Average
Winter CF decreasing by 8% from about 0.29 to 0.26. The decrease is due to a wider range of
hours being included in the weighted average calculation including more morning and afternoon
hours, when the CFs are lower.
On-Peak Seasonal % ChangeUn-weighted Un-weighted Seasonal/
Data Period CF CF On-PeakJune 0.060 0.075 126%July 0.081 0.091 112%
August 0.094 0.104 111%Average Summer 0.076 0.088 116%
Table i - 5: Comparison of Summer On-Peak and Seasonal Peak CFs Residential Lighting

NECPUC New England State Working Group 2007 Coincidence Factor Study_________________________________________ Page V
_____________________________________________________________________________
March 25, 2007 Final REPORT
On-Peak Seasonal % Change
Un-weighted Un-weighted Seasonal/Data Period CF CF On-PeakDecember 0.263 0.249 95%January 0.301 0.279 93%
Average Winter 0.286 0.264 92% Table i - 6: Comparison of Winter On-Peak and Seasonal Peak CFs Residential Lighting
Commercial & Industrial Lighting Coincidence Factor Results
A similar Coincidence Factor analysis was also conducted for Commercial and Industrial
Lighting and Occupancy Sensor measures. The logger data were analyzed by sector so that
results could be applied to multiple programs with different participation rates among the
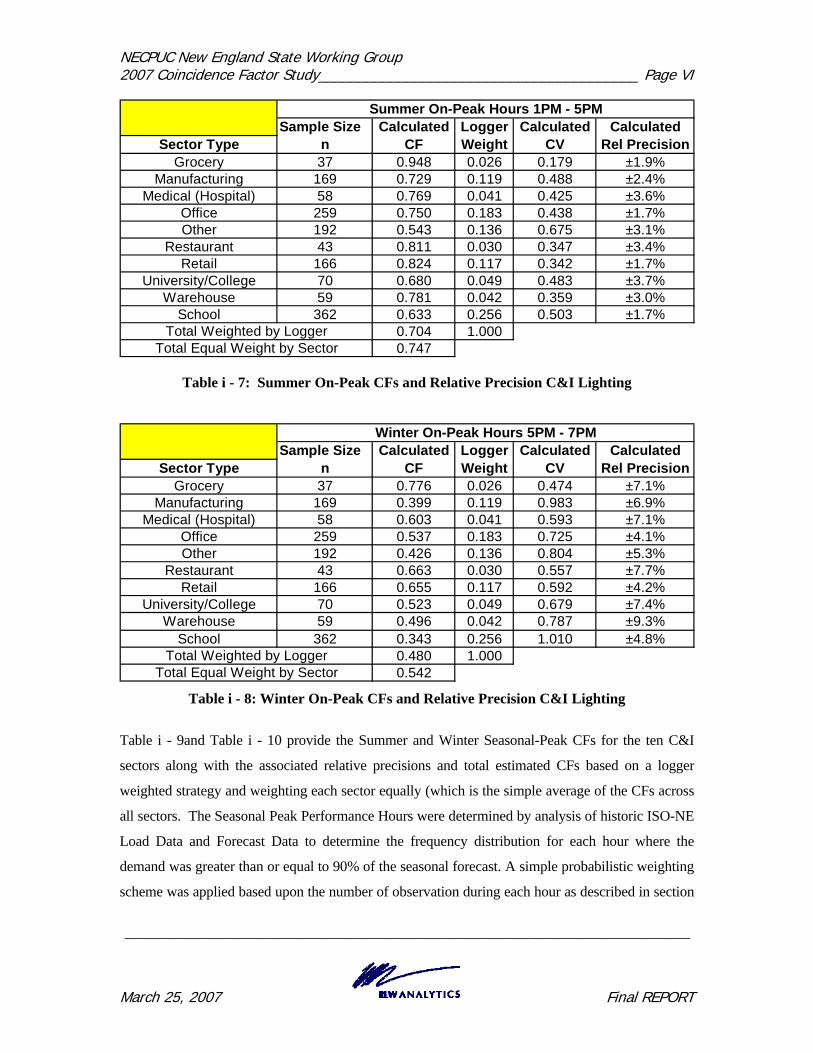
different sectors. Table i - 7and Table i - 8 provide the On-Peak CFs for the ten C&I sectors
along with the associated relative precisions and total estimated CFs based on a logger weighted
strategy and weighting each sector equally. The Summer On-Peak CFs indicates that the Grocery
sector has the highest CF of about 0.95, while the Other sector has the lowest CF of about 0.54.
All of the sectors have relative precisions that are within ± 5% at the 80% confidence interval.
The Grocery sector also had the highest Winter On-Peak CF of about 0.78, while the School
sector had the lowest CF of about 0.34. Once again the relative precisions were all quite good
with each sector exceeding ± 10% at the 80% confidence interval. As expected the Winter On-
Peak CFs were lower than the Summer On-Peak CFs for all of the C&I lighting sectors, because
the performance hours occur later in the day as C&I facilities are shutting down and lighting is
being switched off.
NECPUC New England State Working Group 2007 Coincidence Factor Study________________________________________ Page VI
_____________________________________________________________________________
March 25, 2007 Final REPORT
Sample Size Calculated Logger Calculated CalculatedSector Type n CF Weight CV Rel Precision
Grocery 37 0.948 0.026 0.179 ±1.9%Manufacturing 169 0.729 0.119 0.488 ±2.4%
Medical (Hospital) 58 0.769 0.041 0.425 ±3.6%Office 259 0.750 0.183 0.438 ±1.7%Other 192 0.543 0.136 0.675 ±3.1%
Restaurant 43 0.811 0.030 0.347 ±3.4%Retail 166 0.824 0.117 0.342 ±1.7%
University/College 70 0.680 0.049 0.483 ±3.7%Warehouse 59 0.781 0.042 0.359 ±3.0%
School 362 0.633 0.256 0.503 ±1.7%0.704 1.0000.747
Summer On-Peak Hours 1PM - 5PM
Total Weighted by LoggerTotal Equal Weight by Sector
Table i - 7: Summer On-Peak CFs and Relative Precision C&I Lighting
Sample Size Calculated Logger Calculated CalculatedSector Type n CF Weight CV Rel Precision
Grocery 37 0.776 0.026 0.474 ±7.1%Manufacturing 169 0.399 0.119 0.983 ±6.9%
Medical (Hospital) 58 0.603 0.041 0.593 ±7.1%Office 259 0.537 0.183 0.725 ±4.1%Other 192 0.426 0.136 0.804 ±5.3%
Restaurant 43 0.663 0.030 0.557 ±7.7%Retail 166 0.655 0.117 0.592 ±4.2%
University/College 70 0.523 0.049 0.679 ±7.4%Warehouse 59 0.496 0.042 0.787 ±9.3%
School 362 0.343 0.256 1.010 ±4.8%0.480 1.0000.542
Winter On-Peak Hours 5PM - 7PM
Total Weighted by LoggerTotal Equal Weight by Sector
Table i - 8: Winter On-Peak CFs and Relative Precision C&I Lighting
Table i - 9and Table i - 10 provide the Summer and Winter Seasonal-Peak CFs for the ten C&I
sectors along with the associated relative precisions and total estimated CFs based on a logger
weighted strategy and weighting each sector equally (which is the simple average of the CFs across
all sectors. The Seasonal Peak Performance Hours were determined by analysis of historic ISO-NE
Load Data and Forecast Data to determine the frequency distribution for each hour where the
demand was greater than or equal to 90% of the seasonal forecast. A simple probabilistic weighting
scheme was applied based upon the number of observation during each hour as described in section

NECPUC New England State Working Group 2007 Coincidence Factor Study________________________________________Page VII
_____________________________________________________________________________
March 25, 2007 Final REPORT
3 of this report. The Summer Seasonal-Peak CFs indicates that the Grocery sector has the highest
CF of about 0.90, while the Other sector has the lowest CF of about 0.48. All of the sectors have
relative precisions that are within ± 5% at the 80% confidence interval during the Summer Seasonal
Peak hours. The Grocery sector also had the highest Winter On-Peak CF of about 0.78, while the
School sector had the lowest CF of about 0.34. Once again the relative precisions were all quite
good with each sector exceeding ± 10% at the 80% confidence interval. As expected the Winter
On-Peak CFs were lower than the Summer On-Peak CFs for all of the C&I lighting sectors, because
the performance hours occur later in the day as C&I facilities are shutting down and lighting is
being switched off.
Sample Size Calculated Logger Calculated CalculatedSector Type n CF Weight CV Rel Precision
Grocery 37 0.904 0.026 0.23 ±1.5%Manufacturing 169 0.671 0.119 0.52 ±1.7%
Medical (Hospital) 58 0.740 0.041 0.45 ±2.5%Office 259 0.702 0.183 0.48 ±1.2%Other 192 0.476 0.136 0.75 ±3.0%
Restaurant 43 0.775 0.030 0.40 ±2.5%Retail 166 0.795 0.117 0.38 ±1.2%
University/College 70 0.650 0.049 0.51 ±2.5%Warehouse 59 0.727 0.042 0.41 ±2.2%
School 362 0.599 0.256 0.48 ±1.1%0.660 1.0000.704Total Equal Weight by Sector
Summer Seasonal Peak Hours (90% of 50/50 Peak)
Total Weighted by Logger
Table i - 9: Summer Seasonal Peak CFs and Relative Precision C&I Lighting

NECPUC New England State Working Group 2007 Coincidence Factor Study_______________________________________ Page VIII
_____________________________________________________________________________
March 25, 2007 Final REPORT
Sample Size Calculated Logger Calculated CalculatedSector Type n CF Weight CV Rel Precision
Grocery 37 0.770 0.026 0.44 ±4.6%Manufacturing 169 0.432 0.119 0.91 ±4.2%
Medical (Hospital) 58 0.618 0.041 0.58 ±4.5%Office 259 0.539 0.183 0.71 ±2.6%Other 192 0.428 0.136 0.80 ±4.4%
Restaurant 43 0.644 0.030 0.59 ±5.3%Retail 166 0.647 0.117 0.59 ±2.7%
University/College 70 0.528 0.049 0.60 ±4.2%Warehouse 59 0.535 0.042 0.70 ±5.6%
School 362 0.388 0.256 0.85 ±2.7%0.497 1.0000.553
Winter Seasonal Peak Hours (90% of 50/50 Peak)
Total Weighted by LoggerTotal Equal Weight by Sector
Table i - 10: Winter Seasonal Peak CFs and Relative Precision C&I Lighting
Table i - 11 provides a comparison of the Summer On-Peak and Seasonal Peak CFs for each of the
C&I sectors, which shows that for every sector the Summer Seasonal CFs are lower than the
Summer On-Peak CFs. This means that if the C&I lighting were classified as Summer Seasonal
Peak assets the demand reductions would be lower.
% ChangeOn-Peak Seasonal Seasonal /
Sector Type CF CF On-PeakGrocery 0.948 0.904 95%
Manufacturing 0.729 0.671 92%Medical (Hospital) 0.769 0.740 96%
Office 0.750 0.702 94%Other 0.543 0.476 88%
Restaurant 0.811 0.775 96%Retail 0.824 0.795 96%
University/College 0.680 0.650 96%Warehouse 0.781 0.727 93%
School 0.633 0.599 95%Total Weighted by Logger 0.704 0.660 94%
Total Equal Weight by Sector 0.747 0.704 94%
Summer
Table i - 11: Comparison of Summer On-Peak and Seasonal Peak CFs C&I Lighting
Table i - 12 provides a similar comparison of the Winter On-Peak and Seasonal Peak CFs for each
of the C&I Lighting sectors. In this case the results are mixed, with 7 of the 10 sectors showing an

NECPUC New England State Working Group 2007 Coincidence Factor Study________________________________________ Page IX
_____________________________________________________________________________
March 25, 2007 Final REPORT
increase in the Winter Seasonal Peak CFs compared to the Winter On-Peak CF. This seems to
indicate that in general for the winter, C&I lighting would have more demand reduction if classified
as a Seasonal Peak asset.
% ChangeOn-Peak Seasonal Seasonal /
Sector Type CF CF On-PeakGrocery 0.776 0.770 99%
Manufacturing 0.399 0.432 108%Medical (Hospital) 0.603 0.618 103%
Office 0.537 0.539 101%Other 0.426 0.428 100%
Restaurant 0.663 0.644 97%Retail 0.655 0.647 99%
University/College 0.523 0.528 101%Warehouse 0.496 0.535 108%
School 0.343 0.388 113%Total Weighted by Logger 0.480 0.497 104%
Total Equal Weight by Sector 0.542 0.553 102%
Winter
Table i - 12: Comparison of Winter On-Peak and Seasonal Peak CFs C&I Lighting
Commercial & Industrial Occupancy Sensor Coincidence Factor Results
Table i - 13 and Table i - 14 present the Summer On-Peak and Winter On-Peak CFs for occupancy
sensors for seven of the ten C&I sectors as well as the total CFs for all seven sectors on a logger
weighted basis and by weighting each sector equally. During the Summer On-Peak Period the
occupancy sensors installed in the University/College sector had the highest CF of about 0.30, while
the Other sector had the lowest CF of about 0.02. The Summer On-Peak CF for the remaining
sectors ranged from about 0.21 for Manufacturing to 0.27 for the Office Sector. During the Winter
On-Peak the Office sector had the highest CF of about 0.31 and the Other sector had the lowest CF
of 0.09. The CFs for the remaining sectors ranged from a low of about 0.17 for the Warehouse
sector to a high of about 0.23 for the University/College sector. The relative precision for all of the
CFs were estimated by calculating the relative precision of the occupancy sensors profiles, since
only aggregate savings profiles were developed for the analysis. In this case we would recommend
using the logger weighted Total CFs since the relative precision for individual sector results are not
that good particularly during the Winter period.

NECPUC New England State Working Group 2007 Coincidence Factor Study_________________________________________ Page X
_____________________________________________________________________________
March 25, 2007 Final REPORT
Sample Size Calculated Logger Estimated EstimatedData Period n CF Weight CV Rel Precision
Manufacturing 12 0.210 0.035 0.688 ±12.7%Medical 59 0.234 0.170 0.602 ±5.0%Office 69 0.270 0.199 0.559 ±4.3%Other 56 0.017 0.161 0.793 ±6.8%
University/College 16 0.304 0.046 0.678 ±10.9%Warehouse 77 0.266 0.222 0.646 ±4.7%
School 58 0.239 0.167 0.828 ±7.0%0.217 1.0000.154
Total Weighted by LoggerTotal Equal Weight by Sector
Summer On-Peak Hours 1PM - 5PM
Table i - 13: Summer On-Peak CFs and Relative Precision C&I Occupancy Sensors
Sample Size Calculated Logger Estimated EstimatedSector Type n CF Weight CV Rel Precision
Manufacturing 12 0.190 0.035 1.301 ±34.1%Medical 59 0.213 0.170 0.840 ±9.9%Office 69 0.309 0.199 1.087 ±11.9%Other 56 0.089 0.161 1.053 ±12.8%
University/College 16 0.233 0.046 0.827 ±18.8%Warehouse 77 0.175 0.222 1.082 ±11.2%
School 58 0.173 0.167 1.527 ±18.2%0.197 1.0000.138
Total Weighted by LoggerTotal Equal Weight by Sector
Winter On-Peak Hours 5PM - 7PM
Table i - 14: Winter On-Peak CFs and Relative Precision C&I Occupancy Sensors
Table i - 15 and Table i - 16 provide the Summer Seasonal Peak and Winter Seasonal Peak CFs
for the occupancy sensors for seven of the ten C&I sectors. Once again during the Summer
Seasonal Peak hours the University/College sector occupancy sensors had the highest CF of about
0.28 and the Other sector had the lowest CF of about 0.02. The CFs for the remaining sectors
ranged from about 0.20 to 0.27. The Winter Seasonal Peak CFs were similar to the Winter On-
Peak results with the Office sector having the highest CF of about 0.30 and the Other sector
having the lowest CF of about 0.07. Once again the relative precision of the CFs were estimated
by using the occupancy sensor profiles and the results are better than for the On-Peak periods
because the results were taken across more hours. The Summer Seasonal Peak estimated relative
precisions for each of the sectors are all within ±10% at the 80% confidence interval, and Winter
estimated relative precisions are also within that range for most of the sectors.

NECPUC New England State Working Group 2007 Coincidence Factor Study________________________________________ Page XI
_____________________________________________________________________________
March 25, 2007 Final REPORT
Sample Size Calculated Logger Estimated EstimatedData Period n CF Weight CV Rel Precision
Manufacturing 12 0.198 0.035 0.712 ±8.9%Medical 59 0.239 0.170 0.649 ±3.6%Office 69 0.274 0.199 0.606 ±3.2%Other 56 0.024 0.161 0.808 ±4.6%
University/College 16 0.283 0.046 0.720 ±7.6%Warehouse 77 0.246 0.222 0.700 ±3.3%
School 58 0.209 0.167 0.739 ±4.2%0.208 1.0000.147
Total Weighted by LoggerTotal Equal Weight by Sector
Summer Seasonal Peak Hours (90% of 50/50 Peak)
Table i - 15: Summer Seasonal-Peak CFs and Relative Precision C&I Occupancy Sensors
Sample Size Calculated Logger Estimated EstimatedData Period n CF Weight CV Rel Precision
Manufacturing 12 0.172 0.035 1.063 ±17.3%Medical 59 0.221 0.170 0.827 ±6.3%Office 69 0.296 0.199 0.966 ±6.9%Other 56 0.066 0.161 0.990 ±7.7%
University/College 16 0.231 0.046 0.819 ±11.9%Warehouse 77 0.183 0.222 0.986 ±6.6%
School 58 0.159 0.167 1.140 ±8.7%0.191 1.0000.133
Total Weighted by LoggerTotal Equal Weight by Sector
Winter Seasonal Peak Hours (90% of 50/50 Peak)
Table i - 16: Winter Seasonal-Peak CFs and Relative Precision C&I Occupancy Sensors
Table i - 17 and Table i - 18 provide a comparison of the Summer and Winter On-Peak and
Seasonal Peak CFs for occupancy sensors for seven C&I sectors as well as the totals for all seven
sectors calculated on a logger weighted and sector weighted basis. The results for the Summer
period show that the Summer Seasonal CFs are lower than the On-Peak CFs for four of the seven
sectors and for the total CF using both calculation methods. The results for the Winter period are
similar, with five of the sectors having lower Seasonal Peak CFs and lower Total CFs using both
calculation methods. Classifying the occupancy sensors as Seasonal Peak assets would result in a
slight reduction in demand savings during both periods.

NECPUC New England State Working Group 2007 Coincidence Factor Study________________________________________Page XII
_____________________________________________________________________________
March 25, 2007 Final REPORT
% ChangeOn-Peak Seasonal Seasonal /
Sector Type CF CF On-PeakManufacturing 0.210 0.198 94%
Medical 0.234 0.239 102%Office 0.270 0.274 101%Other 0.017 0.024 144%
University/College 0.304 0.283 93%Warehouse 0.266 0.246 92%
School 0.239 0.209 87%Total Weighted by Logger 0.217 0.208 96%
Total Equal Weight by Sector 0.154 0.147 96%
Summer
Table i - 17: Comparison of Summer On-Peak and Seasonal Peak CFs Occupancy Sensors
% Change
On-Peak Seasonal Seasonal /Sector Type CF CF On-Peak
Manufacturing 0.190 0.172 90%Medical 0.213 0.221 104%Office 0.309 0.296 96%Other 0.089 0.066 75%
University/College 0.233 0.231 99%Warehouse 0.175 0.183 105%
School 0.173 0.159 92%Total Weighted by Logger 0.197 0.191 97%
Total Equal Weight by Sector 0.138 0.133 96%
Winter
Table i - 18: Comparison of Winter On-Peak and Seasonal Peak CFs Occupancy Sensors
Program Level C&I Lighting CF Calculations
Several of the study sponsors wanted to calculate the C&I Lighting CFs using an alternative
method that grouped the logger data into two categories, Large C&I and Small C&I since this
provides them with results that are more in-line with their tracking systems, which track results at
the program level. The sponsors also wanted to estimate the electrical demand impacts
attributable to the interaction between the lighting and the HVAC systems and those results are
presented in the following sections as well. The new C&I lighting CFs and interactive effects
were only developed for C&I lighting measures, occupancy sensor measures were not included as
part of the analysis.
NECPUC New England State Working Group 2007 Coincidence Factor Study_______________________________________ Page XIII
_____________________________________________________________________________
March 25, 2007 Final REPORT
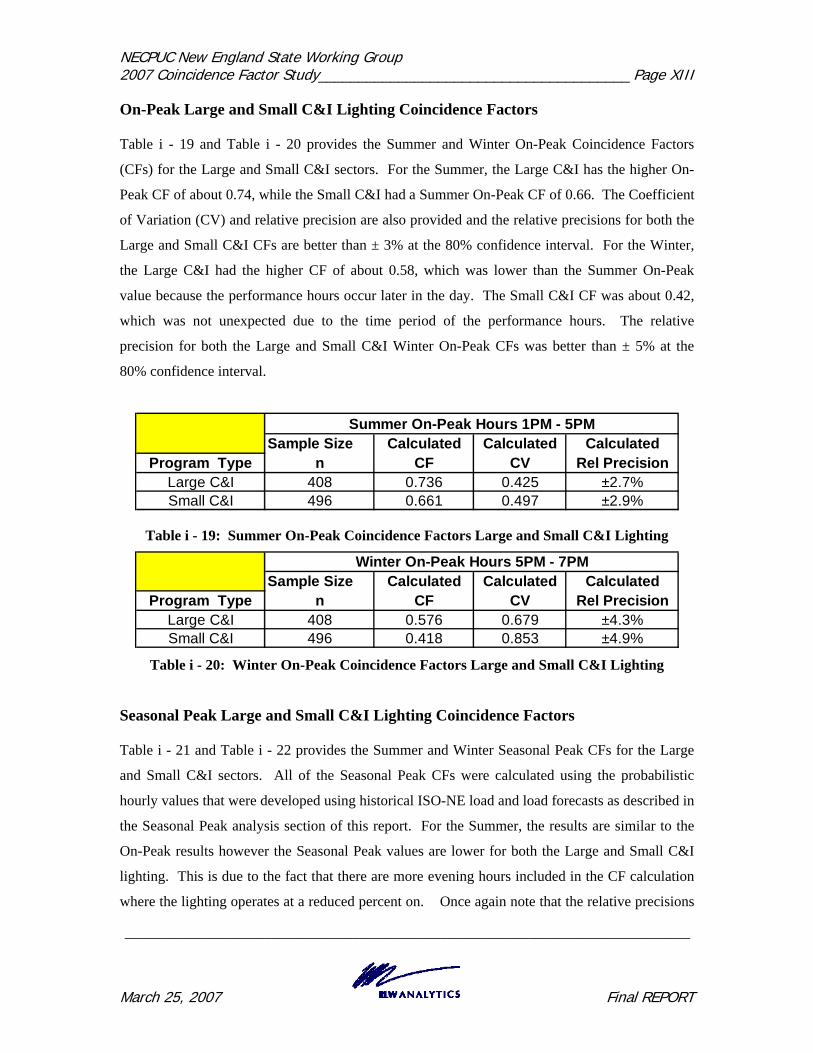
On-Peak Large and Small C&I Lighting Coincidence Factors
Table i - 19 and Table i - 20 provides the Summer and Winter On-Peak Coincidence Factors
(CFs) for the Large and Small C&I sectors. For the Summer, the Large C&I has the higher On-
Peak CF of about 0.74, while the Small C&I had a Summer On-Peak CF of 0.66. The Coefficient
of Variation (CV) and relative precision are also provided and the relative precisions for both the
Large and Small C&I CFs are better than ± 3% at the 80% confidence interval. For the Winter,
the Large C&I had the higher CF of about 0.58, which was lower than the Summer On-Peak
value because the performance hours occur later in the day. The Small C&I CF was about 0.42,
which was not unexpected due to the time period of the performance hours. The relative
precision for both the Large and Small C&I Winter On-Peak CFs was better than ± 5% at the
80% confidence interval.
Sample Size Calculated Calculated CalculatedProgram Type n CF CV Rel Precision
Large C&I 408 0.736 0.425 ±2.7%Small C&I 496 0.661 0.497 ±2.9%
Summer On-Peak Hours 1PM - 5PM
Table i - 19: Summer On-Peak Coincidence Factors Large and Small C&I Lighting
Sample Size Calculated Calculated CalculatedProgram Type n CF CV Rel Precision
Large C&I 408 0.576 0.679 ±4.3%Small C&I 496 0.418 0.853 ±4.9%
Winter On-Peak Hours 5PM - 7PM
Table i - 20: Winter On-Peak Coincidence Factors Large and Small C&I Lighting
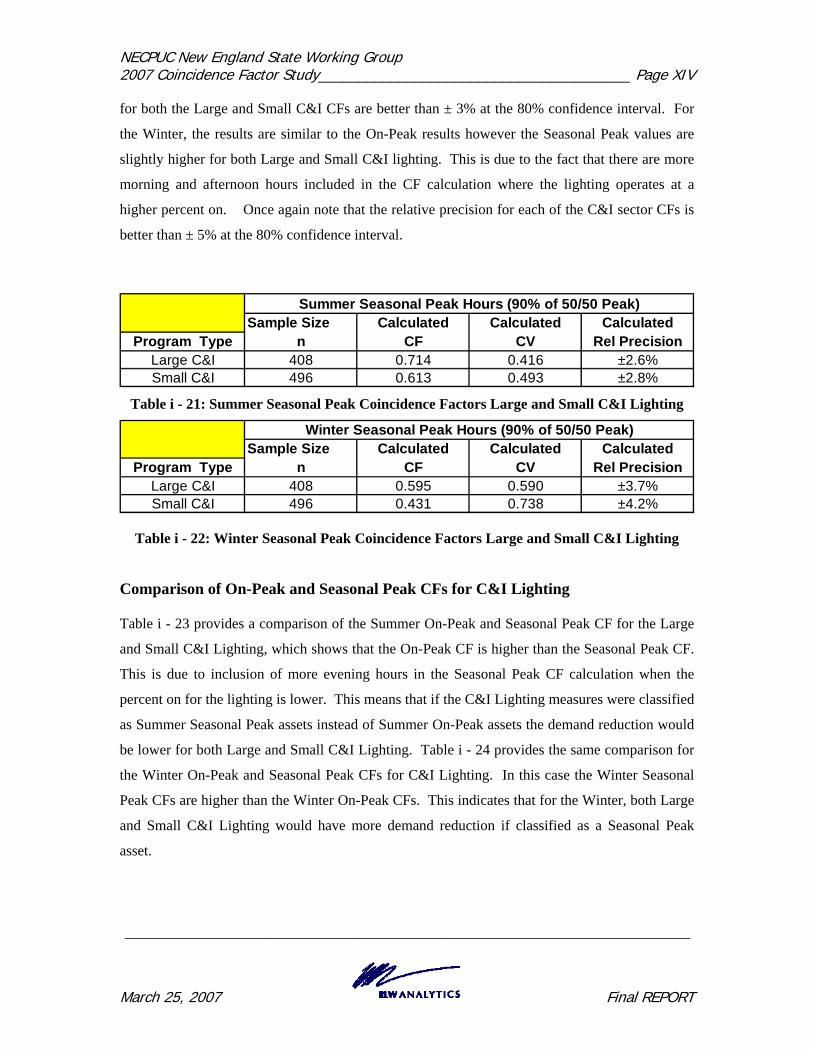
Seasonal Peak Large and Small C&I Lighting Coincidence Factors
Table i - 21 and Table i - 22 provides the Summer and Winter Seasonal Peak CFs for the Large
and Small C&I sectors. All of the Seasonal Peak CFs were calculated using the probabilistic
hourly values that were developed using historical ISO-NE load and load forecasts as described in
the Seasonal Peak analysis section of this report. For the Summer, the results are similar to the
On-Peak results however the Seasonal Peak values are lower for both the Large and Small C&I
lighting. This is due to the fact that there are more evening hours included in the CF calculation
where the lighting operates at a reduced percent on. Once again note that the relative precisions
NECPUC New England State Working Group 2007 Coincidence Factor Study_______________________________________ Page XIV
_____________________________________________________________________________
March 25, 2007 Final REPORT
for both the Large and Small C&I CFs are better than ± 3% at the 80% confidence interval. For
the Winter, the results are similar to the On-Peak results however the Seasonal Peak values are
slightly higher for both Large and Small C&I lighting. This is due to the fact that there are more
morning and afternoon hours included in the CF calculation where the lighting operates at a
higher percent on. Once again note that the relative precision for each of the C&I sector CFs is
better than ± 5% at the 80% confidence interval.
Sample Size Calculated Calculated CalculatedProgram Type n CF CV Rel Precision
Large C&I 408 0.714 0.416 ±2.6%Small C&I 496 0.613 0.493 ±2.8%
Summer Seasonal Peak Hours (90% of 50/50 Peak)
Table i - 21: Summer Seasonal Peak Coincidence Factors Large and Small C&I Lighting
Sample Size Calculated Calculated CalculatedProgram Type n CF CV Rel Precision
Large C&I 408 0.595 0.590 ±3.7%Small C&I 496 0.431 0.738 ±4.2%
Winter Seasonal Peak Hours (90% of 50/50 Peak)
Table i - 22: Winter Seasonal Peak Coincidence Factors Large and Small C&I Lighting
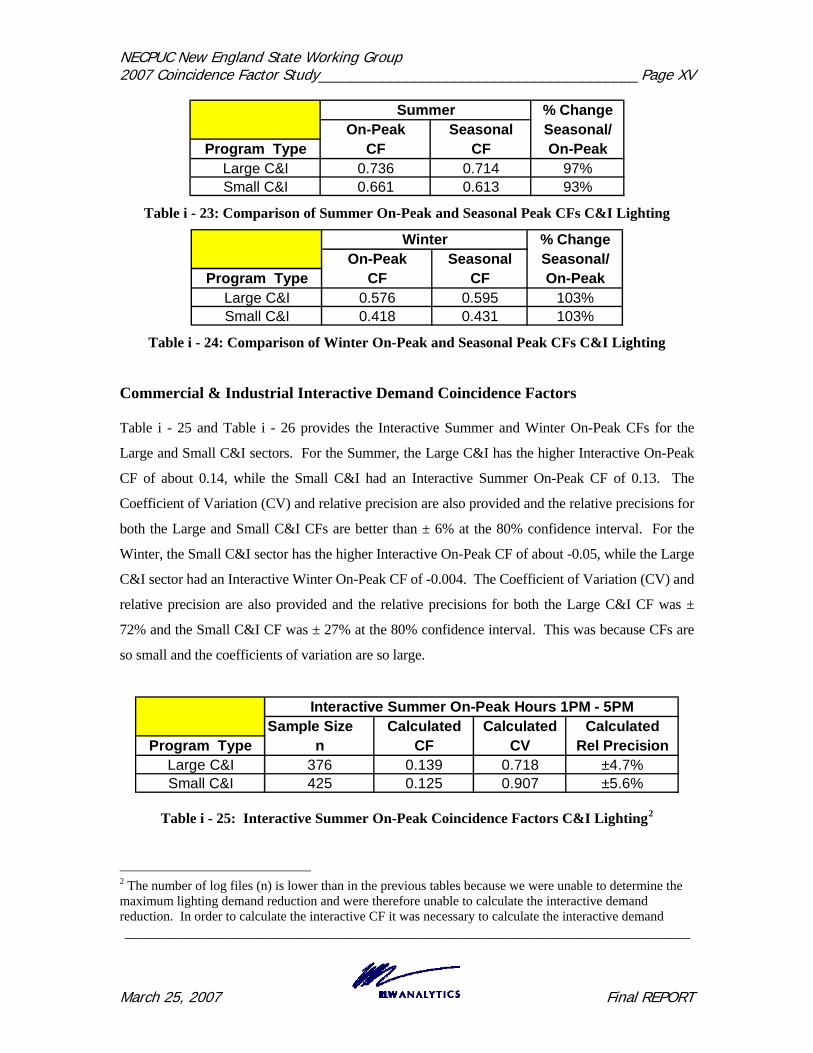
Comparison of On-Peak and Seasonal Peak CFs for C&I Lighting
Table i - 23 provides a comparison of the Summer On-Peak and Seasonal Peak CF for the Large
and Small C&I Lighting, which shows that the On-Peak CF is higher than the Seasonal Peak CF.
This is due to inclusion of more evening hours in the Seasonal Peak CF calculation when the
percent on for the lighting is lower. This means that if the C&I Lighting measures were classified
as Summer Seasonal Peak assets instead of Summer On-Peak assets the demand reduction would
be lower for both Large and Small C&I Lighting. Table i - 24 provides the same comparison for
the Winter On-Peak and Seasonal Peak CFs for C&I Lighting. In this case the Winter Seasonal
Peak CFs are higher than the Winter On-Peak CFs. This indicates that for the Winter, both Large
and Small C&I Lighting would have more demand reduction if classified as a Seasonal Peak
asset.
NECPUC New England State Working Group 2007 Coincidence Factor Study________________________________________ Page XV
_____________________________________________________________________________
March 25, 2007 Final REPORT
% ChangeOn-Peak Seasonal Seasonal/
Program Type CF CF On-PeakLarge C&I 0.736 0.714 97%Small C&I 0.661 0.613 93%
Summer
Table i - 23: Comparison of Summer On-Peak and Seasonal Peak CFs C&I Lighting
% ChangeOn-Peak Seasonal Seasonal/
Program Type CF CF On-PeakLarge C&I 0.576 0.595 103%Small C&I 0.418 0.431 103%
Winter
Table i - 24: Comparison of Winter On-Peak and Seasonal Peak CFs C&I Lighting
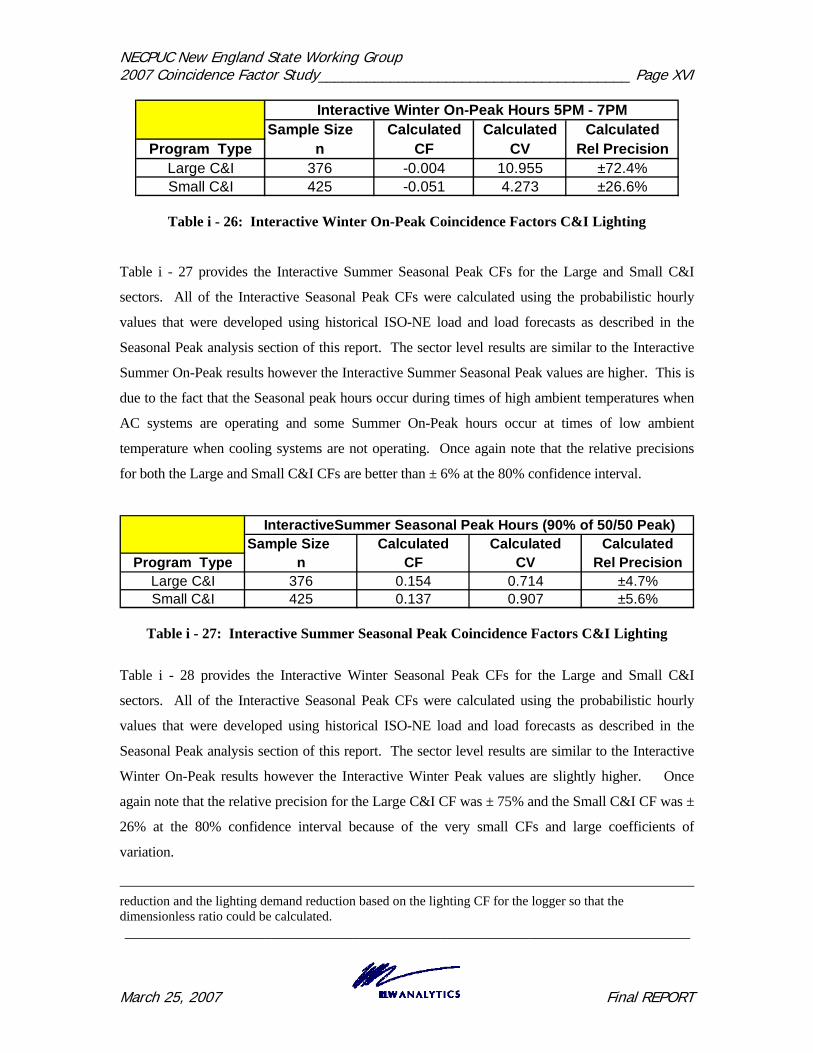
Commercial & Industrial Interactive Demand Coincidence Factors
Table i - 25 and Table i - 26 provides the Interactive Summer and Winter On-Peak CFs for the
Large and Small C&I sectors. For the Summer, the Large C&I has the higher Interactive On-Peak
CF of about 0.14, while the Small C&I had an Interactive Summer On-Peak CF of 0.13. The
Coefficient of Variation (CV) and relative precision are also provided and the relative precisions for
both the Large and Small C&I CFs are better than ± 6% at the 80% confidence interval. For the
Winter, the Small C&I sector has the higher Interactive On-Peak CF of about -0.05, while the Large
C&I sector had an Interactive Winter On-Peak CF of -0.004. The Coefficient of Variation (CV) and
relative precision are also provided and the relative precisions for both the Large C&I CF was ±
72% and the Small C&I CF was ± 27% at the 80% confidence interval. This was because CFs are
so small and the coefficients of variation are so large.
Sample Size Calculated Calculated CalculatedProgram Type n CF CV Rel Precision
Large C&I 376 0.139 0.718 ±4.7%Small C&I 425 0.125 0.907 ±5.6%
Interactive Summer On-Peak Hours 1PM - 5PM
Table i - 25: Interactive Summer On-Peak Coincidence Factors C&I Lighting2
2 The number of log files (n) is lower than in the previous tables because we were unable to determine the maximum lighting demand reduction and were therefore unable to calculate the interactive demand reduction. In order to calculate the interactive CF it was necessary to calculate the interactive demand
NECPUC New England State Working Group 2007 Coincidence Factor Study_______________________________________ Page XVI
_____________________________________________________________________________
March 25, 2007 Final REPORT
Sample Size Calculated Calculated CalculatedProgram Type n CF CV Rel Precision
Large C&I 376 -0.004 10.955 ±72.4%Small C&I 425 -0.051 4.273 ±26.6%
Interactive Winter On-Peak Hours 5PM - 7PM
Table i - 26: Interactive Winter On-Peak Coincidence Factors C&I Lighting
Table i - 27 provides the Interactive Summer Seasonal Peak CFs for the Large and Small C&I
sectors. All of the Interactive Seasonal Peak CFs were calculated using the probabilistic hourly
values that were developed using historical ISO-NE load and load forecasts as described in the
Seasonal Peak analysis section of this report. The sector level results are similar to the Interactive
Summer On-Peak results however the Interactive Summer Seasonal Peak values are higher. This is
due to the fact that the Seasonal peak hours occur during times of high ambient temperatures when
AC systems are operating and some Summer On-Peak hours occur at times of low ambient
temperature when cooling systems are not operating. Once again note that the relative precisions
for both the Large and Small C&I CFs are better than ± 6% at the 80% confidence interval.
Sample Size Calculated Calculated CalculatedProgram Type n CF CV Rel Precision
Large C&I 376 0.154 0.714 ±4.7%Small C&I 425 0.137 0.907 ±5.6%
InteractiveSummer Seasonal Peak Hours (90% of 50/50 Peak)
Table i - 27: Interactive Summer Seasonal Peak Coincidence Factors C&I Lighting
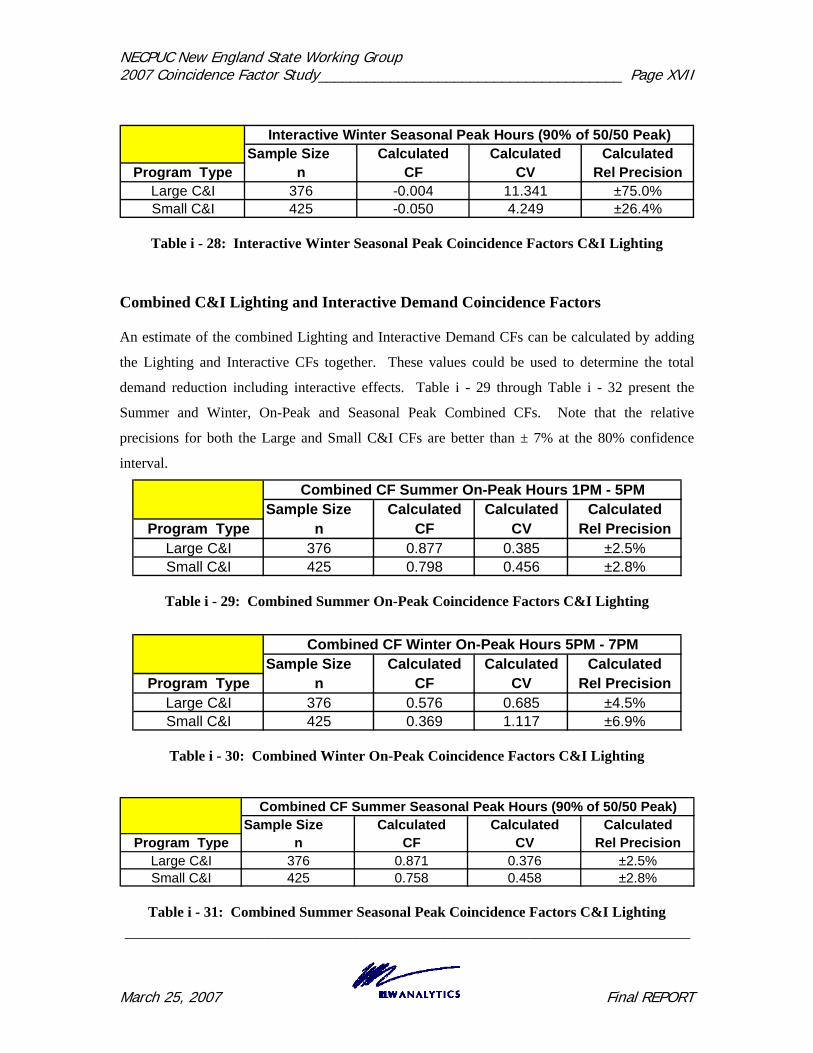
Table i - 28 provides the Interactive Winter Seasonal Peak CFs for the Large and Small C&I
sectors. All of the Interactive Seasonal Peak CFs were calculated using the probabilistic hourly
values that were developed using historical ISO-NE load and load forecasts as described in the
Seasonal Peak analysis section of this report. The sector level results are similar to the Interactive
Winter On-Peak results however the Interactive Winter Peak values are slightly higher. Once
again note that the relative precision for the Large C&I CF was ± 75% and the Small C&I CF was ±
26% at the 80% confidence interval because of the very small CFs and large coefficients of
variation.
reduction and the lighting demand reduction based on the lighting CF for the logger so that the dimensionless ratio could be calculated.
NECPUC New England State Working Group 2007 Coincidence Factor Study______________________________________ Page XVII
_____________________________________________________________________________
March 25, 2007 Final REPORT
Sample Size Calculated Calculated CalculatedProgram Type n CF CV Rel Precision
Large C&I 376 -0.004 11.341 ±75.0%Small C&I 425 -0.050 4.249 ±26.4%
Interactive Winter Seasonal Peak Hours (90% of 50/50 Peak)
Table i - 28: Interactive Winter Seasonal Peak Coincidence Factors C&I Lighting
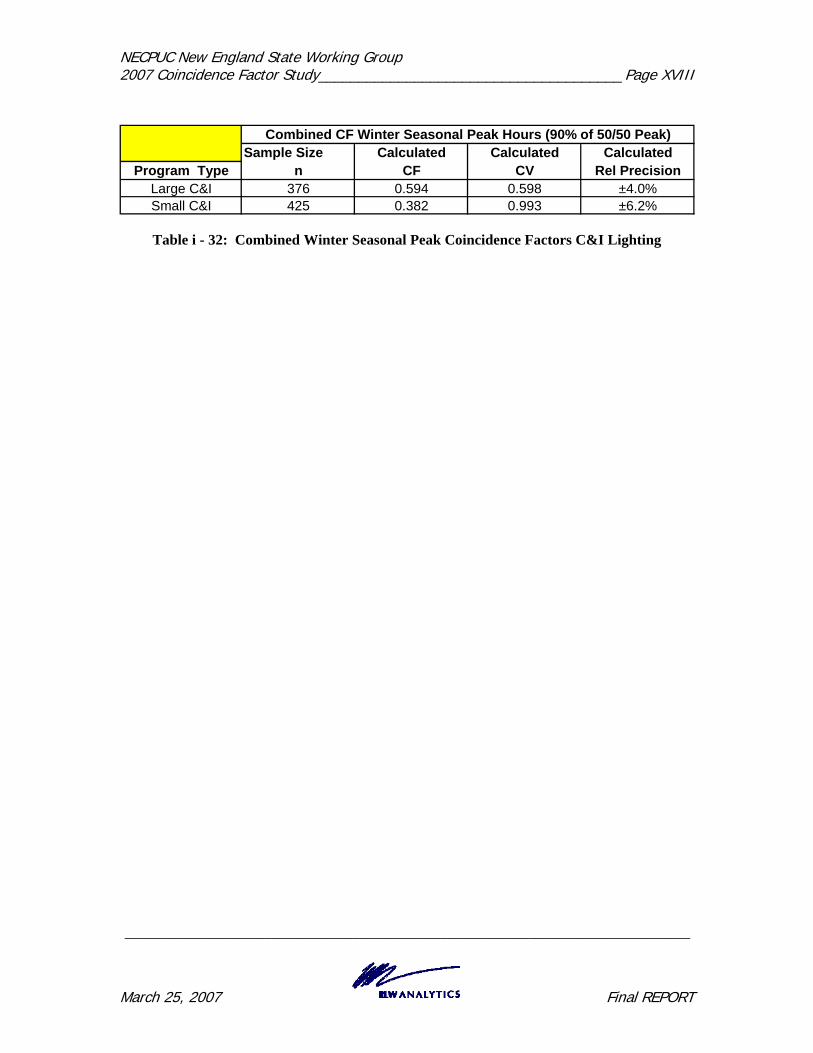
Combined C&I Lighting and Interactive Demand Coincidence Factors
An estimate of the combined Lighting and Interactive Demand CFs can be calculated by adding
the Lighting and Interactive CFs together. These values could be used to determine the total
demand reduction including interactive effects. Table i - 29 through Table i - 32 present the
Summer and Winter, On-Peak and Seasonal Peak Combined CFs. Note that the relative
precisions for both the Large and Small C&I CFs are better than ± 7% at the 80% confidence
interval.
Sample Size Calculated Calculated CalculatedProgram Type n CF CV Rel Precision
Large C&I 376 0.877 0.385 ±2.5%Small C&I 425 0.798 0.456 ±2.8%
Combined CF Summer On-Peak Hours 1PM - 5PM
Table i - 29: Combined Summer On-Peak Coincidence Factors C&I Lighting
Sample Size Calculated Calculated CalculatedProgram Type n CF CV Rel Precision
Large C&I 376 0.576 0.685 ±4.5%Small C&I 425 0.369 1.117 ±6.9%
Combined CF Winter On-Peak Hours 5PM - 7PM
Table i - 30: Combined Winter On-Peak Coincidence Factors C&I Lighting
Sample Size Calculated Calculated CalculatedProgram Type n CF CV Rel Precision
Large C&I 376 0.871 0.376 ±2.5%Small C&I 425 0.758 0.458 ±2.8%
Combined CF Summer Seasonal Peak Hours (90% of 50/50 Peak)
Table i - 31: Combined Summer Seasonal Peak Coincidence Factors C&I Lighting
NECPUC New England State Working Group 2007 Coincidence Factor Study______________________________________Page XVIII
_____________________________________________________________________________
March 25, 2007 Final REPORT
Sample Size Calculated Calculated CalculatedProgram Type n CF CV Rel Precision
Large C&I 376 0.594 0.598 ±4.0%Small C&I 425 0.382 0.993 ±6.2%
Combined CF Winter Seasonal Peak Hours (90% of 50/50 Peak)
Table i - 32: Combined Winter Seasonal Peak Coincidence Factors C&I Lighting