rna-seq with r-bioconductor
TRANSCRIPT
Date
Maarten Leerkes PhD Genome Analysis Specialist Bioinformatics and Computational Biosciences Branch Office of Cyber Infrastructure and Computational Biology
RNA-seq with R-bioconductor Part 1.
BCBB: A Branch Devoted to Bioinformatics and Computational Biosciences
§ Researchers’ time is increasingly important § BCBB saves our collaborators time and effort § Researchers speed projects to completion using
BCBB consultation and development services § No need to hire extra post docs or use external
consultants or developers
2
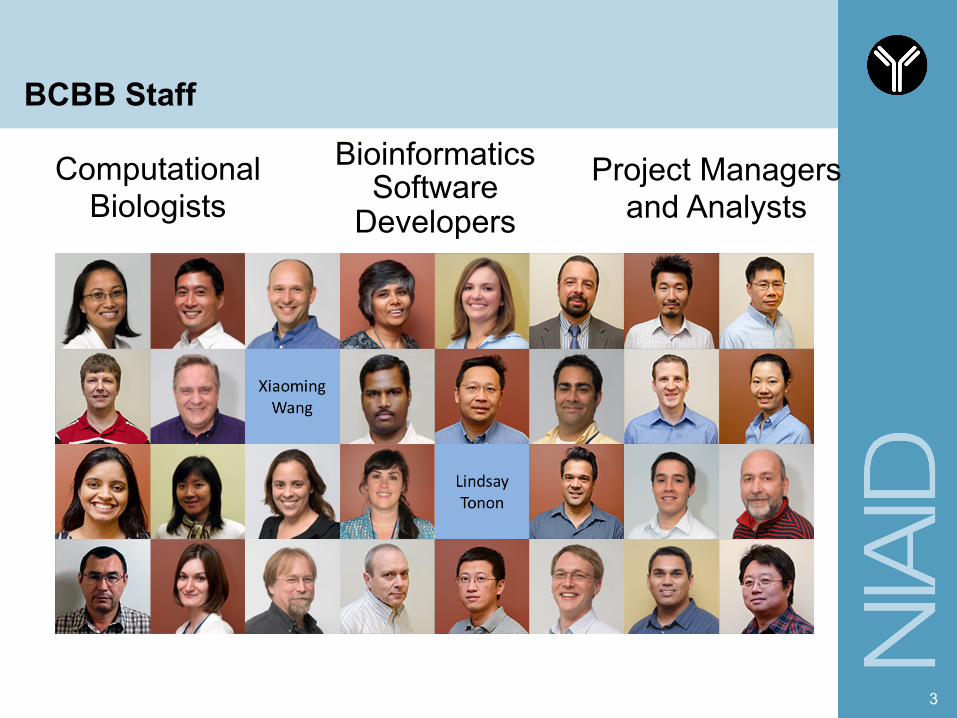
BCBB Staff
3
Bioinformatics Software
Developers Computational
Biologists Project Managers
and Analysts
Contact BCBB…
§ “NIH Users: Access a menu of BCBB services on the NIAID Intranet: • http://bioinformatics.niaid.nih.gov/
§ Outside of NIH – • search “BCBB” on the NIAID Public Internet Page:
www.niaid.nih.gov – or – use this direct link
§ Email us at:
4
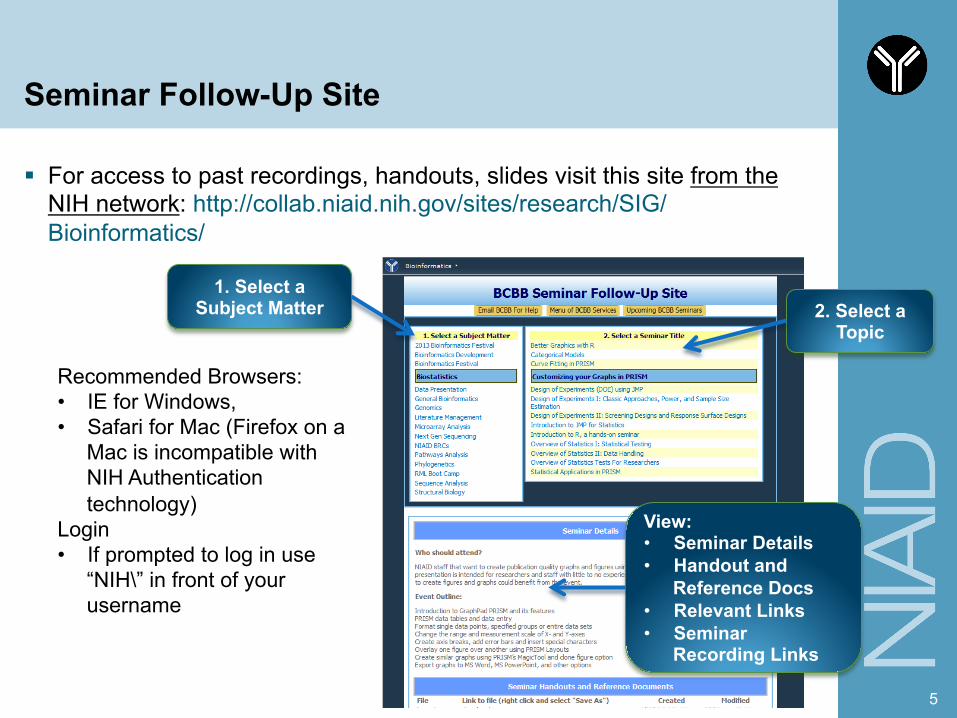
Seminar Follow-Up Site
§ For access to past recordings, handouts, slides visit this site from the NIH network: http://collab.niaid.nih.gov/sites/research/SIG/Bioinformatics/
5
1. Select a Subject Matter
View: • Seminar Details • Handout and
Reference Docs • Relevant Links • Seminar
Recording Links
2. Select a Topic
Recommended Browsers: • IE for Windows, • Safari for Mac (Firefox on a
Mac is incompatible with NIH Authentication technology)
Login • If prompted to log in use
“NIH\” in front of your username
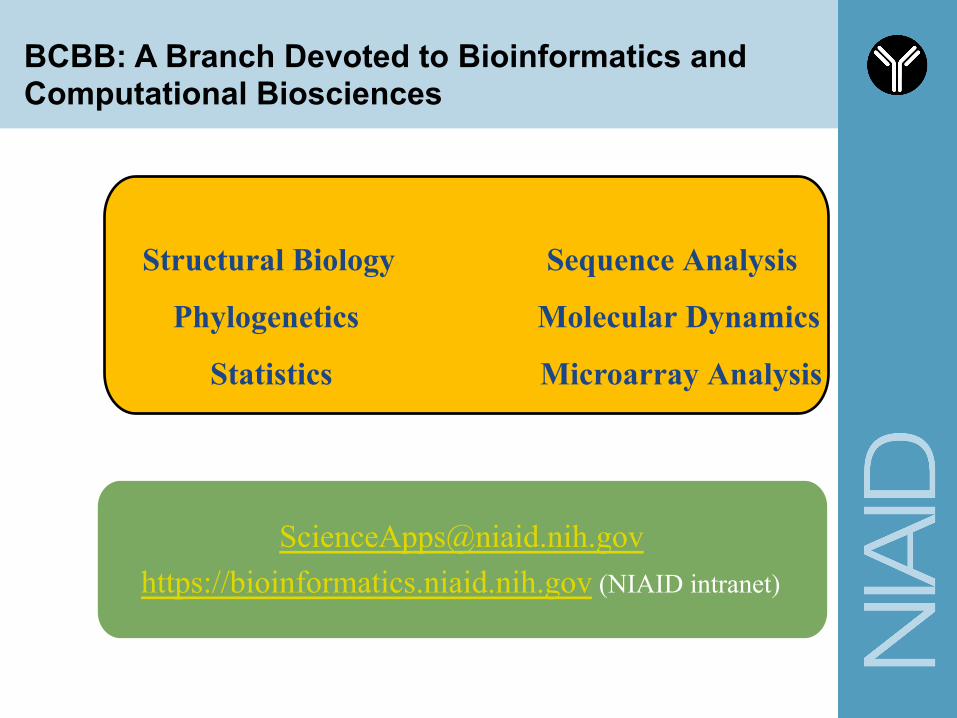
[email protected] https://bioinformatics.niaid.nih.gov (NIAID intranet)
Structural Biology
Phylogenetics
Statistics
Sequence Analysis Molecular Dynamics Microarray Analysis
BCBB: A Branch Devoted to Bioinformatics and Computational Biosciences
Topics
§ What is R § What is Bioconductor § What is RNAseq
7
What is R
§ R is a programming language and software environment for statistical computing and graphics. The R language is widely used among statisticians and data miners for developing statistical software[2][3] and data analysis.
8
What is R
§ R is an implementation of the S programming
language combined with lexical scoping semantics inspired by Scheme. S was created by John Chambers while at Bell Labs. There are some important differences, but much of the code written for S runs unaltered.
9
What is R
§ R is a GNU project. The source code for the R
software environment is written primarily in C, Fortran, and R. R is freely available under the GNU General Public License, and pre-compiled binary versions are provided for various operating systems. R uses a command line interface; there are also several graphical front-ends for it.
10
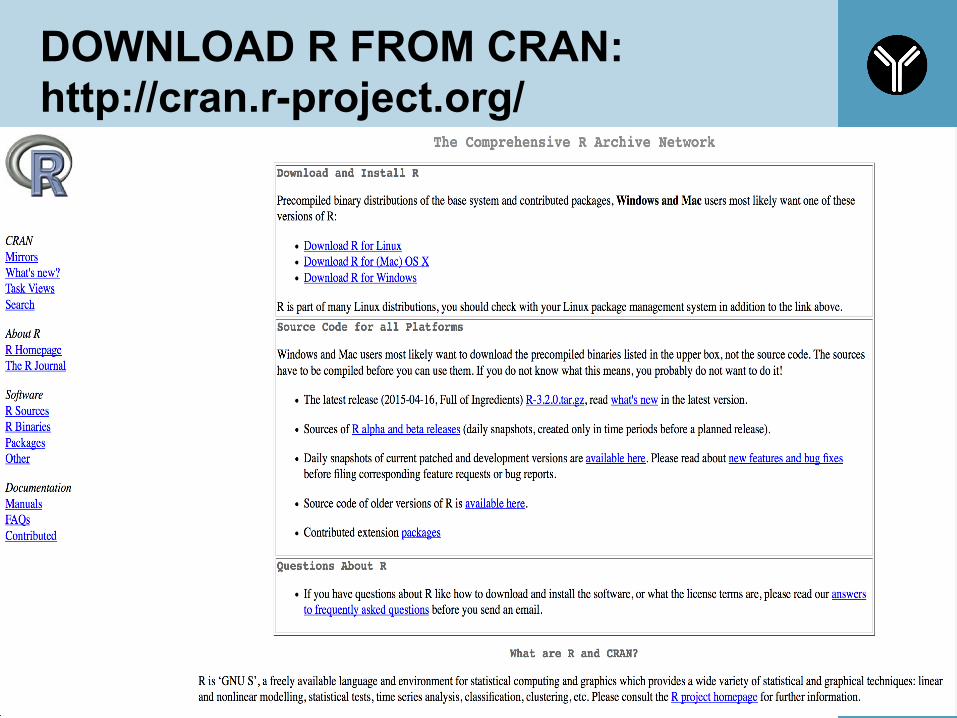
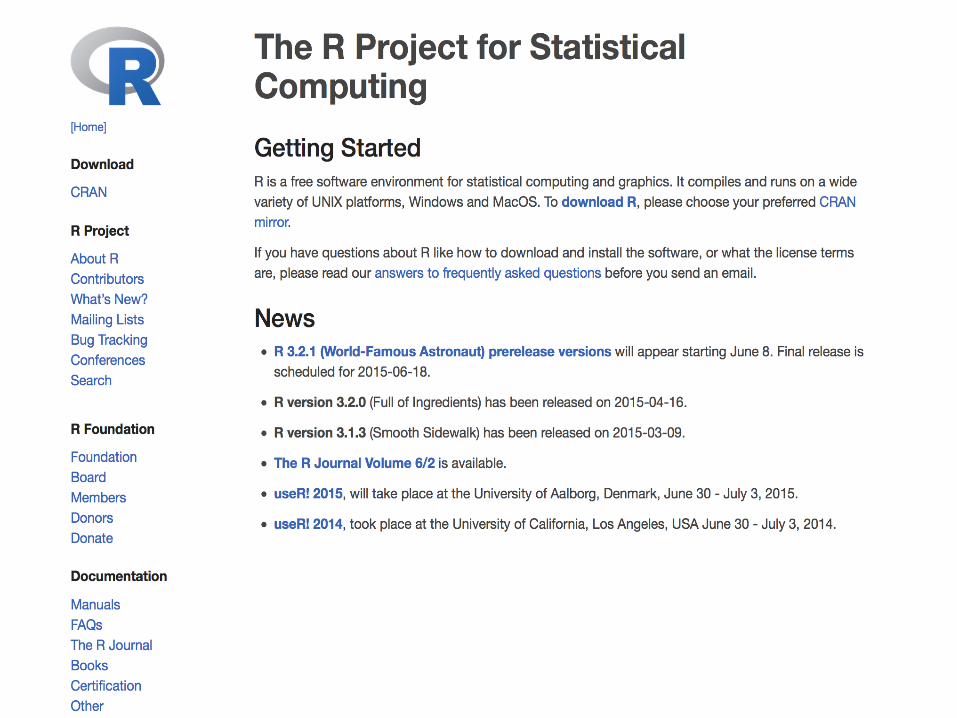
DOWNLOAD R FROM CRAN: http://cran.r-project.org/
11
12
Topics
§ What is R § What is Bioconductor § What is RNAseq
13
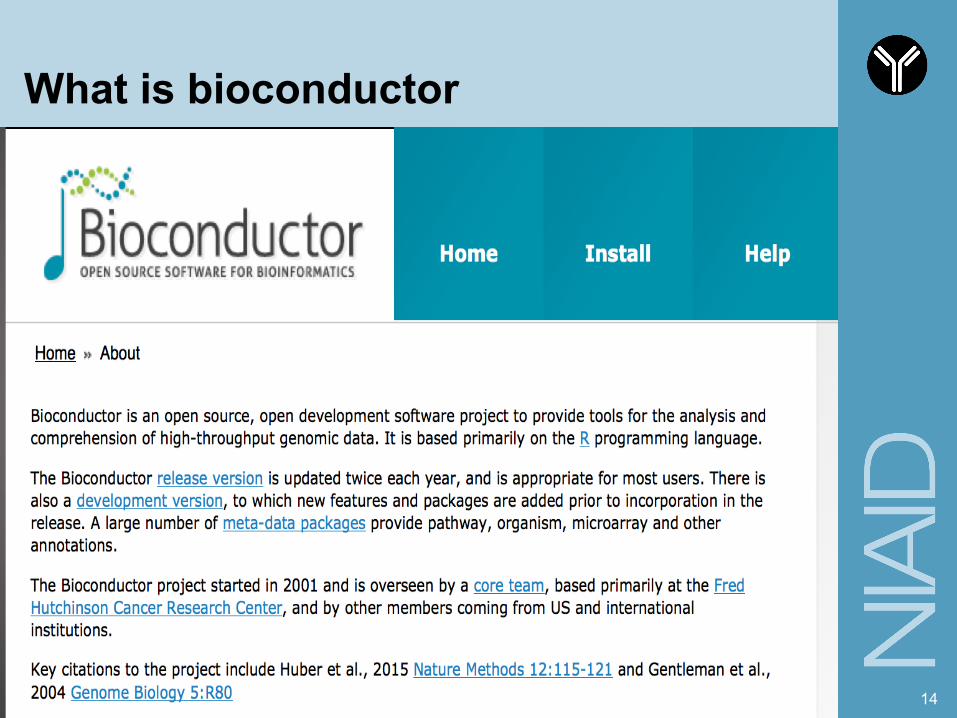
What is bioconductor
14
Topics
§ What is R § What is Bioconductor § What is RNAseq
15
What is RNAseq
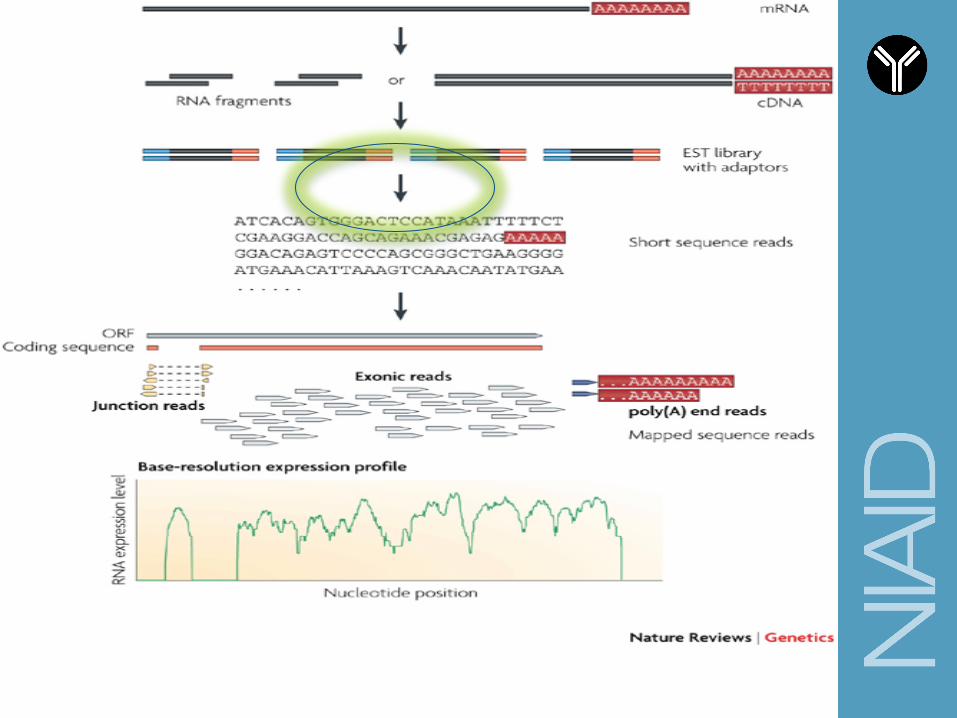
§ RNA-seq (RNA Sequencing), also called Whole Transcriptome Shotgun Sequencing (WTSS), is a technology that uses the capabilities of next-generation sequencing to reveal a snapshot of RNA presence and quantity from a genome at a given moment in time.
16
Topics
§ What is R § What is Bioconductor § What is RNAseq
§ Comes together in: RNA-seq with R-bioconductor
17
Different kinds of objects in R
§ Objects. § The following data objects exist in R: § vectors § lists § arrays § matrices § tables § data frames § Some of these are more important than others. And
there are more.
18
19
20
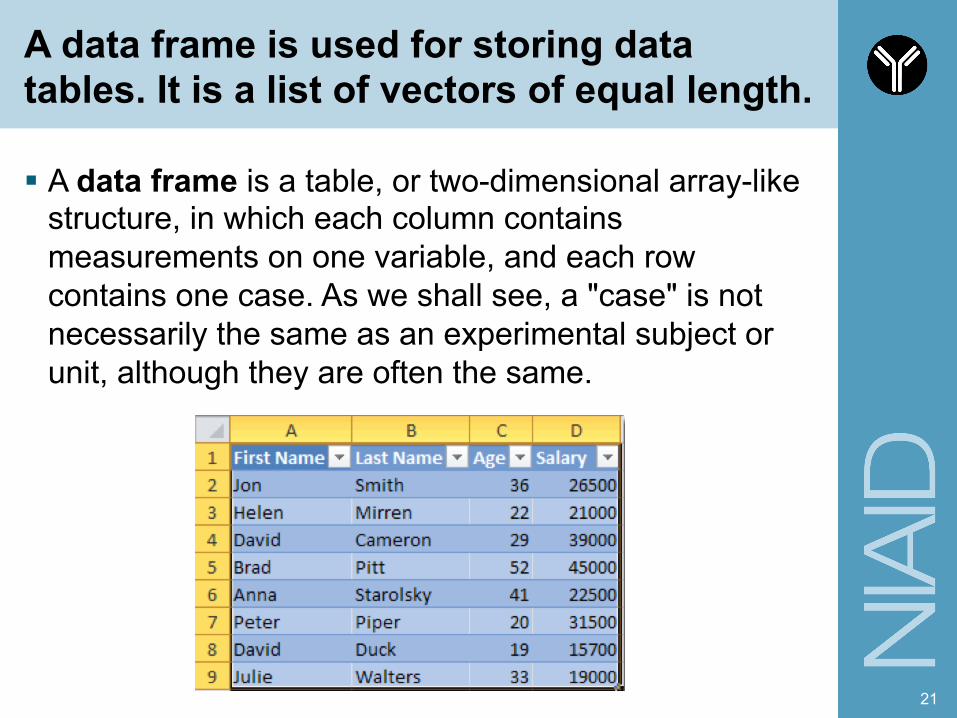
A data frame is used for storing data tables. It is a list of vectors of equal length.
§ A data frame is a table, or two-dimensional array-like structure, in which each column contains measurements on one variable, and each row contains one case. As we shall see, a "case" is not necessarily the same as an experimental subject or unit, although they are often the same.
21
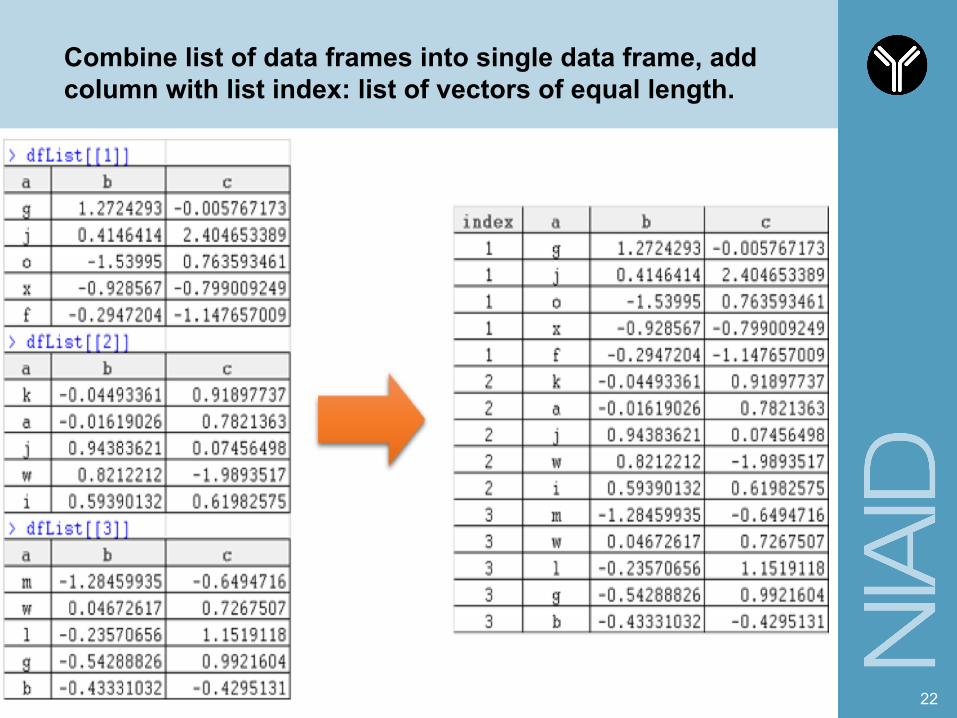
Combine list of data frames into single data frame, add column with list index: list of vectors of equal length.
22
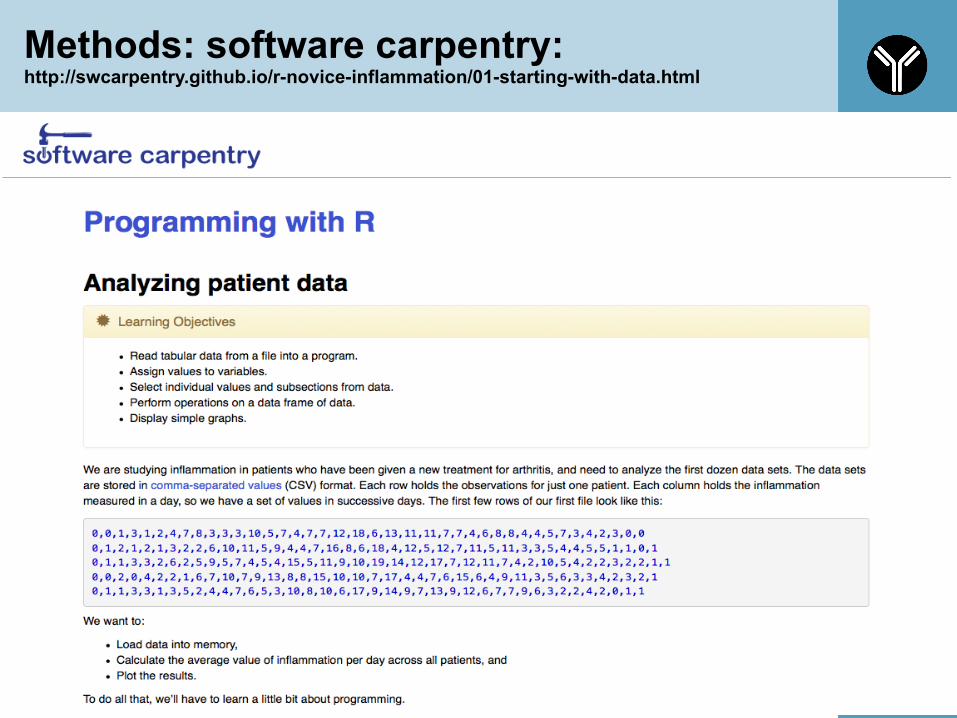
Methods: software carpentry: http://swcarpentry.github.io/r-novice-inflammation/01-starting-with-data.html
23
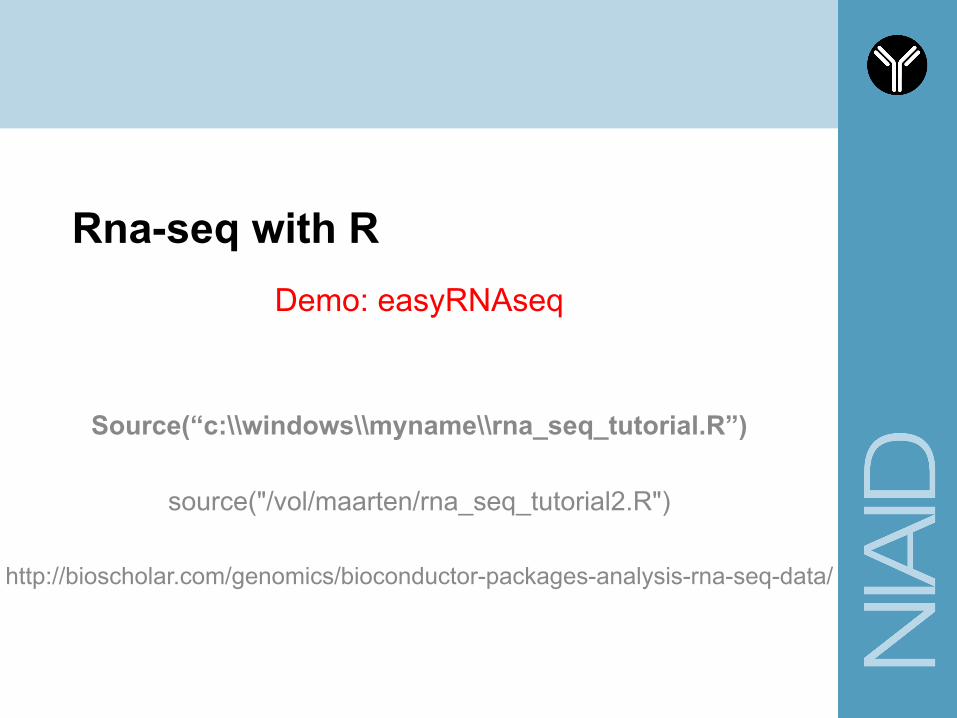
Rna-seq with R Demo: easyRNAseq
Source(“c:\\windows\\myname\\rna_seq_tutorial.R”)
source("/vol/maarten/rna_seq_tutorial2.R")
http://bioscholar.com/genomics/bioconductor-packages-analysis-rna-seq-data/
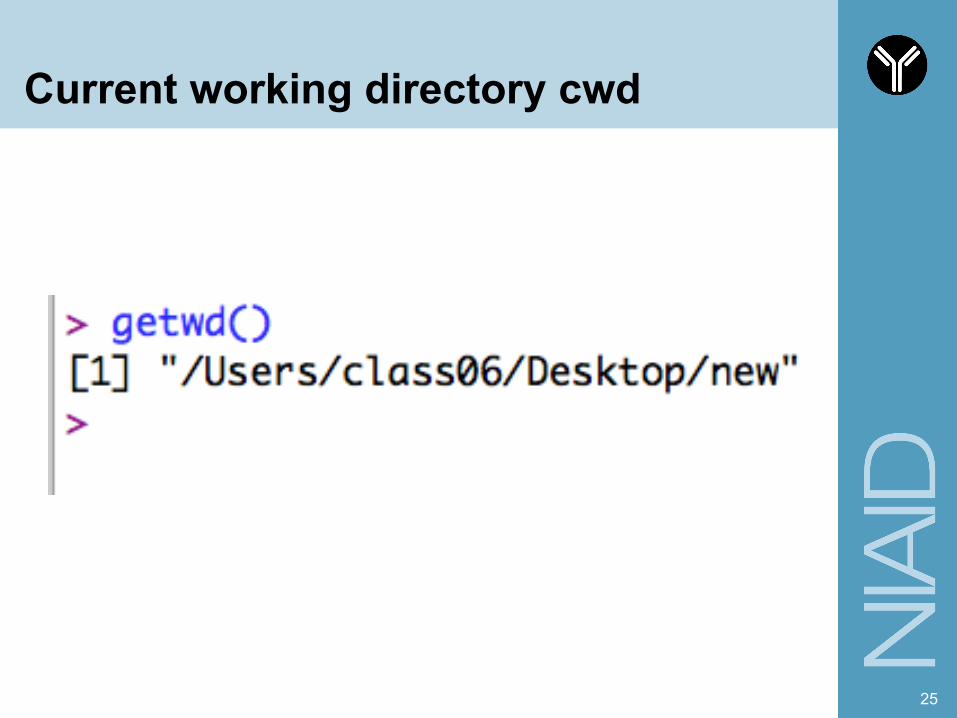
Current working directory cwd
25
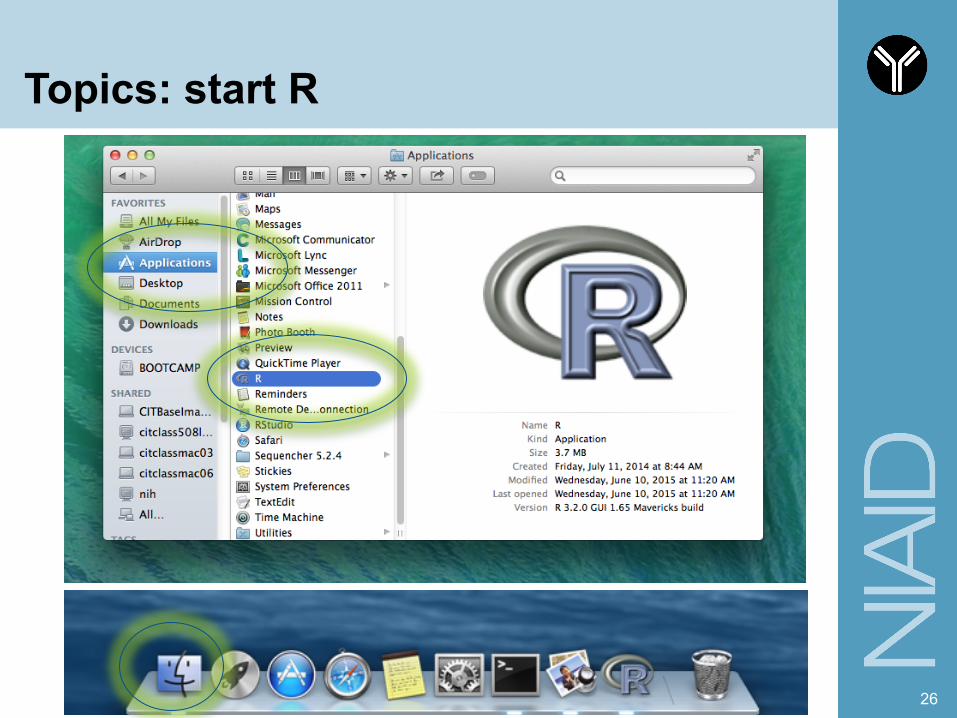
Topics: start R
26
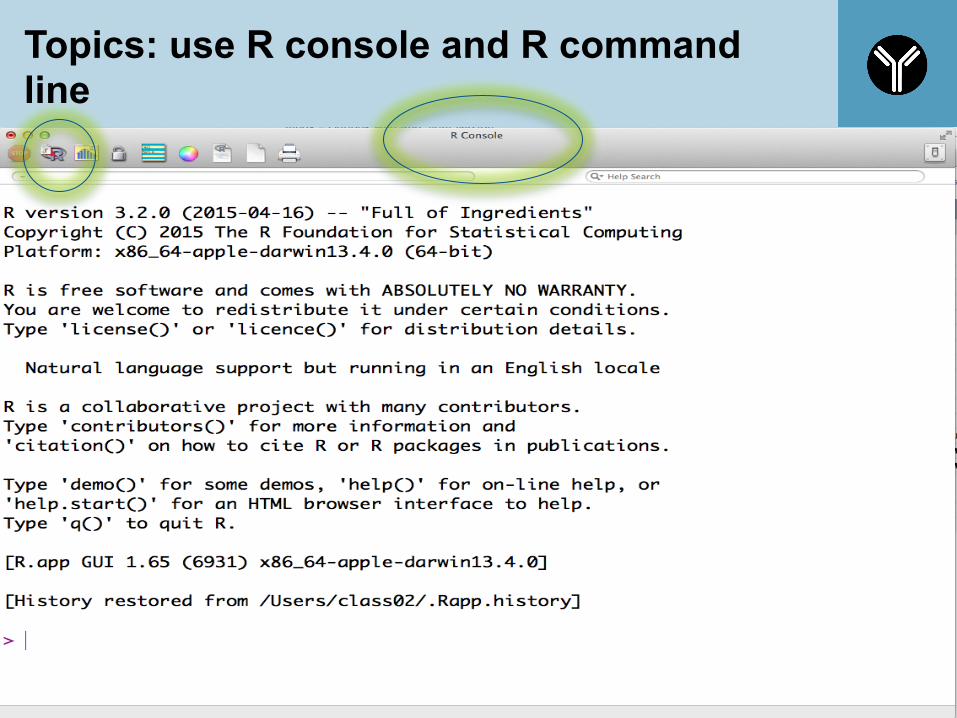
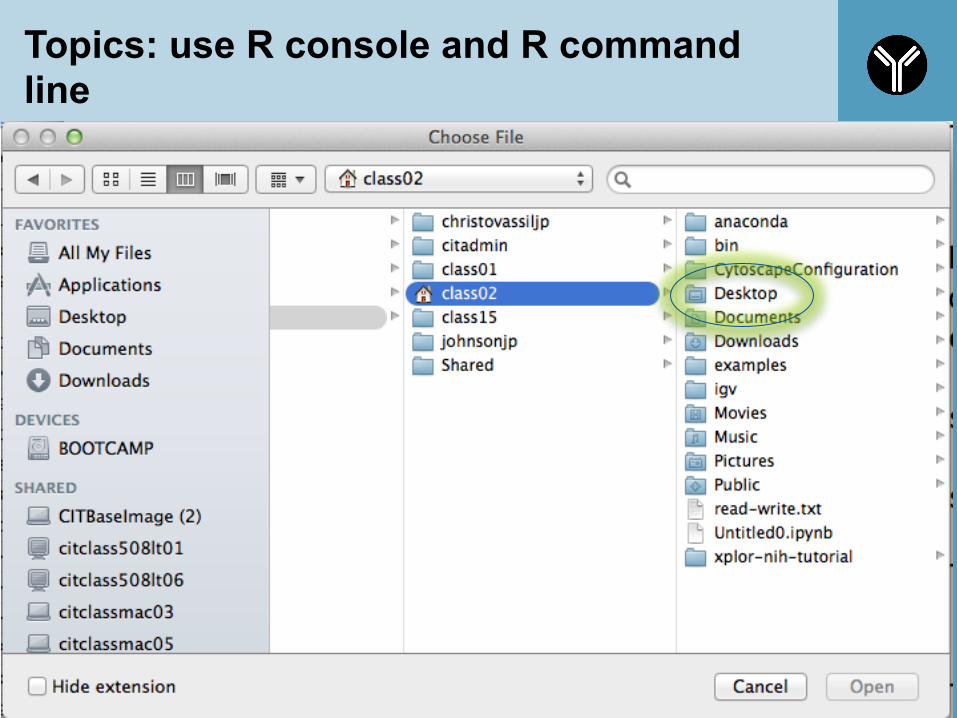
Topics: use R console and R command line
27
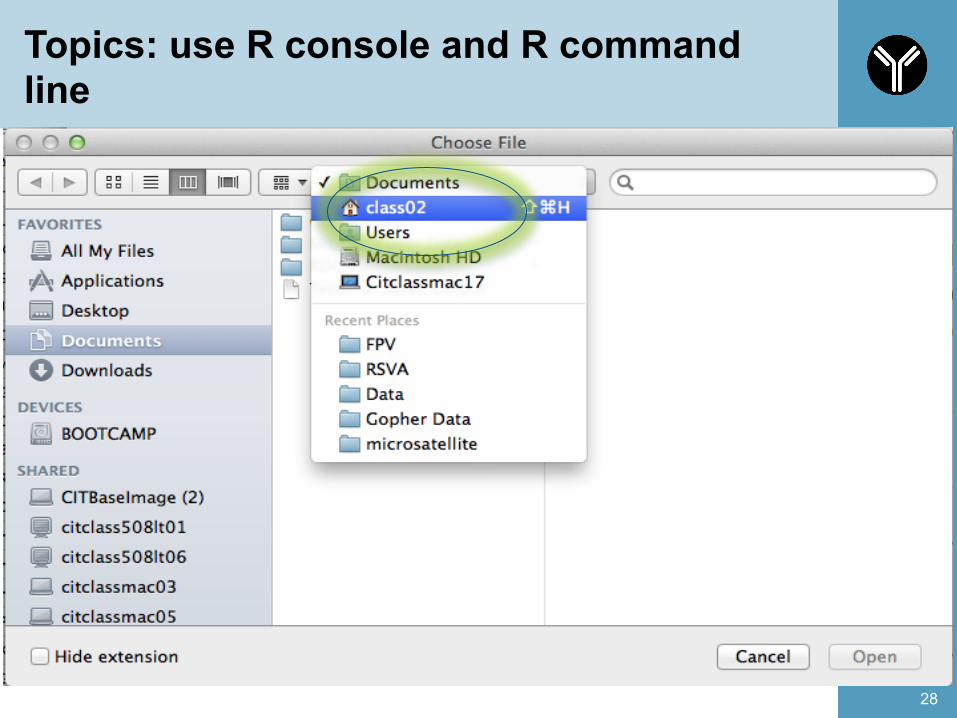
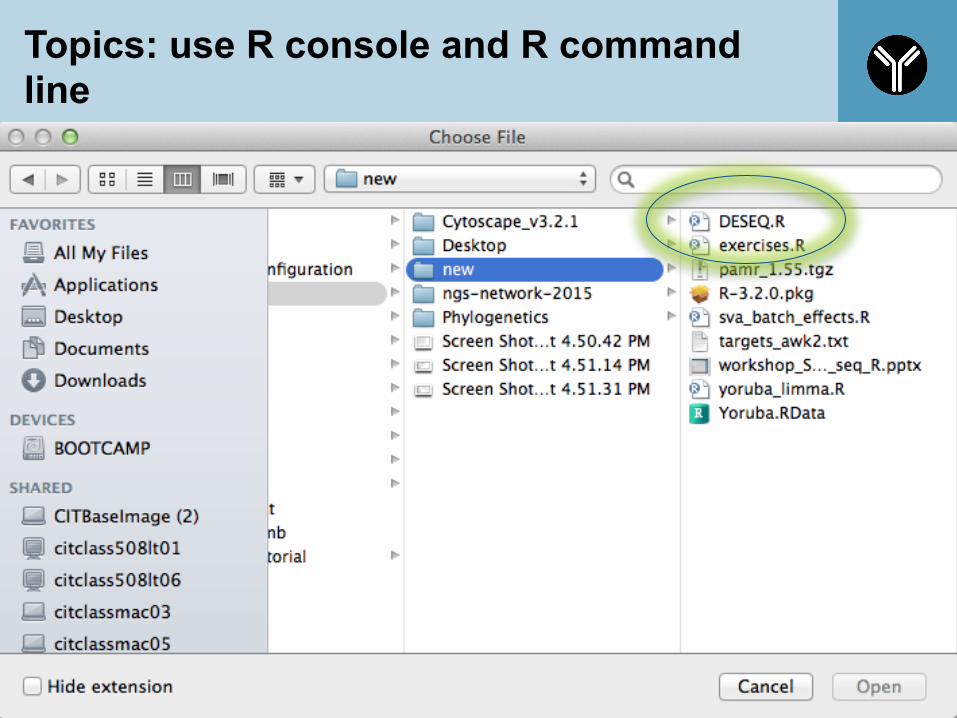
Topics: use R console and R command line
28
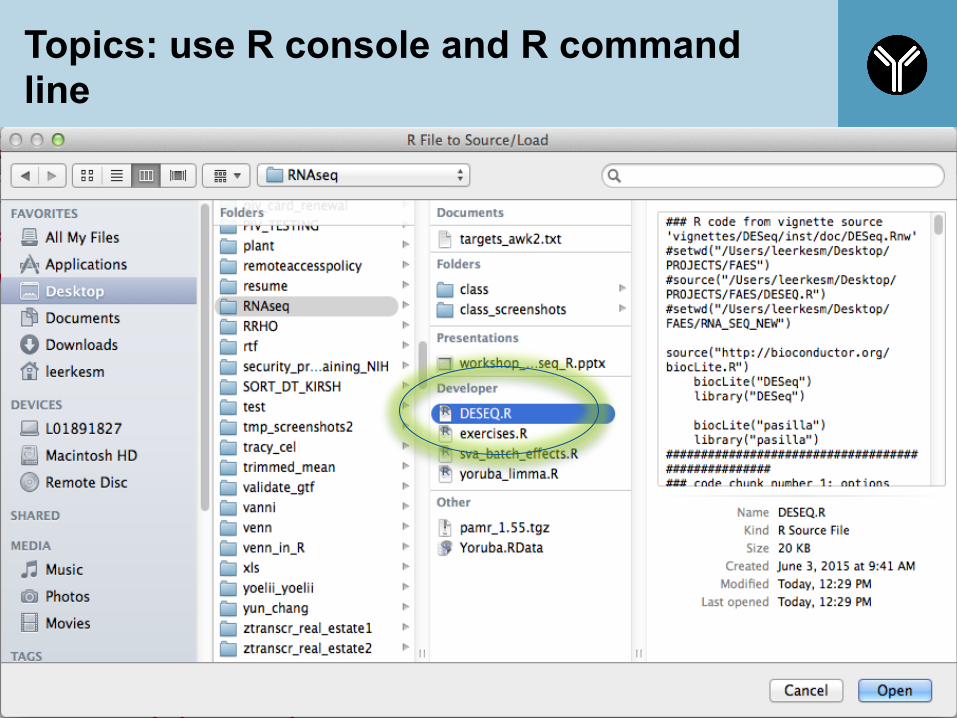
Topics: use R console and R command line
29
Topics: use R console and R command line
30
Topics: use R console and R command line
31
Topics
§ What is R § What is Bioconductor § What is RNAseq
32
Sequencing by synthesis
§ Intro to Sequencing by Synthesis:
§ https://www.youtube.com/watch?v=HMyCqWhwB8E
34
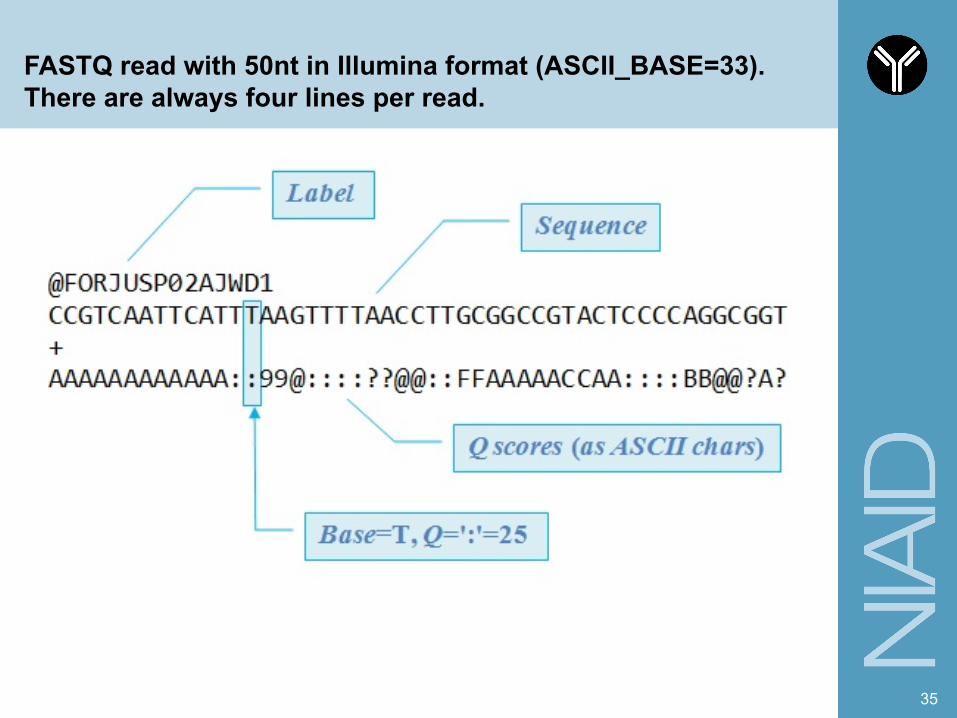
FASTQ read with 50nt in Illumina format (ASCII_BASE=33). There are always four lines per read.
35
36
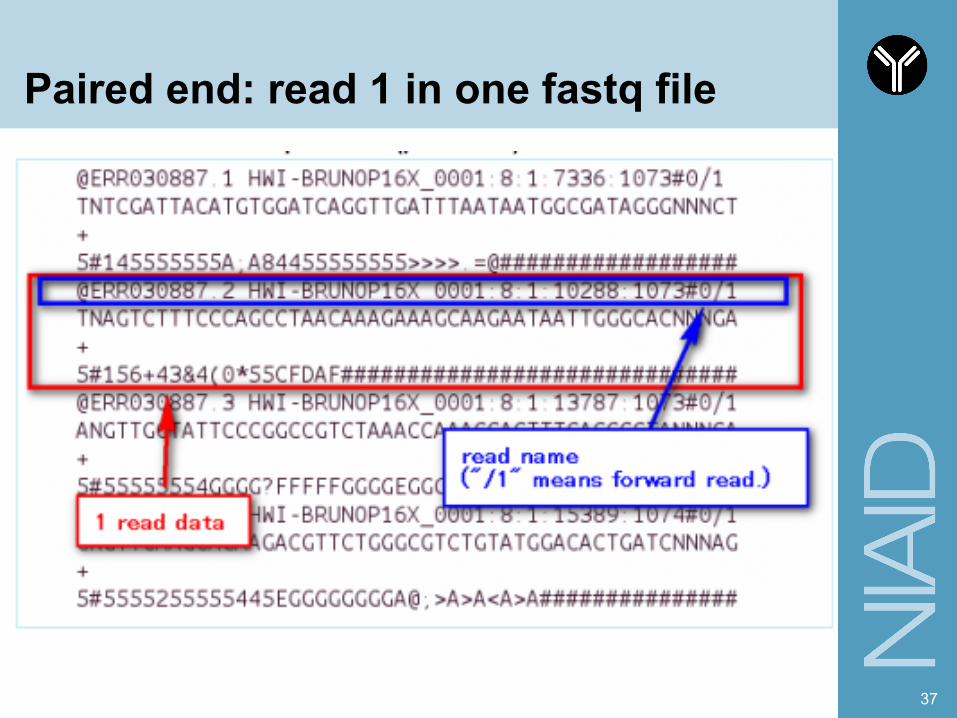
Paired end: read 1 in one fastq file
37
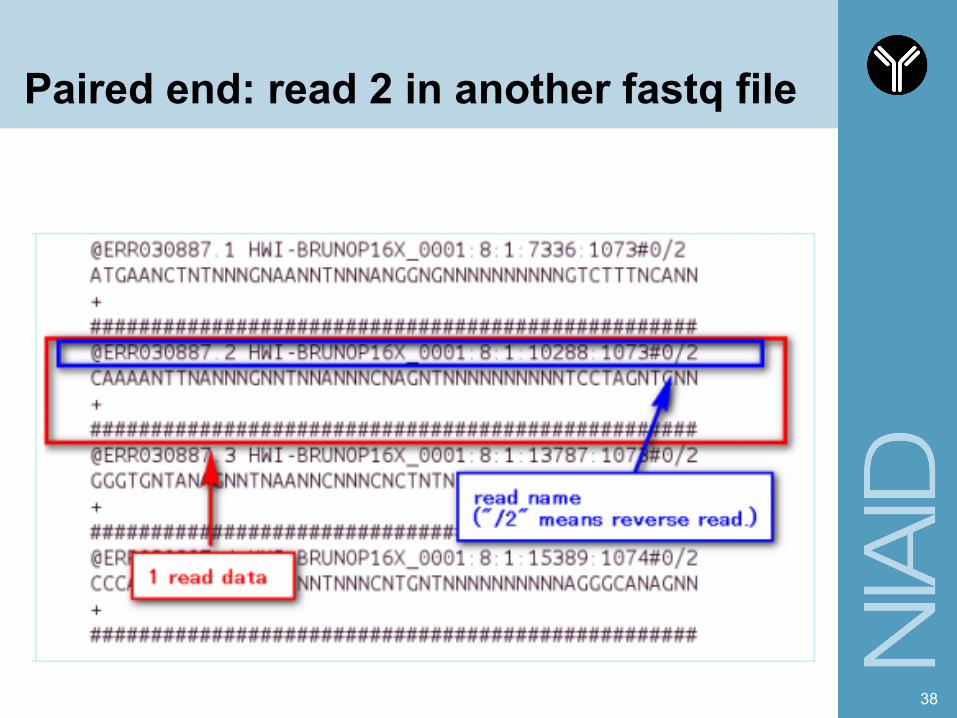
Paired end: read 2 in another fastq file
38
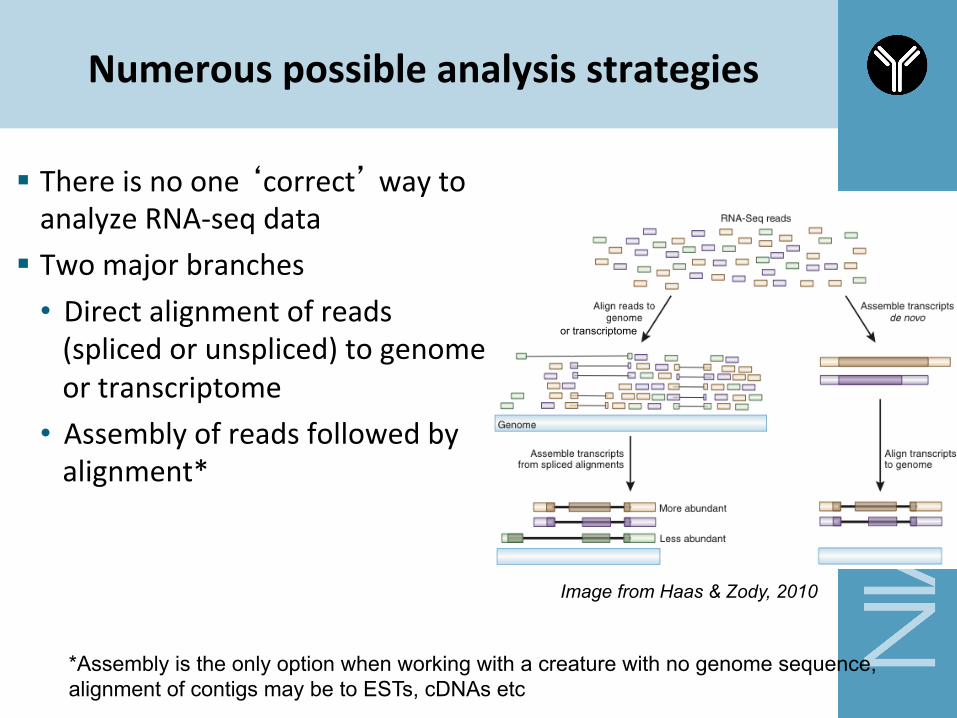
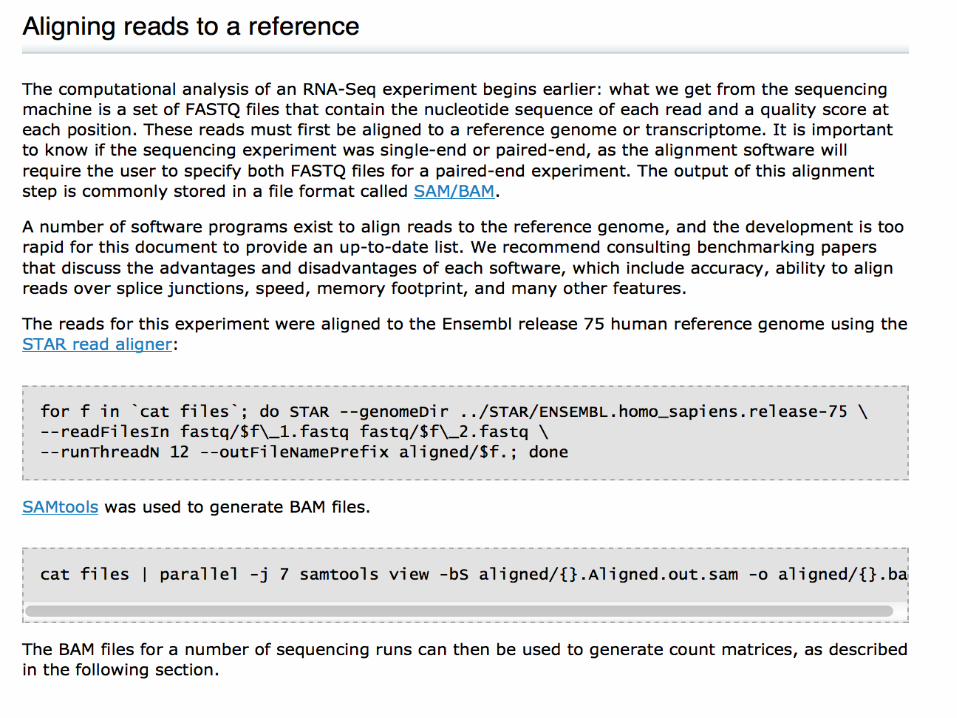
Numerous possible analysis strategies
§ There is no one ‘correct’ way to analyze RNA-‐seq data
§ Two major branches • Direct alignment of reads (spliced or unspliced) to genome or transcriptome
• Assembly of reads followed by alignment*
*Assembly is the only option when working with a creature with no genome sequence, alignment of contigs may be to ESTs, cDNAs etc
or transcriptome
Image from Haas & Zody, 2010

40
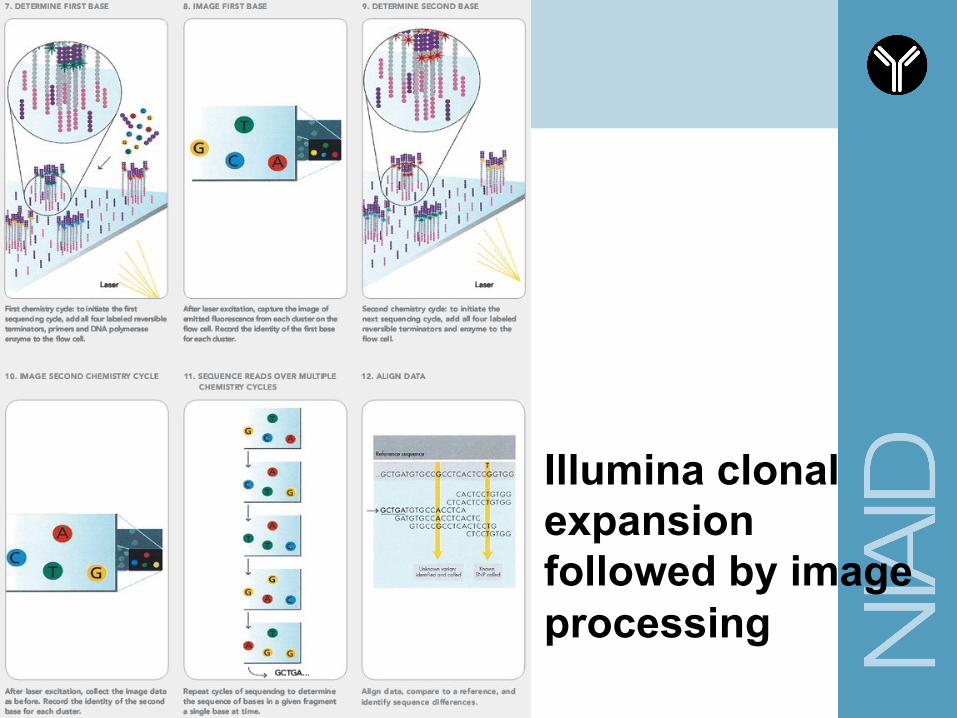
Illumina clonal expansion followed by image processing
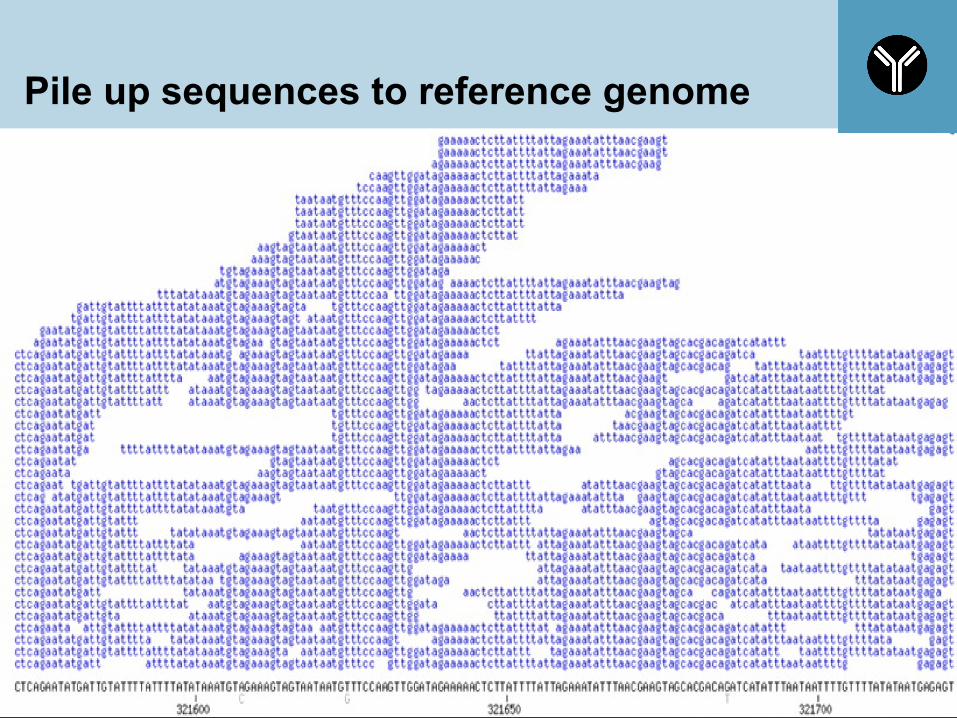
Pile up sequences to reference genome
42
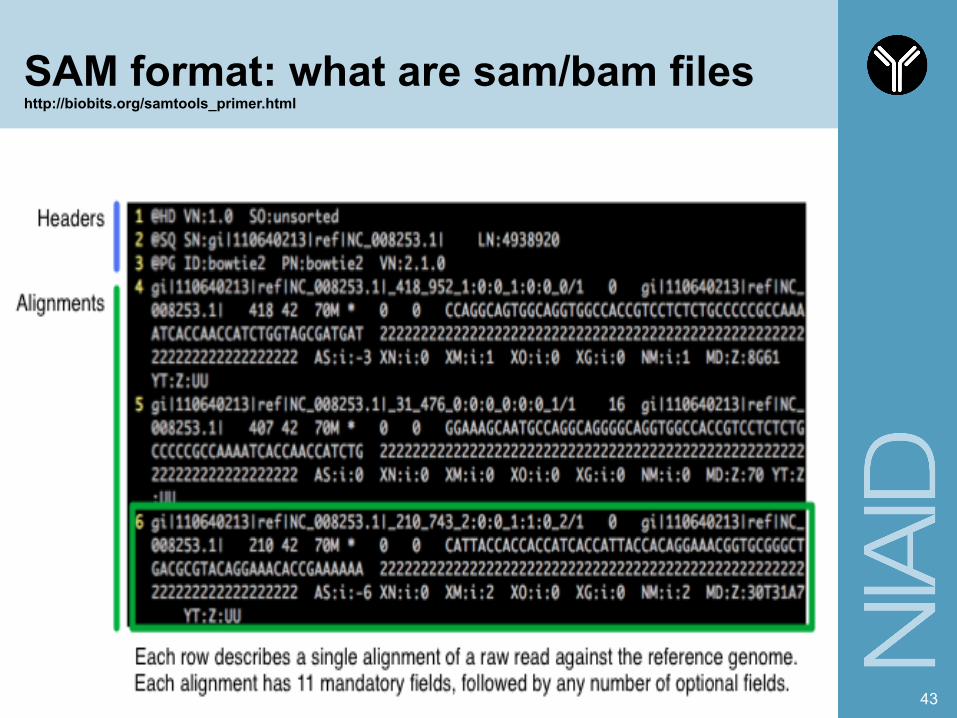
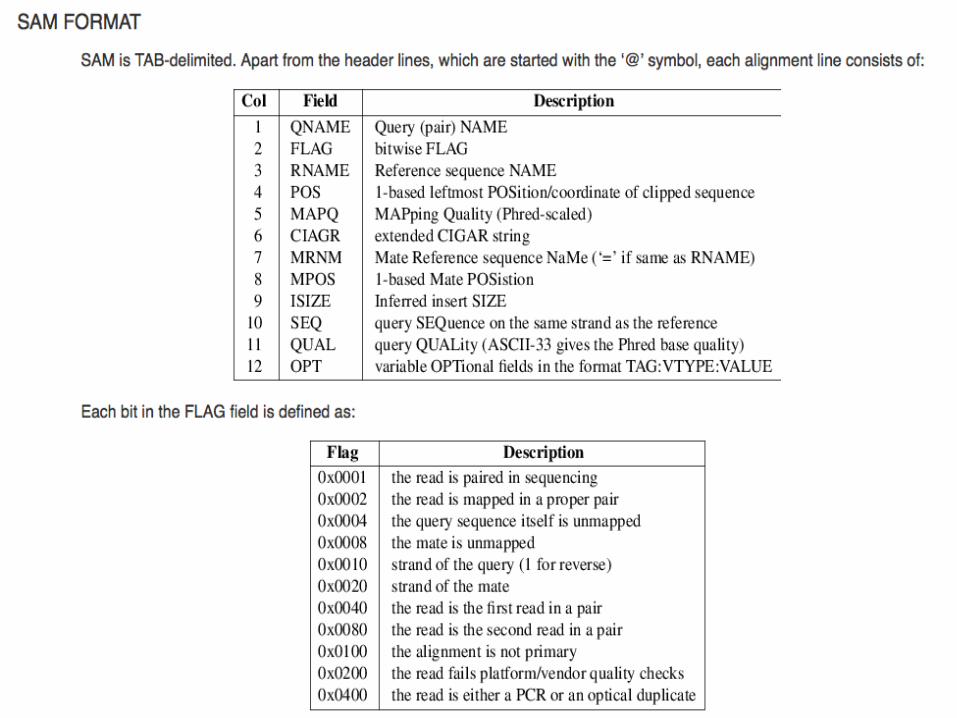
SAM format: what are sam/bam files http://biobits.org/samtools_primer.html
43
44
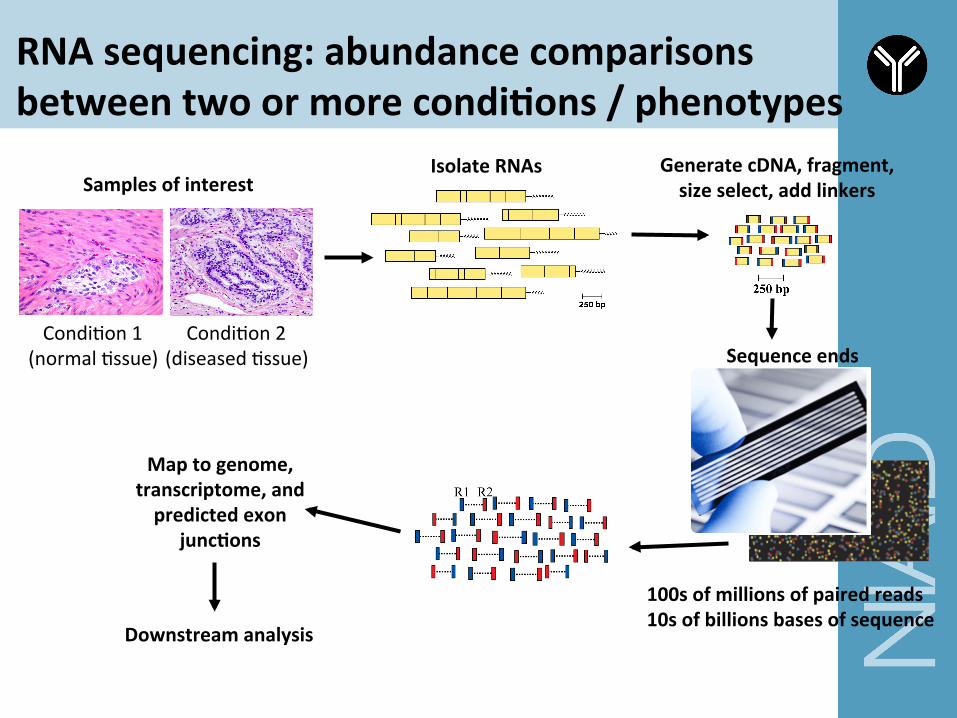
RNA sequencing: abundance comparisons between two or more condi9ons / phenotypes
CondiCon 1 (normal Cssue)
CondiCon 2 (diseased Cssue)
Isolate RNAs
Sequence ends
100s of millions of paired reads 10s of billions bases of sequence
Generate cDNA, fragment, size select, add linkers Samples of interest
Map to genome, transcriptome, and predicted exon
junc9ons
Downstream analysis
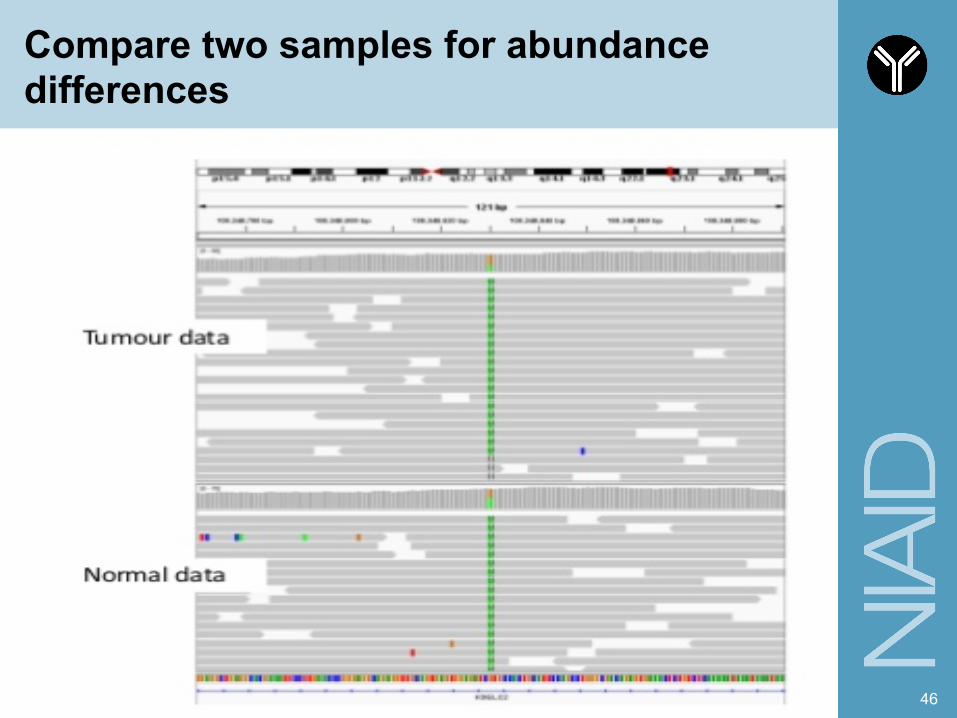
Compare two samples for abundance differences
46
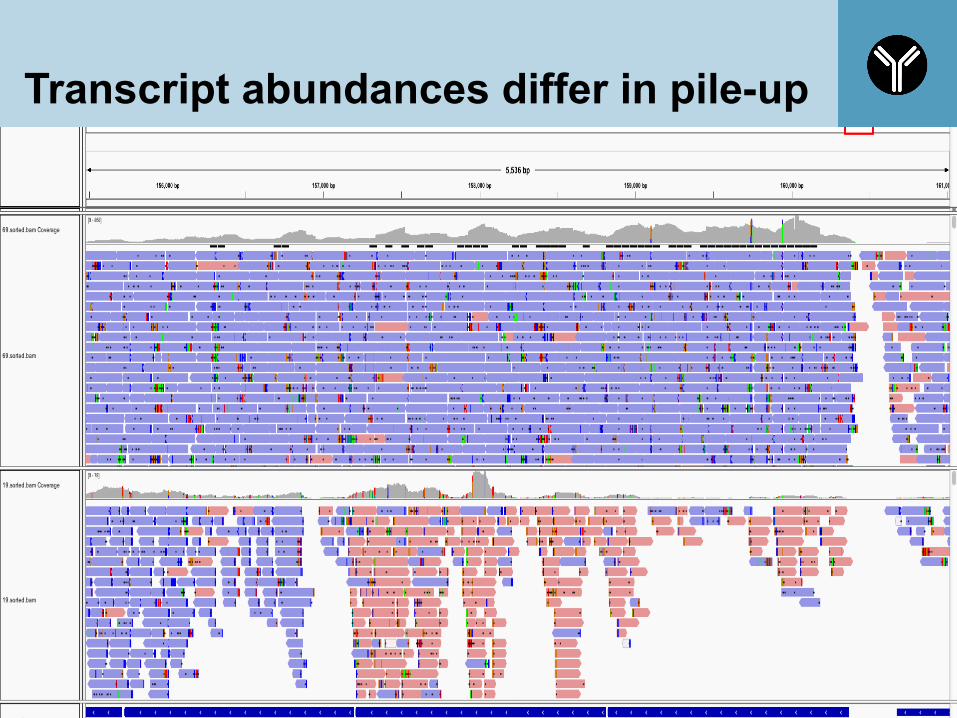
Transcript abundances differ in pile-up
47
Genes have ‘structure’, solve by mapping
§ This leads to for example analysis of intron-exon structure
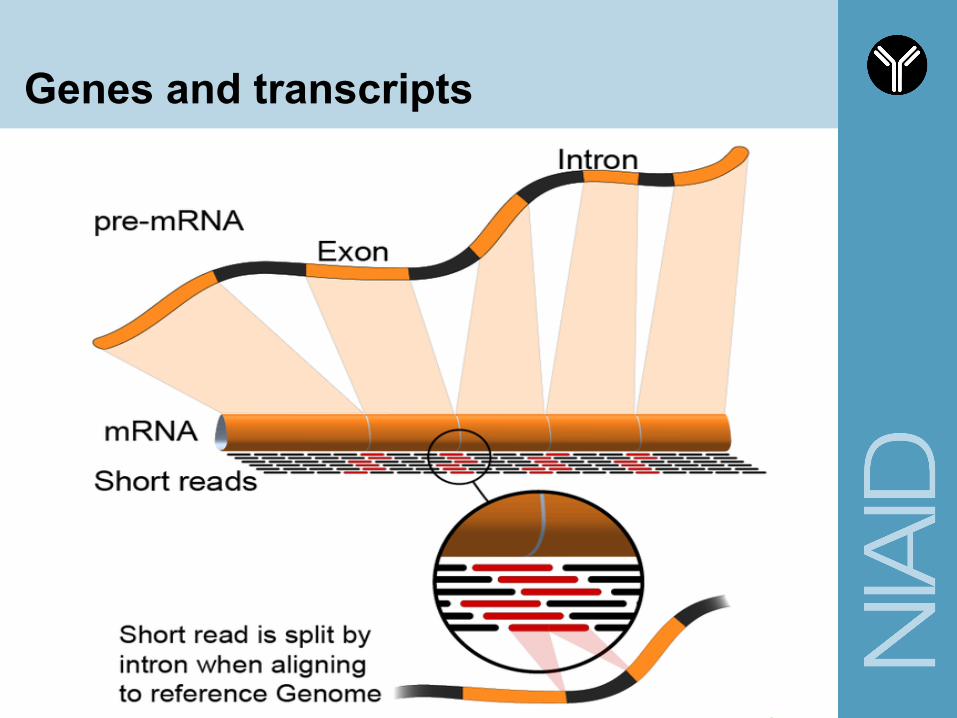
Genes and transcripts
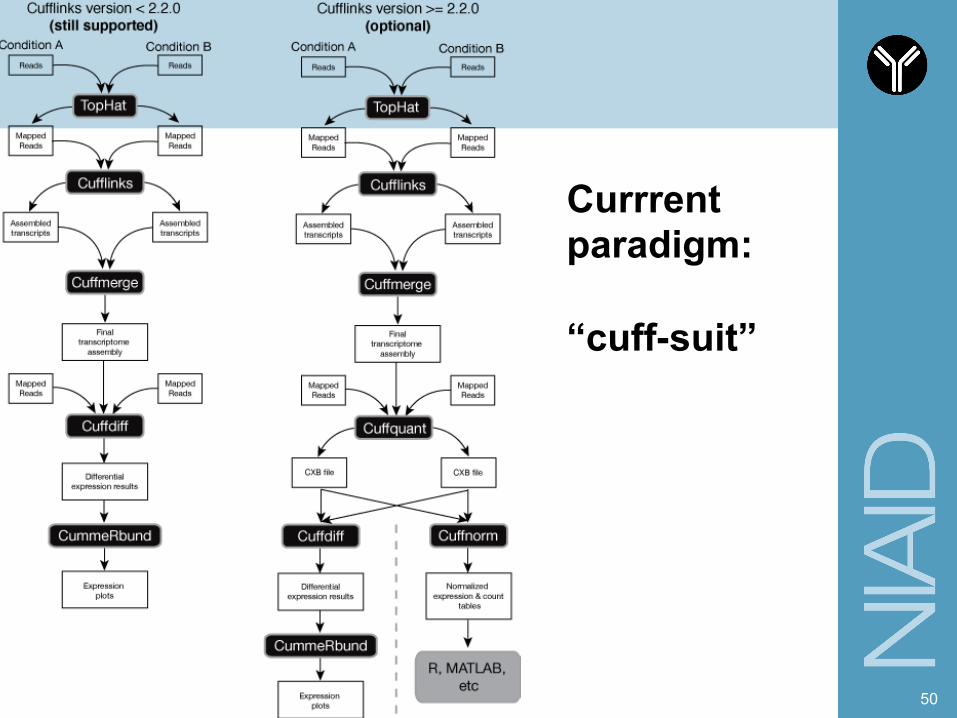
Currrent paradigm: “cuff-suit”
50
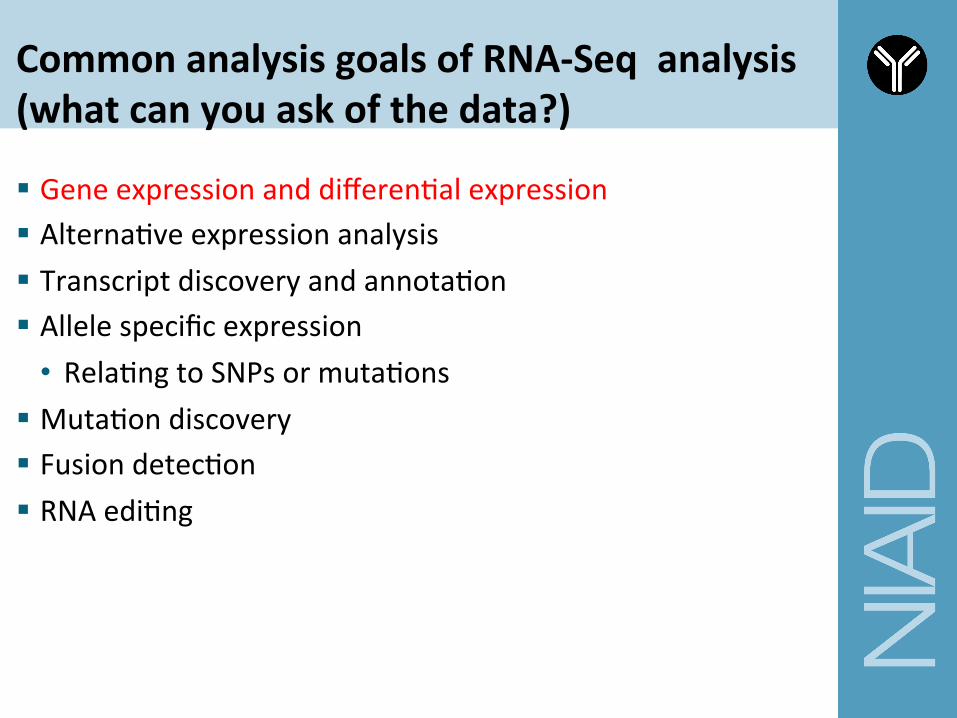
Common analysis goals of RNA-‐Seq analysis (what can you ask of the data?)
§ Gene expression and differenCal expression § AlternaCve expression analysis § Transcript discovery and annotaCon § Allele specific expression
• RelaCng to SNPs or mutaCons § MutaCon discovery § Fusion detecCon § RNA ediCng
Back to the demo
§ IntroducCon to RNA sequencing § RaConale for RNA sequencing (versus DNA sequencing) § Hands on tutorial

Rna-seq with R Demo: easyRNAseq
Source(“c:\\windows\\myname\\rna_seq_tutorial.R”)
source("/vol/maarten/rna_seq_tutorial2.R")
http://bioscholar.com/genomics/bioconductor-packages-analysis-rna-seq-data/
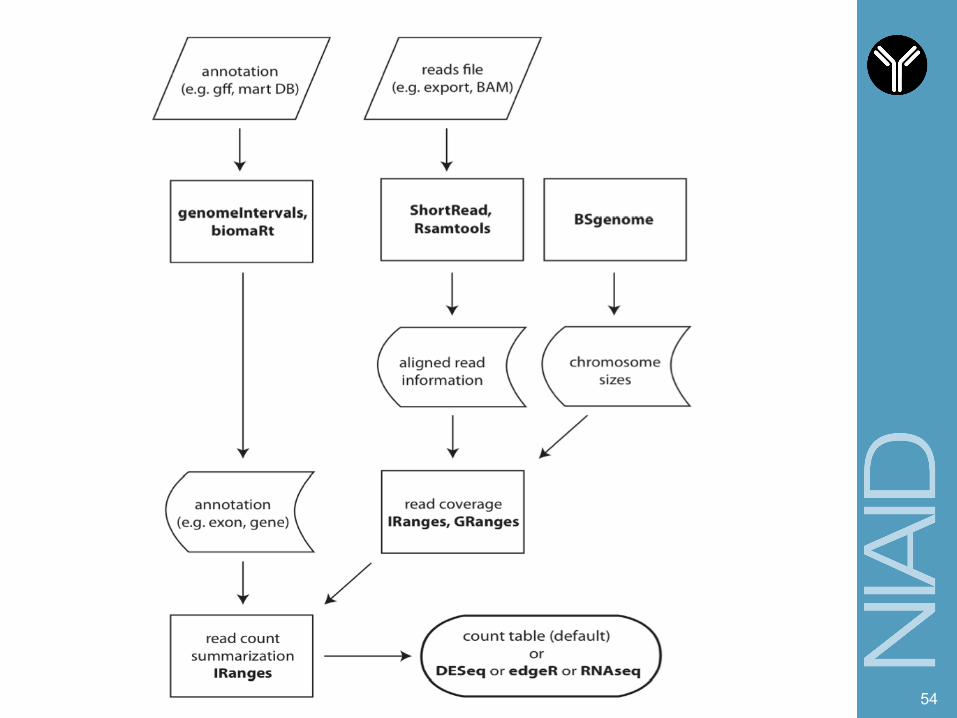
54
Deseq and DEseq2
§ method based on the negative binomial distribution, with variance and mean linked by local regression
§ DEseq2: § No demo scripts available yet: § http://www.bioconductor.org/packages/release/bioc/
vignettes/DESeq2/inst/doc/DESeq2.pdf
55
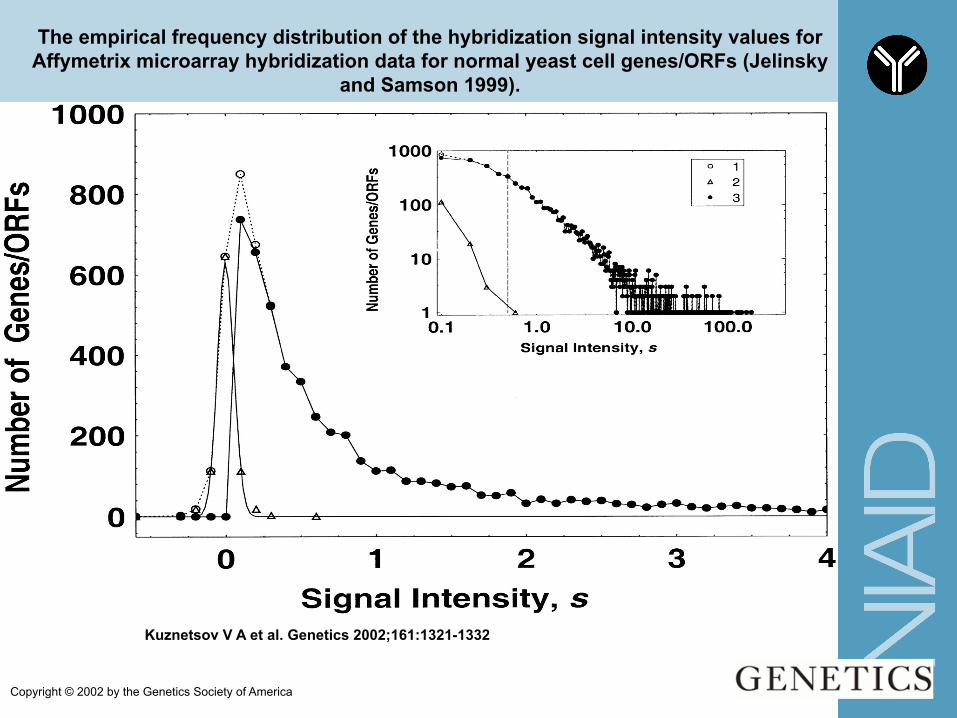
The empirical frequency distribution of the hybridization signal intensity values for Affymetrix microarray hybridization data for normal yeast cell genes/ORFs (Jelinsky
and Samson 1999).
Kuznetsov V A et al. Genetics 2002;161:1321-1332
Copyright © 2002 by the Genetics Society of America
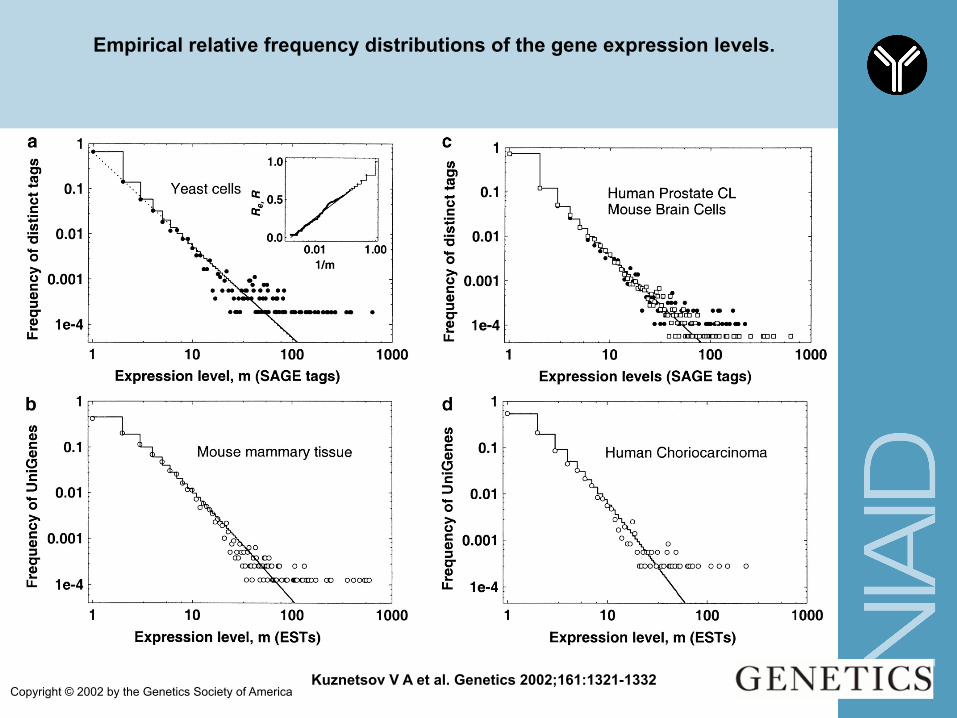
Empirical relative frequency distributions of the gene expression levels.
Kuznetsov V A et al. Genetics 2002;161:1321-1332 Copyright © 2002 by the Genetics Society of America
58
59
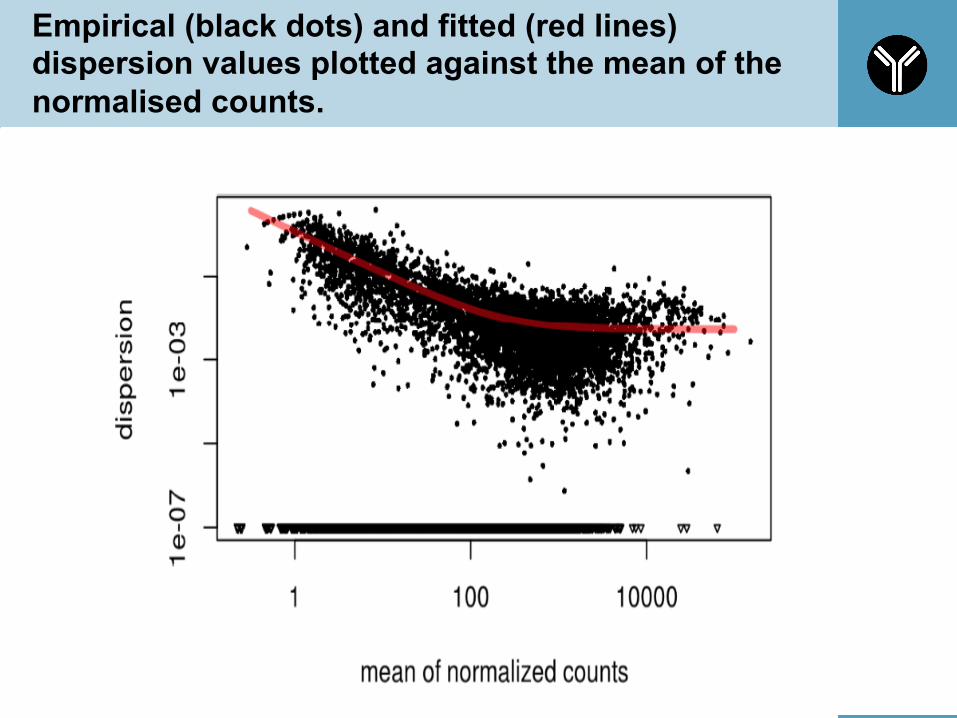
Empirical (black dots) and fitted (red lines) dispersion values plotted against the mean of the normalised counts.
60
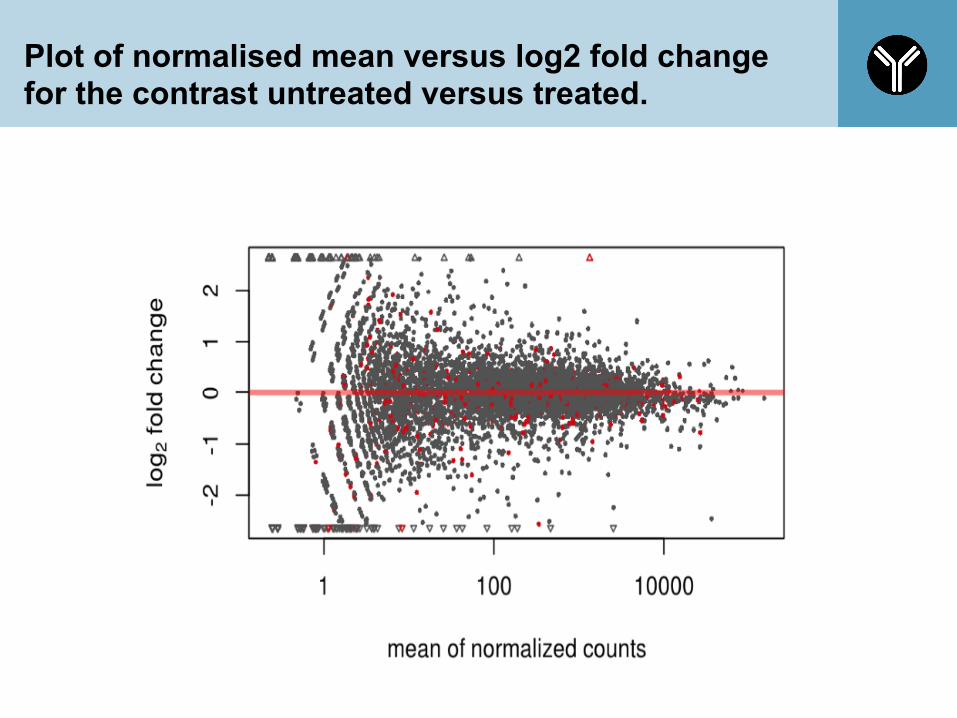
Plot of normalised mean versus log2 fold change for the contrast untreated versus treated.
61
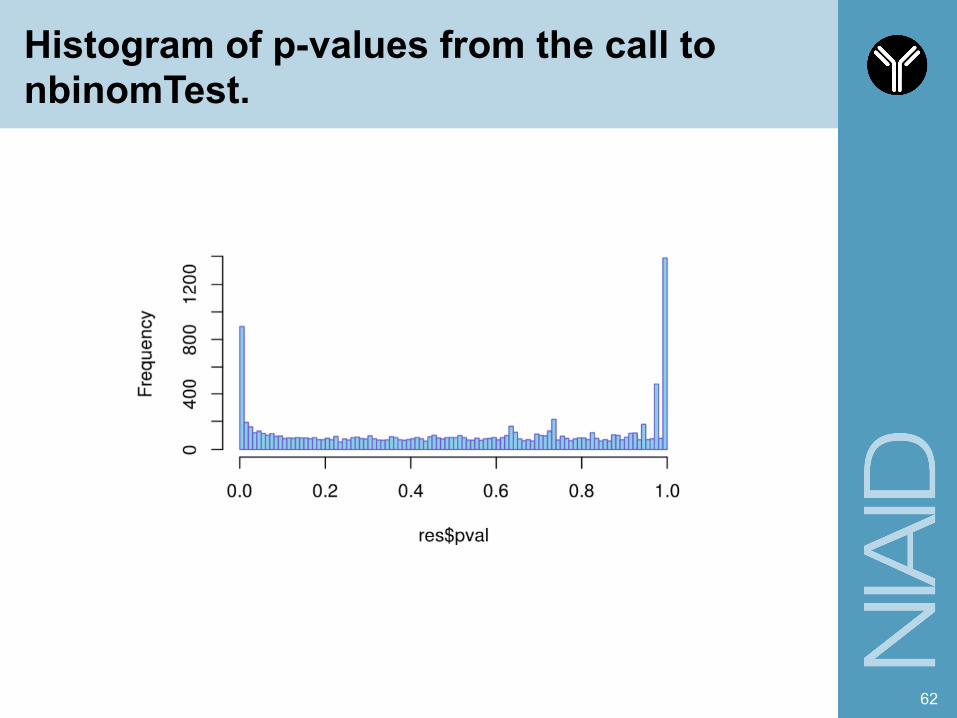
Histogram of p-values from the call to nbinomTest.
62
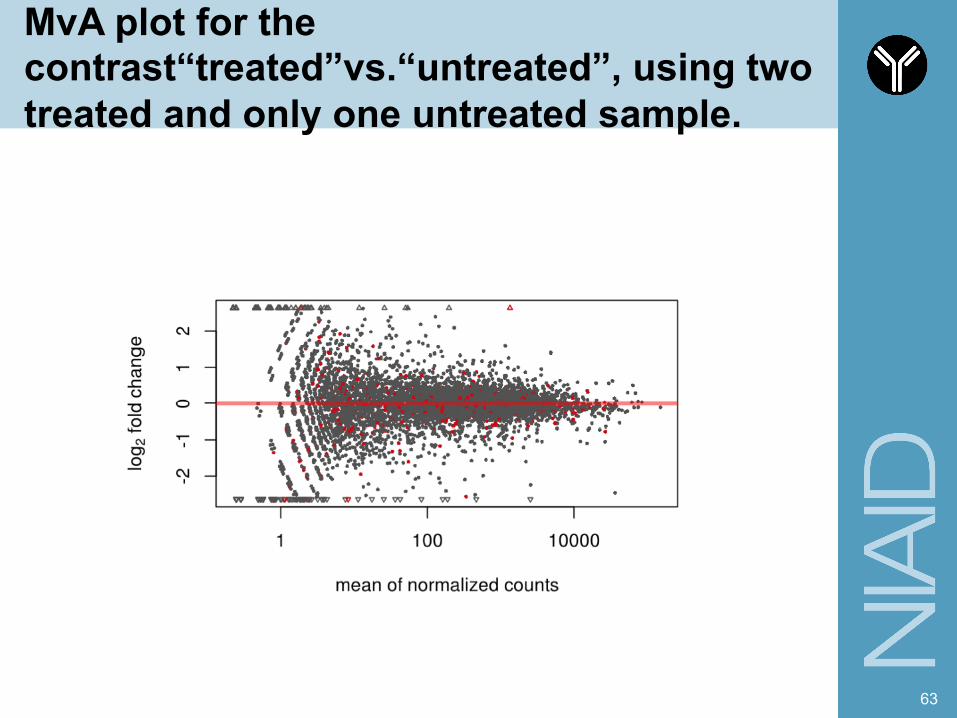
MvA plot for the contrast“treated”vs.“untreated”, using two treated and only one untreated sample.
63
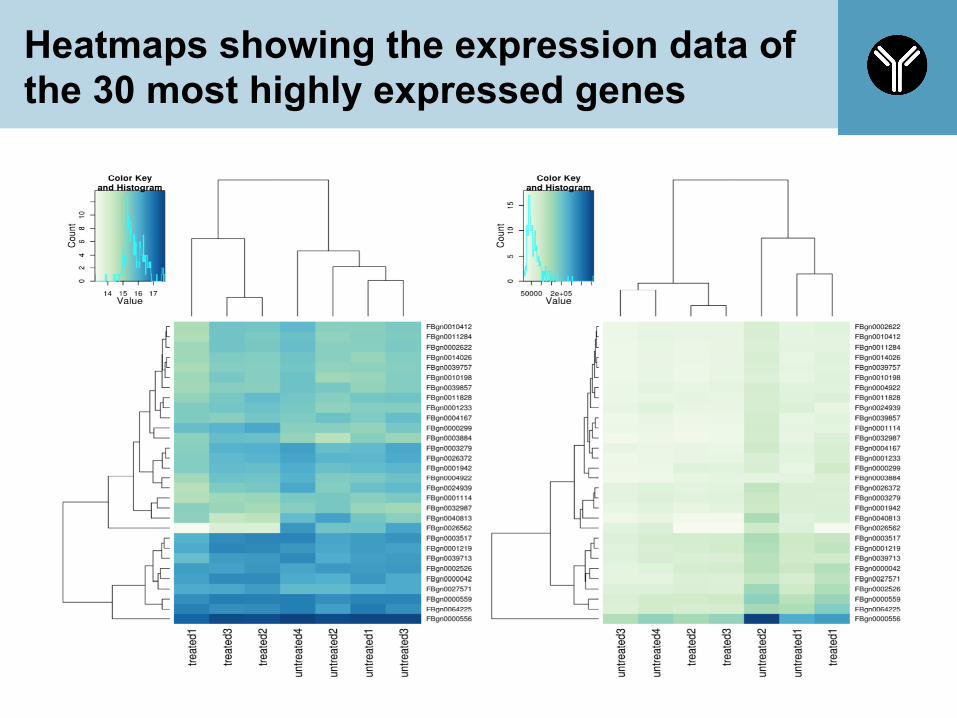
Heatmaps showing the expression data of the 30 most highly expressed genes
64
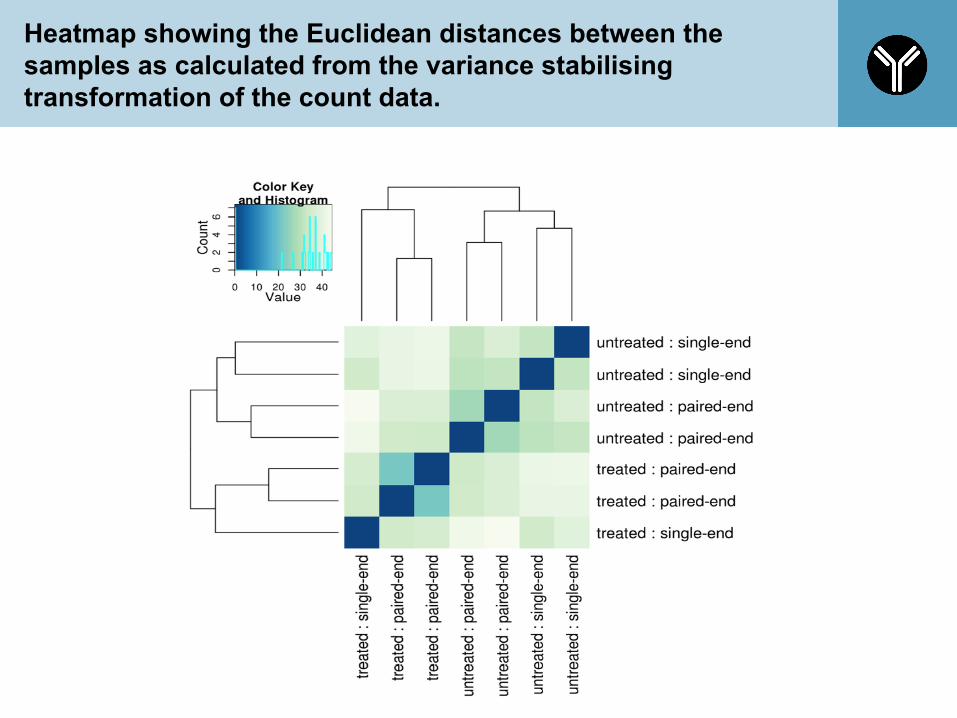
Heatmap showing the Euclidean distances between the samples as calculated from the variance stabilising transformation of the count data.
65
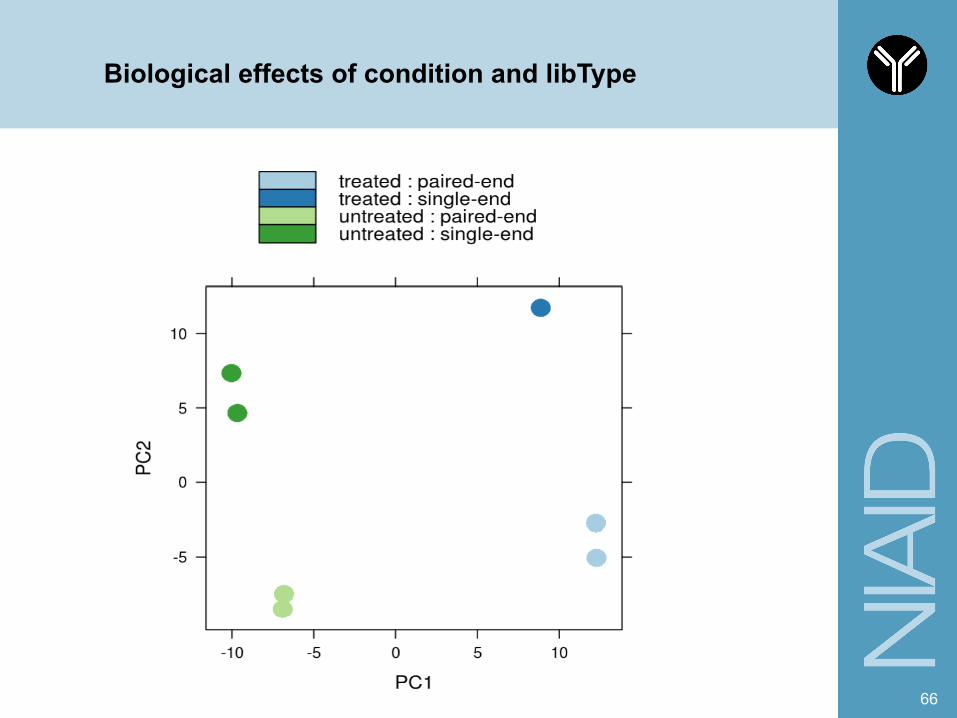
Biological effects of condition and libType
66
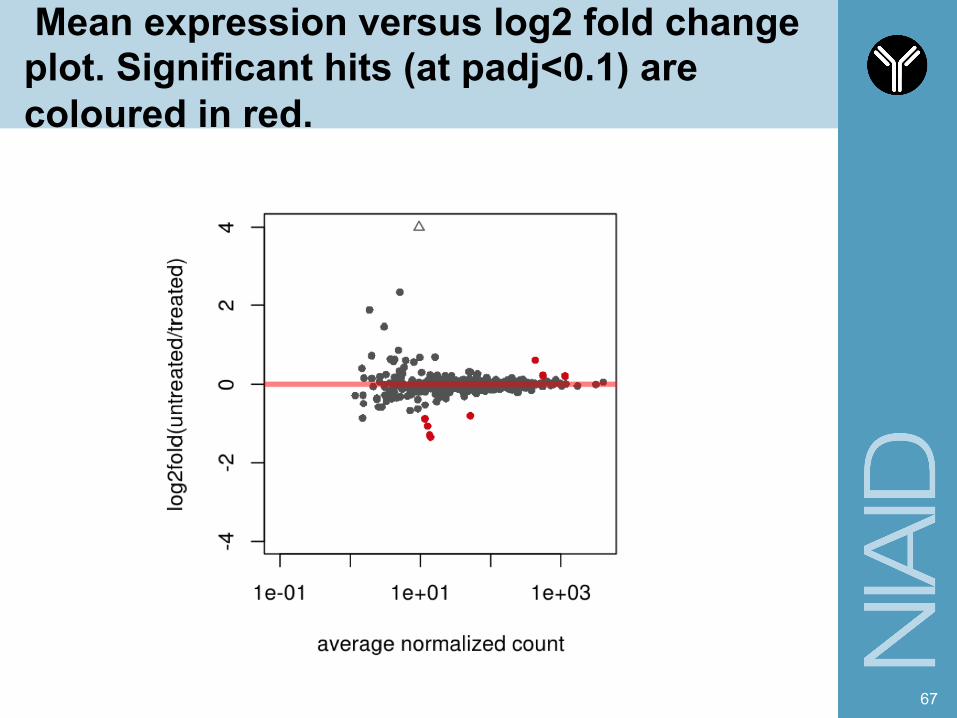
Mean expression versus log2 fold change plot. Significant hits (at padj<0.1) are coloured in red.
67
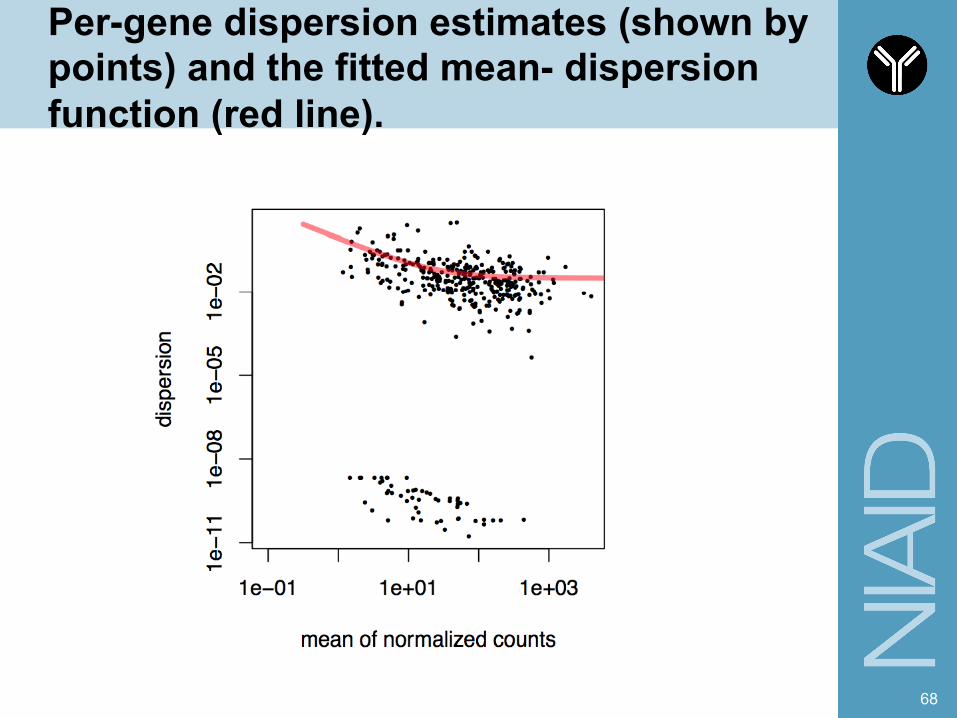
Per-gene dispersion estimates (shown by points) and the fitted mean- dispersion function (red line).
68
Differential exon usage
§ Detecting spliced isoform usage by exon-level expression analysis
69
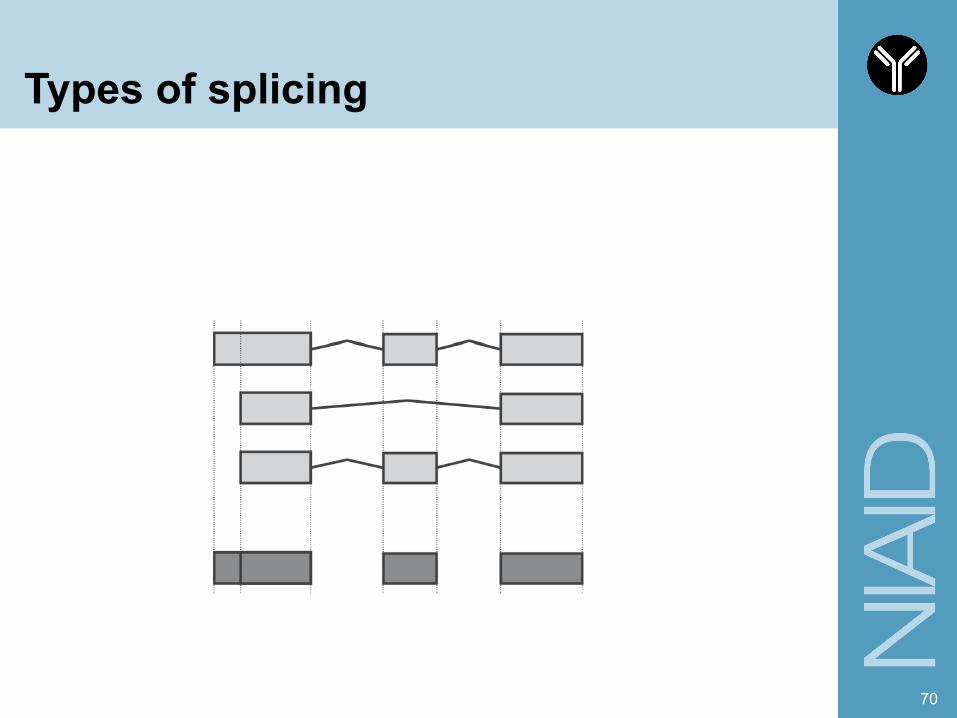
Types of splicing
70
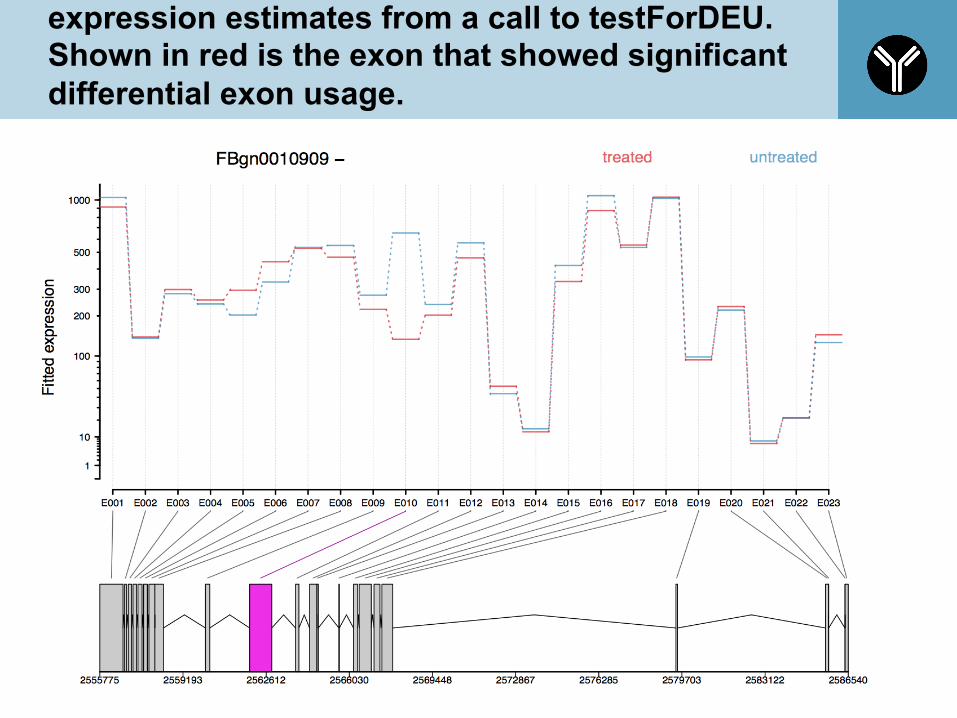
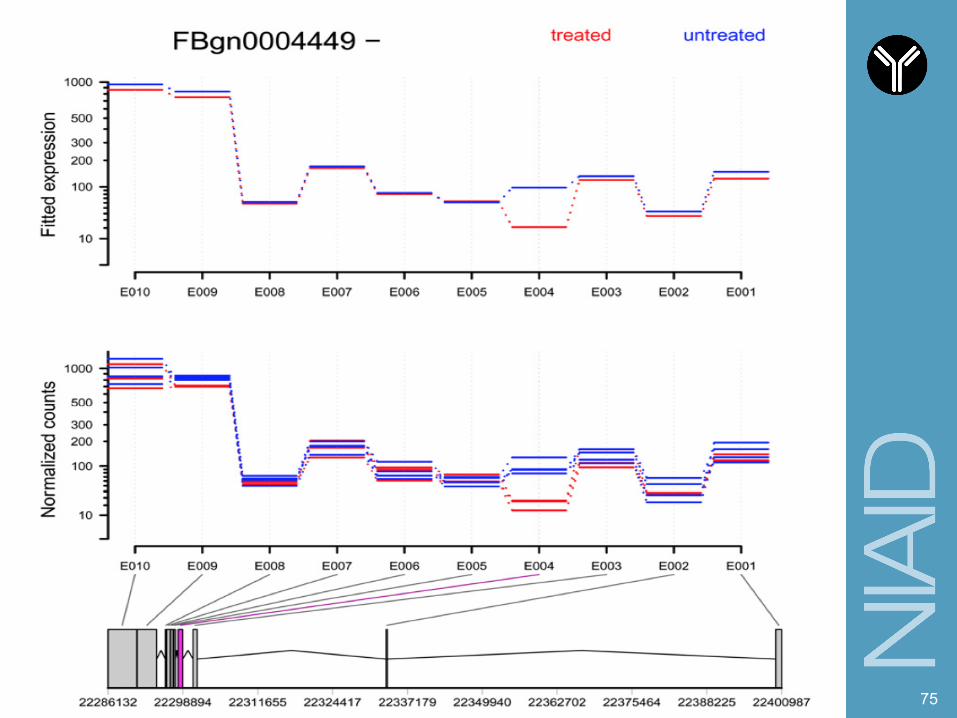
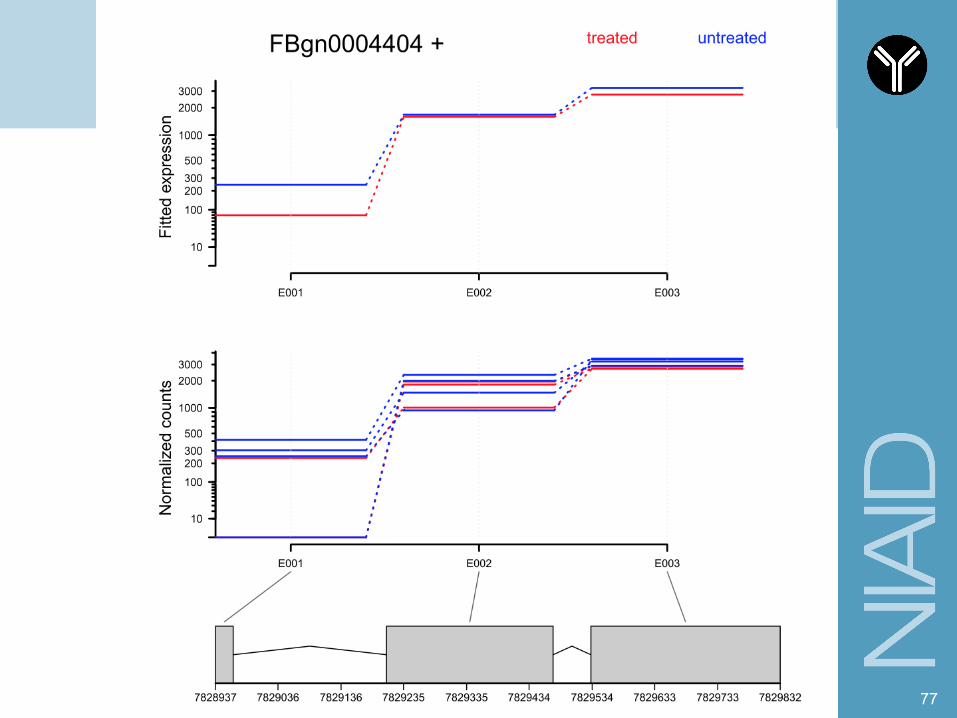
expression estimates from a call to testForDEU. Shown in red is the exon that showed significant differential exon usage.
71
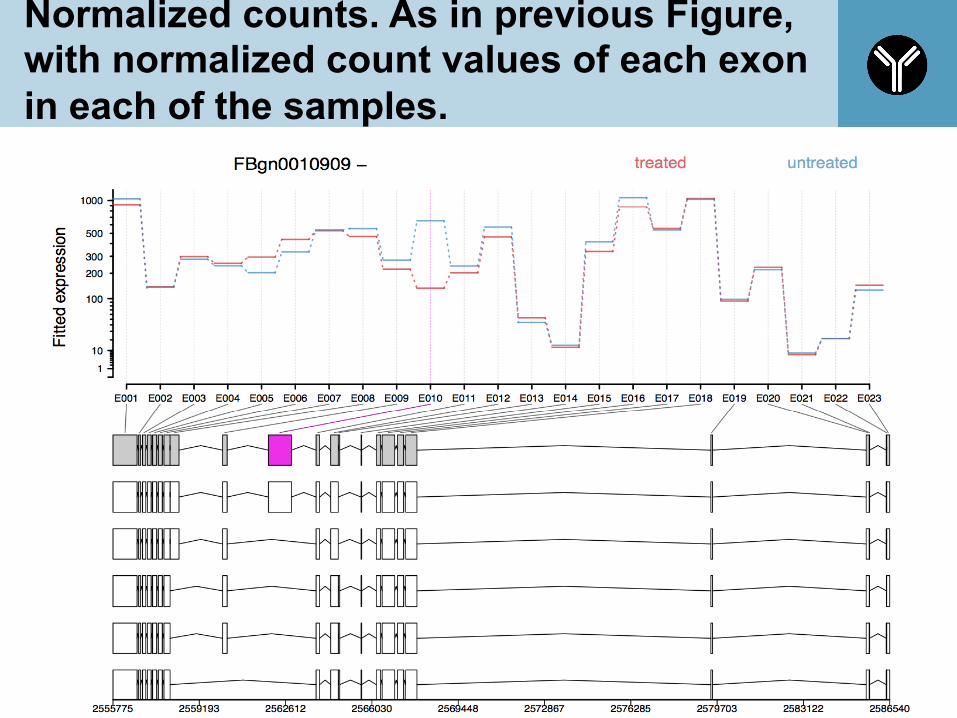
Normalized counts. As in previous Figure, with normalized count values of each exon in each of the samples.
72
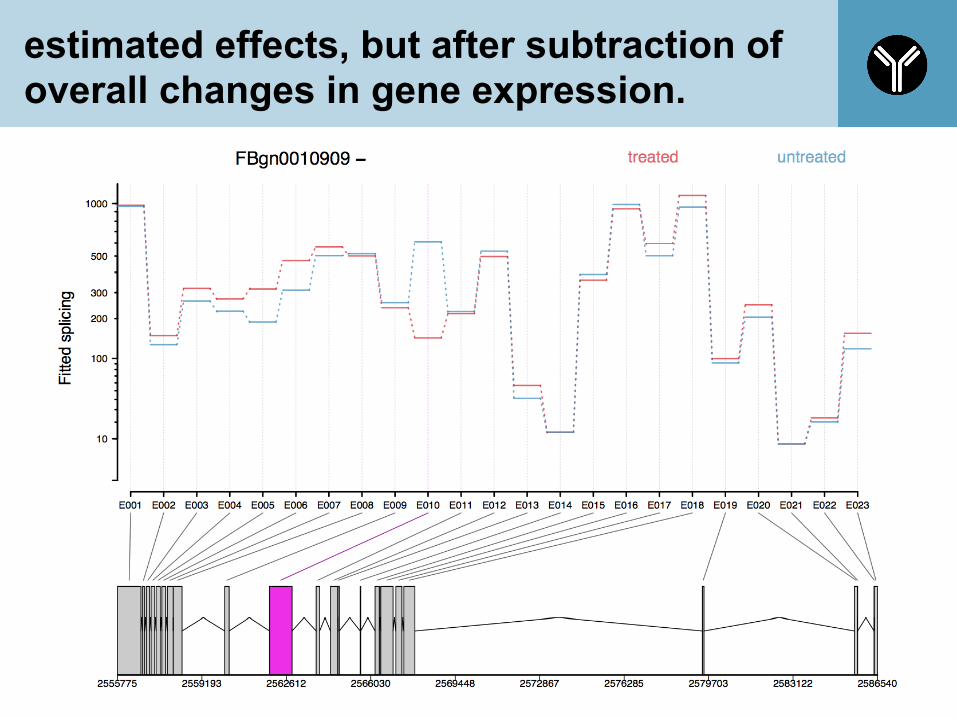
estimated effects, but after subtraction of overall changes in gene expression.
73
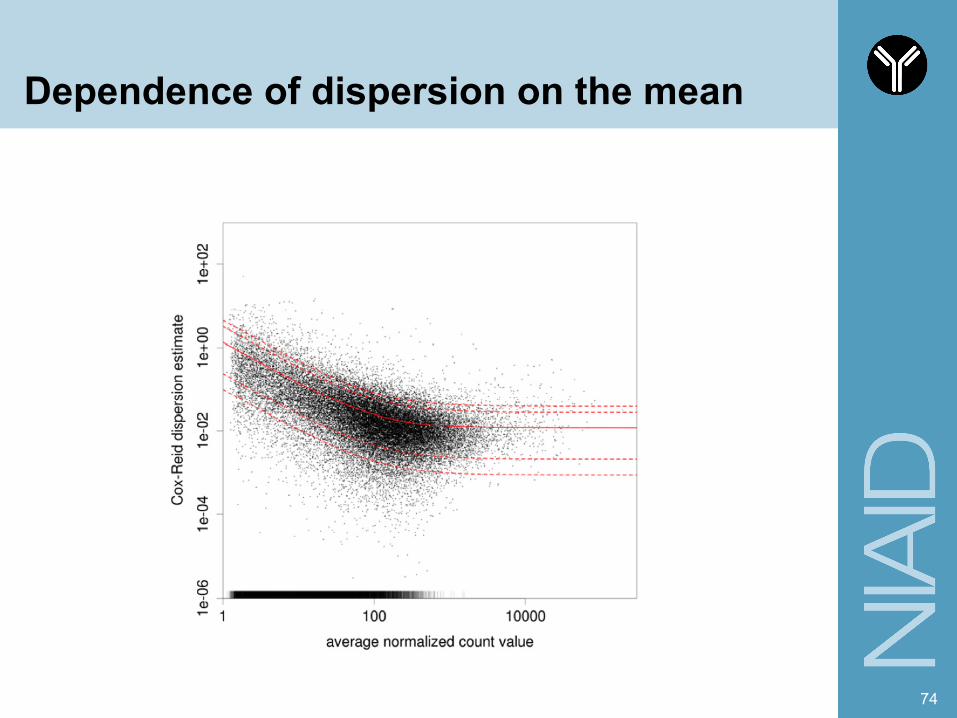
Dependence of dispersion on the mean
74
75
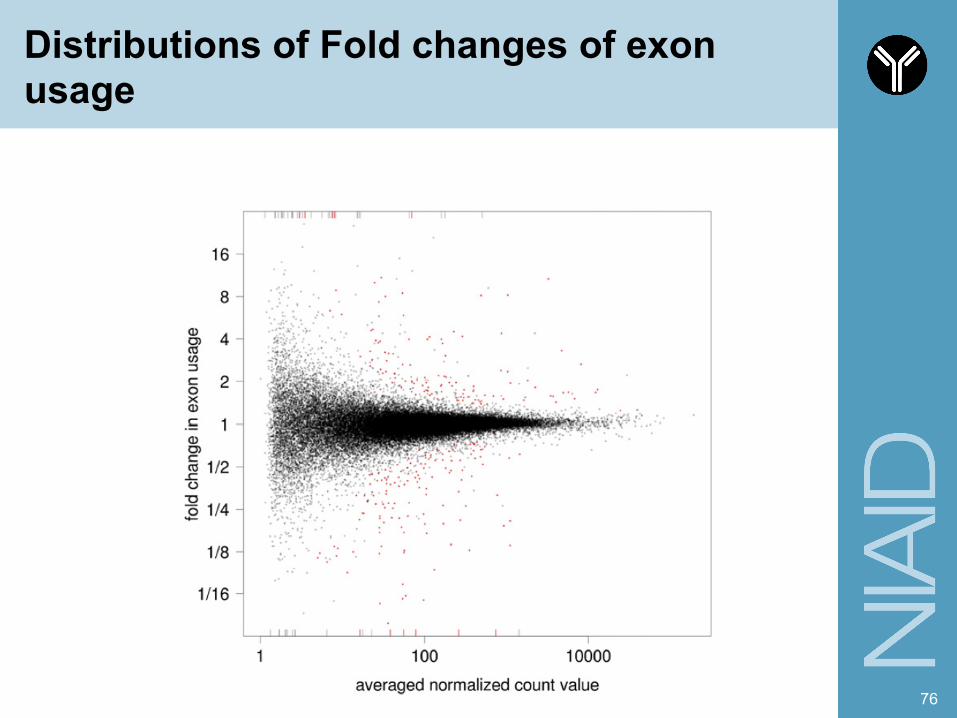
Distributions of Fold changes of exon usage
76
77
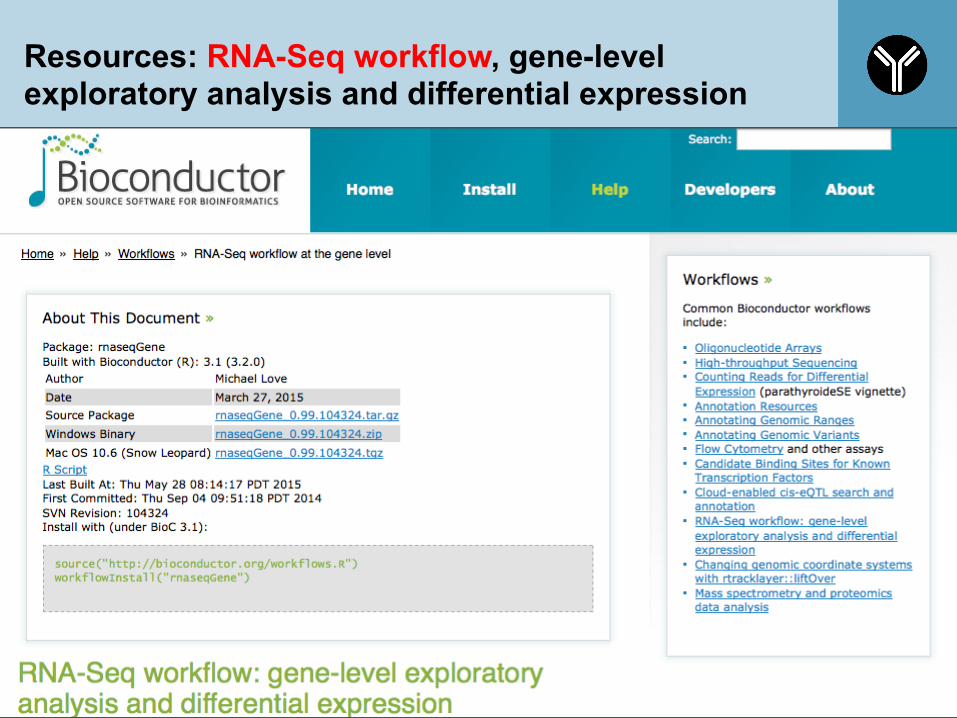
Resources: RNA-Seq workflow, gene-level exploratory analysis and differential expression
78
79
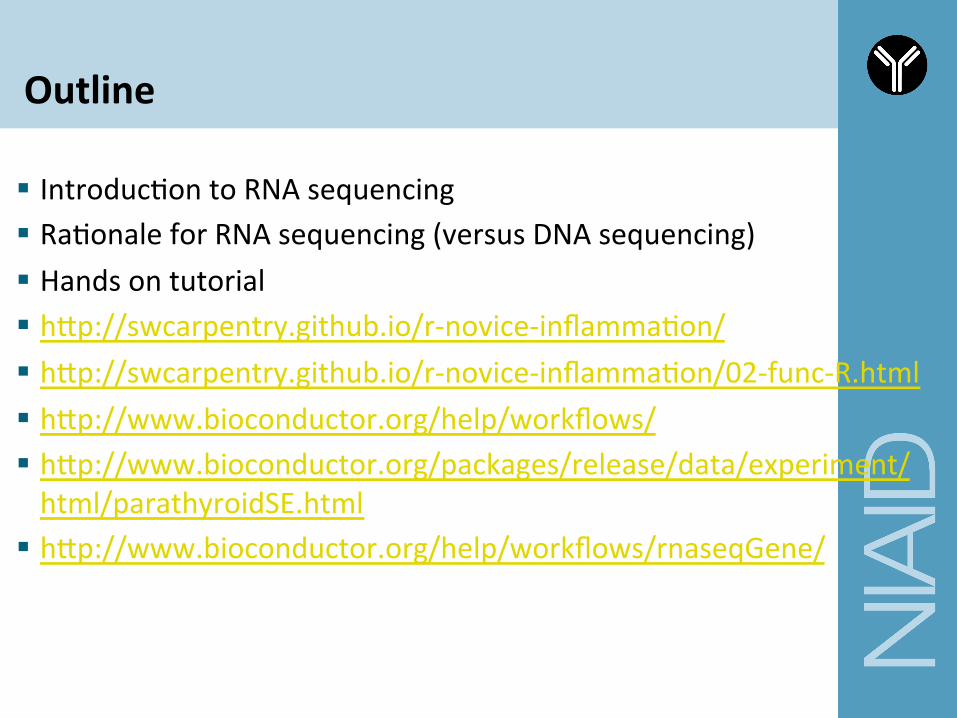
Outline
§ IntroducCon to RNA sequencing § RaConale for RNA sequencing (versus DNA sequencing) § Hands on tutorial § hQp://swcarpentry.github.io/r-‐novice-‐inflammaCon/ § hQp://swcarpentry.github.io/r-‐novice-‐inflammaCon/02-‐func-‐R.html § hQp://www.bioconductor.org/help/workflows/ § hQp://www.bioconductor.org/packages/release/data/experiment/html/parathyroidSE.html
§ hQp://www.bioconductor.org/help/workflows/rnaseqGene/
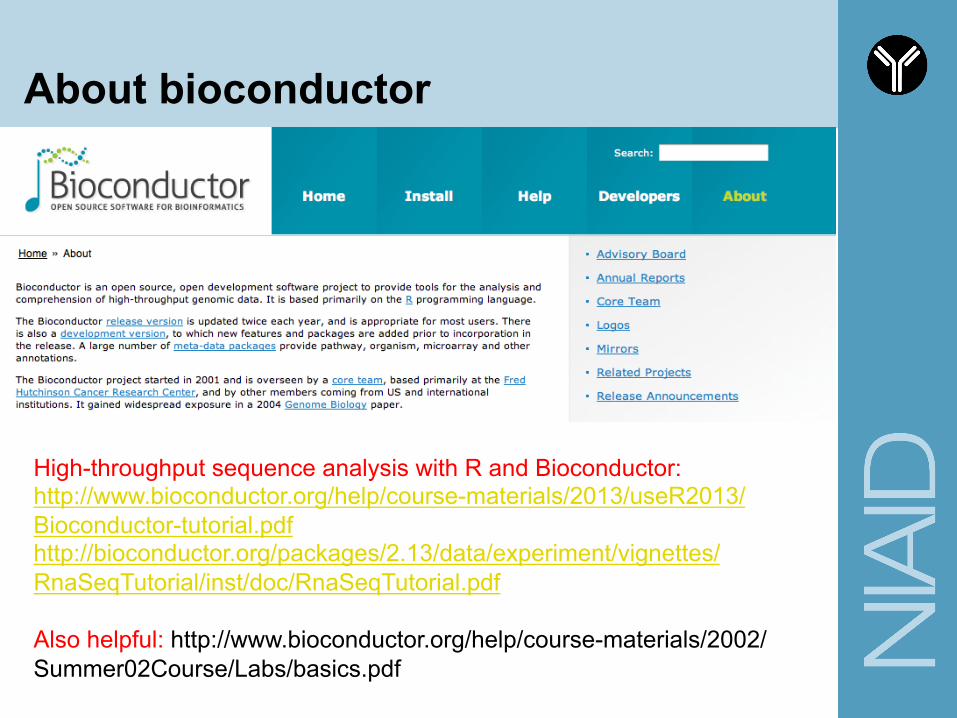
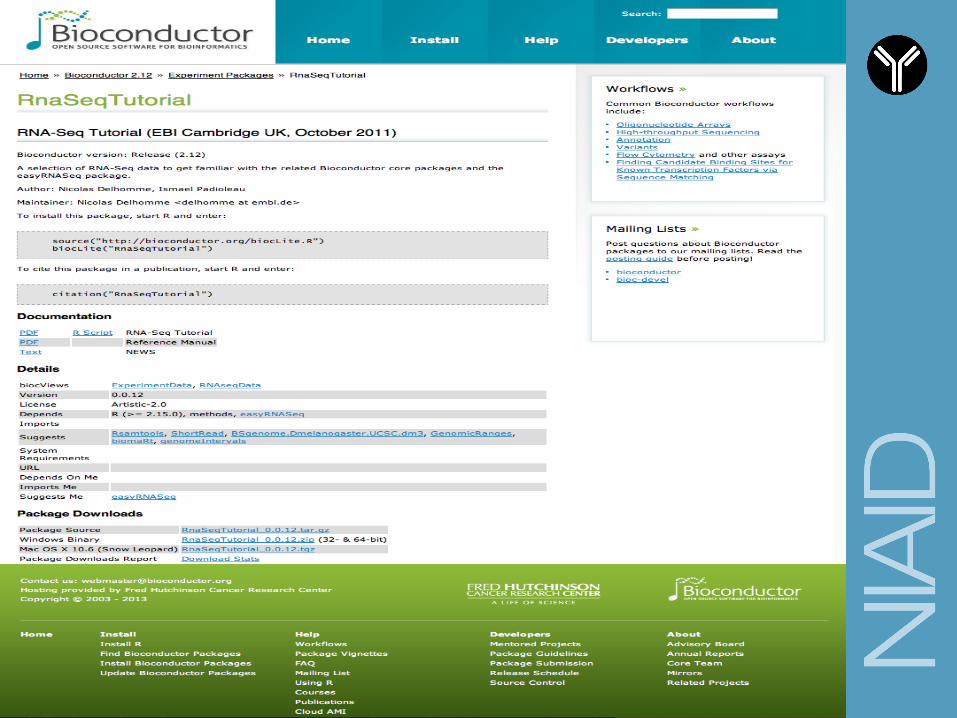
About bioconductor
High-throughput sequence analysis with R and Bioconductor: http://www.bioconductor.org/help/course-materials/2013/useR2013/Bioconductor-tutorial.pdf http://bioconductor.org/packages/2.13/data/experiment/vignettes/RnaSeqTutorial/inst/doc/RnaSeqTutorial.pdf Also helpful: http://www.bioconductor.org/help/course-materials/2002/Summer02Course/Labs/basics.pdf
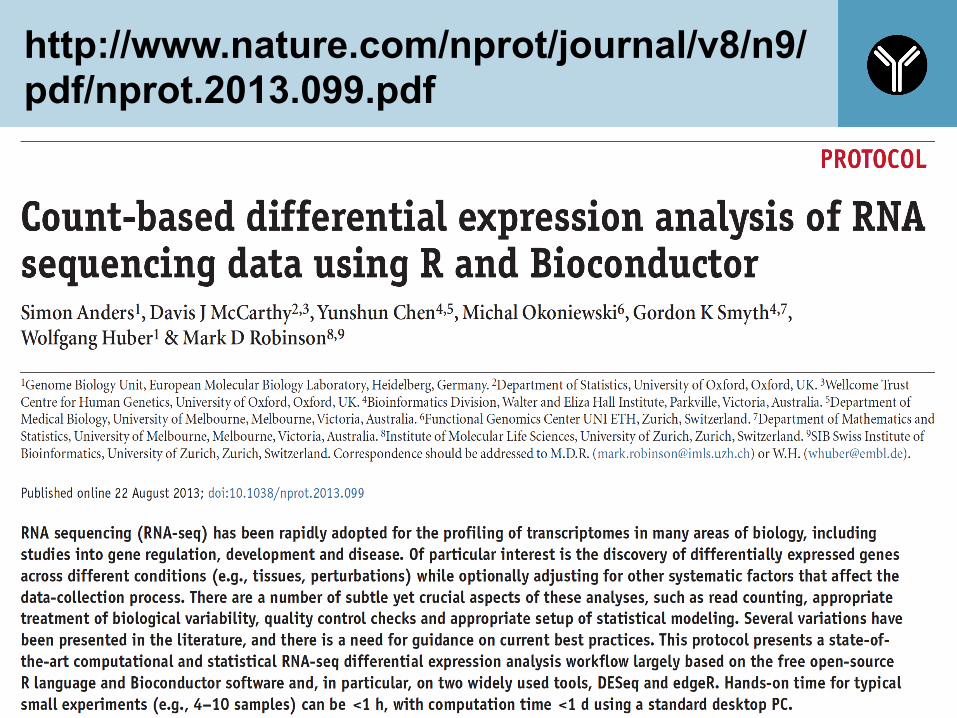
http://www.nature.com/nprot/journal/v8/n9/pdf/nprot.2013.099.pdf
82
The End
84