rnib smart glasses project report keziah... · the purpose of this report is to further analyse the...
TRANSCRIPT
Keziah Latham July 2016
1
RNIB Smart Glasses Project Data analysis report
Prepared by Dr Keziah Latham Prof Cert LV FCOptom
25 July 2016
Keziah Latham July 2016
2
Contents
Introduction ............................................................................................. 4
Visual field through Smart Glasses ......................................................... 4
Observer testing ..................................................................................... 5
Type of loss: self-reported as central, peripheral or both ...................... 6
Self-reported tunnel vision ................................................................... 6
Visual fields .......................................................................................... 7
Visual field loss as determined objectively by field plots .................. 11
Objective tunnel vision .................................................................... 12
Comparison of objective visual field plots and self-reported visual
field loss .......................................................................................... 13
Spectacle prescription ........................................................................ 15
Visual acuity (VA) ............................................................................... 16
Contrast sensitivity ............................................................................. 16
Self-reported sight level ..................................................................... 17
Age .................................................................................................... 18
Duration of visual loss ........................................................................ 19
Diagnosis ........................................................................................... 19
Specific tasks in observer testing ....................................................... 23
Table top testing .............................................................................. 23
Obstacle course .............................................................................. 24
Outside walk .................................................................................... 25
Comparison of tasks ........................................................................ 26
Home trial ............................................................................................. 26
Diagnosis ........................................................................................... 27
Age .................................................................................................... 28
Duration of visual loss ........................................................................ 29
Visual acuity ....................................................................................... 30
Visual field ......................................................................................... 31
Type of loss ..................................................................................... 31
Keziah Latham July 2016
3
Self-reported tunnel vision ............................................................... 31
Objective tunnel vision .................................................................... 32
Useful mode(s) ................................................................................... 33
Use of filter ......................................................................................... 35
Conclusions .......................................................................................... 36
References ........................................................................................... 37
Keziah Latham July 2016
4
Introduction The purpose of this report is to further analyse the findings of the RNIB
Smart Glasses project in order to comment on the characteristics of
people who are more likely to gain benefit from the device. Particular
emphasis is given to analysis of the visual field data provided by a
subset of participants.
Visual field through Smart Glasses The Smart Glasses (Glasses) have a restricted field of view compared to
the normal extent of visual field. It might therefore be considered that
people with a visual field that extends beyond that of the Glasses will be
losing visual extent by using the Glasses, so the appearance of the
image within the screen would have to be significantly better to outweigh
the restricted field of view. For those with visual field restricted to within
the limits of the Glasses, vision is not being ‘lost’ by wearing them, and
so the Glasses may need to provide less improvement in vision to be of
benefit overall. To understand this further, visual field whilst wearing the
Glasses was assessed.
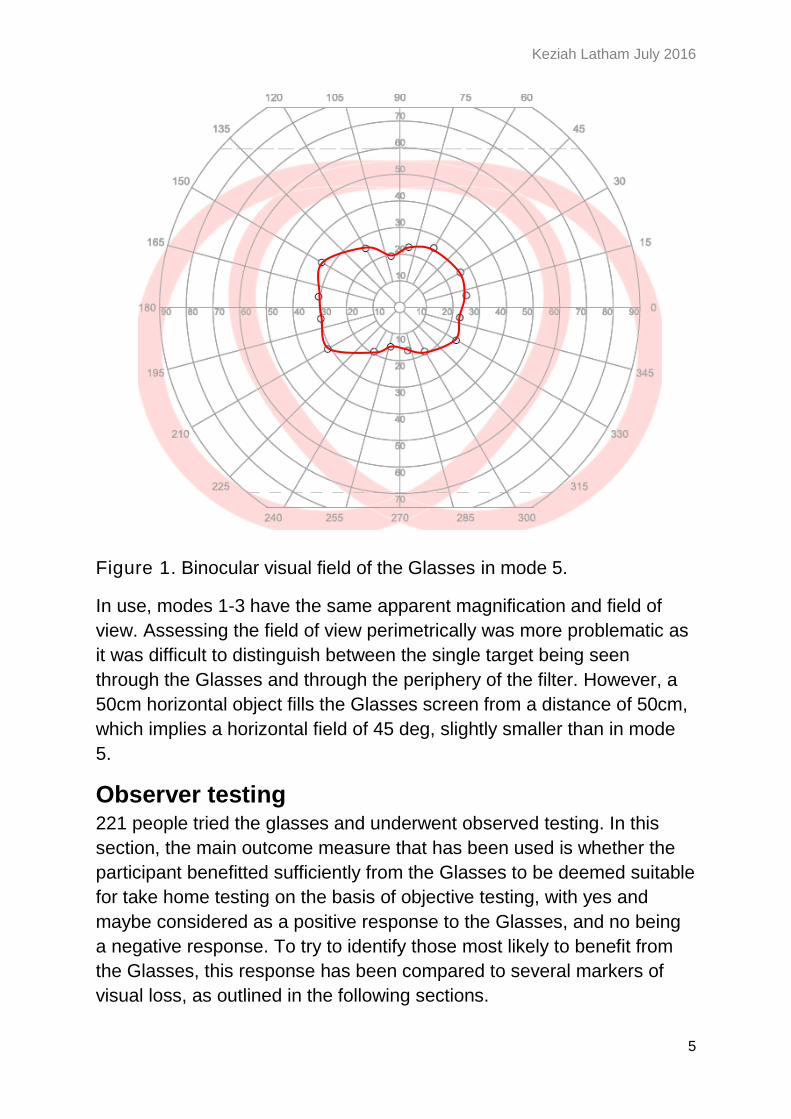
Binocular visual field was assessed kinetically on the Octopus 900 with
the Glasses in mode 5 (with filter in place, maximum contrast, and
minimum zoom). As shown in Figure 1, the vertical extent of the field
was approx. 35 deg, and horizontal extent approx. 55 deg. In addition, a
50 cm horizontal object fills the Glass screen from a distance of 40cm,
indicating a field of 51 deg, consistent with the perimetric findings. Thus
the Smart Glasses in mode 5 will be potentially of most use to patients
who have vision retained within the central 35 deg vertically (approx. 15
deg above and below fixation) and 55 deg horizontally (approx. 25 deg
either side of fixation).
Keziah Latham July 2016
5
Figure 1. Binocular visual field of the Glasses in mode 5.
In use, modes 1-3 have the same apparent magnification and field of
view. Assessing the field of view perimetrically was more problematic as
it was difficult to distinguish between the single target being seen
through the Glasses and through the periphery of the filter. However, a
50cm horizontal object fills the Glasses screen from a distance of 50cm,
which implies a horizontal field of 45 deg, slightly smaller than in mode
5.
Observer testing 221 people tried the glasses and underwent observed testing. In this
section, the main outcome measure that has been used is whether the
participant benefitted sufficiently from the Glasses to be deemed suitable
for take home testing on the basis of objective testing, with yes and
maybe considered as a positive response to the Glasses, and no being
a negative response. To try to identify those most likely to benefit from
the Glasses, this response has been compared to several markers of
visual loss, as outlined in the following sections.
Keziah Latham July 2016
6
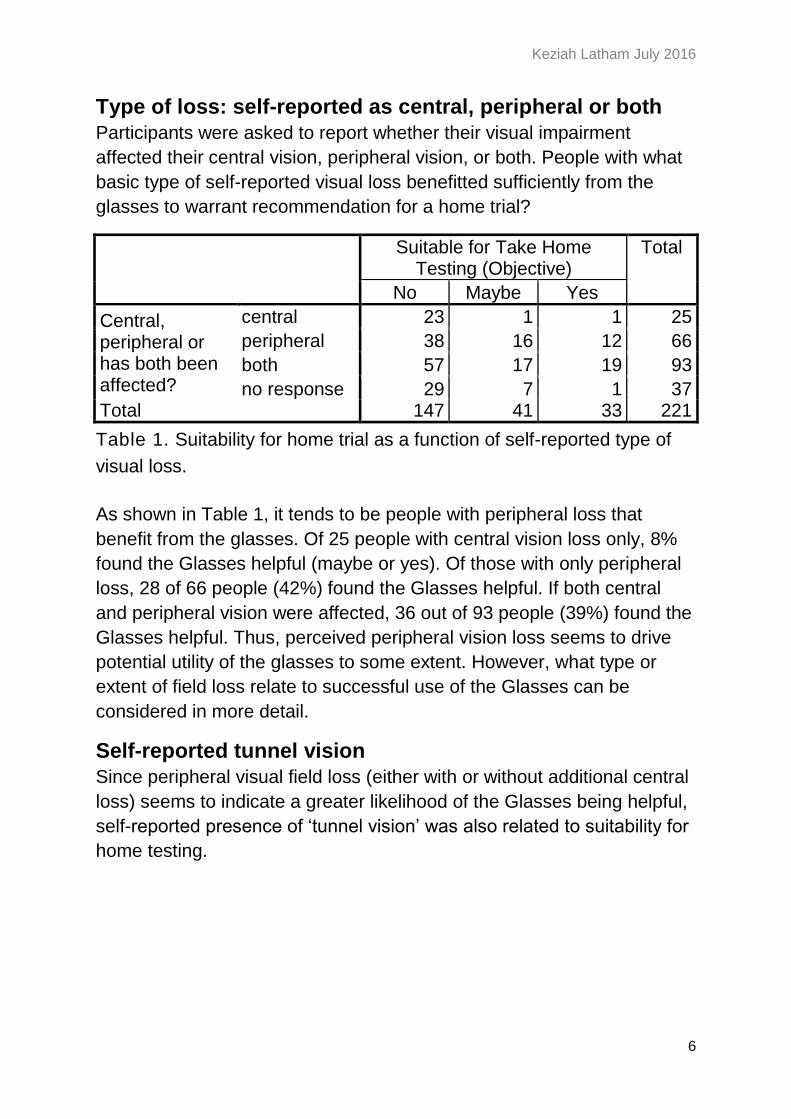
Type of loss: self-reported as central, peripheral or both
Participants were asked to report whether their visual impairment
affected their central vision, peripheral vision, or both. People with what
basic type of self-reported visual loss benefitted sufficiently from the
glasses to warrant recommendation for a home trial?
Suitable for Take Home Testing (Objective)
Total
No Maybe Yes
Central, peripheral or has both been affected?
central 23 1 1 25
peripheral 38 16 12 66
both 57 17 19 93
no response 29 7 1 37 Total 147 41 33 221
Table 1. Suitability for home trial as a function of self-reported type of
visual loss.
As shown in Table 1, it tends to be people with peripheral loss that
benefit from the glasses. Of 25 people with central vision loss only, 8%
found the Glasses helpful (maybe or yes). Of those with only peripheral
loss, 28 of 66 people (42%) found the Glasses helpful. If both central
and peripheral vision were affected, 36 out of 93 people (39%) found the
Glasses helpful. Thus, perceived peripheral vision loss seems to drive
potential utility of the glasses to some extent. However, what type or
extent of field loss relate to successful use of the Glasses can be
considered in more detail.
Self-reported tunnel vision
Since peripheral visual field loss (either with or without additional central
loss) seems to indicate a greater likelihood of the Glasses being helpful,
self-reported presence of ‘tunnel vision’ was also related to suitability for
home testing.

Keziah Latham July 2016
7
Suitable for Take Home Testing (Objective)
Total
No Maybe Yes
Has tunnel vision?
No 110 27 20 157
Yes 35 14 13 62
Not sure
2 0 0 2
Total 147 41 33 221
Table 2. Suitability for home trial as a function of self-reported tunnel
vision.
As shown in Table 2, of the 62 people reporting that they had tunnel
vision, 44% were or might be suitable for home testing, as opposed to
30% of the 157 people who did not report tunnel vision. Considered from
an alternative perspective, 36% of those who might or would benefit
from home trial reported tunnel vision, despite making up only 28% of
the total sample. However, the association between reported tunnel
vision and likelihood of being suitable for home testing was not quite
statistically significant (χ2(1)=3.7, p=.055).
Visual fields
In addition to relying on self-reported visual field status, some objective
data on visual field was available, as 48 subjects provided some form of
visual field plot and a further 4 provided written description of field
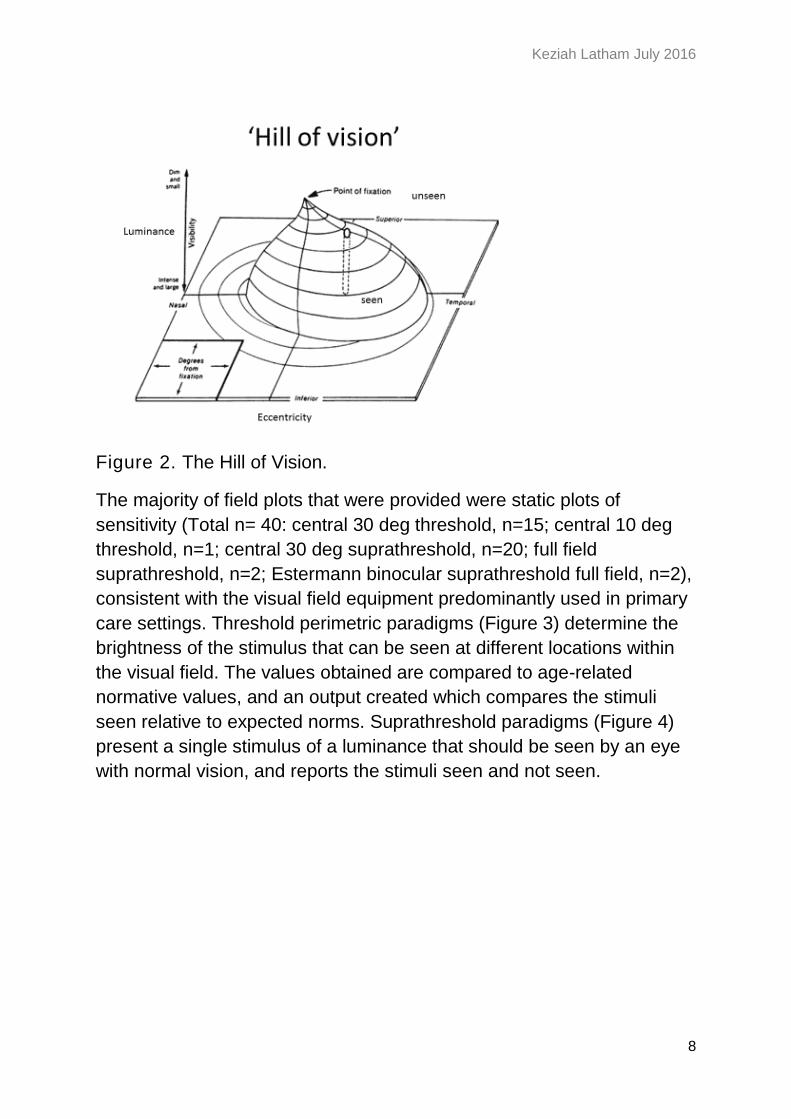
status. The full nature of the visual field can be appreciated by the
concept of the ‘hill of vision’ (Figure 2). The vertical axis of the plot
represents sensitivity, with peak sensitivity at the fovea or point of
fixation in normal vision. Further away from fixation, sensitivity
decreases, and light stimuli need to be brighter to be detected. The
horizontal axes of the plot represent eccentricity away from fixation, in
both horizontal (nasal / temporal) and vertical (superior / inferior)
directions. The visual field can assess the hill of vision in different ways,
which can be broken down into ‘static’ paradigms which assess
sensitivity at specified locations in the visual field, and ‘kinetic’
paradigms which assess the extent of visual field to a stimulus of
specific brightness.
Keziah Latham July 2016
8
Figure 2. The Hill of Vision.
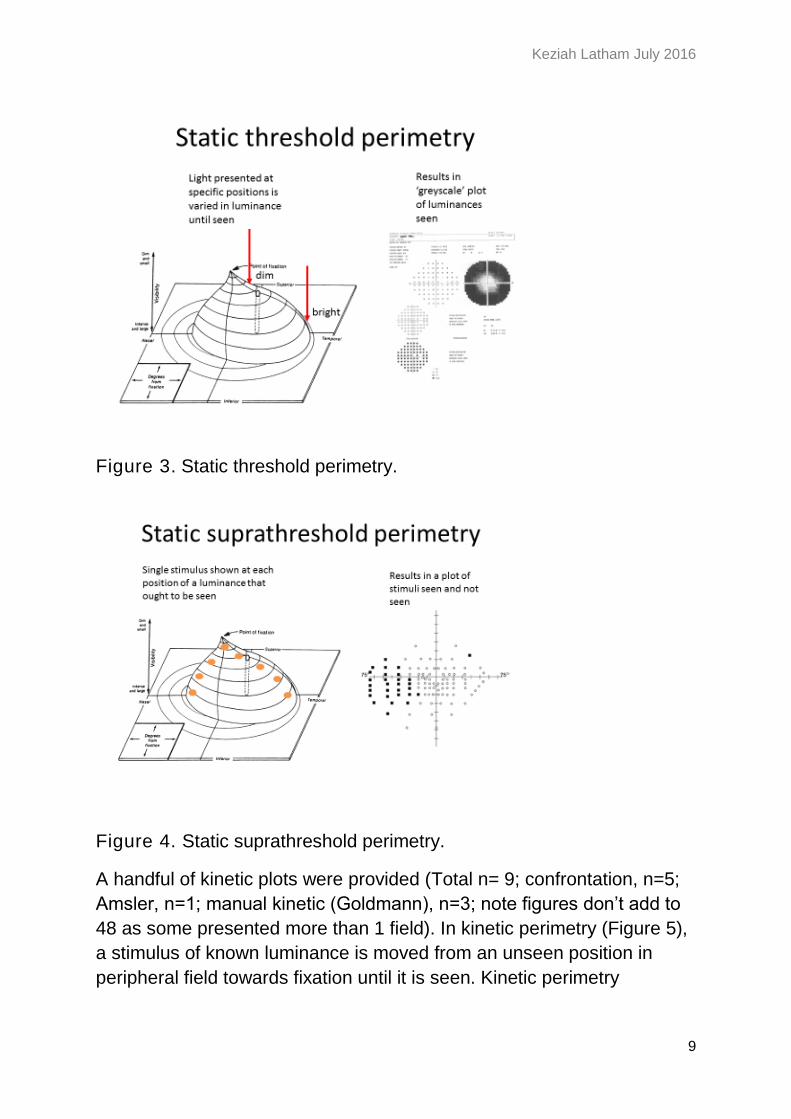
The majority of field plots that were provided were static plots of
sensitivity (Total n= 40: central 30 deg threshold, n=15; central 10 deg
threshold, n=1; central 30 deg suprathreshold, n=20; full field
suprathreshold, n=2; Estermann binocular suprathreshold full field, n=2),
consistent with the visual field equipment predominantly used in primary
care settings. Threshold perimetric paradigms (Figure 3) determine the
brightness of the stimulus that can be seen at different locations within
the visual field. The values obtained are compared to age-related
normative values, and an output created which compares the stimuli
seen relative to expected norms. Suprathreshold paradigms (Figure 4)
present a single stimulus of a luminance that should be seen by an eye
with normal vision, and reports the stimuli seen and not seen.
Keziah Latham July 2016
9
Figure 3. Static threshold perimetry.
Figure 4. Static suprathreshold perimetry.
A handful of kinetic plots were provided (Total n= 9; confrontation, n=5;
Amsler, n=1; manual kinetic (Goldmann), n=3; note figures don’t add to
48 as some presented more than 1 field). In kinetic perimetry (Figure 5),
a stimulus of known luminance is moved from an unseen position in
peripheral field towards fixation until it is seen. Kinetic perimetry
Keziah Latham July 2016
10
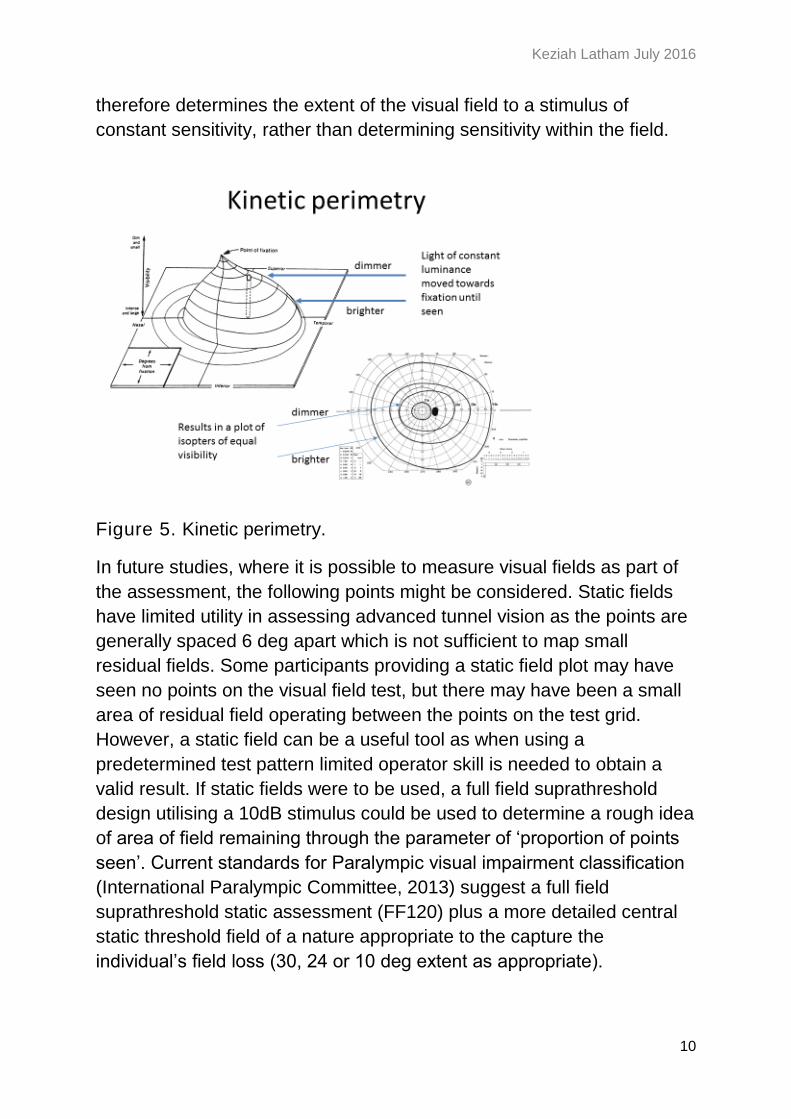
therefore determines the extent of the visual field to a stimulus of
constant sensitivity, rather than determining sensitivity within the field.
Figure 5. Kinetic perimetry.
In future studies, where it is possible to measure visual fields as part of
the assessment, the following points might be considered. Static fields
have limited utility in assessing advanced tunnel vision as the points are
generally spaced 6 deg apart which is not sufficient to map small
residual fields. Some participants providing a static field plot may have
seen no points on the visual field test, but there may have been a small
area of residual field operating between the points on the test grid.
However, a static field can be a useful tool as when using a
predetermined test pattern limited operator skill is needed to obtain a
valid result. If static fields were to be used, a full field suprathreshold
design utilising a 10dB stimulus could be used to determine a rough idea
of area of field remaining through the parameter of ‘proportion of points
seen’. Current standards for Paralympic visual impairment classification
(International Paralympic Committee, 2013) suggest a full field
suprathreshold static assessment (FF120) plus a more detailed central
static threshold field of a nature appropriate to the capture the
individual’s field loss (30, 24 or 10 deg extent as appropriate).

Keziah Latham July 2016
11
Kinetic visual field plots (see e.g. those provided for subject 197 and
273) would be better for determining the extent of residual field that is
compatible with the Glasses proving potentially useful in the cases of
those with severely restricted peripheral field or ‘tunnel vision’. However,
these plots require more operator skill to obtain, and they are of less
benefit for patients with less severe visual loss.
Visual field loss as determined objectively by field plots
Of the 52 people providing a field plot or written description of field
status, 4 were deemed objectively suitable for home testing and 6 were
maybe suitable. Note that this is a small proportion of the 74 people
potentially suitable for home trial, so the following analysis should be
considered as case study examples. The participants who were suitable
for home trial and provided field plots were:
Suitable for home trial:
23: R absolute peripheral loss, relative defect within 10 deg of fixation. L
very small amount of residual central field. Classic ‘tunnel vision’.
Retinitis Pigmentosa (RP). Poor VA (0.01 decimal).
140 R absolute loss. L sparing centrally and extending to at least 25 deg
in upper left half of field, absolute defect lower right half. Not classic
tunnel vision, but certainly restricted peripherally. Diabetic retinopathy.
Fair VA (0.4 decimal).
197 R&L very small residual central fields (<5deg). Also in each eye an
inferior peripheral slither of residual vision at about 40 deg eccentricity.
Classic ‘tunnel vision’. Choroideraemia. Fair VA (0.3 decimal).
273 R temp island of residual vision from 20-50 deg temporally, no
central function; L residual island from just at the macula to 50 deg
temporally. Constitutes ‘tunnel vision’ but less restricted than subjects
23/197. Leber’s optic neuropathy. No VA result.
Maybe suitable for home trial:
7 RE no plot provided, LE sparing of vision in temporal field to about 25
deg. Unsure of condition. Poor VA (0.05 decimal).
Keziah Latham July 2016
12
12 RE no plot provided, LE island of residual vision from just above
fixation to 10 deg inferior field. Classic ‘tunnel vision’. Glaucoma and
cataract. Fair VA (0.2 decimal).
73 RE residual vision to at least 30 deg in upper left quadrant of field, LE
crescent of residual vision from 25 deg temporally. Optic atrophy. Poor
VA (0.05 decimal).
108 RE no vision, LE vision retained in central 5 deg. Classic ‘tunnel
vision’. Glaucoma. Fair VA (0.4 decimal).
160 R&L vision retained in central 10 deg. Classic ‘tunnel vision’.
Glaucoma, retinal detachment, cataract and corneal oedema. Poor VA
(0.02 decimal).
165 R&L loss of superior visual field, with inferior field intact to at least
25 deg. Glaucoma, cataract and nystagmus. Fair VA (0.2 decimal).
If there is a pattern here, it is that the field plots of those who could
benefit from the Glasses are tending to be the ones with ‘classic’ RP
type tunnel vision and very small residual central fields. Most have visual
fields that are restricted to be within the field of view of the Glasses.
Objective tunnel vision
Given the varied nature of the visual field plots provided, it was not
possible to derive a continuous variable expressing the level of field loss
either in terms of loss of sensitivity (dB) or extent of remaining visual
field to a specific stimulus (extent in degrees). Fields provided were
therefore divided into categories of ‘tunnel vision’ or ‘not tunnel vision’.
‘Tunnel vision’ was defined as a residual field of radius less than 10 deg
from fixation. Fields that were not considered to constitute tunnel vision
were those with greater residual field than the definition, and also visual
fields that were not measurable (no points seen). As described above,
this definition might miss some examples of tunnel vision where some
residual visual function remains which is not captured by the field plot
used. Future studies could usefully measure visual field as part of the
protocol to determine a fine graded numerical value for a specific aspect
of the visual field.
Keziah Latham July 2016
13
Suitable for Take Home Testing (Objective)
Total
No Maybe Yes
Tunnel vision (<10deg residual) from field plot
No 26 2 1 29
Yes 16 4 3 23
Don't know
105 35 29 169
Total 147 41 33 221
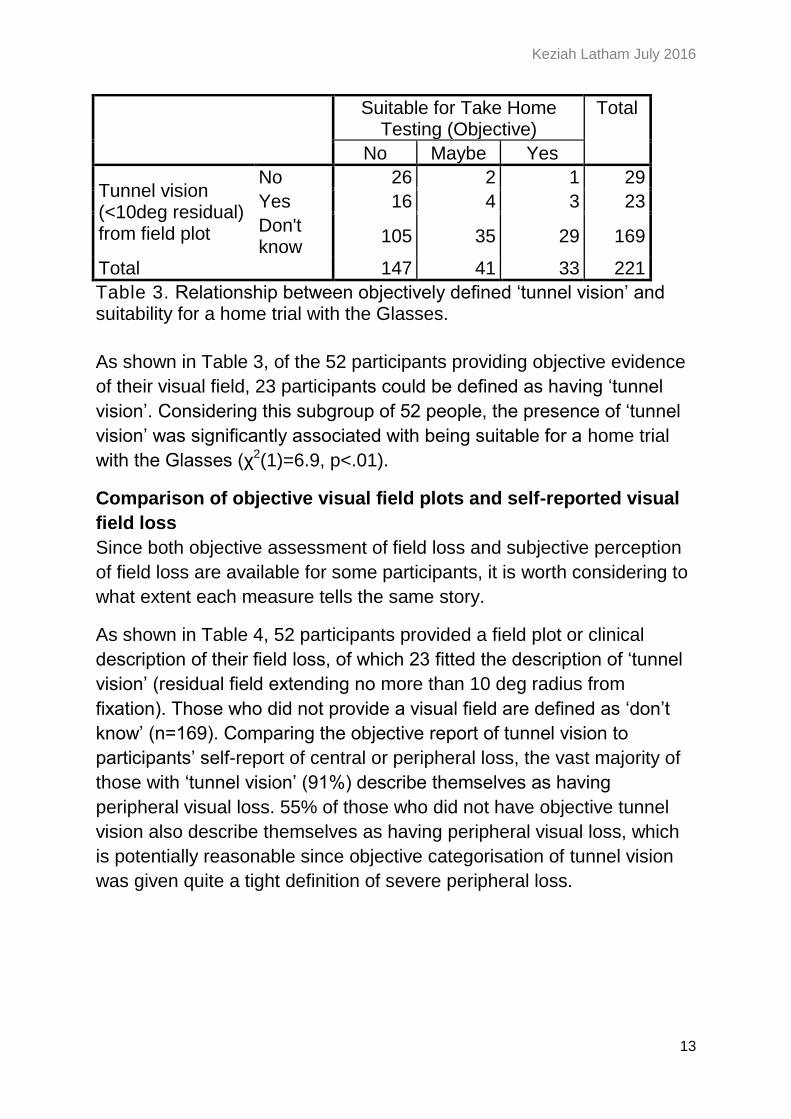
Table 3. Relationship between objectively defined ‘tunnel vision’ and suitability for a home trial with the Glasses.
As shown in Table 3, of the 52 participants providing objective evidence
of their visual field, 23 participants could be defined as having ‘tunnel
vision’. Considering this subgroup of 52 people, the presence of ‘tunnel
vision’ was significantly associated with being suitable for a home trial
with the Glasses (χ2(1)=6.9, p<.01).
Comparison of objective visual field plots and self-reported visual
field loss
Since both objective assessment of field loss and subjective perception
of field loss are available for some participants, it is worth considering to
what extent each measure tells the same story.
As shown in Table 4, 52 participants provided a field plot or clinical
description of their field loss, of which 23 fitted the description of ‘tunnel
vision’ (residual field extending no more than 10 deg radius from
fixation). Those who did not provide a visual field are defined as ‘don’t
know’ (n=169). Comparing the objective report of tunnel vision to
participants’ self-report of central or peripheral loss, the vast majority of
those with ‘tunnel vision’ (91%) describe themselves as having
peripheral visual loss. 55% of those who did not have objective tunnel
vision also describe themselves as having peripheral visual loss, which
is potentially reasonable since objective categorisation of tunnel vision
was given quite a tight definition of severe peripheral loss.
Keziah Latham July 2016
14
Central, peripheral or has both been affected?
Total
central peripheral
both no response
Tunnel vision (<10deg residual) from field plot
No 6 7 9 7 29
Yes 1 10 11 1 23
Don't know
18 49 73 29 169
Total 25 66 93 37 221
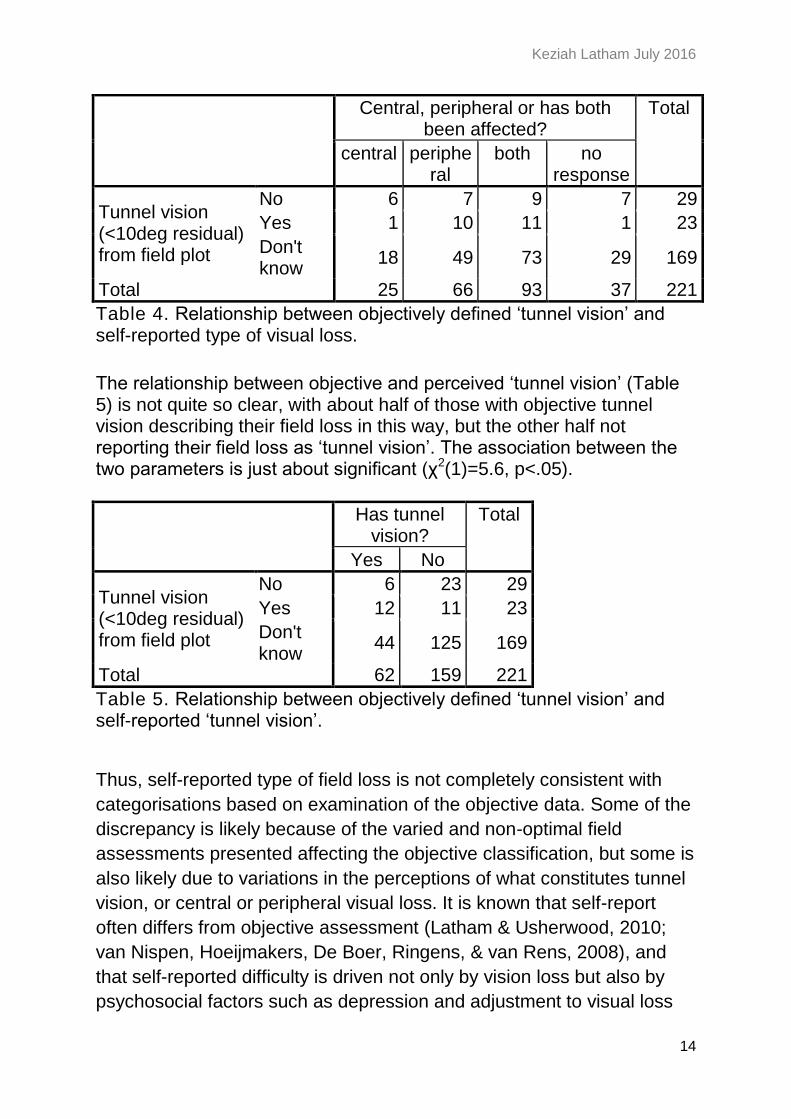
Table 4. Relationship between objectively defined ‘tunnel vision’ and self-reported type of visual loss.
The relationship between objective and perceived ‘tunnel vision’ (Table 5) is not quite so clear, with about half of those with objective tunnel vision describing their field loss in this way, but the other half not reporting their field loss as ‘tunnel vision’. The association between the two parameters is just about significant (χ2(1)=5.6, p<.05).
Has tunnel vision?
Total
Yes No
Tunnel vision (<10deg residual) from field plot
No 6 23 29
Yes 12 11 23
Don't know
44 125 169
Total 62 159 221
Table 5. Relationship between objectively defined ‘tunnel vision’ and self-reported ‘tunnel vision’.
Thus, self-reported type of field loss is not completely consistent with
categorisations based on examination of the objective data. Some of the
discrepancy is likely because of the varied and non-optimal field
assessments presented affecting the objective classification, but some is
also likely due to variations in the perceptions of what constitutes tunnel
vision, or central or peripheral visual loss. It is known that self-report
often differs from objective assessment (Latham & Usherwood, 2010;
van Nispen, Hoeijmakers, De Boer, Ringens, & van Rens, 2008), and
that self-reported difficulty is driven not only by vision loss but also by
psychosocial factors such as depression and adjustment to visual loss
Keziah Latham July 2016
15
(Tabrett & Latham, 2011). The evidence examined thus far suggests that
standardised assessment of the extent of residual visual field for those
with peripheral visual loss might be useful in giving greater clarity in
identifying those most likely to benefit from the Glasses.
Spectacle prescription
53 subjects provided a spectacle prescription. These were rather
variable in terms of whether visual acuities with the glasses were given,
and also in terms of whether the prescription had actually been
prescribed to be worn as spectacles or did not improve vision and had
been provided for information only. The spectacle prescriptions have
therefore not been evaluated further.
Keziah Latham July 2016
16
Visual acuity (VA)
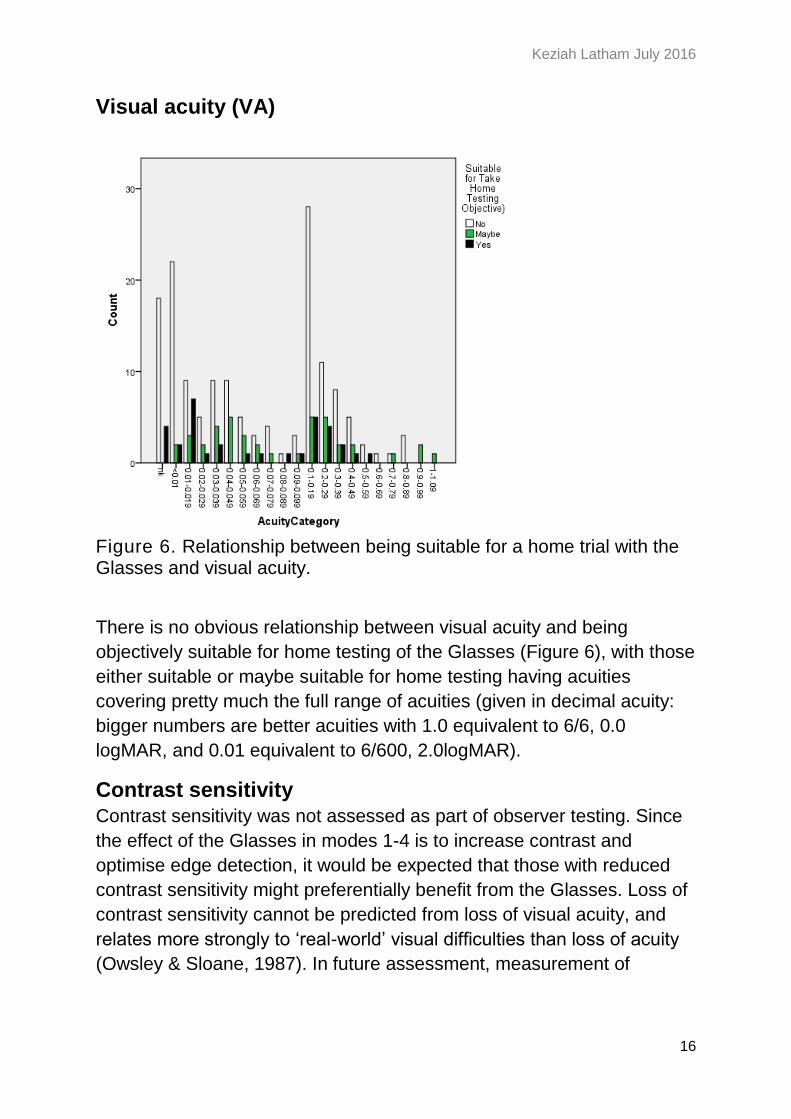
Figure 6. Relationship between being suitable for a home trial with the Glasses and visual acuity.
There is no obvious relationship between visual acuity and being
objectively suitable for home testing of the Glasses (Figure 6), with those
either suitable or maybe suitable for home testing having acuities
covering pretty much the full range of acuities (given in decimal acuity:
bigger numbers are better acuities with 1.0 equivalent to 6/6, 0.0
logMAR, and 0.01 equivalent to 6/600, 2.0logMAR).
Contrast sensitivity
Contrast sensitivity was not assessed as part of observer testing. Since
the effect of the Glasses in modes 1-4 is to increase contrast and
optimise edge detection, it would be expected that those with reduced
contrast sensitivity might preferentially benefit from the Glasses. Loss of
contrast sensitivity cannot be predicted from loss of visual acuity, and
relates more strongly to ‘real-world’ visual difficulties than loss of acuity
(Owsley & Sloane, 1987). In future assessment, measurement of
Keziah Latham July 2016
17
contrast sensitivity using the gold-standard approach of the Pelli-Robson
chart (Pelli, Robson, & Wilkins, 1988) would be recommended.
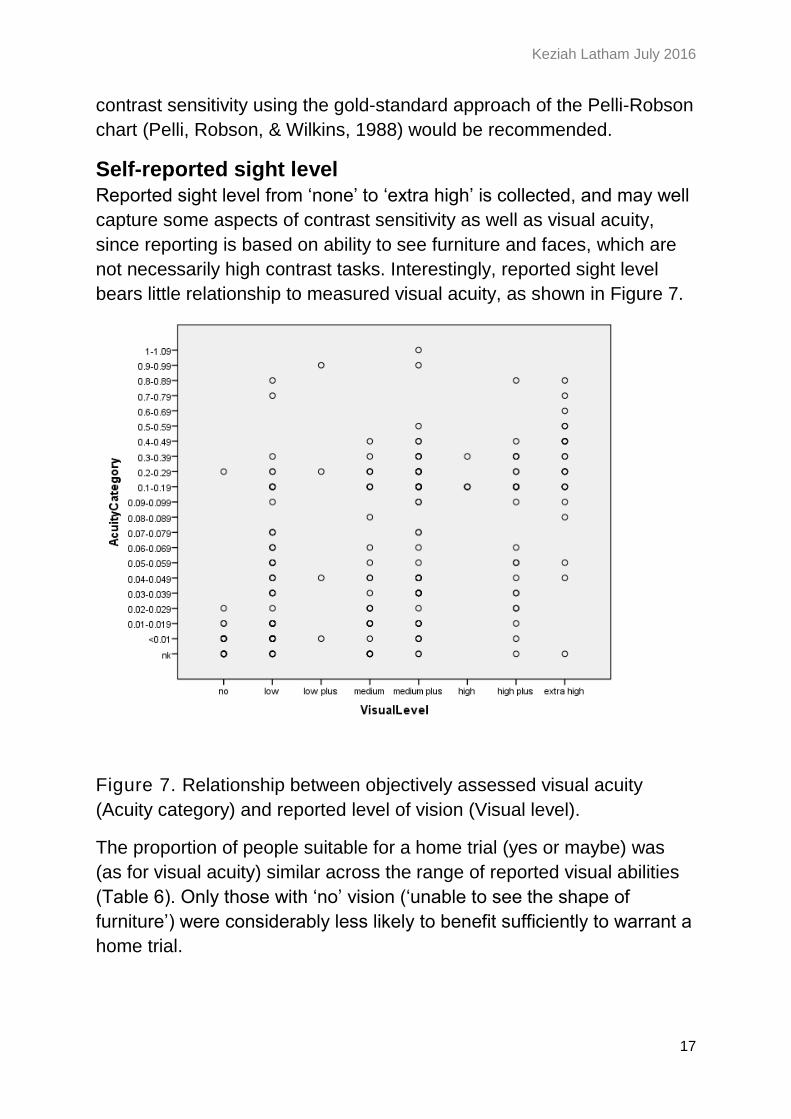
Self-reported sight level
Reported sight level from ‘none’ to ‘extra high’ is collected, and may well
capture some aspects of contrast sensitivity as well as visual acuity,
since reporting is based on ability to see furniture and faces, which are
not necessarily high contrast tasks. Interestingly, reported sight level
bears little relationship to measured visual acuity, as shown in Figure 7.
Figure 7. Relationship between objectively assessed visual acuity
(Acuity category) and reported level of vision (Visual level).
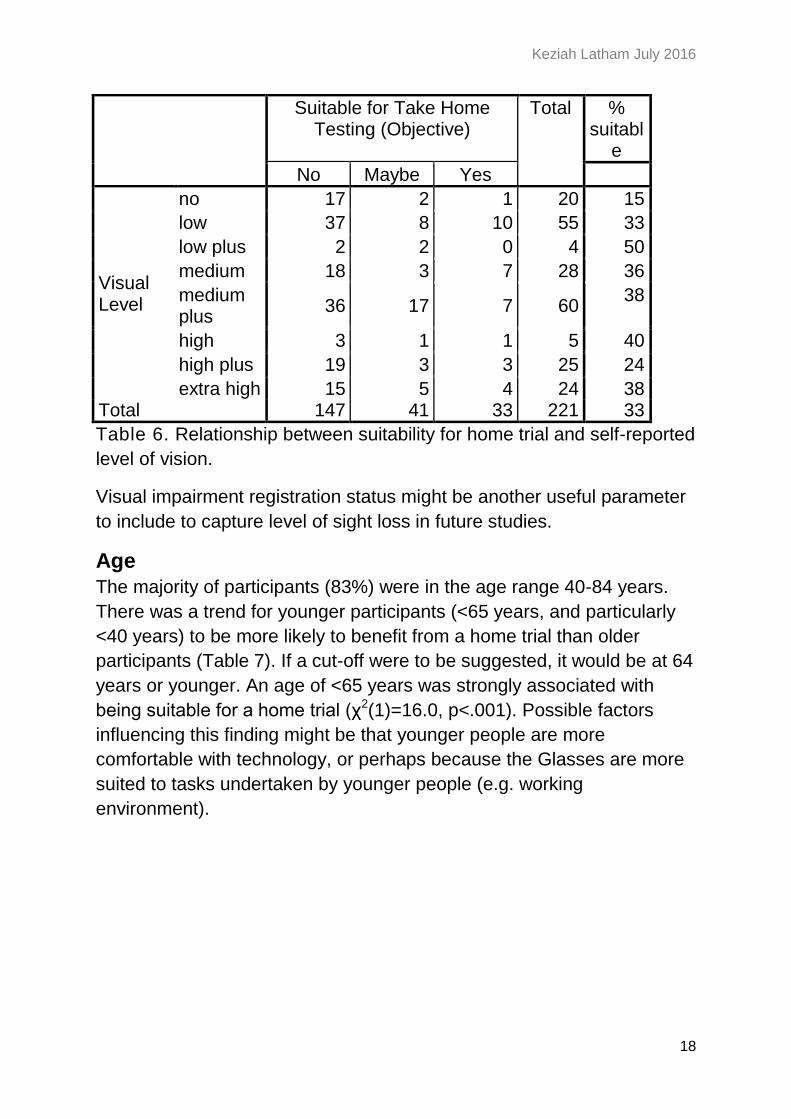
The proportion of people suitable for a home trial (yes or maybe) was
(as for visual acuity) similar across the range of reported visual abilities
(Table 6). Only those with ‘no’ vision (‘unable to see the shape of
furniture’) were considerably less likely to benefit sufficiently to warrant a
home trial.
Keziah Latham July 2016
18
Suitable for Take Home Testing (Objective)
Total % suitabl
e
No Maybe Yes
Visual Level
no 17 2 1 20 15
low 37 8 10 55 33
low plus 2 2 0 4 50
medium 18 3 7 28 36
medium plus
36 17 7 60 38
high 3 1 1 5 40
high plus 19 3 3 25 24
extra high 15 5 4 24 38 Total 147 41 33 221 33
Table 6. Relationship between suitability for home trial and self-reported
level of vision.
Visual impairment registration status might be another useful parameter
to include to capture level of sight loss in future studies.
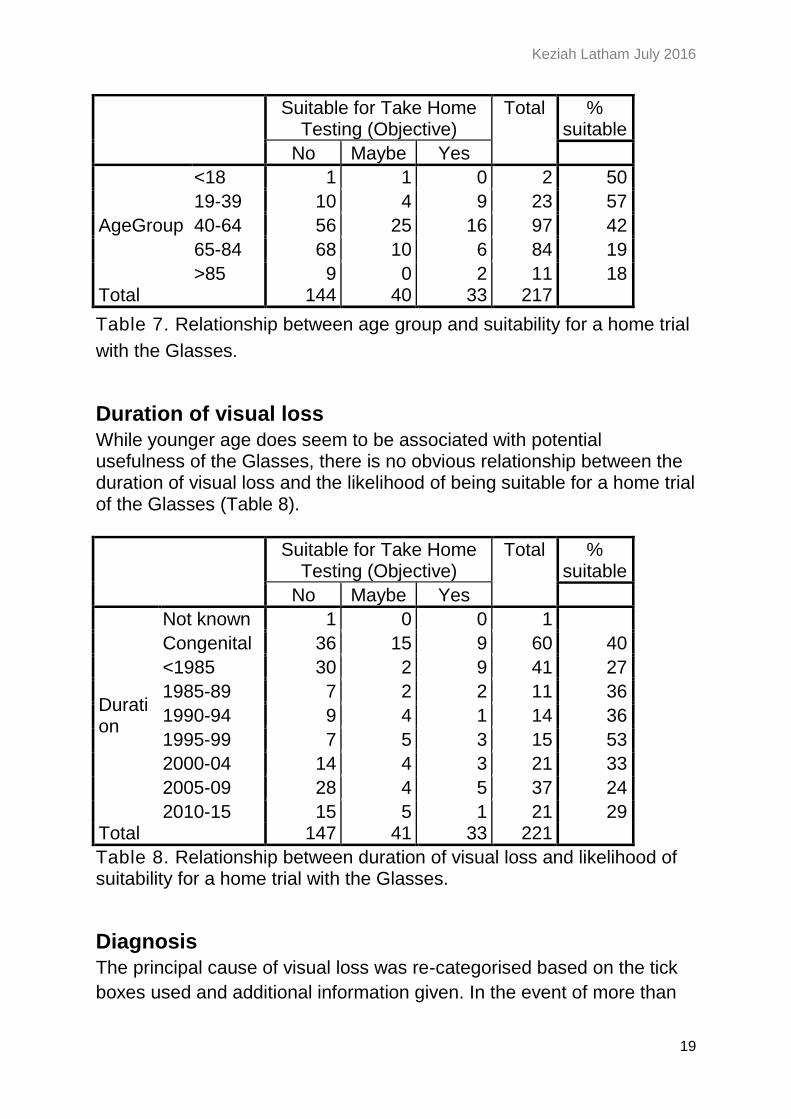
Age
The majority of participants (83%) were in the age range 40-84 years.
There was a trend for younger participants (<65 years, and particularly
<40 years) to be more likely to benefit from a home trial than older
participants (Table 7). If a cut-off were to be suggested, it would be at 64
years or younger. An age of <65 years was strongly associated with
being suitable for a home trial (χ2(1)=16.0, p<.001). Possible factors
influencing this finding might be that younger people are more
comfortable with technology, or perhaps because the Glasses are more
suited to tasks undertaken by younger people (e.g. working
environment).
Keziah Latham July 2016
19
Suitable for Take Home Testing (Objective)
Total % suitable
No Maybe Yes
AgeGroup
<18 1 1 0 2 50
19-39 10 4 9 23 57
40-64 56 25 16 97 42
65-84 68 10 6 84 19
>85 9 0 2 11 18 Total 144 40 33 217
Table 7. Relationship between age group and suitability for a home trial
with the Glasses.
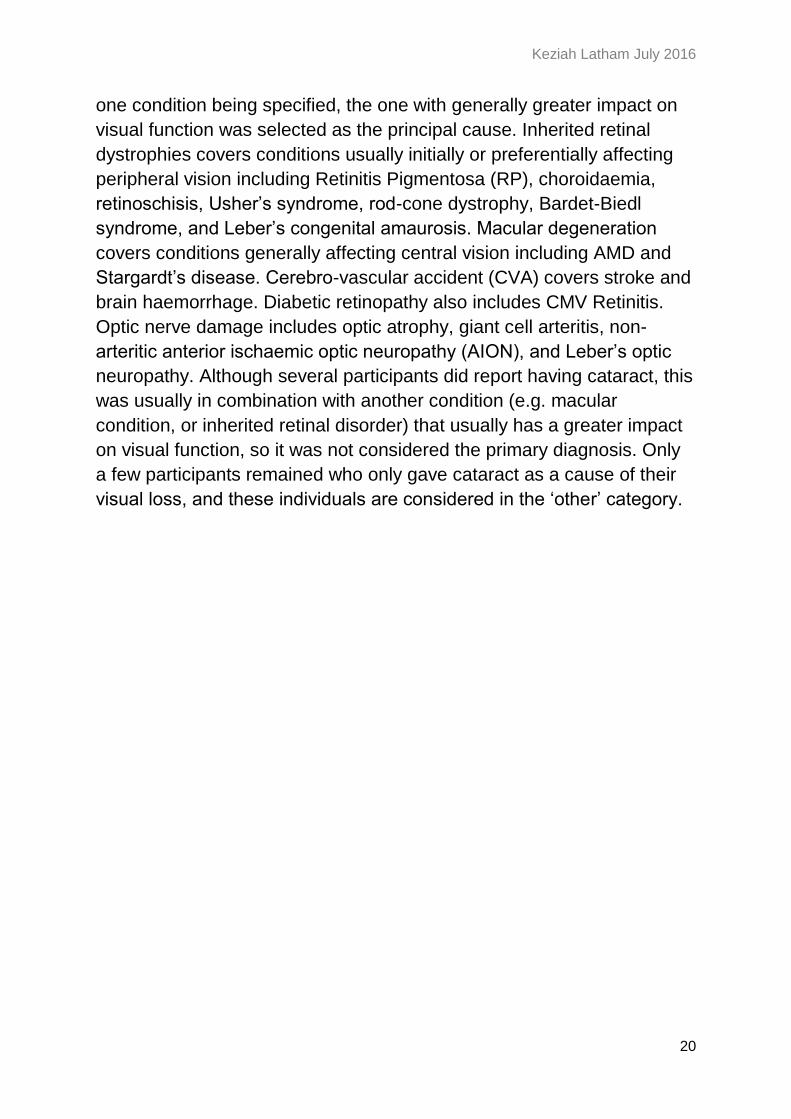
Duration of visual loss
While younger age does seem to be associated with potential usefulness of the Glasses, there is no obvious relationship between the duration of visual loss and the likelihood of being suitable for a home trial of the Glasses (Table 8).
Suitable for Take Home Testing (Objective)
Total % suitable
No Maybe Yes
Duration
Not known 1 0 0 1
Congenital 36 15 9 60 40
<1985 30 2 9 41 27
1985-89 7 2 2 11 36
1990-94 9 4 1 14 36
1995-99 7 5 3 15 53
2000-04 14 4 3 21 33
2005-09 28 4 5 37 24
2010-15 15 5 1 21 29 Total 147 41 33 221
Table 8. Relationship between duration of visual loss and likelihood of suitability for a home trial with the Glasses.
Diagnosis
The principal cause of visual loss was re-categorised based on the tick
boxes used and additional information given. In the event of more than
Keziah Latham July 2016
20
one condition being specified, the one with generally greater impact on
visual function was selected as the principal cause. Inherited retinal
dystrophies covers conditions usually initially or preferentially affecting
peripheral vision including Retinitis Pigmentosa (RP), choroidaemia,
retinoschisis, Usher’s syndrome, rod-cone dystrophy, Bardet-Biedl
syndrome, and Leber’s congenital amaurosis. Macular degeneration
covers conditions generally affecting central vision including AMD and
Stargardt’s disease. Cerebro-vascular accident (CVA) covers stroke and
brain haemorrhage. Diabetic retinopathy also includes CMV Retinitis.
Optic nerve damage includes optic atrophy, giant cell arteritis, non-
arteritic anterior ischaemic optic neuropathy (AION), and Leber’s optic
neuropathy. Although several participants did report having cataract, this
was usually in combination with another condition (e.g. macular
condition, or inherited retinal disorder) that usually has a greater impact
on visual function, so it was not considered the primary diagnosis. Only
a few participants remained who only gave cataract as a cause of their
visual loss, and these individuals are considered in the ‘other’ category.
Keziah Latham July 2016
21
Suitable for Take Home Testing (Objective)
Total % suitabl
e
No Maybe Yes
Diagnosis
Inherited retinal dystrophy
44 10 20 74 41
Macular condition
41 3 3 47 13
Glaucoma 15 9 2 26 42
Optic nerve damage
10 6 5 21 52
CVA 4 0 0 4 0
Diabetic retinopathy
5 2 1 8 38
Retinal detachment
7 1 0 8 13
Albinism / aniridia
3 6 0 9 67
Unknown or not specified
5 1 0 6
Other 13 3 2 18 Total 147 41 33 221
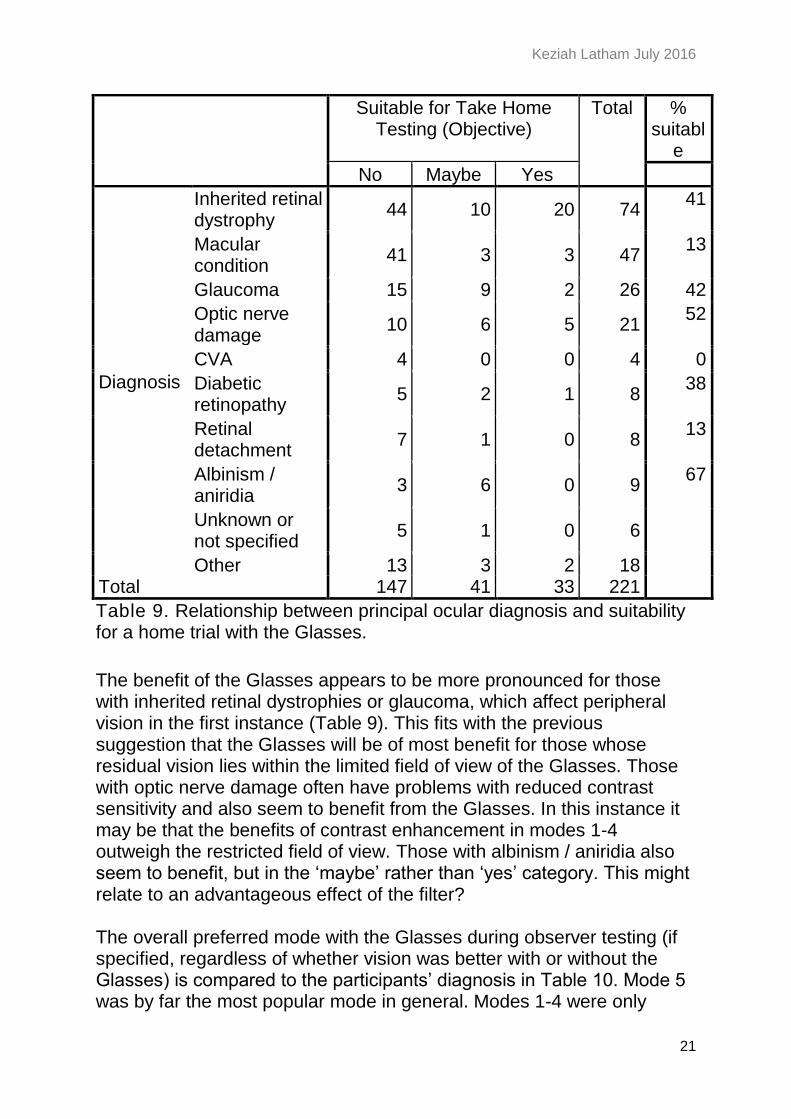
Table 9. Relationship between principal ocular diagnosis and suitability for a home trial with the Glasses.
The benefit of the Glasses appears to be more pronounced for those with inherited retinal dystrophies or glaucoma, which affect peripheral vision in the first instance (Table 9). This fits with the previous suggestion that the Glasses will be of most benefit for those whose residual vision lies within the limited field of view of the Glasses. Those with optic nerve damage often have problems with reduced contrast sensitivity and also seem to benefit from the Glasses. In this instance it may be that the benefits of contrast enhancement in modes 1-4 outweigh the restricted field of view. Those with albinism / aniridia also seem to benefit, but in the ‘maybe’ rather than ‘yes’ category. This might relate to an advantageous effect of the filter? The overall preferred mode with the Glasses during observer testing (if specified, regardless of whether vision was better with or without the Glasses) is compared to the participants’ diagnosis in Table 10. Mode 5 was by far the most popular mode in general. Modes 1-4 were only
Keziah Latham July 2016
22
preferred by a proportion of those with retinal dystrophies. Despite the hypothesis above, those with optic nerve damage did not tend to prefer modes 1-4.
Keziah Latham July 2016
23
Preferred Mode of Glasses Total
1 2 3 4 5
Diagnosis
Inherited retinal dystrophy
5 8 6 3 34 56
Macular condition
1 1 0 1 28 31
Glaucoma 2 0 0 1 20 23
Optic nerve damage
0 1 2 0 12 15
CVA 0 0 0 0 1 1
Diabetic retinopathy
0 1 0 1 4 6
Retinal detachment
0 0 0 0 3 3
Albinism / aniridia
0 0 0 0 8 8
Unknown or not specified
0 1 0 0 3 4
Other 0 1 0 3 13 17 Total 8 13 8 9 126 164
Table 10. Preferred mode of the Glasses for people with different ocular
diagnoses.
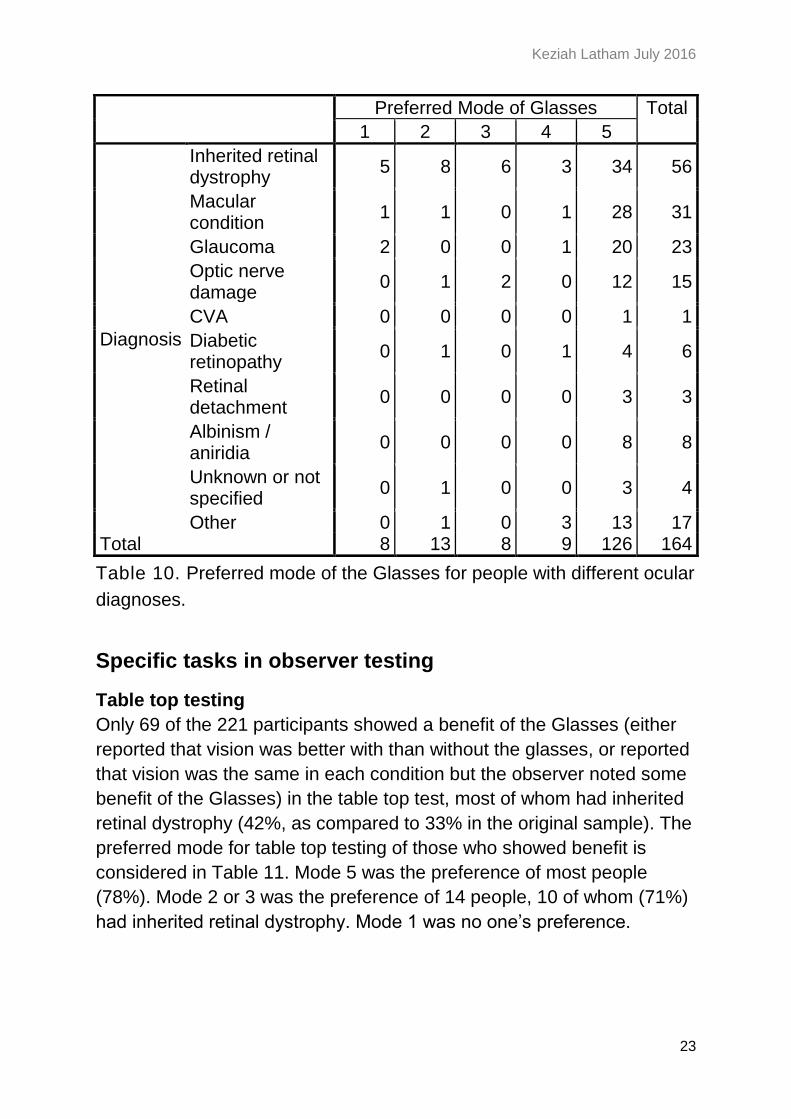
Specific tasks in observer testing
Table top testing
Only 69 of the 221 participants showed a benefit of the Glasses (either
reported that vision was better with than without the glasses, or reported
that vision was the same in each condition but the observer noted some
benefit of the Glasses) in the table top test, most of whom had inherited
retinal dystrophy (42%, as compared to 33% in the original sample). The
preferred mode for table top testing of those who showed benefit is
considered in Table 11. Mode 5 was the preference of most people
(78%). Mode 2 or 3 was the preference of 14 people, 10 of whom (71%)
had inherited retinal dystrophy. Mode 1 was no one’s preference.

Keziah Latham July 2016
24
Preferred Mode of Glasses Total
2 3 4 5
Diagnosis
Inherited retinal dystrophy
3 7 0 19 29
Macular condition 0 0 0 9 9
Glaucoma 0 1 0 8 9
Optic nerve damage
0 1 0 5 6
Diabetic retinopathy
0 1 0 2 3
Retinal detachment
0 0 0 2 2
Albinism / aniridia 0 0 0 6 6
Unknown or not specified
0 1 0 1 2
Other 0 0 1 2 3 Total 3 11 1 54 69
Table 11. Mode preference for table top testing for participants who
benefitted from the Glasses for this task.
Of the 69 people benefitting from the Glasses on the table top task,
three quarters were aged between 19 and 64 years, they had a wide
range of acuities, a quarter had congenital visual loss and the remainder
had durations of visual loss spread across the range of options. Three
people reported central vision loss, the remainder reporting either
peripheral loss (n=24) or central and peripheral loss (n=34), with 8
having no response. Twenty six people reported subjective tunnel vision.
In this group of 69, 15 people had provided visual field plots: 6 were
rated as having tunnel vision.
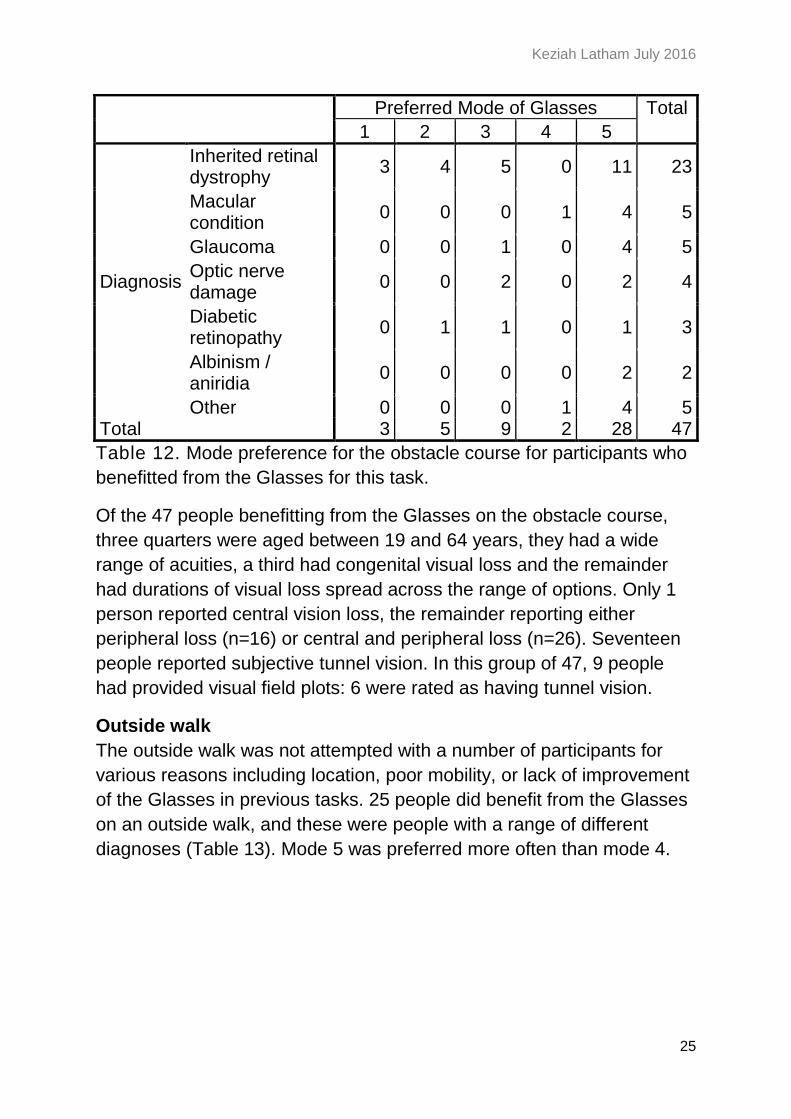
Obstacle course
Only 47 people were seen to find the Glasses helpful for the obstacle
course, most of whom had inherited retinal dystrophy (49%; Table 12).
The majority of people who found the Glasses of benefit here found
mode 5 most useful (60%). Modes 1-4 were found useful by a total of 19
people, most of whom (63%) had inherited retinal dystrophy.
Keziah Latham July 2016
25
Preferred Mode of Glasses Total
1 2 3 4 5
Diagnosis
Inherited retinal dystrophy
3 4 5 0 11 23
Macular condition
0 0 0 1 4 5
Glaucoma 0 0 1 0 4 5
Optic nerve damage
0 0 2 0 2 4
Diabetic retinopathy
0 1 1 0 1 3
Albinism / aniridia
0 0 0 0 2 2
Other 0 0 0 1 4 5 Total 3 5 9 2 28 47
Table 12. Mode preference for the obstacle course for participants who
benefitted from the Glasses for this task.
Of the 47 people benefitting from the Glasses on the obstacle course,
three quarters were aged between 19 and 64 years, they had a wide
range of acuities, a third had congenital visual loss and the remainder
had durations of visual loss spread across the range of options. Only 1
person reported central vision loss, the remainder reporting either
peripheral loss (n=16) or central and peripheral loss (n=26). Seventeen
people reported subjective tunnel vision. In this group of 47, 9 people
had provided visual field plots: 6 were rated as having tunnel vision.
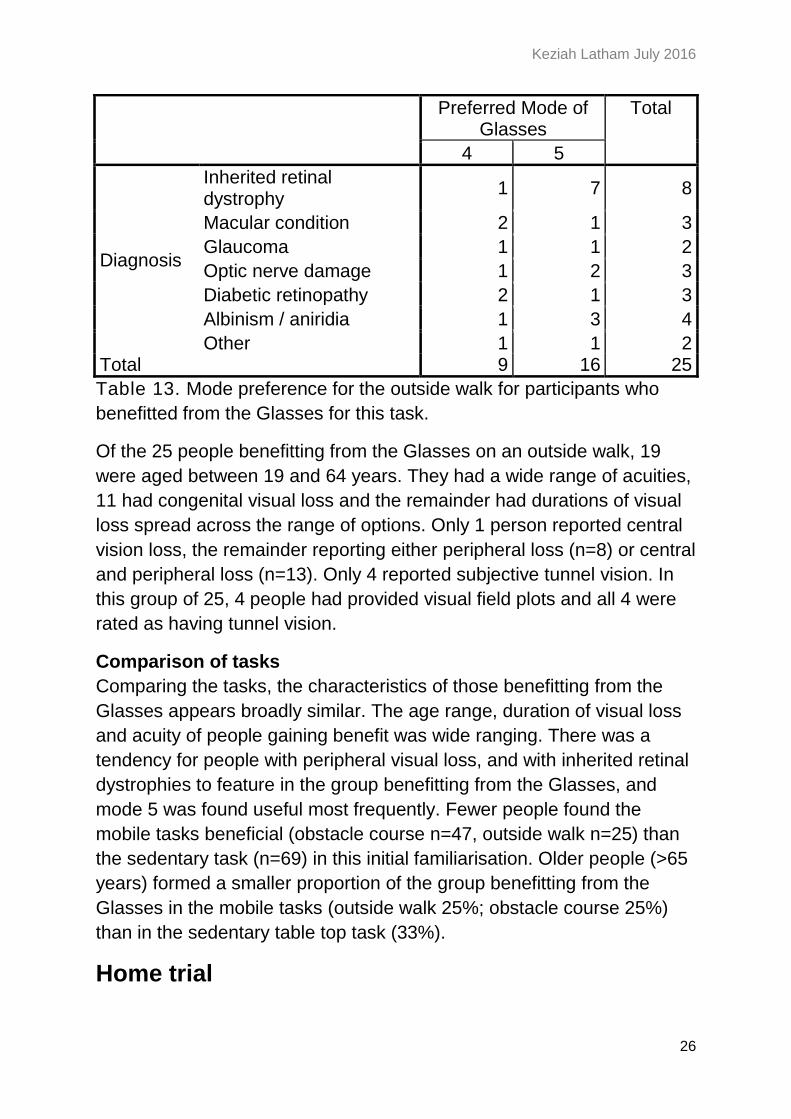
Outside walk
The outside walk was not attempted with a number of participants for
various reasons including location, poor mobility, or lack of improvement
of the Glasses in previous tasks. 25 people did benefit from the Glasses
on an outside walk, and these were people with a range of different
diagnoses (Table 13). Mode 5 was preferred more often than mode 4.
Keziah Latham July 2016
26
Preferred Mode of Glasses
Total
4 5
Diagnosis
Inherited retinal dystrophy
1 7 8
Macular condition 2 1 3
Glaucoma 1 1 2
Optic nerve damage 1 2 3
Diabetic retinopathy 2 1 3
Albinism / aniridia 1 3 4
Other 1 1 2 Total 9 16 25
Table 13. Mode preference for the outside walk for participants who
benefitted from the Glasses for this task.
Of the 25 people benefitting from the Glasses on an outside walk, 19
were aged between 19 and 64 years. They had a wide range of acuities,
11 had congenital visual loss and the remainder had durations of visual
loss spread across the range of options. Only 1 person reported central
vision loss, the remainder reporting either peripheral loss (n=8) or central
and peripheral loss (n=13). Only 4 reported subjective tunnel vision. In
this group of 25, 4 people had provided visual field plots and all 4 were
rated as having tunnel vision.
Comparison of tasks
Comparing the tasks, the characteristics of those benefitting from the
Glasses appears broadly similar. The age range, duration of visual loss
and acuity of people gaining benefit was wide ranging. There was a
tendency for people with peripheral visual loss, and with inherited retinal
dystrophies to feature in the group benefitting from the Glasses, and
mode 5 was found useful most frequently. Fewer people found the
mobile tasks beneficial (obstacle course n=47, outside walk n=25) than
the sedentary task (n=69) in this initial familiarisation. Older people (>65
years) formed a smaller proportion of the group benefitting from the
Glasses in the mobile tasks (outside walk 25%; obstacle course 25%)
than in the sedentary table top task (33%).
Home trial
Keziah Latham July 2016
27
The Glasses were tried by 221 people, of whom 103 volunteered for a
home trial. Of these 103, 33 showed objective benefit of Glasses and 41
got some benefit, so were deemed suitable for home trial. One additional
participant joined the home trial who had not taken part in observer
testing. Of these 75, 55 eventually took part in a home trial of the
Glasses, and 44 completed the trial.
Thirty three people (60% of those starting a home trial, 15% of those
who tried the Glasses in total) both completed the home trial and
responded that they had benefitted from the Glasses. In the analysis that
follows, these 33 people are analysed to consider what characteristics of
successful users of the Glasses can be identified.
Diagnosis
Nearly half of those successful with the Glasses at home had an
inherited retinal dystrophy (Table 14), although people with this
diagnosis constituted only a third of the original sample. Although the
numbers are small, there are also a greater proportion of people with
aniridia / albinism who gained benefit from the Glasses than were in the
original sample. The representation of other diagnoses in this successful
group of Glasses users reflects the proportions in the initial sample,
although there was a lower proportion of successful users with macular
conditions, and no successful users with a CVA or an ‘unknown’
diagnosis. The Glasses appear to be of greater benefit to those with
inherited retinal disorders and possibly to those with albinism / aniridia,
but are of less benefit to those with macular conditions.
Keziah Latham July 2016
28
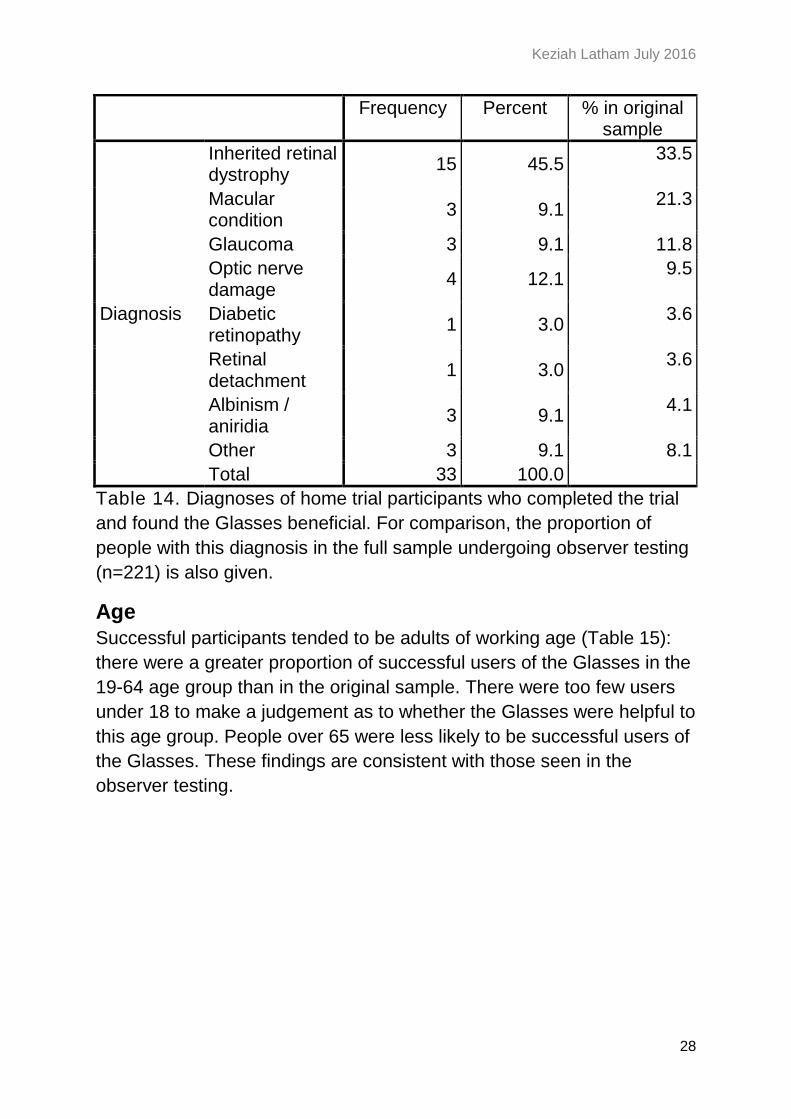
Frequency Percent % in original sample
Diagnosis
Inherited retinal dystrophy
15 45.5 33.5
Macular condition
3 9.1 21.3
Glaucoma 3 9.1 11.8
Optic nerve damage
4 12.1 9.5
Diabetic retinopathy
1 3.0 3.6
Retinal detachment
1 3.0 3.6
Albinism / aniridia
3 9.1 4.1
Other 3 9.1 8.1
Total 33 100.0
Table 14. Diagnoses of home trial participants who completed the trial
and found the Glasses beneficial. For comparison, the proportion of
people with this diagnosis in the full sample undergoing observer testing
(n=221) is also given.
Age
Successful participants tended to be adults of working age (Table 15):
there were a greater proportion of successful users of the Glasses in the
19-64 age group than in the original sample. There were too few users
under 18 to make a judgement as to whether the Glasses were helpful to
this age group. People over 65 were less likely to be successful users of
the Glasses. These findings are consistent with those seen in the
observer testing.
Keziah Latham July 2016
29
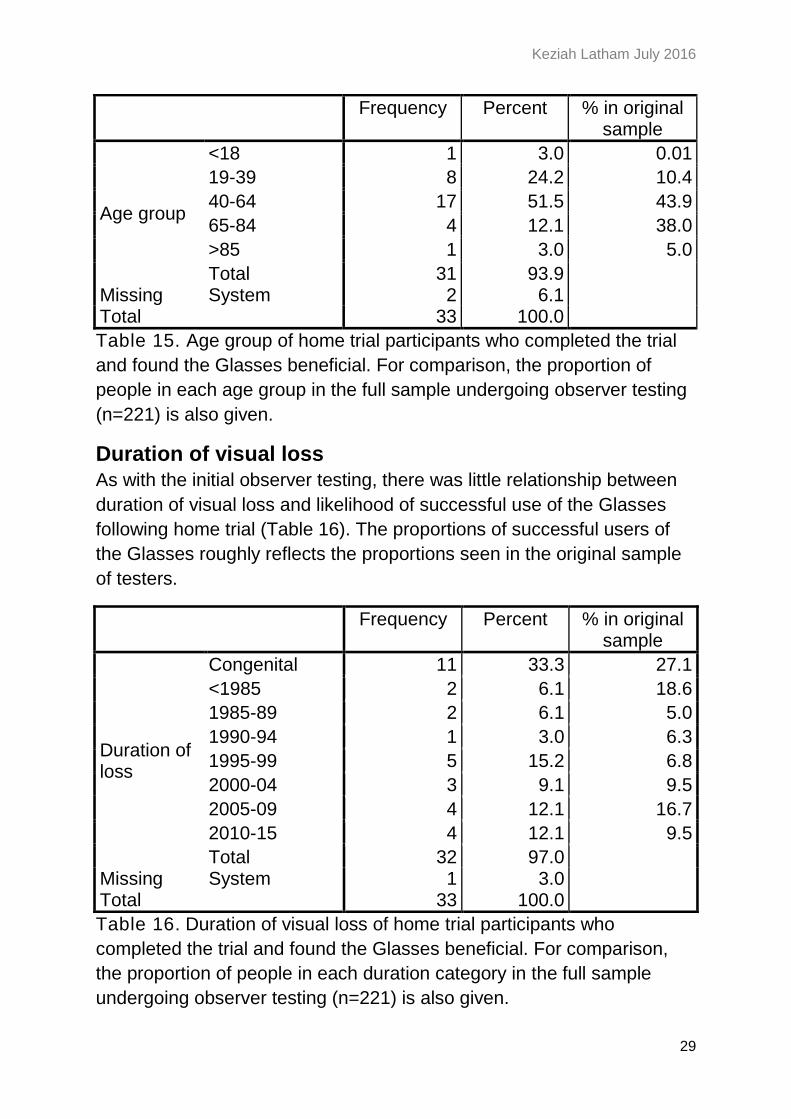
Frequency Percent % in original sample
Age group
<18 1 3.0 0.01
19-39 8 24.2 10.4
40-64 17 51.5 43.9
65-84 4 12.1 38.0
>85 1 3.0 5.0
Total 31 93.9 Missing System 2 6.1 Total 33 100.0
Table 15. Age group of home trial participants who completed the trial
and found the Glasses beneficial. For comparison, the proportion of
people in each age group in the full sample undergoing observer testing
(n=221) is also given.
Duration of visual loss
As with the initial observer testing, there was little relationship between
duration of visual loss and likelihood of successful use of the Glasses
following home trial (Table 16). The proportions of successful users of
the Glasses roughly reflects the proportions seen in the original sample
of testers.
Frequency Percent % in original sample
Duration of loss
Congenital 11 33.3 27.1
<1985 2 6.1 18.6
1985-89 2 6.1 5.0
1990-94 1 3.0 6.3
1995-99 5 15.2 6.8
2000-04 3 9.1 9.5
2005-09 4 12.1 16.7
2010-15 4 12.1 9.5
Total 32 97.0 Missing System 1 3.0 Total 33 100.0
Table 16. Duration of visual loss of home trial participants who
completed the trial and found the Glasses beneficial. For comparison,
the proportion of people in each duration category in the full sample
undergoing observer testing (n=221) is also given.

Keziah Latham July 2016
30
Visual acuity
Any level of visual acuity could be associated with a successful home
trial of the Glasses, either from an objective measure of visual acuity
(Figure 8) or a subjective report of what can be seen (Figure 9). This is
consistent with the findings of the observer testing.
Figure 8. Objectively measured visual acuity category of those who
completed the home trial and found the Glasses of benefit.
Keziah Latham July 2016
31
Figure 9. Subjectively reported visual level of those who completed the
home trial and found the Glasses of benefit.
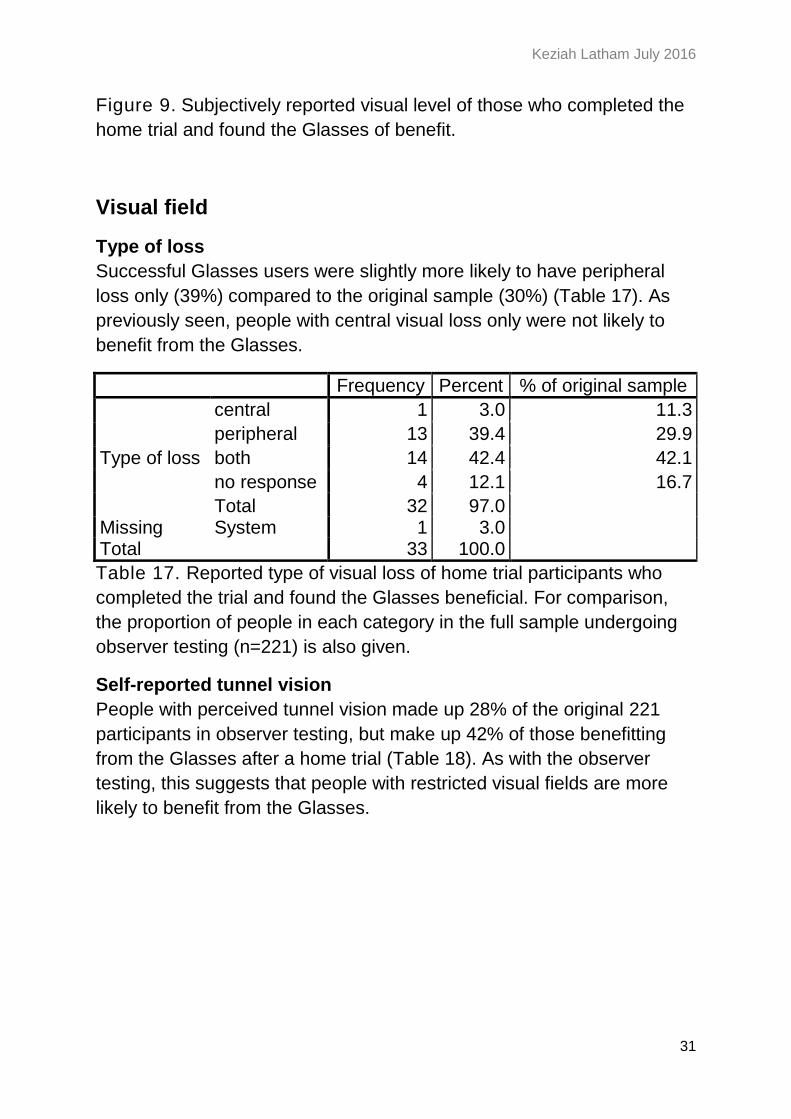
Visual field
Type of loss
Successful Glasses users were slightly more likely to have peripheral
loss only (39%) compared to the original sample (30%) (Table 17). As
previously seen, people with central visual loss only were not likely to
benefit from the Glasses.
Frequency Percent % of original sample
Type of loss
central 1 3.0 11.3
peripheral 13 39.4 29.9
both 14 42.4 42.1
no response 4 12.1 16.7
Total 32 97.0 Missing System 1 3.0 Total 33 100.0
Table 17. Reported type of visual loss of home trial participants who
completed the trial and found the Glasses beneficial. For comparison,
the proportion of people in each category in the full sample undergoing
observer testing (n=221) is also given.
Self-reported tunnel vision
People with perceived tunnel vision made up 28% of the original 221
participants in observer testing, but make up 42% of those benefitting
from the Glasses after a home trial (Table 18). As with the observer
testing, this suggests that people with restricted visual fields are more
likely to benefit from the Glasses.
Keziah Latham July 2016
32
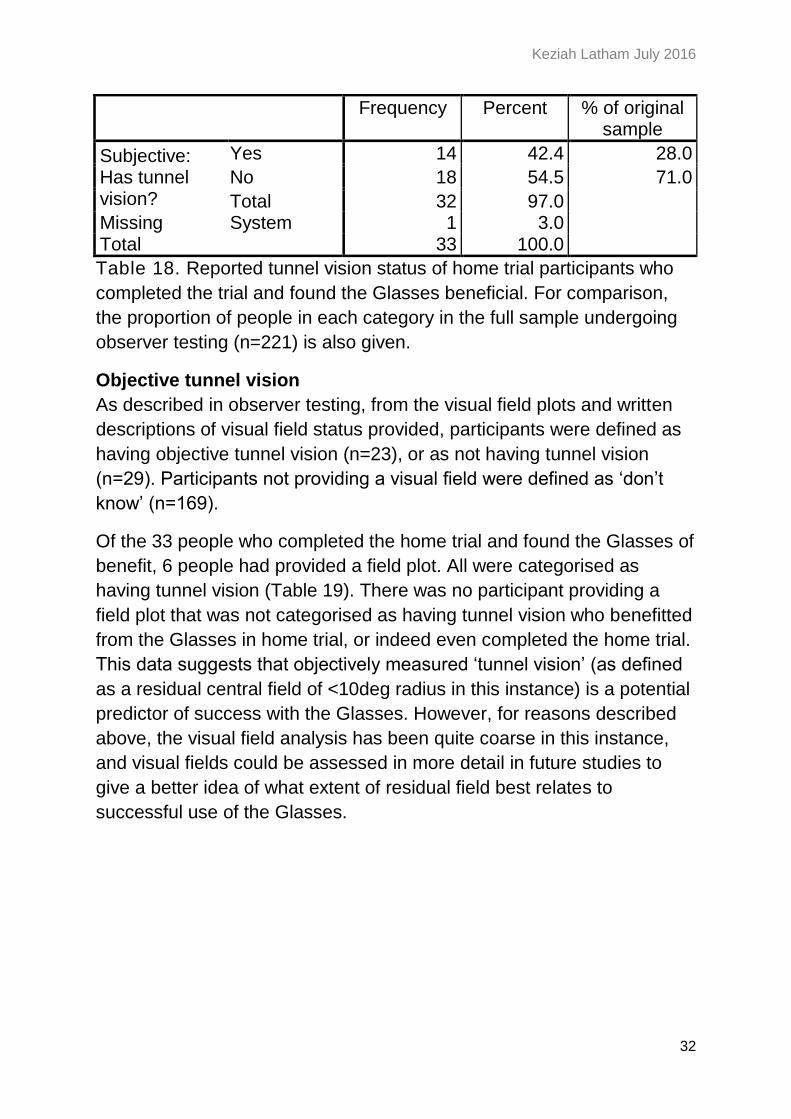
Frequency Percent % of original sample
Subjective: Has tunnel vision?
Yes 14 42.4 28.0
No 18 54.5 71.0
Total 32 97.0 Missing System 1 3.0 Total 33 100.0
Table 18. Reported tunnel vision status of home trial participants who
completed the trial and found the Glasses beneficial. For comparison,
the proportion of people in each category in the full sample undergoing
observer testing (n=221) is also given.
Objective tunnel vision
As described in observer testing, from the visual field plots and written
descriptions of visual field status provided, participants were defined as
having objective tunnel vision (n=23), or as not having tunnel vision
(n=29). Participants not providing a visual field were defined as ‘don’t
know’ (n=169).
Of the 33 people who completed the home trial and found the Glasses of
benefit, 6 people had provided a field plot. All were categorised as
having tunnel vision (Table 19). There was no participant providing a
field plot that was not categorised as having tunnel vision who benefitted
from the Glasses in home trial, or indeed even completed the home trial.
This data suggests that objectively measured ‘tunnel vision’ (as defined
as a residual central field of <10deg radius in this instance) is a potential
predictor of success with the Glasses. However, for reasons described
above, the visual field analysis has been quite coarse in this instance,
and visual fields could be assessed in more detail in future studies to
give a better idea of what extent of residual field best relates to
successful use of the Glasses.
Keziah Latham July 2016
33
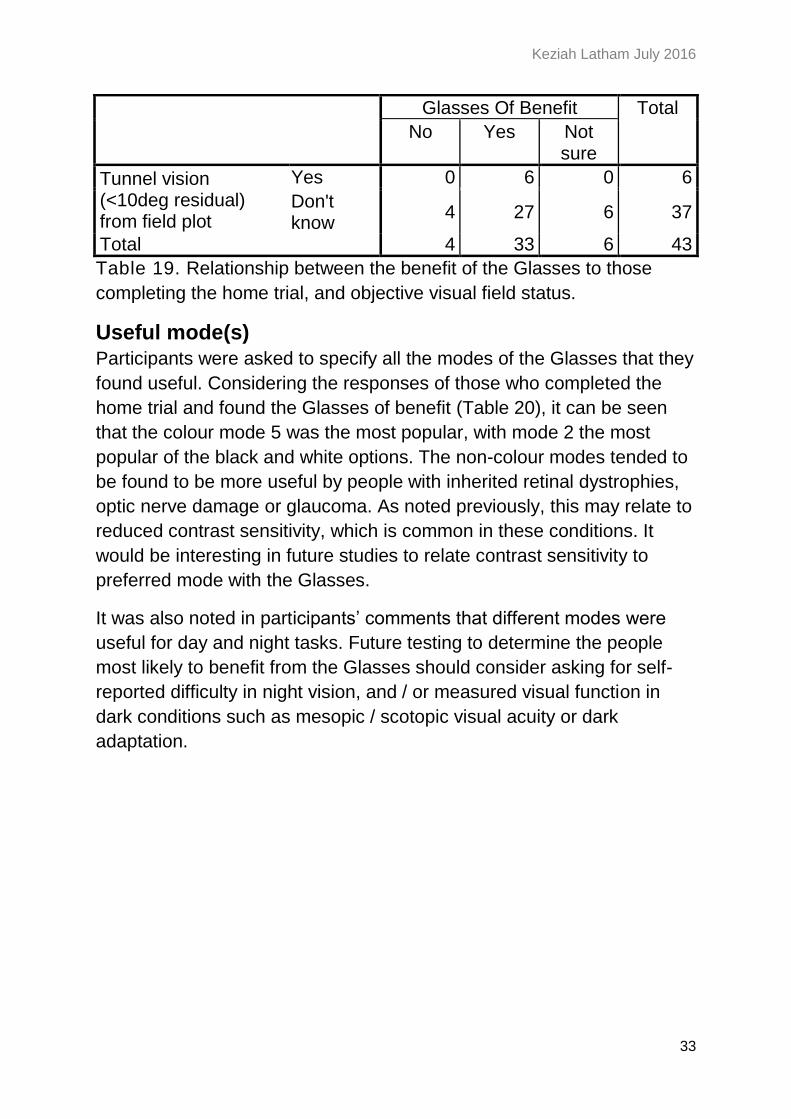
Glasses Of Benefit Total
No Yes Not sure
Tunnel vision (<10deg residual) from field plot
Yes 0 6 0 6
Don't know
4 27 6 37
Total 4 33 6 43
Table 19. Relationship between the benefit of the Glasses to those
completing the home trial, and objective visual field status.
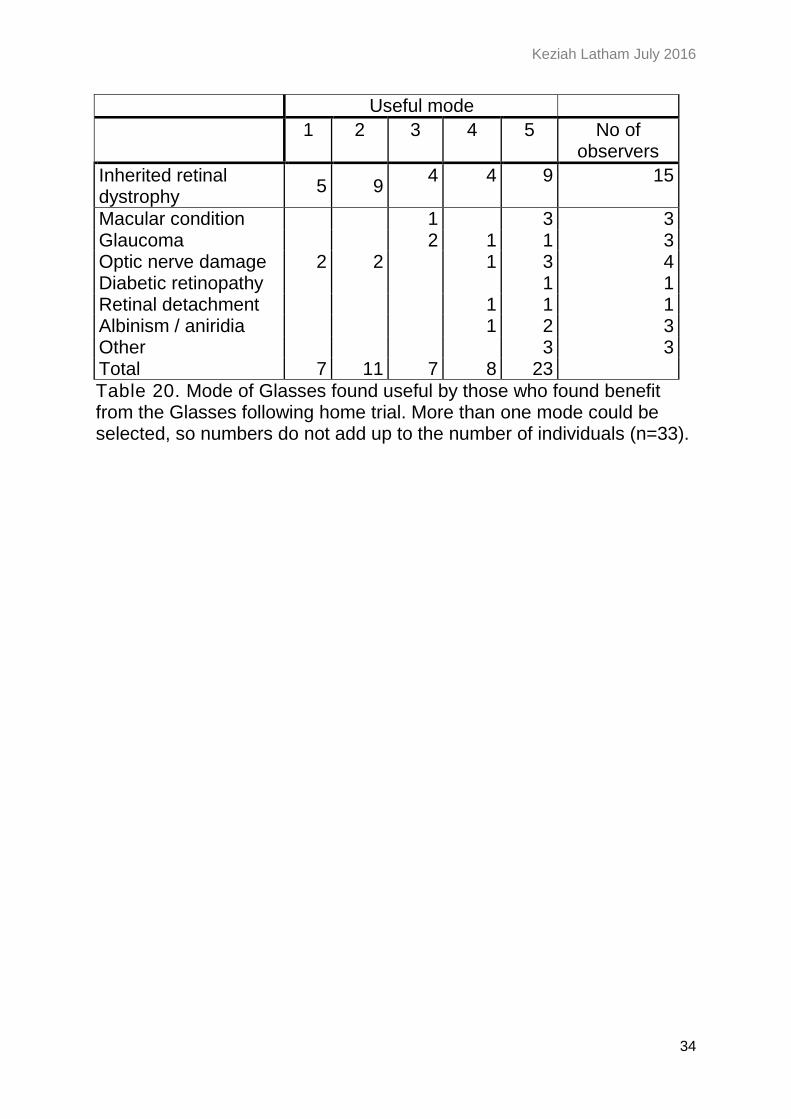
Useful mode(s)
Participants were asked to specify all the modes of the Glasses that they
found useful. Considering the responses of those who completed the
home trial and found the Glasses of benefit (Table 20), it can be seen
that the colour mode 5 was the most popular, with mode 2 the most
popular of the black and white options. The non-colour modes tended to
be found to be more useful by people with inherited retinal dystrophies,
optic nerve damage or glaucoma. As noted previously, this may relate to
reduced contrast sensitivity, which is common in these conditions. It
would be interesting in future studies to relate contrast sensitivity to
preferred mode with the Glasses.
It was also noted in participants’ comments that different modes were
useful for day and night tasks. Future testing to determine the people
most likely to benefit from the Glasses should consider asking for self-
reported difficulty in night vision, and / or measured visual function in
dark conditions such as mesopic / scotopic visual acuity or dark
adaptation.
Keziah Latham July 2016
34
Useful mode
1 2 3 4 5 No of observers
Inherited retinal dystrophy
5 9 4 4 9 15
Macular condition 1 3 3 Glaucoma 2 1 1 3 Optic nerve damage 2 2 1 3 4 Diabetic retinopathy 1 1 Retinal detachment 1 1 1 Albinism / aniridia 1 2 3 Other 3 3 Total 7 11 7 8 23
Table 20. Mode of Glasses found useful by those who found benefit from the Glasses following home trial. More than one mode could be selected, so numbers do not add up to the number of individuals (n=33).
Keziah Latham July 2016
35
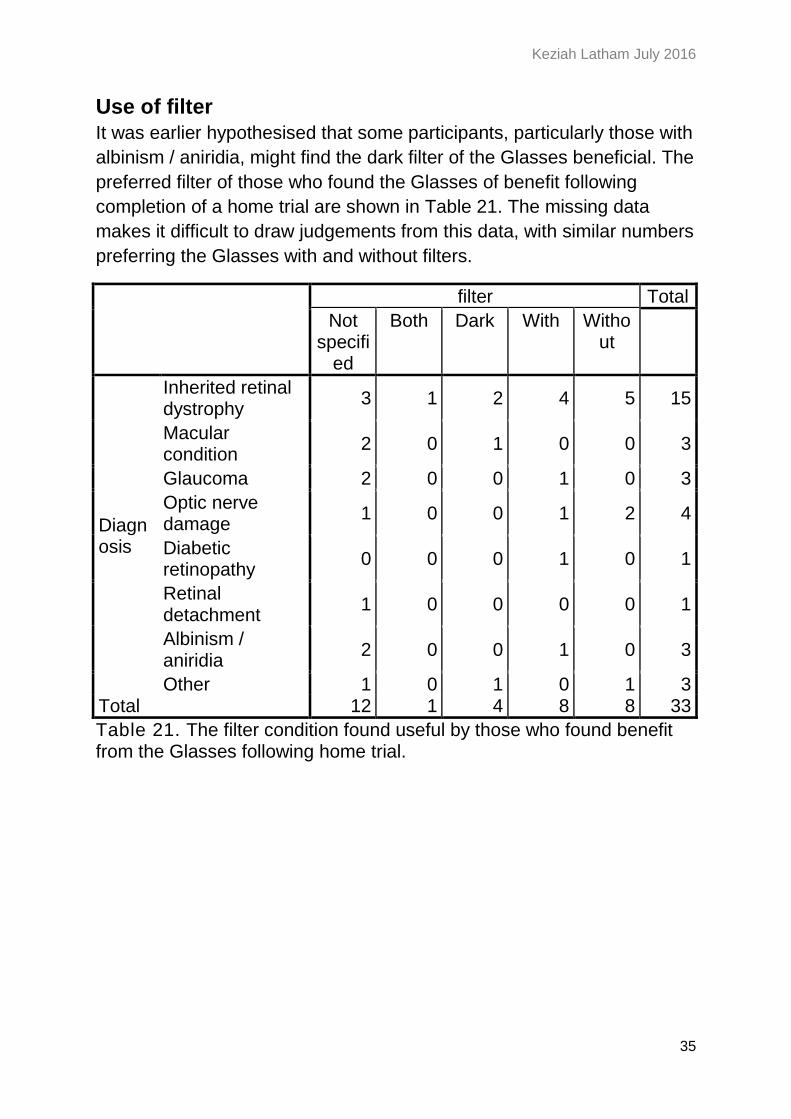
Use of filter
It was earlier hypothesised that some participants, particularly those with
albinism / aniridia, might find the dark filter of the Glasses beneficial. The
preferred filter of those who found the Glasses of benefit following
completion of a home trial are shown in Table 21. The missing data
makes it difficult to draw judgements from this data, with similar numbers
preferring the Glasses with and without filters.
filter Total
Not specifi
ed
Both Dark With Without
Diagnosis
Inherited retinal dystrophy
3 1 2 4 5 15
Macular condition
2 0 1 0 0 3
Glaucoma 2 0 0 1 0 3
Optic nerve damage
1 0 0 1 2 4
Diabetic retinopathy
0 0 0 1 0 1
Retinal detachment
1 0 0 0 0 1
Albinism / aniridia
2 0 0 1 0 3
Other 1 0 1 0 1 3 Total 12 1 4 8 8 33
Table 21. The filter condition found useful by those who found benefit from the Glasses following home trial.
Keziah Latham July 2016
36
Conclusions The principal findings of the present analysis are:
The observer testing and the home trial tell similar stories as to
who is most likely to benefit from the Glasses.
People benefitting from the Glasses are more likely to:
o Be aged under 65 years
o Have restricted peripheral visual fields. There is some
evidence that ‘tunnel vision’ (as defined here as an objective
residual visual field of <10 deg radius) may be more
predictive of likely benefit than self-reported visual field
status.
o Have a diagnosis of an inherited retinal disorder. People with
albinism / aniridia also seemed to be more likely to benefit
from the Glasses, although the sample size was small.
Duration of visual loss and acuity do not appear to influence the
likelihood of gaining benefit from the Glasses.
The colour mode 5 was the most popular, with mode 2 the most
popular of the black and white options. The non-colour modes
tended to be found to be more useful by people with inherited
retinal dystrophies, optic nerve damage or glaucoma.
In future testing of the Glasses it would be recommended to incorporate:
An objective assessment of visual field capable of assessing the
residual visual field of those with ‘tunnel vision’, in order to more
accurately predict the visual field parameters of people likely to
benefit from the Glasses.
Assessment of contrast sensitivity. The hypothesis would be that
those with more impaired contrast sensitivity would be more likely
to benefit from the Glasses.
Consideration of night vision status, by objective or subjective
means. A potential subjective question might be ‘do you consider
that your visual impairment is more severe under night time
conditions than under daytime conditions?’ The hypothesis would
be that those with more impaired scotopic (night time) vision would
be more likely to benefit from the Glasses.
Keziah Latham July 2016
37
References International Paralympic Committee (2013). Medical Diagnostics Form
for athletes with visual impairment. Latham, K., & Usherwood, C. (2010). Assessing visual activities of daily
living in the visually impaired. Ophthal Physiol Opt, 30, 55-65. Owsley, C., & Sloane, M. E. (1987). Contrast sensitivity, acuity, and the
perception of 'real-world' targets. Br J Ophthalmol, 71, 791-796. Pelli, D., Robson, J., & Wilkins, A. (1988). The design of a new letter
chart for measuring contrast sensitivity. Clinical Vision Science, 2, 187-199.
Tabrett, D., & Latham, K. (2011). Factors influencing self-reported vision-related activity limitation in the visually impaired. Investigative Ophthalmology and Visual Science, 52, 5293-5302. doi: doi:10.1167/iovs.10-7055
van Nispen, R. M. A., Hoeijmakers, J. G. J., De Boer, M. R., Ringens, P. J., & van Rens, G. H. M. B. (2008). Agreement between self-reported co-morbidity of visually impaired older patients and reports from their General Practitioners. Visual Impairment Research, 10, 49-56.