road safety in europe - archive.etsc.eu - road safety...around 12,400 car occupants survived serious...
TRANSCRIPT

Road safety in Europe
Mircea Steriu, ETSC, Communications and Project Officer

ETSC PIN Programme
• Compare country performance in road safety
• 30 countries included (EU Member States
+ Israel, Norway and Switzerland)
• A PIN Panel: well-placed experts from each of the 30
countries
Jacqueline Lacroix (DE), Dago Antov (EE), George Yannis (EL), Shalom
Hakkert (IL), Carla Messina and Domenico Pugliese (IT), Aldis Lama
(LV), Ilona Buttler (PL), Joao Cardoso (PT), Pilar Zori (ES), etc…
• A PIN Steering Group
1

• Annual number of deaths (PIN Reports)
• Road user groups:
• Vulnerable road users (2011)
• Young people (2011)
• Children (2009)
• Elderly (2008)
• Types of roads:
• Rural roads (2011)
• Capital cities (2009)
• Motorways (2008)
• Road users’ behaviour:
• Driving speeds (2010)
• Drink driving (2010)
• Seat belt use (2010)
Performance index so far

Road Safety PIN Awards 1
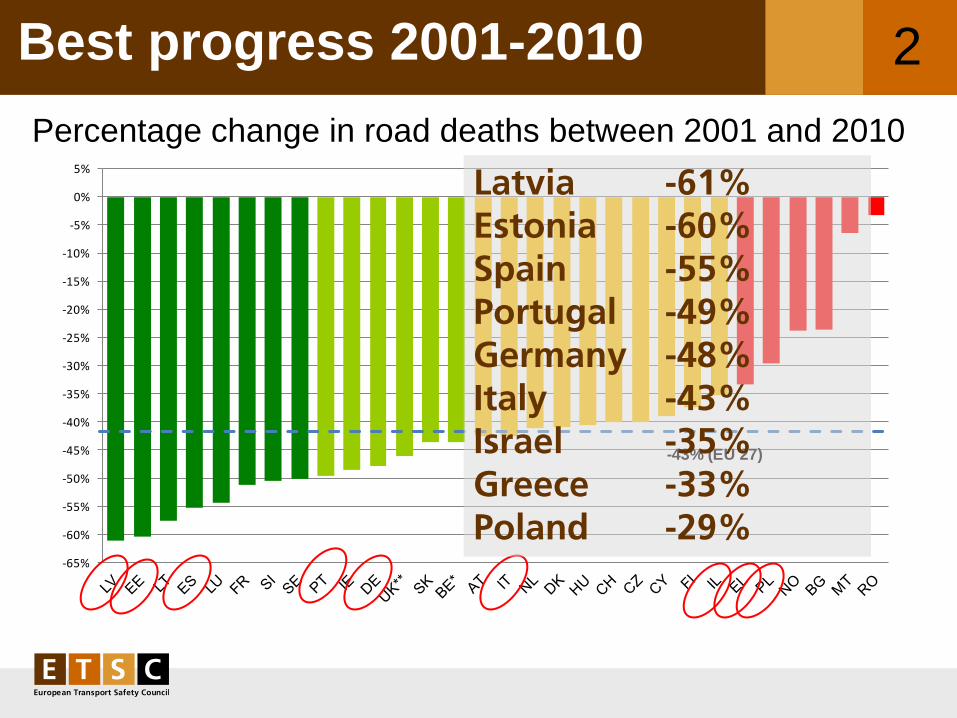
Best progress 2001-2010
Percentage change in road deaths between 2001 and 2010
2
-65%
-60%
-55%
-50%
-45%
-40%
-35%
-30%
-25%
-20%
-15%
-10%
-5%
0%
5%
-43% (EU 27)
Latvia -61% Estonia -60% Spain -55% Portugal -49% Germany -48% Italy -43% Israel -35% Greece -33% Poland -29%

Deaths per population in 2010 2
0
50
100
150
200
250
2001 2010
112 (EU in 2001)
62 (EU in 2010)
Good progress since 2001
No country with more than 115 road deaths per million inhabitants
Germany 45 Israel 46 Spain 54 Estonia 59 Italy 68 Portugal 80 Latvia 97 Poland 102 Greece 111
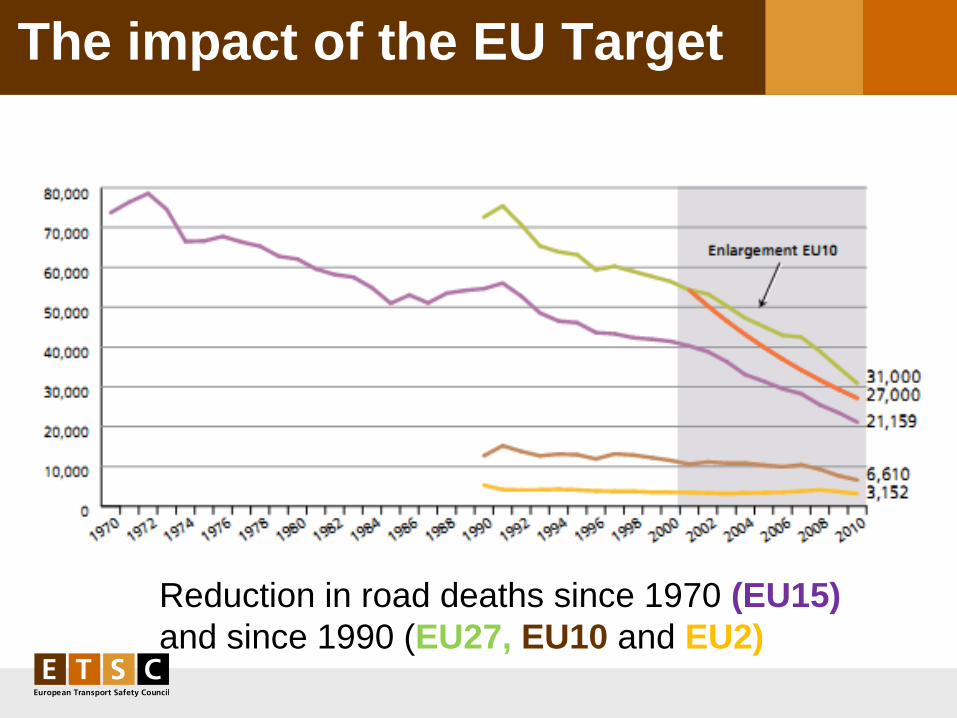
Reduction in road deaths since 1970 (EU15)
and since 1990 (EU27, EU10 and EU2)
The impact of the EU Target

The impact of the EU Target (cont’d)
Reductions in the number of deaths have been much
higher in 2001-2010 than in the three preceding decades
In the EU15, road deaths have been cut by 47%.
In the EU10, reductions have been slower but gained
pace in the last years to reach 38% in 2010.

The three main killers on EU roads
Inappropriate or
excessive speed
More than 2,200 road deaths
could be prevented each year if
average speeds dropped by
‘only’ 1km/h on all roads across
the EU.
Driving under the
influence of alcohol
At least 7,500 deaths could
have been prevented if
accident-involved drivers
reported to be driving over the
limit had been sober.
Failure to wear seat belts
Around 12,400 car occupants survived serious crashes in 2009
because they wore a seat belt.
Another 2,500 deaths could have been prevented if 99% of
occupant had been wearing a seat belt.
ETSC 4th PIN Report 2010, Chapter 3
5

Progress in reducing speed (I)
Mean speed of cars and vans on MOTORWAYS and yearly average % change in mean speed in some European countries.
*All traffic; ** ES: measurements made on 20% of the toll motorways length only
-15 km/h - ES (05-09) 120**
- 10 km/h FR (01-09) 130
Germany, Greece, Romania ?
5

0 %
10 %
20 %
30 %
40 %
50 %
60 %
70 %
80 %AT 100
BE 90
CH 80 *
CZ 90
DK 80
EE 90
FI 100
FR 90 D
GB 113
LT 90
PL 90 *
Speed on rural roads (II)
% of cars and vans exceeding speed limits on rural roads
* All traffic
Poland
Estonia
Estonia
0 %
10 %
20 %
30 %
40 %
50 %
60 %
70 %
80 %
90 %AT 30
CH 50 *
CZ 50
FR 50
GB 48
GB 64
IE 50
PL 50 *
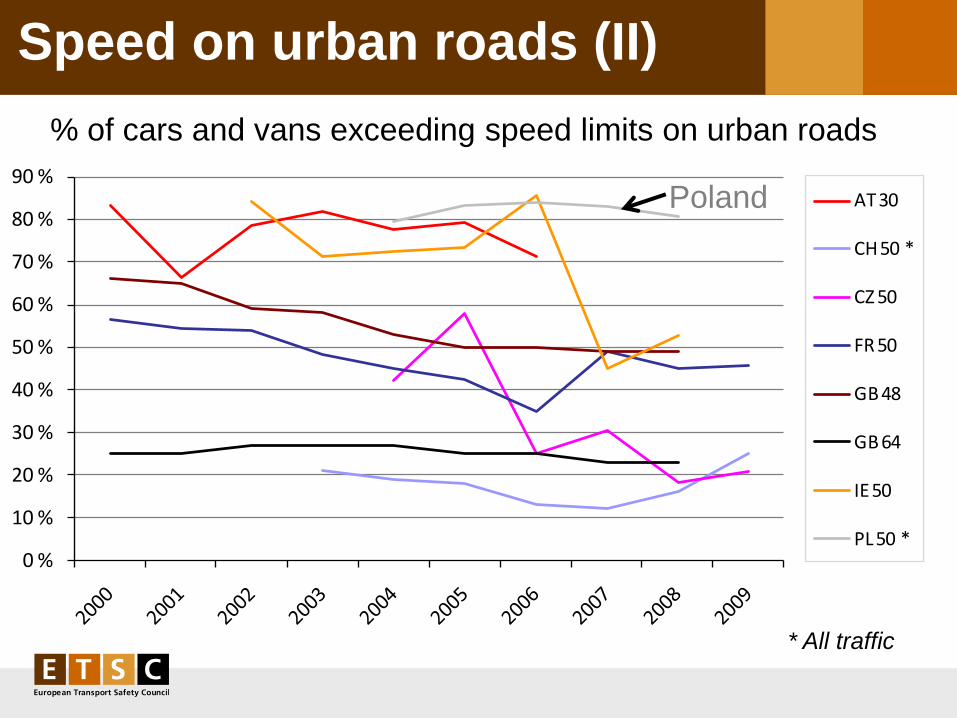
Speed on urban roads (II)
% of cars and vans exceeding speed limits on urban roads
* All traffic
Poland
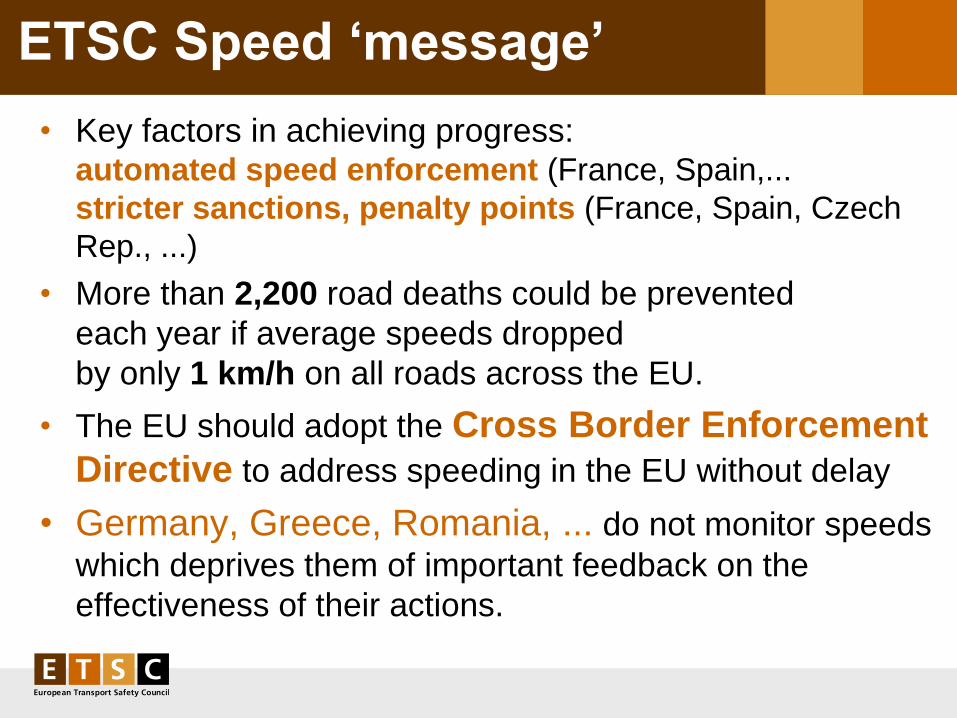
ETSC Speed ‘message’
• Key factors in achieving progress: automated speed enforcement (France, Spain,...
stricter sanctions, penalty points (France, Spain, Czech
Rep., ...)
• More than 2,200 road deaths could be prevented
each year if average speeds dropped
by only 1 km/h on all roads across the EU.
• The EU should adopt the Cross Border Enforcement
Directive to address speeding in the EU without delay
• Germany, Greece, Romania, ... do not monitor speeds
which deprives them of important feedback on the
effectiveness of their actions.

Actual level of Enforcement
Speed – Yearly speed tickets per 1,000 pop.
Alcohol – Roadside police tests per 1,000 pop.
5

Progress in reducing Drink driving
-15%
-10%
-5%
0%
5%
10%
15%
EU-27
Difference between the average annual % reduction in deaths
attributed to alcohol and the corresponding reduction for other deaths
(over 2001-2008)

ETSC Drink driving ‘message’
• High underreporting of drink driving deaths
• The European Commission estimates that across the EU
at least 25% of all road deaths are alcohol related,
against 11.5% according to official statistics.
• At least 7 500 deaths could have been prevented
(if 25% of all deaths occur in collisions with a driver over
the alcohol limit)
• The EU should promote consistent and visible
enforcement as powerful deterrent to drink driving
• The EU should adopt a 0.2 g/l BAC limit for
commercial and novice drivers.
• The EU should support the introduction of alcolocks.

Seat belt use front seat
60%
65%
70%
75%
80%
85%
90%
95%
100%2005 2009
EU-27 in 2009
EU-27 in 2005
Germany(‘08) 97% Israel 94% Estonia 87% Portugal(‘06) 86% Spain (‘08) 85% Latvia(‘08) 83% Poland(‘08) 80% Greece 75% Italy(‘07) 65%

Seat belt use rear seats
0%
10%
20%
30%
40%
50%
60%
70%
80%
90%
100%2005 2009
EU-27 in 2009
EU-27 in 2005
Germany(‘07) 88% Israel 63% Estonia 63% Portugal(‘07) 49% Spain (‘08) 81% Latvia(‘07) 21% Poland(‘08) 50% Greece 23% Italy N/A

ETSC Seat belt ‘message’
• Although obligatory in all Member States, seat belt
use is still only 88% for front seats and as low as 72%
for rear seats
• Despite some progress, rates are still disturbingly low
in many Eastern and Southern European countries
• Around 12 400 car occupants survived serious
crashes in 2009 because they wore a seat belt.
• Another 2 500 deaths could have been prevented if
99% of occupant had been wearing a seat belt, a rate
that could be reached with seat belt reminders.
• The EU should support the extension of seat belt
reminders to all seats without delay.
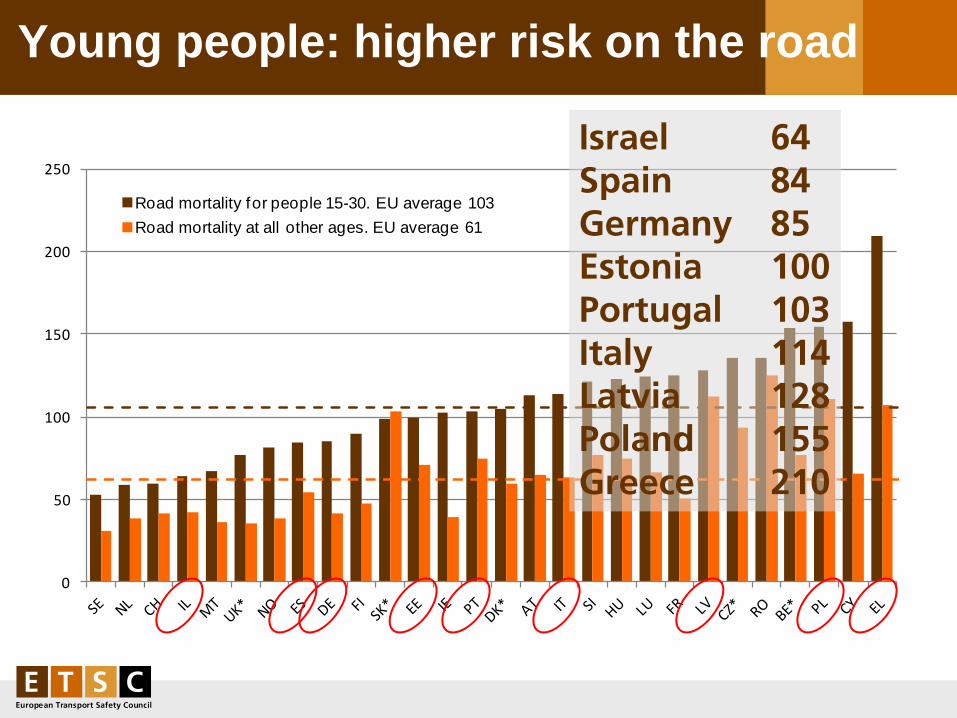
Young people: higher risk on the road
0
50
100
150
200
250
Road mortality for people 15-30. EU average 103
Road mortality at all other ages. EU average 61
Israel 64 Spain 84 Germany 85 Estonia 100 Portugal 103 Italy 114 Latvia 128 Poland 155 Greece 210
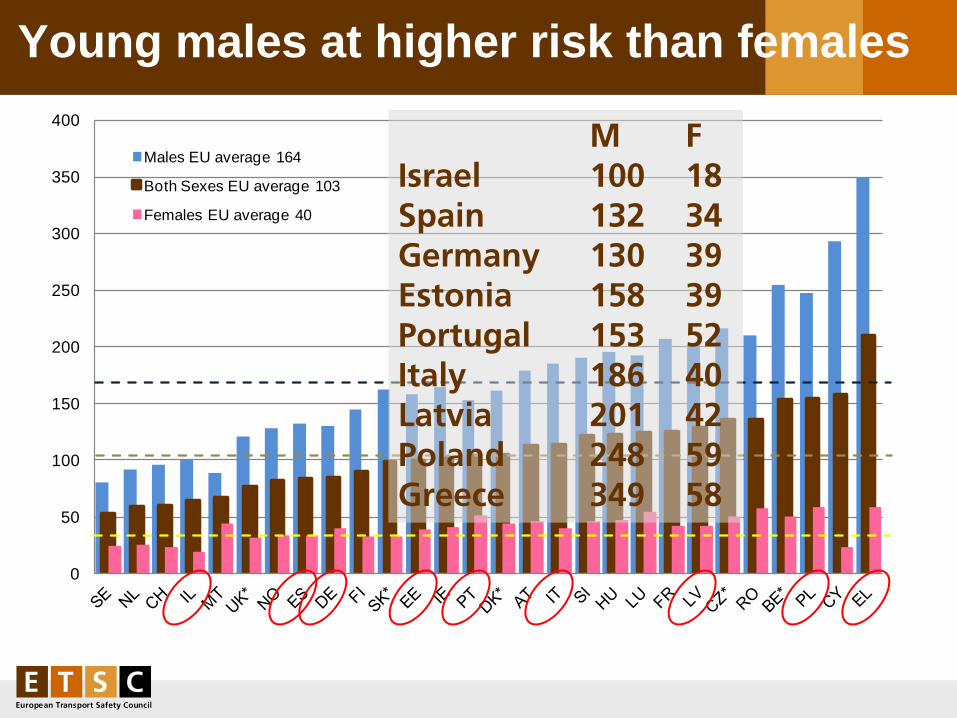
Young males at higher risk than females
0
50
100
150
200
250
300
350
400
Males EU average 164
Both Sexes EU average 103
Females EU average 40
M F Israel 100 18 Spain 132 34 Germany 130 39 Estonia 158 39 Portugal 153 52 Italy 186 40 Latvia 201 42 Poland 248 59 Greece 349 58

Reduction in young people mortality since 2001
-14%
-12%
-10%
-8%
-6%
-4%
-2%
0%
2%
4%
EU average -6.7%
Latvia -11.6% Spain -11.2% Portugal -10.8% Estonia -9.4% Germany -8.7% Israel -7.4% Italy -7.0% Poland -2.0% Greece -1.0%