road user behaviour - safetycube project · road user behaviour ... • traffic rule violations ......
TRANSCRIPT

27.09.2016
1
SafetyCubeSafety CaUsation, Benefits and Efficiency
Road User BehaviourWP4
Road user behaviour – WP4
• Contributing partners

27.09.2016
2
Objectives
Main objective of SafetyCube is to create a repository of estimates of risk factors and safety effects
Human Behaviour related risk factors and measures in WP4
• Identify and assess (accident) risk factors related to the road use
• Identify measures for addressing these risk factors
• Assess the effect of measures
27.09.2016 SafetyCube Workshop 3
… Road Users
… Risk Factors
… Countermeasures
Including all kinds of …
27.09.2016 4

27.09.2016
3
Steps in the process (risk factors)
Identification of human related
risk factors
Identification
“hot topics”Taxonomy
Systematic literature
search
Selection ofstudies
Coding ofstudies
Analysis ofcoded studies
Synopsis of riskfactors
Structur of the taxonomy(risk factors)
Topic
Subtopic
Specific topic Specific topic
Subtopic
Specific topic

27.09.2016
4
Example: driving under the influence
Driving underthe influence
Drunk Driving, Riding
Combinedusage
DruggedDriving, Riding
legal
DruggedDriving, Riding
illegal
Synthetic Drugs
Combined usage
0-0.5‰ 0.51-0.8‰
0.81-1.6‰ >1.6‰
THC Cocaine
Amphe-tamines
Opiates
Benzo-diazepines Z-drugs
Medicinal Opiates
Others
Topics (risk factors)
• Speeding• Influenced driving• Risk taking• Fatigue• Distraction and inattention• Functional impairment• Insufficient skills and knowledge• Emotion & Stress• Misjudgement & Observation Errors• Traffic rule violations• Personal Factors• Diseases and Disorders• Age

27.09.2016
5
Road user groups, age groups, VRU
• Road user groups are included in the individual topics
• age groups and VRU are not treated as a separate risk factor but within the other risk factors
• There will be a focus on these groups in the step of identifying and selecting measures
Challenges
• rare or no studies that focused on the relationship between the risk factors and accidents for some risk factors (e.g. emotion)
• many available studies focused more on conditions of the behaviour rather than the risk factor itself
• Comparability of different outcome variables
• division between risk and measures e.g. safety devices
• interrelation of behaviour, infrastructure, vehicle
27.09.2016
6
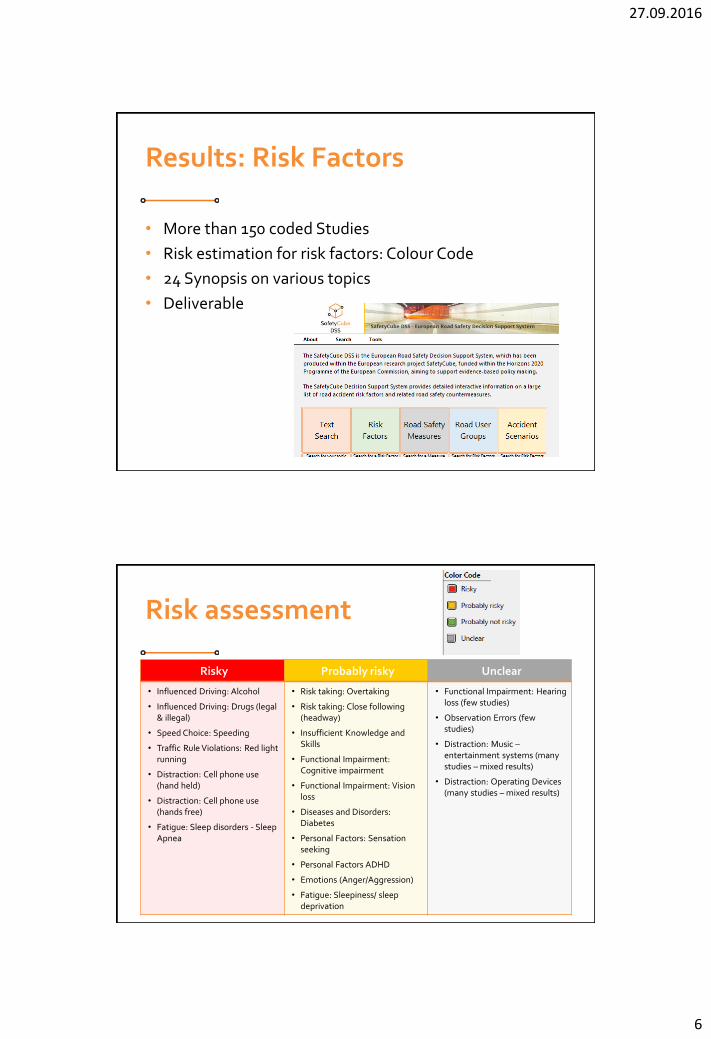
Results: Risk Factors
• More than 150 coded Studies
• Risk estimation for risk factors: Colour Code
• 24 Synopsis on various topics
• Deliverable
Risk assessment
Risky Probably risky Unclear
• Influenced Driving: Alcohol
• Influenced Driving: Drugs (legal & illegal)
• Speed Choice: Speeding
• Traffic Rule Violations: Red light running
• Distraction: Cell phone use (hand held)
• Distraction: Cell phone use (hands free)
• Fatigue: Sleep disorders - Sleep Apnea
• Risk taking: Overtaking
• Risk taking: Close following (headway)
• Insufficient Knowledge and Skills
• Functional Impairment: Cognitive impairment
• Functional Impairment: Vision loss
• Diseases and Disorders: Diabetes
• Personal Factors: Sensation seeking
• Personal Factors ADHD
• Emotions (Anger/Aggression)
• Fatigue: Sleepiness/ sleep deprivation
• Functional Impairment: Hearing loss (few studies)
• Observation Errors (few studies)
• Distraction: Music –entertainment systems (many studies – mixed results)
• Distraction: Operating Devices (many studies – mixed results)

27.09.2016
7
Preview
• Measures
Your expertise is needed…

27.09.2016
8
SafetyCubeSafety CaUsation, Benefits and Efficiency
Infrastructure
Eleonora Papadimitriou, NTUA
SafetyCube workshop, Brussels, September 27th , 2016
Vision
• To create an inventory of evaluated road safety risks measures related to the road infrastructure, with results from accident risk factors analysis and measures cost-efficiency assessment, to be integrated in the European Road Safety Decision Support System (DSS)
SafetyCube workshop, Brussels, September 27th , 2016

27.09.2016
9
Objectives
• The in-depth understanding of infrastructure related accident causation factors and the identification and evaluation of the most appropriate related measures.
• Exploit a large amount of existing accident data (macroscopic and in-depth) and knowledge (e.g. existing studies) in order:– to identify and rank risk factors related to the road
infrastructure,– to identify measures for addressing these risk
factors,– to assess the effects of measures.
SafetyCube workshop, Brussels, September 27th , 2016
Research team
• NTUA, Greece
• Loughborough University, UK
• KfV, Austria
• CTL, Italy
• BRSI, Belgium
• TOI, Norway
• SWOV, Netherlands
• AVP, Slovenia
• ERF, Belgium
SafetyCube workshop, Brussels, September 27th , 2016

27.09.2016
10
Nearly 60 risk factors and 100 measures in more than 15 infrastructure areas- motorways, rural and urban roads -
- road segments and junctions -
SafetyCube workshop, Brussels, September 27th , 2016
Infrastructure ‘hot topics’
1. Self-explaining and forgiving roads: Removing obstacles, Introduce shoulder, Alignment (horizontal / vertical), Sight distance, Traffic signs, Raised crossings / intersections
2. Urban road safety measures: Pedestrians / cyclists, Upgrade of Crossings, New crossings, Junctions / roundabouts treatments for VRU, Visibility
3. Road safety management: Quality of measures implementation, Appropriate speed limits, Enforcement, Availability of cost-effectiveness data, Workzones
4. ITS applications: ISA, Dynamic speed warning, ADAS and active safety with V2I, VMS
SafetyCube workshop, Brussels, September 27th , 2016

27.09.2016
11
Methodological approach
• Taxonomy of infrastructure risk factors• Exhaustive literature review and rigorous study
selection criteria• Template for coding studies• Studies analysed for carrying out meta-analyses
to estimate the effects of risk factors. • Synopses summarising results / meta-analysing
risk factors
• Systems approach: links between infrastructure, user and vehicle risks
• Assessment of the quality of the data / study methods
SafetyCube workshop, Brussels, September 27th , 2016
Risks taxonomy
SafetyCube workshop, Brussels, September 27th , 2016
Traffic flow Traffic volume
congestion
secondary accidents
traffic composition (share of pedestrians, cyclists, PTW, HGV)
distribution of flow over arms at junctions
Road type Road type
Road surface
deficiencies (risk of ran-
off road)
inadequate friction
uneven surface
ice, snow
oil, leaves, etc.
Poor visibility and
lighting
poor visibility - darkness
poor visibility - fog
Adverse weather rain
snow / ice / low temperatures
wind
Workzones small workzone length
high workzone duration
insufficient signage
Horizontal/vertical
alignment deficiencies
low curve radius
absence of transition curves
frequent curves
densely spaced junctions
poor sight distance - horizontal curves
high grade
vertical curve radius
tunnel
poor sight distance - vertical curves

27.09.2016
12
Risks taxonomy
Stakeholders’ consultation workshop, Brussels, February 22nd, 2016
Superelevation / cross-slopes (risk
of ran-off road)
superelevetion at curve
cross-slope
Lanes / ramps deficiencies number of lanes
narrow lane
Median / barrier deficiencies (risk
of crash with oncoming traffic)
undivided road
narrow median
Shoulder and roadside deficiencies
(risk of ran-off road or crash with
obstacle)
absence of shoulder
narrow shoulder
absence of guardrails or crash cushions
absence of clear-zone
roadside obstacles (per type of obstacle e.g. trees)
sight obstructions
Poor road readability absence of traffic signs
misleading or unreadable traffic signs
absence of road markings
absence of rumble strips
Interchange deficiencies inadequate ramp capacity
insufficient ramp length
insufficient acceleration / deceleration lane length
absence of channelisation
absence of access control
poor sight distance
At-grade junctions deficiencies high number of conflict points
type of junction
skewness / junction angle
poor sight distance
gradient
Rail-road crossings (risk of collision
with train)
uncontrolled rail-road crossing
Poor junction readability uncontrolled junction
misleading or unreadable traffic sign
absence of road markings
absence of marked crosswalks
Main challenges
• Difficulty in separating risks from measures effects (e.g. median, guardrails)
• Combined effects of infrastructure design elements
• Complexity of ‘hot topics’ (e.g. road readability)
• Methodological issues:– Outdated studies (e.g. alignment, cross-section)– Limited studies (e.g. interchanges, road surface)– Various forms of Accident Prediction Models
• Transferability– Lack of European studies
SafetyCube workshop, Brussels, September 27th , 2016

27.09.2016
13
Analyses on risks
• Wealth of studies related to road infrastructure, but less focus on risk aspects
• Risk analysis completed
• Already analysed approx. 270 studies on risks• Selection criteria:
– Meta-analyses– Recent studies– High quality studies with quantitative results
• Drafted 36 topic synopses (5 original meta-analyses).
• Risk estimation for risk factors: Colour Code
SafetyCube workshop, Brussels, September 27th , 2016
Synthesis of results• Ranking of risk factors
Red (Risky) Yellow (Probably risky) Grey (Unclear) Green (no risk)
Traffic Volume
Traffic
Composition
Road Surface
Deficiencies
Small workzone
length
Low Curve Radius
Absence of
Shoulder
Narrow Shoulders
Secondary incidents / accidents
Absence of Transition curves
Road type
High grade
Tunnel
Narrow lane
Undivided road
Narrow median
Absence of guard rails / clear zone & roadside
obstacle
Sight obstructions
High number of conflict points
Type of junction
Skewness / Junction angle
Poor sight distance
Gradient
Uncontrolled rail-road crossing
Absence of road markings / marked crosswalks
Uncontrolled junction
? Congestion
? Distribution of flow
over arms at junctions
? Frost and snow
? High workzone
duration
? Frequent curves
? Densely spaced
junctions
? Insufficient
acceleration /
deceleration lane
length
Superelevation at
curves

27.09.2016
14
Stakeholders’ involvement
• The activities are supported by the consultation of road safety infrastructure stakeholders:
• At the beginning of the project, assist in the identification of user needs and “hot topics” and provide related data and knowledge
• At Mid-Term, provide additional data and feedback on the analyses results and DSS development
SafetyCube workshop, Brussels, September 27th , 2016
Workshop objectives
• To present the project activities to date and plans for the coming research steps, and to receive feedback concerning:
• the DSS prototype: is it user-friendly? is the structure clear? is the presentation of results appropriate? how could the system be accessed?, etc.
• the infrastructure / behaviour topics in the DSS: is the information presented useful? is the presentation helpful? how could it be improved?, etc.
SafetyCube workshop, Brussels, September 27th , 2016

27.09.2016
15
SafetyCubeSafety CaUsation, Benefits and Efficiency
Infrastructure
Eleonora Papadimitriou, NTUA
SafetyCube workshop, Brussels, September 27th , 2016
9/27/2016
Guided tour to theDSS