roadshow presentation june 2018 - continental usa€¦ · roadshow presentation –june 2018 edmr -...
TRANSCRIPT

Roadshow Presentation
Ticker: CON
ADR-Ticker: CTTAY
Twitter: @Continental_IR
http://www.continental-ir.com
June 2018
Agenda
Q1 2018 Results4 16
Trends in the Sector of the Automotive Group1 3
Trends in the Sector of the Rubber Group2 10
Continental Strategy – Outlook 2020 and Beyond3 15
Back-up and 2016 – Q1 2018 Fact Sheets5 45
Roadshow Presentation – June 2018
EDMR - Equity and Debt Market Relations 2
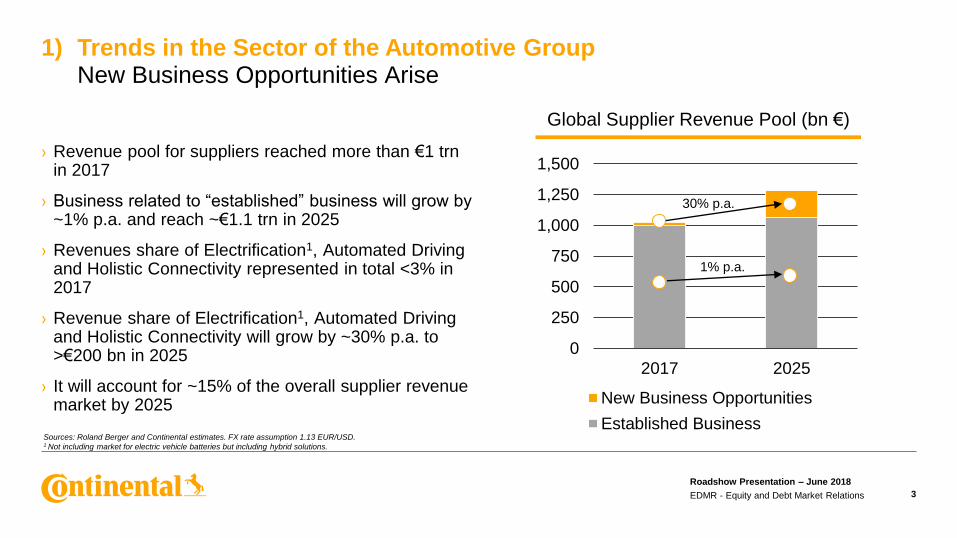
1) Trends in the Sector of the Automotive GroupNew Business Opportunities Arise
Roadshow Presentation – June 2018
EDMR - Equity and Debt Market Relations 3
› Revenue pool for suppliers reached more than €1 trnin 2017
› Business related to “established” business will grow by ~1% p.a. and reach ~€1.1 trn in 2025
› Revenues share of Electrification1, Automated Driving and Holistic Connectivity represented in total <3% in 2017
› Revenue share of Electrification1, Automated Driving and Holistic Connectivity will grow by ~30% p.a. to >€200 bn in 2025
› It will account for ~15% of the overall supplier revenue market by 2025
Sources: Roland Berger and Continental estimates. FX rate assumption 1.13 EUR/USD.1 Not including market for electric vehicle batteries but including hybrid solutions.
0
250
500
750
1,000
1,250
1,500
2017 2025
New Business Opportunities
Established Business
30% p.a.
1% p.a.
Global Supplier Revenue Pool (bn €)
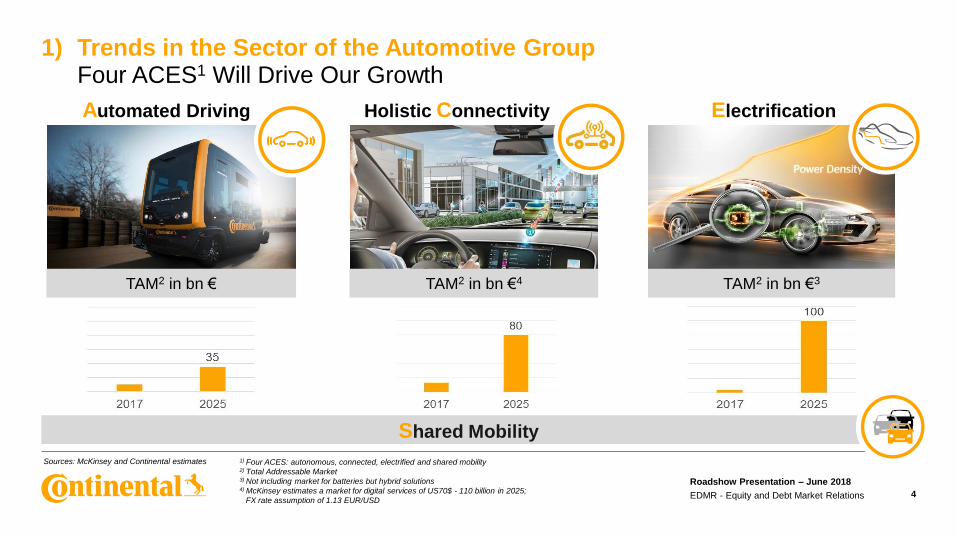
1) Trends in the Sector of the Automotive GroupFour ACES1 Will Drive Our Growth
Roadshow Presentation – June 2018
EDMR - Equity and Debt Market Relations
1) Four ACES: autonomous, connected, electrified and shared mobility2) Total Addressable Market 3) Not including market for batteries but hybrid solutions4) McKinsey estimates a market for digital services of US70$ - 110 billion in 2025;
FX rate assumption of 1.13 EUR/USD
ElectrificationAutomated Driving Holistic Connectivity
TAM2 in bn €3TAM2 in bn € TAM2 in bn €4
Shared Mobility
Sources: McKinsey and Continental estimates
4

1) Trends in the Sector of the Automotive GroupThe Most Digitalized Portfolio in The Supplier Sector1
Roadshow Presentation – June 2018
EDMR - Equity and Debt Market Relations 5
0% 10% 20% 30% 40% 50% 60% 70% 80% 90% 100%
Competitor 10
Competitor 9
Competitor 8
Competitor 7
Competitor 6
Competitor 5
Competitor 4
Competitor 3
Competitor 2
Competitor 1
ContinentalAutomotive
Today: Electronics/Sensors/SW products as % of sales Continental 2025: Electronics/Sensors/SW products as % of sales
Source: Company filings and Continental estimates. 1 Suppliers >€3 bn sales.

1) Trends in the Sector of the Automotive GroupApproaching Automated Driving: Three-Layer Model
Roadshow Presentation – June 2018
EDMR - Equity and Debt Market Relations 6
1 Source: Continental estimates.
Market for Automated Driving
~€35 bn1 by 2025
Recent additions to the portfolio
(incl. cooperations and JVs)
Components
System
Environmental Model
~€26 bn1
~€7 bn1
~€2 bn1
Sensors
Electronics
Software
Integration
Software
Electronics
BMW/Intel platform
NTT Docomo
Baidu
easyMile
HUAWEI
solid-state flash lidar
ADCU
NVIDIA
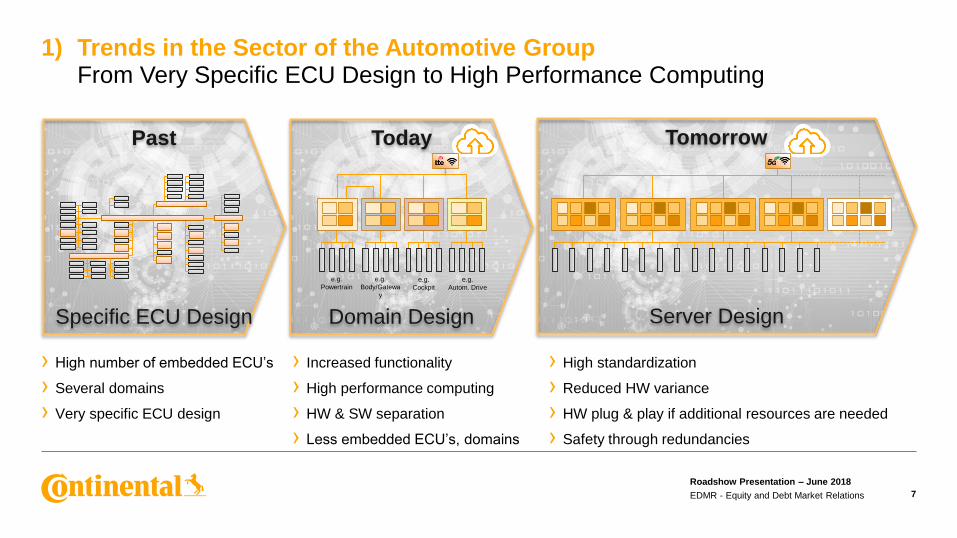
1) Trends in the Sector of the Automotive GroupFrom Very Specific ECU Design to High Performance Computing
Roadshow Presentation – June 2018
EDMR - Equity and Debt Market Relations 7
› High number of embedded ECU’s
› Several domains
› Very specific ECU design
Past
Specific ECU Design
› High standardization
› Reduced HW variance
› HW plug & play if additional resources are needed
› Safety through redundancies
Tomorrow
Server Design
Today
Domain Design
e.g.
Powertrain
e.g.
Body/Gatewa
y
e.g.
Cockpit
e.g.
Autom. Drive
› Increased functionality
› High performance computing
› HW & SW separation
› Less embedded ECU’s, domains
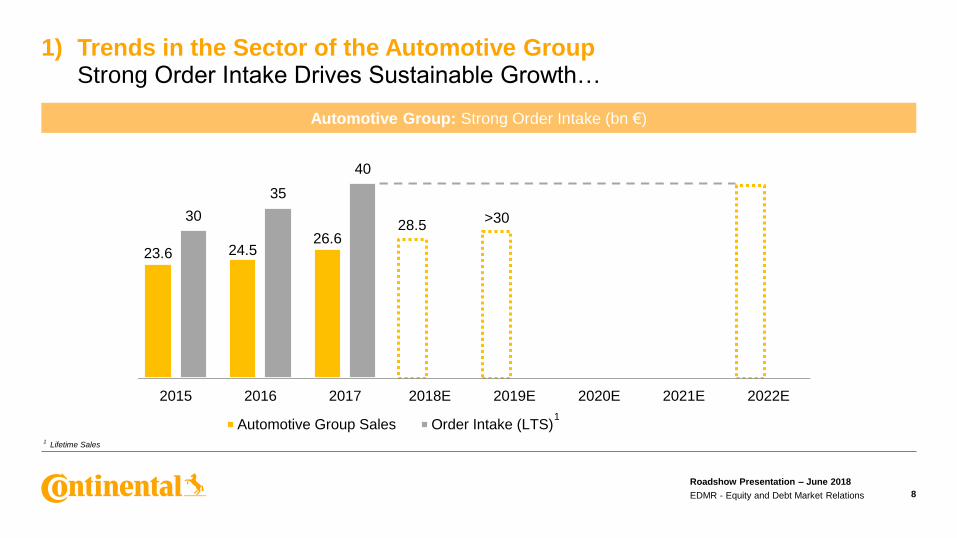
1) Trends in the Sector of the Automotive GroupStrong Order Intake Drives Sustainable Growth…
Roadshow Presentation – June 2018
EDMR - Equity and Debt Market Relations 8
Automotive Group: Strong Order Intake (bn €)
1Lifetime Sales
1
20.0 20.923.6 24.5
26.628.5
>30
26
30 30
35
40
2013 2014 2015 2016 2017 2018E 2019E 2020E 2021E 2022E
Automotive Group Sales Order Intake (LTS)
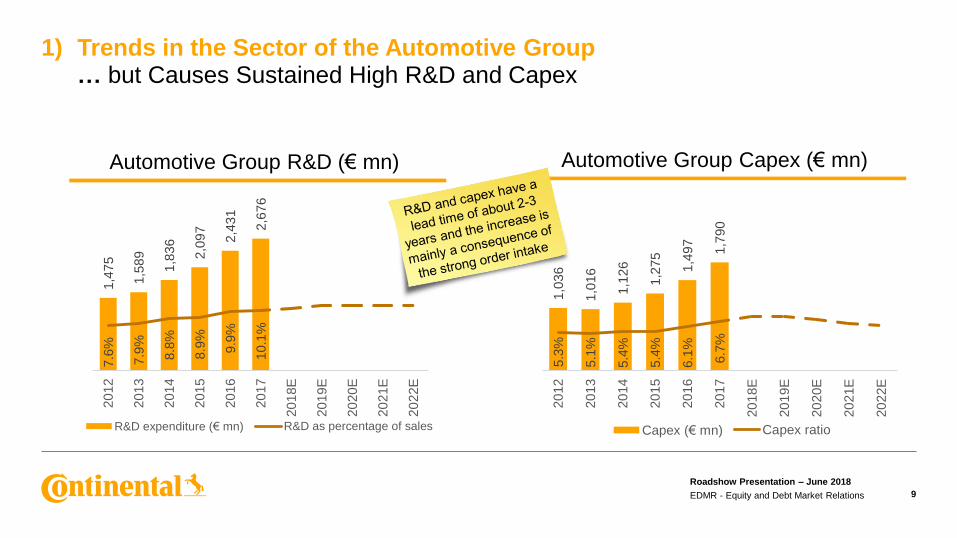
1) Trends in the Sector of the Automotive Group… but Causes Sustained High R&D and Capex
Roadshow Presentation – June 2018
EDMR - Equity and Debt Market Relations 9
1,4
75
1,5
89
1,8
36
2,0
97
2,4
31
2,6
76
7.6
%
7.9
%
8.8
%
8.9
%
9.9
%
10.1
%
20
12
20
13
20
14
20
15
20
16
20
17
20
18E
20
19E
20
20E
20
21E
20
22E
R&D expenditure (€ mn) R&D as percentage of sales
1,0
36
1,0
16
1,1
26
1,2
75
1,4
97
1,7
90
5.3
%
5.1
%
5.4
%
5.4
%
6.1
%
6.7
%
20
12
20
13
20
14
20
15
20
16
20
17
20
18E
20
19E
20
20E
20
21E
20
22E
Capex (€ mn) Capex ratio
Automotive Group R&D (€ mn) Automotive Group Capex (€ mn)
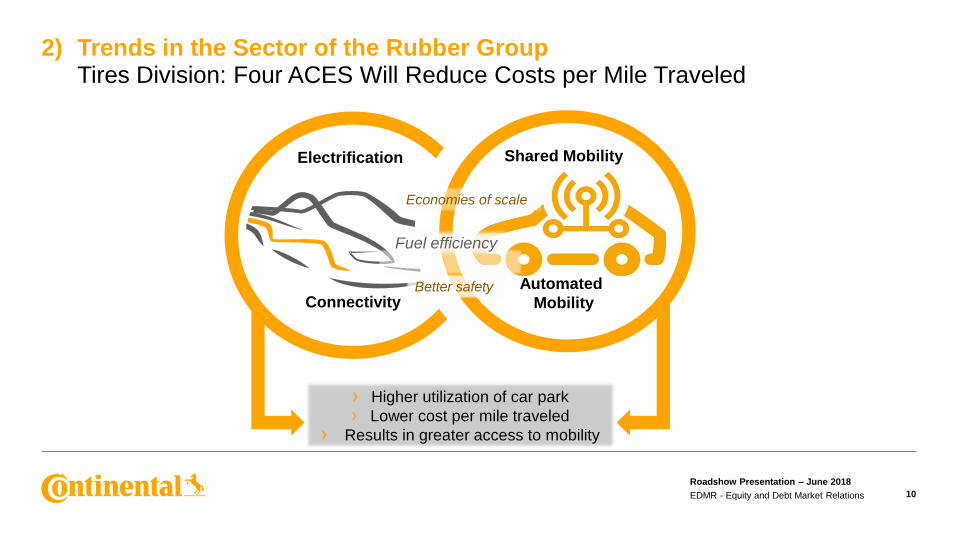
2) Trends in the Sector of the Rubber GroupTires Division: Four ACES Will Reduce Costs per Mile Traveled
Roadshow Presentation – June 2018
EDMR - Equity and Debt Market Relations 10
Shared Mobility
Automated
Mobility
Electrification
Connectivity
› Higher utilization of car park
› Lower cost per mile traveled
› Results in greater access to mobility
Better safety
Fuel efficiency
Economies of scale
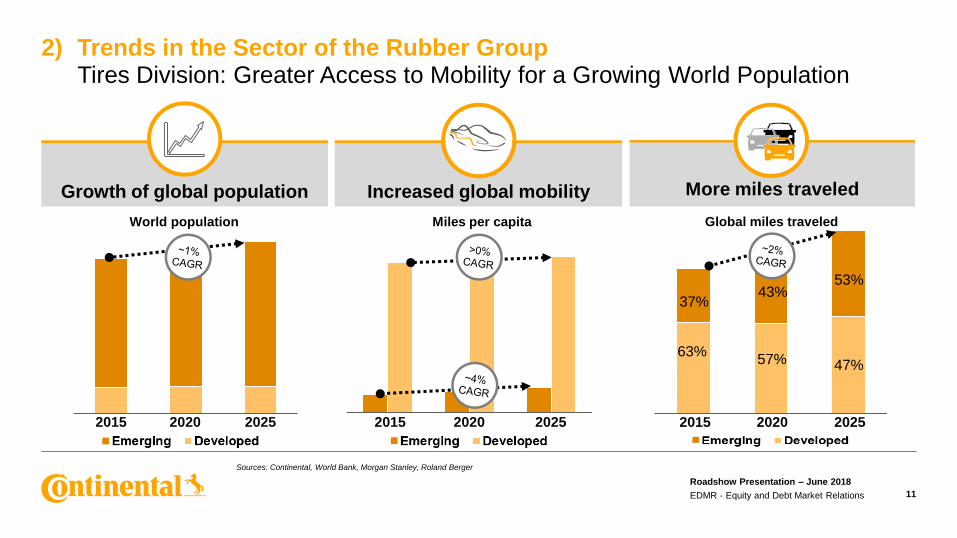
2) Trends in the Sector of the Rubber GroupTires Division: Greater Access to Mobility for a Growing World Population
Roadshow Presentation – June 2018
EDMR - Equity and Debt Market Relations 11
Increased global mobilityGrowth of global population More miles traveled
World population Miles per capita Global miles traveled
2015 2020 20252015 2020 2025
Sources: Continental, World Bank, Morgan Stanley, Roland Berger
2015 2020 20252015 2020 2025
2015 2020 2025
63%
37%43%
53%
47%57%
2015 2020 2025
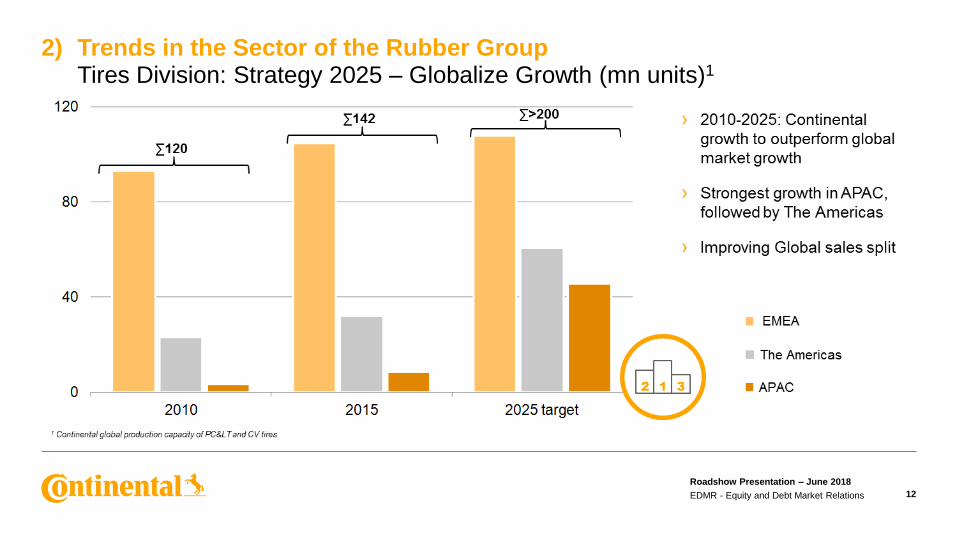
2) Trends in the Sector of the Rubber GroupTires Division: Strategy 2025 – Globalize Growth (mn units)1
Roadshow Presentation – June 2018
EDMR - Equity and Debt Market Relations 12
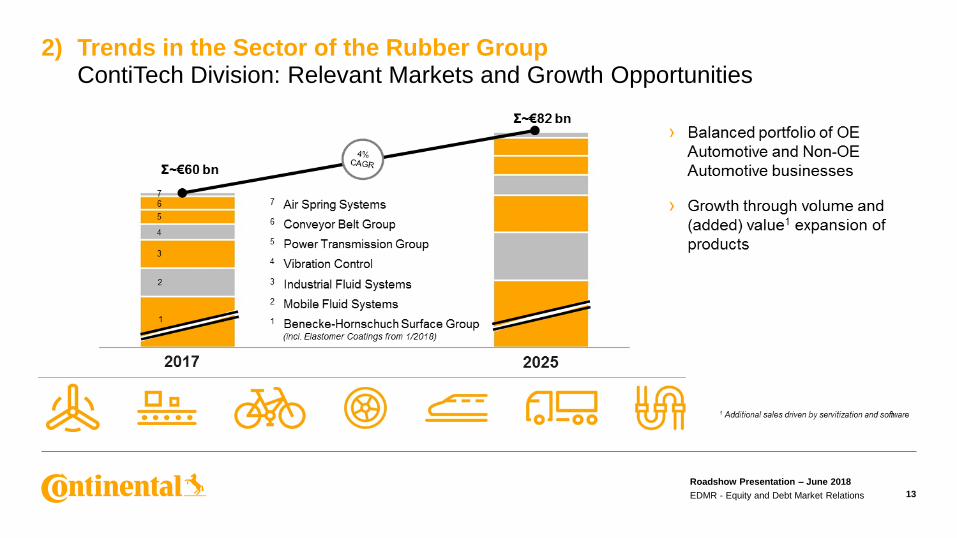
2) Trends in the Sector of the Rubber GroupContiTech Division: Relevant Markets and Growth Opportunities
Roadshow Presentation – June 2018
EDMR - Equity and Debt Market Relations 13
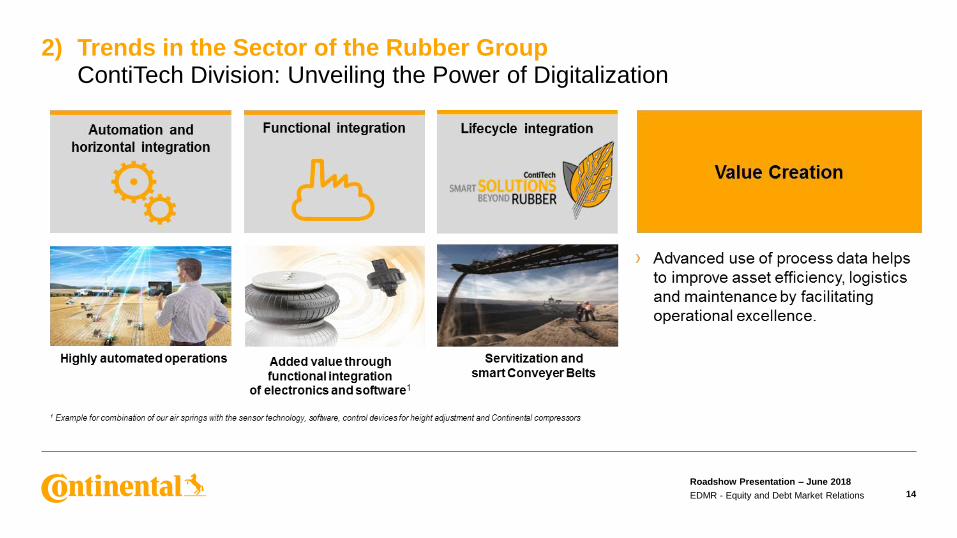
2) Trends in the Sector of the Rubber GroupContiTech Division: Unveiling the Power of Digitalization
Roadshow Presentation – June 2018
EDMR - Equity and Debt Market Relations 14
Roadshow Presentation – June 2018
EDMR - Equity and Debt Market Relations 15
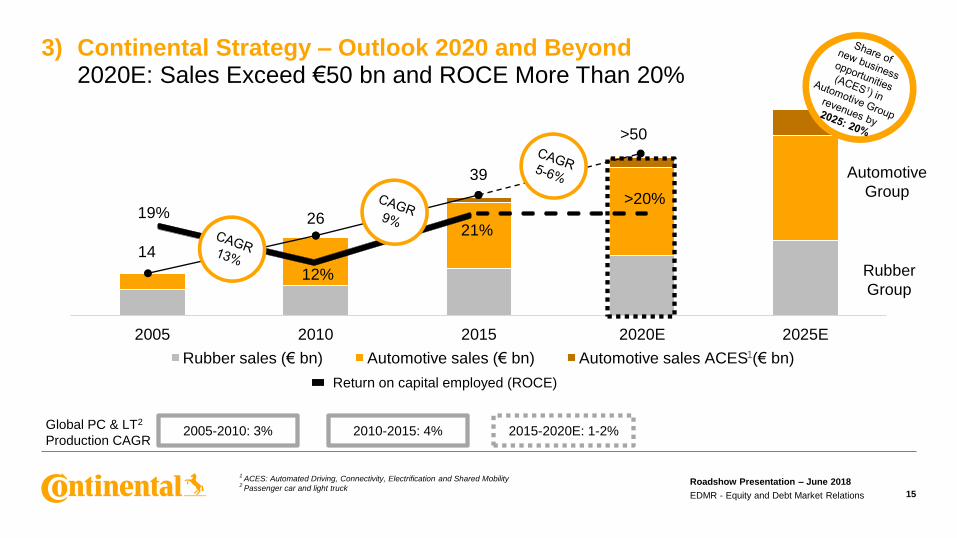
2005 2010 2015 2020E 2025E
Rubber sales (€ bn) Automotive sales (€ bn) Automotive sales ACES (€ bn)
2005-2010: 3% 2010-2015: 4% 2015-2020E: 1-2%Global PC & LT2
Production CAGR
Rubber
Group
Automotive
Group
19%
12%
21%
>20%
14
26
39
>50
1 ACES: Automated Driving, Connectivity, Electrification and Shared Mobility
2 Passenger car and light truck
1
Return on capital employed (ROCE)
3) Continental Strategy – Outlook 2020 and Beyond2020E: Sales Exceed €50 bn and ROCE More Than 20%
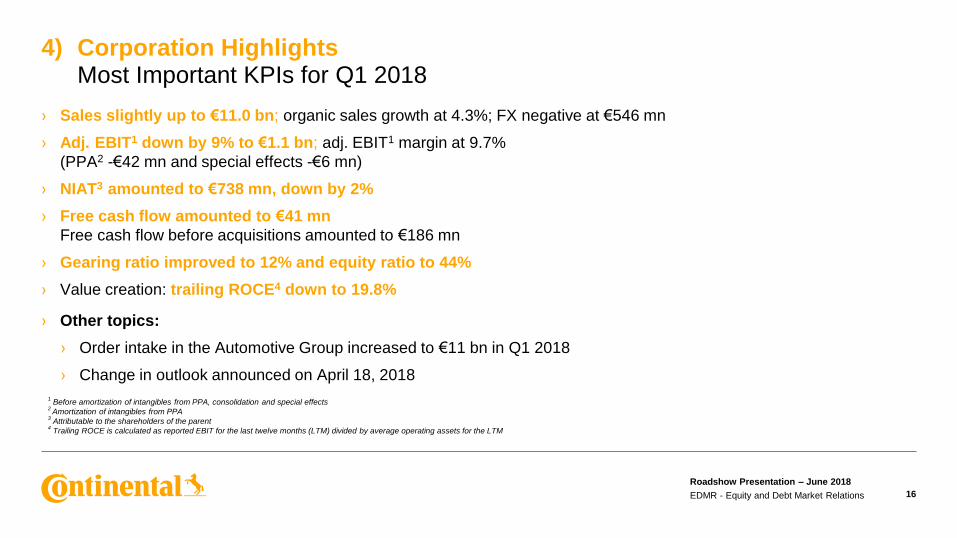
› Sales slightly up to €11.0 bn; organic sales growth at 4.3%; FX negative at €546 mn
› Adj. EBIT1 down by 9% to €1.1 bn; adj. EBIT1 margin at 9.7%
(PPA2 -€42 mn and special effects -€6 mn)
› NIAT3 amounted to €738 mn, down by 2%
› Free cash flow amounted to €41 mn
Free cash flow before acquisitions amounted to €186 mn
› Gearing ratio improved to 12% and equity ratio to 44%
› Value creation: trailing ROCE4 down to 19.8%
› Other topics:
› Order intake in the Automotive Group increased to €11 bn in Q1 2018
› Change in outlook announced on April 18, 2018
4) Corporation HighlightsMost Important KPIs for Q1 2018
1Before amortization of intangibles from PPA, consolidation and special effects
2 Amortization of intangibles from PPA
3Attributable to the shareholders of the parent
4Trailing ROCE is calculated as reported EBIT for the last twelve months (LTM) divided by average operating assets for the LTM
Roadshow Presentation – June 2018
EDMR - Equity and Debt Market Relations 16

› Automotive Group: Organic sales increased by 5.5%;
exceeding global car production by about 7%-points;
adj. EBIT1 margin at 8.3% (PY: 8.3%)
› Chassis & Safety: 10.1% adj. EBIT1 margin
(PY: 9.6%); organic sales at 6.0%; ADAS unit sales
up by 37%
› Powertrain: 5.5% adj. EBIT1 margin (PY: 6.0%);
organic sales up by 1.5%; adj. EBIT1 margin before
HEV at >9%
› Interior: 8.4% adj. EBIT1 margin (PY: 8.6%); organic
sales increased by 8.5% again driven by strong
demand for multimedia and connectivity products
4) Corporation Highlights Divisional Highlights for Q1 2018
17
1Before amortization of intangibles from PPA, consolidation and special effects
› Rubber Group: Organic sales up by 2.3% and adj. EBIT1
margin down to 12.9% (PY: 14.9%), negatively impacted
by FX and some inventory revaluation effects
› Tires: Adj. EBIT1 margin down to 15.2% (PY: 18.0%);
volumes down by 3%; solid price mix at 4%; FX
impacted tire sales negatively by 5.5%;
organic sales up by 1.0%
Tire markets: PC & LT tire replacement demand in
Europe was down by 1% and North America by 2%
› ContiTech: Adj. EBIT1 margin decreased by 60 bps
to 8.6% (PY: 9.2%); organic sales up by 5.1% driven
by the Conveyor Belt Group and Industrial Fluid
Systems which recovered from depressed levels
Automotive Group Rubber Group
Roadshow Presentation – June 2018
EDMR - Equity and Debt Market Relations
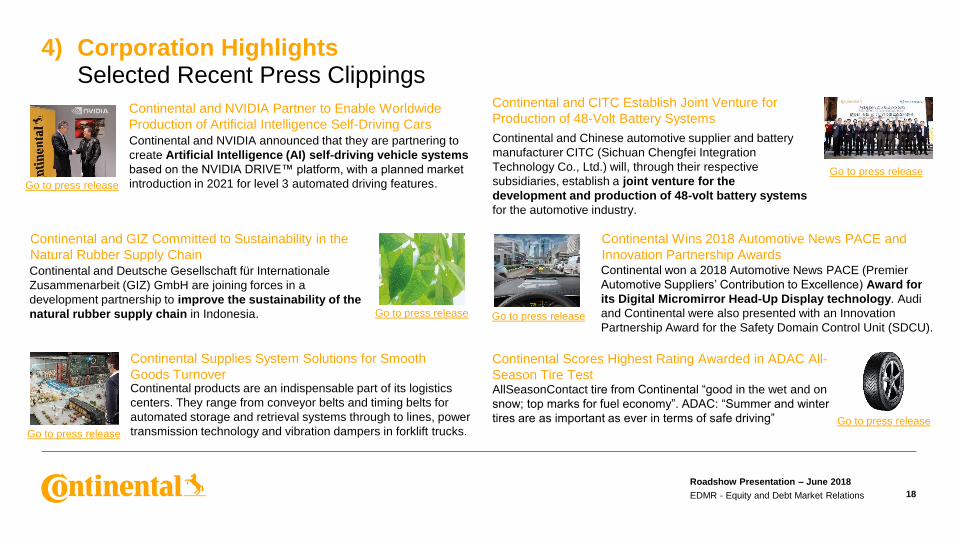
4) Corporation Highlights Selected Recent Press Clippings
18
Continental and CITC Establish Joint Venture for
Production of 48-Volt Battery Systems
Continental and Chinese automotive supplier and battery
manufacturer CITC (Sichuan Chengfei Integration
Technology Co., Ltd.) will, through their respective
subsidiaries, establish a joint venture for the
development and production of 48-volt battery systems
for the automotive industry.
Continental and NVIDIA Partner to Enable Worldwide
Production of Artificial Intelligence Self-Driving Cars
Continental and Deutsche Gesellschaft für Internationale
Zusammenarbeit (GIZ) GmbH are joining forces in a
development partnership to improve the sustainability of the
natural rubber supply chain in Indonesia.
Continental and GIZ Committed to Sustainability in the
Natural Rubber Supply Chain
Continental and NVIDIA announced that they are partnering to
create Artificial Intelligence (AI) self-driving vehicle systems
based on the NVIDIA DRIVE™ platform, with a planned market
introduction in 2021 for level 3 automated driving features.Go to press release
Go to press release
Go to press release
Continental won a 2018 Automotive News PACE (Premier
Automotive Suppliers’ Contribution to Excellence) Award for
its Digital Micromirror Head-Up Display technology. Audi
and Continental were also presented with an Innovation
Partnership Award for the Safety Domain Control Unit (SDCU).
Continental Wins 2018 Automotive News PACE and
Innovation Partnership Awards
Go to press release
Continental products are an indispensable part of its logistics
centers. They range from conveyor belts and timing belts for
automated storage and retrieval systems through to lines, power
transmission technology and vibration dampers in forklift trucks.
Continental Supplies System Solutions for Smooth
Goods Turnover
Go to press release
Continental Scores Highest Rating Awarded in ADAC All-
Season Tire TestAllSeasonContact tire from Continental “good in the wet and on
snow; top marks for fuel economy”. ADAC: “Summer and winter
tires are as important as ever in terms of safe driving” Go to press release
Roadshow Presentation – June 2018
EDMR - Equity and Debt Market Relations
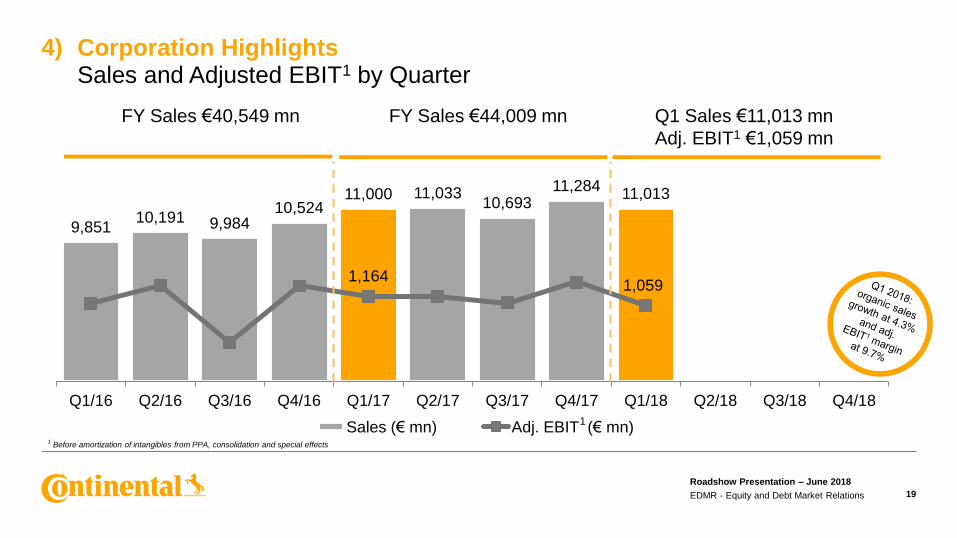
9,85110,191 9,984
10,52411,000 11,033
10,69311,284
11,013
1,1641,059
Q1/16 Q2/16 Q3/16 Q4/16 Q1/17 Q2/17 Q3/17 Q4/17 Q1/18 Q2/18 Q3/18 Q4/18
Sales (€ mn) Adj. EBIT (€ mn)
4) Corporation Highlights Sales and Adjusted EBIT1 by Quarter
19
1Before amortization of intangibles from PPA, consolidation and special effects
FY Sales €40,549 mn FY Sales €44,009 mn Q1 Sales €11,013 mn
Adj. EBIT1 €1,059 mn
1
Roadshow Presentation – June 2018
EDMR - Equity and Debt Market Relations
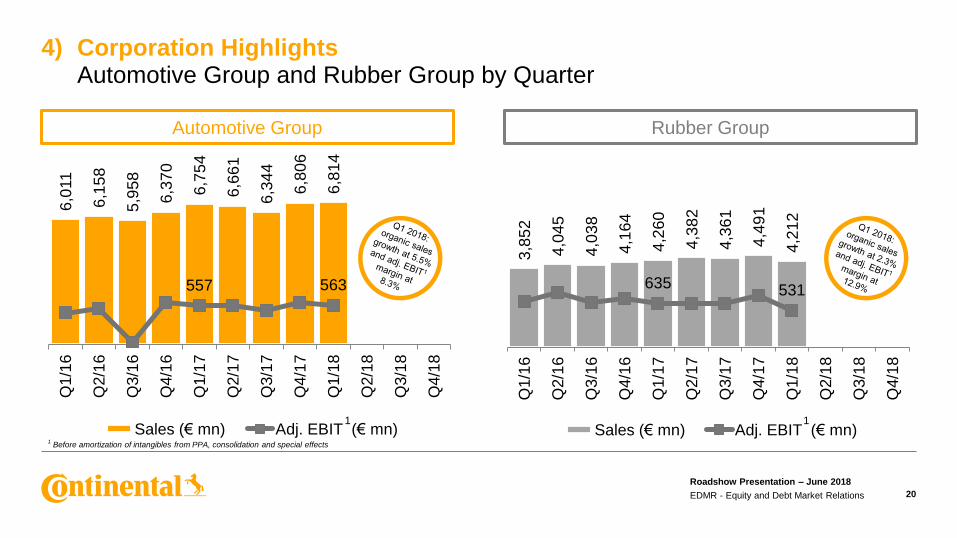
3,8
52
4,0
45
4,0
38
4,1
64
4,2
60
4,3
82
4,3
61
4,4
91
4,2
12
635 531
Q1/1
6
Q2/1
6
Q3/1
6
Q4/1
6
Q1/1
7
Q2/1
7
Q3/1
7
Q4/1
7
Q1/1
8
Q2/1
8
Q3/1
8
Q4/1
8
Sales (€ mn) Adj. EBIT (€ mn)
6,0
11
6,1
58
5,9
58
6,3
70
6,7
54
6,6
61
6,3
44
6,8
06
6,8
14
557 563
Q1/1
6
Q2/1
6
Q3/1
6
Q4/1
6
Q1/1
7
Q2/1
7
Q3/1
7
Q4/1
7
Q1/1
8
Q2/1
8
Q3/1
8
Q4/1
8Sales (€ mn) Adj. EBIT (€ mn)
4) Corporation Highlights Automotive Group and Rubber Group by Quarter
20
1
Automotive Group Rubber Group
1Before amortization of intangibles from PPA, consolidation and special effects
1
Roadshow Presentation – June 2018
EDMR - Equity and Debt Market Relations
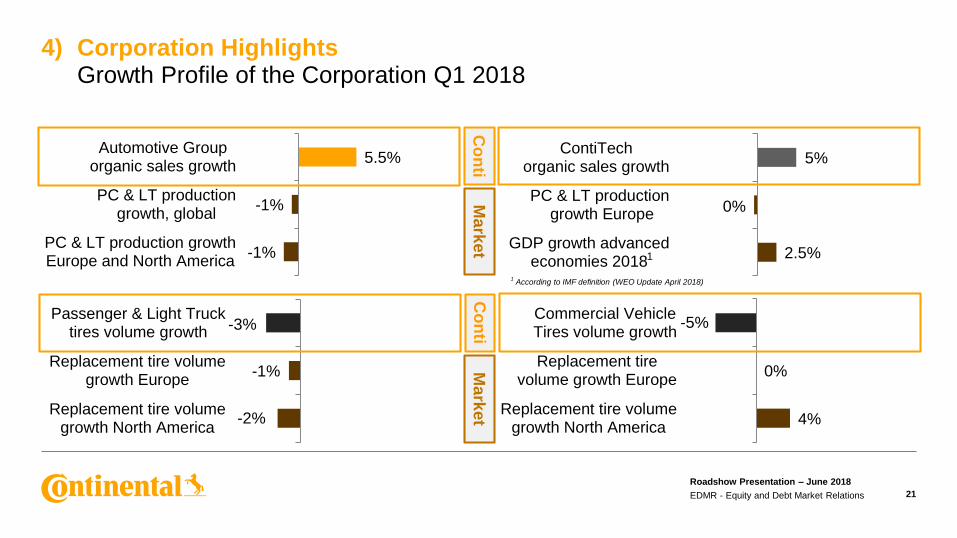
-1%
-1%
5.5%
PC & LT production growthEurope and North America
PC & LT productiongrowth, global
Automotive Grouporganic sales growth
2.5%
0%
5%
GDP growth advancedeconomies 2018
PC & LT production growth Europe
ContiTechorganic sales growth
4%
0%
-5%
Replacement tire volumegrowth North America
Replacement tirevolume growth Europe
Commercial VehicleTires volume growth
-2%
-1%
-3%
Replacement tire volumegrowth North America
Replacement tire volumegrowth Europe
Passenger & Light Trucktires volume growth
4) Corporation Highlights Growth Profile of the Corporation Q1 2018
21
Mark
et
1According to IMF definition (WEO Update April 2018)
1
Co
nti
Mark
et
Co
nti
Roadshow Presentation – June 2018
EDMR - Equity and Debt Market Relations
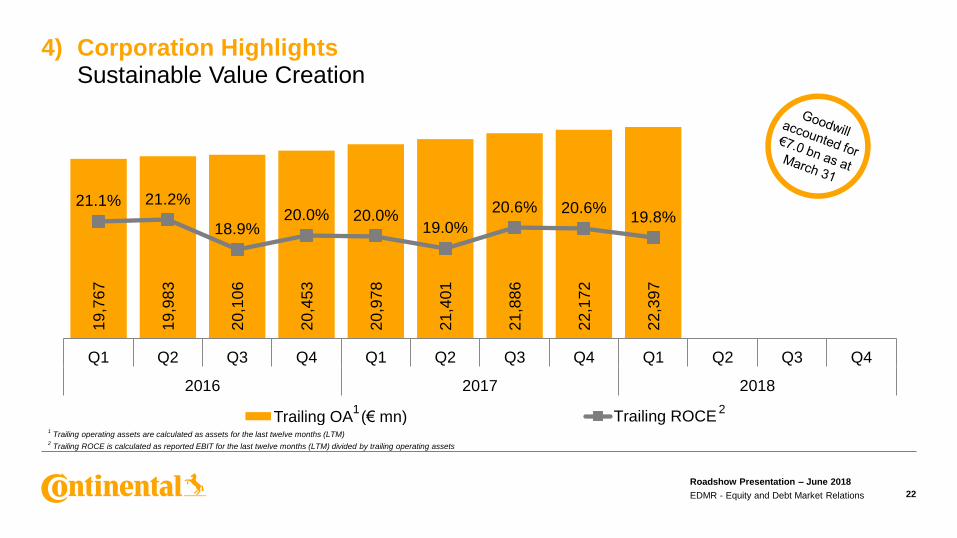
19
,76
7
19
,98
3
20
,10
6
20
,45
3
20
,97
8
21
,40
1
21
,88
6
22
,17
2
22
,39
7
21.1% 21.2%
18.9%20.0% 20.0%
19.0%
20.6% 20.6%19.8%
Q1 Q2 Q3 Q4 Q1 Q2 Q3 Q4 Q1 Q2 Q3 Q4
2016 2017 2018
Trailing OA (€ mn) Trailing ROCE
4) Corporation Highlights Sustainable Value Creation
22
1Trailing operating assets are calculated as assets for the last twelve months (LTM)
2Trailing ROCE is calculated as reported EBIT for the last twelve months (LTM) divided by trailing operating assets
1 2
Roadshow Presentation – June 2018
EDMR - Equity and Debt Market Relations
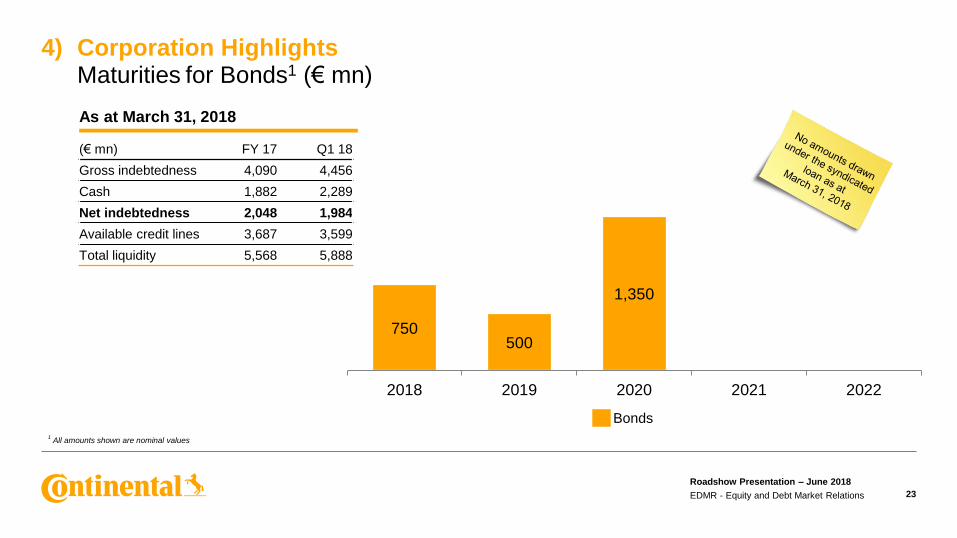
750500
1,350
2018 2019 2020 2021 2022
4) Corporation Highlights Maturities for Bonds1 (€ mn)
23
Bonds1
All amounts shown are nominal values
Roadshow Presentation – June 2018
EDMR - Equity and Debt Market Relations
As at March 31, 2018
(€ mn) FY 17 Q1 18
Gross indebtedness 4,090 4,456
Cash 1,882 2,289
Net indebtedness 2,048 1,984
Available credit lines 3,687 3,599
Total liquidity 5,568 5,888
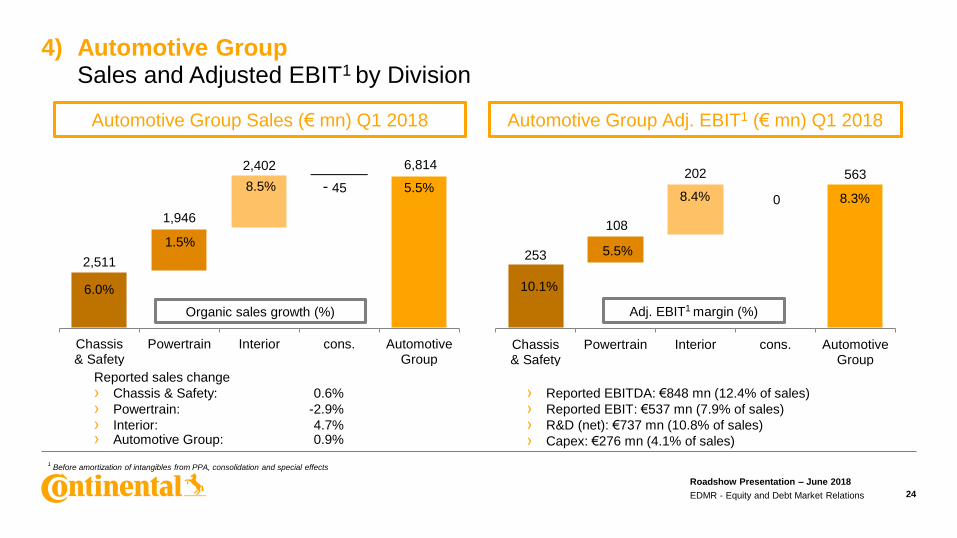
2,511
1,946
2,402
45
6,814
Chassis& Safety
Powertrain Interior cons. AutomotiveGroup
1.5%
8.5% 5.5%
6.0%
Organic sales growth (%)
253
108
202
0
563
Chassis& Safety
Powertrain Interior cons. AutomotiveGroup
10.1%
5.5%
8.4% 8.3%
Adj. EBIT margin (%)
4) Automotive GroupSales and Adjusted EBIT1 by Division
24
-
1Before amortization of intangibles from PPA, consolidation and special effects
Reported sales change
› Chassis & Safety: 0.6%
› Powertrain: -2.9%
› Interior: 4.7% › Automotive Group: 0.9%
1
› Reported EBITDA: €848 mn (12.4% of sales)
› Reported EBIT: €537 mn (7.9% of sales)
› R&D (net): €737 mn (10.8% of sales)
› Capex: €276 mn (4.1% of sales)
Automotive Group Sales (€ mn) Q1 2018 Automotive Group Adj. EBIT1 (€ mn) Q1 2018
Roadshow Presentation – June 2018
EDMR - Equity and Debt Market Relations
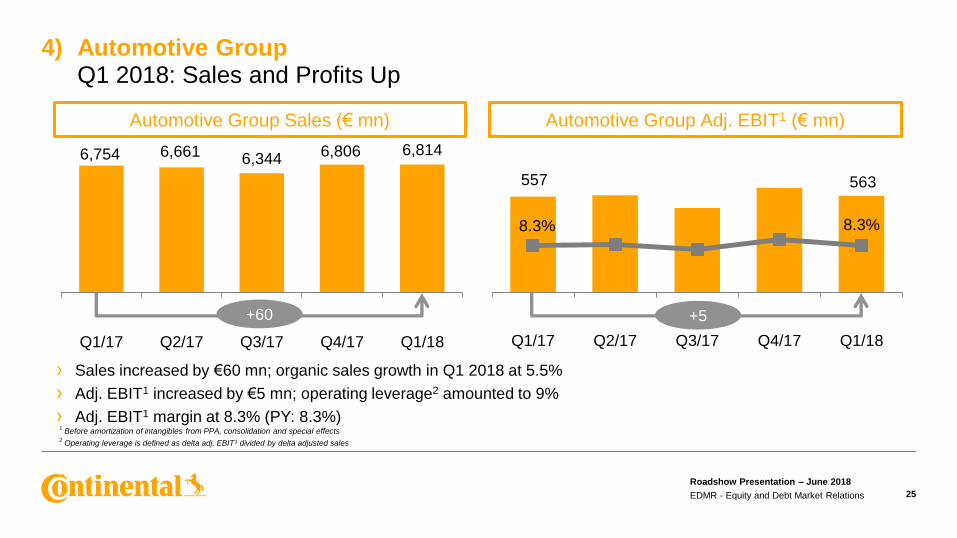
557 563
8.3% 8.3%
Q1/17 Q2/17 Q3/17 Q4/17 Q1/18
6,754 6,661 6,3446,806 6,814
Q1/17 Q2/17 Q3/17 Q4/17 Q1/18
4) Automotive GroupQ1 2018: Sales and Profits Up
25
+60 +5
1Before amortization of intangibles from PPA, consolidation and special effects
2Operating leverage is defined as delta adj. EBIT1 divided by delta adjusted sales
› Sales increased by €60 mn; organic sales growth in Q1 2018 at 5.5%
› Adj. EBIT1 increased by €5 mn; operating leverage2 amounted to 9%
› Adj. EBIT1 margin at 8.3% (PY: 8.3%)
Automotive Group Sales (€ mn) Automotive Group Adj. EBIT1 (€ mn)
Roadshow Presentation – June 2018
EDMR - Equity and Debt Market Relations
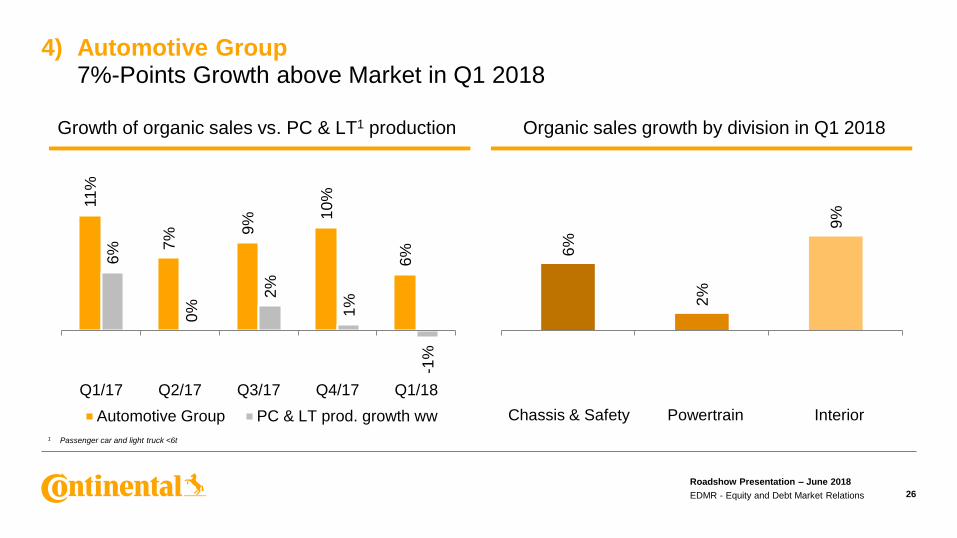
11
%
7% 9
% 10
%
6%6%
0%
2%
1%
-1%
Q1/17 Q2/17 Q3/17 Q4/17 Q1/18
Automotive Group PC & LT prod. growth ww
6%
2%
9%
Q1/14 Q2/14 Q3/14
4) Automotive Group 7%-Points Growth above Market in Q1 2018
26
1 Passenger car and light truck <6t
Growth of organic sales vs. PC & LT1 production Organic sales growth by division in Q1 2018
Chassis & Safety Powertrain Interior
Roadshow Presentation – June 2018
EDMR - Equity and Debt Market Relations
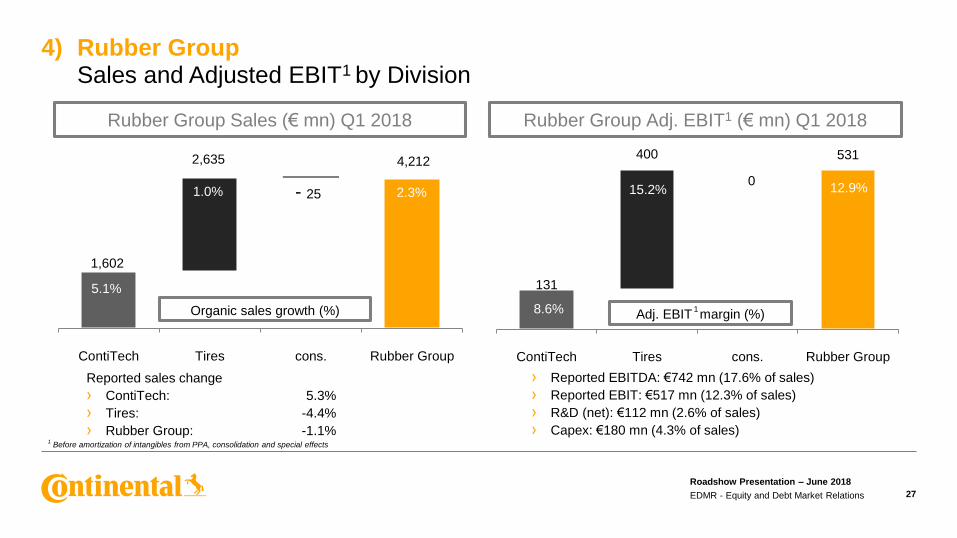
1,602
2,635
25
4,212
ContiTech Tires cons. Rubber Group
5.1%
1.0% 2.3%
Organic sales growth (%)
131
400
0
531
ContiTech Tires cons. Rubber Group
8.6%
15.2% 12.9%
Adj. EBIT margin (%)
4) Rubber Group Sales and Adjusted EBIT1 by Division
27
Reported sales change
› ContiTech: 5.3%
› Tires: -4.4%
› Rubber Group: -1.1%
› Reported EBITDA: €742 mn (17.6% of sales)
› Reported EBIT: €517 mn (12.3% of sales)
› R&D (net): €112 mn (2.6% of sales)
› Capex: €180 mn (4.3% of sales) 1
Before amortization of intangibles from PPA, consolidation and special effects
-
1
Rubber Group Sales (€ mn) Q1 2018 Rubber Group Adj. EBIT1 (€ mn) Q1 2018
Roadshow Presentation – June 2018
EDMR - Equity and Debt Market Relations
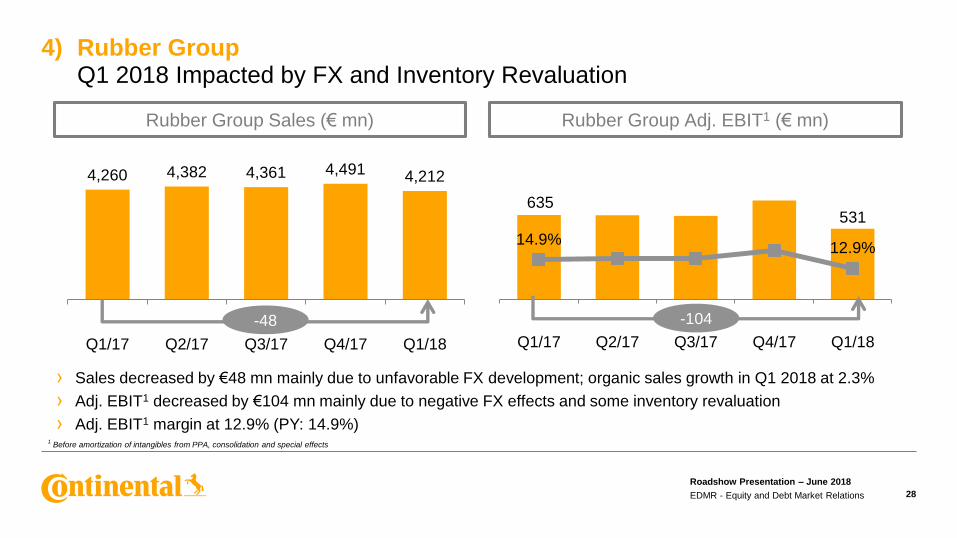
635531
14.9%12.9%
Q1/17 Q2/17 Q3/17 Q4/17 Q1/18
4,260 4,382 4,361 4,491 4,212
Q1/17 Q2/17 Q3/17 Q4/17 Q1/18
4) Rubber GroupQ1 2018 Impacted by FX and Inventory Revaluation
28
› Sales decreased by €48 mn mainly due to unfavorable FX development; organic sales growth in Q1 2018 at 2.3%
› Adj. EBIT1 decreased by €104 mn mainly due to negative FX effects and some inventory revaluation
› Adj. EBIT1 margin at 12.9% (PY: 14.9%)1
Before amortization of intangibles from PPA, consolidation and special effects
Rubber Group Sales (€ mn) Rubber Group Adj. EBIT1 (€ mn)
-48 -104
Roadshow Presentation – June 2018
EDMR - Equity and Debt Market Relations
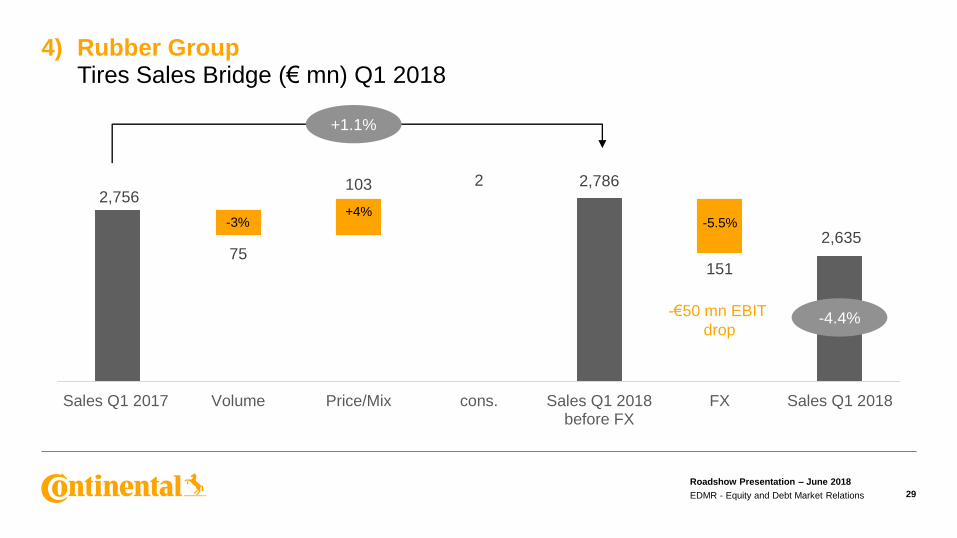
2,756
75
103 2 2,786
151
2,635
Sales Q1 2017 Volume Price/Mix cons. Sales Q1 2018before FX
FX Sales Q1 2018
4) Rubber GroupTires Sales Bridge (€ mn) Q1 2018
29
Roadshow Presentation – June 2018
EDMR - Equity and Debt Market Relations
-3%+4%
-5.5%
+1.1%
-4.4%-€50 mn EBIT
drop
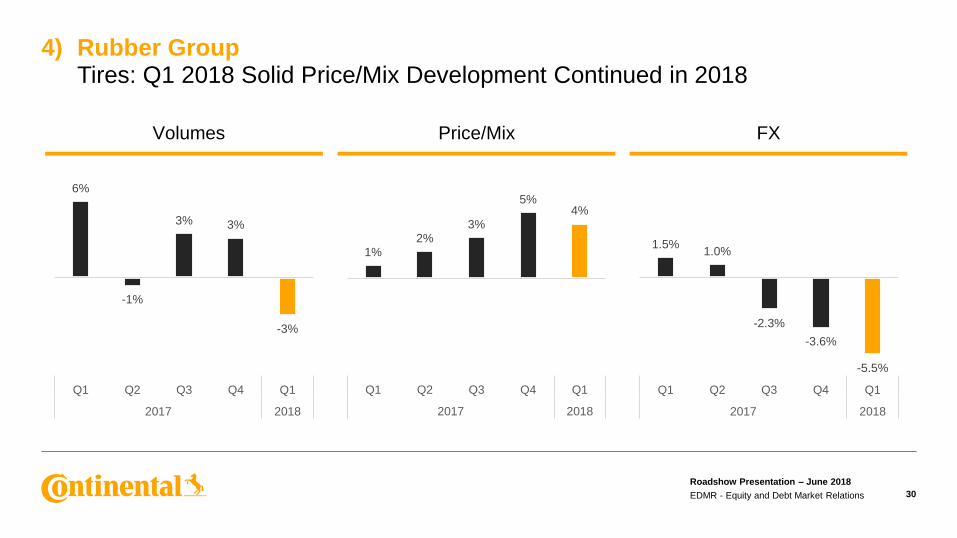
4) Rubber GroupTires: Q1 2018 Solid Price/Mix Development Continued in 2018
30
Roadshow Presentation – June 2018
EDMR - Equity and Debt Market Relations
Volumes Price/Mix FX
1%2%
3%
5%4%
Q1 Q2 Q3 Q4 Q1
2017 2018
6%
-1%
3% 3%
-3%
Q1 Q2 Q3 Q4 Q1
2017 2018
1.5%1.0%
-2.3%
-3.6%
-5.5%
Q1 Q2 Q3 Q4 Q1
2017 2018

14
7
16
0
16
2
17
0
13
3
15
5
15
5
16
3
0
100
200
300
Q1/1
3
Q2/1
3
Q3
/13
Q4/1
3
Q1/1
4
Q2/1
4
Q3/1
4
Q4
/14
Q1/1
5
Q2/1
5
Q3/1
5
Q4/1
5
Q1/1
6
Q2/1
6
Q3/1
6
Q4/1
6
Q1/1
7
Q2/1
7
Q3/1
7
Q4/1
7
Q1/1
8
Q2/1
8E
Q3/1
8E
Q4/1
8E
TSR 20 (U.S. cents/kg) Butadiene (U.S. cents/kg)
4) Rubber GroupExpected Raw Material Price Development in 2018
31
› Natural rubber price (TSR 20) is expected
to decline by 4%
› Synthetic rubber price (butadiene
feedstock) is forecast to stay stable
› Prices for carbon black and chemicals are
forecast to rise by at least 10%
› Based on these assumptions,
costs of raw materials are expected to
have limited impact in 2018
1Source: Bloomberg and Continental estimates for 2018
Average (Y)
TSR 20: 251
Butadiene: 148
Average (Y)
TSR 20: 172
Butadiene: 132
Average (Y)
TSR 20: 137
Butadiene: 90
Average (Y)
TSR 20: 138
Butadiene: 113
Average (Y)
TSR 20: 167
Butadiene: 151
Average (Y)
TSR 20: 160
Butadiene: 151
Roadshow Presentation – June 2018
EDMR - Equity and Debt Market Relations
Raw material price development1 2013 - 2018E (U.S. cents/kg)
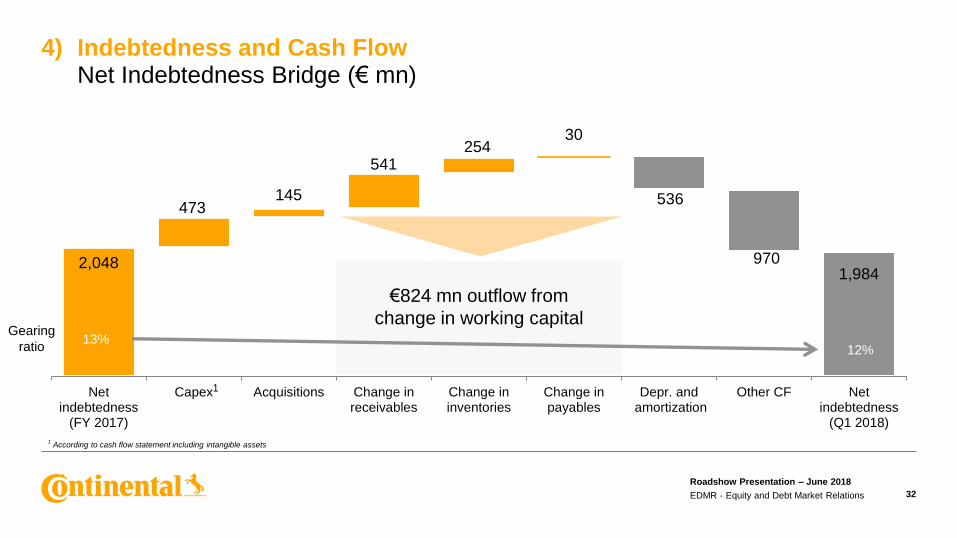
2,048
473145
541254
30
536
9701,984
Netindebtedness
(FY 2017)
Capex Acquisitions Change inreceivables
Change ininventories
Change inpayables
Depr. and amortization
Other CF Netindebtedness
(Q1 2018)
4) Indebtedness and Cash Flow Net Indebtedness Bridge (€ mn)
32
1According to cash flow statement including intangible assets
€824 mn outflow from
change in working capital
1
Gearing
ratio13%
12%
Roadshow Presentation – June 2018
EDMR - Equity and Debt Market Relations

86
4
-73
1
13
3
-50
1
36
463
4
-59
3
41
-44
8
18
6
Cash flow fromoperating activities
Cash flow usedfor investing activities
Free cash flow
2017 2017 before acquisitions 2018 2018 before acquisitions
4) Indebtedness and Cash Flow Free Cash Flow Before Acquisitions (€ mn) in Q1 2018
33
+52
-178-230
Roadshow Presentation – June 2018
EDMR - Equity and Debt Market Relations

4) Indebtedness and Cash Flow Net Indebtedness and Gearing Ratio
34
Roadshow Presentation – June 2018
EDMR - Equity and Debt Market Relations
2,824
3,542
2,798 2,768
3,469 3,298
2,048 1,98426% 27%19% 18%
23% 21%13% 12%
YE YE YE Q1 H1 9M YE Q1
2014 2015 2016 2017 2018
Net indebtedness (€ mn) Gearing ratio
6.3
93
6.0
59
6.3
02
8.3
09
6.8
39
6.0
96
6.4
87
8.3
61
6.6
56
6.3
90
6.5
90
8.3
11
7% 6%
30%16%
7%
1% 3%
1% -3%
5%2% -1%
Q1
/16
Q2
/16
Q3
/16
Q4
/16
Q1/1
7
Q2
/17
Q3
/17
Q4
/17
Q1
/18
E
Q2
/18
E
Q3/1
8E
Q4
/18
E
China chg YOY
4.4
56
4.6
01
4.4
09
4.3
60
4.5
28
4.4
57
3.9
70
4.1
09
4.4
04
4.5
05
3.9
60
3.9
60
4%2% 1% 0% 2%
-3%
-10%-6%
-3%
1%
0%-4%
Q1
/16
Q2
/16
Q3
/16
Q4
/16
Q1
/17
Q2
/17
Q3
/17
Q4
/17
Q1
/18
E
Q2
/18
E
Q3
/18
E
Q4
/18
E
North America chg YOY
5.5
09
5.8
79
4.7
19
5.3
36
5.8
31
5.6
93
4.8
82
5.6
50
5.8
05
5.9
73
5.0
30
5.7
01
2%
9%
-1%
3%6%
-3%
3%6%
0%
5% 3% 1%
Q1/1
6
Q2/1
6
Q3
/16
Q4
/16
Q1
/17
Q2
/17
Q3
/17
Q4/1
7
Q1
/18
E
Q2
/18
E
Q3
/18
E
Q4
/18
E
Europe chg YOY
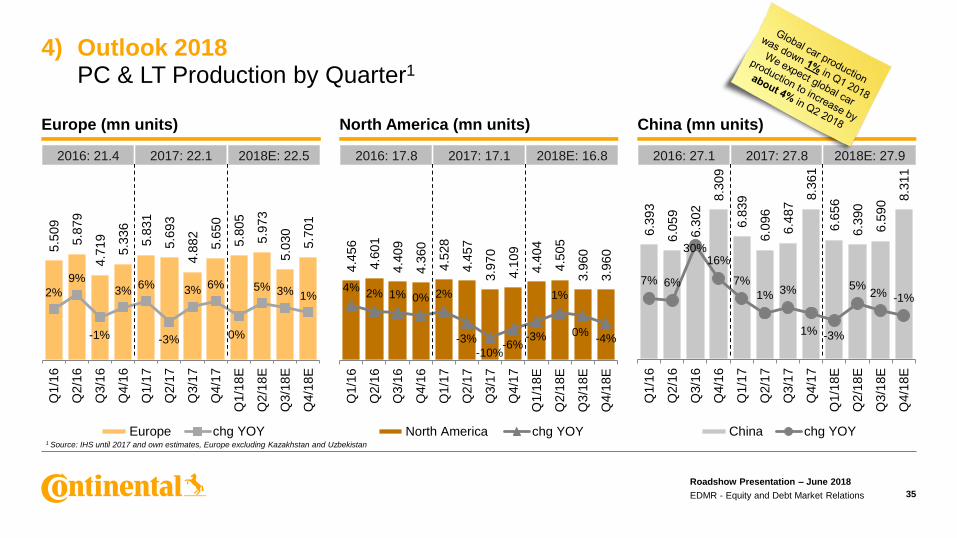
4) Outlook 2018PC & LT Production by Quarter1
35
North America (mn units)Europe (mn units) China (mn units)
2016: 21.4 2017: 22.1 2018E: 22.5 2016: 17.8 2017: 17.1 2018E: 16.8 2016: 27.1 2017: 27.8 2018E: 27.9
1 Source: IHS until 2017 and own estimates, Europe excluding Kazakhstan and Uzbekistan
Roadshow Presentation – June 2018
EDMR - Equity and Debt Market Relations
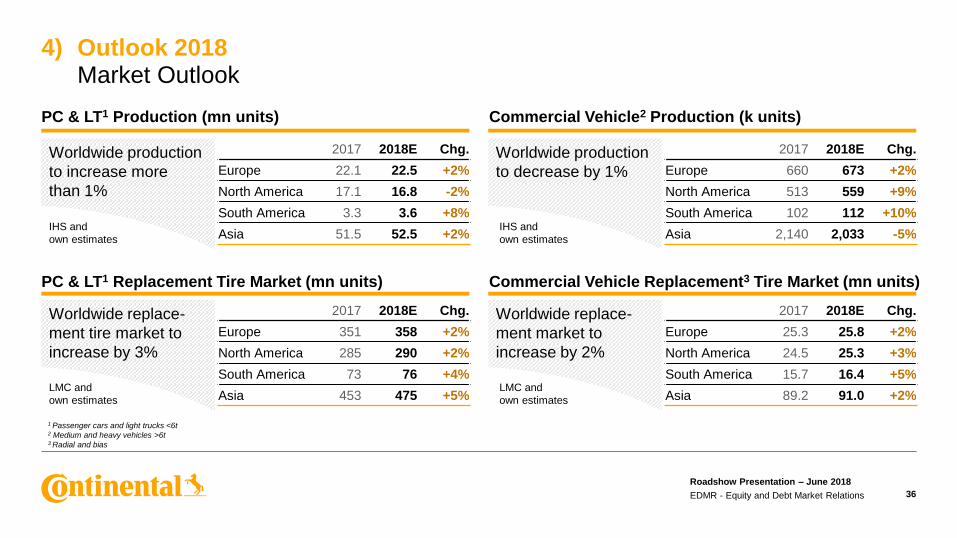
4) Outlook 2018Market Outlook
36
Commercial Vehicle2 Production (k units)
Commercial Vehicle Replacement3 Tire Market (mn units)
PC & LT1 Production (mn units)
PC & LT1 Replacement Tire Market (mn units)
Worldwide production
to increase more
than 1%
Worldwide production
to decrease by 1%
Worldwide replace-
ment tire market to
increase by 3%
Worldwide replace-
ment market to
increase by 2%
IHS and
own estimates
LMC and
own estimates
IHS and
own estimates
LMC and
own estimates
2017 2018E Chg.
Europe 22.1 22.5 +2%
North America 17.1 16.8 -2%
South America 3.3 3.6 +8%
Asia 51.5 52.5 +2%
2017 2018E Chg.
Europe 660 673 +2%
North America 513 559 +9%
South America 102 112 +10%
Asia 2,140 2,033 -5%
2017 2018E Chg.
Europe 351 358 +2%
North America 285 290 +2%
South America 73 76 +4%
Asia 453 475 +5%
2017 2018E Chg.
Europe 25.3 25.8 +2%
North America 24.5 25.3 +3%
South America 15.7 16.4 +5%
Asia 89.2 91.0 +2%
1 Passenger cars and light trucks <6t2 Medium and heavy vehicles >6t3 Radial and bias
Roadshow Presentation – June 2018
EDMR - Equity and Debt Market Relations
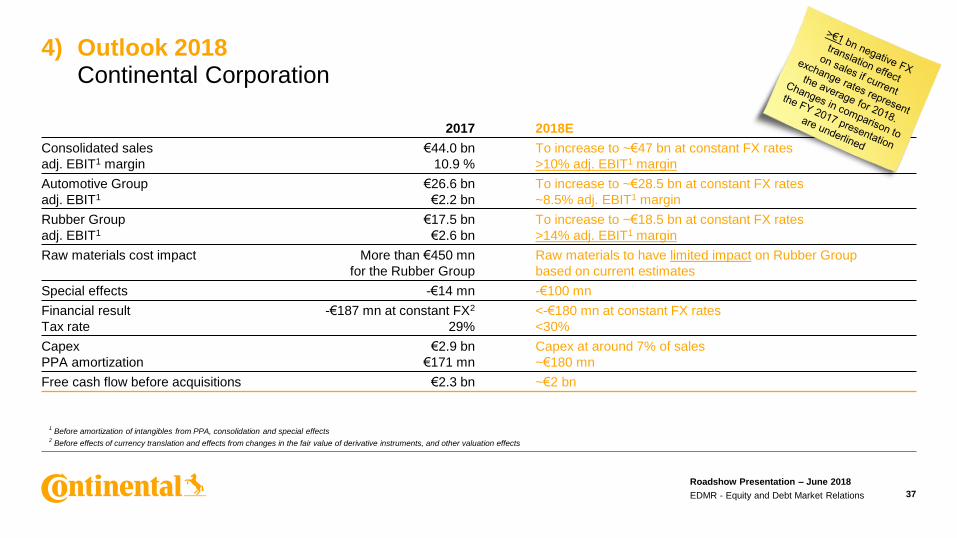
4) Outlook 2018Continental Corporation
37
2017 2018E
Consolidated sales
adj. EBIT1 margin
€44.0 bn
10.9 %
To increase to ~€47 bn at constant FX rates
>10% adj. EBIT1 margin
Automotive Group
adj. EBIT1
€26.6 bn
€2.2 bn
To increase to ~€28.5 bn at constant FX rates
~8.5% adj. EBIT1 margin
Rubber Group
adj. EBIT1
€17.5 bn
€2.6 bn
To increase to ~€18.5 bn at constant FX rates
>14% adj. EBIT1 margin
Raw materials cost impact More than €450 mn
for the Rubber Group
Raw materials to have limited impact on Rubber Group
based on current estimates
Special effects -€14 mn -€100 mn
Financial result
Tax rate
-€187 mn at constant FX2
29%
<-€180 mn at constant FX rates
<30%
Capex
PPA amortization
€2.9 bn
€171 mn
Capex at around 7% of sales
~€180 mn
Free cash flow before acquisitions €2.3 bn ~€2 bn
1Before amortization of intangibles from PPA, consolidation and special effects
2Before effects of currency translation and effects from changes in the fair value of derivative instruments, and other valuation effects
Roadshow Presentation – June 2018
EDMR - Equity and Debt Market Relations

38
39
Disclaimer
› This presentation has been prepared by Continental Aktiengesellschaft solely in connection with the Analyst and Investor Call on May 8, 2018, and the subsequent road shows in
Europe, North America, Asia and Australia. It has not been independently verified. It does not constitute an offer, invitation or recommendation to purchase or subscribe for any
shares or other securities issued by Continental AG or any subsidiary and neither shall any part of it form the basis of, or be relied upon in connection with, any contract or
commitment concerning the purchase or sale of such shares or other securities whatsoever.
› Neither Continental Aktiengesellschaft nor any of its affiliates, advisors or representatives shall have any liability whatsoever (in negligence or otherwise) for any loss that may arise
from any use of this presentation or its contents or otherwise arising in connection with this presentation.
› This presentation includes assumptions, estimates, forecasts and other forward-looking statements, including statements about our beliefs and expectations regarding future
developments as well as their effect on the results of Continental. These statements are based on plans, estimates and projections as they are currently available to the
management of Continental. Therefore, these statements speak only as of the date they are made, and we undertake no obligation to update publicly any of them in light of new
information or future events. Furthermore, although the management is of the opinion that these statements, and their underlying beliefs and expectations, are realistic as of the date
they are made, no guarantee can be given that the expected developments and effects will actually occur. Many factors may cause the actual development to be materially different
from the expectations expressed here. Such factors include, for example and without limitation, changes in general economic and business conditions, fluctuations in currency
exchange rates or interest rates, the introduction of competing products, the lack of acceptance for new products or services and changes in business strategy.
› All statements with regard to markets or market position(s) of Continental or any of its competitors are estimates of Continental based on data available to Continental. Such data are
neither comprehensive nor independently verified. Consequently, the data used are not adequate for and the statements based on such data are not meant to be an accurate or
proper definition of regional and/or product markets or market shares of Continental and any of the participants in any market.
› Unless otherwise stated, all amounts are shown in millions of euro. Please note that differences may arise as a result of the use of rounded amounts and percentages.
› Note: Due to the application of the modified retrospective approach during first time adoption of IFRS 9, Financial Instruments, and IFRS 15, Revenues from Contracts with
Customers, as at January 1, 2018, all the figures from comparative periods are shown unadjusted.
Roadshow Presentation – June 2018
EDMR - Equity and Debt Market Relations
40
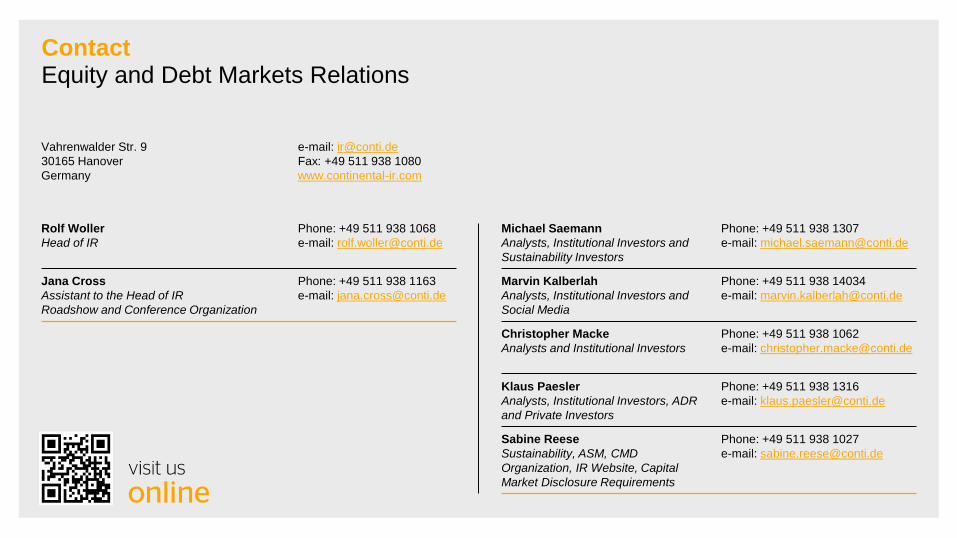
ContactEquity and Debt Markets Relations
Vahrenwalder Str. 9
30165 Hanover
Germany
e-mail: [email protected]
Fax: +49 511 938 1080
www.continental-ir.com
Michael Saemann
Analysts, Institutional Investors and
Sustainability Investors
Phone: +49 511 938 1307
e-mail: [email protected]
Marvin Kalberlah
Analysts, Institutional Investors and
Social Media
Phone: +49 511 938 14034
e-mail: [email protected]
Christopher Macke
Analysts and Institutional Investors
Phone: +49 511 938 1062
e-mail: [email protected]
Klaus Paesler
Analysts, Institutional Investors, ADR
and Private Investors
Phone: +49 511 938 1316
e-mail: [email protected]
Sabine Reese
Sustainability, ASM, CMD
Organization, IR Website, Capital
Market Disclosure Requirements
Phone: +49 511 938 1027
e-mail: [email protected]
Rolf Woller
Head of IR
Phone: +49 511 938 1068
e-mail: [email protected]
Jana Cross
Assistant to the Head of IR
Roadshow and Conference Organization
Phone: +49 511 938 1163
e-mail: [email protected]
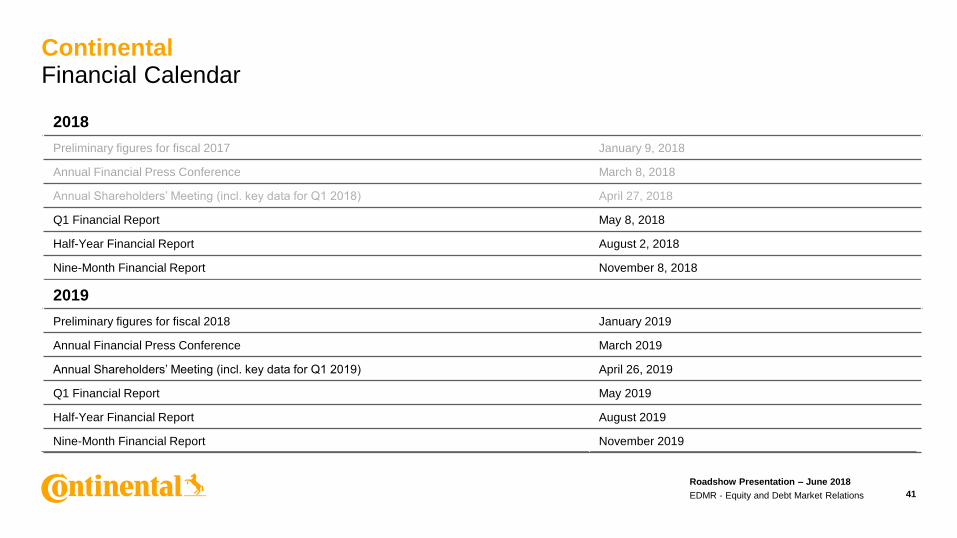
ContinentalFinancial Calendar
41
2018
Preliminary figures for fiscal 2017 January 9, 2018
Annual Financial Press Conference March 8, 2018
Annual Shareholders’ Meeting (incl. key data for Q1 2018) April 27, 2018
Q1 Financial Report May 8, 2018
Half-Year Financial Report August 2, 2018
Nine-Month Financial Report November 8, 2018
2019
Preliminary figures for fiscal 2018 January 2019
Annual Financial Press Conference March 2019
Annual Shareholders’ Meeting (incl. key data for Q1 2019) April 26, 2019
Q1 Financial Report May 2019
Half-Year Financial Report August 2019
Nine-Month Financial Report November 2019
Roadshow Presentation – June 2018
EDMR - Equity and Debt Market Relations
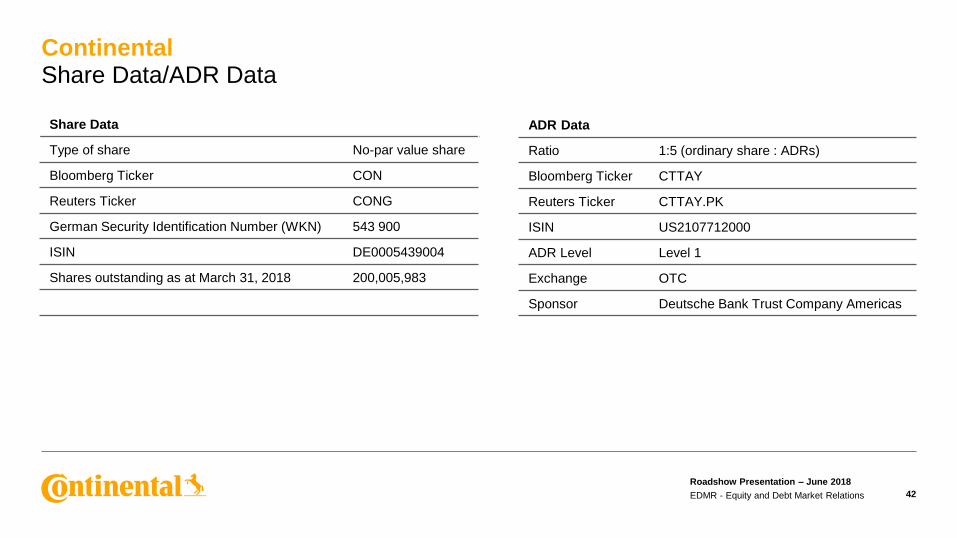
ContinentalShare Data/ADR Data
42
Share Data
Type of share No-par value share
Bloomberg Ticker CON
Reuters Ticker CONG
German Security Identification Number (WKN) 543 900
ISIN DE0005439004
Shares outstanding as at March 31, 2018 200,005,983
ADR Data
Ratio 1:5 (ordinary share : ADRs)
Bloomberg Ticker CTTAY
Reuters Ticker CTTAY.PK
ISIN US2107712000
ADR Level Level 1
Exchange OTC
Sponsor Deutsche Bank Trust Company Americas
Roadshow Presentation – June 2018
EDMR - Equity and Debt Market Relations
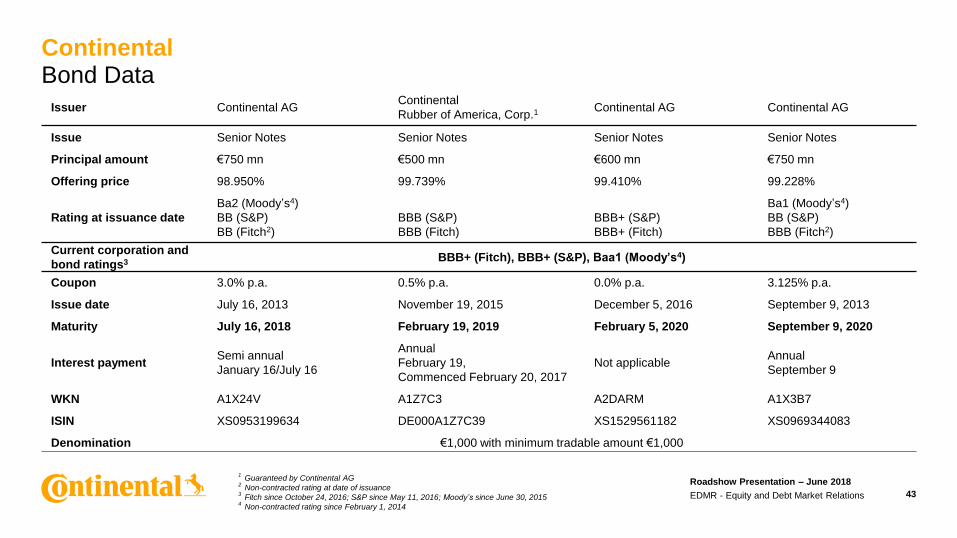
ContinentalBond Data
43
Issuer Continental AGContinental
Rubber of America, Corp.1Continental AG Continental AG
Issue Senior Notes Senior Notes Senior Notes Senior Notes
Principal amount €750 mn €500 mn €600 mn €750 mn
Offering price 98.950% 99.739% 99.410% 99.228%
Rating at issuance date
Ba2 (Moody’s4)
BB (S&P)
BB (Fitch2)
BBB (S&P)
BBB (Fitch)
BBB+ (S&P)
BBB+ (Fitch)
Ba1 (Moody’s4)
BB (S&P)
BBB (Fitch2)
Current corporation and
bond ratings3 BBB+ (Fitch), BBB+ (S&P), Baa1 (Moody’s4)
Coupon 3.0% p.a. 0.5% p.a. 0.0% p.a. 3.125% p.a.
Issue date July 16, 2013 November 19, 2015 December 5, 2016 September 9, 2013
Maturity July 16, 2018 February 19, 2019 February 5, 2020 September 9, 2020
Interest paymentSemi annual
January 16/July 16
Annual
February 19,
Commenced February 20, 2017
Not applicableAnnual
September 9
WKN A1X24V A1Z7C3 A2DARM A1X3B7
ISIN XS0953199634 DE000A1Z7C39 XS1529561182 XS0969344083
Denomination €1,000 with minimum tradable amount €1,000
1Guaranteed by Continental AG
2Non-contracted rating at date of issuance
3Fitch since October 24, 2016; S&P since May 11, 2016; Moodyʼs since June 30, 2015
4Non-contracted rating since February 1, 2014
Roadshow Presentation – June 2018
EDMR - Equity and Debt Market Relations
44
Back-up
Roadshow Presentation – June 2018
EDMR - Equity and Debt Market Relations
5) Back-upCorporation Highlights Q1 2018
45
1Before amortization of intangibles from PPA, consolidation and special effects
2Amortization of intangibles from PPA, tax rate of 28% applied for EPS calculation
3Attributable to the shareholders of the parent
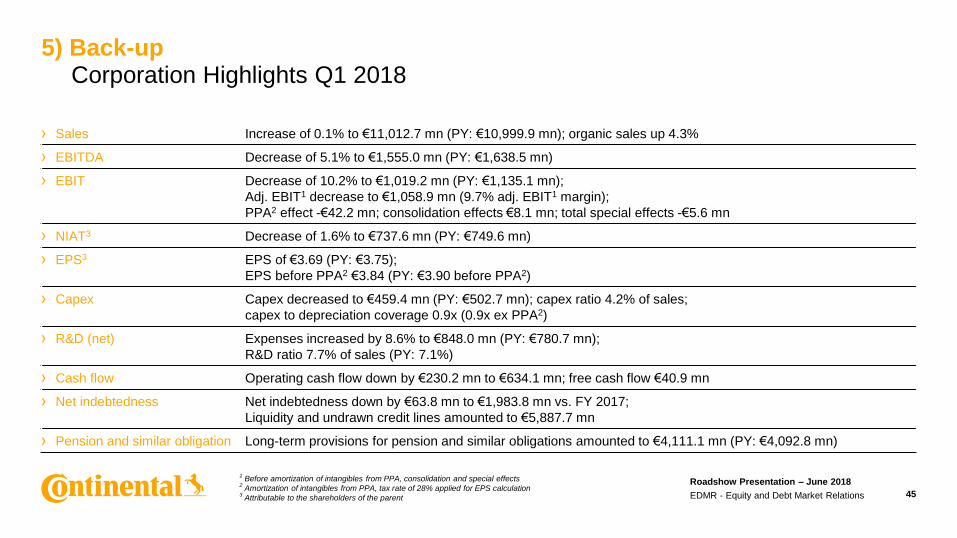
› Sales Increase of 0.1% to €11,012.7 mn (PY: €10,999.9 mn); organic sales up 4.3%
› EBITDA Decrease of 5.1% to €1,555.0 mn (PY: €1,638.5 mn)
› EBIT Decrease of 10.2% to €1,019.2 mn (PY: €1,135.1 mn);
Adj. EBIT1 decrease to €1,058.9 mn (9.7% adj. EBIT1 margin);
PPA2 effect -€42.2 mn; consolidation effects €8.1 mn; total special effects -€5.6 mn
› NIAT3 Decrease of 1.6% to €737.6 mn (PY: €749.6 mn)
› EPS3 EPS of €3.69 (PY: €3.75);
EPS before PPA2 €3.84 (PY: €3.90 before PPA2)
› Capex Capex decreased to €459.4 mn (PY: €502.7 mn); capex ratio 4.2% of sales;
capex to depreciation coverage 0.9x (0.9x ex PPA2)
› R&D (net) Expenses increased by 8.6% to €848.0 mn (PY: €780.7 mn);
R&D ratio 7.7% of sales (PY: 7.1%)
› Cash flow Operating cash flow down by €230.2 mn to €634.1 mn; free cash flow €40.9 mn
› Net indebtedness Net indebtedness down by €63.8 mn to €1,983.8 mn vs. FY 2017;
Liquidity and undrawn credit lines amounted to €5,887.7 mn
› Pension and similar obligation Long-term provisions for pension and similar obligations amounted to €4,111.1 mn (PY: €4,092.8 mn)
Roadshow Presentation – June 2018
EDMR - Equity and Debt Market Relations
5) Back-upOverview of Volume Development
46
Roadshow Presentation – June 2018
EDMR - Equity and Debt Market Relations
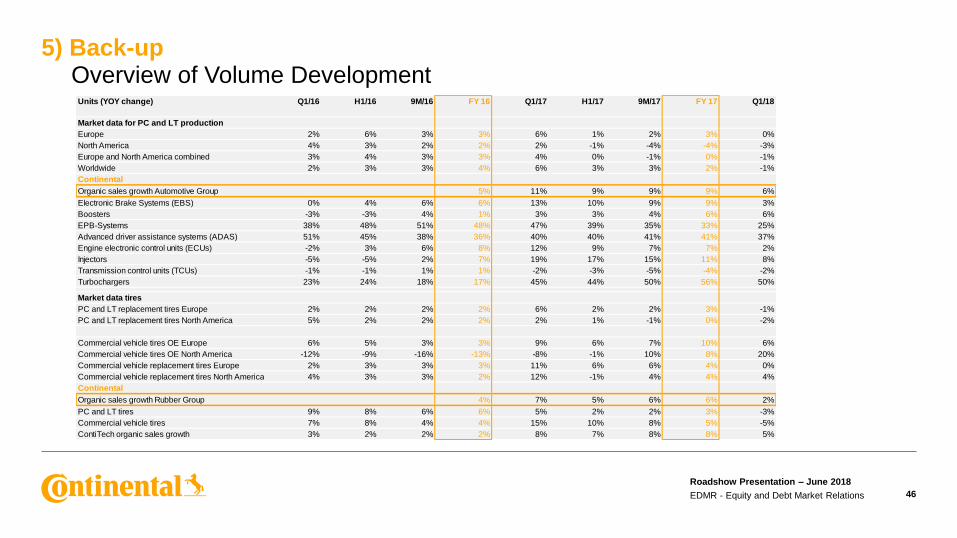
Units (YOY change) Q1/16 H1/16 9M/16 FY 16 Q1/17 H1/17 9M/17 FY 17 Q1/18
Market data for PC and LT production
Europe 2% 6% 3% 3% 6% 1% 2% 3% 0%
North America 4% 3% 2% 2% 2% -1% -4% -4% -3%
Europe and North America combined 3% 4% 3% 3% 4% 0% -1% 0% -1%
Worldwide 2% 3% 3% 4% 6% 3% 3% 2% -1%
Continental
Organic sales growth Automotive Group 5% 11% 9% 9% 9% 6%
Electronic Brake Systems (EBS) 0% 4% 6% 6% 13% 10% 9% 9% 3%
Boosters -3% -3% 4% 1% 3% 3% 4% 6% 6%
EPB-Systems 38% 48% 51% 48% 47% 39% 35% 33% 25%
Advanced driver assistance systems (ADAS) 51% 45% 38% 36% 40% 40% 41% 41% 37%
Engine electronic control units (ECUs) -2% 3% 6% 8% 12% 9% 7% 7% 2%
Injectors -5% -5% 2% 7% 19% 17% 15% 11% 8%
Transmission control units (TCUs) -1% -1% 1% 1% -2% -3% -5% -4% -2%
Turbochargers 23% 24% 18% 17% 45% 44% 50% 56% 50%
Market data tires
PC and LT replacement tires Europe 2% 2% 2% 2% 6% 2% 2% 3% -1%
PC and LT replacement tires North America 5% 2% 2% 2% 2% 1% -1% 0% -2%
Commercial vehicle tires OE Europe 6% 5% 3% 3% 9% 6% 7% 10% 6%
Commercial vehicle tires OE North America -12% -9% -16% -13% -8% -1% 10% 8% 20%
Commercial vehicle replacement tires Europe 2% 3% 3% 3% 11% 6% 6% 4% 0%
Commercial vehicle replacement tires North America 4% 3% 3% 2% 12% -1% 4% 4% 4%
Continental
Organic sales growth Rubber Group 4% 7% 5% 6% 6% 2%
PC and LT tires 9% 8% 6% 6% 5% 2% 2% 3% -3%
Commercial vehicle tires 7% 8% 4% 4% 15% 10% 8% 5% -5%
ContiTech organic sales growth 3% 2% 2% 2% 8% 7% 8% 8% 5%
5) Back-upKey Historical Credit Metrics
47
Roadshow Presentation – June 2018
EDMR - Equity and Debt Market Relations
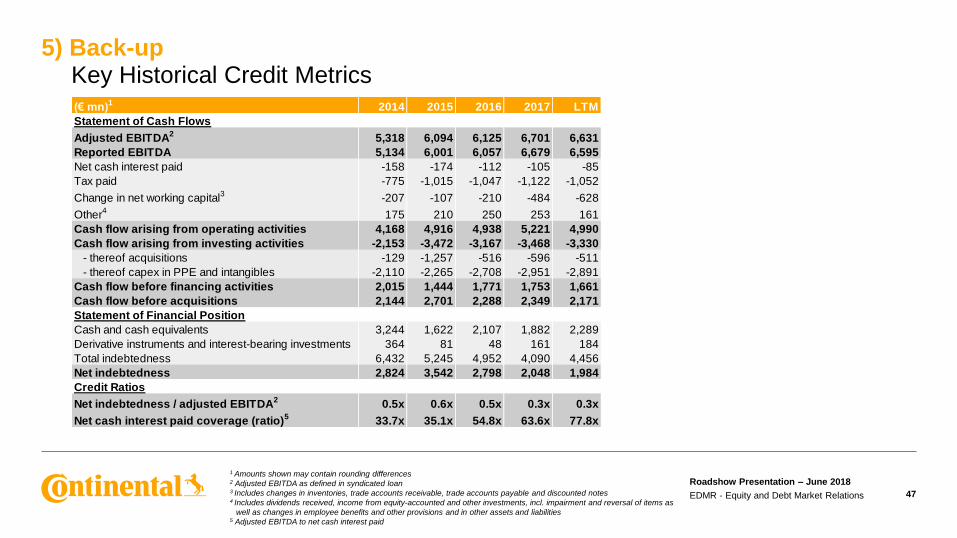
(€ mn)1
2014 2015 2016 2017 LTM
Statement of Cash Flows
Adjusted EBITDA2
5,318 6,094 6,125 6,701 6,631
Reported EBITDA 5,134 6,001 6,057 6,679 6,595
Net cash interest paid -158 -174 -112 -105 -85
Tax paid -775 -1,015 -1,047 -1,122 -1,052
Change in net working capital3
-207 -107 -210 -484 -628
Other4
175 210 250 253 161
Cash flow arising from operating activities 4,168 4,916 4,938 5,221 4,990
Cash flow arising from investing activities -2,153 -3,472 -3,167 -3,468 -3,330
- thereof acquisitions -129 -1,257 -516 -596 -511
- thereof capex in PPE and intangibles -2,110 -2,265 -2,708 -2,951 -2,891
Cash flow before financing activities 2,015 1,444 1,771 1,753 1,661
Cash flow before acquisitions 2,144 2,701 2,288 2,349 2,171
Statement of Financial Position
Cash and cash equivalents 3,244 1,622 2,107 1,882 2,289
Derivative instruments and interest-bearing investments 364 81 48 161 184
Total indebtedness 6,432 5,245 4,952 4,090 4,456
Net indebtedness 2,824 3,542 2,798 2,048 1,984
Credit Ratios
Net indebtedness / adjusted EBITDA2
0.5x 0.6x 0.5x 0.3x 0.3x
Net cash interest paid coverage (ratio)5
33.7x 35.1x 54.8x 63.6x 77.8x
1 Amounts shown may contain rounding differences2 Adjusted EBITDA as defined in syndicated loan 3 Includes changes in inventories, trade accounts receivable, trade accounts payable and discounted notes4 Includes dividends received, income from equity-accounted and other investments, incl. impairment and reversal of items as
well as changes in employee benefits and other provisions and in other assets and liabilities5 Adjusted EBITDA to net cash interest paid
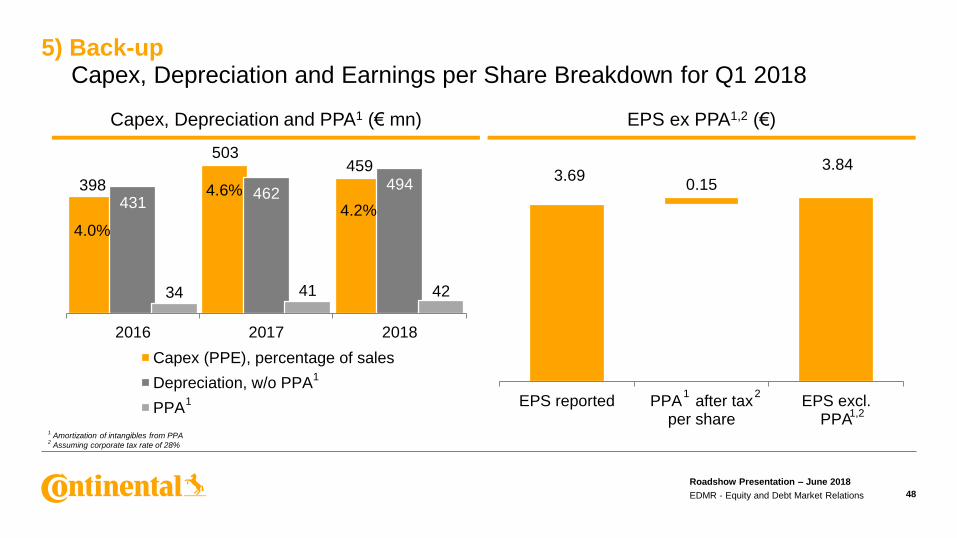
398
503459
431462
494
34 41 42
2016 2017 2018
Capex (PPE), percentage of sales
Depreciation, w/o PPA
PPA
4.0%
4.6%
4.2%
3.690.15
3.84
EPS reported PPA after taxper share
EPS excl.PPA
5) Back-upCapex, Depreciation and Earnings per Share Breakdown for Q1 2018
48
1Amortization of intangibles from PPA
2Assuming corporate tax rate of 28%
1
1
Capex, Depreciation and PPA1 (€ mn) EPS ex PPA1,2 (€)
1 2
1,2
Roadshow Presentation – June 2018
EDMR - Equity and Debt Market Relations
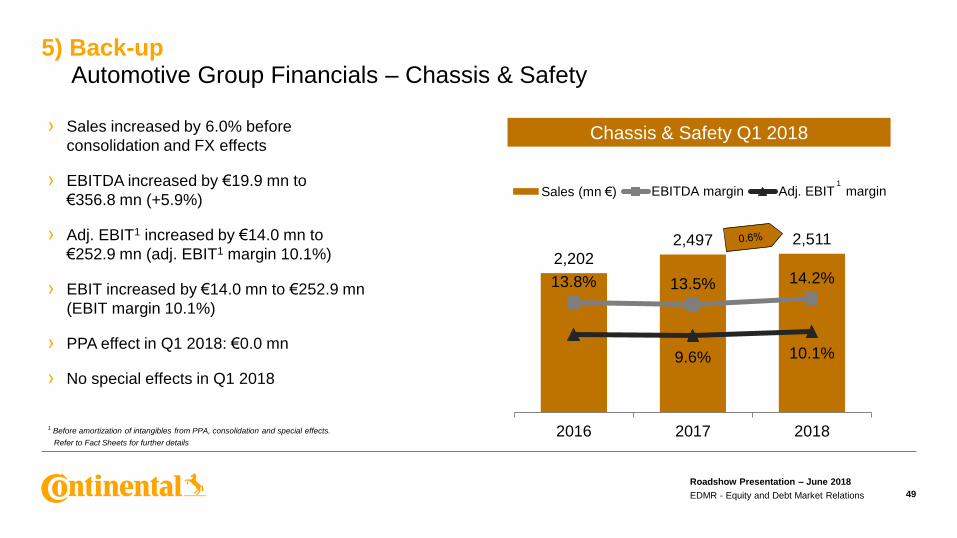
2,202
2,497 2,511
13.8% 13.5% 14.2%
9.6% 10.1%
2016 2017 2018
Sales (mn €) EBITDA margin Adj. EBIT margin
5) Back-upAutomotive Group Financials – Chassis & Safety
49
Chassis & Safety Q1 2018
1Before amortization of intangibles from PPA, consolidation and special effects.
Refer to Fact Sheets for further details
› Sales increased by 6.0% before
consolidation and FX effects
› EBITDA increased by €19.9 mn to
€356.8 mn (+5.9%)
› Adj. EBIT1 increased by €14.0 mn to
€252.9 mn (adj. EBIT1 margin 10.1%)
› EBIT increased by €14.0 mn to €252.9 mn
(EBIT margin 10.1%)
› PPA effect in Q1 2018: €0.0 mn
› No special effects in Q1 2018
1
Roadshow Presentation – June 2018
EDMR - Equity and Debt Market Relations
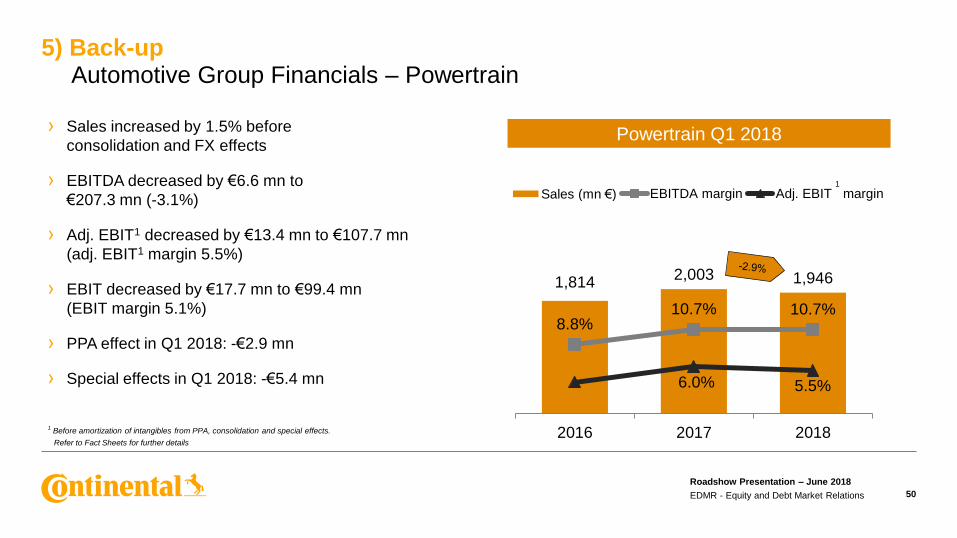
1,8142,003 1,946
8.8%10.7% 10.7%
6.0% 5.5%
2016 2017 2018
Sales (mn €) EBITDA margin Adj. EBIT margin
5) Back-upAutomotive Group Financials – Powertrain
50
1Before amortization of intangibles from PPA, consolidation and special effects.
Refer to Fact Sheets for further details
Powertrain Q1 2018› Sales increased by 1.5% before
consolidation and FX effects
› EBITDA decreased by €6.6 mn to
€207.3 mn (-3.1%)
› Adj. EBIT1 decreased by €13.4 mn to €107.7 mn
(adj. EBIT1 margin 5.5%)
› EBIT decreased by €17.7 mn to €99.4 mn
(EBIT margin 5.1%)
› PPA effect in Q1 2018: -€2.9 mn
› Special effects in Q1 2018: -€5.4 mn
Roadshow Presentation – June 2018
EDMR - Equity and Debt Market Relations
1
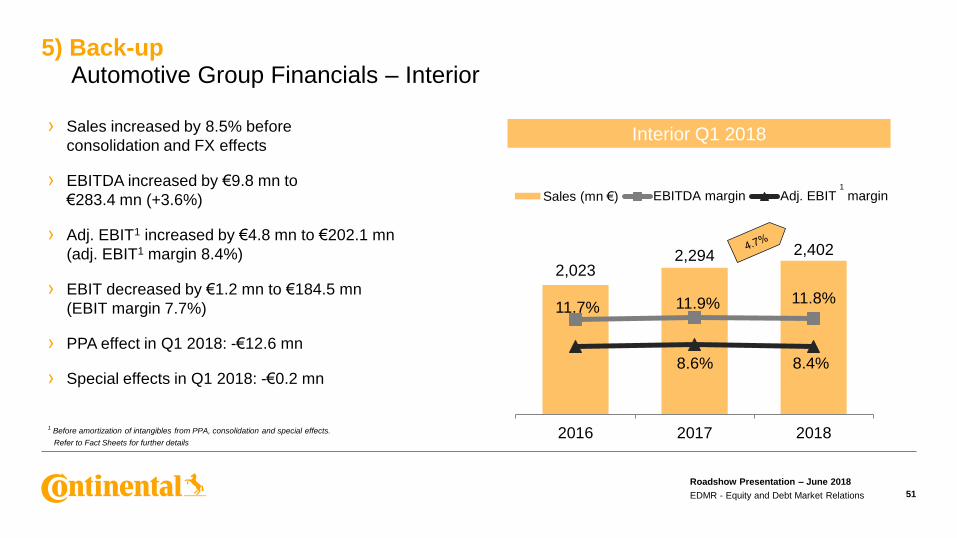
2,0232,294 2,402
11.7% 11.9% 11.8%
8.6% 8.4%
2016 2017 2018
Sales (mn €) EBITDA margin Adj. EBIT margin
5) Back-upAutomotive Group Financials – Interior
51
1Before amortization of intangibles from PPA, consolidation and special effects.
Refer to Fact Sheets for further details
Interior Q1 2018› Sales increased by 8.5% before
consolidation and FX effects
› EBITDA increased by €9.8 mn to
€283.4 mn (+3.6%)
› Adj. EBIT1 increased by €4.8 mn to €202.1 mn
(adj. EBIT1 margin 8.4%)
› EBIT decreased by €1.2 mn to €184.5 mn
(EBIT margin 7.7%)
› PPA effect in Q1 2018: -€12.6 mn
› Special effects in Q1 2018: -€0.2 mn
Roadshow Presentation – June 2018
EDMR - Equity and Debt Market Relations
1
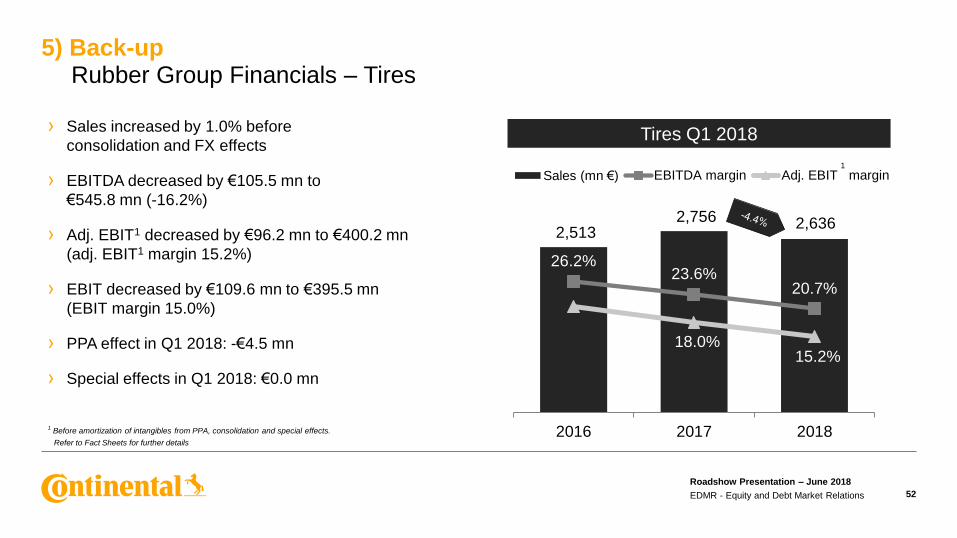
2,513 2,756 2,636
26.2%23.6%
20.7%
18.0%15.2%
2016 2017 2018
Sales (mn €) EBITDA margin Adj. EBIT margin
5) Back-upRubber Group Financials – Tires
52
1Before amortization of intangibles from PPA, consolidation and special effects.
Refer to Fact Sheets for further details
Tires Q1 2018› Sales increased by 1.0% before
consolidation and FX effects
› EBITDA decreased by €105.5 mn to
€545.8 mn (-16.2%)
› Adj. EBIT1 decreased by €96.2 mn to €400.2 mn
(adj. EBIT1 margin 15.2%)
› EBIT decreased by €109.6 mn to €395.5 mn
(EBIT margin 15.0%)
› PPA effect in Q1 2018: -€4.5 mn
› Special effects in Q1 2018: €0.0 mn
Roadshow Presentation – June 2018
EDMR - Equity and Debt Market Relations
1

-5%
0%
5%
-25%
-15%
-5%
5%
15%
Ja
n-1
1
Aug
-11
Mar-
12
Oct-
12
Ma
y-1
3
De
c-1
3
Ju
l-1
4
Fe
b-1
5
Sep-1
5
Apr-
16
No
v-1
6
Ju
n-1
7
Ja
n-1
8
PC & LT Tire Replacement (YOY chg. monthly)
Vehicle miles YOY chg. monthly (DOT, rS)
5) Back-upTires – Demand for Passenger Car and Light Truck Tires
53
1U.S. Department of Transportation, right Scale
1
Replacement Tire Demand for PC & LT Europe
Replacement Tire Demand for
PC & LT North America
Roadshow Presentation – June 2018
EDMR - Equity and Debt Market Relations
-25%
-15%
-5%
5%
15%
Ja
n-1
1
Jul-11
Ja
n-1
2
Ju
l-1
2
Ja
n-1
3
Ju
l-1
3
Ja
n-1
4
Ju
l-1
4
Ja
n-1
5
Jul-15
Ja
n-1
6
Ju
l-1
6
Jan-1
7
Ju
l-1
7
Ja
n-1
8
PC & LT Tire Replacement (YOY chg. monthly)
-30%
-20%
-10%
0%
10%
20%
30%
Ja
n-1
1
Ju
l-1
1
Jan-1
2
Ju
l-1
2
Ja
n-1
3
Ju
l-1
3
Ja
n-1
4
Ju
l-1
4
Ja
n-1
5
Ju
l-1
5
Ja
n-1
6
Ju
l-1
6
Ja
n-1
7
Ju
l-1
7
Ja
n-1
8
Truck tire replacement (YOY chg. monthly)
km BAG monthly (adj.)
-30%
-20%
-10%
0%
10%
20%
30%
Ja
n-1
1
Ju
l-1
1
Ja
n-1
2
Ju
l-1
2
Ja
n-1
3
Ju
l-1
3
Jan-1
4
Ju
l-1
4
Ja
n-1
5
Ju
l-1
5
Ja
n-1
6
Ju
l-1
6
Ja
n-1
7
Ju
l-1
7
Ja
n-1
8
Truck tire replacement (YOY chg. monthly)
ATA monthly (adj.) YOY
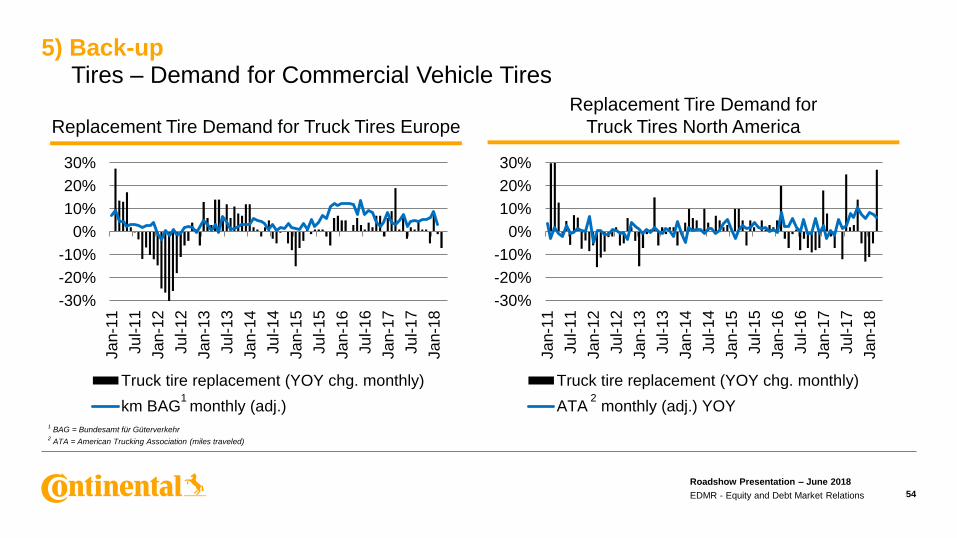
5) Back-upTires – Demand for Commercial Vehicle Tires
54
1BAG = Bundesamt für Güterverkehr
2ATA = American Trucking Association (miles traveled)
21
Replacement Tire Demand for Truck Tires Europe
Replacement Tire Demand for
Truck Tires North America
Roadshow Presentation – June 2018
EDMR - Equity and Debt Market Relations
1,3591,521
1,602
13.0%12.6% 12.2%
9.2% 8.6%
2016 2017 2018
Sales (mn €) EBITDA margin Adj. EBIT margin
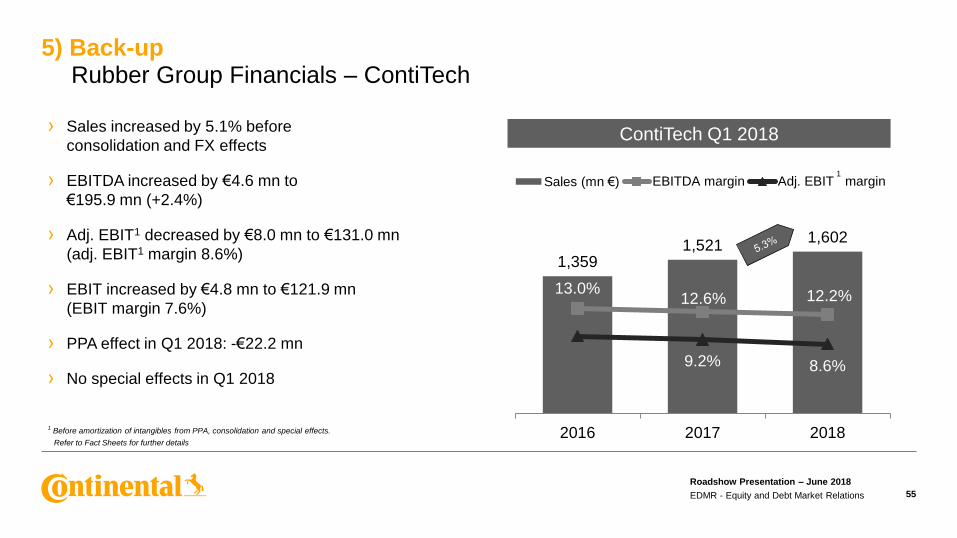
5) Back-upRubber Group Financials – ContiTech
55
1Before amortization of intangibles from PPA, consolidation and special effects.
Refer to Fact Sheets for further details
ContiTech Q1 2018› Sales increased by 5.1% before
consolidation and FX effects
› EBITDA increased by €4.6 mn to
€195.9 mn (+2.4%)
› Adj. EBIT1 decreased by €8.0 mn to €131.0 mn
(adj. EBIT1 margin 8.6%)
› EBIT increased by €4.8 mn to €121.9 mn
(EBIT margin 7.6%)
› PPA effect in Q1 2018: -€22.2 mn
› No special effects in Q1 2018
Roadshow Presentation – June 2018
EDMR - Equity and Debt Market Relations
1
56
2016 – Q1 2018 Fact Sheets
Roadshow Presentation – June 2018
EDMR - Equity and Debt Market Relations
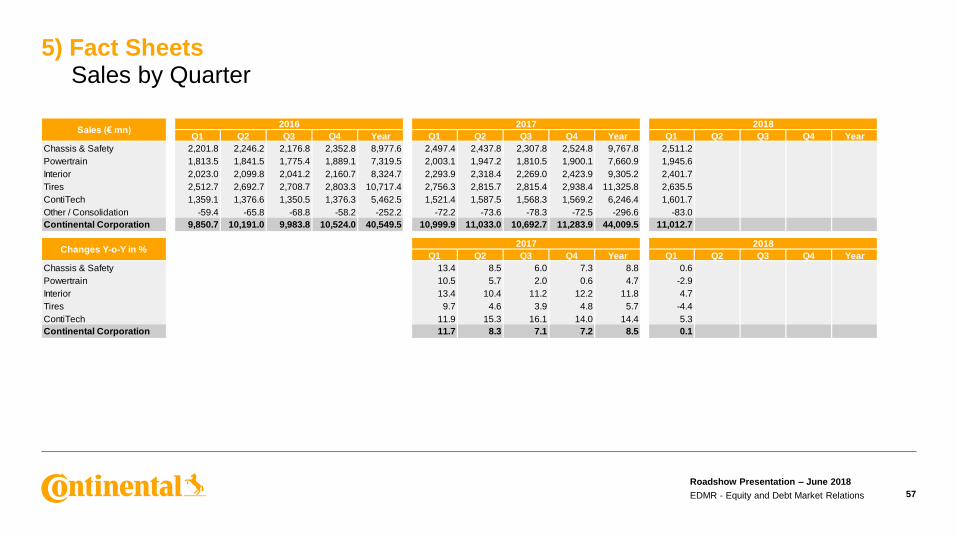
5) Fact SheetsSales by Quarter
57
Roadshow Presentation – June 2018
EDMR - Equity and Debt Market Relations
Q1 Q2 Q3 Q4 Year Q1 Q2 Q3 Q4 Year Q1 Q2 Q3 Q4 Year
Chassis & Safety 2,201.8 2,246.2 2,176.8 2,352.8 8,977.6 2,497.4 2,437.8 2,307.8 2,524.8 9,767.8 2,511.2
Powertrain 1,813.5 1,841.5 1,775.4 1,889.1 7,319.5 2,003.1 1,947.2 1,810.5 1,900.1 7,660.9 1,945.6
Interior 2,023.0 2,099.8 2,041.2 2,160.7 8,324.7 2,293.9 2,318.4 2,269.0 2,423.9 9,305.2 2,401.7
Tires 2,512.7 2,692.7 2,708.7 2,803.3 10,717.4 2,756.3 2,815.7 2,815.4 2,938.4 11,325.8 2,635.5
ContiTech 1,359.1 1,376.6 1,350.5 1,376.3 5,462.5 1,521.4 1,587.5 1,568.3 1,569.2 6,246.4 1,601.7
Other / Consolidation -59.4 -65.8 -68.8 -58.2 -252.2 -72.2 -73.6 -78.3 -72.5 -296.6 -83.0
Continental Corporation 9,850.7 10,191.0 9,983.8 10,524.0 40,549.5 10,999.9 11,033.0 10,692.7 11,283.9 44,009.5 11,012.7
Q1 Q2 Q3 Q4 Year Q1 Q2 Q3 Q4 Year
Chassis & Safety 13.4 8.5 6.0 7.3 8.8 0.6
Powertrain 10.5 5.7 2.0 0.6 4.7 -2.9
Interior 13.4 10.4 11.2 12.2 11.8 4.7
Tires 9.7 4.6 3.9 4.8 5.7 -4.4
ContiTech 11.9 15.3 16.1 14.0 14.4 5.3
Continental Corporation 11.7 8.3 7.1 7.2 8.5 0.1
Changes Y-o-Y in %2017 2018
Sales (€ mn)2016 2017 2018
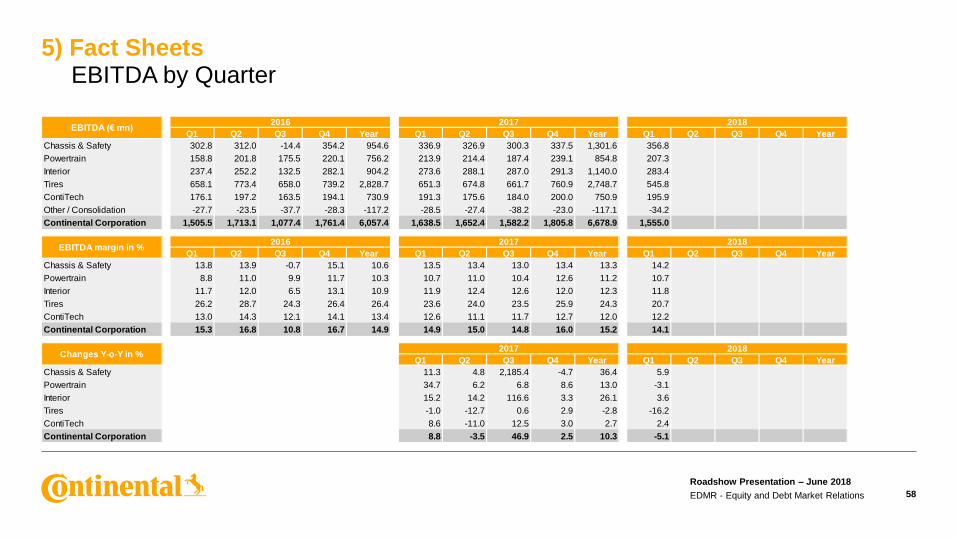
5) Fact SheetsEBITDA by Quarter
58
Roadshow Presentation – June 2018
EDMR - Equity and Debt Market Relations
Q1 Q2 Q3 Q4 Year Q1 Q2 Q3 Q4 Year Q1 Q2 Q3 Q4 Year
Chassis & Safety 302.8 312.0 -14.4 354.2 954.6 336.9 326.9 300.3 337.5 1,301.6 356.8
Powertrain 158.8 201.8 175.5 220.1 756.2 213.9 214.4 187.4 239.1 854.8 207.3
Interior 237.4 252.2 132.5 282.1 904.2 273.6 288.1 287.0 291.3 1,140.0 283.4
Tires 658.1 773.4 658.0 739.2 2,828.7 651.3 674.8 661.7 760.9 2,748.7 545.8
ContiTech 176.1 197.2 163.5 194.1 730.9 191.3 175.6 184.0 200.0 750.9 195.9
Other / Consolidation -27.7 -23.5 -37.7 -28.3 -117.2 -28.5 -27.4 -38.2 -23.0 -117.1 -34.2
Continental Corporation 1,505.5 1,713.1 1,077.4 1,761.4 6,057.4 1,638.5 1,652.4 1,582.2 1,805.8 6,678.9 1,555.0
Q1 Q2 Q3 Q4 Year Q1 Q2 Q3 Q4 Year Q1 Q2 Q3 Q4 Year
Chassis & Safety 13.8 13.9 -0.7 15.1 10.6 13.5 13.4 13.0 13.4 13.3 14.2
Powertrain 8.8 11.0 9.9 11.7 10.3 10.7 11.0 10.4 12.6 11.2 10.7
Interior 11.7 12.0 6.5 13.1 10.9 11.9 12.4 12.6 12.0 12.3 11.8
Tires 26.2 28.7 24.3 26.4 26.4 23.6 24.0 23.5 25.9 24.3 20.7
ContiTech 13.0 14.3 12.1 14.1 13.4 12.6 11.1 11.7 12.7 12.0 12.2
Continental Corporation 15.3 16.8 10.8 16.7 14.9 14.9 15.0 14.8 16.0 15.2 14.1
Q1 Q2 Q3 Q4 Year Q1 Q2 Q3 Q4 Year
Chassis & Safety 11.3 4.8 2,185.4 -4.7 36.4 5.9
Powertrain 34.7 6.2 6.8 8.6 13.0 -3.1
Interior 15.2 14.2 116.6 3.3 26.1 3.6
Tires -1.0 -12.7 0.6 2.9 -2.8 -16.2
ContiTech 8.6 -11.0 12.5 3.0 2.7 2.4
Continental Corporation 8.8 -3.5 46.9 2.5 10.3 -5.1
EBITDA margin in %2016 2017 2018
Changes Y-o-Y in %2017 2018
EBITDA (€ mn)2016 2017 2018
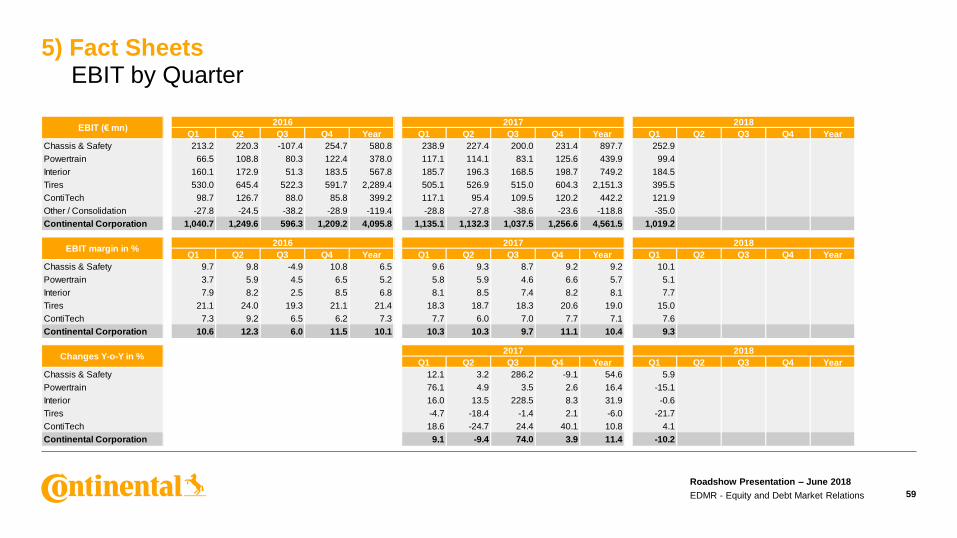
5) Fact SheetsEBIT by Quarter
59
Roadshow Presentation – June 2018
EDMR - Equity and Debt Market Relations
Q1 Q2 Q3 Q4 Year Q1 Q2 Q3 Q4 Year Q1 Q2 Q3 Q4 Year
Chassis & Safety 213.2 220.3 -107.4 254.7 580.8 238.9 227.4 200.0 231.4 897.7 252.9
Powertrain 66.5 108.8 80.3 122.4 378.0 117.1 114.1 83.1 125.6 439.9 99.4
Interior 160.1 172.9 51.3 183.5 567.8 185.7 196.3 168.5 198.7 749.2 184.5
Tires 530.0 645.4 522.3 591.7 2,289.4 505.1 526.9 515.0 604.3 2,151.3 395.5
ContiTech 98.7 126.7 88.0 85.8 399.2 117.1 95.4 109.5 120.2 442.2 121.9
Other / Consolidation -27.8 -24.5 -38.2 -28.9 -119.4 -28.8 -27.8 -38.6 -23.6 -118.8 -35.0
Continental Corporation 1,040.7 1,249.6 596.3 1,209.2 4,095.8 1,135.1 1,132.3 1,037.5 1,256.6 4,561.5 1,019.2
Q1 Q2 Q3 Q4 Year Q1 Q2 Q3 Q4 Year Q1 Q2 Q3 Q4 Year
Chassis & Safety 9.7 9.8 -4.9 10.8 6.5 9.6 9.3 8.7 9.2 9.2 10.1
Powertrain 3.7 5.9 4.5 6.5 5.2 5.8 5.9 4.6 6.6 5.7 5.1
Interior 7.9 8.2 2.5 8.5 6.8 8.1 8.5 7.4 8.2 8.1 7.7
Tires 21.1 24.0 19.3 21.1 21.4 18.3 18.7 18.3 20.6 19.0 15.0
ContiTech 7.3 9.2 6.5 6.2 7.3 7.7 6.0 7.0 7.7 7.1 7.6
Continental Corporation 10.6 12.3 6.0 11.5 10.1 10.3 10.3 9.7 11.1 10.4 9.3
Q1 Q2 Q3 Q4 Year Q1 Q2 Q3 Q4 Year
Chassis & Safety 12.1 3.2 286.2 -9.1 54.6 5.9
Powertrain 76.1 4.9 3.5 2.6 16.4 -15.1
Interior 16.0 13.5 228.5 8.3 31.9 -0.6
Tires -4.7 -18.4 -1.4 2.1 -6.0 -21.7
ContiTech 18.6 -24.7 24.4 40.1 10.8 4.1
Continental Corporation 9.1 -9.4 74.0 3.9 11.4 -10.2
EBIT margin in %2016 2017 2018
Changes Y-o-Y in %2017 2018
EBIT (€ mn)2016 2017 2018

5) Fact SheetsAdjusted EBIT1 by Quarter
60
1Before amortization of intangibles from PPA, consolidation and special effects
Roadshow Presentation – June 2018
EDMR - Equity and Debt Market Relations
Q1 Q2 Q3 Q4 Year Q1 Q2 Q3 Q4 Year
Chassis & Safety 238.9 252.9
Powertrain 121.1 107.7
Interior 197.3 202.1
Tires 496.4 400.2
ContiTech 139.0 131.0
Other / Consolidation -28.8 -35.0
Continental Corporation 1,163.9 1,058.9
Q1 Q2 Q3 Q4 Year Q1 Q2 Q3 Q4 Year
Chassis & Safety 9.6 10.1
Powertrain 6.0 5.5
Interior 8.6 8.4
Tires 18.0 15.2
ContiTech 9.2 8.6
Continental Corporation 10.6 9.7
Q1 Q2 Q3 Q4 Year
Chassis & Safety 5.9
Powertrain -11.1
Interior 2.4
Tires -19.4
ContiTech -5.8
Continental Corporation -9.0
Adj. EBIT ¹ margin in %2017 2018
Changes Y-o-Y in %2018
Adj. EBIT ¹ (€ mn)2017 2018
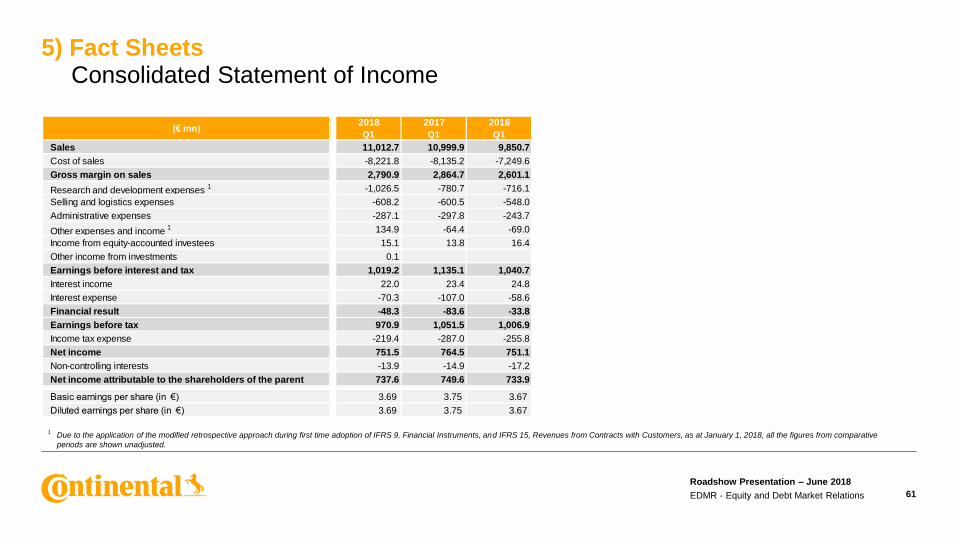
5) Fact SheetsConsolidated Statement of Income
61
Roadshow Presentation – June 2018
EDMR - Equity and Debt Market Relations
1Due to the application of the modified retrospective approach during first time adoption of IFRS 9, Financial Instruments, and IFRS 15, Revenues from Contracts with Customers, as at January 1, 2018, all the figures from comparative
periods are shown unadjusted.
2018 2017 2016
Q1 Q1 Q1
Sales 11,012.7 10,999.9 9,850.7
Cost of sales -8,221.8 -8,135.2 -7,249.6
Gross margin on sales 2,790.9 2,864.7 2,601.1
Research and development expenses 1 -1,026.5 -780.7 -716.1
Selling and logistics expenses -608.2 -600.5 -548.0
Administrative expenses -287.1 -297.8 -243.7
Other expenses and income 1 134.9 -64.4 -69.0
Income from equity-accounted investees 15.1 13.8 16.4
Other income from investments 0.1
Earnings before interest and tax 1,019.2 1,135.1 1,040.7
Interest income 22.0 23.4 24.8
Interest expense -70.3 -107.0 -58.6
Financial result -48.3 -83.6 -33.8
Earnings before tax 970.9 1,051.5 1,006.9
Income tax expense -219.4 -287.0 -255.8
Net income 751.5 764.5 751.1
Non-controlling interests -13.9 -14.9 -17.2
Net income attributable to the shareholders of the parent 737.6 749.6 733.9
Basic earnings per share (in €) 3.69 3.75 3.67
Diluted earnings per share (in €) 3.69 3.75 3.67
(€ mn)
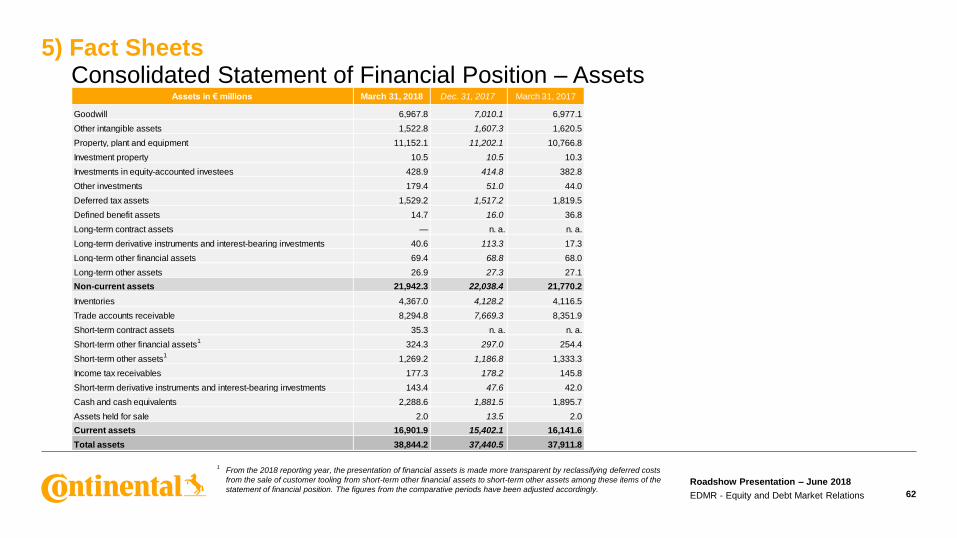
5) Fact SheetsConsolidated Statement of Financial Position – Assets
62
Roadshow Presentation – June 2018
EDMR - Equity and Debt Market Relations
Assets in € millions March 31, 2018 Dec. 31, 2017 March 31, 2017
Goodwill 6,967.8 7,010.1 6,977.1
Other intangible assets 1,522.8 1,607.3 1,620.5
Property, plant and equipment 11,152.1 11,202.1 10,766.8
Investment property 10.5 10.5 10.3
Investments in equity-accounted investees 428.9 414.8 382.8
Other investments 179.4 51.0 44.0
Deferred tax assets 1,529.2 1,517.2 1,819.5
Defined benefit assets 14.7 16.0 36.8
Long-term contract assets — n. a. n. a.
Long-term derivative instruments and interest-bearing investments 40.6 113.3 17.3
Long-term other financial assets 69.4 68.8 68.0
Long-term other assets 26.9 27.3 27.1
Non-current assets 21,942.3 22,038.4 21,770.2
Inventories 4,367.0 4,128.2 4,116.5
Trade accounts receivable 8,294.8 7,669.3 8,351.9
Short-term contract assets 35.3 n. a. n. a.
Short-term other financial assets1
324.3 297.0 254.4
Short-term other assets1
1,269.2 1,186.8 1,333.3
Income tax receivables 177.3 178.2 145.8
Short-term derivative instruments and interest-bearing investments 143.4 47.6 42.0
Cash and cash equivalents 2,288.6 1,881.5 1,895.7
Assets held for sale 2.0 13.5 2.0
Current assets 16,901.9 15,402.1 16,141.6
Total assets 38,844.2 37,440.5 37,911.8
1From the 2018 reporting year, the presentation of financial assets is made more transparent by reclassifying deferred costs
from the sale of customer tooling from short-term other financial assets to short-term other assets among these items of the
statement of financial position. The figures from the comparative periods have been adjusted accordingly.

5) Fact SheetsConsolidated Statement of Financial Position – Total Equity and Liabilities
63
Roadshow Presentation – June 2018
EDMR - Equity and Debt Market Relations
Equity and liabilities in € millions March 31, 2018 Dec. 31, 2017 March 31, 2017
Subscribed capital 512.0 512.0 512.0
Capital reserves 4,155.6 4,155.6 4,155.6
Retained earnings 14,437.7 13,669.3 12,284.3
Other comprehensive income -2,552.0 -2,508.5 -1,700.6
Equity attributable to the shareholders of the parent 16,553.3 15,828.4 15,251.3
Non-controlling interests 458.1 461.9 471.1
Total equity 17,011.4 16,290.3 15,722.4
Long-term employee benefits 4,410.4 4,394.1 4,356.1
Deferred tax liabilities 352.3 348.5 444.7
Long-term provisions for other risks and obligations 133.5 139.6 205.5
Long-term indebtedness 1,459.7 2,017.8 2,783.2
Long-term other financial liabilities 35.5 36.1 106.2
Long-term contract liabilities 11.3 n. a. n. a.
Long-term other liabilities 16.6 25.4 16.0
Non-current liabilities 6,419.3 6,961.5 7,911.7
Short-term employee benefits 1,745.0 1,490.6 1,596.1
Trade accounts payable 6,757.0 6,798.5 6,760.1
Short-term contract liabilities 1,002.1 n. a. n. a.
Income tax payables 934.7 889.7 829.0
Short-term provisions for other risks and obligations 919.4 943.0 1,198.2
Short-term indebtedness 2,996.7 2,072.2 1,939.4
Short-term other financial liabilities 345.9 1,276.8 1,111.0
Short-term other liabilities 712.7 717.9 843.9
Current liabilities 15,413.5 14,188.7 14,277.7
Total equity and liabilities 38,844.2 37,440.5 37,911.8
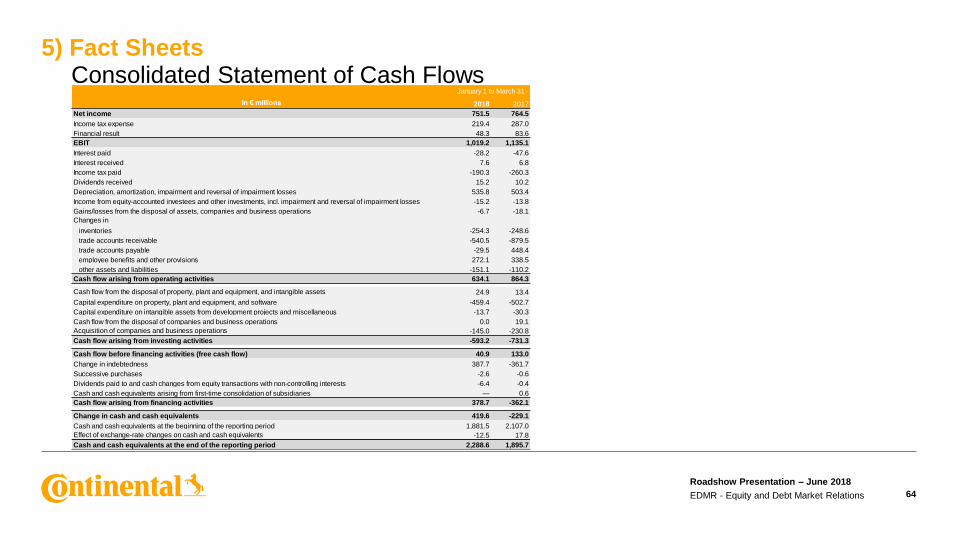
5) Fact SheetsConsolidated Statement of Cash Flows
64
Roadshow Presentation – June 2018
EDMR - Equity and Debt Market Relations
1
1
In € millions 2018 2017
Net income 751.5 764.5
Income tax expense 219.4 287.0
Financial result 48.3 83.6
EBIT 1,019.2 1,135.1
Interest paid -28.2 -47.6
Interest received 7.6 6.8
Income tax paid -190.3 -260.3
Dividends received 15.2 10.2
Depreciation, amortization, impairment and reversal of impairment losses 535.8 503.4
Income from equity-accounted investees and other investments, incl. impairment and reversal of impairment losses -15.2 -13.8
Gains/losses from the disposal of assets, companies and business operations -6.7 -18.1
Changes in
inventories -254.3 -248.6
trade accounts receivable -540.5 -879.5
trade accounts payable -29.5 448.4
employee benefits and other provisions 272.1 338.5
other assets and liabilities -151.1 -110.2
Cash flow arising from operating activities 634.1 864.3
Cash flow from the disposal of property, plant and equipment, and intangible assets 24.9 13.4
Capital expenditure on property, plant and equipment, and software -459.4 -502.7
Capital expenditure on intangible assets from development projects and miscellaneous -13.7 -30.3
Cash flow from the disposal of companies and business operations 0.0 19.1
Acquisition of companies and business operations -145.0 -230.8
Cash flow arising from investing activities -593.2 -731.3
Cash flow before financing activities (free cash flow) 40.9 133.0
Change in indebtedness 387.7 -361.7
Successive purchases -2.6 -0.6
Dividends paid to and cash changes from equity transactions with non-controlling interests -6.4 -0.4
Cash and cash equivalents arising from first-time consolidation of subsidiaries — 0.6
Cash flow arising from financing activities 378.7 -362.1
Change in cash and cash equivalents 419.6 -229.1
Cash and cash equivalents at the beginning of the reporting period 1,881.5 2,107.0
Effect of exchange-rate changes on cash and cash equivalents -12.5 17.8
Cash and cash equivalents at the end of the reporting period 2,288.6 1,895.7
January 1 to March 31
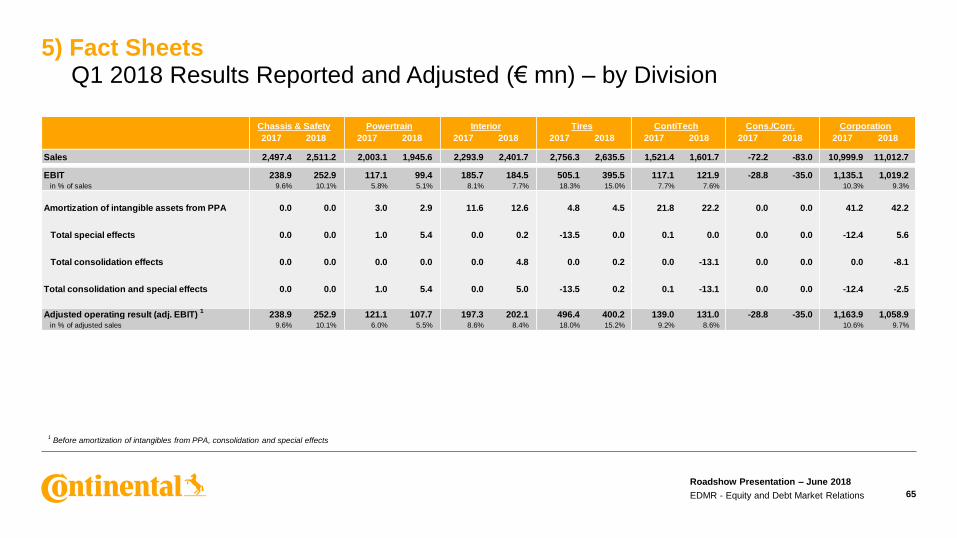
5) Fact SheetsQ1 2018 Results Reported and Adjusted (€ mn) – by Division
65
1Before amortization of intangibles from PPA, consolidation and special effects
Roadshow Presentation – June 2018
EDMR - Equity and Debt Market Relations
2017 2018 2017 2018 2017 2018 2017 2018 2017 2018 2017 2018 2017 2018
Sales 2,497.4 2,511.2 2,003.1 1,945.6 2,293.9 2,401.7 2,756.3 2,635.5 1,521.4 1,601.7 -72.2 -83.0 10,999.9 11,012.7
EBIT 238.9 252.9 117.1 99.4 185.7 184.5 505.1 395.5 117.1 121.9 -28.8 -35.0 1,135.1 1,019.2in % of sales 9.6% 10.1% 5.8% 5.1% 8.1% 7.7% 18.3% 15.0% 7.7% 7.6% 10.3% 9.3%
Amortization of intangible assets from PPA 0.0 0.0 3.0 2.9 11.6 12.6 4.8 4.5 21.8 22.2 0.0 0.0 41.2 42.2
Total special effects 0.0 0.0 1.0 5.4 0.0 0.2 -13.5 0.0 0.1 0.0 0.0 0.0 -12.4 5.6
Total consolidation effects 0.0 0.0 0.0 0.0 0.0 4.8 0.0 0.2 0.0 -13.1 0.0 0.0 0.0 -8.1
Total consolidation and special effects 0.0 0.0 1.0 5.4 0.0 5.0 -13.5 0.2 0.1 -13.1 0.0 0.0 -12.4 -2.5
Adjusted operating result (adj. EBIT) 1
238.9 252.9 121.1 107.7 197.3 202.1 496.4 400.2 139.0 131.0 -28.8 -35.0 1,163.9 1,058.9in % of adjusted sales 9.6% 10.1% 6.0% 5.5% 8.6% 8.4% 18.0% 15.2% 9.2% 8.6% 10.6% 9.7%
Interior CorporationChassis & Safety Powertrain Tires ContiTech Cons./Corr.

5) Fact SheetsQ1 2018 Results Reported and Adjusted (€ mn) – by Group
66
1Before amortization of intangibles from PPA, consolidation and special effects
Roadshow Presentation – June 2018
EDMR - Equity and Debt Market Relations
2017 2018 2017 2018 2017 2018 2017 2018
Sales 6,754.0 6,813.9 4,260.4 4,212.2 -14.5 -13.4 10,999.9 11,012.7
EBIT 541.7 536.8 622.2 517.4 -28.8 -35.0 1,135.1 1,019.2
in % of sales 8.0% 7.9% 14.6% 12.3% 10.3% 9.3%
Amortization of intangible assets from PPA 14.6 15.5 26.6 26.7 0.0 0.0 41.2 42.2
Total special effects 1.0 5.6 -13.4 0.0 0.0 0.0 -12.4 5.6
Total consolidation effects 0.0 4.8 0.0 -12.9 0.0 0.0 0.0 -8.1
Total consolidation and special effects 1.0 10.4 -13.4 -12.9 0.0 0.0 -12.4 -2.5
Adjusted operating result (adj. EBIT) 1 557.3 562.7 635.4 531.2 -28.8 -35.0 1,163.9 1,058.9
in % of adjusted sales 8.3% 8.3% 14.9% 12.9% 10.6% 9.7%
Automotive Rubber Cons./Corr. Corporation
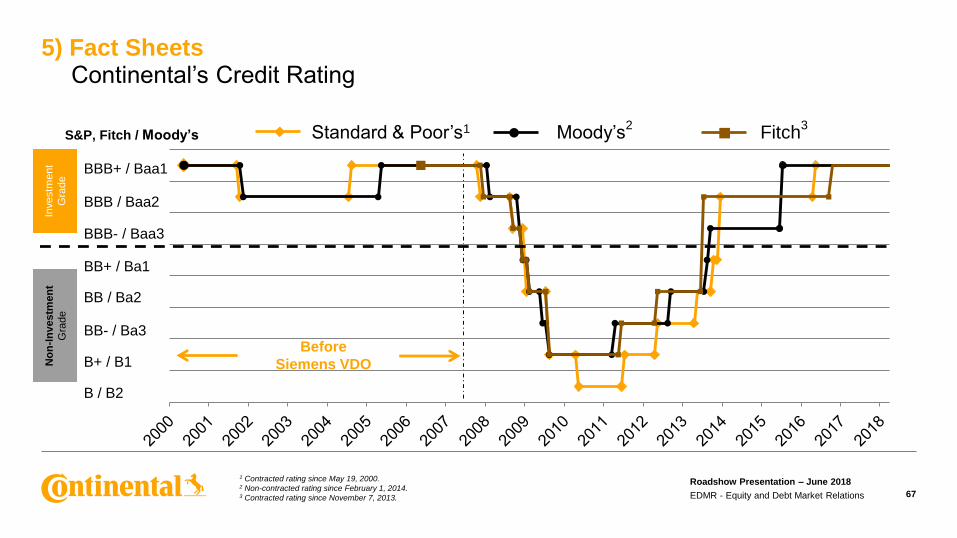
5) Fact SheetsContinental’s Credit Rating
67
BBB+ / Baa1
BBB / Baa2
BBB- / Baa3
BB+ / Ba1
BB / Ba2
BB- / Ba3
B+ / B1
B / B2
S&P, Fitch / Moody’s Standard & Poor’s1 Moody’s2
Fitch3
Before
Siemens VDO No
n-I
nv
estm
en
t
Gra
de
Investm
ent
Gra
de
1 Contracted rating since May 19, 2000.2 Non-contracted rating since February 1, 2014.3 Contracted rating since November 7, 2013.
Roadshow Presentation – June 2018
EDMR - Equity and Debt Market Relations
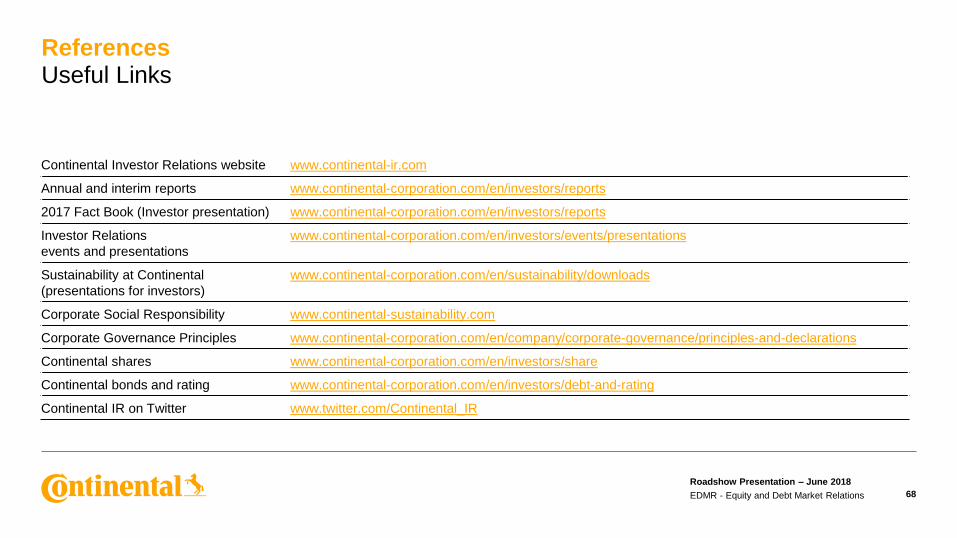
ReferencesUseful Links
68
Roadshow Presentation – June 2018
EDMR - Equity and Debt Market Relations
Continental Investor Relations website www.continental-ir.com
Annual and interim reports www.continental-corporation.com/en/investors/reports
2017 Fact Book (Investor presentation) www.continental-corporation.com/en/investors/reports
Investor Relations
events and presentations
www.continental-corporation.com/en/investors/events/presentations
Sustainability at Continental
(presentations for investors)
www.continental-corporation.com/en/sustainability/downloads
Corporate Social Responsibility www.continental-sustainability.com
Corporate Governance Principles www.continental-corporation.com/en/company/corporate-governance/principles-and-declarations
Continental shares www.continental-corporation.com/en/investors/share
Continental bonds and rating www.continental-corporation.com/en/investors/debt-and-rating
Continental IR on Twitter www.twitter.com/Continental_IR