roadshow presentation jyri luomakoski, president and ceo ... · – jobs reduced by 140 by end of...
TRANSCRIPT

Enriching people’s way of lifeRoadshow presentationJyri Luomakoski, President and CEORiitta Palomäki, CFOOctober 2016

© Uponor2
Uponor at a glance
Uponor is a leading international provider of plastic based piping systems for buildings and infrastructure.
We provide safe drinking water delivery systems,energy-efficient radiant heating and cooling andreliable infrastructure solutions.
billion euroNet sales 2015
1.05 30countries with
Uponor operations
14production
sites worldwide
3,700worldwide
staff
FACTS & FIGURES
45%
25%
30% Plumbing Solutions
Infrastructure Solutions
Indoor Climate Solutions
July 2016 Roadshow presentation

© Uponor3
Our solutions enrich people’s way of life
Our visionThroughout the world, our solutions enrich people’s way of life.
Our missionPartnering with professionals to create better plumbing, indoor climate and infrastructure solutions.
July 2016 Roadshow presentation

© Uponor4
Our solutions enrich people’s way of life
Our peopleWe will build an exciting environment for growth and achievement both for the company and our employees
Our valuesConnect. Build. Inspire.
Our brand promiseLet’s build confidence!
July 2016 Roadshow presentation

© UponorI I I
Uponor milestones1620Johan de la Gardie establishes Wirsbo Bruks
1600
1918Aukusti Asko-Avonius establishes a carpentry workshop in Lahti, Finland
1900
1982Asko Oy and NesteOy jointly establishOy Uponor Ab
1972Wirsbo was first in the world to start manufacturing PEX pipes
1938 Upo Oy starts to manufacture cast iron products and household appliances
1964Plastic division Upo-Muovi starts up in Nastola, Finland, and launches its first plastic pipes
2000
2006 – 2008Municipal business outside of the Nordic countries divested
2000Merger with parent company Asko Oyj on 1 Jan 2000
1988Uponor enters plastic hot water pipe business, acquires Wirsbo
Asko Oy is listed on the Helsinki Stock Exchange
1990Wirsbo opens a factory in Apple Valley, Minnesota, USA
1997Acquisition of Unicor in 1997- 1999
2006The business is consolidated under one brand
2013Start of Uponor Infra through a merger with KWH Pipe on 1 July 2013
1999Oras Invest becomes a major shareholder
2016Acquisitions to expand competence in hygienic drinking water delivery
July 2016 Roadshow presentation5

© Uponor6
Sustainability is a foundation of our business
Sustainability is linked to our vision and mission and demonstrated by actions throughout the organisation
Our sustainability pillars• Strongly integrating sustainability
into our corporate mindset• Driving down our environmental impact• Enriching life through our innovative solutions• Engaging external stakeholders
in our sustainability journey
• Reporting through CDP Climate Change Nordic programme since 2010, Uponor has consistently improved performance and reached level B in 2016
July 2016 Roadshow presentation

© Uponor7
Group structure
The chart shows the Executive Committee members’ responsibilities
July 2016 Roadshow presentation

© Uponor8
Business groups
Plumbing solutions45% *)
Infrastructure solutions30%
Indoor climate solutions25%
*) percentage of 2015 net sales by business groupJuly 2016 Roadshow presentation

© Uponor9
Uponor’s Plumbing offeringFor efficient and hygienic drinking water delivery
Flexible pipe systems Multilayer pipe systems Risers
Quick & Easy fittings Intelligent water and hygieneToolsRTM fittings
Press fittings
July 2016 Roadshow presentation

© Uponor10
Uponor’s Indoor Climate offeringThe basis for a comfortable and energy-efficient ambiance
Radiant heating and cooling Thermally active slabs Ceiling cooling
Controls
Geothermal energy stations
VentilationLocal heat distributionManifold stations
July 2016 Roadshow presentation

© Uponor11
Uponor’s infrastructure offeringTransporting water, air, electricity, telecommunications and data
Technology360° Project ServicesStandard Solutions
July 2016 Roadshow presentation
© Uponor12
0
30
60
90
120
150
180
0
200
400
600
800
1 000
1 200
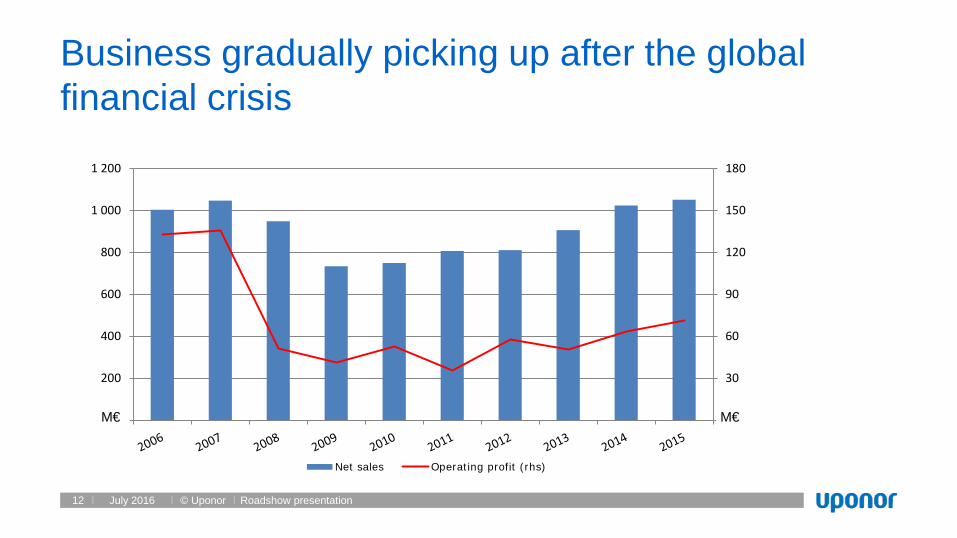
Net sales Operating profit (rhs)
Business gradually picking up after the global financial crisis
M€ M€
July 2016 Roadshow presentation

© Uponor13
Uponor has a strategy to generate sustainable growth in the shorter and longer term
Value
Time
We defend our strong position in the distribution business and the residential markets
We expand in commercial markets with an aim to significantly grow designed solution sales
We build options for future growth, e.g. sustainable hygienic solutions, digitalisation and new production technologies
July 2016 Roadshow presentation

© Uponor14
Long-term financial targetsSince 12 Feb 2013
• Help develop Uponor globally in a manner that secures faster than average industry growth and funding for future initiatives.
• Based on earlier criteria, now reflecting the ‘new normal’ business landscape.
• The emphasis is on growth, which is clearly influenced by the flat outlook of European building markets.
July 2016 Roadshow presentation

© Uponor15
Long-term financial targetsAnnounced in February 2013
Organic net sales growth to exceed
annual GDP growth* by
3 ppts
EBIT margin to exceed
10%
ROI to exceed
20%
Dividend pay-out to be at least
50% of annual earnings
(considering the gearing target)
Gearing to stay within
30 to 70 as an annual
average of the quarters
* GDP growth based on a weighted average growth in the top 10 countries
5.2%(target 4.8%)
7.2%w/o NRI
15.5% 86% 40.4
Actual 2015
July 2016 Roadshow presentation

© Uponor16
Major shareholders31 December 2015
22,6%
5,3%
4,1%2,7%
1,0%1,0%1,0%
30,6%
31,7%
Oras Invest Oy 22,6% Varma Mutual Pension Insurance Company 5,3% Nordea Nordic Small Cap Fund 4,1% Ilmarinen Mutual Pension Insurance Company 2,7% Nordea Fennia Fund 1,0% The State Pension Fund 1,0% Nordea Pro Finland Fund 1,0% Nominee registerations 30.6% Others 31.7%
Currently valid foreign notifications:15 September 2016: the holdings of Franklin Resources, Inc. went down to 9.55%
• 14,539 shareholders at the end of Dec 2015• Foreign shareholding was 31.5% at the end of Dec 2015, up from 28.3% in Dec 2014
July 2016 Roadshow presentation
© Uponor17
Financial results 1-6 2016
July 2016 Roadshow presentation

© Uponor18
Net sales• Demand picking up in parts of Europe, Building Solutions grew by double-digit numbers in several countries− Non-organic growth at €8.6 million
• Strong tailwinds supported the U.S. growth: Building Solutions - North America reports over five years of y-o-y growth• Despite emerging stability in Europe, Uponor Infra declined, mainly due to weak North America and Poland
Operating profit• Building Solutions – Europe benefited from higher net sales and savings from the ongoing transformation programme• Building Solutions – North America’s performance at prior year level, curbed by fittings transition and JV transaction costs• Uponor Infra benefited from transformation savings and changes in product/channel mix
Q2/2016: European demand picks up, savings from transformation programmes visibleApril - June, M€ 4-6/
20154-6/
2016 Change
Net sales 277.6 299.5 7.9%
Operating profit 22.5 26.5 18.0%
Comparable operating profit 23.2 30.7 31.8%
July 2016 Roadshow presentation

© Uponor19 July 2016
Market overview: second quarter 2016
Nordic countries• Sweden continues to outpace its
neighbours, especially in the new residential segment
• Other markets are generally stable, with signs of a fragile recovery in Finland
Southern Europe• A dynamic situation, with a recovery in
Spain, continued stagnation in Italy and significant uncertainty surrounding the UK
Central Europe• The regions largest market,
Germany, continues to see improvements in the construction market
• In the Netherlands, activity has moderated
North America• The U.S. construction market has
continued to improve across nearly every building segment, but at a reduced pace
• In Canada, weak energy markets hold back non-residential activity while house building is more resilient
Roadshow presentation
© Uponor20
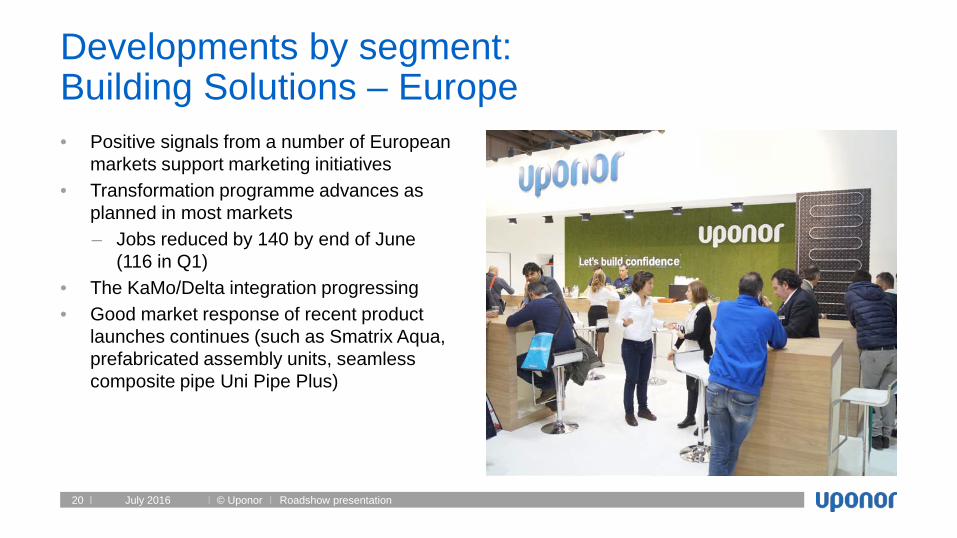
Developments by segment: Building Solutions – Europe• Positive signals from a number of European
markets support marketing initiatives• Transformation programme advances as
planned in most markets– Jobs reduced by 140 by end of June
(116 in Q1)• The KaMo/Delta integration progressing• Good market response of recent product
launches continues (such as Smatrix Aqua, prefabricated assembly units, seamless composite pipe Uni Pipe Plus)
July 2016 Roadshow presentation

© Uponor21
Developments by segment: Building Solutions – North America• Strong sales growth in a healthy market
maintained across the U.S.; Canadian demand softened in Q2
• Sales driven by the lively U.S. plumbing market
• Financial performance burdened by costs related to the temporary EP fittings replacement by metal fittings, the Canadian currency impact and costs related to the joint venture transaction
July 2016 Roadshow presentation
© Uponor22
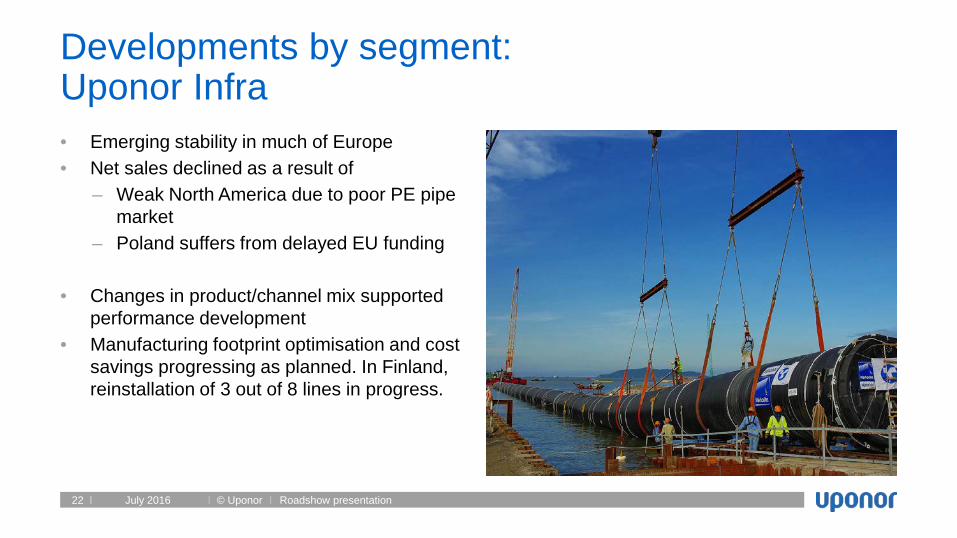
Developments by segment: Uponor Infra• Emerging stability in much of Europe• Net sales declined as a result of
– Weak North America due to poor PE pipe market
– Poland suffers from delayed EU funding
• Changes in product/channel mix supported performance development
• Manufacturing footprint optimisation and cost savings progressing as planned. In Finland, reinstallation of 3 out of 8 lines in progress.
July 2016 Roadshow presentation

© Uponor23 July 2016
M€ 1-6 1-6 Change 1-122015 2016 Y/Y 2015
Net sales, continuing operations 514.7 546.4 +6.2% 1,050.8
Operating profit, continuing operations 33.8 38.4 +13.6% 71.4
Comparable operating profit 34.6 45.6 +31.7% 75.8
Comparable operating profit margin 6.7% 8.3% 1.6% pts 7.2%
Earnings per share (diluted), continuing operations, € 0.23 0.28 +21.7% 0.51
Return on equity, % (p.a.) 11.6% 13.9% 2.3% pts 12.1%
Return on investment, % (p.a.) 14.0% 15.3% 1.3% pts 15.5%
Net interest bearing liabilities 138.8 175.1 +26.2% 91.3
Gearing, % 47.8% 58.5% +10.7% pts 29.3%
Net working capital of Net sales, % (p.a.) 11.9% 11.9% +0.0% pts 8.1%
Number of employees, end of period, continuing operations 3,906 3,964 +1.5% 3,735
January – June 2016:Key figures
All numbers in M€, unless otherwise noted
-1.5% excludingGerman acquisitions
Roadshow presentation

© Uponor24
January – June 2016:Income statementM€ 1-6 1-6 Change 1-12
2015 2016 Y/Y 2015Continuing operations
Net sales 514.7 546.4 +6.2% 1,050.8Cost of goods sold 330.9 353.1 +6.7% 680.6
Gross profit 183.8 193.3 +5.2% 370.2 % of net sales 35.7% 35.4% -0.3% pts 35.2%
Other operating income 0.7 2.0 +180.7% 2.4Expenses 150.7 156.9 +4.1% 301.2
Operating profit 33.8 38.4 +13.6% 71.4 % of net sales 6.6% 7.0% +0.5% pts 6.8%
Financial expenses, net 6.4 5.5 -14.0% 8.9Share of result in associated companies 0.1 0.1 +0.0% 0.3
Profit before taxes 27.5 33.0 +20.0% 62.8Profit for the period 17.3 20.8 +20.1% 37.1
EBITDA 52.1 57.9 +11.2% 110.5
• Comparable gross profit at €194.8m (35.7%) against €184.2m (35.8%) in 2015
• Comparable operating profit at €45.6m (8.3%) against €34.6m (6.7%) in 2015, up €11m
July 2016 Roadshow presentation

© Uponor25 July 2016
January – June 2016:Net sales & comparable operating profit by segmentCurrency: M€
Net sales Comparable operating profit
231.6
126.7
158.0
257.8
150.9139.9
0.0
50.0
100.0
150.0
200.0
250.0
300.0
Building Solutions - Europe Building Solutions - NorthAmerica
Uponor Infra
1-6 2015 1-6 2016
13.1
23.1
1.7
19.1
25.7
2.5
0.0
5.0
10.0
15.0
20.0
25.0
30.0
Building Solutions -Europe
Building Solutions - NorthAmerica
Uponor Infra
1-6 2015 1-6 2016
• Building Solutions – Europe:net sales growth driven by the German acquisitions. Comparable operating profit margin at 7.4%, up from 5.7%
• Building Solutions – North America: strong sales growth continued, +19% in euro terms. Comparable operating profit margin 17.0%, down by 1.2%-pts from the very high level in 2015
• Uponor Infra: net sales down by 11.5%. Improved comparable operating profit driven by reduced operational cost levels in Finland
Roadshow presentation

© Uponor26 July 2016
January – June 2016:Net sales development by key markets
Growth% in EUR 18.7 % 21.5% -4.0% 10.8% -9.3% 6.5% -7.8% -7.7%% in Curr. 19.0 % 10.6% -3.8% -0.4%
3.8% 26.0% -9.5%3.6% -1.7%
78.6
71.9 70.9
47.2
34.8
24.4
15.8 14.820.1 18.5
98.5
115.6
66.762.8
43.1 41.4
23.718.8
15.418.9 17.3
90.9
137.2
81.1
60.3
47.8
37.6
24.620.0 19.4 17.5 15.7
85.3
0
10
20
30
40
50
60
70
80
90
100
110
120
130
140
150
USA Germany Finland Sweden Canada Denmark Netherlands Spain UK Norway Others
Jan-Jun 2014 Jan-Jun 2015 Jan-Jun 2016
M€
• Increase in Germany driven by the KaMo/Delta acquisitions
• Good progress in Sweden and Spain
• Decrease in Finland driven by Uponor Infra, the building solutions business posted growth
Roadshow presentation

© Uponor27
January – June 2016:Balance sheet
July 2016
• Increase in the balance sheet driven by the German acquisitions and a growing business in Building Solutions - North America
• Non-controlling interest represents €63.8m of the total equity at €299.2m
M€ 30 Jun 30 Jun Change 31 Dec2015 2016 Y/Y 2015
Property, plant and equipment 209.5 221.7 +12.2 221.4Intangible assets 96.3 121.4 +25.1 94.7
Securities and long-term investments 10.8 21.6 +10.8 21.0Inventories 131.2 133.6 +2.4 112.4
Cash and cash equivalents 16.5 24.8 +8.3 49.2Other current and non-current assets 252.5 269.4 +16.9 209.1
Total equity 290.6 299.2 +8.6 311.7Non-current interest-bearing liabilities 100.4 139.1 +38.7 91.2
Provisions 17.4 26.4 +9.0 25.0Current non-interest-bearing liabilities 253.5 267.0 +13.5 231.6
Current interest-bearing liabilities 54.9 60.8 +5.9 48.3Balance sheet total 716.8 792.5 +75.7 707.8
July 2016 Roadshow presentation

© Uponor28
January – June 2016:Cash flow
July 2016
M€ 1-6 1-6 Change 1-122015 2016 Y/Y 2015
Net cash from operations +47.1 +55.1 +8.0 +105.6Change in NWC -50.2 -41.9 +8.3 -15.0
Net payment of income tax and interest -16.7 -16.6 +0.1 -32.4Cash flow from operations -19.8 -3.4 +16.4 +58.2
Cash flow from investments -12.5 -44.4 -31.9 -41.7Cash flow before financing -32.3 -47.8 -15.5 +16.5
Dividends and buy backs -30.7 -32.2 -1.5 -30.7Other financing +18.5 +56.5 +38.0 +2.3
Cash flow from financing -12.2 +24.3 +36.5 -28.4
Conversion differences +0.8 +0.1 -0.7 -0.1
Change in cash and cash equivalents -43.7 -23.4 +20.3 -12.0
• Improved cash flow from operations
• Cash flow from investments includes cash flow-out related to the German acquisitions (€31.4m)
• Gross CapEx (€15.7m) below depreciation and slightly down year-on-year
• Cash flow from investments in the comparison period includes a netcash flow effect of €+5.9m from the divestments of Uponor Infra’s Thai business and Extron Engineering Oy in Finland
July 2016 Roadshow presentation

© Uponor29
Outlook for the future

© Uponor30 July 2016
Indicator YTD% Change
Rolling 12-month % Change Data through Trend since Q1
updateUSA Housing starts1) -2% N/A June 2016
Germany Housing permits +29% +18% May 2016
Finland Housing permits +10% +7% April 2016
Sweden Housing starts +47% +30% Q1 2016
Canada Housing starts1) +14% N/A June 2016
Denmark Housing starts +13% -11% March 2016
Netherlands Housing permits -42% -15% April 2016
Spain Housing permits +42% +32% April 2016
UK Housing starts2) -9% +2% Q1 2016
Norway Housing starts +11% +14% May 2016
Leading indicators: stable market outlook overall
1) Seasonally adjusted, annualised rate vs. same month in 2015 2) England only
Roadshow presentation

© Uponor31 July 2016
60
80
100
120
140
160
180
200
Jan-
08Ju
n-08
Nov
-08
Apr
-09
Sep
-09
Feb-
10Ju
l-10
Dec
-10
May
-11
Oct
-11
Mar
-12
Aug
-12
Jan-
13Ju
n-13
Nov
-13
Apr
-14
Sep
-14
Feb-
15Ju
l-15
Dec
-15
Residential buildings Non-residential buildings
Building permits in Europe have continued to make gains from all-time lows
Source: Eurostat (Base year = 2010)
European building permits index (Euro Area 19, seasonally adjusted)
• Permit activity has continued to slowly trend upwards in both the residential and non-residential segments (data through February 2016)
• Comparing the first months of 2016 to 2015, the largest gains were made in Germany, Spain, and Norway
Roadshow presentation
© Uponor32
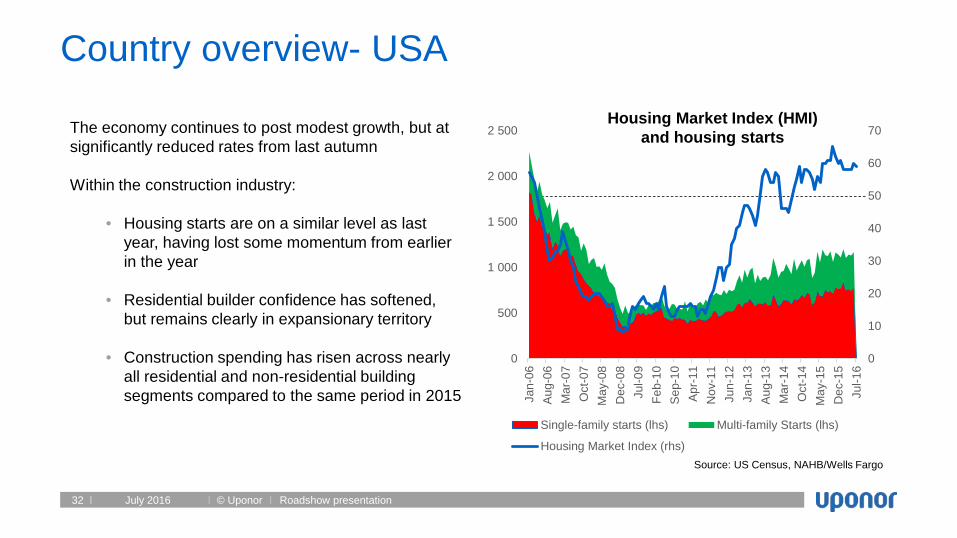
Country overview- USA
The economy continues to post modest growth, but at significantly reduced rates from last autumn
Within the construction industry:
• Housing starts are on a similar level as last year, having lost some momentum from earlier in the year
• Residential builder confidence has softened, but remains clearly in expansionary territory
• Construction spending has risen across nearly all residential and non-residential building segments compared to the same period in 2015
Housing Market Index (HMI) and housing starts
Source: US Census, NAHB/Wells Fargo
0
10
20
30
40
50
60
70
0
500
1 000
1 500
2 000
2 500
Jan-
06A
ug-0
6M
ar-0
7O
ct-0
7M
ay-0
8D
ec-0
8Ju
l-09
Feb-
10S
ep-1
0A
pr-1
1N
ov-1
1Ju
n-12
Jan-
13A
ug-1
3M
ar-1
4O
ct-1
4M
ay-1
5D
ec-1
5Ju
l-16
Single-family starts (lhs) Multi-family Starts (lhs)
Housing Market Index (rhs)
July 2016 Roadshow presentation

© Uponor33 July 2016
Country overview- GermanyGerman housing permits
and builder confidence
Source: Destatis and Eurostat
-35
-30
-25
-20
-15
-10
-5
0
140000
160000
180000
200000
220000
240000
260000
280000
300000
Jan-
09A
ug-0
9M
ar-1
0O
ct-1
0M
ay-1
1D
ec-1
1Ju
l-12
Feb-
13S
ep-1
3A
pr-1
4N
ov-1
4Ju
n-15
Jan-
16
Con
stru
ctio
n co
nfid
ence
indi
cato
r
Perm
its (r
ollin
g 12
-mon
th to
tal)
Rolling 12-month permit total (lhs)
Construction confidence (rhs)
The economy has so far continued to brush off external uncertainties, with households driving economic growth
Within the construction industry:
• Builder confidence has reached another post-reunification high
• Order book development has remained generally positive in both the residential and non-residential segments
• Permit levels continue to develop positively across most building segments
Roadshow presentation
© Uponor34
Management agenda for 2016 –No change in focus since Q1
• Complete the broad-based transformation in Europe, including manufacturing footprint optimisation, targeting a clear growth in net sales
• Start the manufacture of indoor climate and plumbing products in China
• Uphold customer satisfaction and sales growth in North America, while continuously upgrading manufacturing capacity
• Boost investment in research, technology and corporate development in order to maintain lead in sustainable building technology
July 2016 Roadshow presentation
© Uponor35 July 2016
• Despite recent encouraging stability, volatility in the market is expected to continue
• No sign of changes in the market place in the near future, which could materially affect demand in 2016 from our earlier forecast– Direct impact of ‘Brexit’ not meaningful due to Uponor’s low exposure to the UK market– Wider political and economic repercussions remain to be seen
• In 2016, the Group's capital expenditure will temporarily increase from that experienced in the last few years and reach circa €58 million, against €50 million in 2015 (excluding any investment in shares)
• Assuming that economic development in Uponor's key geographies continues undisturbed, Uponor reiterates earlier guidance from February 2016:
The Group’s net sales and comparable operating profit are expected to improve from 2015
Guidance 2016
Roadshow presentation

© Uponor36 July 2016
-15
-10
-5
0
5
10
15
20
25
Builder confidence in Europe has strengthened in most markets compared to last year
Source: Eurostat
Change in construction confidence(Q2 2016 avg. vs Q2 2015 avg.)
EU construction confidence
-45
-40
-35
-30
-25
-20
-15
-10
-5
0
Jan-
09Ju
n-09
Nov
-09
Apr
-10
Sep
-10
Feb-
11Ju
l-11
Dec
-11
May
-12
Oct
-12
Mar
-13
Aug
-13
Jan-
14Ju
n-14
Nov
-14
Apr
-15
Sep
-15
Feb-
16
Roadshow presentation

© Uponor37 July 2016
Country overview- Finland
Finnish housing permits and builder confidence
Source: Statistics Finland & Eurostat
-70
-60
-50
-40
-30
-20
-10
0
10
2000
2500
3000
3500
4000
4500
Jan-
09A
ug-0
9M
ar-1
0O
ct-1
0M
ay-1
1D
ec-1
1Ju
l-12
Feb-
13S
ep-1
3A
pr-1
4N
ov-1
4Ju
n-15
Jan-
16 Con
stru
ctio
n co
nfid
ence
indi
cato
r
Rol
ling
12-m
onth
tota
l, in
thou
sand
m2
Permits (lhs)
Construction confidence indicator (rhs)
While the economy has likely returned to growth, significant challenges continue to be present
Within the construction industry:
• Construction volumes and permit activity have increased compared to last year (from a very low base)
• However, the positive trend witnessed in builder confidence has halted during recent months
Roadshow presentation

© Uponor38 July 2016
Country overview- Sweden
Housing starts in Sweden
Source: Statistics Sweden
0
10 000
20 000
30 000
40 000
50 000
60 000
0
2 000
4 000
6 000
8 000
10 000
12 000
14 000
16 000
18 000
Q1 Q3 Q1 Q3 Q1 Q3 Q1 Q3 Q1 Q3 Q1 Q3 Q1 Q3Q1 Q3 Q1
2008 2009 2010 2011 2012 2013 2014 20152016
Rol
ling
4-qu
arte
r tot
al
Qua
rterly
am
ount
Quarterly (lhs) Rolling 4-quarter total (rhs)
While some measures of trade have slowed, nearly every component of the economy continues to grow
Within the construction industry:
• The residential new-build segment continues to grow significantly, reaching a 25-year high
• However, builder confidence has moderated in recent months and non-residential and civil engineering activity remain more constrained
Roadshow presentation

© Uponor39
Follow us: investors.uponor.com
Twitter: @UponorIR
LinkedIn: Uponor
Uponor’s IRapp