robbery in the city of pittsburghapps.pittsburghpa.gov/dps/robbery_in_the_city_of_pittsburgh.pdf ·...
TRANSCRIPT

www.pittsburghpa.gov/police
1. INTRODUCTION
This brief presents an analysis of robbery in the City of Pittsburgh from January 2005 through July 2015. It begins with a study of trends in the annual rate of robbery and an examination of the nature of these crimes, with special attention to crime characteristics and victim demographics. This brief concludes with an examination of the Pittsburgh Bureau of Police’s clearance rate statistics and the relationship between clearance rates and the demographics of robbery victims.
This document offers four broad conclusions about robbery in the City of Pittsburgh:
1. Robbery rates have declined since 2005, and remain among the lowest in the Pittsburgh Today comparison group.
2. Robbery is most prevalent in neighborhoods historically beset by violent crime, including Homewood, Garfield and the North Side.
3. Victims of robbery are disproportionately young and male, with high rates of victimization among African Americans.
4. Robbery clearance rates are higher than those of comparable cities, but vary depending on the location of the crime and the demographics of the victim.
Robbery Defined
Taking or attempting to take anything of value from the care, custody, or control of a person
or persons by force or threat of force or violence and/or by putting the victim in fear.
— The FBI Uniform Crime Report
Robbery in the City of Pittsburgh
OCTOBER 2015

City of Pittsburgh Bureau of Police | Robbery in the City of Pittsburgh: 2005 through 2015 | October 2015 page 1
www.pittsburghpa.gov/police
2. DATA
2.1. Sources
City of Pittsburgh Bureau of Police Offense DataThe analysis in this report is drawn, largely, from incident data collected by the City of Pittsburgh Bureau of Police and reported under the FBI Uniform Crime Report. These data are available for incidents that occurred from January 2005 through July 2015, and include information about the location, date, time and clearance status of each incident. These data also include victim information, including age, race and gender, for the period January 2009 through July 2015.
Federal Bureau of Investigation, Uniform Crime Report (UCR)The Federal Bureau of Investigation collects crime data from police agencies nationwide. Because crime rates tend to vary with a city’s population size,1 this brief uses data from the UCR to compare Pittsburgh’s 2014 robbery rate to similarly sized U.S. cities, referred to as the FBI cohort. Specifically, this brief compares Pittsburgh’s rate of robbery to that of cities, with populations 250,000 to 499,999, which reported this crime to the UCR in 2014.
United States Census BureauThe analysis in this brief incorporates population estimates from the U.S. Census Bureau’s 2014 Population Estimates Program to compute the robbery rates of 13 comparable U.S. cities and the City of Pittsburgh.
PGHSNAP, City of Pittsburgh Department of City Planning The analysis of robbery incident rates by neighborhood incorporates data from the City of Pittsburgh’s Department of City Planning data tool, PGHSNAP. PGHSNAP offers population and demographic statistics derived from the 2010 U.S. Census.
Pittsburgh TodayThis report uses 13 of the 14 Pittsburgh Today benchmark cities to compare Pittsburgh’s robbery rate to those in comparable cities. Pittsburgh Today is a University of Pittsburgh project that has identified a list of 14 U.S. cities that are similar in size and demographics to the City of Pittsburgh, for use in comparing key indicators. The Pittsburgh Today benchmark cities include: Baltimore, Boston, Charlotte, Cleveland, Cincinnati, Denver, Detroit, Indianapolis, Kansas City, Milwaukee, Minneapolis, Philadelphia, Richmond and St. Louis. Indianapolis is omitted from this analysis, due to inconsistencies in data reported to the FBI.
1 Lee Ellis, Kevin M. Beaver, and John Wright, Handbook of Crime Correlates, 2009, San Diego, CA: Academic Press.

City of Pittsburgh Bureau of Police | Robbery in the City of Pittsburgh: 2005 through 2015 | October 2015 page 2
www.pittsburghpa.gov/police
2.2 Period of StudyMuch of the analysis in this report is derived from incident records collected from 2005 through 2014, the most recent years for which complete and reliable City of Pittsburgh data are available. A study of clearance rates, for example, would be skewed by the inclusion of recent 2015 records, since there is a lower likelihood of case resolution. However, this report does include 2015 data in analyses of victim demographics, as the 2015 records offer victim descriptions nearly as complete as those of prior years. Victim data are only available for records collected from January 2009 through July 2015.
In comparing across U.S. cities, this report draws on data from the FBI’s Uniform Crime Reporting Program, which has released national statistics through 2014. Comparisons of robbery rates or clearance rates, therefore, include comparisons to Pittsburgh’s 2014 data.
2.3 Incident-level AnalysisThis report uses incidents, rather than victims, as the primary unit of analysis. In the case of robbery, for example, it is possible for a perpetrator to rob multiple victims at a single location. Records of this kind were consolidated for the purposes of this brief, with the exception of victim demographic analysis, which employs victim-level data.
2.4 The Limits of Police DataIn 2014, the National Crime Victimization Survey conducted by the Bureau of Justice Statistics (BJS) estimated that 29 percent of robberies go unreported.2 The BJS posits that victims of robbery or witnesses to a robbery might choose not to report the crime if they fear reprisal, have a relationship with the perpetrator, or believe that the police will not solve the case or provide desired assistance. Since the data used in this report include only those cases reported to the police or observed by an officer, this analysis could be impacted by selection bias. It is important to consider the ways in which differences in reporting may skew our perception of the nature of robbery or the demographic profile of its victims.
3. ANALYSIS
3.1 Trends in RobberyIn 2014, Pittsburgh Police received approximately 950 reports of robbery, at a rate of 321 robberies per 100,000 city residents. This rate is lower than those of many of the Pittsburgh Today benchmark cities, with the exception of Richmond, Charlotte, Boston and Denver. Figure 1 compares Pittsburgh’s 2014 robbery rate to the rates of the 13 comparison cities.
2 Bureau of Justice Statistics, “Criminal Victimization, 2014,” http://www.bjs.gov/content/pub/pdf/cv14.pdf

City of Pittsburgh Bureau of Police | Robbery in the City of Pittsburgh: 2005 through 2015 | October 2015 page 3
www.pittsburghpa.gov/police
FIGURE 1: Robbery rates of comparable U.S. cities, 2014
Among 44 cities in the FBI cohort, Pittsburgh’s 2014 robbery rate ranked 14th-highest, as Figure 2 shows. Its robbery rate, at 321 per 100,000 residents, was about one-fifth higher than the average of all cohort cities (261 per 100,000 residents). Among the four geographically-closest cohort cities, Pittsburgh’s robbery rate was virtually the same as Toledo’s, while considerably less than that of Cincinnati, Buffalo and Cleveland.
0 100 200 300 400 500 600 700 800
Denver
Charlotte
Boston
Richmond
Pittsburgh
Kansas City
Philadelphia
Cincinnati
Minneapolis
St. Louis
Detroit
Milwaukee
Baltimore
Cleveland

City of Pittsburgh Bureau of Police | Robbery in the City of Pittsburgh: 2005 through 2015 | October 2015 page 4
www.pittsburghpa.gov/police
FIGURE 2: Robbery rates of similarly sized U.S. cities, 2014
Pittsburgh’s 2014 rate was among the lowest this decade. From 2005 through 2014, Pittsburgh’s robbery rate fell by 34 percent. Table 1 details the year-over-year percent change in robbery across this 10-year period. Figure 3 plots the robbery rate for the last 10 years, showing a steady improvement.
0 100 200 300 400 500 600 700 800 900
Oakland, CACleveland, OH
Newark, NJAtlanta, GABu�alo, NY
St. Louis, MOMinneapolis, MN
Cincinnati, OHMiami, FL
New Orleans, LAStockton, CA
Kansas City, MOToledo, OH
Pittsburgh, PASt. Petersburg, FL
Orlando, FLJersey City, NJ
Tulsa, OKSt. Paul, MN
Sacramento, CALong Beach, CABakersfield, CA
Lexington, KYGreensboro, NC
Mobile, ALOmaha, NE
Anchorage, AKTampa, FL
Riverside, CAFort Wayne, INSanta Ana, CAArlington, TXAnaheim, CA
Aurora, COCorpus Christi, TX
Mesa, AZColorado Springs, CO
Chula Vista, CALaredo, TXLincoln, NE
Henderson, NVPlano, TX
Virginia Beach, VAChandler, AZ

City of Pittsburgh Bureau of Police | Robbery in the City of Pittsburgh: 2005 through 2015 | October 2015 page 5
www.pittsburghpa.gov/police
TABLE 1: Year-over-year percent change in the rate of robbery in Pittsburgh, 2005 through 2014
YEAR-OVER-YEAR PERCENT CHANGE
2005 -
2006 4%
2007 -8%
2008 0%
2009 -13%
2010 -12%
2011 -3%
2012 1%
2013 -16%
2014 3%
Ten-Year -34%
FIGURE 3: Robbery rate in Pittsburgh, 2005 through 2014
Although 2005 is the earliest year for which we have comprehensive data, it is useful to place this recent decade in the context of the volatile 1980s and 1990s, a period during which cities nationwide experienced unprecedented highs in their rates of violent crime. Figure 3 plots the City of Pittsburgh’s robbery rate from 1985 through 2014, using data supplied by the Pittsburgh Bureau of Police to the FBI’s Uniform Crime Reporting program. The most recent decade, highlighted in blue, appears to be a continuation of the decline that began in the early 1990s after several years of inflated rates.
0
100
200
300
400
500
600
2005 2006 2007 2008 2009 2010 2011 2012 2013 2014

City of Pittsburgh Bureau of Police | Robbery in the City of Pittsburgh: 2005 through 2015 | October 2015 page 6
www.pittsburghpa.gov/police
FIGURE 4: Robbery rate in Pittsburgh, 1985 through 2014
Similar to the trends observed in Pittsburgh, robbery rates in nearly all the benchmark cities have declined since 2005. Figure 5 plots the median robbery rate of the benchmark cities over the last 10 years, while Figure 6 presents the 10-year percent change in each city.
These comparison data suggest that recent declines in Pittsburgh’s robbery rate may be attributable to the same forces driving reductions in crime throughout the country. Research offers a number of explanations for this national trend, including the increased use of CompStat by police departments, growth in the size of police forces, changes in the age composition of the population and a decline in the use of alcohol.3
0
200
400
600
800
1,000
1985 1990 1995 2000 2005 2010 2014
3 Oliver Roeder, Lauren-Brooke Eisen, and Julia Bowling, “What Caused the Crime Decline?” February 12, 2015, https://www.brennancenter.org/sites/default/files/publications/What_Caused_The_Crime_Decline.pdf

City of Pittsburgh Bureau of Police | Robbery in the City of Pittsburgh: 2005 through 2015 | October 2015 page 7
www.pittsburghpa.gov/police
FIGURE 5: Trends in Pittsburgh’s robbery rate compared to a composite of comparable cities, 2005 through 2014
Composite Median Pittsburgh
FIGURE 6: Ten-year percent change in the robbery rates of comparable U.S. cities, 2005 through 2014
0
100
200
300
400
500
600
700
800
2005 2006 2007 2008 2009 2010 2011 2012 2013 2014
Rate
per
100,
00
0 re
side
nts
00
10
20
30
40
50
60
70
80Milwaukee
Baltimore
Cleveland
Kansas City
DetroitPittsburgh
Philadelphia
DenverCincinnati
St. Louis
BostonMinneapolis
Richmond
Charlotte
20%
40%
60%
80%
-80%
-60%
-40%
-20%

City of Pittsburgh Bureau of Police | Robbery in the City of Pittsburgh: 2005 through 2015 | October 2015 page 8
www.pittsburghpa.gov/police
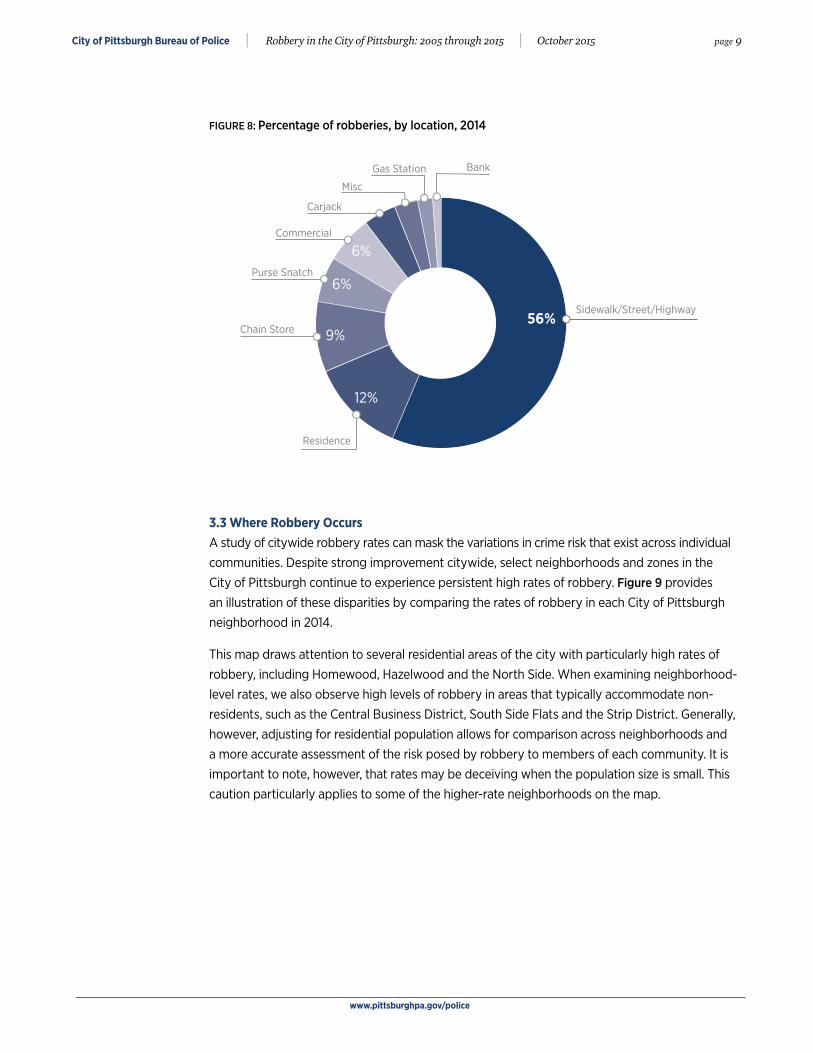
3.2 The Nature of RobberyTo effectively measure and track crime throughout the city, the Pittsburgh Bureau of Police collects data on the circumstances and methods of each reported crime. Officers who respond to a report of robbery make note of the crime’s location and the weapon used. Figure 7 serves as a snapshot of robbery throughout the City of Pittsburgh in 2014, by listing the weapons used most commonly in robbery. Nearly half of 2014 robberies involved the use of a gun, while 42 percent were strong-arm robberies (using hands, feet and/or fists). Figure 8 presents a list of the most common locations for robbery and shows that most robberies in 2014 took place on a street, highway or sidewalk.
FIGURE 7: Percentage of robberies, by weapon type, 2014
4%5%
42%
Gun
Other
Strong-arm
Knife
48%
City of Pittsburgh Bureau of Police | Robbery in the City of Pittsburgh: 2005 through 2015 | October 2015 page 9
www.pittsburghpa.gov/police
FIGURE 8: Percentage of robberies, by location, 2014
3.3 Where Robbery OccursA study of citywide robbery rates can mask the variations in crime risk that exist across individual communities. Despite strong improvement citywide, select neighborhoods and zones in the City of Pittsburgh continue to experience persistent high rates of robbery. Figure 9 provides an illustration of these disparities by comparing the rates of robbery in each City of Pittsburgh neighborhood in 2014.
This map draws attention to several residential areas of the city with particularly high rates of robbery, including Homewood, Hazelwood and the North Side. When examining neighborhood-level rates, we also observe high levels of robbery in areas that typically accommodate non-residents, such as the Central Business District, South Side Flats and the Strip District. Generally, however, adjusting for residential population allows for comparison across neighborhoods and a more accurate assessment of the risk posed by robbery to members of each community. It is important to note, however, that rates may be deceiving when the population size is small. This caution particularly applies to some of the higher-rate neighborhoods on the map.
6%
6%
12%
56%Chain Store
Purse Snatch
Sidewalk/Street/Highway
Residence
9%
Commercial
Carjack
Misc
Gas Station Bank

City of Pittsburgh Bureau of Police | Robbery in the City of Pittsburgh: 2005 through 2015 | October 2015 page 10
www.pittsburghpa.gov/police
FIGURE 9: Robbery Rate, City of Pittsburgh by neighborhood, 2014 (FBI Uniform Crime Report)
Table 2 lists the 10 City of Pittsburgh neighborhoods with the greatest number of robberies in 2014 and their corresponding robbery rates. In this table, as in the map of robbery rates, we observe high levels of robbery in neighborhoods in the East End, the Oakland area and the South Side Hilltop neighborhoods.
Rate per 100,000 Population
+

City of Pittsburgh Bureau of Police | Robbery in the City of Pittsburgh: 2005 through 2015 | October 2015 page 11
www.pittsburghpa.gov/police
TABLE 2: Neighborhoods with the greatest number of robberies, 2014
NEIGHBORHOOD ROBBERY ROBBERY RATE
Central Business District 73 2012
East Liberty 51 869
South Side Flats 43 652
Carrick 38 376
Bloomfield 35 415
Homewood South 29 1237
Hazelwood 28 649
Central Oakland 27 444
Mount Washington 27 307
Garfield 26 707
Due to variation in neighborhood crime rates, there are accompanying disparities in the number of robberies within multi-neighborhood police zones. Table 3 lists the number of robberies, the share of total robberies and the robbery rate of each City of Pittsburgh police zone. In 2014, the greatest number of robberies occurred in Zones 3 and 5, which, together, contained 42 percent of all robberies. Zone 5, which includes much of the East End, had particularly high levels of robbery, recording 228 robberies at a rate of 453 per 100,000 residents.
TABLE 3: Robberies and robbery rates within each City of Pittsburgh Police Zone, 2014
ROBBERYPERCENT OF TOTAL
RATE PER 100,000
Zone 1 150 16% 366
Zone 2 164 17% 512
Zone 3 168 18% 351
Zone 4 154 16% 173
Zone 5 228 24% 453
Zone 6 83 9% 183
3.4 When Robbery OccursThe risk to residents of robbery also varies depending on the month of the year, day of the week and time of day. Figure 10 shows the share of robberies that occurred in each month from 2005 through 2014, and contrasts that distribution with all crimes in the City of Pittsburgh. Over the 10 year period, police have documented high rates of robbery in the summer and fall. Compared to other crimes, however, robberies occur at higher percentages in the late fall and winter.

City of Pittsburgh Bureau of Police | Robbery in the City of Pittsburgh: 2005 through 2015 | October 2015 page 12
www.pittsburghpa.gov/police
FIGURE 10: Percent of robberies occurring each month of the year, 2005 through 2014
Robbery All Crimes
Rates of robbery can also vary across a single week. Figure 10 shows the share of robberies that occurred on each day of the week from 2005 through 2015. This distribution is compared to the percentage of all crimes that took place each day throughout this 10-year period. Although crime, in general, tends to be lower on the weekends, robberies occur most frequently on Saturday.
FIGURE 11: Percent of robberies occurring each day of the week, 2005 through 2015
Robbery All Crimes
0
2%
4%
6%
8%
10%
Jan Feb Mar Apr May June July Aug Sept Oct Nov Dec
0
5%
10%
15%
20%
Monday Tuesday Wednesday Thursday Friday Saturday Sunday

City of Pittsburgh Bureau of Police | Robbery in the City of Pittsburgh: 2005 through 2015 | October 2015 page 13
www.pittsburghpa.gov/police
Robberies also fluctuate over the course of a day. Figure 12 shows the distribution of robbery across 12 two-hour time increments, as observed from 2005 through 2015. The data indicate that robberies occur most frequently in the late afternoon and at night. Robberies are uncommon in the early morning, particularly between 4:00 am and 10:00 am.
FIGURE 12: Robberies by time of day, 2005 through 2015
3.5 The Victims of RobberyThe demographics of victims of robbery differ from those of the general population of Pittsburgh. Robbery victims are more likely than average Pittsburgh residents to be young, male and African American. Figure 13 compares the percentages of male and female victims across several crime types for the period from 2009 through 2015. Since 2009, 65 percent of robbery victims have been male compared to 35 percent female, and the male victimization rate for robbery is nearly double the rate for female residents.
0
500
1,000
1,500
2,000
2,500
12 amto
2 am
2 amto
4 am
4 amto
6 am
6 amto
8 am
8 amto
10 am
10 amto
12 pm
12 pmto
2 pm
2 pmto
4 pm
4 pmto
6 pm
6 pmto
8 pm
8 pmto
10 pm
10 pmto
12 am

City of Pittsburgh Bureau of Police | Robbery in the City of Pittsburgh: 2005 through 2015 | October 2015 page 14
www.pittsburghpa.gov/police
FIGURE 13: Percentage of male and female victims of robbery, 2009 through 2015
Male Female
Figure 14 compares the percentages of white and African American victims of robbery across several crime types for the period from 2009 through 2015. Although a roughly equal number of white and African American residents are victims of robbery, African Americans are over-represented among these robbery victims. With a victimization rate of 236, compared to 180 for white residents, African Americans in Pittsburgh are more likely than white residents to be victims of a robbery.
FIGURE 14: Percentage of white and African American victims of robbery, 2009 through 2015
White African American Other
0 20 40 60 80 100
Rape
Aggravated Assault
Robbery
Homicide
0 20% 40% 60% 80% 100%
Population of Pittsburgh
Robbery
Rape
Aggravated Assault
Homicide

City of Pittsburgh Bureau of Police | Robbery in the City of Pittsburgh: 2005 through 2015 | October 2015 page 15
www.pittsburghpa.gov/police
Rates of robbery victimization are also high for young adults living in Pittsburgh. Although the median age of City of Pittsburgh residents is approximately 33 years, the median age of a victim of robbery is 28.4 Table 4 compares the median ages of each Part 1 crime for the period from 2009 through 2015. These data indicate that victims of robbery tend to be younger than victims of Part 1 property crimes. Figure 15 demonstrates this difference by plotting the ages of robbery victims in comparison to the ages of victims of all Part 1 crimes. As shown in the figure, robbery victims experience the highest rates of victimization in their early 20s through early 30s.
TABLE 4: Median age of Part 1 crime victims, 2009 through 2015
MEDIAN AGE OF VICTIM
Aggravated Assault 29
Homicide 28
Rape 23
Robbery 28
Part 1 Violent Crimes 28
MV Theft 39
Arson 40
Burglary 39
Theft 35
Part 1 Property Crimes 36
All Part 1 Crimes 34
FIGURE 15: Age distribution of robbery victims, 2009 through 2015
All P1 Crimes Robbery
0
50
100
150
200
250
300
0
500
1,000
1,500
2,000
2,500
3,000
10 20 30 40 50 60 70 80 90 1000
50
100
150
200
250
300
All
P1 C
rimes
Robb
ery
4 US Census Bureau, “ACS Demographic and Housing Estimates,” 2013, http://factfinder.census.gov/bkmk/table/1.0/en/ACS/13_5YR/DP05/1600000US4261000

City of Pittsburgh Bureau of Police | Robbery in the City of Pittsburgh: 2005 through 2015 | October 2015 page 16
www.pittsburghpa.gov/police
3.6 Clearance Rates for RobberyPolice departments across the country rely on clearance rates as a measure of success. A clearance rate represents the proportion of reported crimes that are investigated and closed. A case is classified as cleared when a perpetrator is arrested and charged or when exceptional circumstances prevent the police and the courts from arresting or prosecuting a known perpetrator. While rising clearance rates can signal increased success in solving crimes, they can also be indicative of falling rates of incident reporting among hard-to-solve crimes, such as theft, or increases in rates of crimes with nearly automatic clearances, such as drug violations, disorderly conduct, or weapon violations.
Due to characteristic differences across Part 1 crimes, it is useful to calculate and track clearance rates within a single crime category. In the City of Pittsburgh, the clearance rate for robbery is the lowest of the Part 1 violent crimes. Figure 16 lists 2014 clearance rates by crime.
Key Terms
Cleared by Exceptional Means: The case is closed due to exceptional circumstances that prevent arrest and prosecution. These circumstances can include the death of a suspect, difficulty securing victim cooperation, or challenges with extradition.
Cleared by Arrest: Police have arrested a juvenile or adult in connection with the incident, charged them with the crime and turned the case over to a court.
Pending: The case remains open.
Clearance Rate: The number of cases cleared by arrest or by exceptional means as a percentage of the total number of reported incidents.

City of Pittsburgh Bureau of Police | Robbery in the City of Pittsburgh: 2005 through 2015 | October 2015 page 17
www.pittsburghpa.gov/police
FIGURE 16: Clearance rate by crime type, 2014
In 2014, Pittsburgh’s clearance rate for robbery was 41 percent, meaning that approximately two out of every five robberies reported to the police culminated in the identification of a suspect. Figure 17 presents the distribution of all 2014 robberies by clearance status: adult arrest, juvenile arrest, cleared by exception, or pending. As shown in Figure 17, adult arrest was the leading contributor to the 2014 clearance rate.
FIGURE 17: Clearance status of robbery, 2014
Figure 18 shows trends in the clearance status of robbery over the last 10 years. The robbery clearance rate has increased steadily each year, from a low of 30 percent in 2006 to the 2014 high of 41 percent. It appears that this clearance rate growth has been driven by increases in the rate of clearance by arrest.
0 10 20 30 40 50 60
Rape
Aggravated Assault
Homicide
Robbery
MV Theft
Arson
Theft
Burglary
5%4%
31%
59%
Except. Cleared
Arrest — Juvenile
Pending
Arrest — Adult

City of Pittsburgh Bureau of Police | Robbery in the City of Pittsburgh: 2005 through 2015 | October 2015 page 18
www.pittsburghpa.gov/police
FIGURE 18: Trends in the clearance status of robbery, 2005 through 2014
Arrest — Adult Arrest — Juvenile Except. Cleared Pending
To evaluate Pittsburgh’s clearance rate for robbery, it is useful to compare Pittsburgh to similar benchmark cities. Because the FBI does not report clearance rates on the city level, this brief will use the FBI’s Group I: Population 250,000 to 499,999 subset category for comparison purposes. The FBI generates data for this category by combining crime statistics for all cities with populations of 250,000 to 499,999. As shown in Figure 19, Pittsburgh’s clearance rate for robbery in 2014 was 21 percentage points higher than the rate of these similarly sized cities.
FIGURE 19: Robbery clearance rates in Pittsburgh compared to all cities with population 250,000 to 499,999, 2014
0.0
20%
40%
60%
80%
100%
2006 2007 2008 2009 2010 2011 2012 2013 2014
59%Pending
41%Cleared
25%Cleared
75%Pending
City of PittsburghCities with Population
250,000 – 499,999

City of Pittsburgh Bureau of Police | Robbery in the City of Pittsburgh: 2005 through 2015 | October 2015 page 19
www.pittsburghpa.gov/police
However, Pittsburgh’s 41 percent clearance rate does not apply uniformly to all instances of robbery; it can vary depending on location of the robbery or the demographics of a victim. Figure 20 compares the clearance rates of each robbery location for all robberies from 2005 through 2014. As shown, clearance rates for robbery are lowest when a robbery takes place on a street or highway (29%) or when the crime is classified as a purse snatching (29%). By contrast, robberies are most likely to be cleared when they occur at a bank (57%), in a residence (50%), or at a chain store (49%) — locations where a perpetrator’s identity can be determined more easily.
FIGURE 20: Robbery clearance rate by category of robbery, 2005 through 2014
There are also differences in the clearance rate for robbery depending on the demographics of the victim. Figure 21 compares the robbery clearance rates for female victims to the clearance rates for male victims. While only 32 percent of cases involving a male victim were ultimately cleared, 42 percent of cases with a female victim resulted in a clearance. Likewise, the clearance rate for robberies perpetrated against white victims was 34 percent compared to a clearance rate of 38 percent for African American victims. This difference is illustrated in Figure 22.
0
10
20
30
40
50
60
Highway
Purse Snatch
Gas Station
CommercialMisc
Carjack
Chain Store
ResidenceBank

City of Pittsburgh Bureau of Police | Robbery in the City of Pittsburgh: 2005 through 2015 | October 2015 page 20
www.pittsburghpa.gov/police
FIGURE 21: Clearance rate by the gender of the victim, all crimes, 2009 through 2014
Female Male
FIGURE 22: Clearance rate by the race of the victim, all crimes, 2009 through 2014
African American White
0
10%
20%
30%
40%
50%
60%
70%
80%
AggravatedAssault
Arson Burglary Homicide MV Theft Rape Robbery Theft
0
20%
40%
60%
80%
100%
AggravatedAssault
Arson Burglary Homicide MV Theft Rape Robbery Theft