robbing the riches: capital flight, institutions, and instability; by
TRANSCRIPT

WP/05/199
Robbing the Riches: Capital Flight, Institutions, and Instability
Valerie Cerra, Meenakshi Rishi, and
Sweta C. Saxena


© 2005 International Monetary Fund WP/05/199
IMF Working Paper
IMF Institute
Robbing the Riches: Capital Flight, Institutions, and Instability1
Prepared by Valerie Cerra, Meenakshi Rishi, and Sweta C. Saxena2
Authorized for distribution by Andrew Feltenstein
October 2005
Abstract
This Working Paper should not be reported as representing the views of the IMF. The views expressed in this Working Paper are those of the author(s) and do not necessarily represent those of the IMF or IMF policy. Working Papers describe research in progress by the author(s) and are published to elicit comments and to further debate.
Capital flight may undermine economic growth and the effectiveness of debt relief and foreign aid. This paper is the first attempt to test whether unsound macroeconomic policies orweak institutions lead to capital flight, using panel data for a large set of developing, emerging market and transition countries. In addition, the paper tests the revolving door hypothesis that links debt accumulation and capital flight, and analyzes the contribution of institutions to several channels in this relationship. JEL Classification Numbers: F20; F34; F35; O17 Keywords: Capital Flight; Institutions; Debt; Foreign Aid Author(s) E-Mail Address: [email protected]; [email protected]; [email protected]
1 The authors are grateful for helpful comments from the seminar participants at the American Economic Association Meetings (Philadelphia), the IMF Institute, the Reserve Bank of India (Mumbai), and S.P. Jain Institute of Management and Research (Mumbai). They would also like to thank Badi H. Baltagi and Simon Johnson for helpful suggestions.
2 Valerie Cerra, IMF Institute; Meenakshi Rishi, Seattle University; Sweta C. Saxena, University of Pittsburgh.

- 2 -
Contents Page I. Introduction .......................................................................................................................3 II. Background Literature.......................................................................................................4 III. Methodology and Data Construction ................................................................................6 IV. Timeline of Capital Flight and Associated Factors ...........................................................8 V. Empirical Findings............................................................................................................9 A. Determinants of Capital Flight in Cross-Sections..................................................9 B. Panel Determinants of Capital Flight ...................................................................10 C. Debt and Capital Flight: The Revolving Door .....................................................12 V. Conclusions......................................................................................................................16 References................................................................................................................................34 Tables 1. Cross-Section Regressions...............................................................................................17 2. Determinants of Capital Flight.........................................................................................18 3. Capital Flight and Domestic Credit Growth ....................................................................19 4. Determinants of Capital Flight including Time-Invariant Regressors.............................20 5. Capital Flight and Total Debt ..........................................................................................21 6. Capital Flight and Short-term Debt..................................................................................22 7. Institutional Quality in Absorbing Debt ..........................................................................23 8. Capital Flight and Aid......................................................................................................24 9. Aid....................................................................................................................................25 10. Capital Flight and Foreign Direct Investment .................................................................26 Figures 1. Macroeconomic Indicators Relative to Peak Flight or Repatriation................................27 2. Confidence Indicators Relative to Peak Flight or Repatriation .......................................28 3. Probabilities of Crises Relative to Peak Flight or Repatriation .......................................29 Appendices I. Empirical Studies of Capital Flight .................................................................................30 II. List of Countries..............................................................................................................32 III. List of Abbreviations and Variables Used in Tables .......................................................33

- 3 -
I. INTRODUCTION
In June 2005, finance ministers of the Group of Eight (G-8) industrial countries agreed to cancel at least $40 billion in debt owed by the world’s poorest nations. Under the G-8 proposal, 18 nations3 as a group will be spared $1 billion to $2 billion per year in debt service for loans from lenders such as the World Bank, the IMF, and the African Development Bank. The G-8 ministers indicated that 20 other countries could be eligible for debt relief if they meet targets for good governance and tackling corruption. The group also pledged to double aid to Africa and envisaged $50 billion in additional aid by 2010, with half of the increase going to Africa. Debt relief and foreign aid are intended to allow poor countries to use domestic resources to exit from poverty rather than forcing domestic savings to flow out of the country to service debt. Sachs et al. (2004) argue that poor nations, especially in Africa, are caught in the coils of a poverty trap characterized by high transport costs, low agricultural productivity, high disease burdens, unfavorable geopolitical factors, and the slow diffusion of technology from abroad. These factors in turn engender low savings rates and a level of capital that is below the threshold level required for industrialization. The poverty trap is further exacerbated by high rates of population growth from the rural poor who view children as an economic asset. According to Sachs et al. (2004), low capital thresholds, savings traps, and demographic traps all interact to produce a vicious cycle that keeps poor countries continually mired in poverty. If this perspective is correct, both foreign and domestic savings may be required to achieve the Millennium Development Goals of reducing global poverty by half by 2015. In Sachs’s view, an end to poverty is only possible with increased aid packages from rich donor nations.
However, many poor countries, including some targeted by the debt relief initiative, are losing more resources through capital flight than through debt servicing. For instance, Boyce and Ndikumana (2001) estimate that Africa is a net creditor to the rest of the world in the sense that private assets held abroad as measured by accumulated capital flight exceed the total stock of external debt. Therefore, the efforts of the donor community to increase savings in developing countries may be ineffective if capital flight results in a loss of scarce domestic savings. On one hand, if poor countries are to benefit from debt relief initiatives then it is vital that capital flight does not compromise any salutary benefits stemming from such initiatives. On the other hand, the debt relief initiative itself may be leveraged if such relief is associated with lower capital flight. In sum, the phenomenon of capital flight is worthy of academic attention especially in the context of debt relief. Therefore, one main objective of this paper is to understand the relationship between capital flight and debt, as well as that between capital flight and foreign aid. 3 Benin, Bolivia, Burkina Faso, Ethiopia, Ghana, Guyana, Honduras, Madagascar, Mali, Mauritania, Mozambique, Nicaragua, Niger, Rwanda, Senegal, Tanzania, Uganda, and Zambia.

- 4 -
Critics of Sachs’s optimism on foreign aid also contend that aid inflows may have resulted in dependencies and may have been wasted by inefficient or corrupt governments. Indeed, in contrast with Sachs’s view that savings traps create constraints to economic development, Acemoglu, Robinson, and Johnson (2001) identify weak institutions as the main drag on growth. Acemoglu et al. (2003) also argue that weak institutions, rather than poor macroeconomic policies, have been more important sources of volatility, including economic crises. However, the channels through which weak institutions affect development and stability are not yet well understood. A contribution of this paper is to explore whether capital flight in developing countries acts as a mediating channel between weak institutions and poor macroeconomic outcomes.
In this regard, we provide the first set of panel data estimates on capital flight for a large set of developing countries, including both macro policy and institutional variables as regressors. Our data set includes 134 developing countries over a 32-year time period from 1970 to 2001. We explore whether distorted macroeconomic policies and/or weak institutions are responsible for capital flight and other perverse economic outcomes such as high external indebtedness. In this respect, we also contribute to the literature on macroeconomic volatility in developing countries. If capital flight has an institutional cause, it would imply a link between the savings trap and institutional views of development. It would also imply that the usual policy prescription of stemming the outflow of capital by correcting macro policy distortions would be ineffective without an equal emphasis on institutional reform.
This paper is organized as follows. Section II summarizes extant literature on capital flight and, in keeping with the emphasis of the paper, discusses studies that have examined the links between institutional quality and economic performance. The literature review motivates the paper’s focus on institutional factors and their role in impelling capital flight. The research methodology, variables employed in the analysis, and testable hypotheses are discussed in Section III. We outline data sources and construction of variables and clarify the residual measure of capital flight, including our adjustment for changes in debt valuation. Section IV provides an anatomy of capital flight and repatriation, relating macro variables and confidence indicators to the peak experience of each in terms of a timeline. The empirical section (V) econometrically links capital flight to macroeconomic variables and to indices of institutional quality, and explores linkages with debt accumulation. Section VI concludes.
II. BACKGROUND LITERATURE
Capital flight is a rich area of study for development economists. For the sake of clarity we have classified capital flight studies into two main strands—determinants and associations.4 The determinants literature concentrates on identifying variables that are responsible for capital flight in a country or a cross-section of countries. Primarily, this literature identifies 4 Appendix I provides a summary of the extant literature.

- 5 -
macroeconomic policies and outcomes of macro policies—such as overvalued exchange rates, high budgetary deficits, high inflation, interest rate differentials, and domestic tax and trade policies—as significant determinants of capital flight (Cuddington, 1987; Lessard and Williamson, 1987; Boyce, 1992; Dooley and Kletzer, 1994; Henry 1996; Bhattacharya 1999). Recently, the empirical literature on the determinants of capital flight has started directing attention to non-macro variables such as political risk factors. For instance, Gibson and Tsakalotos (1993) conclude that political risk and expected depreciation were significant determinants of capital flight from five European countries. Similarly, Fatehi (1994) has examined the association between capital flight and variations in political stability in 17 Latin American countries to deduce that political instability adversely influences FDI into a country. Fatehi argues that “whatever keeps foreign investors away from a politically volatile country should influence capital flight as well” (Fatehi, 1994, p. 188). In a similar vein, Lensink, Hermes, and Murinde (1998) examine the cross-sectional relationship between political risk and capital flight for a large set of developing countries. They surmise that no matter how capital flight is defined conceptually and/or measured, political risk factors do matter in the case where no other macroeconomic variables are taken into account.
Another strand of literature on capital flight spotlights the significant and often contemporaneous association between capital flight and other perverse macroeconomic outcomes such as low rates of growth (Varman-Schneider, 1991), increased aid inflows (Collier, Hoeffler, and Pattillo, 2004), high external debt (Boyce, 1992; Chipalkatti and Rishi, 2001; Demir, 2004) and financial and currency crises (World Bank, 1998, Moghaddam et al., 2003). Where the role of institutional factors is concerned, many economists and political scientists have long argued that there is a significant association between institutions and economic performance. While North and Thomas (1973) and Bardhan (1984) have tried to model this relationship, Acemoglu et al. (2003) have focused on the effect of institutions on specific macroeconomic outcomes such as volatility, crises, and growth. The authors argue that some governments choose a battery of inefficient microeconomic and macroeconomic policies and regulations so as to extract resources from one sector of the country as transfers to other politically important sectors. They identify “constraints on the executive” as an important measure of institutional quality, arguing that extractive institutions result in macro instability.
This paper connects the literature on capital flight and the literature on the effect of institutions on economic outcomes, such as volatility. In contrast to existing studies on capital flight, this paper questions whether macroeconomic factors alone tell the full story. We contend that countries with a poor track record on macroeconomic fundamentals may also have weak institutions. Therefore, capital flight may be a byproduct of redistributive tools designed by a weakly constrained executive that is interested in “robbing the riches.”

- 6 -
III. METHODOLOGY AND DATA CONSTRUCTION
We pool time-series data on the broadest available panel of developing countries in order to examine the importance of institutional quality and macroeconomic fundamentals for capital flight. A battery of F-tests indicate that country and period effects are required. Moreover, Hausman (1978) tests indicate that random effects are highly inconsistent. Thus, unlike the majority of other panel studies on capital flight, we control for country fixed effects and period fixed effects. We also focus on the debt-flight relationship given that external borrowing has consistently shown up in the empirical literature as an important determinant of flight. Since the revolving door hypothesis describes a bidirectional relationship between capital flight and debt, we also include 2SLS estimates for each endogenous variable.
The paper investigates the linkages between capital flight, debt accumulation, macroeconomic policies, and institutional quality for a large set of economies. (1) Capital flight = f (institutional quality, macro policies and conditions, foreign financing) (2) Debt accumulation or other forms of foreign financing = g (capital flight, institutional
quality, other macro policies and conditions)
As detailed in Section II and Appendix I, the list of macroeconomic variables that potentially explain capital flight includes: interest rate differentials, inflation, growth rates, budget balances, investment, growth in domestic credit, level of foreign reserves, misaligned exchange rates, financial crises, trade openness, stock of debt and foreign financing inflows, including short-term and long-term debt, aid, and FDI. In keeping with the main emphasis of this paper, we also use various measures to capture institutional quality. Appendices II and III provide details on the sample and variables employed in the econometric analysis.
Institutional quality: We utilize variables that capture the quality of institutions, such as constraints on the power of the executive (Acemoglu et al., 2003) and political confidence (Dornbusch, 1990). The data on the quality of political and economic institutions is taken from Polity IV dataset and International Country Risk Guide, respectively. The constraint on the executive variable is constructed by the Polity IV project by coding the authority characteristics of states in the world. The variable measures the extent of regular institutional constraints on executive power. These constraints arise from accountability groups, such as legislatures and judiciaries that have equivalent or greater effective authority, or can impose constraints on executive behavior in most activities. We also explore various indicators of institutional quality or governance developed by the World Bank, the Fraser Institute, the Milken Institute, and the Heritage Foundation. Macro Variables: Data on macroeconomic variables (e.g., budget deficits, inflation, exchange rates, interest rates, etc.) is taken from the IMF’s International Financial Statistics. This macroeconomic data is supplemented in some cases with data from Asia: Key Indicators of Developing Asian and Pacific Countries by Asian Development Bank (various issues) and African Development Indicators by the World Bank (various issues).

- 7 -
Capital Flight: We use the “residual” definition of capital flight developed by various scholars at the World Bank (see Cuddington, 1986; Cumby and Levich, 1987; Dornbusch, 1990; and Hermes, Lensink, and Murinde, 2002, for a discussion and assessment of the various definitions of capital flight). The residual approach extracts the best measured components of the balance of payments identity (the current account balance, the change in external debt, net foreign direct investment, and the change in official reserves). The residual from this extraction consists of net outflows of debt and equity portfolio investment and outflows of other debt instruments, including foreign bank accounts. Although this measure may include some “normal” portfolio outflows, the unmeasured residual components of the balance of payments may also be related to the desire of domestic residents to place funds outside of the control of domestic authorities and away from any detrimental impact of poor domestic policies, such as domestic taxation or depreciation associated with a currency crisis.5 The measure is constructed as: (3) ititititit CHORCASDFIDebtKF +++∆= where Debt∆ is the change in total external debt outstanding, DFI is net foreign direct investment, CAS is current account surplus, and CHOR is the net reduction in the stock of the foreign reserves. Using Boyce and Ndikumana (2001) methodology, we adjust the change in the long-term debt stock for fluctuations in the exchange rate of the dollar against other currencies. For country i, the U.S. dollar value of the beginning-of-year stock of debt at the new exchange rates is obtained as:
(4)
1t,i1t,i1t,i1t,i
1t,sdrt,sdr1t,i
6
1j1t,jjt1t,i1t,ij1t,i
STDebt$LTUSLTMultLTother
)EX/EX/(IMFCr)EX/EX/()LTdebt*(Newdebt
−−−−
−−=
−−−−
++++
+α= ∑
where LTdebt is the total long-term debt; ijα is the proportion of long-term debt held in currency j, for each of the six non-U.S. currencies; EX is the end-of-the-year exchange rate of the currency of denomination against the dollar (expressed as units of currency per US$); IMFCr is the use of IMF credit (denominated in SDR); LTOther is long-term debt denominated in other unspecified currencies; LTMult is long-term debt denominated in
5 In preliminary regressions, we find that misinvoicing, as a mechanism of capital flight, appears to behave differently from other components of flight. One explanation may be that trade misinvoicing takes place in the presence of trade taxes and thus may be unrelated to the phenomenon of capital flight (Gibson and Tsakalotos, 1993). Also, as suggested by Chang and Cumby (1991, p. 167), the regular underreporting of trade statistics in both directions in order to evade trade barriers can “overwhelm any discernible capital flight through misinvoicing.” Thus, we don’t adjust for misinvoicing.

- 8 -
multiple currencies; LTUS$ is long-term debt denominated in U.S. dollars and STDdebt is short-term debt. The exchange rate adjusted debt can be given by: (5) 1ttt NewdebtDebtDebtadj −−=∆ Hence, the residual measure of capital flight adjusted for exchange rate fluctuations is given by: (6) ititititit CHORCASDFIDebtadjKF +++∆=
IV. TIMELINE OF CAPITAL FLIGHT AND ASSOCIATED FACTORS
In this section, we provide an anatomy of capital flight and factors associated with it, including macroeconomic and confidence indicators and financial crises. For the entire panel of 134 developing and emerging market countries over the years 1970 to 2001, we sort the country-year data pairs on capital flight into the top quartile of capital flight and the top quartile of capital repatriation. Each of these country-year episodes in the top quartile for capital flight are aligned as “time zero” for capital flight, and an equivalent timeline is constructed for repatriation. However, for any episode in which the capital flight (repatriation) experience is in the top quartile for two consecutive years for the same country, we pick the year of maximum flight (repatriation) as time zero. Summary information on macroeconomic variables, confidence indicators, and dummies for currency and banking crises are shown for the previous three years, contemporaneous year, and subsequent three years to the set of time zero maximum capital flight (repatriation). The summary information for each variable consists of its median value of the top quartile sample relative to the median value for the middle half, the “tranquil” period, of the panel.6
Macroeconomic indicators show marked differences in the years surrounding capital flight relative to the years surrounding capital repatriation (Figure 1). The growth rate declines precipitously in the two years prior to maximum capital flight, while growth is slightly above normal during episodes of capital repatriation. Inflation is on a downward trend for both types, but the level is higher for episodes of flight than for repatriation. Budget balances tend to slump prior to and during flight, and government foreign borrowing surges. All four measures of confidence tell a similar story (Figure 2). We show a political, financial, economic, and composite indicator of confidence, from International Country Risk Guide (ICRG) from the PRS Group (East Syracuse, New York). The indicators unanimously
6 The currency and banking crises are dummy variables. Therefore, we use the mean values in place of median values.

- 9 -
suggest that confidence declines dramatically in the periods before, during, and after capital flight, with nadir centered in the year of maximum flight. The repatriation experience is markedly different. Sentiment is lower than normal three years before repatriation, but rises steadily. Confidence continues to improve after the year of maximum repatriation, reaching its zenith two years thereafter.
Probabilities of banking and currency crises rise prior to capital flight (Figure 3). Banking crises probabilities are constructed as the mean of dummy variables corresponding to banking crisis dates provided by Caprio and Klingebiel (2003). Currency crises dummies are formed for country-year pairs in the top quartile of an exchange market pressure index of reserve loss and exchange rate depreciation. Therefore, by construction, the mean probability of a currency crisis is 25 percent. Figure 3 shows that the probability of a currency crisis is considerably higher in the years before and during capital flight. However, the probabilities are similar to the mean for capital repatriation.
V. EMPIRICAL FINDINGS
A. Determinants of Capital Flight in Cross-Sections
Cross-section regressions show that the political and business environment is related to capital flight. We use three measures of politically connected firms from Faccio (2005)—the percent of firms connected with a member of parliament (MP) or a minister (Polcon1), the percent of firms connected with a MP, a minister, or close relationship (Polcon2), and the percent of top 50 firms connected with a minister, MP, or close relationship (Polcon3). We find that the average level of capital flight from 1992–2001 is greater in countries with a higher percentage of politically connected firms, with the strongest results for connections to a minister or MP (Table 1). The R-squared statistics are quite high for each regression, as the percentage political connections explain close to 50 percent of the variation.
Some additional indicators of institutional environment are also important in a cross-section. An indicator of the control of irregular payments from the Fraser Institute (measured such that higher values are associated with less irregular payments) has a significant negative relationship with capital flight when controlling for politically connected firms and income per capita. Higher-quality banking governance, from the Milken Institute, significantly reduces capital flight in countries with politically connected firms. A possible implication is that better bank governance can impede capital flight even in countries with a higher percentage of politically connected firms. Lastly, we examine the measure for initial institutional quality identified by Acemoglu, Johnson, and Robinson (2001) viz., settlers’ mortality. They contend that higher rates of mortality among settlers in a sample of former colonies led to extractive institutions run by a select group of elites. In contrast, colonies that were settled in high numbers by colonial powers developed strong and representative institutions. We find that higher rates of settlers’ mortality are significantly associated with average capital flight over the available sample from 1971–2001 when controlling for per capita GDP, although the R-square is not as high as for politically connected firms.

- 10 -
The cross-section results are suggestive, but limited. Cross-section regressions may not be capable of controlling for all important country effects that influence capital flight. The omitted country effects could be correlated with the regressors, biasing the results. Panel data analysis can control for country-specific effects. In addition, panel data analysis can allow us to examine the consequences for capital flight of changes in macroeconomic policies and conditions and the quality of institutions over time. These results can address the arguably more important policy question of how such policy and institutional changes within a country can affect flight from it. Can changes in policies and institutions make a difference, or is fate sealed by some original sin?
Another caveat of the cross-section regressions is the samples are small. The regressions using Faccio’s politically connected firms consist of the 21 countries that overlap with our capital flight data. The remainder of Faccio’s data on 47 countries consists mostly of industrial countries. The settlers’ mortality regression contains 47 countries that were former colonies, but as with cross-country growth regressions, changes to the regressor set can strongly influence the results. We thus turn to a more informative panel data on the largest available set of nonindustrial countries for the period 1971–2001.
B. Panel Determinants of Capital Flight
Institutional quality is a significant determinant of capital flight in a large panel sample of developing and emerging market countries. Given our use of fixed effects, we require indicators of institutional quality that are available as long-time series. This requirement narrows our selection of indicators to the Polity and ICRG data for the panel specifications. Other institutional and governance indicators are cross-sectional or have only a few observations for each country, primarily from recent years. The ICRG measure of confidence in the political system and confidence in the economy are both negative and individually significant when no other macroeconomic variables are included in the regression. However, these perception-based indicators are not significant once we control directly for the macroeconomic policies and the state of the economy that influence confidence. Thus, for subsequent regressions we focus on the Polity measure of institutions.
Table 2 shows that the Polity measure of institutional quality, constraint on executive power (EXCONST), is highly significant for capital flight to GDP (KF2GDP) in a regression even controlling for other determinants. The significance of constraints on executive power may indicate that executive power can be used by corrupt governments to transfer resources to themselves and other elites, and so the resources can be transferred abroad. As the regressions already control for other country-specific factors through the fixed effects, this result indicates that even changes in institutional quality over time can have significant effects on macroeconomic outcomes, such as capital flight.
Poor economic conditions and policies lead to capital flight, even after controlling for institutional quality. Low growth (GRRT), high fiscal deficits (BUDBALGDP), and currency crises (CURRCRISIS) lead to significantly higher capital flight (Table 2). This result suggests that residents seek the refuge in foreign markets when they expect returns on

- 11 -
domestic savings to be depressed as a result of economic weakness, currency depreciation from a crisis, or future taxation to repay government debt. Domestic credit growth (DOMCRGR) is also significantly higher two years prior to capital flight, indicating that credit transferred to the private sector through the banking system may provide the resources for flight. The tail end of a credit boom is typically associated with a crisis, which may lead to capital flight.7 Capital flight is also persistent, indicating that policies and conditions leading to capital flight may have a larger long-run impact. One-year lags of the macroeconomic and institutional determinants (growth, fiscal balance, currency crisis, and executive constraints) are also significant for flight, with very similar coefficients and standard errors as their contemporaneous values. Therefore, to avoid interpretative difficulties due to a theoretically possible endogeneity of the contemporaneous variables, we use the predetermined variables for the remainder of the regressions.
Some variables that are standard determinants of capital flight in the literature are not significant in the panel regressions. For instance, cross-section regressions in the capital flight literature sometimes identify inflation, trade openness, and the level of foreign exchange reserves (as a percent of GDP) as determinants of capital flight (Lensink, Hermes, and Murinde, 1998). Some studies also find higher domestic interest rates relative to U.S. rates reduce capital flight, consistent with a portfolio motive that seeks higher returns (Hermes and Lensink, 1992). The panel results in Table 2 show that these variables (INFLATION, TRADE2GDP, FOREX2GDP, INTRT-USINTRT) are insignificant once the other determinants and fixed effects are taken into account.
We control for country and period effects, which F-tests indicate are present. We allow fixed effects for each, as Hausman tests reject the consistency of the random effects estimators. Since capital flight exhibits dynamic adjustment, the country-fixed effects are correlated with the lagged dependent variable. However, the order of bias is 1/T (Nickell, 1981), which is fairly small for this dataset. Indeed, Judson and Owen (1999) show that the bias of the least squares dummy variable (LSDV) estimator is approximately 2–3 percent on the lagged dependent variable and less than 1 percent on the regressor for a panel of size N=100, T=30, and low persistence. They recommend the LSDV estimator for an unbalanced panel of such dimensions. Nevertheless, we do robustness tests using Arellano-Bond (1991) and Arellano-Bover (1995) estimators, which are designed to control for endogeneity between the lagged dependent variable and the country effect. The Arellano-Bond method estimates the model in first differences, using earlier lags of the dependent variable as instruments. Qualitatively, the results remain the same as before. However, the magnitudes of coefficients differ considerably, mostly larger in absolute value. However, the Arellano-Bond estimator has 7 Kaminsky, Lizondo, and Reinhart (1998) find domestic credit as a leading indicator of balance of payments crises and Demirguc-Kunt and Detragiache (1997) note that lagged credit growth is one of the best early warning indicators of a banking crisis. Terrones (2004) finds collapses in output, consumption, and investment that reach their lowest levels two years after the peak of credit expansion.

- 12 -
been shown to be biased due to the weak instrument problem. The Arellano-Bover method estimates equations in levels, using the forward orthogonal deviation of the RHS variables in order to remove the country effects. The coefficient estimates, as displayed in Table 2, are quite similar to the fixed effects specification, although with much higher significance levels. These results corroborate the limited bias of the fixed effects estimator for this dataset. Consistent with our robbing the riches hypothesis, resources from the banking system are drained out as capital flight in the presence of weak institutions. Table 3 shows that the impact of domestic credit growth on subsequent capital flight depends on the quality of institutions. We interact domestic credit growth with the country-average level of a variety of indicators of institutional quality and governance, measured such that higher values are associated with better governance. These include indices of control of corruption, political stability, government effectiveness, rule of law (all from the World Bank, see Kaufmann, Kraay, and Zoido-Lobatón, 1999), control of irregular payments (Fraser Institute), and the Fraser Institute summary indicator. All interaction terms are significantly negative, implying that better-quality institutions and good public governance can ameliorate the flight of capital stemming from domestic credit booms. We provide a set of panel estimates that include time invariant regressors (Table 4). These regressions are motivated by the Hausman and Taylor (1981) estimator. This estimator can be used for panel regressions when only some of the regressors are correlated with the country effect. Time-varying regressors are formed as deviations from their cross-sectional means, and the between variation (cross-sectional means) of the exogenous regressors can be used as instruments for endogenous time-invariant regressors (provided that identification requirements are met). We assume that the lagged dependent variable and the time-varying regressors are all potentially endogenous with the country effect, but that the time-invariant regressor is exogenous (as in a cross-section regression). As expected, coefficients on the time varying regressors in deviations from means are very similar to the earlier regressions in Table 2. All four of the World Bank indices of good governance are negatively related to capital flight, but the Fraser Institute variables are insignificant (not shown). As in the cross-section regressions shown in Table 1, the percent of politically connected firms in a country is positively related to capital flight.
C. Debt and Capital Flight: The Revolving Door
Many studies find that an increase in foreign borrowing, particularly by the public sector, is concurrent with outflows by domestic residents and firms (see Appendix I). Ndikumana and Boyce (2003) provide evidence of a revolving door syndrome between external borrowing and capital flight in a sample of 30 sub-Saharan African countries.
Indeed, an increase in external debt has a strong relationship with capital flight in our large panel of countries. The coefficient on the change in total debt in the equation for capital flight is positive and significant (Table 5). This relationship may indicate that increased external borrowing can prompt flight if residents fear the likelihood of a debt crisis and/or a potential nationalization of debt repayments (Eaton, 1987). Increased external debt may

- 13 -
induce capital flight as it increases expectations about exchange rate devaluations (Fry, 1993) or deterioration of other macro conditions that affect the returns on domestic assets. In addition, the change in debt can provide liquidity for elites to “rob the riches.” That is, public external borrowing or other forms of borrowing from abroad can be channeled to the elites in economies with low constraints on executive power, poor banking supervision, or other institutional weaknesses. Elites can park their savings abroad to avoid periods of macroeconomic instability, saddling less influential residents with the burden of adjustment. This “debt-fueled” capital flight can be a channel through which weak institutions contribute to economic volatility. A reverse causal link connects capital flight to the change in debt, as the flight of domestic savings itself creates a need for foreign financing. Both channels suggest a positive association between flight and increases in debt, a relationship that shows up powerfully in the regression results. The strong contemporaneous relationship between foreign borrowing and capital flight may be indicative of simultaneity. Foreign borrowing may provide resources for residents’ outflows. This latter channel could be mediated through a banking system with weak supervision that provides loans to elites or to connected owners of firms in times of macro distress. Table 5 shows that 21 cents of each dollar of additional debt flows back out of the country as capital flight (since the units are both in percent of GDP). Conversely, capital flight can generate a financing need, so that foreign borrowing substitutes for the outflow of domestic savings. Indeed, each dollar of capital flight draws in 69 cents of new borrowing. Hausman tests reject the null hypothesis of exogeneity for debt in the capital flight equation and for flight in the debt equation. Given this finding of endogeneity, we also present two stage least squares (2SLS) equations for capital flight and debt. The lagged ratio of capital flight to GDP, budget balance to GDP, and growth rates serve as instruments for flight, and lagged trade openness, the lagged debt ratio (TOTDEBT2GDP), and lagged government expenditure ratio (GOVEXP2GDP) serve as instruments for the change in debt. The F-statistic for joint significance of the instruments is 58 for the debt instruments and 25 for the capital flight instruments, suggesting strong and relevant instruments. In addition, the J-test fails to reject the over identifying restrictions, consistent with the exogeneity of the instruments. The debt-fueled capital flight and financing need channels both remain significant even in the 2SLS equations. The financing need channel continues to dominate in terms of the magnitude of the coefficients, with the financing need increasing from 69 cents to 81 cents in the 2SLS regression. The impact of debt on capital flight rises as the maturity of debt falls. As displayed in Table 6, increases in short-term debt are much more strongly linked to capital flight than are increases in total debt. One dollar of additional short-term debt is associated with 84 cents of capital flight (Table 6), versus only 21 cents of outflow for total debt (Table 5). In the 2SLS regressions, the difference is even more striking. One dollar increase in short-term debt generates 92 cents of capital flight, compared to 13 cents in the case of total debt. While the volatility of short-term debt is well documented in the literature (Rodrik and Velasco, 1999), Table 6 provides evidence that capital flight can be a mediating channel through which short-term debt can increase the macroeconomic vulnerability of an economy.

- 14 -
Debt accumulation is related to macroeconomic policies. Higher government expenditure to GDP ratios lead to greater debt accumulation, even in the following year. Openness to trade, measured as the sum of exports and imports to GDP, is associated with subsequent reductions in debt. The negative coefficient on the lagged level of the debt ratio indicates that change in short-term debt is typically nonexplosive, although this finding does not rule out that adjustment to reduce high and unsustainable total debt ratios may be painful. One dollar of capital flight spawns 81 cents of additional external financing (Table 5), out of which 12 cents of the additional debt is of short-term maturity (Table 6).
Countries with weak institutions are more addicted to external debt accumulation, especially through the withdrawal of domestic savings via capital flight. Better institutions, proxied by the constraint on executive power, strongly reduce debt accumulation when capital flight is excluded from the debt equations (Tables 5 and 6). Notably, this relationship disappears when capital flight is added as a regressor (OLS and 2SLS in Tables 5 and 6). Thus, weak institutions do not directly lead to debt accumulation, but increase debt by encouraging capital flight. In contrast, the other explanatory variables for the change in debt are hardly affected by the introduction of capital flight. Conversely, controlling for the endogeneity of debt in the capital flight equation through 2SLS, we find a stronger relationship between institutional quality and capital flight. These joint results indicate that weaker institutions not only spur capital flight but also raise the proclivity for debt accumulation through the financing need generated by the flight of capital. In other words, capital flight operates as the conduit through which poor institutional quality engenders macroeconomic instability, even as capital flight, in turn, responds to poor macroeconomic policies. As elites and other residents move domestic resources offshore, the country resorts to external borrowing to fill the savings gap. Foreign finance presumably has a comparative advantage if it comes conditional on tax concessions, hard currency denomination, and the protection of international sanctions. The ensuing debt accretion further impairs macro stability, and leaves the country more vulnerable to shocks.
We also examine the interactive role of institutional quality in each channel of the revolving door relationship between capital flight and debt accumulation. We find that institutional quality plays a role in access to finance. Strong constraints on executive power and more income equality (AVEINCSHTOP10) allow a country to tap foreign markets for borrowing in the presence of capital flight (Table 7). This financing factor may help to explain the otherwise puzzling results that contemporaneous debt-fueled capital flight is more pronounced in countries with good institutions and low inequality. That is, the counterintuitive result may relate to the endogeneity between capital flight and debt accumulation. Although our instruments pass tests of over-identifying restrictions, econometric procedures are not directly capable of verifying the exogeneity of the instruments. Thus, the result on institutions and debt-fueled capital flight should be treated with caution. A second explanation for the puzzle involves potential time lags between external borrowing, the extraction of resources by elites, and the transference of those resources abroad. We show alternative specifications using predetermined changes in debt, which should help address both concerns. Predetermined specifications allow for time lags and eliminate contemporaneous endogeneity. With a one-year lag, we indeed find that debt

- 15 -
accumulation fuels subsequent capital flight more prominently in countries with weak institutions and high income inequality. The results in this section confirm the revolving door hypothesis and clarify the direct and interactive roles of institutions in impacting both sides of the relationship. We turn to the question of how less debt-creating inflows, such as foreign aid and FDI, impact capital flight, as well as the influence of institutional quality in these relationships. In contrast to the pure debt inflows, aid inflows reduce capital flight. The relationship is contemporaneous, as aid does not appear to influence capital flight in the subsequent year (Table 8). Like debt flows, aid may be endogenous for capital flight. However, Table 9 indicates that contemporaneous capital flight is not a significant determinant of aid. Capital flight only leads to higher aid inflows with a one-year lag, perhaps as international agencies require some time to evaluate and respond to a flight-induced financing need. A Hausman test also fails to reject the null hypothesis that aid is exogenous in the capital flight equation. As in Collier, Hoeffler, and Pattillo (2004), we also find a nonlinear relationship between aid and capital flight, but with reversed signs. High levels of aid tend to stem capital flight. Our regressions are different from Collier, Hoeffler, and Pattillo in several respects. We control for country and period fixed effects, which in the presence of panel data with a lagged dependent variable may be (and according to F-tests are) required. Second, as we find that aid is not endogenous for flight after controlling for fixed effects, we do not need to instrument for it. We also find that good institutional quality is important for absorbing aid without flight. Aid inflows interacted with controls on executive power sharply reduce capital flight. These results support Sachs’s prescription of increasing aid to better governed nations in order to combat poverty.
Net FDI inflows also reduce capital flight. As FDI does not increase the debt burden, the risk of higher future taxation or macro imbalance is not prevalent as it is with other forms of foreign financing. The specifications in Table 10 focus on predetermined FDI, which we find has the same relationship as contemporaneous FDI. As with aid, we also find some nonlinearity in the impact of FDI on capital flight. Likewise, good institutional quality significantly helps to absorb FDI inflows without inducing capital flight. Our results on the salutary effects of better institutions on capital flight are similar in tenor to the association between poor public governance and deterred FDI in the case of China, as noted by Wei (2002).
To check for robustness, we ran the main regressions in this section and the last section for various regional and income groups. We split the sample of countries into four regions – Africa, Asia, Western Hemisphere and Transition Economies. In addition, we break up the entire sample into three income groups based on the World Bank classification – low income (with per capita annual real GDP of $735 or less), lower middle income (with per capita real GDP between $736 and $2,935) and upper middle income group (with per capita real GDP between $2,936 and $9,075). For the most part, the results do not change much. Except for an occasional outlier depending on the model specification, the only noteworthy exception was a significantly positive relationship between the growth rate and capital flight for Asia in

- 16 -
a couple of regressions. This may be an indication that as these economies grow, their capital accounts become more liberalized and hence some of their capital flight could simply reflect portfolio diversification.
VI. CONCLUSIONS
This paper has made several contributions to the literature on capital flight, as well as to the literature on volatility and institutions. We provide the first set of panel data estimates of the determinants of capital flight using a broad set of countries. We find that macroeconomic policy variables and conditions have a significant influence on capital flight, even after controlling for country effects and institutional quality. Institutional quality, particularly effective institutional constraints on executive power, has an independent impact on capital flight. Our results are fairly robust to regional and income group classifications.
We show strong evidence of the revolving door relationship between borrowing and flight. We find “debt-fueled capital flight,” as well as a “financing need” channel working in the opposite causal direction. The composition of external financing matters. Debt tends to stimulate capital flight, while FDI and aid tend to reduce flight. Short-term debt accumulation has the most severe impact on capital flight.
The paper identifies capital flight as a mechanism by which institutional quality influences volatility. However, the channels are more complex than only the direct effects. Weak institutions spur capital flight, and thereby indirectly raise debt accumulation. The loss of domestic savings associated with capital flight is partly offset by increases in foreign financing. Institutions have no direct impact on changes in debt after controlling for capital flight. Higher debt in the context of weak institutions also feeds through to greater capital flight with a lag of one year or more. All of these channels reinforce the positive relationship between weak institutions and high debt and capital flight. However, we also find evidence for a partly offsetting channel. Good institutions facilitate access to credit in the face of high contemporaneous capital flight that generates a financing need. The results have suggestive implications for recent debt relief and foreign aid initiatives. By reducing prospective taxation to finance debt repayments, relief may reduce capital flight, and thereby leverage the impact of such assistance. This possibility is consistent with our finding that foreign aid reduces capital flight. The results in the paper also provide a caveat. Foreign aid or debt relief should be complemented by sound macro policies and an institutional environment conducive to allocating available resources to useful projects within the country.

- 17 -
Tabl
e 1.
Cro
ss-S
ectio
n R
egre
ssio
ns
N
ote:
In a
ll Ta
bles
, T-s
tatis
tics a
re d
ispl
ayed
bel
ow re
gres
sion
coe
ffic
ient
s.
C
0.32
80.
426
0.51
9-7
.782
1.
611
-9.3
440.
572
0.79
61.
010
-0.9
90
0.43
0-1
.540
POLC
ON
1 0.
558
***
0.60
3 ***
1.
779
**4.
109
4.68
1 2.
715
POLC
ON
2 0.
267
***
4.39
8PO
LCO
N3
0.14
7**
*4.
536
LOG
(GD
PPC
PPP9
9)
1.59
4 0.
922
1.51
1 1.
612
CO
NTR
OL
IRR
EG P
AY
MEN
T -1
.074
**
-2.1
54
BA
NK
GO
V
-0.1
24-0
.143
POLC
ON
1*B
AN
K G
OV
-0
.380
**-2
.120
LOG
(SET
MO
RTA
LITY
) 0.
849
*1.
875
R-s
quar
ed0.
471
0.50
40.
520
0.58
5 0.
652
0.08
2A
djus
ted
R-s
quar
ed
0.44
30.
478
0.49
50.
512
0.58
60.
040
Tota
l ob
serv
atio
ns
2121
2121
20
47
KF2
GD
P (A
vg. 1
992-
2001
)(A
vg. 1
971-
2001
)

- 18 -
Table 2. Determinants of Capital Flight
Arellano- Arellano-Bond 1 Bover 2
GRRT -0.100 * -0.085 *-1.684 -1.769
BUDBALGDP -0.291 *** -0.246 ***-3.827 -4.374
CURRCRISIS 1.559 *** 1.046 **2.569 2.066
EXCONST -0.761 *** -0.505 ***-3.224 -2.730
INTRT-USINTRT -0.0004-0.661
INFLATION 0.0010.615
TRADE2GDP 0.0200.869
FOREX2GDP 0.0541.239
GOVEXPGDP -0.073-0.745
GRRT(-1) -0.076 * 0.052 -0.039 **-1.644 1.398 -2.457
BUDBALGDP(-1) -0.204 *** -0.264 *** -0.195 ***-3.902 -5.637 -7.965
CURRCRISIS(-1) 0.985 ** 4.576 *** 0.980 ***1.964 9.499 5.012
EXCONST(-1) -0.506 *** -2.480 *** -0.411 ***-2.761 -10.592 -3.176
KF2GDP(-1) 0.137 *** 0.147 *** 0.137 *** 0.036 *** 0.145 ***4.730 5.688 5.298 6.491 17.016
DOMCRGR(-2) 0.002 *** 0.002 *** 0.002 ** 0.004 *** 0.002 ***4.149 4.183 4.235 34.389 15.062
R-squared 0.293 0.329 0.321 ... ...Adjusted R-squared 0.208 0.262 0.255 ... ...Durbin-Watson stat 1.917 1.981 2.037 ... ...Sample (adjusted) 1972-2001 1972-2001 1972-2001 1973 2001 1973 2001Cross-sections included 93 102 102 101 101Total observations 1234 1512 1537 1435 1435
Note: All regressions include cross-section and period fixed effects except the GMM, which includes period effects and uses other instruments for removing the country effects. 1 Arellano and Bond (1991).2 Arellano and Bover (1995).
KF2GDPGMM

- 19 -
Tabl
e 3.
Cap
ital F
light
and
Dom
estic
Cre
dit G
row
th
K
F2G
DP
GR
RT(
-1)
-0.0
71
-0.0
72-0
.073
-0.0
75-0
.115
*-0
.108
**-1
.545
-1.5
59-1
.578
-1.6
36-2
.150
-2.3
56B
UD
BA
LGD
P(-1
)-0
.217
***
-0.2
09**
*-0
.217
***
-0.2
15**
*-0
.096
-0.2
62**
*-4
.165
-4.0
09-4
.184
-4.1
43-1
.307
-4.2
90C
UR
RC
RIS
IS(-
1)0.
945
*0.
970
*0.
953
*0.
979
**0.
673
0.49
01.
894
1.93
71.
912
1.96
41.
281
0.97
8D
OM
CR
GR
(-2)
0.00
1**
*0.
002
***
0.00
1-0
.002
**0.
016
***
0.02
8**
*2.
635
4.55
91.
266
-2.0
753.
423
2.83
1EX
CO
NST
(-1)
-0.5
05**
*-0
.515
***
-0.4
98**
*-0
.493
***
-0.3
49*
-0.4
47**
-2.7
67-2
.815
-2.7
33-2
.705
-1.9
10-2
.457
KF2
GD
P(-1
)0.
131
***
0.13
7**
*0.
130
***
0.13
1**
*0.
174
***
0.17
8**
*5.
078
5.27
75.
054
5.08
25.
665
6.52
7
Lag
ged
dom
estic
cre
dit g
row
th in
tera
cted
with
:
CO
NTR
OL
OF
CO
RR
UPT
ION
-0.0
03**
*-4
.000
POLI
TIC
AL
STA
BIL
ITY
-0.0
02**
-2.4
98G
OV
T EF
FEC
TEC
TIV
ENES
S-0
.003
***
-4.3
10R
ULE
OF
LAW
-0.0
06**
*-4
.355
CO
NTR
OL
IRR
EGU
LAR
PA
YM
ENT
-0.0
03**
*-2
.931
FRA
SER
SU
MM
AR
Y-0
.005
***
-2.5
93
R-s
quar
ed0.
329
0.32
40.
330
0.33
00.
263
0.31
1A
djus
ted
R-s
quar
ed0.
263
0.25
80.
265
0.26
50.
190
0.24
5D
urbi
n-W
atso
n st
at2.
021
2.01
82.
021
2.01
72.
182
2.17
3Sa
mpl
e (a
djus
ted)
1972
-200
119
72-2
001
1972
-200
119
72-2
001
1972
-200
119
72-2
001
Cro
ss-s
ectio
ns in
clud
ed10
210
210
210
262
82To
tal
obse
rvat
ions
1537
1537
1537
1537
1077
1351
Not
e: A
ll re
gres
sion
s inc
lude
cro
ss-s
ectio
n an
d pe
riod
fixed
effe
cts.

- 20 -
Table 4. Determinants of Capital Flight including Time-Invariant Regressors
DEV KF2GDP(-1) 0.153 *** 0.152 *** 0.152 *** 0.152 *** 0.337 ***5.499 5.464 5.469 5.453 6.085
DEV GRRT(-1) -0.115 ** -0.116 ** -0.115 ** -0.116 ** -0.030-2.351 -2.368 -2.341 -2.370 -0.548
DEV BUDBALGDP(-1) -0.279 *** -0.278 *** -0.280 *** -0.281 *** -0.087-5.026 -5.003 -5.039 -5.047 -1.084
DEV CURRCRISIS(-1) 1.001 * 0.982 * 1.016 * 1.004 * 0.894 *1.851 1.814 1.878 1.853 1.689
DEV EXCONST(-1) -0.450 ** -0.457 ** -0.454 ** -0.451 ** 0.043-2.473 -2.507 -2.494 -2.471 0.282
DEV DOMCRGR(-2) 0.002 *** 0.002 *** 0.002 *** 0.002 *** -0.0015.277 5.431 5.274 5.279 -1.404
CONTROL OF CORRUPTION -1.277 ***-3.103
POLITICAL STABILITY -0.710 **-2.411
GOVT EFFECTECTIVENESS -1.055 ***-2.871
RULE OF LAW -0.683 ***-1.865
AVEPOLCON1 0.147 **2.115
R-squared 0.125 0.123 0.124 0.121 0.257Adjusted R-squared 0.104 0.102 0.103 0.100 0.184Durbin-Watson stat 1.703 1.698 1.700 1.695 1.647Sample (adjusted) 1972 2001 1972 2001 1972 2001 1972 2001 1972 2001Cross-sections included 102 102 102 102 21Total observations 1537 1537 1537 1537 403
Note: DEV refers to the deviation of the regressor from its cross-sectional mean.
KF2GDP

- 21 -
Table 5. Capital Flight and Total Debt
D(TOTDEBT2GDP)
OLS 2SLS OLS OLS 2SLS
GRRT(-1) -0.068 * -0.071 *-1.613 -1.606
BUDBALGDP(-1) -0.171 *** -0.170 ***-3.597 -3.292
CURRCRISIS(-1) 0.049 0.4320.106 0.851
DOMCRGR(-2) 0.001 *** 0.002 ***3.888 3.982
KF2GDP(-1) 0.153 *** 0.145 ***6.473 5.916
EXCONST(-1) -0.397 ** -0.514 *** -0.953 ** 0.058 -0.048-2.380 -2.857 -2.573 0.206 -0.145
TRADE2GDP(-1) -0.214 *** -0.134 *** -0.150 ***-7.060 -5.492 -4.819
GOVEXPGDP(-1) 0.323 *** -0.101 0.269 **2.635 -1.041 2.132
TOTDEBT2GDP(-1) -0.143 *** -0.221 *** -0.177 ***-13.657 -21.086 -13.259
KF2GDP 0.690 *** 0.814 ***19.608 4.398
D(TOTDEBT2GDP) 0.212 *** 0.131 ***17.136 3.228
R-squared 0.439 0.407 0.157 0.449 0.413Adjusted R-squared 0.384 0.347 0.105 0.406 0.358Durbin-Watson stat 2.046 2.056 1.765 1.670 1.890Sample (adjusted) 1972-2001 1972-2001 1971-2001 1971-2001 1972 2001Cross-sections included 102 102 114 112 101Total observations 1537 1476 2544 2045 1562
Note: All regressions include cross-section and period fixed effects.
KF2GDP

- 22 -
Table 6. Capital Flight and Short-term Debt
D(STDEBT2GDP)
OLS 2SLS OLS OLS 2SLS
GRRT(-1) -0.085 * -0.082 *-1.954 -1.879
BUDBALGDP(-1) -0.174 *** -0.147 ***-3.415 -2.739
CURRCRISIS(-1) 0.505 0.5981.103 1.275
DOMCRGR(-2) -0.0004 -0.0004-0.623 -0.653
KF2GDP(-1) 0.137 *** 0.133 *** 0.030 *** -0.007 0.0085.723 5.630 3.012 -0.720 0.592
KF2GDP(-2) 0.050 ** 0.051 **2.152 2.199
EXCONST(-1) -0.250 -0.362 ** -0.213 *** -0.094 -0.102-1.479 -2.051 -2.861 -1.373 -1.256
TRADE2GDP(-1) -0.038 *** -0.032 *** -0.029 ***-5.879 -5.370 -4.260
GOVEXPGDP(-1) 0.072 *** 0.042 * 0.062 **2.789 1.768 2.370
STDEBT2GDP(-1) -0.154 *** -0.138 *** -0.155 ***-11.222 -10.255 -9.860
KF2GDP 0.180 *** 0.122 **20.614 2.184
D(STDEBT2GDP) 0.844 *** 0.923 ***19.006 5.420
R-squared 0.468 0.480 0.175 0.334 0.339Adjusted R-squared 0.414 0.425 0.110 0.280 0.281Durbin-Watson stat 2.055 2.088 2.029 1.753 1.868Sample (adjusted) 1973-2001 1973-2001 1972-2001 1972-2001 1973-2001Cross-sections included 102 100 112 112 110Total observations 1475 1418 1977 1950 1782
Note: All regressions include cross-section and period fixed effects.
KF2GDP

- 23 -
Tabl
e 7.
Inst
itutio
nal Q
ualit
y in
Abs
orbi
ng D
ebt
EXC
ON
ST(-
1)-0
.046
0.03
2-0
.439
***
-0.3
56**
-0.4
97**
*-0
.506
***
-0.4
48**
-0.4
68**
-0.1
630.
105
-2.6
80-2
.109
-2.7
05-2
.756
-2.2
48-2
.350
TRA
DE2
GD
P(-1
)-0
.135
***
-0.1
19**
*-5
.537
-4.1
81G
OV
EXPG
DP(
-1)
-0.0
97-0
.238
**-1
.002
-2.2
32TO
TDEB
T2G
DP(
-1)
-0.2
21**
*-0
.220
***
-21.
157
-18.
989
KF2
GD
P0.
509
***
1.36
0**
*7.
227
6.70
9K
F2G
DP*
EXC
ON
ST(-
1)0.
050
***
2.96
9K
F2G
DP*
AV
EIN
CSH
TOP1
0-0
.017
***
-2.9
95G
RR
T(-1
)-0
.061
-0.0
42-0
.084
*-0
.080
*-0
.051
-0.0
60-1
.481
-0.9
34-1
.799
-1.7
26-0
.949
-1.1
26B
UD
BA
LGD
P(-1
)-0
.172
***
-0.0
83-0
.204
***
-0.2
04**
*-0
.162
**-0
.165
**-3
.695
-1.2
98-3
.880
-3.9
05-2
.141
-2.1
75C
UR
RC
RIS
IS(-
1)0.
061
-0.0
950.
986
*1.
020
**1.
064
*1.
147
**0.
135
-0.2
041.
961
2.03
61.
958
2.10
9D
OM
CR
GR
(-2)
0.00
1**
*0.
002
***
0.00
1**
*0.
001
**0.
002
***
0.00
1**
3.39
84.
932
3.41
71.
988
3.77
82.
402
KF2
GD
P(-1
)0.
143
***
0.14
1**
*0.
153
***
0.17
4**
*0.
142
***
0.16
3**
*6.
170
5.97
55.
373
6.10
24.
385
5.12
1D
(TO
TDEB
T2G
DP)
0.08
4**
*0.
597
***
3.97
96.
960
D(T
OTD
EBT2
GD
P(-1
))0.
008
-0.5
13**
*0.
353
-5.1
16D
(STD
EBT2
GD
P(-1
))-0
.005
-1.9
96**
*-0
.056
-5.1
45D
(TO
TDEB
T2G
DP)
*EX
CO
NST
(-1)
0.03
6**
*7.
359
D(T
OTD
EBT2
GD
P)*A
VEI
NC
SHTO
P10(
-1)
-0.0
09**
*-3
.607
D(T
OTD
EBT2
GD
P(-1
))*E
XC
ON
ST(-
1)-0
.006
-1.1
10D
(TO
TDEB
T2G
DP(
-1))
*AV
EIN
CSH
TOP1
00.
142
***
5.16
9D
(STD
EBT2
GD
P(-1
))*E
XC
ON
ST(-
1)-0
.036
*-1
.808
D(S
TDEB
T2G
DP(
-1))
*AV
EIN
CSH
TOP1
00.
054
***
4.92
3
R-s
quar
ed0.
451
0.45
40.
460
0.45
50.
322
0.32
60.
240
0.24
1A
djus
ted
R-s
quar
ed0.
409
0.41
00.
407
0.39
90.
255
0.25
90.
162
0.16
3D
urbi
n-W
atso
n st
at1.
659
1.63
42.
024
1.91
62.
054
2.08
11.
986
1.97
4Sa
mpl
e (a
djus
ted)
1971
-200
119
71-2
001
1972
-200
119
72-2
001
1972
-200
119
72-2
001
1972
-200
119
72-2
001
Cro
ss-s
ectio
ns in
clud
ed11
294
102
8510
210
285
85To
tal
obse
rvat
ions
2045
1722
1537
1301
1536
1536
1300
1300
Not
e: A
ll re
gres
sion
s inc
lude
cro
ss-s
ectio
n an
d pe
riod
fixed
eff
ects
.
KF2
GD
PD
(TO
TD
EB
T2G
DP)

- 24 -
Table 8. Capital Flight and Aid
GRRT(-1) -0.082 * -0.080 * -0.085 * -0.099 ** -0.084 *-1.723 -1.692 -1.804 -2.117 -1.765
BUDBALGDP(-1) -0.211 *** -0.207 *** -0.198 *** -0.185 *** -0.206 ***-3.948 -3.877 -3.694 -3.485 -3.848
CURRCRISIS(-1) 0.968 * 0.938 * 1.051 ** 1.045 ** 0.928 *1.873 1.806 2.037 2.044 1.786
DOMCRGR(-2) 0.002 *** 0.002 *** 0.002 *** 0.002 *** 0.002 ***4.255 4.287 4.641 4.406 3.668
KF2GDP(-1) 0.139 *** 0.138 *** 0.139 *** 0.127 *** 0.128 ***5.300 5.237 5.300 4.856 4.777
EXCONST(-1) -0.516 *** -0.513 *** -0.534 *** -0.025 -0.319-2.748 -2.732 -2.852 -0.119 -1.488
AID2GNI -0.117 * 0.221 * 0.476 ***-1.822 1.772 3.548
AID2GNI(-1) -0.063 0.008-1.011 0.059
AID2GNI^2 -0.008 *** -0.005 *-3.163 -1.907
AID2GNI(-1)^2 0.0020.754
AID2GNI*EXCONST(-1) -0.121 ***-4.946
AID2GNI(-1)*EXCONST(-1) -0.045 *-1.866
R-squared 0.323 0.322 0.328 0.340 0.324Adjusted R-squared 0.256 0.254 0.260 0.273 0.255Durbin-Watson stat 2.153 2.152 2.046 2.017 2.016Sample (adjusted) 1972-2001 1972-2001 1972-2001 1972-2001 1972-2001Cross-sections included 101 101 101 101 101Total observations 1499 1501 1499 1499 1501
Note: All regressions include cross-section and period fixed effects.
KF2GDP

- 25 -
Table 9. Aid
GRRT(-1) -0.010 -0.012-0.593 -0.729
BUDBALGDP(-1) -0.082 *** -0.025-4.318 -1.332
CURRCRISIS(-1) 0.219 0.2661.168 1.472
DOMCRGR(-2) -0.0002 -0.0002-1.230 -1.640
EXCONST(-1) -0.051 -0.031-0.753 -0.470
AID2GNI(-1) 0.517 *** 0.534 ***23.133 24.462
KF2GDP 0.0050.483
KF2GDP(-1) 0.017 *1.812
R-squared 0.859 0.863Adjusted R-squared 0.845 0.850Durbin-Watson stat 1.719 1.693Sample (adjusted) 1972-2001 1972-2001Cross-sections included 101 101Total observations 1551 1552
Note: All regressions include cross-section and period fixed effects.
AID2GNI

- 26 -
Table 10. Capital Flight and Foreign Direct Investment
GRRT(-1) -0.068 -0.065 -0.071 -0.070-1.421 -1.369 -1.482 -1.471
BUDBALGDP(-1) -0.206 *** -0.211 *** -0.200 *** -0.203 ***-3.857 -3.956 -3.737 -3.812
CURRCRISIS(-1) 0.902 * 0.869 * 0.891 * 0.878 *1.735 1.672 1.714 1.692
DOMCRGR(-2) 0.002 *** 0.002 *** 0.002 *** 0.002 ***4.012 4.064 3.911 4.057
KF2GDP(-1) 0.136 *** 0.134 *** 0.132 *** 0.124 ***5.174 5.102 5.006 4.668
EXCONST(-1) -0.500 *** -0.525 *** -0.412 * -0.436 **-2.642 -2.770 -2.102 -2.211
FDI2GDP(-1) -0.216 ** -0.291 *** 0.066 -0.144-2.328 -2.874 0.347 -0.589
FDI2GDP(-1)^2 0.009 * 0.036 ***1.848 2.818
FDI2GDP(-1)*EXCONST(-1) -0.065 * -0.012-1.697 -0.173
FDI2GDP(-1)^2*EXCONST(-1) -0.006 *-1.864
R-squared 0.325 0.326 0.326 0.331Adjusted R-squared 0.257 0.258 0.258 0.263Durbin-Watson stat 2.151 2.071 2.046 2.080Sample (adjusted) 1972-2001 1972-2001 1972-2001 1972-2001Cross-sections included 100 100 100 100Total observations 1487 1487 1487 1487
Note: All regressions include cross-section and period fixed effects.
KF2GDP

- 27 -
Figure 1. Macroeconomic Indicators Relative to Peak Flight or Repatriation (Median Deviations from Baseline, 134 Developing and Emerging Market Countries, 1970–2001)
Source: IMF's International Financial Statistics, World Bank's World Development Indicators, Global Development Finance (World Bank, various years).
Growth Rate
-0.6
-0.5
-0.4
-0.3
-0.2
-0.1
0.0
0.1
0.2
0.3
-3 -2 -1 0 1 2 3
Capital Repatriation
Capital Flight
Inflation Rate
-1.5
-1.0
-0.5
0.0
0.5
1.0
1.5
-3 -2 -1 0 1 2 3
Capital Flight
Capital Repatriation
Budget Balance (Percent of GDP)
-1.0
-0.8
-0.6
-0.4
-0.2
0.0
0.2
0.4
-3 -2 -1 0 1 2 3
Capital Repatriation
Capital Flight
Government Foreign Borrowing (Percent of GDP)
-0.05
0.00
0.05
0.10
0.15
0.20
-3 -2 -1 0 1 2 3
Capital Flight
Capital Repatriation

- 28 -
Figure 2. Confidence Indicators Relative to Peak Flight or Repatriation (Median Deviations from Baseline, 134 Developing and Emerging Market Countries, 1970–2001)
Source: IMF's International Financial Statistics, World Bank's World Development Indicators, Global Development Finance (World Bank, various years), International Country Risk Guide (The PRS Group).
Composite Confidence Index
-2.0
-1.5
-1.0
-0.5
0.0
0.5
1.0
1.5
2.0
-3 -2 -1 0 1 2 3
Capital Repatriation
Capital Flight
Political Confidence Index
-2.0
-1.5
-1.0
-0.5
0.0
0.5
1.0
1.5
-3 -2 -1 0 1 2 3
Capital Repatriation
Capital Flight
Financial Confidence Index
-1.0
-0.5
0.0
0.5
1.0
1.5
-3 -2 -1 0 1 2 3
Capital Repatriation
Capital Flight
Economic Confidence Index
-1.5
-1.0
-0.5
0.0
0.5
1.0
1.5
-3 -2 -1 0 1 2 3
Capital Repatriation
Capital Flight

- 29 -
Figure 3. Probability of Crises Relative to Peak Flight or Repatriation (Median Deviations from Baseline, 134 Developing and Emerging Market Countries, 1970–2001)
Source: IMF's International Financial Statistics, World Bank's World Development Indicators, Global Development Finance (World Bank, various years).
Probability of Banking Crisis
0.22
0.24
0.26
0.28
0.30
0.32
0.34
-3 -2 -1 0 1 2 3
Capital Flight
Capital Repatriation
Probability of Currency Crisis
0.22
0.24
0.26
0.28
0.30
0.32
0.34
0.36
0.38
-3 -2 -1 0 1 2 3
Capital Flight
Capital Repatriation

APPENDIX I
- 30 -
Empirical Studies of Capital Flight
Study Sample Methodology Results A. Determinants literature A1. Macroeconomic factors Cuddington (1987) 7 Latin
American countries
Time series analysis over 1974–84
External debt flows, lagged capital flight, inflation, exchange rate, and interest rate differentials are significant contributors to capital flight.
Dooley (1988) 5 Latin American countries, Philippines
Time series analysis over 1973–86
Inflation was significantly and positively related to capital flight.
Boyce (1992) Philippines Time series analysis over 1962–86
External debt, budget deficits, and interest rate differentials emerge as significant determinants of Philippine capital flight.
Hermes and Lensink (1992)
6 sub-Saharan countries
Pooled data analysis over 1976–87
Capital flight is significantly and positively determined by external debt flows and overvalued exchange rates.
Henry (1996) 3 Caribbean countries
Time series analysis over 1971–87
External debt, real interest rate differentials, and the unemployment rate are significant causes of capital flight.
A2. Nonmacroeconomic factors Fatehi (1994) 17 Latin
American countries
Stepwise multiple regression analysis over 1950–82
Political disturbances in some Latin American countries are associated with changes in capital flight from these countries.
Nyoni (2000) Tanzania Time series analysis over 1973–92
Lagged capital flight, real growth rates, interest and exchange rate differentials were significant determinants of capital
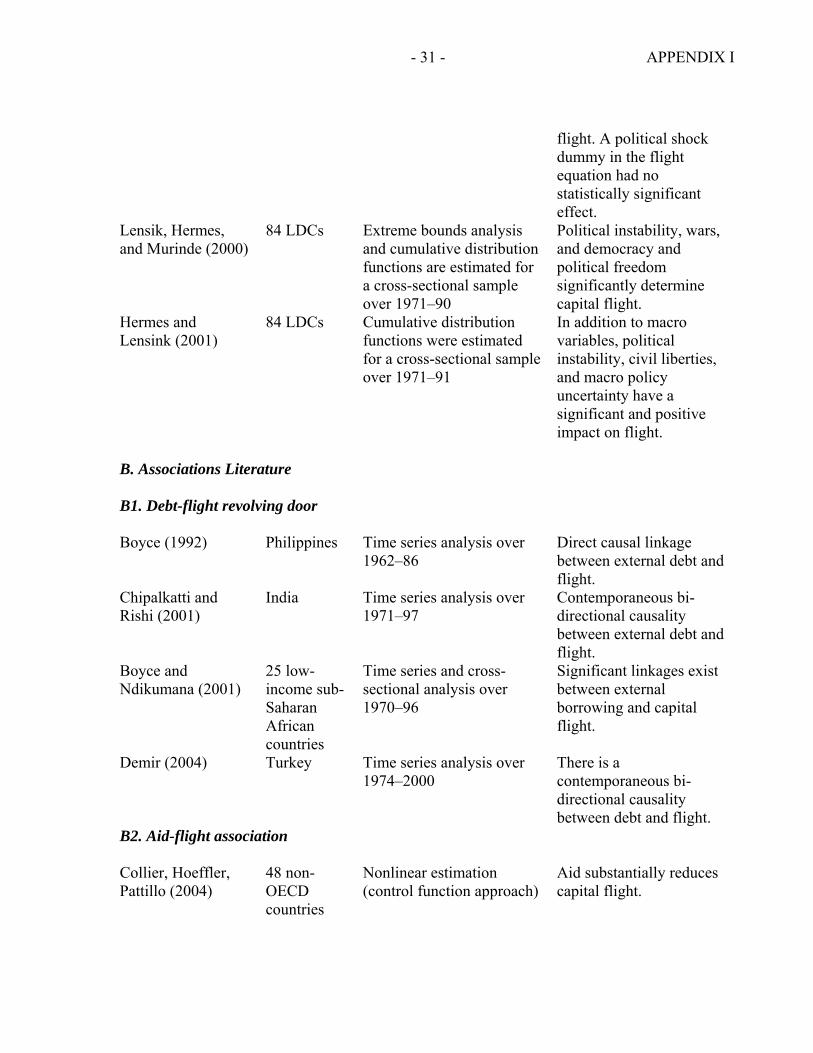
APPENDIX I
- 31 -
flight. A political shock dummy in the flight equation had no statistically significant effect.
Lensik, Hermes, and Murinde (2000)
84 LDCs Extreme bounds analysis and cumulative distribution functions are estimated for a cross-sectional sample over 1971–90
Political instability, wars, and democracy and political freedom significantly determine capital flight.
Hermes and Lensink (2001)
84 LDCs Cumulative distribution functions were estimated for a cross-sectional sample over 1971–91
In addition to macro variables, political instability, civil liberties, and macro policy uncertainty have a significant and positive impact on flight.
B. Associations Literature B1. Debt-flight revolving door Boyce (1992) Philippines Time series analysis over
1962–86 Direct causal linkage between external debt and flight.
Chipalkatti and Rishi (2001)
India Time series analysis over 1971–97
Contemporaneous bi-directional causality between external debt and flight.
Boyce and Ndikumana (2001)
25 low-income sub-Saharan African countries
Time series and cross-sectional analysis over 1970–96
Significant linkages exist between external borrowing and capital flight.
Demir (2004) Turkey Time series analysis over 1974–2000
There is a contemporaneous bi-directional causality between debt and flight.
B2. Aid-flight association Collier, Hoeffler, Pattillo (2004)
48 non-OECD countries
Nonlinear estimation (control function approach)
Aid substantially reduces capital flight.

APPENDIX II
- 32 -
Africa Asia Western HemisphereAlgeria Bangladesh ArgentinaAngola Bhutan Barbados Benin Cambodia Belize Botswana Fiji Bolivia Burkina Faso India BrazilBurundi Indonesia ChileCameroon Korea ColombiaCape Verde Lao People's Dem.Rep Costa Rica Central African Rep. Malaysia Dominica Chad Maldives Dominican RepublicComoros Myanmar EcuadorCongo, Dem. Rep. of Nepal El Salvador Congo, Republic of Pakistan Grenada Côte d'Ivoire Papua New Guinea Guatemala Djibouti Philippines Guyana Equatorial Guinea Samoa Haiti Eritrea Solomon Islands Honduras Ethiopia Sri Lanka Jamaica Gabon Thailand MexicoGambia, The Tonga Nicaragua Ghana Vanuatu Panama Guinea Vietnam Paraguay Guinea-Bissau Peru Kenya St. Kitts and Nevis Lesotho Transition Economies St. Lucia Liberia Armenia St. Vincent & Grens.Madagascar Azerbaijan Trinidad and Tobago Malawi Belarus UruguayMali Bosnia & Herzegovina Venezuela, Rep. Bol.Mauritania Bulgaria Mauritius China,P.R.: MainlandMorocco Croatia Middle EastMozambique Czech Republic Egypt Niger Estonia Iran, I.R. ofNigeria Georgia JordanRwanda Hungary Lebanon São Tomé & Príncipe Kazakhstan Oman Senegal Kyrgyz Republic Syrian Arab RepublicSeychelles Latvia Turkey Sierra Leone Lithuania Yemen, Republic ofSomalia Macedonia, FYRSouth Africa Moldova Sudan Mongolia Swaziland Poland Tanzania Romania Togo RussiaTunisia Slovak Republic Uganda Turkmenistan Zambia UkraineZimbabwe Uzbekistan
List of Countries

APPENDIX III
- 33 -
List of Abbreviations and Variables Used in Tables
AID2GNI Aid inflows as a percentage of GNI AVEINCSHTOP10 Average income share of the top 10 percent
AVEPOLCON1 Average % of firms connected with a minister or MP BANK GOV Indicator of the quality of banking governance
BUDBALGDP Budget balance as a percentage of GDP C Regression constant
CONTROL IRREG PAYMENT Indicator of the control of irregular payments CONTROL OF CORRUPTION Index of the control of corruption
CURRCRISIS Currency crisis dummy D(TOTDEBT2GDP) Change in total debt to GDP D(STDEBT2GDP) Change in short-term debt to GDP
DEV Deviation of the regressor from its cross-sectional mean DOMCRGR Growth rate of domestic credit EXCONST Indicator of executive constraints FDI2GDP Net Foreign Direct Investment as a percentage of GDP
FOREX2GDP Level of foreign exchange reserves as a percentage of GDP FRASER SUMMARY Summary indicator on institutional quality (Fraser Institute)
GDPPCPPP99 Per capita GDP GOVEXPGDP Government expenditure as a percentage of GDP
GOVT EFECTIVENESS Index of government effectiveness GRRT Growth rate
INFLATION Annual domestic inflation rate INTRT-USINTRT Interest rate differential (domestic relative to US)
KF2GDP Capital flight (residually measured and adjusted for exchange rate valuations) as a percentage of GDP
POLCON1 % of firms connected with a minister or MP POLCON2 % of firms connected with a minister, MP, or close
relationship POLCON3 % of top 50 firms connected with a minister, MP, or close
relationship
POLITICAL STABILITY Index of political stability RULE OF LAW Rule of law index STDEBT2GDP Short-term debt to GDP
SETMORTALITY Settlers’ mortality TRADE2GDP Trade openness: exports+imports as a percentage of GDP
- 34 -
References Acemoglu, Daron, Simon Johnson, and James Robinson, 2001, “Colonial Origins of
Comparative Development: An Empirical Investigation,” American Economic Review, Vol. 91, pp. 1369–401.
———, and Yunyong Thaicharoen, 2003, “Institutional Causes, Macroeconomic Symptoms:
Volatility, Crises and Growth,” Journal of Monetary Economics, Vol. 50, pp. 49–123. Arellano, Manuel, and Stephen Bond, 1991, “Some Tests of Specification for Panel Data:
Monte Carlo Evidence and an Application to Employment Equations,” Review of Economic Studies, Vol. 58, pp. 277–97.
Arrellano, Manuel, and Olympia Bover, 1995, “Another Look at the Instrumental-Variable
Estimation of Error-Components Models,” Journal of Econometrics, Vol. 68, pp. 29–52. Bardhan, Pranab, 1984, The Political Economy of Development in India (Oxford: Basil
Blackwell). Bhattacharya, Rina, 1999, “Capital Flight under Uncertainty about Domestic Taxation and
Trade Liberalization,” Journal of Development Economics, Vol. 59, No. 2, pp. 365–87. Boyce, James, and Leonce Ndikumana, 2001, “Is Africa a Net Creditor? New Estimates of
Capital Flight from Severely Indebted Sub-Saharan African Countries, 1970–96,” Journal of Development Studies, Vol. 38, No. 2, pp. 27–56.
Boyce, James, 1992, “The Revolving Door? External Debt and Capital Flight: A Philippine
Case Study,” World Development, Vol. 20, No. 3, pp. 335–49. Caprio, Gerard, and Daniela Klingebiel, 2003, “Episodes of Systemic and Borderline Financial
Crises” (Washington: The World Bank), unpublished. Chang, Kevin P.H., and Robert E. Cumby, 1991, “Capital Flight in Sub-Saharan African
Countries,” African External Finance in the 1990s, ed. by Ishrat Husain and John Underwood (Washington: The World Bank), pp 162–85.
Chipalkatti, Niranjan, and Meenakshi Rishi, 2001, “External Debt and Capital Flight in the Indian Economy,” Oxford Development Studies, Vol. 29, No. 1, pp. 31–44.
Collier, Paul, Anke Hoeffler, Catherine Pattillo, 2004, “Aid and Capital Flight,” (Oxford
University: Centre for the Study of African Economies), unpublished. http://users.ox.ac.uk/~ball0144/aid&cf.pdf.
Cuddington, John T., 1986, “Capital Flight: Estimates, Issues and Explanations,” Princeton
Studies in International Finance, Vol. 58.

- 35 -
———, 1987, “Macroeconomic Determinants of Capital Flight: An Econometric
Investigation,” Capital Flight and Third World Debt, ed. by D. Lessard and J. Cuddington (Washington: Institute for International Economics), pp. 85–96.
Cumby, Robert, and Richard M. Levich, 1987, “On the Definition and Magnitude of Recent
Capital Flight,” NBER Working Paper 2275 (Cambridge, Massachusetts: National Bureau of Economic Research).
Demir, Firat, 2004, “A Failure Story: Politics and Financial Liberalization in Turkey, Revisiting
the Revolving Door Hypothesis,” World Development, Vol. 32, No. 5, pp. 851–69. Demirgüç-Kunt, Asli, and Enrica Detragiache, 1997, “The Determinants of Banking Crises:
Evidence from Developing and Developed Countries,” IMF Working Paper No. 97/106 (Washington: International Monetary Fund).
Dooley, Michael P., and Kenneth M. Kletzer, 1994, “Capital Flight, External Debt and
Domestic Policies,” NBER Working Paper 4793 (Cambridge, Massachusetts: National Bureau of Economic Research).
Dooley, Michael P., 1988, Capital Flight: “A Response to Differences in Financial Risks,” IMF
Staff Papers, Vol. 35, No. 3, pp 422–36 (Washington: International Monetary Fund). Dornbusch, Rudiger, 1990, “Capital Flight: Theory, Measurement and Policy Issues,”
Occasional Paper No. 2 (Washington: Inter-American Development Bank). Eaton, Jonathon, 1987, “Public Debt Guarantees and Private Capital Flight,” The World Bank
Economic Review, Vol. 1, No. 3, pp. 377–95. Faccio, Mara, 2005, “Politically-Connected Firms,” American Economic Review, forthcoming. Fatehi, Kamal, 1994, “Capital Flight form Latin America as a Barometer of Political
Instability,” Journal of Business Research, Vol. 30. Fry, Maxwell J., 1993, “Foreign Debt Accumulation: Financial and Fiscal Effects and Monetary
Policy Reactions of Developing Countries,” Journal of International Money and Finance, Vol. 12, No. 4, pp 347–67.
Gibson, Heather D., and Euclid Tsakalotos, 1993, “Testing a Flow Model of Capital Flight in
Five European Countries,” Manchester School of Economic and Social Studies, Vol. 61, No. 2, pp. 144–66.
Gwartney, James, and Robert Lawson, 2004, Economic Freedom of the World: 2004 Annual
Report (Vancouver, Canada: The Fraser Institute). www.freetheworld.com

- 36 -
Hausman, Jerry, 1978, “Specification Tests in Econometrics,” Econometrica, Vol. 46, pp. 1251–71.
———, and William E. Taylor, 1981, “Panel Data and Unobservable Individual Effects,”
Econometrica, Vol. 49, pp.1377–98. Henry, Lester, 1996, “Capital Flight from Beautiful Places: The Case of Three Caribbean
Countries,” International Review of Applied Economics, Vol. 10, No. 2, pp. 263–72. Heritage Foundation, Index of Economic Freedom (Washington, D.C.) http://www.heritage.org/ Hermes, Niels, and Robert Lensink, 1992. “The Magnitude and Determinants of Capital Flight:
The Case for Six Sub-Saharan African Countries,” De Economist, Vol. 140, No. 4, pp. 515–30.
Hermes, Niels, and Robert Lensink, 2001, “Capital Flight and the Uncertainty of Government
Policies,” Economics Letters, Vol. 71, No. 3, pp. 377–81. Hermes, Niels, Robert Lensink, and Victor Murinde, 2002, “Flight Capital and Its Reversal for
Development Financing,” Discussion Paper No. 2002/99 (Helsinki, Finland: WIDER). Judson, Ruth, and Ann Owen, 1999, “Estimating Dynamic Panel Data Models: A Guide for
Macroeconomists,” Economics Letters, Vol. 65, pp. 9–15. Kaminsky, Graciela, and Carmen Reinhart, 1999, “The Twin Crises: The Causes of Banking
and Balance of Payments Problems,” American Economic Review, Vol. 89, pp. 473–500. Kaminsky, Graciela, Saul Lizondo, and Carmen Reinhart, 1998, “Leading Indicators of
Currency Crises,” International Monetary Fund Staff Papers, Vol. 45, No. 1, pp. 1–48. Kaufmann, Daniel, Aart Kraay, and Pablo Zoido-Lobatón, 1999, “Governance Matters,” World
Bank Policy Research Working Paper No. 2195 (Washington: World Bank). Lensink, Robert, Niels Hermes, and Victor Murinde, 1998, “The Effect of Financial
Liberalization on Capital Flight in African Economies,’ World Development, Vol. 26, No. 7, pp. 1349–68.
———, 2000, “Capital flight and Political Risk,” Journal of International Money and Finance,
19, pp. 73–92. Lessard, Donald R., and John Williamson, 1987, Capital Flight and Third World (Washington:
Institute for International Economics). Milken Institute, Capital Market Access (Santa Monica, California).
http://www.milkeninstitute.org/capital market access

- 37 -
Moghadam, Mashaallah Rahnama, Hedayeh Samavati, and David A. Dilts, 2003, “An Examination of Capital Flight from East Asian Emerging Economies: Paradise Lost,” Journal of Asia-Pacific Business, Vol. 5, No. 1, pp. 33–49.
Ndikumana, Leonce, and James K. Boyce, 2003, “Public Debts and Private Assets: Explaining
Capital Flight from Sub-Saharan African Countries,” World Development, Vol. 31, No. 1, pp. 107–130.
Nickell, Stephen, 1981, “Biases in Dynamic Models with Fixed Effects,” Econometrica,
Vol. 49, pp. 1417–26. North, Douglass C., and Robert P. Thomas, 1970, “An Economic Theory of the Growth of the
Western World,” Economic History Review, Vol. 23. Nyoni, Timothy, S., 2000, “Capital Flight from Tanzania,” External Debt and Capital Flight in
Sub-Saharan Africa, ed. by I. Ajayi and M.S. Khan (Washington: IMF Institute), pp. 265–99.
PRS Group, “International Country Risk Guide” (East Syracuse, New York: The PRS Group). Rodrik, Dani, and Andres Velasco, 1999, “Short-Term Capital Flows,” NBER Working Paper
No. 7364 (Cambridge, Massachusetts: National Bureau of Economic Research). Sachs, Jeffrey, John W., Mcarthur, Guido Schmidt-Traub, Margaret Kruk, Chandrika Bahadur,
Michael Faye, and Gordon Mccord, 2004, “Ending Africa’s Poverty Trap,” Brookings Papers on Economic Activity, Vol. 1 (Washington: Brookings Institution), pp. 117–240.
Schineller, Lisa M., 1997, “A Nonlinear Econometric Analysis of Capital Flight,” International
Finance Discussion Paper 594 (Washington: Board of Governors of the Federal Reserve System).
Terrones, Marco, 2004, “Are Credit Booms in Emerging Markets a Concern?” in World
Economic Outlook (Washington: International Monetary Fund), Chapter IV. Varman-Schneider, Benu, 1991, Capital Flight from Developing Countries (Boulder, Colorado:
Westview Press). Wei, Shang-Jin, 2002, “Valuing Governance: the Corruption Premium in Global Capital
Flows,” Financial Sector Governance: The Roles of the Public And Private Sectors, ed. by R. Litan, M. Pomerleano, and S.Vasudevan (Washington: Brookings Institution).
World Bank, 1998, World Development Report (Washington: World Bank). ———, various years, Global Development Finance (Washington: World Bank).