robert bornstein jamie favors, james thomas, allison charland, shawn padrick department of...
Post on 22-Dec-2015
215 views
TRANSCRIPT

Robert BornsteinJamie Favors, James Thomas, Allison Charland,
Shawn Padrick
Department of Meteorology and Climate ScienceSan Jose State University
4 June 2010

Results 1: SoCAB 1970-2005 summer (JJA) Tmax warming/ cooling trends (0C/decade); solid, crossed, & open circles show stat p-values <
0.01, 0.05, & not significant, respectively
??
????
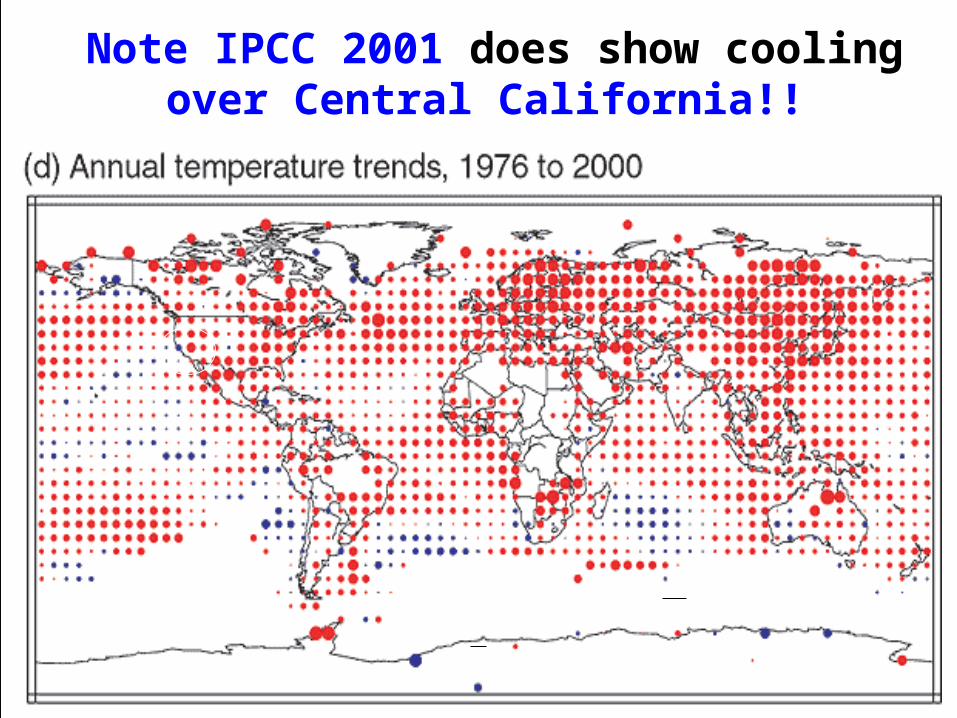
Note IPCC 2001 does show cooling over Central California!!

• 15 SoCAB sites used in trend-analyses over 38 years (1969-2007) • All subsequent results are averages over above 15 coastal-cooling sites• Values in table are number of months dropped (out of total of 38*12 = 456) for not having at least 15 days of data
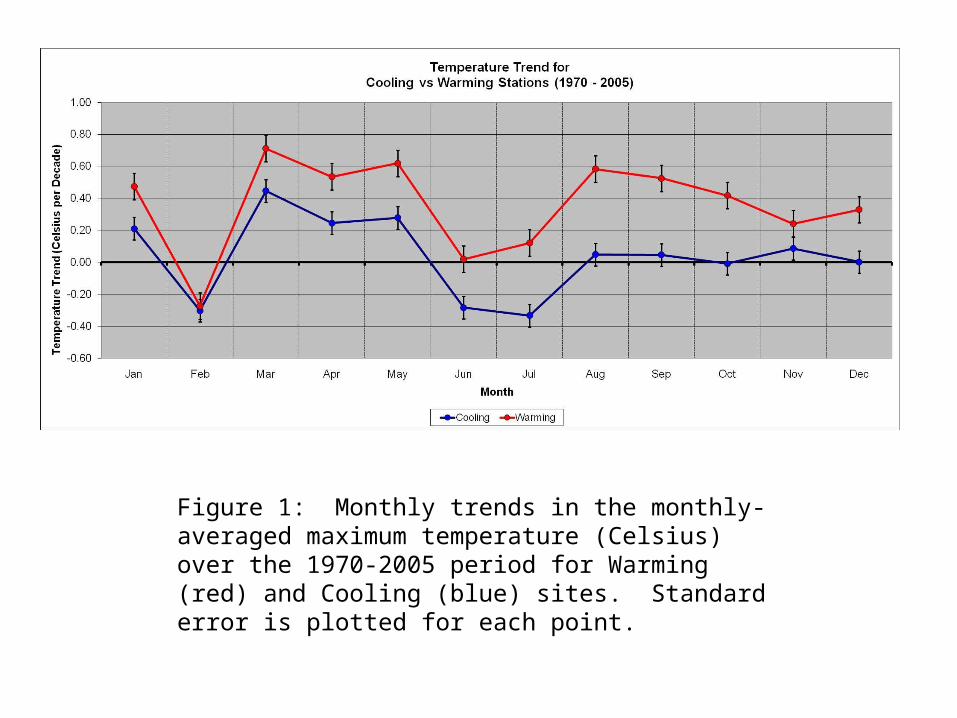
Figure 1: Monthly trends in the monthly-averaged maximum temperature (Celsius) over the 1970-2005 period for Warming (red) and Cooling (blue) sites. Standard error is plotted for each point.

Figure 2: Trend in normalized observation (percentage) of daily maximum temperature above 70° (blue), 75° (magenta), 80° (yellow) and 85° (purple) Fahrenheit over the 1970-2005 period. Linear trendlines (red, dashed) are shown for each data series with the corresponding regression equation.
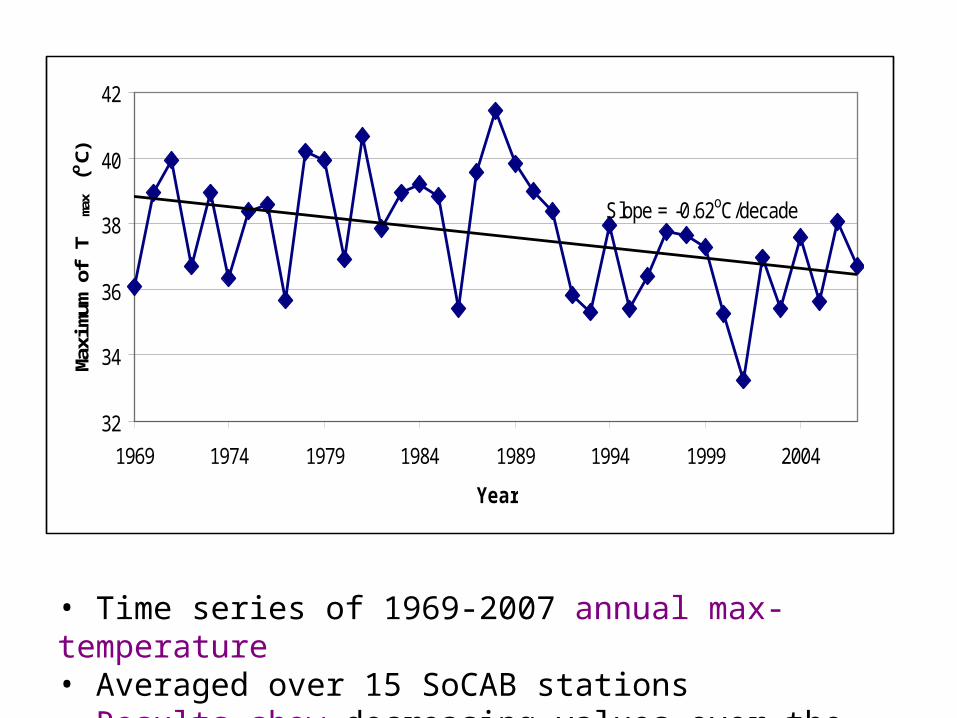
• Time series of 1969-2007 annual max-temperature• Averaged over 15 SoCAB stations • Results show decreasing values over the period
Slope = -0.62oC/decade
32
34
36
38
40
42
1969 1974 1979 1984 1989 1994 1999 2004
Year
Max
imum
of T
max
(o
C)

Figure 3: Cumulative frequency distribution for temperatures between 60° and 100° Fahrenheit in 5° increments for 1970-1974 (blue) and 2000-2004 (red).

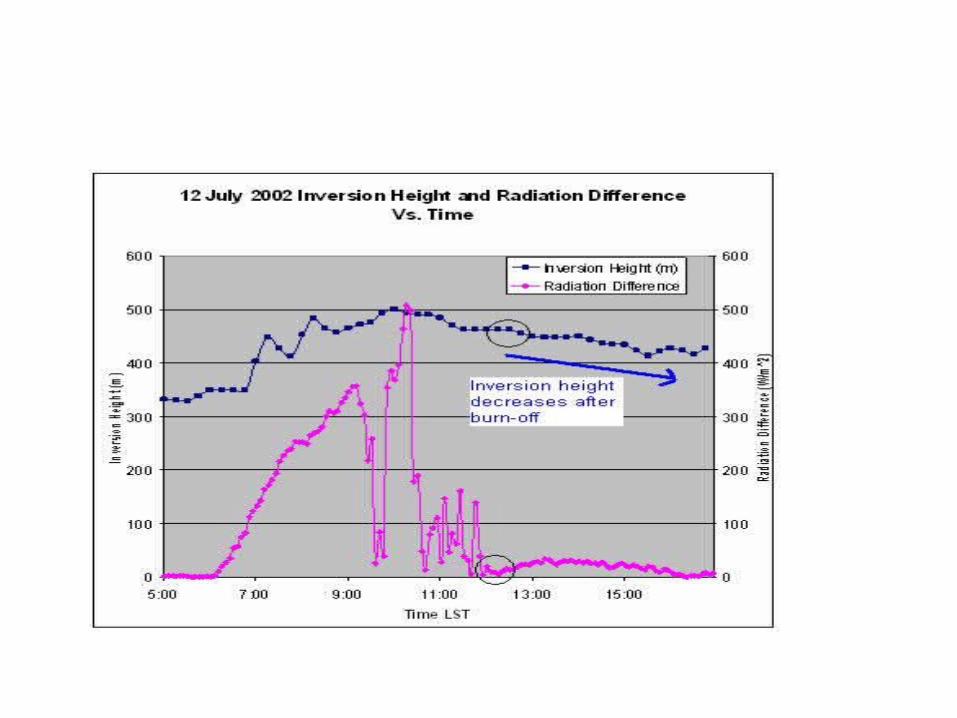
Hypothesis• A longer lasting stratus deck leads to decreased
peak daily high temperature• The more extensive the period after burn-off occurs, the
higher daily high temperature• Following burn-off
– an upward spike of surface temperature will be observed as the surface receives increased shortwave radiation
– inversion height will rise as well, due to increased vertical mixing • These results can be used to estimate contribution to
coastal cooling from – Stratus cover– Cold air advection

Data
• From Marine Stratus Initiative (MSI)1995-present • From MIT Lincoln Lab via Monterey NWS 1. Pyranometer
Measurement interval: 5 min averagedUsed for measuring surface radiation
2. SODARMeasurement interval: 15 min averagedUsed for measuring inversion height
3. ASOSMeasurement interval: 15 min averagedUsed for measuring surface temp