robert wood johnson foundation center to prevent childhood obesity robert ping state network...
TRANSCRIPT

Robert Wood Johnson Foundation Center to Prevent Childhood Obesity
Robert PingState Network Director
Safe Routes to School National Partnership

Source: CDC Behavioral Risk Factor Surveillance System.
Robert Wood Johnson Foundation Center to Prevent Childhood Obesity
Goal: reverse childhood obesity in the United States by 2015

Source: CDC Behavioral Risk Factor Surveillance System.
Robert Ping, State Network Director
SRTS National Partnership
(Father of Christopher, eating his first donut)

<10% 10-14 15-19 20-24 25-29 > 30%
How Bad Has It Become?
Percentage of Children who are Obese Aged 10–17 Years by State (1985-2008)

Source: CDC Behavioral Risk Factor Surveillance System.
Obesity Trends* Among U.S. AdultsBRFSS, 1985
(*BMI ≥30, or ~ 30 lbs. overweight for 5’ 4” person)
No Data <10% 10%–14%

Source: CDC Behavioral Risk Factor Surveillance System.
Obesity Trends* Among U.S. AdultsBRFSS, 1986
(*BMI ≥30, or ~ 30 lbs. overweight for 5’ 4” person)
No Data <10% 10%–14%

Source: CDC Behavioral Risk Factor Surveillance System.
Obesity Trends* Among U.S. AdultsBRFSS, 1987
(*BMI ≥30, or ~ 30 lbs. overweight for 5’ 4” person)
No Data <10% 10%–14%

Source: CDC Behavioral Risk Factor Surveillance System.
Obesity Trends* Among U.S. AdultsBRFSS, 1988
(*BMI ≥30, or ~ 30 lbs. overweight for 5’ 4” person)
No Data <10% 10%–14%

Source: CDC Behavioral Risk Factor Surveillance System.
Obesity Trends* Among U.S. AdultsBRFSS, 1989
(*BMI ≥30, or ~ 30 lbs. overweight for 5’ 4” person)
No Data <10% 10%–14%

Source: CDC Behavioral Risk Factor Surveillance System.
Obesity Trends* Among U.S. AdultsBRFSS, 1990
(*BMI ≥30, or ~ 30 lbs. overweight for 5’ 4” person)
No Data <10% 10%–14%

Source: CDC Behavioral Risk Factor Surveillance System.
Obesity Trends* Among U.S. AdultsBRFSS, 1991
(*BMI ≥30, or ~ 30 lbs. overweight for 5’ 4” person)
No Data <10% 10%–14% 15%–19%

Source: CDC Behavioral Risk Factor Surveillance System.
Obesity Trends* Among U.S. AdultsBRFSS, 1992
(*BMI ≥30, or ~ 30 lbs. overweight for 5’ 4” person)
No Data <10% 10%–14% 15%–19%

Source: CDC Behavioral Risk Factor Surveillance System.
Obesity Trends* Among U.S. AdultsBRFSS, 1993
(*BMI ≥30, or ~ 30 lbs. overweight for 5’ 4” person)
No Data <10% 10%–14% 15%–19%

Source: CDC Behavioral Risk Factor Surveillance System.
Obesity Trends* Among U.S. AdultsBRFSS, 1994
(*BMI ≥30, or ~ 30 lbs. overweight for 5’ 4” person)
No Data <10% 10%–14% 15%–19%

Source: CDC Behavioral Risk Factor Surveillance System.
Obesity Trends* Among U.S. AdultsBRFSS, 1995
(*BMI ≥30, or ~ 30 lbs. overweight for 5’ 4” person)
No Data <10% 10%–14% 15%–19%

Source: CDC Behavioral Risk Factor Surveillance System.
Obesity Trends* Among U.S. AdultsBRFSS, 1996
(*BMI ≥30, or ~ 30 lbs. overweight for 5’ 4” person)
No Data <10% 10%–14% 15%–19%

Source: CDC Behavioral Risk Factor Surveillance System.
Obesity Trends* Among U.S. AdultsBRFSS, 1997
(*BMI ≥30, or ~ 30 lbs. overweight for 5’ 4” person)
No Data <10% 10%–14% 15%–19% ≥20%

Source: CDC Behavioral Risk Factor Surveillance System.
Obesity Trends* Among U.S. AdultsBRFSS, 1998
(*BMI ≥30, or ~ 30 lbs. overweight for 5’ 4” person)
No Data <10% 10%–14% 15%–19% ≥20%

Source: CDC Behavioral Risk Factor Surveillance System.
Obesity Trends* Among U.S. AdultsBRFSS, 1999
(*BMI ≥30, or ~ 30 lbs. overweight for 5’ 4” person)
No Data <10% 10%–14% 15%–19% ≥20%
Source: CDC Behavioral Risk Factor Surveillance System.
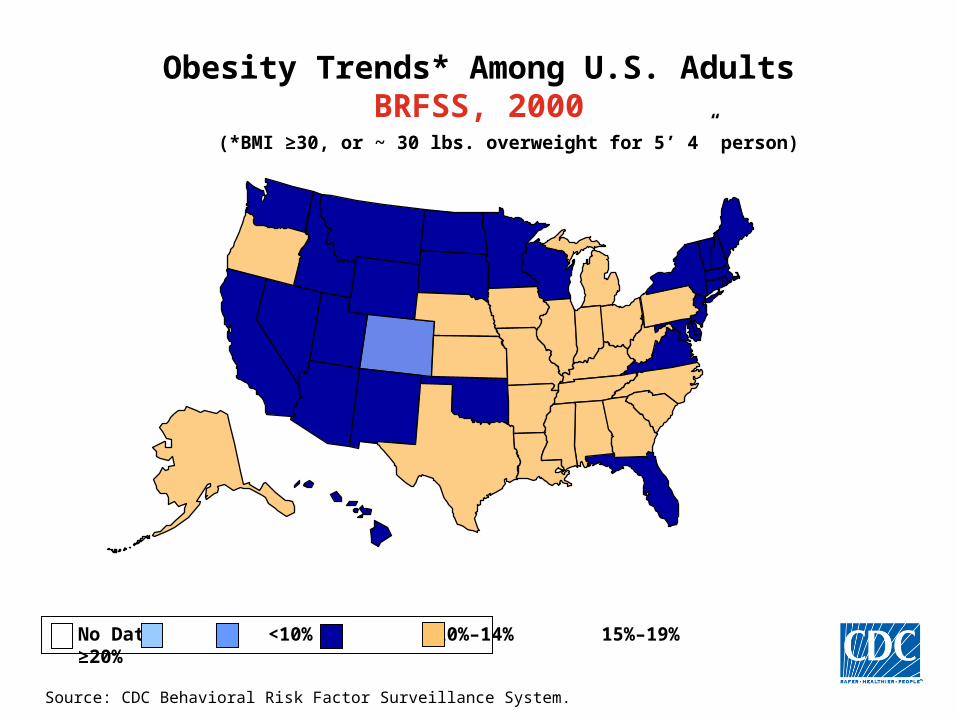
Obesity Trends* Among U.S. AdultsBRFSS, 2000
(*BMI ≥30, or ~ 30 lbs. overweight for 5’ 4” person)
No Data <10% 10%–14% 15%–19% ≥20%
Source: CDC Behavioral Risk Factor Surveillance System.
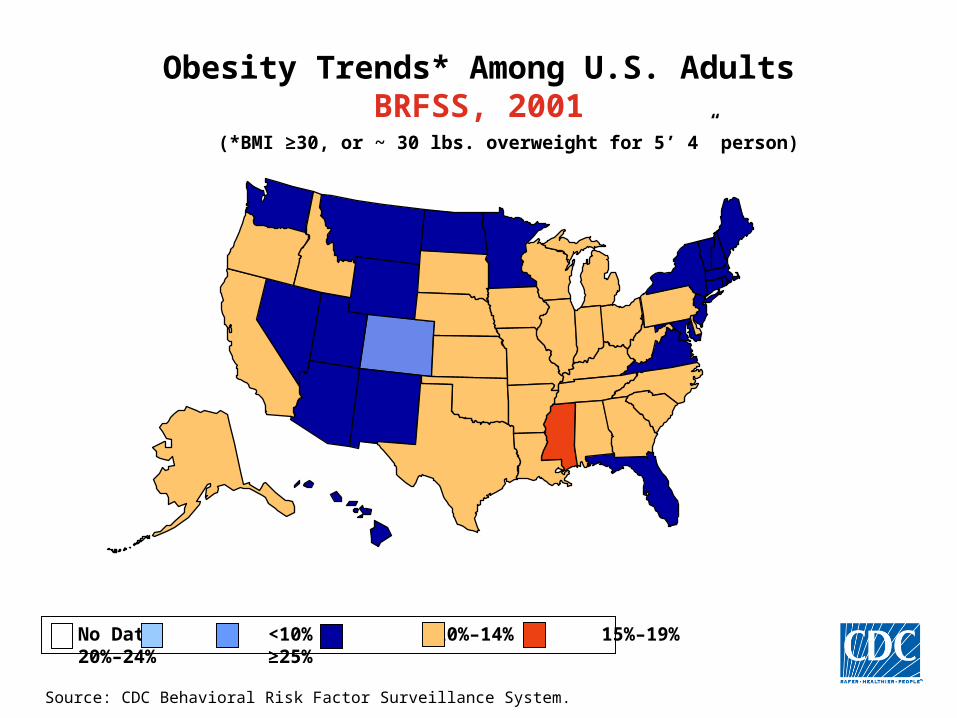
Obesity Trends* Among U.S. AdultsBRFSS, 2001
(*BMI ≥30, or ~ 30 lbs. overweight for 5’ 4” person)
No Data <10% 10%–14% 15%–19% 20%–24% ≥25%

Source: CDC Behavioral Risk Factor Surveillance System.
(*BMI ≥30, or ~ 30 lbs. overweight for 5’ 4” person)
Obesity Trends* Among U.S. AdultsBRFSS, 2002
No Data <10% 10%–14% 15%–19% 20%–24% ≥25%

Source: CDC Behavioral Risk Factor Surveillance System.
Obesity Trends* Among U.S. AdultsBRFSS, 2003
(*BMI ≥30, or ~ 30 lbs. overweight for 5’ 4” person)
No Data <10% 10%–14% 15%–19% 20%–24% ≥25%

Source: Behavioral Risk Factor Surveillance System, CDC.
Obesity Trends* Among U.S. AdultsBRFSS, 2004
(*BMI ≥30, or ~ 30 lbs. overweight for 5’ 4” person)
No Data <10% 10%–14% 15%–19% 20%–24% ≥25%

Source: Behavioral Risk Factor Surveillance System, CDC.
Obesity Trends* Among U.S. AdultsBRFSS, 2005
(*BMI ≥30, or ~ 30 lbs. overweight for 5’ 4” person)
No Data <10% 10%–14% 15%–19% 20%–24% 25%–29% ≥30%

Source: Behavioral Risk Factor Surveillance System, CDC.
Obesity Trends* Among U.S. AdultsBRFSS, 2006
(*BMI ≥30, or ~ 30 lbs. overweight for 5’ 4” person)
No Data <10% 10%–14% 15%–19% 20%–24% 25%–29% ≥30%

Source: Behavioral Risk Factor Surveillance System, CDC.
Obesity Trends* Among U.S. AdultsBRFSS, 2007
(*BMI ≥30, or ~ 30 lbs. overweight for 5’ 4” person)
No Data <10% 10%–14% 15%–19% 20%–24% 25%–29% ≥30%

Source: Behavioral Risk Factor Surveillance System, CDC.
Obesity Trends* Among U.S. AdultsBRFSS, 2008
(*BMI ≥30, or ~ 30 lbs. overweight for 5’ 4” person)
No Data <10% 10%–14% 15%–19% 20%–24% 25%–29% ≥30%
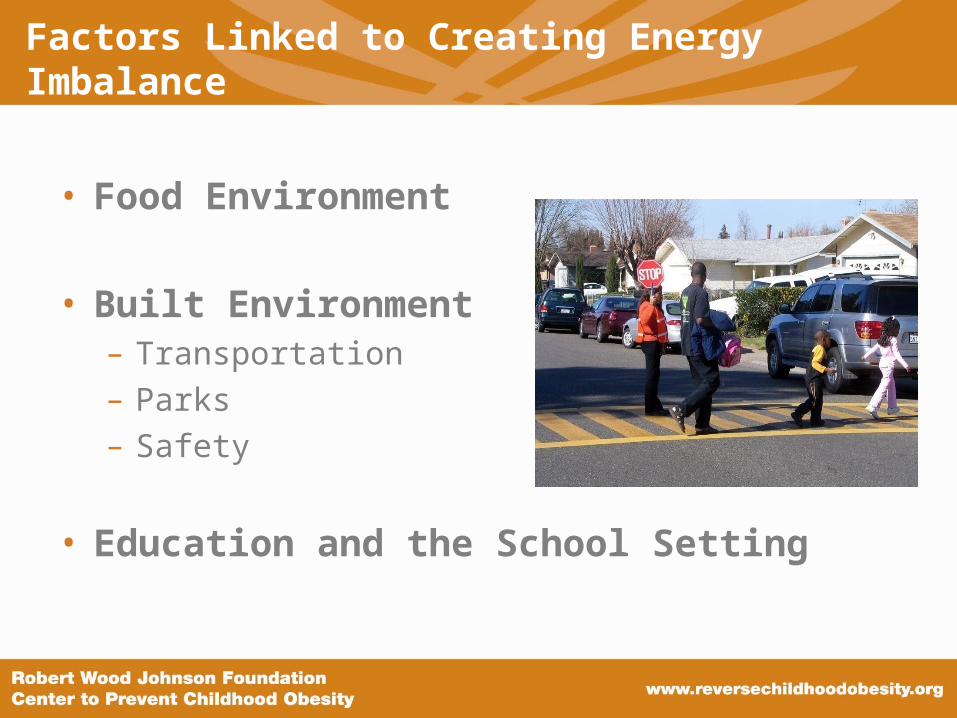
Factors Linked to Creating Energy Imbalance
• Food Environment
• Built Environment– Transportation– Parks– Safety
• Education and the School Setting

Energy Balance Framework of the RWJF Center
• Increasing children’s consumption of healthy foods and beverages and decreasing consumption of unhealthy alternatives
• Increasing physical activity
• Building awareness and support

Robert Wood Johnson Foundation Center to Prevent Childhood Obesity
• Established in September 2008
• Harness the impact of the RWJF programs and affiliated resources
• Advance a comprehensive policy agenda at the federal, state, and local levels

Goals of the RWJF Center
• Reduce overweight and obesity among children in the U.S.
• Decrease disparities– Communities of color– Impoverished areas– Disproportionately affected regions
• Create systemic, sustainable changes

Obesity is Not Simply a Health Issue
• Policy change and collaboration among various disciplines– Transportation– Education– Built Environment– Parks and Recreation– Nutrition– Food Marketing– Agriculture– and others

RWJF Center Areas of Work
• Technical assistance to build capacity and leadership of the movement
• Policy agendas at the national, state, regional, and local levels
• Advance communications and media strategies
• Synthesize evidence-based science

RWJF Strategies/Programs
ADVOCACYADVOCACY
EVIDENCEEVIDENCE
ACTIONACTION
Healthy Eating Research
Salud America!
National Collaborative on Childhood Obesity Research (NCCOR)
Alliance for a Healthier Generation: Healthy Schools Program
Healthy Kids, Healthy America
Healthy Kids, Healthy Communities
New Jersey Partnership for Healthy Kids
Safe Routes to School National Partnership: State Network Project
Pioneering Healthier Communities: YMCA of the USA Active Living Research
African American Collaborative Obesity Research Network (AACORN)
Bridging the Gap
Food Marketing and Youth Project at Yale University Rudd Center
Communities Creating Healthy Environments
Faith-Based Advocacy: Galvanizing Communities to End Childhood Obesity
Leadership for Healthy Communities
Mobilizing Health Care Professionals as Community Leaders in the Fight Against Childhood Obesity
National Policy and Legal Analysis Network to Prevent Childhood Obesity
Campaign for Healthy Kids: Save the Children
RWJF Center to Prevent Childhood Obesity
IOM Standing Committee
Convergence Partnership
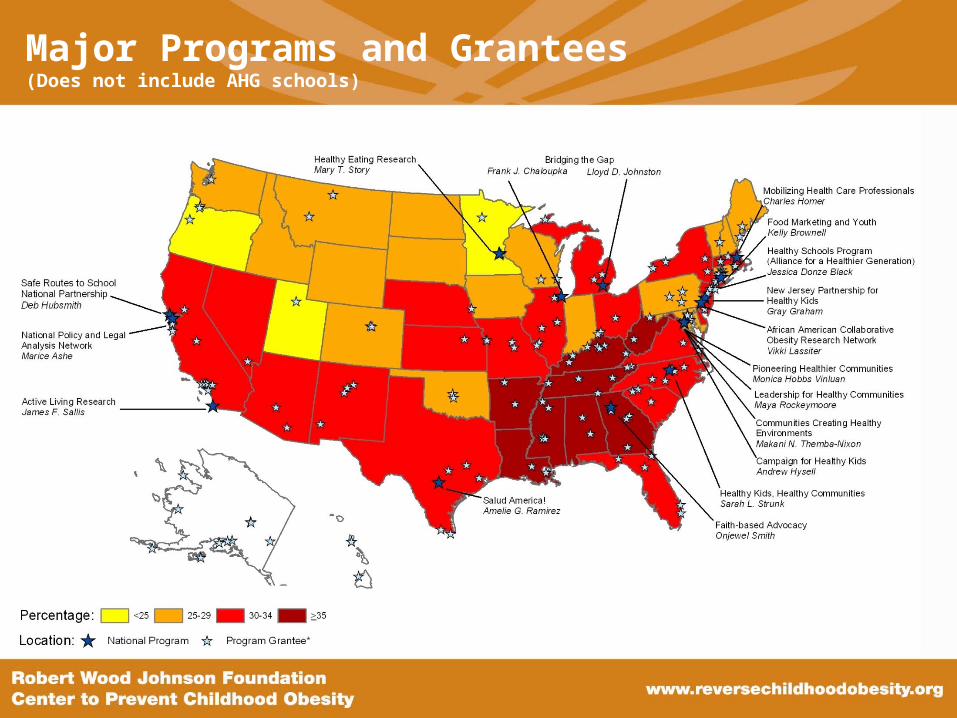
Major Programs and Grantees(Does not include AHG schools)

Major Programs and Grantees(includes AHG schools)

Policy Priorities for Energy Balance
• Federal
• State
• Local

Federal Policy Opportunities
• Child Nutrition and WIC• Transportation Reauthorization• K–12 Education, Reauthorization of
Elementary and Secondary Reauthorization Act
• Federal Trade Commission and Food Marketing

State Policy Opportunities
• Safe Routes to School • Legislation• Wellness Policies• School Siting• Complete Streets• Personal Safety• Many others…

QuickTime™ and a decompressor
are needed to see this picture.
Safe Routes to School State Network Project:2007-2011Making Change Through Partners and Policies
Source: CDC Behavioral Risk Factor Surveillance System.
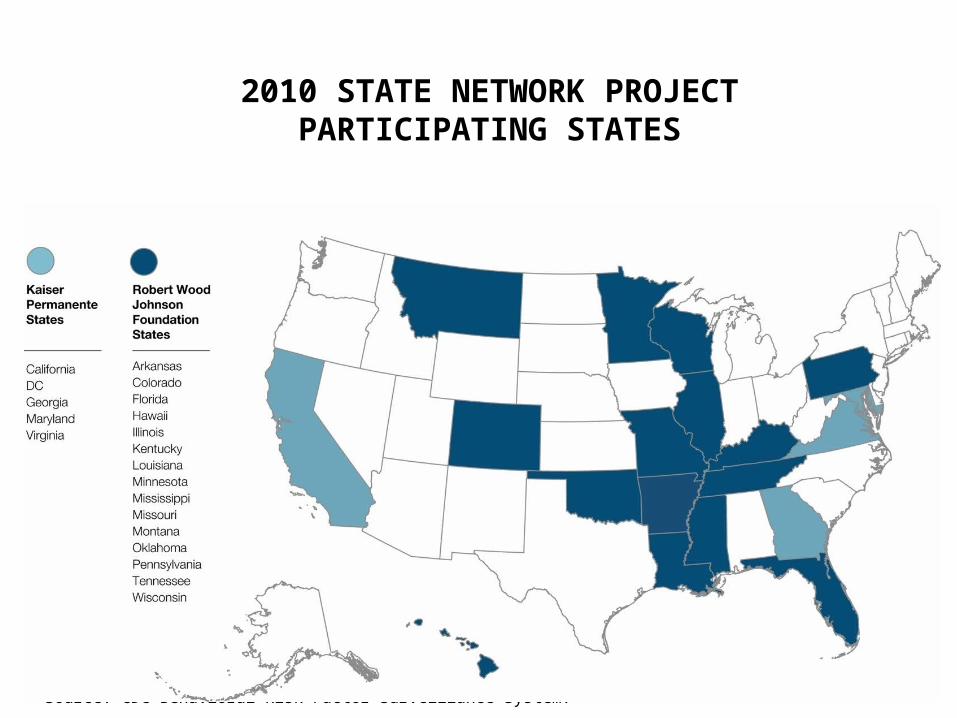
2010 STATE NETWORK PROJECTPARTICIPATING STATES

Why Safe Routes to School?
Distance - Traffic Safety - Fear of Crime

School consolidation has lengthened the trip between home and schoolSchool consolidation has lengthened the trip between home and school
• From 1968-2001 - 1,000 less schools; 2 million more students
• Only 35% of students live within 2 miles of their school
• From 1968-2001 - 1,000 less schools; 2 million more students
• Only 35% of students live within 2 miles of their school
(CDC 2005 Kidswalk-to-School)
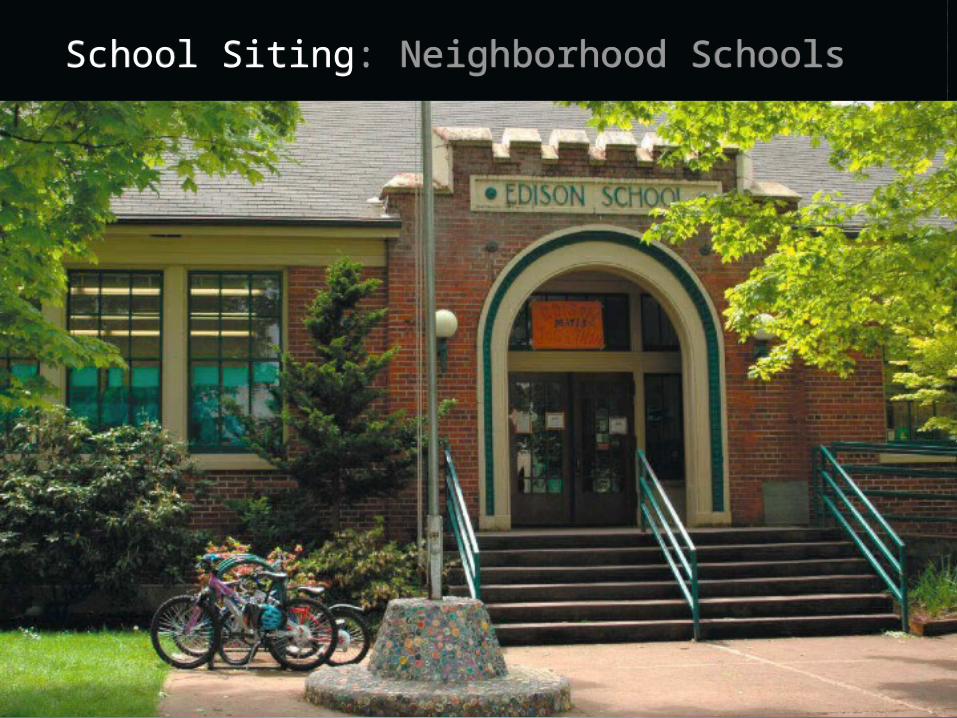
School Siting: Neighborhood SchoolsSchool Siting: Neighborhood Schools

Complete Streets: For All UsersComplete Streets: For All Users

Local Government Actions - Nutrition
• Promote the use of healthy foods and beverages for local government-sponsored events.
• Limit marketing of unhealthy foods where children gather. • Promote healthy foods in government buildings and
community property • Require fast-food/chains to include calories on in-store
menus and menu boards. • Incentives for restaurants offering healthier menu items.

Local Government Actions - Nutrition
• Create incentive programs for retail grocery stores in underserved areas,
• Improve food offerings in corner and convenience stores, • Start and sustain farmers’ markets. • Community groups/farmers technology to accept Electronic
Benefit Transfer, debit and credit purchases at farmers’ markets, etc..

Local Government Actions - Physical Activity
• Connect roadways to trails and bike paths. • Support smart growth strategies and zoning: • compact and mixed-use zoning, • affordable housing, • thriving retail, • transit-oriented development, • urban infill, • walkable and bikable street design, • green building practices.

Local Government Actions - Physical Activity
• Complete Streets - require integration of sidewalks, bike lanes and safe crossings in all major transportation projects.
• Support safe and crime-free parks, playgrounds, trails, greenways and recreation facilities, especially in underserved areas.
• Encourage pedestrian- and transit-friendly development/recreation access
• Support bike/ped in design and procurement of contracts and governmental building.
• School Siting - locate, build and renovate schools to support walking and biking.

Local Government Actions - Physical Activity
• LEED Neighborhood Design.• Incorporate a health impact assessment in all locally funded transportation projects prior to funding approval. • Joint-use agreements - playgroundsand rec facilities before-after school-weekends. • Work with state and local governments, developers and community to ensure planning and capital improvement projects prioritize physical activity.

Columbia Villa - Portland, Oregon

Columbia Villa - Portland, Oregon
• HOPE VI and other federal and local funds
• From 450 to 850 housing units
• 4 small parks, 1 main park and public garden
• Rosa Parks Elementary has the highest walk to school rate
• Bicycle/pedestrian preference throughout
• LEED/green building principles used throughout
• 95% of rainwater is naturally filtered

Waimea Trail and Greenway - Kamuela, Hawaii

Waimea Trail and Greenway - Kamuela, Hawaii
• connects two apartment complexes with the local public elementary and middle school
• operated by the Housing and Community Development Corporation of Hawaii
• half mile section of the trail was cleared and now allows students to walk to school
• trail will become a five mile Shared-Use Pathway
• undergoing a NEPA level Environmental Assessment

PedNet/Columbia Housing - Columbia, Missouri

PedNet/Columbia Housing - Columbia, Missouri
• $300,000 SRTS project in partnership with the Columbia Housing Authority
• Walking School Buses from public housing area to three schools
• Promotion of program through public housing channels
• Recruitment of parent volunteers by crediting time towards "self-improvement/community service" hours as requirement for all public housing residents
• Afternoon delivery of the children directly to public housing agency's after-school daycare program


