robotic and clinical evaluation of upper limb motor ... · marco germanotta1*†, gessica...
TRANSCRIPT
J N E R JOURNAL OF NEUROENGINEERINGAND REHABILITATION
Germanotta et al. Journal of NeuroEngineering and Rehabilitation (2015) 12:41 DOI 10.1186/s12984-015-0032-6
RESEARCH Open Access
Robotic and clinical evaluation of upper limbmotor performance in patients with Friedreich’sAtaxia: an observational studyMarco Germanotta1*†, Gessica Vasco2,3†, Maurizio Petrarca2, Stefano Rossi4, Sacha Carniel2, Enrico Bertini3,Paolo Cappa2,5 and Enrico Castelli2
Abstract
Background: Friedreich’s ataxia (FRDA) is the most common hereditary autosomal recessive form of ataxia. In thisdisease there is early manifestation of gait ataxia, and dysmetria of the arms and legs which causes impairment indaily activities that require fine manual dexterity. To date there is no cure for this disease. Some novel therapeuticapproaches are ongoing in different steps of clinical trial. Development of sensitive outcome measures is crucial toprove therapeutic effectiveness. The aim of the study was to assess the reliability and sensitivity of quantitative andobjective assessment of upper limb performance computed by means of the robotic device and to evaluate thecorrelation with clinical and functional markers of the disease severity.
Methods: Here we assess upper limb performances by means of the InMotion Arm Robot, a robot designed forclinical neurological applications, in a cohort of 14 children and young adults affected by FRDA, matched for ageand gender with 18 healthy subjects. We focused on the analysis of kinematics, accuracy, smoothness, andsubmovements of the upper limb while reaching movements were performed. The robotic evaluation of upperlimb performance consisted of planar reaching movements performed with the robotic system. The motors of therobot were turned off, so that the device worked as a measurement tool. The status of the disease was scoredusing the Scale for the Assessment and Rating of Ataxia (SARA). Relationships between robotic indices and a rangeof clinical and disease characteristics were examined.
Results: All our robotic indices were significantly different between the two cohorts except for two, and werehighly and reliably discriminative between healthy and subjects with FRDA. In particular, subjects with FRDAexhibited slower movements as well as loss of accuracy and smoothness, which are typical of the disease. Durationof Movement, Normalized Jerk, and Number of Submovements were the best discriminative indices, as they weredirectly and easily measurable and correlated with the status of the disease, as measured by SARA.
Conclusions: Our results suggest that outcome measures obtained by means of robotic devices can improve thesensitivity of clinical evaluations of patients’ dexterity and can accurately and efficiently quantify changes over timein clinical trials, particularly when functional scales appear to be no longer sensitive.
Keywords: Friedreich’s ataxia, Robot-mediated evaluation, Scale for the Assessment and Rating of Ataxia, Upperlimb, Reaching task, Kinematics, Accuracy, Smoothness, Submovements
* Correspondence: [email protected]†Equal contributors1Don Carlo Gnocchi Onlus Foundation, Piazzale Morandi 6, 20121 Milan, ItalyFull list of author information is available at the end of the article
© 2015 Germanotta et al.; licensee BioMed Central. This is an Open Access article distributed under the terms of the CreativeCommons Attribution License (http://creativecommons.org/licenses/by/4.0), which permits unrestricted use, distribution, andreproduction in any medium, provided the original work is properly credited. The Creative Commons Public DomainDedication waiver (http://creativecommons.org/publicdomain/zero/1.0/) applies to the data made available in this article,unless otherwise stated.

Germanotta et al. Journal of NeuroEngineering and Rehabilitation (2015) 12:41 Page 2 of 13
BackgroundFriedreich’s ataxia (FRDA) is the most common heredi-tary autosomal recessive form of ataxia resulting fromthe homozygous expansion of a guanine–adenine–adenine(GAA) trinucleotide repeat in intron 1 of the frataxin geneon chromosome 9q13. FRDA affects about 1 in 30,000 in-dividuals in Western Europe [1]. The clinical features ofFRDA are progressive ataxia, weakness, spasticity, sensorysymptoms and cardiomyopathy [2,3].In patients with FRDA, gait ataxia and general clumsi-
ness are the commonest presenting symptoms and upperlimb ataxia progresses slower than lower limb impairment,thus the majority of non-ambulatory patients can still usetheir upper limbs for daily activities. Consequently, spe-cific tools for assessing upper limb function may then besuitable both for ambulatory and non-ambulatory patientsand valuable for long-term evaluation [4].Currently, the effectiveness of treatment is generally
measured by clinical scales that include several func-tional tests like the Friedreich Ataxia Rating Scale(FARS) [5], the International Cooperative Ataxia RatingScale (ICARS) [6], the brief version of ICARS namedBrief Ataxia Rating Scale (BARS) [7], and the Scale forthe Assessment and Rating of Ataxia (SARA) [8]. SARAwas recognized as the most sensitive scale for its high con-struct validity, best effect size and for its compact naturein a longitudinal analysis of a numerous cohort of 96FRDA patients in comparison with ICARS and FARS[9,10], although the scores of these scales are well corre-lated with each other. The applicability of these functionalscales in children is still an open question, as age-validation is needed. However, SARA was demonstratedto be suitable with a good reliability in healthy childrenbeyond the age of 10. Moreover, in a preliminary pilotstudy concerning age-dependency, it emerges that SARAis more suitable for long-term quantitative ataxia assess-ment from child to adulthood in comparison to ICARSand BARS [11].In general, however, clinical evaluations exhibit several
limitations: a low rate of reproducibility, low resolution,lack of sensitivity, and floor and ceiling effects [12].Therefore, in the last few years, researchers have devel-oped a growing interest in the quantitative evaluationtechniques of residual motor abilities, especially thosefocusing on the upper limb function. Such efforts havebeen primarily motivated by the inherent ability of ro-botic devices to objectively quantify motor performanceand to detect small variations; consequently, robot medi-ated evaluations could represent a useful additional toolfor clinical measures [13,14]. Briefly, robot devices areeffectively employed to assess motor recovery of theupper limbs mainly in patients with stroke [15-22] (forreviews, see [23] and [24]) and in children with cerebralpalsy [25-28] and the mounting evidence suggests that
robotic outcomes can also be effectively employed inother diseases, such as Multiple Sclerosis [29].Up to now, only a few studies have aimed to a quanti-
tative evaluation of the motor performance of upperlimbs in patients with ataxia [30-34] and even fewerstudies focused on individuals with FRDA. Day et al.[35] reported that analyzing the influence of vision onupper limb reaching movements by using an opticaltracker system, FRDA patients showed prolonged reac-tion times and less accurate and slower movementscompared to healthy subjects. Bardorfer et al. [36], byusing an haptic interface, showed that FRDA patientswere able to perform tracking tasks, but with lower vel-ocity and less accuracy than a healthy control group; therelationship between the robotic indices and clinicalscales was not investigated and the movement was notpartitioned into submovements, which were recognizedas significant for the analysis of neurological disease pro-gression [37,38]. Finally, Maurel et al. [39] developedand applied an upper limb kinematic protocol adaptedto children and young adults with FRDA; they highlightedlower values of velocity, precision and smoothness ofmovements of upper limbs in three tasks - i.e. pointing,circle-drawing and prono-supination tasks - in comparisonwith a control group.Therefore, the aim of this study was to assess with a
robotic system the upper limb performances in a cohortof children and young adults affected by FRDA and ageand gender-matched with healthy subjects. We analyzedthe kinematics, accuracy, smoothness, and submove-ments of the upper limb during a planar point-to-pointreaching task in a dual-modal visual-haptic feedback bymeans of the InMotion Arm Robot, the commercial ver-sion of the MIT-Manus [40].Specifically, the purposes of this paper are threefold.
Firstly, to study the discriminative sensitivity of theselected indices computed via the robotic system betweenhealthy subjects and patients with FRDA. Secondly, toassess the reliability of the selected indices. Finally, toevaluate the correlation between the indices provided bythe robotic system and a range of clinical and diseasecharacteristics in subjects with FRDA. We hypothesizedthat the indices of upper limb performance would be asso-ciated with disease severity, as evaluated by SARA, andwith disease-related variables, as disease duration andnumber of GAA repeats, which are variables well knownin literature highly related with the phenotype [41].
MethodsSubjectsFourteen genetically confirmed individuals affected byFRDA (mean age 15.3 years, range 6–28 years, 4 males,10 females) were recruited at the NeurorehabilitationDivision of the IRCCS Bambino Gesù Children’s Hospital
Germanotta et al. Journal of NeuroEngineering and Rehabilitation (2015) 12:41 Page 3 of 13
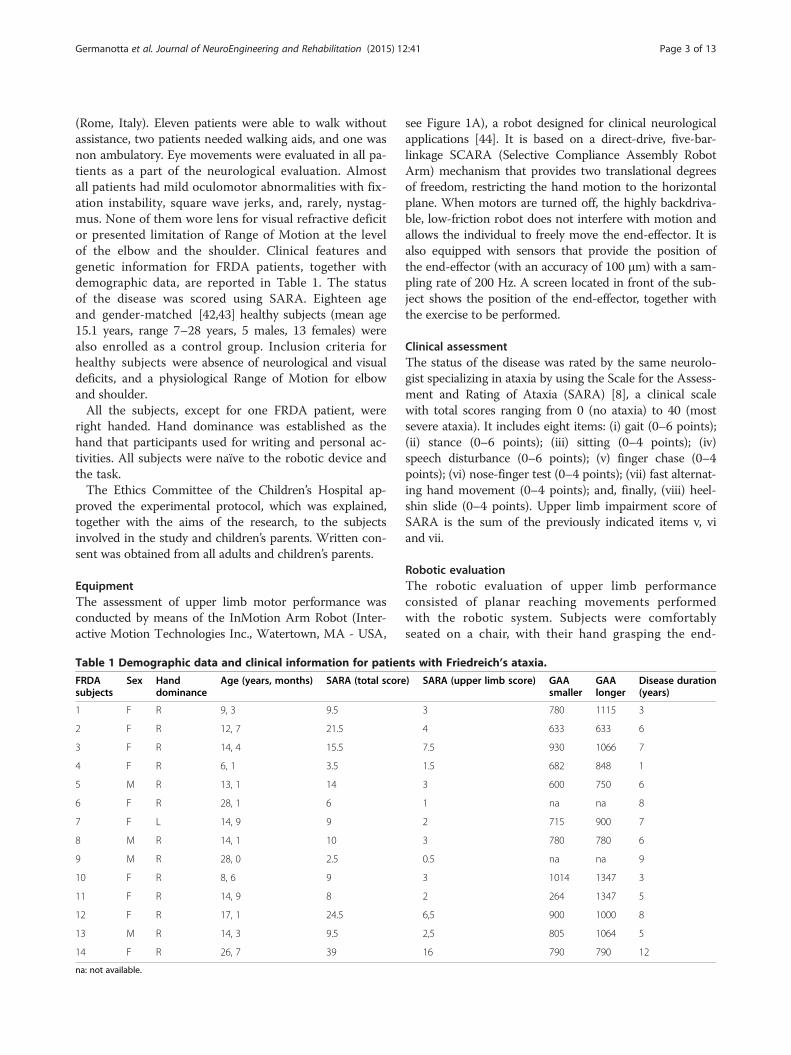
(Rome, Italy). Eleven patients were able to walk withoutassistance, two patients needed walking aids, and one wasnon ambulatory. Eye movements were evaluated in all pa-tients as a part of the neurological evaluation. Almostall patients had mild oculomotor abnormalities with fix-ation instability, square wave jerks, and, rarely, nystag-mus. None of them wore lens for visual refractive deficitor presented limitation of Range of Motion at the levelof the elbow and the shoulder. Clinical features andgenetic information for FRDA patients, together withdemographic data, are reported in Table 1. The statusof the disease was scored using SARA. Eighteen ageand gender-matched [42,43] healthy subjects (mean age15.1 years, range 7–28 years, 5 males, 13 females) werealso enrolled as a control group. Inclusion criteria forhealthy subjects were absence of neurological and visualdeficits, and a physiological Range of Motion for elbowand shoulder.All the subjects, except for one FRDA patient, were
right handed. Hand dominance was established as thehand that participants used for writing and personal ac-tivities. All subjects were naïve to the robotic device andthe task.The Ethics Committee of the Children’s Hospital ap-
proved the experimental protocol, which was explained,together with the aims of the research, to the subjectsinvolved in the study and children’s parents. Written con-sent was obtained from all adults and children’s parents.
EquipmentThe assessment of upper limb motor performance wasconducted by means of the InMotion Arm Robot (Inter-active Motion Technologies Inc., Watertown, MA - USA,
Table 1 Demographic data and clinical information for patien
FRDAsubjects
Sex Handdominance
Age (years, months) SARA (total score
1 F R 9, 3 9.5
2 F R 12, 7 21.5
3 F R 14, 4 15.5
4 F R 6, 1 3.5
5 M R 13, 1 14
6 F R 28, 1 6
7 F L 14, 9 9
8 M R 14, 1 10
9 M R 28, 0 2.5
10 F R 8, 6 9
11 F R 14, 9 8
12 F R 17, 1 24.5
13 M R 14, 3 9.5
14 F R 26, 7 39
na: not available.
see Figure 1A), a robot designed for clinical neurologicalapplications [44]. It is based on a direct-drive, five-bar-linkage SCARA (Selective Compliance Assembly RobotArm) mechanism that provides two translational degreesof freedom, restricting the hand motion to the horizontalplane. When motors are turned off, the highly backdriva-ble, low-friction robot does not interfere with motion andallows the individual to freely move the end-effector. It isalso equipped with sensors that provide the position ofthe end-effector (with an accuracy of 100 μm) with a sam-pling rate of 200 Hz. A screen located in front of the sub-ject shows the position of the end-effector, together withthe exercise to be performed.
Clinical assessmentThe status of the disease was rated by the same neurolo-gist specializing in ataxia by using the Scale for the Assess-ment and Rating of Ataxia (SARA) [8], a clinical scalewith total scores ranging from 0 (no ataxia) to 40 (mostsevere ataxia). It includes eight items: (i) gait (0–6 points);(ii) stance (0–6 points); (iii) sitting (0–4 points); (iv)speech disturbance (0–6 points); (v) finger chase (0–4points); (vi) nose-finger test (0–4 points); (vii) fast alternat-ing hand movement (0–4 points); and, finally, (viii) heel-shin slide (0–4 points). Upper limb impairment score ofSARA is the sum of the previously indicated items v, viand vii.
Robotic evaluationThe robotic evaluation of upper limb performanceconsisted of planar reaching movements performedwith the robotic system. Subjects were comfortablyseated on a chair, with their hand grasping the end-
ts with Friedreich’s ataxia.
) SARA (upper limb score) GAAsmaller
GAAlonger
Disease duration(years)
3 780 1115 3
4 633 633 6
7.5 930 1066 7
1.5 682 848 1
3 600 750 6
1 na na 8
2 715 900 7
3 780 780 6
0.5 na na 9
3 1014 1347 3
2 264 1347 5
6,5 900 1000 8
2,5 805 1064 5
16 790 790 12

Figure 1 (A) Robotic system for upper limb rehabilitation; (B) Visual template of the reaching task. The yellow circle indicates the position of theend-effector while the target to be reached is showed by the red circle.
Germanotta et al. Journal of NeuroEngineering and Rehabilitation (2015) 12:41 Page 4 of 13
effector. In order to minimize compensatory move-ments, the trunk was restrained by a five-point seat-belt. An orthotic device supported the forearm andthe hand to prevent all wrist movements and forearmprono-supination. The center of the workspace was lo-cated in front of the subject at the midline of the body.The position (height and distance from the table) ofthe chair was set depending on the subject’s anthropo-metric measures, so that, handling the end-effectorwith the orthotic device in the center of the work-space, the elevation angle of the shoulder was 45 de-grees for all the participants.The protocol consisted of five blocks of 16 unassisted
planar reaching movements, making a total of 80reaching movements. In a single block, eight white tar-gets equally spaced on a circumference (with radius of14 cm), and a white target positioned in the center ofthe circumference were shown on the screen located infront of the subject, together with the end-effector pos-ition (Figure 1B). The center of the circumference wascoincident with the center of the workspace. Startingfrom the center, subjects were asked to move the end-effector, with a self-selected speed, in order to reachthe blinking target and to come back to the center fol-lowing the visual feedback in a virtual environment,along a straight path of about 14 cm; additionally theparticipants were not asked to perform the task with aspecific time constraint and, then, the movement ac-curacy was implicitly a task requisite. The trial involvesonly the shoulder and elbow planar coordination. Thesequence of center-out movements was randomized.The motors of the robot were turned off, so that thedevice worked as a measurement tool. Only the domin-ant arm was tested. The session per subject/patientlasted less than 20 minutes. Both patients and healthysubjects were tested twice, to assess the test-retest reli-ability of the proposed outcome measures. The timeinterval between testing was 1–7 days.
Data analysisData measured by the robot were processed offline toobtain quantitative indices related to different featuresof the subject’s dexterity. The recorded end-effectorposition was filtered with a 6th order zero phase shiftlow-pass Butterworth filter, with a cut-off frequency of10 Hz, and differentiated to obtain speed, acceleration,and jerk. Then, from the global measure, we identifiedthe 80 reaching movements: specifically, each move-ment was considered to start when the speed magni-tude became greater than 10% of the peak speed andthe movement was considered to end when the speeddropped and remained below the 10% of the peak speed[20]. For each movement, a set of indices was com-puted. Among feasible measures proposed in the litera-ture on neuro-rehabilitation of the upper limb [20,45]to characterize movement smoothness, movement ac-curacy, and tracking rapidity, we selected the followingindices grouped as: kinematic, accuracy, smoothness,and submovement indices.
Kinematic indicesTo characterize the kinematics of the movement, wemeasured: (i) the Duration of Movement (D), defined asthe time between the movement onset and the move-ment termination, (ii) the Mean Velocity (MV) and (iii)the Peak Velocity (PV) values of the velocity profile [19].
Accuracy indicesThe Length Ratio (LR) is defined as the ratio betweenthe path actually travelled by the subject and the desiredone (Lt), i.e. the minimum distance between the begin-ning and the end of the trajectory [20]:
LR ¼X
dR
Ltð1Þ
Germanotta et al. Journal of NeuroEngineering and Rehabilitation (2015) 12:41 Page 5 of 13
where dR is the distance between two points of thetrajectory. Higher values of LR represent a lower accur-acy value.The Lateral Deviation (LD) is defined as the highest
deviation from the straight line that connects the initialand the final target position in the analyzed movement[27]. The LD value increases when accuracy decreases.The Aiming Angle (AA) is computed as the angle be-
tween the line connecting the starting and ending target,and the line from the starting point to the peak speedpoint [19]. An AA decrease corresponds to an increaseof accuracy.
Smoothness indicesThe Normalized Jerk (NJ) is expressed by the followingequation [46]:
NJ ¼ffiffiffiffiffiffiffiffiffiffiffiffiffiffiffiffiffiffiffiffiffiffiffiffiffiffiffiffiffiffiffiffiffiffiffiffiffiffiffiffiffiffi12
Zj2⋅
T 5
XdR
� �2 ⋅dt
vuuut ð2Þ
where j is the jerk, i.e. the derivative of acceleration, andT is the duration of the movement. Lower values of NJindicate smoother movements.The Speed Metric (SM) is measured as the ratio be-
tween the mean and the peak speed [13]:
SM ¼ vmean
vpeakð3Þ
The SM value increases when smoothness increases.
Submovement indicesWith respect to the submovements, we followed the ap-proach proposed by Friedman et al. [47]. Specifically, wedecomposed the reaching movements into submove-ments, modeled according to minimum jerk criterionwith a bell-shape velocity profile [48]:
_x tð Þ ¼ AD
30t−t0D
� �4
−60t−t0D
� �3
þ 30t−t0D
� �2� �
ð4Þ
where D, A and t0 are the duration, the amplitude andthe starting time of a single submovement, respectively.Each velocity profile F(t) of the reconstructed movementis then composed of the overlap of N submovements:
F tð Þ ¼XNi¼1
0 t < T 0i
_x tð Þ T 0i ≤ t ≤T 0i þ D0 T 0i þ D
8<:
ð5ÞSince the robot restrained the movement to the horizon-
tal plane, each movement was implicitly two-dimensional,so it was defined by four parameters: duration D, startingtime T, and amplitude in x and y direction (Ax and Ay).
Submovements were extracted from the measured velocityprofile by using the constrained nonlinear optimizationfunction (fmincon) in the Optimization toolkit of Matlab(MathWorks, Natick, MA - USA). For a given number ofsubmovements, all the parameters were optimized simul-taneously by minimizing the reconstruction error:
E ¼X Fx tð Þ−Gx tð Þ½ �2 þ Fy tð Þ−Gy tð Þ� �2 þ Fv tð Þ−
ffiffiffiffiffiffiffiffiffiffiffiffiffiffiffiffiffiffiffiffiffiffiffiffiffiffiffiffiffiffiffiffiGx tð Þ2 þ Gy tð Þ2
q� �2
2 Gx tð Þ2 þ Gy tð Þ2� �ð6Þ
where Gx(t) and Gy(t) are the components of the mea-sured end-effector velocity, Fx(t) and Fy(t) are the recon-structed x and y components of the velocity, and Fv isthe reconstructed tangential velocity. Referring to theconstraints, submovements were allowed to have a dur-ation of at least 167 ms, following Rohrer et Hogan [49]; Ax
and Ay, instead, were limited to the size of the workspace,i.e., between −0.2 m and 0.2 m [50]. The optimization wasrun for an increasing number of submovements, until theerror E is lower than a threshold, set to 0.02 [38].Starting from the obtained submovements, the following
indices were then computed: Number of Submovements(NS), Duration of Submovements (DS) and Amplitude ofSubmovements (AS) [38].
Statistical analysisAll data were tested for normality with the Shapiro-Wilktest. When the assumption of normality was met, weassessed the differences between FRDA patients and thecontrol group by using an independent t-test, withWelch’s correction when the variances were not equal.Otherwise, we used a Mann-Withney U test.Reliability of parameters was analyzed using the Intra-
class Correlation Coefficient (ICC) with an ICC(2,k)model. Reliability was classified as excellent (ICC ≥ 0.90),very good (ICC ≥ 0.80), good (ICC ≥ 0.70), moderate(ICC ≥ 0.6) or poor otherwise.Finally, within-subject relations between robotic indi-
ces and clinical parameters (disease duration, the smallerGAA repeat size, the larger GAA repeat size, and theSARA scale) were tested with a Spearman’s rank ordercorrelation, with a False Discovery Rate correction formultiple comparison. The significance level was set at0.05 for all statistical tests.Statistical analysis was performed with built-in func-
tions of SPSS 21 (IBM, Armonk, NY - USA).
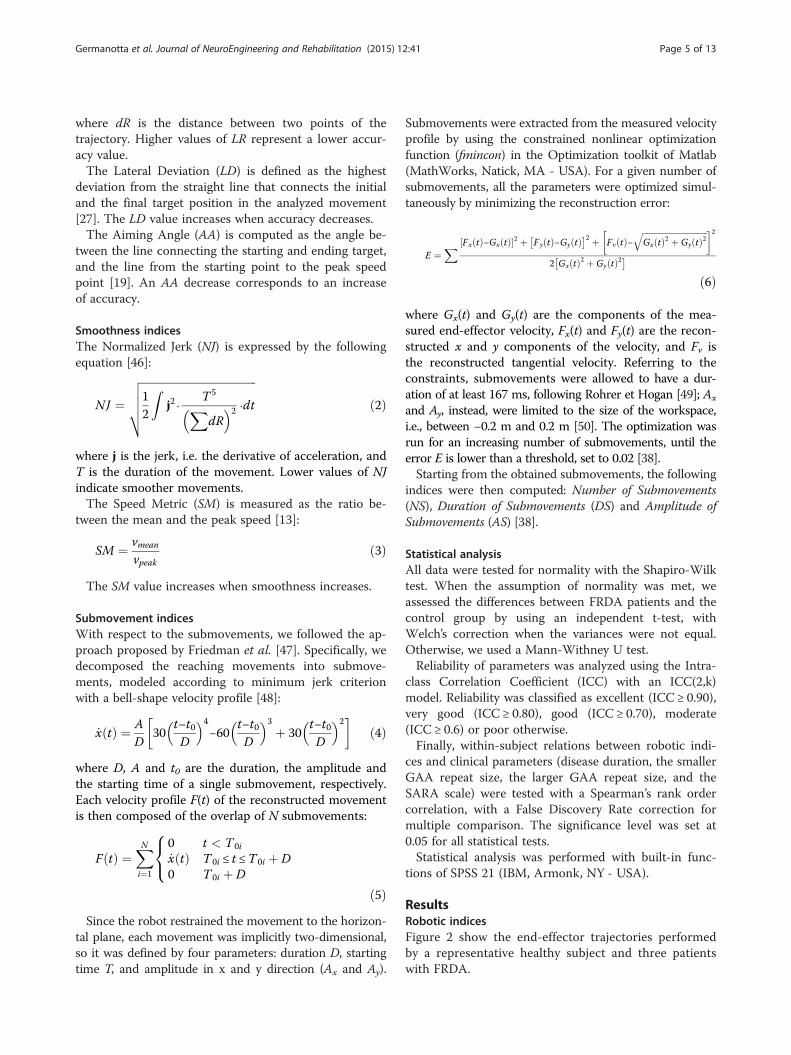
ResultsRobotic indicesFigure 2 show the end-effector trajectories performedby a representative healthy subject and three patientswith FRDA.
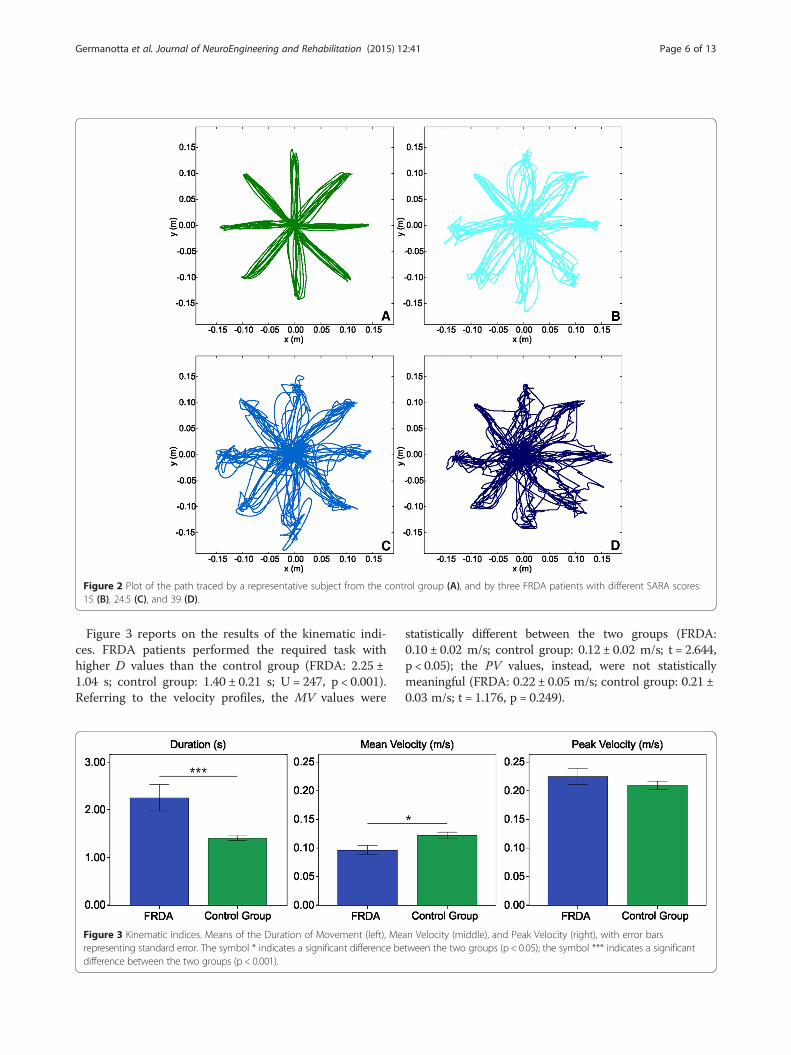
Figure 2 Plot of the path traced by a representative subject from the control group (A), and by three FRDA patients with different SARA scores:15 (B), 24.5 (C), and 39 (D).
Germanotta et al. Journal of NeuroEngineering and Rehabilitation (2015) 12:41 Page 6 of 13
Figure 3 reports on the results of the kinematic indi-ces. FRDA patients performed the required task withhigher D values than the control group (FRDA: 2.25 ±1.04 s; control group: 1.40 ± 0.21 s; U = 247, p < 0.001).Referring to the velocity profiles, the MV values were
Figure 3 Kinematic indices. Means of the Duration of Movement (left), Merepresenting standard error. The symbol * indicates a significant difference bedifference between the two groups (p < 0.001).
statistically different between the two groups (FRDA:0.10 ± 0.02 m/s; control group: 0.12 ± 0.02 m/s; t = 2.644,p < 0.05); the PV values, instead, were not statisticallymeaningful (FRDA: 0.22 ± 0.05 m/s; control group: 0.21 ±0.03 m/s; t = 1.176, p = 0.249).
an Velocity (middle), and Peak Velocity (right), with error barstween the two groups (p < 0.05); the symbol *** indicates a significant

Germanotta et al. Journal of NeuroEngineering and Rehabilitation (2015) 12:41 Page 7 of 13
Regarding the movement accuracy (Figure 4), all theselected indices showed a lower accuracy in the FRDA,compared with the control group; in fact, LR was higherin the FRDA patients than in the control group (FRDA:1.37 ± 0.18; control group: 1.09 ± 0.06; U = 258, p < 0.001);LD was higher in the FRDA patients than in the con-trol group (FRDA: 0.72 ± 0.13 cm; control group: 0.50 ±0.20 cm; U = 213, p < 0.01); and, finally, the AA washigher in the FRDA patients than in the controlgroup (FRDA: 9.59 ± 2.20°; control group: 6.85 ± 2.49°;t = 3.280, p <0.01).With respect to the movement smoothness (Figure 5),
all the selected indices showed a lower smoothness inthe FRDA, compared with the control group; in fact, NJwas higher in the FRDA patients than in the controlgroup (FRDA: 333.24 ± 551.73; control group: 63.73 ±20.95; U = 256, p < 0.001); SM was lower in the FRDApatients than in the control group (FRDA: 0.43 ± 0.04;control group: 0.57 ± 0.06; U = 5, p < 0.001).The results of the analysis of the submovements
(Figure 6) revealed that movements in FRDA patientsare made of a higher NS value compared to healthy sub-jects (FRDA: 4.84 ± 2.04; control group: 2.83 ± 0.34; U =250, p < 0.001); moreover, the mean DS is lower in FRDAcompared with control group (FRDA: 0.60 ± 0.04 s; con-trol group: 0.67 ± 0.07 s; t = 3.022, p < 0.01). Finally, nodifferences were found between the two groups in AS(FRDA: 0.12 ± 0.03 m/s; control group: 0.14 ± 0.02 m/s;t = 1.820, p = 0.079).
Test-retest reliabilityThe ICC values for the selected robotic indices both inFRDA patients and the control group are reported inTable 2. With respect to the FRDA group, the ICCvalues ranged from 0.686 for the PV (good reliability) to0.969 for the NS (excellent reliability). With respect tothe healthy subjects, all the selected indices showed a
Figure 4 Movement accuracy indices. Means of the Length Ratio (left), Latrepresenting standard error. The symbol ** indicates a significant differencesignificant difference between the two groups (p < 0.001).
very good to excellent reliability: the ICC values rangedfrom 0.859 for the LR to 0.992 for the LD.
Correlation analysisThe correlation analysis between robotic indices andclinical measures is reported in Table 3. The SARA scaleand the upper limb score of the SARA subscale corre-lated moderately with the D, NJ, and NS. No correlationwas found between the robotic indices and the smallerGAA repeat size or the larger GAA repeat size. Table 4shows the correlation analysis for patients older than 10.From an analysis of this table and a comparative examwith Table 3, higher values of the Spearman’s correlationcoefficient were found for the D, NJ, and NS indices, ifcompared with the ones found for the entire enrolled co-hort. Moreover, moderate to high values of correlationwere found (see Table 4) between the SARA scale, and theupper limb score of the SARA scale, with MV, PV, and AS.Finally, the correlation among the robotic indices for
patients with FRDA is reported in Table 5. High correl-ation was found between D, MV, PV, LR, NJ, NS and AS.No correlation or lower correlation was found betweenLD, AA, SM, DS and the remaining above-mentionedindices. DS showed no correlation with all the otherindices. D, MV, NJ, and NS, which show correlation withthe SARA scale, are the indices that showed the highestcorrelation between them.
DiscussionIn this work, we quantitatively evaluated the upper limbmotor performance in a cohort of individuals affected byFRDA compared with an age and gender matched controlgroup of healthy subjects, by using a rehabilitation roboticdevice. Specifically, we analyzed the dexterity in perform-ing a planar point-to-point reaching task, a multijointmovement that requires the coordination of shoulder andelbow joint. A similar protocol was efficiently used as an
eral Deviation (middle), and Aiming Angle (right), with error barsbetween the two groups (p < 0.01); the symbol *** indicates a

Figure 5 Movement smoothness indices. Means of the Normalized Jerk (left) and the Speed Metric (right), with error bars representing standarderror. The symbol *** indicates a significant difference between the two groups (p < 0.001).
Germanotta et al. Journal of NeuroEngineering and Rehabilitation (2015) 12:41 Page 8 of 13
evaluative tool for the quantification of neurological dis-ease, such as stroke, cerebral palsy, or multiple sclerosis[25,26,29,51]. The test-retest reliability resulted from goodto excellent for most of the chosen indices, ranging from0.686 to 0.969 for patients with FRDA. These results aresimilar to those obtained by Maurel et al. [39], supportingthe introduction of quantitative outcome measures in clin-ical studies involving patients with FRDA.The aim of this study was first to verify the sensitivity
of quantitative outcome measures. All the selectedrobotic indices, except for two (i.e. the Peak Velocityand Amplitude of Submovements), were found to besignificantly different between healthy and FRDA pa-tients, indicating the ability of the selected outcomes todiscriminate between the two groups. In particular, wealso chose redundant indices to better exploit the in-ternal coherence among indices that are related tosimilar feature of the motion. We found that patientswith FRDA showed a significant increase of the Num-ber of Submovements, and a decrease in their duration(Duration of Submovements) while the amplitude values(Amplitude of Submovements) did not show a statistically
Figure 6 Submovement indices. Means of the Number of SubmovementsSubmovements (right) with error bars representing standard error. The sym(p < 0.01); the symbol *** indicates a significant difference between the tw
significant difference. In addition, we found a decrease insmoothness in patients with FRDA, as highlighted by theincrease in the Normalized Jerk and the decrease in SpeedMetric. Loss of smoothness and increase of submove-ments in patients with FRDA is probably related both tothe compensative strategy with sudden change of acceler-ation, and to the decrease of the nervous system controlin correctly planning the movement.All the selected indices showed a deterioration in
accuracy for patients, compared to healthy subjects.Actually, trajectories performed by the patients appearto be more circuitous, as highlighted by both the highervalues of Length Ratio and Lateral Deviation. Moreover,the increase of the Aiming Angle showed a difficulty inthe planning of the movement, moving the arm towardthe direction of the target. Consequently, the kinematicindices showed a significant increase in the timerequired to reach the target (Duration of Movement),relative to healthy subjects. These results are in accord-ance with all the studies that analyzed quantitatively themovements in patients with FRDA, both in reaching[3,35,39] and in different tasks [39]. In fact, the slowness
(left), Duration of Submovements (middle) and Amplitude ofbol ** indicates a significant difference between the two groupso groups (p < 0.001).
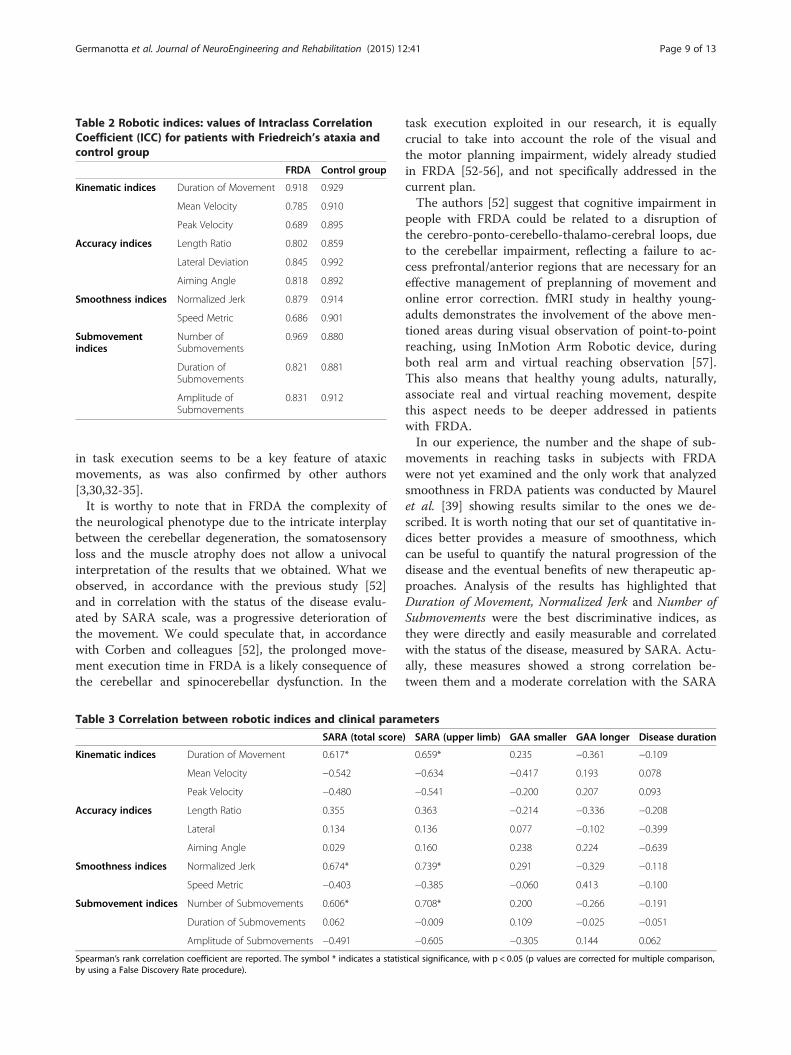
Table 2 Robotic indices: values of Intraclass CorrelationCoefficient (ICC) for patients with Friedreich’s ataxia andcontrol group
FRDA Control group
Kinematic indices Duration of Movement 0.918 0.929
Mean Velocity 0.785 0.910
Peak Velocity 0.689 0.895
Accuracy indices Length Ratio 0.802 0.859
Lateral Deviation 0.845 0.992
Aiming Angle 0.818 0.892
Smoothness indices Normalized Jerk 0.879 0.914
Speed Metric 0.686 0.901
Submovementindices
Number ofSubmovements
0.969 0.880
Duration ofSubmovements
0.821 0.881
Amplitude ofSubmovements
0.831 0.912
Germanotta et al. Journal of NeuroEngineering and Rehabilitation (2015) 12:41 Page 9 of 13
in task execution seems to be a key feature of ataxicmovements, as was also confirmed by other authors[3,30,32-35].It is worthy to note that in FRDA the complexity of
the neurological phenotype due to the intricate interplaybetween the cerebellar degeneration, the somatosensoryloss and the muscle atrophy does not allow a univocalinterpretation of the results that we obtained. What weobserved, in accordance with the previous study [52]and in correlation with the status of the disease evalu-ated by SARA scale, was a progressive deterioration ofthe movement. We could speculate that, in accordancewith Corben and colleagues [52], the prolonged move-ment execution time in FRDA is a likely consequence ofthe cerebellar and spinocerebellar dysfunction. In the
Table 3 Correlation between robotic indices and clinical para
SARA (total score
Kinematic indices Duration of Movement 0.617*
Mean Velocity −0.542
Peak Velocity −0.480
Accuracy indices Length Ratio 0.355
Lateral 0.134
Aiming Angle 0.029
Smoothness indices Normalized Jerk 0.674*
Speed Metric −0.403
Submovement indices Number of Submovements 0.606*
Duration of Submovements 0.062
Amplitude of Submovements −0.491
Spearman’s rank correlation coefficient are reported. The symbol * indicates a statisby using a False Discovery Rate procedure).
task execution exploited in our research, it is equallycrucial to take into account the role of the visual andthe motor planning impairment, widely already studiedin FRDA [52-56], and not specifically addressed in thecurrent plan.The authors [52] suggest that cognitive impairment in
people with FRDA could be related to a disruption ofthe cerebro-ponto-cerebello-thalamo-cerebral loops, dueto the cerebellar impairment, reflecting a failure to ac-cess prefrontal/anterior regions that are necessary for aneffective management of preplanning of movement andonline error correction. fMRI study in healthy young-adults demonstrates the involvement of the above men-tioned areas during visual observation of point-to-pointreaching, using InMotion Arm Robotic device, duringboth real arm and virtual reaching observation [57].This also means that healthy young adults, naturally,associate real and virtual reaching movement, despitethis aspect needs to be deeper addressed in patientswith FRDA.In our experience, the number and the shape of sub-
movements in reaching tasks in subjects with FRDAwere not yet examined and the only work that analyzedsmoothness in FRDA patients was conducted by Maurelet al. [39] showing results similar to the ones we de-scribed. It is worth noting that our set of quantitative in-dices better provides a measure of smoothness, whichcan be useful to quantify the natural progression of thedisease and the eventual benefits of new therapeutic ap-proaches. Analysis of the results has highlighted thatDuration of Movement, Normalized Jerk and Number ofSubmovements were the best discriminative indices, asthey were directly and easily measurable and correlatedwith the status of the disease, measured by SARA. Actu-ally, these measures showed a strong correlation be-tween them and a moderate correlation with the SARA
meters
) SARA (upper limb) GAA smaller GAA longer Disease duration
0.659* 0.235 −0.361 −0.109
−0.634 −0.417 0.193 0.078
−0.541 −0.200 0.207 0.093
0.363 −0.214 −0.336 −0.208
0.136 0.077 −0.102 −0.399
0.160 0.238 0.224 −0.639
0.739* 0.291 −0.329 −0.118
−0.385 −0.060 0.413 −0.100
0.708* 0.200 −0.266 −0.191
−0.009 0.109 −0.025 −0.051
−0.605 −0.305 0.144 0.062
tical significance, with p < 0.05 (p values are corrected for multiple comparison,
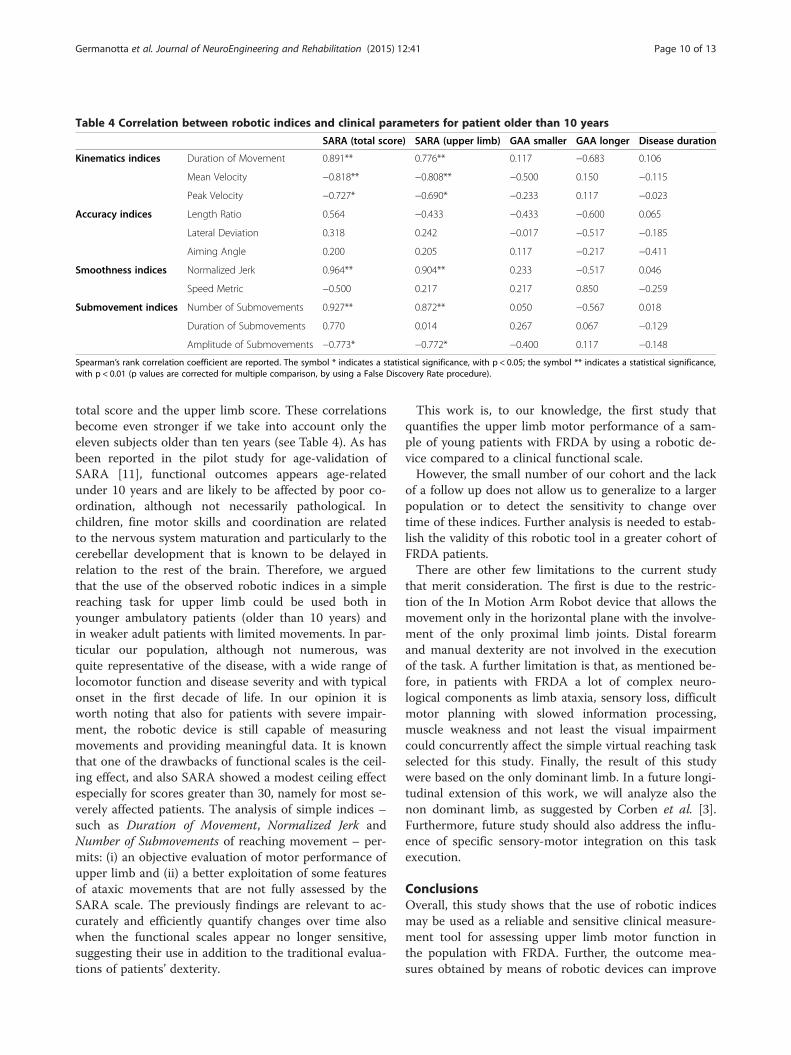
Table 4 Correlation between robotic indices and clinical parameters for patient older than 10 years
SARA (total score) SARA (upper limb) GAA smaller GAA longer Disease duration
Kinematics indices Duration of Movement 0.891** 0.776** 0.117 −0.683 0.106
Mean Velocity −0.818** −0.808** −0.500 0.150 −0.115
Peak Velocity −0.727* −0.690* −0.233 0.117 −0.023
Accuracy indices Length Ratio 0.564 −0.433 −0.433 −0.600 0.065
Lateral Deviation 0.318 0.242 −0.017 −0.517 −0.185
Aiming Angle 0.200 0.205 0.117 −0.217 −0.411
Smoothness indices Normalized Jerk 0.964** 0.904** 0.233 −0.517 0.046
Speed Metric −0.500 0.217 0.217 0.850 −0.259
Submovement indices Number of Submovements 0.927** 0.872** 0.050 −0.567 0.018
Duration of Submovements 0.770 0.014 0.267 0.067 −0.129
Amplitude of Submovements −0.773* −0.772* −0.400 0.117 −0.148
Spearman’s rank correlation coefficient are reported. The symbol * indicates a statistical significance, with p < 0.05; the symbol ** indicates a statistical significance,with p < 0.01 (p values are corrected for multiple comparison, by using a False Discovery Rate procedure).
Germanotta et al. Journal of NeuroEngineering and Rehabilitation (2015) 12:41 Page 10 of 13
total score and the upper limb score. These correlationsbecome even stronger if we take into account only theeleven subjects older than ten years (see Table 4). As hasbeen reported in the pilot study for age-validation ofSARA [11], functional outcomes appears age-relatedunder 10 years and are likely to be affected by poor co-ordination, although not necessarily pathological. Inchildren, fine motor skills and coordination are relatedto the nervous system maturation and particularly to thecerebellar development that is known to be delayed inrelation to the rest of the brain. Therefore, we arguedthat the use of the observed robotic indices in a simplereaching task for upper limb could be used both inyounger ambulatory patients (older than 10 years) andin weaker adult patients with limited movements. In par-ticular our population, although not numerous, wasquite representative of the disease, with a wide range oflocomotor function and disease severity and with typicalonset in the first decade of life. In our opinion it isworth noting that also for patients with severe impair-ment, the robotic device is still capable of measuringmovements and providing meaningful data. It is knownthat one of the drawbacks of functional scales is the ceil-ing effect, and also SARA showed a modest ceiling effectespecially for scores greater than 30, namely for most se-verely affected patients. The analysis of simple indices –such as Duration of Movement, Normalized Jerk andNumber of Submovements of reaching movement – per-mits: (i) an objective evaluation of motor performance ofupper limb and (ii) a better exploitation of some featuresof ataxic movements that are not fully assessed by theSARA scale. The previously findings are relevant to ac-curately and efficiently quantify changes over time alsowhen the functional scales appear no longer sensitive,suggesting their use in addition to the traditional evalua-tions of patients’ dexterity.
This work is, to our knowledge, the first study thatquantifies the upper limb motor performance of a sam-ple of young patients with FRDA by using a robotic de-vice compared to a clinical functional scale.However, the small number of our cohort and the lack
of a follow up does not allow us to generalize to a largerpopulation or to detect the sensitivity to change overtime of these indices. Further analysis is needed to estab-lish the validity of this robotic tool in a greater cohort ofFRDA patients.There are other few limitations to the current study
that merit consideration. The first is due to the restric-tion of the In Motion Arm Robot device that allows themovement only in the horizontal plane with the involve-ment of the only proximal limb joints. Distal forearmand manual dexterity are not involved in the executionof the task. A further limitation is that, as mentioned be-fore, in patients with FRDA a lot of complex neuro-logical components as limb ataxia, sensory loss, difficultmotor planning with slowed information processing,muscle weakness and not least the visual impairmentcould concurrently affect the simple virtual reaching taskselected for this study. Finally, the result of this studywere based on the only dominant limb. In a future longi-tudinal extension of this work, we will analyze also thenon dominant limb, as suggested by Corben et al. [3].Furthermore, future study should also address the influ-ence of specific sensory-motor integration on this taskexecution.
ConclusionsOverall, this study shows that the use of robotic indicesmay be used as a reliable and sensitive clinical measure-ment tool for assessing upper limb motor function inthe population with FRDA. Further, the outcome mea-sures obtained by means of robotic devices can improve

Table 5 Correlation coefficients among the robotic indices for patients with FRDA
Duration ofmovement
Meanvelocity
Peakvelocity
Lengthratio
Lateraldeviation
Aimingangle
Normalizedjerk
Speedmetric
Number ofsubmovements
Duration ofsubmovements
Amplitude ofsubmovements
Duration of movement 1 −0.793** −0.741** 0.771** 0.323 0.200 0.960** −0.604* 0.947** 0.099 −0.758**
Mean velocity −0.793** 1 0.965** −0.327 0.033 0.029 −0.837** 0.182 −0.802** −0.182 0.978**
Peak velocity −0.741** 0.965** 1 −0.297 0.112 0.187 −0.789** 0.108 −0.754** −0.138 0.969**
Length ratio 0.771** −0.327 −0.297 1 0.644* 0.376 0.714* −0.802** 0.754** −0.231 −0.310
Lateral deviation 0.323 0.033 0.112 0.644* 1 0.697* 0.367 −0.618* 0.358 −0.385 0.099
Aiming angle 0.200 0.029 0.187 0.376 0.697* 1 0.226 −0.248 0.270 0.007 0.086
Normalized jerk 0.960** −0.837** −0.789** 0.714* 0.367 0.226 1 −0.547 0.974** −0.059 −0.820**
Speed metric −0.604* 0.182 0.108 −0.802** −0.618* −0.248 −0.547 1 −0.556 0.305 0.125
Number of submovements 0.947** −0.802** −0.754** 0.754** 0.358 0.270 0.974** −0.556 1 −0.077 −0.807**
Duration of submovements 0.099 −0.182 −0.138 −0.231 −0.385 0.007 −0.059 0.305 −0.077 1 −0.103
Amplitude of submovements −0.758** 0.978** 0.969** −0.310 0.099 0.086 −0.820** 0.125 −0.807** −0.103 1
Spearman’s rank correlation coefficient are reported. The symbol * indicates a statistical significance, with p < 0.05; the symbol ** indicates a statistical significance, with p < 0.01 (p values are corrected for multiplecomparison, by using a False Discovery Rate procedure).
Germ
anottaet
al.JournalofNeuroEngineering
andRehabilitation
(2015) 12:41 Page
11of
13
Germanotta et al. Journal of NeuroEngineering and Rehabilitation (2015) 12:41 Page 12 of 13
the sensitivity of clinical evaluations of patients’ dexter-ity, supporting the clinical decision-making, and can ac-curately and efficiently quantify changes over time inclinical trials, particularly when functional scales appearto be no longer sensitive as in the case of patients withsevere functional impairment.
AbbreviationFRDA: Friedreich’s ataxia; SARA: Scale for the Assessment and Rating ofAtaxia; GAA: Guanine–Adenine–Adenine; FARS: Friedreich Ataxia Rating Scale;ICARS: International Cooperative Ataxia Rating Scale; BARS: Brief Ataxia RatingScale; SCARA: Selective Compliance Assembly Robot Arm; D: Duration ofmovement; MV: Mean velocity; PV: Peak velocity; LR: Length ratio; LD: Lateraldeviation; AA: Aiming angle; NJ: Normalized jerk; SM: Speed metric;NS: Number of submovements; DS: Duration of submovements;AS: Amplitude of submovements; ICC: Intraclass correlation coefficient.
Competing interestsThe authors declare that they have no competing interests.
Authors’ contributionsMG: Concept and design, acquisition of data, analysis and interpretation ofdata, preparation of manuscript. GV: Acquisition of data, interpretation ofdata, preparation of manuscript. MP: Concept and design, interpretation ofdata, preparation of manuscript. SR: Analysis and interpretation of data. SC:Acquisition of data. EB: Concept and design, study coordination. PC: Conceptand design, study coordination, preparation of manuscript. EC Concept anddesign, study coordination. All authors contributed in critically revising themanuscript and have given final approval of the version to be published.
Authors’ informationEnrico Bertini, Paolo Cappa and Enrico Castelli are senior investigators in thisproject.
AcknowledgementsThis study formed part of the PhD program pursued by MG at the “Sapienza”University of Rome (Italy). This research is supported by a grant from theItalian Ministry of Public Education, University and Research MIUR (“Roboticsystems for the rehabilitation” – year 2003/07; Principal Investigator: PC) anda grant from the Italian Ministry of Health (“Pilot study on a new class ofmedical devices: robotic system for rehabilitation and rehabilitation” – year2009/11; Principal Investigator: PC). We wish to thank all the participants whovolunteered for the experiment.
Author details1Don Carlo Gnocchi Onlus Foundation, Piazzale Morandi 6, 20121 Milan, Italy.2Movement Analysis and Robotics Laboratory (MARLab), NeurorehabilitationUnits, IRCCS Bambino Gesù Children’s Hospital, Via Torre di Palidoro, 00050,Passoscuro (Fiumicino) Rome, Italy. 3Unit of Neuromuscular andNeurodegenerative Disorders, Laboratory of Molecular Medicine, IRCCSBambino Gesù Children’s Hospital, Piazza S. Onofrio 4, 00165 Rome, Italy.4Department of Economics and Management - Industrial Engineering (DEIM),University of Tuscia, Via del Paradiso 47, 01100 Viterbo, Italy. 5Department ofMechanical and Aerospace Engineering, “Sapienza”, University of Rome, ViaEudossiana 18, 00184 Roma, Italy.
Received: 22 December 2014 Accepted: 10 April 2015
References1. Delatycki MB. Evaluating the progression of Friedreich ataxia and its
treatment. J Neurol. 2009;256:36–41.2. Pandolfo M. Friedreich ataxia. Semin Pediatr Neurol. 2003;10:163–72.3. Corben LA, Tai G, Wilson C, Collins V, Churchyard AJ, Delatycki MB. A
comparison of three measures of upper limb function in Friedreich ataxia.J Neurol. 2010;257:518–23.
4. Parkinson MH, Boesch S, Nachbauer W, Mariotti C, Giunti P. Clinical featuresof Friedreich’s ataxia: classical and atypical phenotypes. J Neurochem.2013;126:103–17.
5. Subramony SH, May W, Lynch D, Gomez C, Fischbeck K, Hallett M.Measuring Friedreich ataxia: Interrater reliability of a neurologic rating scale.Neurology. 2005;64:1261–2.
6. Trouillas P, Takayanagi T, Hallett M, Currier RD, Subramony SH, Wessel K,et al. International Cooperative Ataxia Rating Scale for pharmacologicalassessment of the cerebellar syndrome. J Neurol Sci. 1997;145:205–11.
7. Schmahmann JD, Gardner R, MacMore J, Vangel MG. Development of abrief ataxia rating scale (BARS) based on a modified form of the ICARS. MovDisord. 2009;24:1820–8.
8. Schmitz-Hübsch T, du Montcel ST, Baliko L, Berciano J, Boesch S, Depondt C,et al. Scale for the assessment and rating of ataxia: development of a newclinical scale. Neurology. 2006;66:1717–20.
9. Bürk K, Mälzig U, Wolf S, Heck S, Dimitriadis K, Schmitz-Hübsch T, et al.Comparison of three clinical rating scales in Friedreich ataxia (FRDA).Mov Disord. 2009;24:1779–84.
10. Reetz K, Dogan I, Costa AS, Dafotakis M, Fedosov K, Giunti P, et al. Biologicaland clinical characteristics of the European Friedreich’s Ataxia Consortium forTranslational Studies (EFACTS) cohort: a cross-sectional analysis of baselinedata. Lancet Neurol. 2015;14:174–82.
11. Brandsma R, Spits AH, Kuiper MJ, Lunsing RJ, Burger H, Kremer HP, et al.Ataxia rating scales are age-dependent in healthy children. Dev Med ChildNeurol. 2014;56:556–63.
12. Krabben T, Molier BI, Houwink A, Rietman JS, Buurke JH, Prange GB. Circledrawing as evaluative movement task in stroke rehabilitation: an explorativestudy. J Neuroeng Rehabil. 2011;8:15.
13. Rohrer B, Fasoli S, Krebs HI, Hughes R, Volpe B, Frontera WR, et al.Movement smoothness changes during stroke recovery. J Neurosci.2002;22:8297–304.
14. Finley MA, Fasoli SE, Dipietro L, Ohlhoff J, Macclellan L, Meister C, et al.Short-duration robotic therapy in stroke patients with severe upper-limbmotor impairment. J Rehabil Res Dev. 2005;42:683–92.
15. Kahn LE, Zygman ML, Rymer WZ, Reinkensmeyer DJ. Robot-assisted reachingexercise promotes arm movement recovery in chronic hemiparetic stroke: arandomized controlled pilot study. J Neuroeng Rehabil. 2006;3:12.
16. Dipietro L, Krebs HI, Fasoli SE, Volpe BT, Stein J, Bever C, et al. Changingmotor synergies in chronic stroke. J Neurophysiol. 2007;98:757–68.
17. Lewis GN, Perreault EJ. An assessment of robot-assisted bimanual movementson upper limb motor coordination following stroke. IEEE Trans Neural SystRehabil Eng. 2009;17:595–604.
18. Celik O, O’Malley MK, Boake C, Levin HS, Yozbatiran N, Reistetter TA.Normalized movement quality measures for therapeutic robots stronglycorrelate with clinical motor impairment measures. IEEE Trans Neural SystRehabil Eng. 2010;18:433–44.
19. Balasubramanian S, Colombo R, Sterpi I, Sanguineti V, Burdet E. Roboticassessment of upper limb motor function after stroke. Am J Phys MedRehabil. 2012;91(11 Suppl 3):S255–69.
20. Zollo L, Gallotta E, Guglielmelli E, Sterzi S. Robotic technologies andrehabilitation: new tools for upper-limb therapy and assessment in chronicstroke. Eur J Phys Rehabil Med. 2011;47:223–36.
21. Gilliaux M, Lejeune T, Detrembleur C, Sapin J, Dehez B, Stoquart G. Arobotic device as a sensitive quantitative tool to assess upper limbimpairments in stroke patients: a preliminary prospective cohort study.J Rehabil Med. 2012;44:210–7.
22. Colombo R, Cusmano I, Sterpi I, Mazzone A, Delconte C, Pisano F. Test-retestreliability of robotic assessment measures for the evaluation of upper limbrecovery. IEEE Trans Neural Syst Rehabil Eng. 2014;22:1020–9.
23. Scott SH, Dukelow SP. Potential of robots as next-generation technology forclinical assessment of neurological disorders and upper-limb therapy.J Rehabil Res Dev. 2011;48:335–53.
24. Nordin N, Xie SQ, Wünsche B. Assessment of movement quality in robot-assisted upper limb rehabilitation after stroke: a review. J Neuroeng Rehabil.2014;11:137.
25. Frascarelli F, Masia L, Di Rosa G, Cappa P, Petrarca M, Castelli E, et al. Theimpact of robotic rehabilitation in children with acquired or congenitalmovement disorders. Eur J Phys Rehabil Med. 2009;45:135–41.
26. Frascarelli F, Masia L, Di Rosa G, Petrarca M, Cappa P, Castelli E. Robot-mediated and clinical scales evaluation after upper limb botulinum toxintype A injection in children with hemiplegia. J Rehabil Med. 2009;41:988–94.
27. Masia L, Frascarelli F, Morasso P, Di Rosa G, Petrarca M, Castelli E, et al.Reduced short term adaptation to robot generated dynamic environmentin children affected by Cerebral Palsy. J Neuroeng Rehabil. 2011;8:28.

Germanotta et al. Journal of NeuroEngineering and Rehabilitation (2015) 12:41 Page 13 of 13
28. Cappa P, Clerico A, Nov O, Porfiri M. Can force feedback and sciencelearning enhance the effectiveness of neuro-rehabilitation? An experimentalstudy on using a low-cost 3D joystick and a virtual visit to a zoo. PLoS One.2013;8:e83945.
29. Vergaro E, Squeri V, Brichetto G, Casadio M, Morasso P, Solaro C, et al.Adaptive robot training for the treatment of incoordination in MultipleSclerosis. J Neuroeng Rehabil. 2010;7:37.
30. Ramos E, Latash MP, Hurvitz EA, Brown SH. Quantification of upperextremity function using kinematic analysis. Arch Phys Med Rehabil.1997;78:491–6.
31. Bastian AJ, Zackowski KM, Thach WT. Cerebellar ataxia: torque deficiency ortorque mismatch between joints? J Neurophysiol. 2000;83:3019–30.
32. Erasmus LP, Sarno S, Albrecht H, Schwecht M, Pöllmann W, König N.Measurement of ataxic symptoms with a graphic tablet: standard values incontrols and validity in Multiple Sclerosis patients. J Neurosci Methods.2001;108:25–37.
33. Ferrarin M, Gironi M, Mendozzi L, Nemni R, Mazzoleni P, Rabuffetti M.Procedure for the quantitative evaluation of motor disturbances incerebellar ataxic patients. Med Biol Eng Comput. 2005;43:349–56.
34. Menegoni F, Milano E, Trotti C, Galli M, Bigoni M, Baudo S, et al.Quantitative evaluation of functional limitation of upper limb movements insubjects affected by ataxia. Eur J Neurol. 2009;16:232–9.
35. Day BL, Thompson PD, Harding AE, Marsden CD. Influence of vision onupper limb reaching movements in patients with cerebellar ataxia. Brain.1998;121:357–72.
36. Bardorfer A, Munih M, Zupan A, Primozic A. Upper limb motion analysisusing haptic interface. IEE/ASME Trans. 2001;6:253–60.
37. Rohrer B, Fasoli S, Krebs HI, Volpe B, Frontera WR, Stein J, et al.Submovements grow larger, fewer, and more blended during strokerecovery. Mot Control. 2004;8:472–83.
38. Dipietro L, Krebs HI, Fasoli SE, Volpe BT, Hogan N. Submovement changescharacterize generalization of motor recovery after stroke. Cortex.2009;45:318–24.
39. Maurel N, Diop A, Gouelle A, Alberti C, Husson I. Assessment of upper limbfunction in young Friedreich ataxia patients compared to control subjectsusing a new three-dimensional kinematic protocol. Clin Biomech.2013;28:386–94.
40. Lo AC, Guarino P, Krebs HI, Volpe BT, Bever CT, Duncan PW, et al.Multicenter randomized trial of robot-assisted rehabilitation for chronicstroke: methods and entry characteristics for VA ROBOTICS. NeurorehabilNeural Repair. 2009;23:775–83.
41. Pandolfo M. Molecular basis of Friedreich ataxia. Mov Disord. 2001;16:815–21.42. Pacilli A, Germanotta M, Rossi S, Cappa P. Quantification of age-related
differences in reaching and circle-drawing using a robotic rehabilitationdevice. Appl Bionics Biomech. 2014;11:91–104.
43. Dorfberger S, Adi-Japha E, Karni A. Sex differences in motor performanceand motor learning in children and adolescents: an increasing male advantage inmotor learning and consolidation phase gains. Behav Brain Res. 2009;198:165–71.
44. Krebs HI, Hogan N, Aisen ML, Volpe BT. Robot-aided neurorehabilitation.IEEE Trans Rehabil Eng. 1998;6:75–87.
45. Balasubramanian S. A robust and sensitive metric for quantifying movementsmoothness. Biomed Eng IEEE Trans. 2012;59:2126–36.
46. Teulings HL, Contreras-Vidal JL, Stelmach GE, Adler CH. Parkinsonism reducescoordination of fingers, wrist, and arm in fine motor control. Exp Neurol.1997;146:159–70.
47. Friedman J, Finkbeiner M: Temporal dynamics of masked congruencepriming: evidence from reaching trajectories. ASCS09 Proc 9th ConfAustralas Soc Cogn Sci Sydney Macquarie Cent Cogn Sci 2010:98–105.
48. Flash T, Hogan N. The coordination of arm movements: an experimentallyconfirmed mathematical model. J Neurosci. 1985;5:1688–703.
49. Rohrer B, Hogan N. Avoiding spurious submovement decompositions II: ascattershot algorithm. Biol Cybern. 2006;94:409–14.
50. Friedman J, Brown S, Finkbeiner M. Linking cognitive and reaching trajectoriesvia intermittent movement control. J Math Psychol. 2013;57:140–51.
51. Casadio M, Sanguineti V, Morasso P, Solaro C. Abnormal sensorimotorcontrol, but intact force field adaptation, in multiple sclerosis subjects withno clinical disability. Mult Scler. 2008;14:330–42.
52. Corben LA, Georgiou-Karistianis N, Bradshaw JL, Hocking DR, Churchyard AJ,Delatycki MB. The Fitts task reveals impairments in planning and onlinecontrol of movement in Friedreich ataxia: reduced cerebellar-corticoconnectivity? Neuroscience. 2011;192:382–90.
53. Lynch DR, Farmer JM, Rochestie D, Balcer LJ. Contrast letter acuity as ameasure of visual dysfunction in patients with Friedreich ataxia.J neuro-ophthalmology. 2002;22:270–4.
54. Fahey MC, Cremer PD, Aw ST, Millist L, Todd MJ, White OB, et al. Vestibular,saccadic and fixation abnormalities in genetically confirmed Friedreichataxia. Brain. 2008;131(Pt 4):1035–45.
55. Hocking DR, Fielding J, Corben LA, Cremer PD, Millist L, White OB, et al.Ocular motor fixation deficits in Friedreich ataxia. Cerebellum. 2010;9:411–8.
56. Seyer LA, Galetta K, Wilson J, Sakai R, Perlman S, Mathews K, et al. Analysisof the visual system in Friedreich ataxia. J Neurol. 2013;260:2362–9.
57. Nocchi F, Gazzellini S, Grisolia C, Petrarca M, Cannatà V, Cappa P, et al. Brainnetwork involved in visual processing of movement stimuli used in upperlimb robotic training: an fMRI study. J Neuroeng Rehabil. 2012;9:49.
Submit your next manuscript to BioMed Centraland take full advantage of:
• Convenient online submission
• Thorough peer review
• No space constraints or color figure charges
• Immediate publication on acceptance
• Inclusion in PubMed, CAS, Scopus and Google Scholar
• Research which is freely available for redistribution
Submit your manuscript at www.biomedcentral.com/submit