robotics and i
TRANSCRIPT

Robotics and IIntelligent, intuitive, innovative: how new tech-nologies are becoming part of our everyday lives.
Artificial intelligence
Man and machine in new harmony? A debate.
Young mavericks ...
... are shaping the future. Fresh ideas for the world of tomorrow.
Snapshot 4.0
Taking stock with a co-initiator of Industrie 4.0

2 | the o.i.
CONTENTSIt’s time to get mobile | 4Mobility is transforming production.
Young mavericks are shaping the future | 8Fresh ideas for the world of tomorrow
You can’t buy innovation | 12Everyone is talking about the start-up mecca Silicon Valley. Can’t Germany keep up?
Electromobility in pole position | 15Why the drive unit of the future is challenging suppliers.
Collaboration in the ecosystem | 16The hidden opportunities behind the unwieldy term
Snapshot 4.0 | 18Taking stock with a co-initiator of Industrie 4.0
More than industry and production | 20Fascinating technologies also outside the factory halls
A cobot for me | 22Robot assistants are finding their way into everyday life.
From apprentice to journeyman | 28What robots can learn from smartphones.
Artificial intelligence | 30Man and machine in new harmony? A debate.
The ring after the click | 34Without automation, on-line shopping will soon be at its limit.
Reality plus | 36Why virtual reality is more than a trend for technology freaks.
28
12
4
22
30
36

3
KUKA has evolved, transformed and rede-fined itself. From a former robot and system builder to an automation specialist. From a process expert to a driving force behind Industrie 4.0. From a globally active company to a global enterprise. From 7,000 employees to 14,000 KUKAns worldwide.
KUKA is a company that draws on its 120-year history, tradition and experience, yet with a visionary look towards the future. A company that never shies away from adapt-ing to changing times, indeed even shapes them.
Change has always been afoot at varying paces, but never at the current speed. IT inte-gration is catapulting our company into a torrent of innovation, which is also carrying oth-ers along. Artificial intelligence gives rise to new possibilities in this context. The effects of these developments are multi-faceted, interpreted in various ways and vehemently debated.
We frequently participate in these discussions, taking on an explaining role. Our goal? To dismantle preconceptions and reservations in order to boost innovation – to the benefit of people. We are convinced of that.
“The o.i.” is a new magazine that not only expresses our way of thinking and our stance, but one that will also take our readers beyond the boundaries of the company. These devel-opments are far too important for us to interpret by ourselves.
In this new journal, we aim to unveil the changing environment in which we operate, while including outside opinions and discussions. But first and foremost, we offer insights into a world which, once entered, is as fascinating as the technologies that we are occupied with.
We take our readers on a journey into the world of automation and digitization, with the robot as one of the most fascinating elements. It is gradually migrating from the industrial environment to our everyday lives and assisting us progressively. In this issue, we want to take a look at our digital future together with you.
We hope you enjoy reading it.
Sincerely,
EDITORIAL
Dear Readers,

4 | the o.i.
One room and endless possibilities for man and machine – thanks to mobile robotics

5
IT’S TIME TO GET MOBILE
Predefined paths and inflexible processes: in the factories of the future, those days will be long gone. Mobile units are moving into production halls. After all, a production system can only respond quickly to changes if it is flexible. And this is exactly what it comes down to. We never lose sight of our goal to enable extremely versatile production on an industrial scale with the aid of mobility. Because, at the end of the day, customers are looking for individuality.
WWant your favorite granola without raisins? That has been possible for a long time. Want to wait while your shoes are made for you right before your eyes just the way you want them? It won’t be long before that’s pos-sible. What about a green car with sports seats, red stitching, patterned interior trim and an electric motor? The demand for cus-tomized products is even having an impact on large production lines in the automotive industry. “If I needed to adapt a car produc-tion line to accommodate a new model right now, it would take weeks. Mobility and mod-ular production make it possible to recon-figure things in a matter of minutes,” says the German computer and robotics scientist Prof. Dr. Wolfram Burgard.
The so-called matrix body shop concept of KUKA is one example of this. A production hall featuring the matrix concept is char-acterized by individual robotic cells. They are interlinked using freely programmable
logistics for the components to be manu-factured. Each cell can be freely configured. Automotive components are transported to and fro between the cells on unmanned carriers known as Automated Guided Vehi-cles (AGVs) in order to undergo machining. A clear distinction is made between trans-port and manufacturing tasks. This paves the way for shorter product cycles and diversi-fied product portfolios. “If I decide to incor-porate mobility into my production hall, I will need far less space, I will cut costs and, above all else, I will be far more flexible,” says Bur-gard, summarizing the benefits of mobility. The scientist heads up the research group for Autonomous Intelligent Systems at the Albert-Ludwig University in Freiburg, Ger-many.
These developments require a radical new way of thinking. If you enter “quick and flex-ible” on a search engine, you may well find this autocompleted to “quick response and

6 | the o.i.
flexible manufacturing”. It is clear that “quick and flexible” are key attributes of tomorrow’s production systems. The issues that have been on people’s minds for years are now tak-ing shape in the workshop. In its article on intelligent factories, the German government regards it as decisive for success that it is no more costly to make an individual product, for example a personalized red case contain-ing a USB stick, than the same piece time and again by way of serial production. “The costs caused by all aspects of the process must be kept as low as possible. The competitive pres-sure is enormous. You need effective solu-tions in order to keep pace. Ultimately, you want the flexibility of manual production and the effectiveness of robot-based production. Imagine a situation in which two compo-nents are screwed together while they are being transported from one work station to the next. That saves a huge amount of time. And you need mobility to achieve it,” says Burgard, explaining the correlations.
Mobile robot systems that do not simply transport workpieces but also process them, while allowing direct collaboration with humans at the same time, will therefore be an integral part of the versatile, flexible fac-tory of the future. Mobile units will equip robots with other tools in passing, quickly enabling them to carry out new tasks or pro-cess other workpieces.
One of the industries that will benefit most from mobility is the logistics sector. “Mobility is one of the determinant factors for success in this industry. Quite simply because prod-ucts constantly have to be fetched from racks throughout these huge halls and brought to packing stations.” Mobility expert Dominik Jäkle from the Switzerland-based automation company Swisslog says: “We can achieve a great deal in logistics using mobile solutions. Equipment that is permanently anchored to the floor of production shops will become a thing of the past. On the contrary, we need elements that can be set up quickly and
easily and also moved to another part of the production process from one day to the next. Add to that the fact that manufactur-ing sequences can be expanded effortlessly in this manner, and entire systems can be relocated much more efficiently.”
One thing is certain: a conveyor that is anchored to the floor operates extremely reliably and is highly productive. However, it is also extremely inflexible. Such equipment will nevertheless not disappear from indus-trial halls entirely. At the same time, mobile platforms will find their way into production processes so as to meet the needs of each individual customer in a quick and flexible manner.
Swisslog logistics expert Dominik Jäkle on mobile solutions in logistics
Equipment that is perma-nently anchored to the shop floor will progres-sively disappear from production operations.
Mobile, autonomous units will be more and more common in
production halls.

7
First and foremost, mobility means flexibility in my opin-ion. Assembly line production can still be found in many modern-day factories. However, this type of production always means that the process is tied to a fixed line. Changing the sequence on a flexible basis is not possi-ble. For this reason, conveyors will be replaced by mobile platforms to an ever increasing extent.
I actually see mobility as the icing on the cake. Imple-menting Industrie 4.0 in a mobile environment is a huge challenge because the planning, particularly with regard to infrastructure, needs to be very well thought out in advance due to the absence of the predetermined path and the comparatively simple installation of the assem-bly line. On the other hand, Industrie 4.0, with its track-ing facilities, data evaluation and real-time analyses, brings greater added value in terms of predictive main-tenance and the optimization of process workflows. Mobility makes it possible to lower unit costs. A modu-lar production system provides the scope to leave out or add in certain machining steps, in line with the current requirements. Costly conversions are no longer necessary and the timing of process sequences can be optimized. Mobility is quite simply indispensable in cases where the component to be processed is extremely large, for exam-ple the fuselage of an aircraft. Because the fuselage can-not easily be moved from A to B, the robot comes to the fuselage. In such cases, mobile platforms are the be-all and end-all. A conveyor or a linear axis is too inflexible, impedes the production process and is therefore utterly unsuitable.
Yes, in my opinion they go hand in hand. The product diversity that comes as a result of customization gives rise to a complex production environment. There are two ways to manufacture products efficiently in a setting like this: either the product is placed on a mobile platform and is transported to those stations where work steps need to be performed, or a robot is installed on a mobile platform which moves it to the product or component.
Christoph Bick Head of R & D Mobile Robotics Operations at KUKA
What does mobility mean to you?
Do we need mobil-ity in order to implement Indus-trie 4.0? What role will mobility play in tomorrow’s produc-tion systems?
Mobility and new business models: is there a link between these two concepts?
QUESTIONS TO

8 | the o.i.
YOUNG MAVERICKS ARE SHAPING THE FUTURE
Robots for peopleFor Dr. Martin Riedel the future begins with a pen and a sheet of paper. Whenever the inventor from KUKA Corporate Research comes across an everyday problem, creative ideas flash through his mind, begging to be written down right away. Riedel has already filed patent applications for more than 50 inventions on KUKA’s behalf over the last 5 years and was recently honored with the Midea Technology Star Award, the sixth scien-tific accolade in recognition of his work. The kinematics engineer reveals, “I have been fas-cinated by motion technology for as long as I can think.” He is convinced that humans and robots belong together. “The exciting thing is that we are often faced with entirely new challenges which we cannot address by sim-ply improving existing solutions but rather have to develop totally new approaches,” says Riedel. From the first sketch to the functional model, Riedel and his team realize their pro-jects “with their own hands”, as the team leader explains. Robots are not intended to replace any jobs, quite the contrary: their purpose is to serve human workers, assist-ing them wherever strenuous, monotonous or dangerous tasks have to be carried out. “We are improving the ergonomics and effi-ciency of logistics processes in supermar-kets, for example, by using robots to help the employees fill the shelves with goods quickly and without straining their joints,” he reports. The medical environment is another area where robots can aid humans, for instance robotic assistance platforms that
help elderly people to move about, thereby enhancing their independence in old age. Riedel and his team are also examining the question of how to design a robot system for more effective tumor treatment by radiation therapy while reducing the discomfort for the patient at the same time. If people are to interact with robots without ever having had anything to do with them before, an entirely new and intelligent interaction concept will be required, in which “robots are no longer operated but simply used,” according to the inventor – so that robots can soon belong to people’s everyday lives as a matter of course.
Dr. Martin Riedel, team leader at KUKA Corporate Research

9
YOUNG MAVERICKS ARE SHAPING THE FUTURE They are young, innovative and full of ideas for the future. How will
we live, work and move about? What will our cities look like and how can we stay healthy? Bright minds from all over Germany give their views on what society could look like in the future.
Dr. Insa Thiele-Eich, climatologist
Climatologist reaches for the starsTraveling to the stars and back. Dr. Insa Thiele-Eich aims to be the first woman to do so. It could all start in 2020. That is when the winner of the competition “Die Astro-nautin” (female astronaut) might be the first woman in Germany to travel to the Interna-tional Space Station (ISS). As a climatologist, she is particularly looking forward to survey-ing our fragile planet from space. “I think the view of our planet and above all the relatively thin atmosphere from the space station is something special, leaving you with a strong
desire to protect the planet.” The desire for space travel is virtually innate to Thiele-Eich: her father Gerhard Thiele was also an astro-naut. At the Russian military airbase Star City, Thiele-Eich has already completed her first parabolic flight and is currently undergo-ing tailored training with technical and scien-tific exercises. Part of the mission is to collect data regarding the impact of weightlessness on the female body and regarding psycholog-ical and social resilience. One thing is impor-tant to her: “One of my major objectives is to show that a lot has to change until we can forego the extra effort it takes to inspire girls and young women to work in technical fields. Ideally, society should simply be able to iden-tify and promote the preferences and abilities of each and every child.”

10 | the o.i.
Social business in textilesSina Trinkwalder embodies a new type of entrepreneur: in Germany’s first textile social enterprise, she employs people who are gen-erally overlooked on the job market – and she is still profitable while doing so. As a result, she has been awarded the Order of Merit of the Federal Republic of Germany, among other recognitions. 140 seamstresses work at Manomama in Augsburg, producing cut-ting-edge fashion. Her company Bridgebag produces backpacks for the homeless that are so fashionable that they sell well even with normal customers. She is convinced, “Being socially responsible and having a prof-itable business are not mutually exclusive. Sina Trinkwalder, founder of
Manomama
The economy is a part of society and we have to recognize that again. And the gains in terms of the humanistic aspects are price-less.” With regard to marketing, Trinkwalder uses a mix of e-commerce, traditional direct selling and stationary (brick-and-mortar) retail. She firmly believes, “It is a fallacy to think that brick-and-mortar retailers have succumbed to e-commerce and the Inter-net.” New concepts, courage and the will to network these two areas synergistically are needed. Trinkwalder’s credo is, “The future belongs to entrepreneurs who act instinc-tively and with courage.”
Technical healthcare assistantsMultifunctional robots autonomously moving patients from their rooms to the operating room, where they then act as assistants, is still pie in the sky – but Dr. Anja Werling and her colleagues at KUKA’s Medical Robotics R&D department are working hard on intel-ligent assistants for doctors, nursing staff, patients and the elderly. Since her studies, the computer scientist has been fascinated by the opportunities offered by the digital world and how this has become part of our everyday lives. “Especially in healthcare, IT can play a role in helping people – and maybe even make the world a little better.” For exam-ple through robotic assistance, as provided by the KUKA LBR Med lightweight robot: “Our LBR Med is becoming increasingly intelligent and already supports surgeons and neurolo-gists in their work.” At the moment, the LBR is learning how to cut bones cleanly under the guidance of a surgeon, so that artificial knees, for example, can be joined even more precisely to the patient. “Robots do not get tired, their hands never tremble, and they work with greater precision than humans, which makes them perfect assistants for sur-geons,” says Werling, who obtained a doctor-ate at the Karlsruhe Institute of Technology and attended the renowned Harvard Medical School as a visiting scientist. Neurosurgeons
can also rely on the LBR in the future when it comes to puncturing certain areas of the patient with ultra-fine needles. And that’s not all. KUKA robots already help to posi-tion patients precisely during radiotherapy or to guide the beam source around the per-son at the ideal angle – if the patient moves, the robot senses the change with millimeter accuracy and readjusts its position accord-ingly. “The focus in the future will certainly be on intelligent and highly versatile robots. One day they will be a matter of course in facil-itating everyday medical and nursing activi-ties,” Werling predicts.
Dr. Anja Werling, Medical Robotics Research & Devel-opment department at KUKA

11
In sync with the pulse of time thanks to artificial intelligence
Andreas Reinisch literally has his ear on the pulse of time. The co-founder of CSD Labs from Graz carries out research in the field of auscultation, the process of listening to body sounds with a stethoscope. With his eMurmur project he is breaking ground in the field of medicine for the future. “The software platform eMurmur ID is intended to introduce the current progress made in machine learning and artificial intelligence to the healthcare sector in order to provide patients with optimal medical care – doctors and algorithms working hand in hand,” is how Reinisch describes the project. The aus-cultation software that he and his colleagues have developed can hear heart murmurs even
in babies with such precision that it can accu-rately predict possible heart defects – much more precisely than would be possible with the human ear. The heart sounds are sent from an electronic stethoscope to a smart-phone or tablet and analyzed by software. The doctor or a nurse receive a reliable diag-nosis. “eMurmur not only assists doctors, but it also offers new opportunities for learning and teaching auscultation,” says Reinisch.
Andreas Reinisch, co-founder of CSD Labs
The future of traffic“The future will be here much quicker than we think,” says Steffen Braun, research engi-neer at the Fraunhofer Institute for Industrial Engineering (IAO) in Stuttgart. He is certain, his children will no longer have to get a driv-er’s license, as they will be traveling through
the cities in autonomous vehicles. Within the next ten years, robocabs might already be operating in cities. These are autonomous taxis that can be hailed to drive people from A to B. Braun is a co-initiator of the Morgen-stadt Initiative, a research network dedi-cated to the city of the future. Cities could look entirely different if road traffic no longer took up five to ten percent of the overall sur-face area, as it does today. “Robocabs do not need parking space, as they are always on the move,” says Braun. Digitization is the driv-ing factor behind the breakneck speed of progress to which city planners can merely react. Braun and his colleagues want to change that. “This is about much more than just traffic,” says Braun. Energy, construction, water, logistics – all areas are subject to this rapid change. Even the media will change, he believes. Because once we no longer have to sit behind the wheel ourselves, we will have much more time to read or watch videos.
Diplom-Ingenieur Steffen Braun, research engineer at the Fraunhofer Institute

12 | the o.i.
“ You can’t buy innovation”
“Valley of the future”, home of the “gifted, innovators and prophets” or “hot-
house of innovation”. These characteri-zations of Silicon Valley certainly do not
lack superlatives. But for good reason, because Silicon Valley on the US West
Coast is considered the global mecca of the tech scene. Technology giants stand
for American dominance in terms of start-ups and IT companies.
BBut what about Germany? Has Germany missed the boat internationally in terms of start-ups and high-tech? Kon-rad Peters, founder and CEO of Actiworks Application Solutions GmbH, feels this is not the case: “In Germany, people underestimate the significance of how ‘Made in Germany’ is valued abroad, whether it be cars or an Indus-trie 4.0 application.” Peters should know: the company he founded in 2011 while he was still a student is now an international player.
Actiworks Application Solutions develops apps that help companies track and optimize their processes from any-where in the world. The company also deals with cloud solutions and is thus right at home in the world of Indus-trie 4.0. At the age of 30, Peters is one of those young entrepreneurs that one would expect to find in Silicon Valley rather than Germany.
So all is fine then? Not quite. “Digitization is not waiting for Germany,” Bitkom pres-ident Achim Berg warns. According to a study by the IT association, 60 percent of sur-
veyed companies consider themselves latecomers with regard to IT. In 2016, only 20 percent of those compa-nies invested in new digital business models. In terms of using state-of-the-art technology, German companies are only in twelfth place according to a current study by the World Economic Forum.
Digitization is not waiting for
Germany

13
are funded only to be sold for gain later on. We are cre-ating sustainable value here.”
Of particular advantage are the well-educated employ-ees. It is quite common for future colleagues to start at Vincent Systems GmbH as student trainees, write their thesis there and then start their professional lives. “We invest heavily in selecting and training our employees. They are our capital if we aim to remain technologically competitive. You can’t buy innovation, after all – it is pro-duced by highly qualified colleagues.”
David Rhotert, founder and CEO of the crowd-investing platform Companisto, strikes a similar tone. “It’s a strug-gle here in terms of venture capital. But compared to the US, less money is being wasted in Germany. We optimize.” And this is exactly where Rhotert and his team come in with a view to promoting start-ups. “At Companisto, we focus on the seed to early stages, concentrating on tech-nology. One of the main conditions we have for start-ups is that they are trailblazers in their field, and they must win us over with real innovations.”
One such example is myEnso, the online supermarket. The e-commerce start-up from Bremen radically puts the consumer at the center of its platform and aspires to reinvent retailing. “The fact that people in Germany have a critical disposition and offer a certain resistance can be a source of innovation given the right perspec-tive. I think there are also a lot of cultural changes under-way in Germany at the moment. If this is accompanied by courage to think outside the box and it is systemat-ically implemented, then I look forward to the next big developments,” says founder and CEO Norbert Hegmann,
Dr. Eric Maiser, Head of the Future Business Competence Center at the German Engineering Association (VDMA), also takes a critical view of the reluctant approach to dig-itization. “Our industry needs to be proactive and flexible in order to develop some resilience to disruptive change. It is thus imperative to be open to new ideas. In Silicon Valley, disruption is viewed as an opportunity rather than a threat. We should learn to think like this.”
The lack of capital is another problem that affects entre-preneurs and start-ups in particular. While around 69 bil-lion dollars in venture capital was invested in start-ups in the US in 2016 according to a study by KPMG, in Germany that figure was a mere 1.9 billion. “Funding of start-up companies is inadequate in Germany, and it is also based on the principle of indiscriminate all-round distribution. This creates the wrong incentives, which especially hurts small businesses,” says Dr. Stefan Schulz, CEO of Vincent Systems GmbH.
Founded in 2009, the company develops and produces innovative high-tech prostheses that are in great global demand. In 2017, Schulz and his colleagues were nom-inated for the German Future Award, the Federal Presi-dent’s award for technology and innovation. It was not an easy feat to excel to that point. “The workload and the lack of financial security are brutal. Not many companies are cut out for this,” says Schulz.
The lack of capital can, however, also have a positive effect: “Silicon Valley is flooded with capital. This makes companies lazy. In addition to that, German start-ups are not
viewed as speculative investment opportunities which
Highly qualified employees are
crucial

14 | the o.i.
thus flipping the preconception that Germany is afraid of anything new into an advantage. “Our company wouldn’t stand a chance in Silicon Valley. But in Germany, we can develop new business forms. Germany is the perfect seed-ing ground for that.”
Compared to the big guys in the industry, myEnso is still small. As a matter of fact, the digital giants seem to have an unassaila-ble lead. Politicians in Europe and Germany
have recognized the challenges and are beginning to take countermeasures. For example, a regulatory framework is currently being developed to facilitate fair competition and to make it easier for smaller companies to enter the pan-European market.
Hidden champion even in the age of
digitization
Robot Valley in SwabiaIn the summer of 2017, KUKA announced extensive investments in its Augsburg headquarters. Around 100 million euro will be spent on expanding and modernizing the traditional location over the coming years. By 2025, a KUKA Campus is to be built step by step, an open and modern environment that promotes innovative ideas and pro-vides a start-up atmosphere. “Innovation has made regions like Cal-ifornia’s Silicon Valley world-famous. I think we can do the same,” says KUKA CEO Till Reuter. “Our vision is to create a “Robot Valley” or an “Automation Valley” here, because I think the economic region of Bavaria has what it takes.” The KUKA Campus combines production, research & development, training and innovation at a single location. The idea is to entice young entrepreneurs to the campus and to foster the start-up spirit in the region.
According to Ilse Aigner, Bavaria’s Minister of Econom-ics and Technology: “Bavaria is at the forefront in terms of Industrie 4.0. The mix of large corporations, a vibrant SME sector and the dynamic start-up scene provides the groundwork. But I do think that small and medium-sized companies need to catch up in terms of digitization.” Bavaria has adopted the “Bayern Digital” master plan and launched the “Zentrum Digitalisierung Bayern” (Bavarian Digitization Center).
The digitization potential of collaboration between agile start-ups and medium-sized enterprises is also pointed out by Dr. Maiser from the VDMA: “Nowhere else in the world will you find so many hidden champions that turn product ideas into tangible, affordable products. This is particularly the case for production engineering. At the same time, start-ups are very important: not only for new technologies, such as machine learning or artificial intel-ligence, but also for new ways of working and the joy of experimenting.”
Entrepreneur Konrad Peters explains what this may look like in practice: “We cannot keep up with the financial strength of Silicon Valley. And that is why, just like tra-ditional industrial companies, start-ups look for niches where they can fully exploit their technological expertise.” Hidden Champions 2.0, so to speak.

15
EElectromobility is on the threshold to the mass market. In Germany, sales of electric vehicles doubled last year, according to the industry association VDA. There are two main reasons for the development of alternative drive units: in the coming decades, the energy requirements of industrialized and emerging countries will continue to rise, while resources such as oil are becoming increas-ingly scarce. On top of that, automakers have been set climate policy targets to reduce CO2 emissions.
“In light of these targets, it is paramount for the automo-tive industry to find suitable mass-market alternatives,” says Michael Kluger, Head of the Forum Electromobil-ity e. V. “Electromobility is not a self-contained system. It must be viewed holistically together with issues such as power generation, infrastructure and automation.”
There are various alternative technologies to conventional combustion engines: hybrid vehicles that supplement the engine with an electric power unit, alternative fuels such as ethanol or hydrogen-powered fuel cell electric vehi-cles. The best-known technology, however, is battery-pow-ered electric drive, which draws the required energy from energy storage devices such as lithium-ion batteries.
The advantage of battery electric cars is their efficiency, say their proponents. The batteries are getting cheaper, and the range of the vehicles is increasing at the same time. This has also been confirmed in a study by the con-sultancy firm McKinsey. It is an important factor because
the fear of being stranded with an empty battery is stunt-ing electric vehicle sales. Furthermore, an increase in electromobility also entails a significant increase in elec-tricity consumption.
But despite all the challenges, experts believe electromo-bility will be in pole position in the contest between the various technologies. It has the potential of becoming the new megatrend in the car sector and a key component of a smart urban lifestyle. Manufacturers have announced a wave of new electric cars for the coming years.
This also poses new challenges to suppliers. Because manufacturing battery cells and modules is very complex, and the technical processes are highly sophisticated. In order to produce batteries for electric cars economically, it takes automated, intelligent systems and experienced suppliers.
“To satisfy the increasing demand for electromobility, automakers are calling for quality and automated solu-tions in the production of battery modules,” says Dr. Joa-chim Döhner, expert for battery production at KUKA. “This makes close cooperation between engineering companies and the automotive industry absolutely imperative.” Auto-mation and experienced suppliers can thus contribute to mastering the biggest transformation in the history of the automotive industry and bringing mobility into the future.
Potential to become a new megatrend:
electromobility
Electromobility in pole position
The automotive industry is undergoing the biggest transformation in its history. Megatrends such as digitization, autonomous driving and electromobility are determining developments – not only for manufac-turers but also for suppliers.

16 | the o.i.
LOGISTICSRESEARCH
CONSULTING
MACHINE BUILDING
HARDWARESOFTWARE
SYSTEMINTEGRATION
CBe it self-designed sneakers, personalized children’s books or one-of-a-kind vehicle equipment: customers want indi-viduality. Very often they no longer wish to just consume, but rather to be involved in the creative process of devel-oping the product they want. They are not prepared to accept higher costs, however: a custom-made product has to be manufactured at the price of a mass-produced item. This is quite a challenge for manufacturers – and for current business models.
COLLABORATION IN THE ECOSYSTEM
Competition in the global market brings about increas-ingly high demands on quality, flexibility and personaliza-tion. Production has to be fast, flexible and adaptable, yet highly efficient. With a batch size of one, the traditional and proven value chain is pushed to the limit. “Business processes must be re-invented and re-designed. Network-ing is key for future business models,” says Dr. Christian Schlögel, Chief Digital Officer at KUKA. What is needed are flexible, networked and intelligent factories rather than rigid, linear production chains.
“Meeting these higher demands is only possible through increased cooperation among the participants, pursu-ant to the motto: think in terms of business models, act cooperatively,” Prof. Dr.-Ing. Thomas Bauernhansl, Head of the Fraunhofer Institute for Production Engineering and Automation IPA, explains. For successful solutions, it is important to merge the right set of competencies, open up boundaries between companies, and collabo-rate as partners within an ecosystem. “Machine builders who have been perfecting their mechanical or mecha-tronic products for decades have to work together with research and consulting partners in order to develop new digital services and business models, and to offer these through partnerships,” the director of the research insti-tute adds. IT companies and start-ups are enriching the network with IoT skills.
Cooperating instead of competingThe open system has the advantage that individual part-ners can enlarge the solution database of the overall sys-tem with their unique know-how. Each company in the group contributes its own core competencies and inte-grates important partners, who add even more expertise to the network. Instead of engaging in competition, the participating companies benefit from the shared use of resources and competencies (cooperation). It’s a win-win situation for all parties. This creates a value-creation net-work of hardware and software manufacturers, system integrators, research institutes and consultants, which can offer customers a wide range of production and logis-tics processes as well as optimization services.
For a manufacturer, data are the key to a system that can be controlled and analyzed at any time: products commu-nicate what they are supposed to look like and where they are currently located, production machines communicate their processing status via data streams and request material or maintenance. These data volumes must be managed, read and analyzed. But that is easier said than done: a single production operation can entail numer-ous different machines, such as robots, welding guns, machine tools and conveyors. And these individual ele-ments have many different standards for communication

17
LOGISTICSRESEARCH
CONSULTING
MACHINE BUILDING
HARDWARESOFTWARE
SYSTEMINTEGRATION
protocols and interfaces. This is why a basis is needed on which the various data are collected – a platform.
For Daniel Reinhardt, Senior IoT Product Manager at conn-yun GmbH, this is the cornerstone of the ecosystem: “The ecosystem in itself is a complex construct that cannot be viewed purely from a technological perspective. The plat-form provides the technical framework for the different partners to collaborate in an organized manner.” Accord-ing to Schlögel, the ecosystem lays the groundwork for learning together. “This allows us to bring innovations to market quicker and more broadly in a joint effort, mak-ing the platform more seminal through previously devel-oped solutions.”
Success through trust and opennessIn addition to the technical prerequisites, such an eco-system places new soft requirements on the parties involved: the rules that apply to established business models must be extensively expanded, and the partners need to change their way of thinking. Openness, willing-ness to change and the ability to work together are crit-ical for success. The big challenge for machine builders is to gain an understanding of value chains across com-pany boundaries, and to open themselves to third par-ties, according to Bauernhansl. “Furthermore, legal and
technical framework conditions must be established that enable the members of ecosystems to pool their compe-tencies and use them collaboratively in a way that the added value is more than just the sum of their individ-ual contributions. This requires trust in their community and their partners.”
A value chain optimized in this manner saves resources and energy, while also potentially reducing goods flows and excess material. According to a study by Fraunhofer IPA, innovation and growth stemming from the devel-opment of Internet-capable products and corresponding business models will unlock an economic potential of 99.8 billion euro by 2025, an increase of 2.2 percent per year. Safety stocks along supply chains can be reduced by 30 to 40 percent, and the costs of complexity can even be reduced by as much as 60 to 70 percent due to increased transparency and reduced waste. Networked systems based on a business ecosystem make it possible to deliver the best product to the end customer: produc-tion can be flexibly converted and re-equipped to meet the requirements. So even a batch size of one can be eco-nomical – and value creation truly sustainable.

18 | the o.i.
AAccording to the Industrie 4.0 Platform, about 15 million jobs depend directly or indirectly on the manufacturing industry; it is Germany’s main job engine. But the requirements in production are changing. Versatile factories, intelligent robots and networked machinery are helping to meet this challenge. “In Industrie 4.0, production dovetails with state-of-the-art information and communication technology. The driving force behind this development is the rapid pace of digitization in business and society. It is transforming the methods of produc-ing and working in Germany. After mecha-nization, electrification and automation, the second wave of digitization is now heralding the fourth industrial revolution,” says Hen-ning Kagermann.
Industrie 4.0 represents individualization and autonomy instead of standardization and automation.
But readying industry and production for the future is also a monumental social and soci-etal task. Digitization is penetrating all areas of life and changing the way we learn and work. Many people are concerned that their jobs will be lost, or they have general trepi-dations about new technologies.
Acceptance is the key“New technologies become accepted when individuals benefit from technology while being able to remain independent in inter-action with it,” says Kagermann. “The same is true for the digitization process.” An exam-ple of this is e-government, where citizens benefit from online services and digital mail being offered by public authorities, replacing paperwork and long waiting times. E-govern-ment and the resulting personal gains can contribute to breaking down people’s reser-vations about the digital world. Acceptance is the key to success for quick implementation of Industrie 4.0. And speed is more important than ever in the competitive global market, because this German initiative is attracting a lot of attention abroad.
The competition never rests“We have a diverse economy in Germany, with strengths in many segments of industry and a reputation of excelling in building and mastering complex systems. Of course, we cannot afford to relax. There are many coun-tries with visions and goals similar to ours,” Kagermann explains. “Large-scale initiatives are evident throughout Asia, in particular. China, for example, has introduced its ‘China 2025’ program, modeled after Industrie 4.0.
The Japanese government has launched its ‘Society 5.0’ initiative and an ‘Industrial Value Chain Initiative’ with a focus on robot-ics. And in South Korea there is the ‘Smart Factory Initiative’ along with the more exten-sive ‘Fourth Industrial Revolution’ program: a combination of Industrie 4.0 and Smart Ser-vice World.” An important factor for the suc-cess of future-oriented initiatives is a strong, homogeneous market, such as in China or the US. “If you have a homogeneous domestic market where you can become established, it’s much easier to scale up further growth and set standards. Europe therefore needs a digital European single market in order to play a stronger role in the competitive global environment.”
Germany still has a slight edge. Since 2011, a great deal has happened to spur innovation. This includes technology programs, model factories and initiatives such as the Indus-trie 4.0 Platform, which brings together poli-tics, business and science. But other countries might soon surpass Germany, because we are lagging in two particular areas.
Digital infrastructure and digital education“The expansion of broadband infrastructure is an area in which Germany has to catch up,” criticizes Kagermann. According to the German Federal Agency for Civic Education, 38 percent of all companies in Germany with ten or more employees had an Internet con-nection with a data transfer rate of at least 30 Mbit/s in mid-2016. This puts Germany in the middle of the pack in Europe. Denmark is the frontrunner with 65 percent. If the digi-tal infrastructure is not soon adapted to the requirements, Germany may miss the boat.
The term Industrie 4.0 was first publicly mentioned in 2011, and it has shaped discussions about modern production around the world ever since. Seven years on, we take stock of the achievements and challenges of the fourth industrial revolution together with one of the initiators of Industrie 4.0, Prof. Henning Kagermann.
Snapshot 4.0

19
The success of Industrie 4.0 will also be decided in the field of education. “We have to prepare young people for a working world that is different from the environment we know today,” says Kagermann. “According to a survey of the popularity of STEM subjects among young people, conducted by acatech in 2017 (MINT Nachwuchsbarometer), a lack of state-of-the-art IT equipment in schools and insufficient training and professional development opportunities for teachers con-tribute to the fact that the development of education is lagging behind.”
Experts call for students to learn on a more individual basis with multimedia mate-rial. Online feedback can make it easier to update teaching aids quickly. This would allow students to work with multimedia material instead of decades-old books, and the imparted material could be tailored to each individual.
Lifelong learning – and a personal formula for successA broad education over the course of their entire professional life allows employees to keep pace with technological developments and to find their place in tomorrow’s economy.
The jobs of the future will touch on many dif-ferent facets, and interdisciplinary work will become increasingly important. What will
A professor of physics and former CEO of SAP AG, Henning Kagermann has been President of acatech (National Academy of Science and Engineer-ing) since 2009. He is one of the most influential architects of Industrie 4.0 and was instrumental in coining the term. Henning Kagermann is a mem-ber of several committees and initia-tives. He has been on the Supervisory Board of KUKA AG since 2017.
Henning Kagermann, President of acatech
We have to prepare young people for a working world that is different from the environment we know today.
be the key competencies of Jobs 4.0? “Self- management, a good portion of flexibility and the ability to work in heterogeneous teams,” Henning Kagermann states confidently.
Critics say that industrial revolutions have been identified as such only in hindsight. But Industrie 4.0 is still in its infancy, and the course still has to be set in many respects. For this reason, some prefer the term ‘evo-lution’ over ‘revolution’. One thing is for sure: a gargantuan change is underway, and we have an opportunity to play an active role in shaping it.

20 | the o.i.
More than just industry and production
Robots and future technologies arouse amazement even outside factories. We have collected a few highlights.
Sense and sensitivity: handling fragile wheat beer glasses is no problem for the sensitive LBR iiwa lightweight robot (here with a Schunk gripper).
Precision landing during the “Bottle Flip Challenge” in Texas: machine
learning allows bottles to be thrown with pinpoint accuracy.
3D printing has the potential to revolu-
tionize architecture. A robot provides support at this art installation
in Nashville.
High speed with an electric drive: KUKA is a partner of the ABT Schaeffler
Audi Sport Formula E racing team.

21
World premiere of the Audi A8 in Barcelona – with a robot impres-
sively setting the stage
Custom-made product from the smart factory: German Chancellor Angela Merkel examines her individual puzzle at Hannover Messe.
Representatives from the world of politics, business and trade unions in a good mood – and with good reason: KUKA is investing 100 million euro in the Augsburg headquarters over the coming years.

22 | the o.i.

23
A COBOT FOR ME
Robotics for people
Until now, robots have been primarily used as heavy-duty indus-trial machines performing monotonous tasks behind factory fences. But the future belongs to a more flexible and intelligent generation: the sensitive robot assistant that offers support in everyday life. And we do badly need support in some areas.
D“Do you have a cellphone yet?” Only 15 years ago this question was generally answered with head shaking. Too expensive, too cumbersome, too few functions. As strange as this reaction may seem today, it is likely that one day we will look back in a similar fashion on the question: “Do you have a cobot yet?” At least that’s what Dr. Albrecht Hoene, R&D Director for Human-Robot Col-laboration at KUKA, has in mind: “Sensitive robots that can directly interact with humans will play an important role. They will assist us in addressing the challenges of the future.”
The population of industrial nations such as Germany is becoming increasingly older. In Japan, Italy and Germany, for example, the percentage of people over the age of 65 is higher than 20 percent. And the forecasts predict a progressively aging population: while the world’s median age was 29.6 in 2015, the prediction for 2100 is already 49.2 years. What are the consequences of the life expec-tancy of newborns nearly doubling in the last hundred years while birth rates are going down at the same time?
The robot for humansThe demographic change is evident in the working world: the number of older people is rising and the number of young skilled workers is declining. Human-robot collab-oration (HRC) is the key to coping with day-to-day work in the future. The idea is to merge the strengths of robots with the abilities of humans. “HRC makes it possible to

24 | the o.i.
Exact positioning of patients thanks to robotic assis-tance
they are no longer in good physical shape. “Allowing peo-ple to stay in a familiar environment for longer, so-called home assisted living, will be an important issue in the future,” says Michael Otto, Vice President of Health-care & Advanced Robotics at KUKA. Assistance systems can make it possible. They support care personnel and doctors, but also patients in their very own homes. For example, an intelligent mobile walker could help to pre-vent falls and assist people to get up and sit down. An additional navigation feature could also help people with dementia to live independently for longer.
But how high is the acceptance of robots? Unlike some industrial nations like Japan, where care robots are already lifting patients from their beds or where animal robots with furry covers cuddle with the residents, care robotics in Germany is still in its infancy. Michael Otto is optimistic: “The acceptance of assistance systems is growing – it is a matter of assistance, not replacement.
To spur development, technology partnerships are cru-cial especially in the care and rehab sectors. This type of partnership created, for example, ROBERT®, a robotic rehabilitation device that aids in the mobilization of bed-ridden patients. It assists physiotherapists in physically demanding and repetitive exercises.
Smaller surgical procedures, faster healing thanks to robot-assisted operationsTraditional medical robotics has made significant strides. Robot assistants are already being used successfully for tumor treatments, imaging or during operations. “Each and every day, our technology provides support for 1500 tumor and cancer treatments, 2000 cardiac catheteri-zations, and we are currently supporting more than
ease the workload on people, thus keeping them on the job longer,” according to Hoene. Robot assistants are particularly useful for activities that are unpleasant, ergonomically unfavorable or monotonous. Such as in assembly, where robots can act as intelligent lifting aids. But we also need urgent support outside the working world. After all, we are getting older and more frail – the aging population is really putting healthcare to the test.
More efficient hospitals – more time for patients“We are facing a global challenge in the healthcare sec-tor,” says Stephan Sonderegger, CEO of Swisslog Health-care. “All aspects of the industry are transitioning.” There are fewer and fewer specialists for ever more patients, while the statutory requirements are high. Hospitals have to reduce costs and operate more efficiently. This means shortening the patients’ stay while at the same time keeping the quality at a high level. Automation can provide logistical support, according to Sonderegger. A more efficient division of labor allows employees to focus fully on the patients, thus increasing the quality of care.
“Our solutions affect the entire medication supply chain.” Swisslog helps hospitals and healthcare facilities to make material transport and medication management more efficient. Drugs are stored, delivered and dispensed automatically. Drug management, which used to be very time-consuming and above all error-prone, is thus signifi-cantly improved. This ensures that every patient receives the right drug at the right dose.
Golden years at home instead of a retirement homeFor many older people, living in a care facility is just as unavoidable and unpopular as staying in a hospital. Peo-ple want to grow old in a familiar environment, even if

25
Sensitive robots are helping more and more people in
their daily work.
120 clinical trials with our robotic equipment,” says Otto. The robotic surgical assistants help to make procedures minimally invasive – which means smaller wounds and faster healing.
In an article the Deutsches Ärzteblatt (German medi-cal journal) took a look at the developments in robot-as-sisted surgery in 2016. “For most users, robot assistance ultimately provides minimally invasive surgery with the advantages of unrestricted access,” the Journal of the German Medical Association and the Association of Stat-utory Health Insurance Physicians wrote. “The camera additionally allows magnification of up to ten times with an absolutely steady image.” This also opens the door to new possibilities for complex interventions.
The costs for such a technology investment are offset by the advantages of faster and more precise operations. Which is not only to the benefit of patients’ health, but is also more efficient for the hospitals.
An indispensable assistant for our daily livesEven outside of hospitals and working life we are likely to encounter cobots more frequently in the future. “Robots will support people in many day-to-day activities in the coming years. And autonomous driving will also be an integral aspect,” says Dr. Till Reuter, CEO of KUKA AG. In a strategic partnership with Volkswagen, KUKA is work-ing on robot-based solutions for electrically powered and self-driving cars. For example, a sensitive, HRC-capable
robot independently connects one of VW’s electric vehi-cles to a charging station as part of the joint e-smart Con-nect research project. The car simply needs to be parked in a designated parking space, and everything else is han-dled by the mechanical assistant.
Robots are powerful and indefatigable, working precisely and reliably. They can relieve people of unpleasant or dan-gerous tasks and provide everyday help. The possibilities are endless, with ideas such as intelligent alarm systems, aids in cleaning dangerous substances, and even lifting assistants.
“I think we are out of the gate,” says Reuter about the future of robotics for end consumers. “The first cell-phones were only used to make calls. Today, smartphones are virtually everyone’s permanent life companion. I think we will see a similar development in robotics.”
And the question: “Do you have a cobot yet?” will proba-bly no longer sound all that futuristic.
Joint project of KUKA and VW: the robot as an assistant for electric car drivers.
Source: VW

26 | the o.i.
QUESTIONS TO
The trend towards individualization certainly plays an important role: order quantities are decreasing while product diversity is increas-ing. Production must be capable of adapting extremely quickly. We need more flexibility and adaptability in the factory. In the past, we had only two ways of doing things: man-ual labor or full automation. HRC fills exactly the gap between the two: gradual, flexible automation of individual tasks. And HRC puts an end to the idea that automation is only worthwhile for high-volume production.
Dr. Albrecht Hoene R&D Director for Human-Robot Collaboration at KUKA AG on the future of human-robot collaboration
What are the benefits of HRC to industry?
Forms of human-robot interaction
Full Automation (FA) Human-Robot C... (HRC)
Coexistence Cooperation Collaboration
Presence detection Intervention zones Shared workspacesSeparate workspaces
Separate workspaces Shared workspaces
Decoupled work Coupled work
Contact allowedNo contact allowed
Maximum speed Adapted speed
Coexistence, cooper-ation, collaboration: there are various ways in which humans and robots can work together. Sensitive robots like the KUKA LBR iiwa allow collab-oration in a shared workspace – and thus open up countless new possibilities.

27
In industry, the prime objective is to do away with safety fences. They are inflexible. Picture a robot cell that has material coming in and going out. If you want to automate this, you need safe and monitored access for the con-veyor and transport systems. But it would be more elegant if the fence wasn’t there in the first place. The goods are delivered, the robot picks up the material and work continues promptly. And if a person is in the vicinity, the system slows down and comes to a halt. This is how automation can make life easier.
What is your vision for human-robot collaboration?
The future belongs to HRC, which will have an ever greater impact on industry. It will become increasingly important to make larger robots for heavier loads HRC-capable. There are some significant challenges here. Remote sensors and tool safeguarding can help to avoid collisions and to make entire factory halls operate flexibly.
What will HRC 2.0, in other words the human-robot collaboration of tomorrow, look like in factories?
Full Automation (FA) Human-Robot C... (HRC)
Coexistence Cooperation Collaboration
Presence detection Intervention zones Shared workspacesSeparate workspaces
Separate workspaces Shared workspaces
Decoupled work Coupled work
Contact allowedNo contact allowed
Maximum speed Adapted speed

28 | the o.i.
The digital transformation is bringing forth intelligent products that make all of our lives easier. After all, who
is willing to live without their smartphone in this day and age? Hardly anyone, according to the statistics por-
tal Statista: 4.4 billion smartphone connections were registered in 2017, while the figure was only ten per-
cent of that in 2010. The reason for this success is that smartphones fill our needs in a wonderfully simple fash-ion: they offer countless possibilities, yet are still easy to operate – a decisive factor in their momentous success.
The industrial sector is striving to replicate this blueprint for success, bringing automation to a whole new level.
Robotics for everyone
FROM APPRENTICE TO JOURNEYMAN
Intuitive human-robot interaction with a smartphone – a project at
KUKA Corporate Research
IIncreasingly simple control of robots is not an end in itself. According to the Interna-tional Federation of Robotics (IFR), the num-ber of industrial robots worldwide will rise by 14 percent annually until 2020, at which point it will surpass the three million mark. This increase and the need for production to be ever more flexible are the reasons why more and more people are coming into con-tact with robots. It will be quite a challenge to find enough qualified personnel to handle these machines.
Moreover, the product range in manufactur-ing is increasing as a result of automation, allowing companies to offer a wider selec-tion. This also requires robots and intelli-gent machines to be reprogrammed more frequently, ideally without long downtimes. For medium-sized companies in particular, automation is only worthwhile if the robots can be utilized quickly and easily for smaller quantities too.

29
FROM APPRENTICE TO JOURNEYMAN
The automation sector would therefore be well-advised not to delay in developing tech-nologies for easy operation. Looking into the automobile sector the potential here is not limited to graphical programming and voice control. In the latest generation of cars, info-tainment systems can already be controlled with gestures.
Never losing sight of the target groupLarge companies are increasingly concerned with the question of who the users of their products are and what desires and require-ments they may have. “A person always per-forms a certain role, which in turn can be defined by certain characteristics,” explains Jessica Rademacher, head of the Usability department in KUKA’s Research and Devel-opment division. “We are creating software solutions to provide the best possible sup-port for customers in carrying out their tasks successfully, efficiently and to their own sat-isfaction. The focus is always on the user.”
But opinions vary in terms of whether a device or machine is easy to operate. After all, there are professionals and non-experts in all areas. And the age of the user also plays a role. Precisely these factors must be taken into consideration when developing new but-tons, touch screens or controls.
Easy robot control with preprogrammed blocksThe aspects that work well on a smartphone also make the operation of robots easier. As a result, an increasing number of employees are able to program and operate robots with-out any formal skills. One of the simplifica-tions is to use a widely popular programming language, such as Java, for programming robots. To make robot-based automation user-friendly even for employees who do not possess any programming knowledge, Java commands can be grouped into intuitively configured function blocks. In this scenario, the operator selects function blocks and
configures the desired sequence. So the com-plexity of text-based programming is never even an issue.
Easy programming and operation signifi-cantly reduces people’s reservations about working with robots. One example of this has been implemented at the Technical Uni-versity of Dortmund. The robot-based test environment is designed to train students for future production scenarios, to demon-strate the benefits of automation to compa-nies, and to mitigate people’s reservations. An important feature here is the robot con-troller, which can be simply programmed and operated by means of graphic elements. Users can select the desired robot program and expand it, if needed, without any spe-cial knowledge.
Hello robot – voice control makes it possibleThere are also other options allowing robots to be easily commanded. “In the future, I want to be able to control robots by voice,” says Dr. Rainer Bischoff, Head of KUKA Cor-porate Research. In this respect, robotics can benefit from smartphone developments, where voice-based input is already part of everyday life.
Thanks to more advanced sensors and algo-rithms, a lot has already happened in this field. Today, robots are capable of master-ing even complex tasks with a high degree of autonomy, as Bischoff illustrates with an example: “The task is described orally, pretty much like a command that I might give to a person, ‘I need a terminal. You can find one in our warehouse. Place it in a box and bring the box to my workplace.’ Currently we are working on getting a robot to make decisions autonomously and to execute more demand-ing and varying tasks independently. In other words, we want to evolve the robot from apprentice to journeyman.”

30 | the o.i.
ARTIFICIAL INTELLIGENCE
Man and machine in new harmony?
Martin Ruskowski is a professor at the Department of Machine Tools and Controls of the Technical University of Kaiserslautern. At this university and at the German Research Center for Artificial Intelligence (DFKI), he researches topics such as the interaction between humans and machines as well as Industrie 4.0. He previously worked for KUKA Industries, where he was responsible for global research and development.

31
It is a fascinating and polarizing technology: arti-ficial intelligence (AI) is changing the world and giving rise to new possibilities. Above all else, Hol-lywood movies and exaggerated predictions have characterized AI in the past, arousing fears in many people. Sepp Hochreiter from Linz in Austria and
Martin Ruskowski from Kaiserslautern in Germany are renowned experts in the field of artificial intel-ligence. In a joint conversation, the two professors discuss opportunities and unrealistic expectations – and why it’s not just humans who need time to learn more.
Sepp Hochreiter is a professor at the Institute for Bioinformatics of the Johannes Kepler University in Linz, Austria. The computer scientist researches topics such as machine learning and bioinformatics, among other things for genetic analysis and drug devel-opment.

32 | the o.i.
Professor Hoch-reiter, Professor
Ruskowski: What is your defini-
tion of artificial intelligence?
Your definition, Professor Hoch-reiter, sounds as
if the aim of AI is to create a “new”
human being.
Hochreiter: To me, it constitutes a machine with cognitive abilities which are generally ascribed to humans. This is also how John McCarthy defined it in 1956. Such a machine perceives the world, plans and draws logical conclusions to achieve an objective.Ruskowski: In my view, artificial intelli-gence primarily comprises a group of special mathematical procedures. These facilitate, among other things, the recognition of pat-terns, machine learning processes and also the interaction of a machine with its envi-ronment in the sense described by Mr. Hoch-reiter. But the original definition by McCarthy goes too far, in my opinion.
Hochreiter: A machine that looks like a human being but is not a human would give rise to too many ethical issues. It would be foolish. Rather, we should develop something that is capable of providing the best possi-ble support.Ruskowski: I agree that replicating humans makes no sense. We must distinguish, there are two approaches to AI: strong AI, which aims to understand how humans function, and weak AI, which expands the abilities of humans. The second approach is what we are pursuing at DFKI, the German Research Center for Artificial Intelligence, for exam-ple in terms of using AI for production. To us, AI is like an adapter between the digital and human worlds. We humans are not that great at processing large amounts of data, for instance. AI can handle the preprocess-ing, allowing us to make better and faster decisions on that basis.Hochreiter: I don’t think that is ultimately the goal. Strong AI is the more interest-ing route in my opinion. We are striving to build complete systems that can see, hear,
understand and handle objects. These uni-versal systems can then be specialized: one cooks, another cleans and a third works as a roofer. Facebook, Google and Amazon are already working on such universal systems in their own fields, and so are automakers for the purpose of recognizing the environment for autonomous driving.Ruskowski: I don’t think that one system for everything is the way to go. I believe in diversification with many small systems, from which we pick specialized abilities that can then be combined on a modular basis. What concerns me about your approach is that a single player could monopolize the sit-uation. A system like Facebook would have even more of an influence on our entire life.
Ruskowski: No. Look at Germany, for exam-ple: we have used automation for decades and still have full employment in many sectors. Even back in the 1980s, engineers dreamed of factories without people. It has never come true – thankfully. But why? Some think that AI is inexpensive or even free, but that’s just not the case. These systems are so complex that their development entails considerable costs. This is the reason why AI will not readily replace humans in factories. Quite the contrary: by using these technolo-gies, we can even bring industrial production back to Europe. This is assuming that we are successful in further developing the automa-tion process: to date, humans have had to adapt to the machines. For the first time, AI makes it possible for automation to adapt to humans, meaning that machinery becomes a useful tool and attendant.Hochreiter: I also believe that AI will yield more work, not less. Machines are becoming more intelligent and will be able to talk to humans. A lathe will be able to tell you that the lubricant is too hot or the chips are too long. Relieved of tedious tasks, humans will become teachers or instructors, and will only have to deal with exceptions, which are much more interesting.Ruskowski: But we must not forget to involve employees and works councils from the beginning when such systems are intro-duced. The transformation has to hap-pen from the bottom up, rather than being
Regardless of what approach we pur-
sue, do you believe that AI will replace
human workers?
“ Especially because many of the scenarios that are presented to us at the movies are so absurd, it is important for us to define clearly in reality what AI is and what it isn’t.”

33
dictated from the top down. One important issue is transparency, for example, when it comes to monitoring technology.Hochreiter: I agree, the user must under-stand what is happening, thus enabling him or her to actively participate.
Hochreiter: It is true that many people are afraid of losing control, which would be virtu-ally tantamount to domination by machines. But why would AI want to dominate humans when it requires different resources and hab-itats than humans, who are bound to the biosphere? Another argument against such gloomy scenarios is the fact that humans exercise selective pressure on AI, meaning that only useful and helpful AI will be fur-ther developed and reproduced. I am opti-mistic that this pressure will encourage us to develop productive AI.Ruskowski: Especially because many of the scenarios that are presented to us at the movies are so absurd, it is important for us to define clearly in reality what AI is and what it isn’t. This includes learning how to use it in a responsible manner and repeatedly explain-ing how AI works.Hochreiter: Exactly. Why do we demand 100 percent perfection from AI from the start, but not from humans? Let’s take auton-omous driving, for example. Before humans are allowed to drive, they have to obtain a driver’s license. Similarly, a machine must first demonstrate that it can accomplish
everything that it is asked to do, and that it can do so with adequate safety and resil-ience. But it is not liable to make certain mis-takes. For example, it does not get tired and is not distracted by a cellphone ringing. In the long term there will be significantly fewer accidents thanks to AI.
Hochreiter: In terms of the legal framework, we need to catch up quickly. At the moment, there are many individual stories that are cir-culating in the press regarding things that can go wrong. I have had discussions with criminal lawyers. The circle of people involved with AI products has grown. This raises new questions: whose fault is it if something goes wrong when using a machine? The program-mer, the sensor manufacturer or the people who have trained the system and fed it the data? We have to come to terms with the fact that we will not be able to pre-program all conceivable eventualities. After all, the very characteristic of AI systems is that they learn from perceiving their environment.Ruskowski: We also need to make signifi-cant strides in education and training. Our current curricula are still very analog-based and humanistic, for example. Not that there is anything wrong with that, but they must be expanded. I have noticed that schools in many cases brush aside the digital world. As a result, young people are insufficiently pre-pared to responsibly handle digital opportu-nities such as AI.
Movies often por-tray artificial intel-
ligence as menac-ing – is there any
truth to that?
How should we, the economy and society, get ready
for AI?
Artificial intelligence and roboticsTo an increasing extent, robots are no longer being used only in strictly organized production cells, separated by safety fencing, but are collaborating with humans in production operations or even have to find their way around a “chaotic” environment in domestic set-tings. Artificial intelligence helps robots adapt to such uncertainties and variability. Until now, robots have been repetitive, working with consistent precision and high repeatability. The requirements of the future are much more diverse, however. If robots are to handle every-day tasks, for example, they must be able to react flexibly to events in their surroundings. To achieve this, KUKA is using machine learn-ing, a subdomain of AI. This involves learning procedures on the basis of examples instead of explicitly programming fixed sequences. But the same still applies: human experience and human creativity are ultimately irreplaceable.
“Machines are becoming more intelligent and will be
able to talk to humans.”

34 | the o.i.
THE RING AFTER THE CLICK
FThe world is on a digital shopping spree. Online shopping is more popu-lar than ever, and customers are becoming ever more demanding. Be it
stocking a constantly changing variety of goods or making environmen-tally-friendly deliveries in record time through congested megacities,
logistics companies must prepare to face tomorrow’s challenges.
From Christmas reindeer sweaters to fair trade organic coffee and freshly picked flowers, the choice of products on the Internet seems infinite. And after having clicked, customers wait for the fast delivery service to ring the door bell.
In Germany, around 67.6 percent of the population bought goods online during 2016, and the trend is increasing. The world reached a global milestone in 2017: for the first time, half of earth’s inhabitants were online – and the number is on the rise. In addition, the global middle class will more than double between 2009 and 2030 accord-ing to an EU study. In summary this means there will be more people with Internet access who can afford to shop online – and will actually do so.
On the other hand, what customers don’t appreciate at all is a long wait before the goods arrive. The DHL parcel
service reports that 85 percent of all online shoppers attach the greatest importance to quick and reliable deliv-ery; 50 percent of the respondents said they had already aborted online purchases because the delivery options were too slow. Same-day delivery or next-day delivery are already offered by large retailers, but next-hour delivery is going to be the future standard.
Anyone who uses a car in the rush hour and tries to drive quickly through a large city will understand the chal-lenges posed by these express delivery options. Therefore, experts are trying to work out quicker and more efficient methods of delivery and new types of warehousing.
“The warehouse of the future will be as compact as possible so that it can fit into any available space, with self-learning robots to make it flexible,” says logistics expert Michiel Veenman from the Swiss automation

35
company Swisslog. That’s because smaller warehouses are easier to locate close to residential areas. Urban dis-tribution centers reduce the length of delivery trips, and save time.
With such flexible future technology concepts, auto-mated warehousing systems can also be more quickly modified, so changes to the product range are no longer a problem. “The fashion industry has particularly short product cycles, with the assortment of goods changing continually,” Veenman explains. Self-learning robots and software solutions help us manage the sheer endless diversity of products. The support provided by logistics robots can also overcome the problem of staff shortages in the industry.
Flexibility is immensely important, because the future “sharing economy” won’t only be of interest for cars or music. Following this principle, warehouses could also be shared flexibly rather than purchased, taking the form of modular units that can be re-assembled like building blocks in a construction kit, and intelligent robots which immediately recognize a new renter with different prod-ucts and then invoice their work on a service basis. Pay-per-pick instead of costly permanent storage.
This way, players in the fiercely competitive logistics mar-ket can respond to extreme fluctuations in demand. The Fraunhofer Institute for Materials Flow and Logistics has addressed the topic of urban logistics, and suggests using multi-story car parks, for example, as temporary ware-houses when millions of people press the “Buy Now” but-ton on their smartphones shortly before Christmas.
The “last mile” to the customer could also be shared. When dozens of drivers with half-full delivery trucks drive
along congested streets heading to the same address, this has an impact on the environment and infrastruc-ture – and on the vendor’s balance sheet. An efficient “shared last mile” with electrically powered delivery trucks would therefore not only save costs for the logis-tics companies but also reduce the burden on cities and the environment.
“With people and politicians increasingly expecting not only functioning but also clean, quiet and unobtru-sive logistics, it is inevitable for logistics companies to address electromobility and new means of transport,” says Prof. Uwe Clausen, Director of the Fraunhofer Insti-tute for Materials Flow and Logistics (IML). “Delivery con-cepts without a driver in the vehicle for certain parts of the route will be really exciting,” according to Clausen’s prediction. “Stationary retail business will persist, but it will have to reinvent itself to keep customers interested.”
We can only speculate on how the cities of the future will look, and on the pattern of our future shopping behavior. DHL has investigated various future scenarios in a study. Will we have access to a 3D printer in our own neighbor-hood, printing our desired products, just as nowadays we print our photos at the local drugstore? Will we live in megacities which function only through efficient logistics and where people rent things instead of buying them?
“Altogether, the study clearly shows that the role of logis-tics will change strongly in the coming decades. That applies to all the scenarios described in it,” says Deutsche Post CEO Frank Appel in an interview about the study. “Common to all of them, however, is a highly encour-aging message, especially for our industry: the demand for logistics services is set to grow in virtually all cases.”
Warehouse airshipsIn late 2016, a big online dealer made headlines when it became known that it had patented the idea of comput-er-controlled tethered airships. The plan: tethering the warehouse airships close to the city, where they would act as bases from which drones fly the goods to the customer.
The flying parcel serviceRoads may be clogged, but airspace is clear – that saves time and cuts distances. This is the reason logistics compa-nies are testing deliveries by drone. These small aerial vehi-cles would be capable not only of delivering purchases to city dwellers but also of flying goods to inaccessible places or transporting medication for humanitarian purposes.
Ideas for future logisticsUnderground pneumatic tube systemLike a mole: several companies and start-ups are explor-ing the idea of delivering merchandise and goods via underground tunnel systems. This would allow products to reach their destinations without congestion or diver-sions, taking the burden off the streets and the environ-ment at the same time.
One vehicle, many optionsSome ideas address the possibility of extending car shar-ing to include the delivery of packages. Either the person renting the car could take the package with them on their journey and receive a discount on the car sharing charge, or autonomous vehicles could use their parking time to deliver packages.
Airborne delivery: is this what a logistics solution of the future might look like?

36 | the o.i.
FFor just 25 cents, visitors were able to expe-rience a historical milestone in the USA in 1962: the “reality machine” took them to another world. Those who sat down on the moving chair and put their head into the apparatus experienced a motorcycle ride through Brooklyn from the driver’s perspec-tive. Real wind blew through their hair, the chair vibrated and tilted in the direction of travel. The Sensorama, as cinematographer Morton Heilig called his invention, is consid-ered the first Virtual Reality appliance, a mul-ti-sensory theater that enabled the audience to fully immerse themselves in the films.
But the futuristic apparatus never got beyond the prototype stage. “The Sensorama may have been too revolutionary for its time,” Heilig later stated in an interview, and he was most likely right. Because, for an innovation to be successful, the market timing has to be right as well.
And if you concur with the opinion of the IT market research company Gartner, the time has now come for Virtual Reality (VR). The company estimates in a study that, after peri-ods of hyped expectations and subsequent disillusionment, Virtual Reality can be used productively within the next five years.
“The world is becoming more and more complex. VR and Augmented Reality (AR) can make certain subjects more compre-hensible through innovative visualization, rendering them more tangible,” says Tor-sten Fell, board member of the First Ger-man Professional Association for Virtual
For a long time, only technology enthu-siasts were thrilled about Virtual Reality and Augmented Reality. But today indus-try experts are convinced: the hype is now being followed by applications.
Reality. The possibilities are wide-ranging: “I can physically grasp data and adapt them, thus making it possible to experience big data or to move digital twins of machinery.” Even though it will still take some time until the technology is widely used: “Companies that are gaining experience with the technol-ogy now will be a step ahead in the future, as they will already be familiar with it.”
Researchers and developers have been experimenting with the countless technical possibilities for a long time: firefighters sim-ulate highly dangerous situations in train-ing and doctors are using VR in studies to treat anxiety and pain. In a VR simulation of the St. Gotthard base tunnel, workers were trained to ensure smooth operations under-ground without costly downtime. And at RWTH Aachen, forest workers are safely and realistically practicing off-road driving with a wood harvester by means of a 3D simulator on a KUKA robot.
“We have started working with technologies in this field and are developing solutions for our customers, in addition to finding solu-tions for optimizing our own processes,” says Kerstin Höfle, IP and Strategy Man-ager at Swisslog. This enables customers to explore their future warehouse with VR glasses, observe how employees interact with machines, or test how access routes and cables can be optimally positioned.
Augmented Reality (AR), in other words expanding the real world with virtual objects, is also very promising. The first AR pilot
REALITY PLUS

37
projects with digital support for service tech-nicians and remote maintenance are under-way. The use of a headset like the Microsoft HoloLens allows users to see 3D projections in their real environment, such as additional product information or simulations. A large furniture store is using AR to help their cus-tomers see what the virtual sofa could look like in their living room.
“We enhance the real world with informa-tion, so to speak,” says Thomas Kirner, team leader for virtual commissioning at KUKA. Working with Virtual Reality has been part of his everyday life for many years. His team creates digital images of systems, and these virtual machines are then programmed. If everything works as intended, the software is used on real systems. This saves time and money and allows customers to walk through complex production cells that would be vis-ually inaccessible in reality, and it enables them to get a detailed view of their system in operation. 3D glasses are not always needed. Frequently, a monitor suffices.
At first glance, people wearing the bulky, black headset look somewhat isolated, but in reality VR can facilitate cooperation, such as during joint project work in a virtual space while the teams are actually in different loca-tions. It may even help employees work more creatively in the future. Because in the virtual world meetings can also take place in front of a breathtaking mountain panorama or on the beach instead of in a dreary conference room.
Augmented Reality
Augmented Virtuality
Mixed Reality
Virtual Reality
Real World
Augmented Reality: The real world is augmented with virtual objects and information, such as instructions or tips. As a matter of fact, probably the most pop-ular AR application to date is a computer game: in Pokémon Go, users catch digital fantasy crea-tures in the real world.
Augmented Virtuality: “Aug-mented Virtuality” flips the rela-tionship between virtual and real: real objects or people are inserted or displayed in a virtual environment.
Mixed Reality: In “Mixed Real-ity”, virtual and real elements are combined to different degrees. This can range from a real envi-ronment with some virtual objects (AR) to a digitally created environment with people or real objects in it.
Virtual Reality: Users can also completely immerse themselves in a computer-generated world by means of special glasses or virtual rooms. This effect is called immersion and is one of the core characteristics of Virtual Reality. Users move about in Vir-tual Reality and interact with it in real time.

38 | the o.i.
KUKA Aktiengesellschaft
Zugspitzstr. 14086165 AugsburgGermany
T +49 821 797 - 0F +49 821 797 - [email protected]
Corporate Communications T +49 821 797 - 3722F +49 821 797 - [email protected]
Contact and imprint
Concept, design and setting sam waikiki, Hamburg /Germany
Text KUKA Aktiengesellschaft
Redaktion Katrin Stuber-Koeppe, Teresa Fischer
Fotos Marek Vogel Andreas Pohlmann KUKA AG iStock Jo Teichmann Swisslog Audi AG (p. 20 /21) VW (p. 25) SCHUNK GmbH & Co. KG (p. 20)
Graphic arts Torsten Fell – angelehnt an Milgram, Paul; H. Takemura; A. Utsumi; F. Kishino (1994) (graphic arts VR /AR, p. 37) Dr. Richard Zunke (graphic arts MRK, p. 26 /27)
Translation AMPLEXOR Digital GmbH, Augsburg /Germany
Print Eberl Print GmbH, Immenstadt /Germany
Tradition meets innovationKUKA is celebrating its 120th anniversary this year.All events around the orange birthday can be found at www.kuka.com/KUKA120

39


beyond automation
Annual Report 2017

KUKA at a glance
KUKA is a global automation company with sales revenues of around 3.5 billion euro and a workforce of about 14,200. As one of the world’s leading suppliers of intelligent automation solutions, the company offers its customers everything they need from a single source: from the core component – the robot – to cells and fully automated systems. Industrie 4.0 is bringing the digital networking of production, flexible manufacturing concepts and new business models to the fore. The aim is to support customers by providing comprehensive automation and digitization know-how in order to optimize their value creation.
Orders received
€3.6 billionEmployees: 14,256
+8.1%Sales revenue
€3.5 billion
Key figures and locations 2017

ContentsForeword 6
Supervisory Board report 8
Corporate Governance report 13
Compensation report 18
KUKA and the capital market 23
Consolidated financial report 24
Group basis 25
Economic report 33
Forecast, opportunity and risk report 51
Internal control and risk management system 59
Disclosures in accordance with sections 315b, 315c, 289c, sections 315d, 289f and section 315a para. 1 of the German Commercial Code (HGB) including accompanying explanations 61
Group financial statements 66
Group notes 72
Responsibility statement 121
Independent Auditor’s report 122
Disclosures in accordance with pay transparency act 127
Glossary 128
Financial calendar 2018 130
Contact and imprint 130

Key figures
in € millions2016 2017 Change
in %
Orders received
Robotics 1,088.8 1,223.3 12.4
Systems 1,644.6 1,530.2 -7.0
Swisslog 742.6 926.2 24.7
Group 3,422.3 3,614.3 5.6
Sales revenues
Robotics 993.5 1,200.6 20.8
Systems 1,395.5 1,579.2 13.2
Swisslog 593.5 763.7 28.7
Group 2,948.9 3,479.1 18.0
Order backlog (Dec. 31) 2,048.9 2,157.9 5.3
EBIT
Robotics 100.7 133.1 32.2
Systems 91.3 17.8 -80.5
Swisslog 4.8 10.4 >100
Group 127.2 102.7 -19.3
EBIT in % of sales
Robotics 10.1 11.1 –
Systems 6.5 1.1 –
Swisslog 0.8 1.4 –
Group 4.3 3.0 –
Earnings after taxes 86.2 88.2 2.3
Financial situation
Free cash flow -106.8 -135.7 -27.1
Capital employed (annual average) 783.0 950.4 21.4
ROCE (EBIT in % of capital employed) 16.2 10.9 –
Capital expenditure 99.6 138.8 39.4
Employees (Dec. 31) 13,188 14,256 8.1
Net worth
Balance sheet total 2,543.9 2,640.1 3.8
Equity 840.2 866.6 3.1
in % of balance sheet total 33.0 32.8 –
Share
Weighted average number of shares outstanding (in millions of shares) 39.6 39.8 0.5
Earnings per share (in €) 2.19 2.22 1.4
Dividend per share (in €) 0.50 0.50 –
Market capitalization (Dec. 31) 3,506 4,819 37.5
1 Subject to approval by shareholders at the Annual General Meeting on June 6, 2018

OUR GOAL?
To make people’s lives easier and better.
We are working with great passion to make robots more intelligent and introduce them to new areas. People will always remain in charge of robots, programming them for the desired purpose, deploying them and also controlling them.Dr. Till Reuter

KUKA Aktiengesellschaft | Annual Report 2017
6
Foreword
KUKA can look back on global success and growth in the year under review. However, it was also a year of investment and challenges.
KUKA Group recorded orders received totaling 3,614.3 million euro, representing an increase of 5.6 percent on the previous year (2016: 3,422.3 million euro); we also increased sales revenues by 18 percent from 2,948.9 million euro (2016) to 3,479.1 million euro. The EBIT margin fell, however, from 4.7 percent to 4.3 percent.
This was attributable to capacity bottlenecks in the Systems division in Augsburg for certain projects in Europe and to the fact that we had to counteract this with measures to boost profitability. Earnings were thus impacted to the amount of approximately 40.0 million euro. The Systems division in Germany operates in the systems engineering sector that is of particular significance to us with regard to our Indus-trie 4.0 strategy. That is why the restructuring is crucial.
Overall, KUKA is successful, which is why we invested in our Augs-burg headquarters and in our technologies in the year under review. Research and development is placing pioneering technologies and products on the market, leading to new fields of application. Numer-ous process steps can now be automated where until recently it was hard to imagine robots could be used.
Automation enables companies from different industries and small and medium-sized enterprises to make their production more effi-cient. The focus is on connecting the real and virtual production worlds in the context of Industrie 4.0, as well as on safe collaboration between humans and robots, and on mobile robotics. The safety fac-tor, intuitive operation and solutions for networked digital production are playing an important role.
Together with VW, we are thus entering the field of service robotics. In the course of a close research cooperation, the CarLa charging robot has been developed for electric cars. With our Industrie 4.0 team, we are working on new business models for our customers’ factories of the future.
2017 was also the first year with our new majority shareholder Midea. We thus laid the foundations for our growth in China. In addition to the expansion of our location and capacities in Shanghai, we are planning a robotics park at the Midea site in Shunde in order to capitalize on the rapid growth in automation and digitization in the Middle Kingdom.
As the global industry association, the International Federation of Robotics (IFR) estimates worldwide sales of 347,000 industrial robots for 2017. This corresponds to growth of 18 percent on the previous

Foreword
7
Peter MohnenCFO
Dr. Till ReuterCEO
year. The IFR anticipated 230,000 industrial robots sold in 2017 for Asia /Australia, of which 115,000 are accounted for by China alone. This constitutes a rise of 21 percent in Asia and an increase of even 32 percent in China.
The reasons for this are rising labor costs, growing quality require-ments, the focus on increasing efficiency and the previously low robot density.
We also see further potential in the USA. All the shares in the com-pany Talyst Systems LLC, Delaware, USA were acquired in the third quarter of 2017. Talyst is a leading supplier in the pharmacy inventory management sector and so-called “inpatient pharmacies” and has extensive customer relationships, particularly in the USA.
In the year under review, the KUKA team demonstrated overwhelming commitment and continues to work with great passion on solutions and technologies for the future.
We will be presenting many innovations at Hannover Messe in April. I cannot reveal too much at this point. One thing I can say, however: the factory of the future is taking shape. The robot, as the central ele-ment, supports people, and it is people who remain our primary focus.
Hannover Messe is not the only highlight this year, however. KUKA is celebrating its 120th anniversary and for this reason we are hosting the opening event of European Robotics Week in Augsburg.
I am very much looking forward to these fantastic events. In the meantime, I would like to take this opportunity to thank our employ-ees for their magnificent performance.
Sincerely,
Dr. Till Reuter

KUKA Aktiengesellschaft | Annual Report 2017
8
Supervisory Board reportDear Shareholders,The past fiscal year was characterized by the increase in revenues and thus the continued growth of the company. Within the scope of its control and advisory function, the Supervisory Board assisted the Executive Board in moving the company forward. The Super visory Board was able to play an active part in fundamental decisions regarding the company’s future course. These also included strate-gically important company acquisitions, especially with a view to Industrie 4.0. The strategic alignment of the company constituted a general focus of the Supervisory Board’s work. Cooperation between the Supervisory Board and the Executive Board was always construc-tive and based on mutual trust.
The Supervisory Board fulfilled its duties in plenary meetings, com-mittee work, conference calls and in circular resolutions. Talks were also regularly held with the Executive Board, especially by the Chair-man of the Supervisory Board and the chairs of its committees. The key performance indicators of the Group (e.g. orders received, sales revenues, EBIT, staff levels) were discussed in detail at every Super-visory Board meeting in connection with the Management Report of the Executive Board. Deviations of the business performance from the plans and targets or from the budgets were discussed in detail in the Supervisory Board and examined by it on the basis of the documents submitted. The Supervisory Board was thus continuously aware of the company’s economic situation.
Questions regarding Executive Board remuneration were prepared in the Personnel Committee, with subsequent decisions being made at the plenary meetings of the Supervisory Board.
Changes to the Executive Board and Supervisory BoardNo changes occurred in the Executive Board. The company is still managed by Dr. Till Reuter as CEO and Mr. Peter Mohnen as CFO. The appointments of Dr. Till Reuter and Mr. Peter Mohnen last until March 31, 2022. In view of these terms in office, the Supervisory Board has set the quota for female Executive Board members at 0% for the time being.
The Supervisory Board underwent numerous personnel changes. The following board members resigned from office: Dr. Hubert Lienhard as of January 10, 2017, Dr. Friedhelm Loh as of January 27, 2017, Prof. Dr. Dirk Abel as of January 31, 2017 and Mr. Bernd Minning also as of January 31, 2017, Prof. Dr. Uwe Loos as of February 28, 2017 as well as Dr. Constanze Kurz as of November 14, 2017. The new members were initially appointed by court order: Dr. Yanmin (Andy) Gu, Ms. Min (Francoise) Liu and Prof. Dr. Michèle Morner since February 10, 2017 and Mr. Hongbo (Paul) Fang and Mr. Alexander Liong Hauw Tan since February 24, 2017. These Supervisory Board representatives of the shareholders, Mr. Hongbo (Paul) Fang, Dr. Yanmin (Andy) Gu, Ms. Min (Francoise) Liu, Prof. Dr. Michèle Morner and Mr. Alexander Liong Hauw Tan, were then also elected to the Supervisory Board by the Annual General Meeting on May 31, 2017 following expiry of their court appointment. Furthermore, Prof. Dr. Henning Kagermann was
also appointed to the Supervisory Board at this Annual General Meet-ing. Lastly, Ms. Tanja Smolenski has been a member of the Supervisory Board since December 14, 2017 by court appointment. All mandates last until the end of the 2018 General Meeting which is scheduled for June 6, 2018.
The members newly appointed to the Supervisory Board also took on the following functions in the committees: Dr. Yanmin (Andy) Gu as Chairman of the Personnel Committee, Chairman of the Medi-ation Committee, member of the Nomination Committee, Audit Committee and member of the Strategy and Technology Committee, Mr. Hongbo (Paul) Fang as member of the Nomination Committee, Ms. Min (Francoise) Liu as member of the Personnel Committee, Mediation Committee, Nomination Committee as well as the Strategy and Technology Committee, Prof. Dr. Michèle Morner as member of the Audit Committee, Mr. Alexander Liong Hauw Tan as Chairman of the Audit Committee and member of the Strategy and Technology Committee, Prof. Dr. Henning Kagermann as Chairman of the Strategy and Technology Committee.
The Supervisory Board extends its great thanks to the former mem-bers Dr. Constanze Kurz, Prof. Dr. Dirk Abel, Dr. Hubert Lienhard, Dr. Friedhelm Loh, Prof. Dr. Uwe Loos and Mr. Bernd Minning for their dedicated work on the board.
With four females out of a total of twelve acting members, the pro-portion of women on the Supervisory Board amounted to 30% at the end of the year under review.
The Supervisory Board convened six plenary meetings. It met three times for telephone conferences and reached two resolutions passed by written circulatory procedure.
An extraordinary Supervisory Board meeting on February 13, 2017 was the first of these meetings. Dr. Yanmin (Andy) Gu, the mem-ber appointed to the Supervisory Board by court order as of Febru-ary 10, 2017, was elected as Chairman of the Supervisory Board at this meeting. Pursuant to section 7 para. 4 of the rules of procedure of the Supervisory Board, this meant that Dr. Yanmin (Andy) Gu also became a member of the Audit Committee and chairman of the other committees with equal representation. Prof. Dr. Michèle Morner, like-wise a Supervisory Board member as of February 10, 2017, was also appointed as a member of the Audit Committee.
In addition to Dr. Yanmin (Andy) Gu, who as Chairman of the Super-visory Board already became an ex officio member of the Personnel Committee pursuant to section 7 para. 4 of the rules of procedure of the Supervisory Board, Ms. Min (Francoise) Liu, who had also been appointed as a Supervisory Board member on February 10, 2017, was elected as a member of the Personnel Committee at another extraordinary meeting of the Supervisory Board held in the form of a conference call on March 15, 2017. Furthermore, Ms. Min (Francoise) Liu, Mr. Hongbo (Paul) Fang and Ms. Yanmin (Andy) Gu were newly appointed to the Nomination Committee.

Supervisory Board report
9
The first ordinary Supervisory Board meeting took place on March 21, 2017, when the topic of the budget for 2017, which had already been discussed on December 15, 2016, was re-examined. On this occasion, the EBIT value planned for the Group in 2017 was addressed again. The Supervisory Board then focused on the annual financial statements of KUKA Aktiengesellschaft and the Group pre-pared by the Executive Board for 2016. In its role as auditor, KPMG presented a report and the Chairman of the Audit Committee made a statement. Both sets of annual accounts were approved by the Supervisory Board, which meant that the annual financial statements of KUKA Aktiengesellschaft were thereby adopted. The Supervisory Board also had to reach a decision on the proposal to the Annual General Meeting regarding appropriation of the 2016 balance sheet profit of KUKA Aktiengesellschaft. The Executive Board had raised the prospect of paying a dividend of €0.50 /share and carrying for-ward the remaining profit. The Supervisory Board concurred in this proposal. Furthermore, the Supervisory Board approved not only the Corporate Governance report but also the Supervisory Board report for 2016. The board dealt with the other proposed resolutions for the Annual General Meeting planned for May 31, 2017. The acquisi-tion project “Talyst” in Swisslog’s Healthcare segment was then also discussed. The Supervisory Board gave its assent. In addition, the Augsburg site concept was addressed at this meeting along with the change in KUKA Group’s organizational structure to a customer cen-tric organization. The declaration of compliance had to be changed in view of Mr. Alexander Liong Hauw Tan taking over the chair in the Audit Committee in a “non-independent” capacity according to section 5.3.2 para. 3 of the German Corporate Governance Code (GCGC). Lastly, issues relating to Executive Board compensation, such as the extent to which the targets stipulated for the Executive Board members for 2016 had been achieved and the 2016 success factor for the variable bonus relating to the company’s financial targets, were also on the agenda. Moreover, the success factor for settlement of the phantom share program (PSP) for 2014 to 2016 was defined and a new arrangement was made for the closing price of the KUKA share. Another key topic of this meeting was the reappointment of Dr. Till Reuter and Mr. Peter Mohnen as CEO and CFO respectively.
The current appointments were repealed by mutually agreed resig-nation as of March 31, 2017 and the Executive Board members were reappointed from April 1, 2017 to March 31, 2022, with Dr. Till Reuter being appointed Chairman of the Executive Board (CEO) and at the same time Labor Relations Director pursuant to section 33 of the Co-Determination Act, and Mr. Peter Mohnen being appointed CFO. With regard to these new appointments, the employment contracts of the Executive Board members also had to be revised and newly resolved. Finally, Ms. Min (Francoise) Liu was appointed to the Medi-ation Committee, and the previous Technology and Production Com-mittee and Strategy and Development Committee were combined to form a Strategy and Technology Committee. Ms. Carola Leitmeir and Ms. Min (Francoise) Liu and Messrs Michael Leppek, Alexander Liong Hauw Tan, Siegfried Greulich and Armin Kolb were newly elected to this new committee. Dr. Yanmin (Andy) Gu became a member of this committee due to his role as Chairman of the Supervisory Board.
The Supervisory Board met before and after the Annual General Meeting held on May 31, 2017. First of all, the Supervisory Board prepared for the Annual General Meeting; it also decided to support the nomination proposal from the shareholder MECCA International (BVI) Limited for Prof. Dr. Henning Kagermann to be elected to the Supervisory Board by the Annual General Meeting.
Following the Annual General Meeting, Dr. Yanmin (Andy) Gu was – after his election as a Supervisory Board member by the Annual General Meeting – again elected Chairman of the Supervisory Board. While Dr. Yanmin (Andy) Gu, as Chairman of the Supervisory Board, is an ex officio member in the committees with equal representation pursuant to section 7 para. 4 of the rules of procedure and – except for the Audit Committee – is also their chairman, the members now elected to the Supervisory Board by the Annual General Meeting had to be elected to the committees again. Dr. Yanmin (Andy) Gu became a member of the Nomination Committee. Ms. Min (Francoise) Liu became a member of the Mediation Committee, Personnel Commit-tee, Nomination Committee and Strategy and Technology Committee, Prof. Dr. Michèle Morner became a member of the Audit Committee,
Dr. Yanmin (Andy) GuChairman of the Supervisory Board

KUKA Aktiengesellschaft | Annual Report 2017
10
Mr. Alexander Liong Hauw Tan became a member of the Audit Com-mittee and Strategy and Technology Committee, Mr. Hongbo (Paul) Fang became a member of the Nomination Committee and Prof. Dr. Henning Kagermann became a member of the Strategy and Tech-nology Committee. In derogation from the rules of procedure, the decision was then taken that Dr. Yanmin (Andy) Gu would not chair the Strategy and Technology Committee, but that this position would be vacated for Prof. Dr. Henning Kagermann who was then elected by the committee as chairman. The 2016 ICS report and a status report on the customer centric organization were on the agenda, as was Executive Board compensation again. The personal targets for 2017, the calculation basis for the company’s financial targets in 2017 and the long-term incentive plan for 2017 – 2019 as a replacement for the previous phantom share programs were agreed upon for the Executive Board members. A decision was also made on an advisory board mem-bership of Dr. Till Reuter and a status report on the investments and contractual relationships of KUKA companies in and with KBee AG. Another matter for resolution was the target quota for women in the Executive Board which – in view of the two-member Executive Board and the ongoing appointments – was set at 0 until May 31, 2022 (fulfillment deadline). However, the Supervisory Board was strongly in favor of diversity in its resolution. The Supervisory Board also had to address matters relating to the board itself, namely its skills profile and the change in the rules of procedure, which had to take into account the merger of the Strategy and Development Committee and the Technology and Production Committee into a Strategy and Technology Committee.
Members were invited to another Supervisory Board meeting by way of a conference call on July 19, 2017. The only item on the agenda was the significant new investment in the KUKA Toledo Production Operations (KTPO) factory in the USA, a body-in-white production plant for Fiat /Chrysler vehicles.
On September 29, 2017, a strategy meeting was held at the Midea site in Shunde. The Executive Board explained the strategic goals of the Group, notably safeguarding and expanding the Group’s leader-ship in innovation and leveraging potential in the Chinese medium segment. In this connection, the focal topics for 2018 to 2020 were addressed, such as securing KUKA’s leading position and the growth in general industry. Particular attention was paid to Swisslog’s WDS and Healthcare segments. Associated risks and opportunities were considered in greater detail, for example, and a portfolio outlook was discussed. Two acquisition projects were also on the agenda, namely the full acquisition of the company Visual Components OY in Finland and the investment in Device Insight GmbH in Munich. Both projects were approved. Lastly, the potential KUKA activities at the Midea site in Shunde were presented.
The concepts of forming joint ventures with Midea companies by integrating Swisslog HCS China and Swisslog WDS China and by way of a robotics joint venture (Industries in China) were discussed at an extraordinary Supervisory Board meeting held on November 15, 2017 in the form of a conference call. Initial plans for a robotics technology park in Shunde were also presented.
The budget for 2018 and the medium-term planning up to 2020 were the focus of the last Supervisory Board meeting on Decem-ber 12, 2017. The committees also reported on their work at this meeting. Another report was presented to the Supervisory Board on the customer centric organization. The Executive Board additionally
reported on the situation at KUKA Systems Augsburg. As a further item on the agenda, the Executive Board outlined the status of the post-merger integration for each of the recent acquisitions. This Supervisory Board meeting was continued in another session on December 19, 2017, when the budget for 2018 and medium-term planning up to 2020 were again up for discussion.
The written resolutions related to the original declaration of compli-ance and the declaration regarding corporate governance, and – after his court appointment as a member of the Supervisory Board – the appointment of Mr. Alexander Liong Hauw Tan to the Audit Committee.
All members of the Supervisory Board except Mr. Hongbo (Paul) Fang and Ms. Tanja Smolenski participated in more than half of the plenary and committee meetings (German Corporate Governance Code, sec-tion 5.4.7) in the year under review. Unless indicated otherwise, the Supervisory Board met in the presence of the Executive Board except when matters of its remuneration were on the agenda (German Cor-porate Governance Code, section 3.6, para. 2).
Further aspects of corporate governance can be found in the report of the same name which forms part of the annual report.
The Supervisory Board has the following committees: Personnel Com-mittee (chaired by Dr. Yanmin (Andy) Gu), Audit Committee (chaired by Mr. Alexander Liong Hauw Tan), Strategy and Technology Commit-tee (chaired by Prof. Dr. Henning Kagermann) and Mediation Commit-tee pursuant to section 27 para. 3 of the German Co-Determination Act (chaired by Dr. Yanmin (Andy) Gu). A Nomination Committee has also been established in accordance with section 5.3.3 of the German Corporate Governance Code.
The Personnel Committee met twice. Both meetings addressed the Executive Board’s compensation. One of the meetings also involved a discussion about the reappointment of the Executive Board members and the reorganization of their employment contracts.
The Audit Committee had six meetings. The financial statements of KUKA Group and KUKA AG were discussed regularly. The audit plan for 2017 and the risk atlas were also addressed. Another subject of the discussions was the new CSR reporting. The company’s Chief Compliance Officer also reported to the Audit Committee.
The Nomination Committee held one meeting and discussed the nomination for the Supervisory Board’s shareholder representative candidates to be elected by the Annual General Meeting.
There was no occasion to convene the Mediation Committee.
The Strategy and Technology Committee was convened four times. Top-ics relating to Industrie 4.0 such as the KUKA Connect roadmap as well as human-robot collaboration and service /consumer robotics were on the agenda. The LBR iisy was a subject of discussion once again.

Supervisory Board report
11
Independence and conflicts of interest, declaration of complianceIn the past, a report was presented at this point on the Supervisory Board members Dr. Hubert Lienhard, Dr. Friedhelm Loh and Mr. Bernd Minning in the context of their other relationships to KUKA share-holders and /or the business relationships of their companies with KUKA companies. On the one hand, there have been no more relevant shareholdings in KUKA Aktiengesellschaft since the completion of the Midea takeover bid on January 6, 2017 and, on the other hand, the aforementioned gentlemen resigned from their offices in Janu-ary 2017, as stated above.
The Supervisory Board members Dr. Yanmin (Andy) Gu, Mr. Hongbo (Paul) Fang, Ms. Min (Francoise) Liu and Mr. Alexander Liong Hauw Tan have employment contracts with Midea Group, which holds a 94.5% stake in KUKA. Dr. Yanmin (Andy) Gu and Mr. Hongbo (Paul) Fang also hold positions on boards within this group.
No conflicts of interest were reported in the year under review.
The Supervisory Board and the Executive Board submitted identical declarations in accordance with section 161 of the German Stock Corporation Act (AktG). The resolutions were initially made by the Executive Board and the Supervisory Board on February 8, 2017. An amended declaration of compliance was issued by the Executive Board on March 20, 2017 and by the Supervisory Board on March 21, 2017. The declarations of compliance were made permanently available to shareholders on the company’s website.
Work with the auditors
The annual financial statements of KUKA Aktiengesellschaft as of December 31, 2017 and the consolidated financial statements of KUKA Group as of December 31, 2017, as well as the consolidated Management Report of KUKA Aktiengesellschaft and KUKA Group, including the bookkeeping, were audited by auditors KPMG Aktien-gesellschaft, Wirtschaftsprüfungsgesellschaft, Berlin, which issued an unqualified audit opinion in each case on February 23, 2018. The auditors also checked the monitoring system as per section 91 para. 2 of the German Stock Corporation Act (AktG), the purpose of which is the early detection of developments that could threaten the compa-ny’s existence. KUKA Group’s mid-year report dated June 30, 2017 was also reviewed by the auditors. KUKA Aktiengesellschaft’s consolidated statements were prepared in accordance with section 315a of the Ger-man Commercial Code (HGB) based on the International Accounting Standards (IFRS) as adopted by the European Union.
The Supervisory Board’s Audit Committee appointed the external auditors, KPMG, as per the resolution at the Annual General Meet-ing of May 31, 2017. During the course of appointing the auditors of the financial statements of the company and the Group, the chair of the Audit Committee and the Chairman of the Supervisory Board conducted a review with the auditors regarding key audit issues, scope and fees. The auditors agreed to immediately inform the chair of the Audit Committee about any disqualification or bias issues encountered during the audit, provided such disqualification or bias issues could not immediately be resolved. The auditors also agreed to report on an ongoing basis during the audit all material findings and developments arising during the audit that were within the scope
of the Supervisory Board’s responsibilities. Furthermore, the audi-tors were instructed to inform the Supervisory Board, or note in the audit report, if information was encountered during the audit that was contrary to the declarations released by the Executive Board and Supervisory Board as per section 161 para. 1 sentence 1 of the German Stock Corporation Act (AktG).
Finally, the Audit Committee obtained the arm’s length declaration of the auditors in accordance with section 7.2.1 para. 1 of the GCGC and monitored the auditors’ independence.
As was the case in previous years – always in respect of different matters – focal points were defined for the audit in the 2017 fiscal year, namely, in relation to the consolidated financial statements, the assessment and completeness of the information pursuant to IFRS 3 from business transactions in 2017, the capitalization of internally generated intangible assets, especially software, the recognition, val-uation and disclosure of finance leases in which KUKA is the lessor, the valuation, disclosure and completeness of long-term personnel provisions such as pensions, partial retirement, etc., the internal (risk) reporting and evaluation of toxic projects, the Group tax rate, the forecast report of KUKA Group as well as, in relation to the indi-vidual statements of KUKA AG, the valuation of investments and the forecast report of KUKA Aktiengesellschaft. The auditors found no major issues regarding these items.
Because they had been contracted to review the June 30, 2017 mid-year financial report, the auditors attended the Audit Committee meeting on July 31, 2017.
In a joint meeting with the auditors on March 7, 2018, the Audit Com-mittee reviewed the two sets of financial statements for fiscal 2017, taking into consideration the auditors’ reports. The Executive Board and the auditors presented the highlights of the financial reports to the panel. The Audit Committee members reviewed, discussed and checked in detail the documentation relating to the financial statements and discussed the audit report in depth with the audi-tors. The auditors answered the questions posed by the Audit Com-mittee members. The Audit Committee reported to the Supervisory Board on the results of its discussions during the board’s meeting on March 21, 2018 and recommended that the board approve KUKA Aktiengesellschaft’s annual financial statements and KUKA Group’s consolidated annual financial statements for fiscal 2017.
The full Supervisory Board reviewed the draft annual financial state-ments and the Executive Board’s recommendation on appropriation of net income on March 21, 2018. The auditors, KPMG, attended the Supervisory Board meeting in order to report on material findings in the audit and to provide additional information. All members of the Supervisory Board were in possession of the audit reports provided by the auditors. KPMG explained in detail the financial position and per-formance of the company and the Group. The auditors also reported that there are no material weaknesses in the internal controlling of the accounting system or the risk early detection system. The board and the auditors jointly reviewed and discussed the financial state-ments and KPMG answered all questions posed by the Audit Com-mittee. The audits of the KUKA Aktiengesellschaft and KUKA Group annual financial statements for 2017 were thus fully comprehensible.

KUKA Aktiengesellschaft | Annual Report 2017
12
Furthermore, in the meeting on March 21, 2018, the Sustainability Report for 2017 pursuant to section 315b para. 3 of the German Com-mercial Code (HGB), prepared for KUKA Group for the first time, was examined by the plenum following discussion by the Audit Commit-tee. There were no objections.
Finally, in view of Midea’s shareholder status (94.55%), the Supervi-sory Board had to address the dependency report for 2017 prepared by the Executive Board pursuant to section 312 of the German Stock Corporation Act (AktG). This report was also reviewed by KPMG in its role as auditor. Following preparatory discussion by the Audit Com-mittee, the Supervisory Board conducted a further review. All reviews confirmed the Executive Board’s final declaration that, with regard to the business relationships with Midea companies in the 2017 fiscal year, appropriate compensation was received and KUKA companies did not suffer any disadvantages therefrom.
2017 financial statements adopted
After completing its own review of the financial statements for 2017 for KUKA Aktiengesellschaft and KUKA Group, and with full knowl-edge and consideration of the Audit Committee report, the auditors’ reports and the explanations provided, the Supervisory Board raised no objections to the results and concurred with the auditors’ findings at its meeting on March 21, 2018. In the opinion of the Supervisory Board, the auditors’ reports comply with the legal requirements stipu-lated in sections 317 and 321 of the German Commercial Code (HGB).
The Supervisory Board is satisfied that the combined Management Report compiled for KUKA Aktiengesellschaft and KUKA Group is complete. The assessments made by the Executive Board in the Management Report are in agreement with its reports to the Super-visory Board, and the statements made in the combined Management Report are also in agreement with the Supervisory Board’s own evalu-ations. At the conclusion of its review, the Supervisory Board found no cause to raise objections to the combined Management Report. The Supervisory Board also reviewed the Group’s Sustainability Report at its plenary meeting and did not raise any objections.
In its financial statements meeting on March 21, 2018, the Super-visory Board therefore approved KUKA Aktiengesellschaft’s financial statements for fiscal 2017 as prepared by the Executive Board. The annual financial statements are thereby adopted.
The Supervisory Board also approved KUKA Aktiengesellschaft’s con-solidated financial statements and the Corporate Governance report for the 2017 fiscal year as prepared by the Executive Board.
The Executive Board recommended that a dividend of €0.50 per common share entitled to dividends be paid from the balance sheet profit and the balance be carried forward. We reviewed this recom-mendation and endorsed it.
Thanks to the staff
2017 was another year characterized by significant growth for KUKA in which the ambitious budget value for revenues was exceeded and a solid EBIT was achieved. As a result, the dividend can remain unchanged this year. This is attributable not just to the Executive Board, but to all KUKA Group employees.
The Supervisory Board is therefore especially grateful to all staff of KUKA companies for their outstanding commitment. The employees worked hard to achieve a positive business performance in 2017 and prepared the company for the future. However, the Supervisory Board also extends its thanks to the members of the Executive Board, the CEOs of the Group companies and the employee representatives. All have contributed impressively to the success of the company through their efforts and to the welfare of its customers and shareholders.
Augsburg, March 21, 2018The Supervisory Board
Dr. Yanmin (Andy) GuChairman

Corporate Governance report
13
Corporate Governance reportThe Executive Board and Supervisory Board report below on corporate governance at KUKA in accordance with section 3.10 of the German Corporate Governance Code (GCGC).
Corporate governance refers to the entire system of managing and monitoring a company and group of companies. This includes in par-ticular a company’s organization, business policy and guidelines as well as internal and external control and monitoring mechanisms. Good, responsible corporate governance is one of KUKA’s core prin-ciples. It creates transparency and confidence in KUKA among share-holders, customers and suppliers, the staff, the financial markets and the public.
Again for this reporting year, the Executive Board and Supervisory Board of KUKA Aktiengesellschaft have examined the requirements of the GCGC in detail in its current version as of February 7, 2017 and issue the following declaration of compliance:
Declarations of complianceThe declarations of compliance of the Executive Board and Supervisory Board that have been issued for every financial year since 2002 are available to the public on the company’s website at www.kuka.com.
The identical declarations of the Executive Board dated Febru-ary 5, 2018 and the Supervisory Board dated February 15, 2018 in accordance with section 161 para. 1 sentence 1 of the German Stock Corporation Act (AktG) and the GCGC read as follows:
“Since issuing the latest declarations of compliance of the Executive Board (March 20, 2017) and of the Supervisory Board (March 21, 2017), KUKA Aktiengesellschaft has complied with the recommendations of the Government Commission on the German Corporate Governance Code as on February 7, 2017, which were published in the Bunde-sanzeiger (German Federal Gazette) dated April 24, 2017, with the exception of the divergences mentioned in these declarations of compliance; it will continue to comply with these recommendations in the future subject to the following divergences:
1. KUKA Aktiengesellschaft does not follow the recommendation for the Supervisory Board outlined in section 3.8 para. 3 of the GCGC. The Group D&O insurance policy does not provide for a deductible for members of the Supervisory Board. In KUKA Aktiengesellschaft’s view, Supervisory Board members do not require a deductible to ensure that they properly fulfill their monitoring role.
2. KUKA Aktiengesellschaft does not follow the recommendation for the chair of the Audit Committee outlined in section 5.3.2 para. 3 of the GCGC. The chairman of the Audit Committee is not to be regarded as an independent member within the meaning of section 5.4.2 of the GCGC because this person performs a management role for the shareholder controlling
KUKA Aktiengesellschaft. As the Deputy CFO of the Midea Group, the chairman of the Audit Committee possesses special knowl-edge and experience in the application of accounting principles and internal control procedures.
KUKA Aktiengesellschaft adheres to almost all the other suggestions contained in the Code.”
The identical declarations of the Executive Board and Supervisory Board have been available on the company’s website at www.kuka.com since February 23, 2018.
Corporate and management structureSince January 6, 2017, Midea Group Co., Ltd. (through wholly-owned subsidiaries) has held 94.55% of the shares in KUKA Aktien gesellschaft. KUKA Aktiengesellschaft and its subsidiaries and affiliates form a “sub-group” (hereinafter “KUKA Group”) within the Midea Group.
KUKA Group is managed by KUKA Aktiengesellschaft as the Group’s managing holding company. Up to the end of fiscal 2017, KUKA Group consisted of the Robotics, Systems and Swisslog divisions. Systems engineering and the Solutions business of KUKA Industries (includ-ing Reis) were allocated to the Systems division. As of fiscal 2018, the operating business units are organized in divisions (segments) corresponding to the new customer centric organization (CCO). The individual divisions in the new CCO structure are (i) Automotive, (ii) Industries, (iii) Consumer Goods & Logistic Automation, and (iv) OMP (Operating /Manufacturing /Purchase). These new divisions combine the business activities previously carried out by the individual busi-ness units in a way that is more customer-oriented, thereby enabling KUKA’s entire product portfolio to be offered to customers from a single division.
Similarities between the divisions in terms of product portfo-lios, markets, customers and geographic focus are identified, and intense efforts are made to further develop these similarities. This is an expression of the “ONE KUKA” approach. However, the divisions remain responsible for their business and thus also for their results. Moreover, as in the past, project and risk managers monitor imple-mentation of the established targets by focusing intensively on key indicators, as well as developing executive staff and maintaining brand strategy.

KUKA Aktiengesellschaft | Annual Report 2017
14
Executive Board and Supervisory Board
As a German stock corporation, the statutory rules impose on KUKA Aktiengesellschaft a dual management system comprising the Exec-utive Board and Supervisory Board. The Executive Board is responsi-ble for managing the company. The members of the Executive Board share this responsibility for company management. The Chairman of the Executive Board and Chief Executive Officer coordinates the work of the entire Board; he is responsible for representing and leading the Board in its cooperation with the Supervisory Board and its members. The Supervisory Board appoints, monitors and advises the Executive Board. The Chairman of the Supervisory Board coordinates the work of the Supervisory Board.
Responsible cooperation between the Executive Board and the Supervisory BoardThe common goal of the Executive Board and Supervisory Board is to sustainably increase shareholder value. To this end, the Executive Board and Supervisory Board work closely together in the interest of the company. No former members of the Executive Board sit on the Supervisory Board. The Executive Board reports to the Supervisory Board regularly, in a timely manner, and comprehensively regarding all matters relevant to the company with respect to planning, business development, risk exposure, risk management and any correspond-ing action taken. The Executive Board also addresses any deviations in the business results from the established plans and targets and explains the causes of such deviations. The Executive Board and /or Chief Compliance Officer also reports to the Supervisory Board regarding corporate compliance. The Articles of Association and the Supervisory Board’s rules of procedure contain provisions ensuring the right of the Supervisory Board to withhold its consent on sig-nificant transactions. Further information on cooperation between the Executive Board and the Supervisory Board can be found in the Supervisory Board report on pages 8 to 12.
In fiscal 2017, no consulting or other contracts for work or services existed between Supervisory Board members and the company.
We refer you to the report of the Supervisory Board (page 8 et seq.) with regard to resolutions passed concerning business events during fiscal 2017 where conflicts of interest could have arisen for members of the Executive and Supervisory Boards.
Executive BoardThe Executive Board of KUKA Aktiengesellschaft consists of two per-sons: the Chief Executive Officer (CEO) and the Chief Financial Officer (CFO). KUKA Aktiengesellschaft’s Articles of Association expressly state that the Executive Board may consist of two persons (section 6 para. 1 of the Articles of Association).
In fiscal 2017, the responsibilities of the members of the Executive Board were assigned as follows:
Dr. Till Reuter, Chief Executive Officer (CEO), is responsible for (i) investor relations, (ii) strategic corporate development, (iii) public relations, (iv) senior Group executives, (v) internal audit, (vi) per-sonnel and (vii) legal affairs /compliance. Dr. Reuter is also director of industrial relations at KUKA Aktiengesellschaft.
Mr. Peter Mohnen, Chief Financial Officer (CFO), is responsible for (i) finances and controlling, which includes the financial accounting, controlling, treasury and tax departments, (ii) risk management, (iii) IT and (iv) facility management.
The Executive Board members normally convene at least every 14 days, and otherwise keep in constant close contact.
In accordance with the recommendations of the GCGC (section 4.1.5), the Executive Board takes diversity into consideration when filling managerial positions in the company and, in particular, aims for an appropriate consideration of women. The Executive Board sets targets for the proportion of women at the two management levels below the Board itself (page 10).
Executive Board compensation
Executive Board compensation is outlined in the compensation report.
Supervisory BoardKUKA Aktiengesellschaft’s Supervisory Board consists of twelve mem-bers as per the Articles of Association, of which six represent the shareholders and six the employees.
The election of employee representatives to the Supervisory Board was held on April 18, 2013. The results of the vote were published in the Federal Gazette (Bundesanzeiger) on April 24, 2013. A new election of shareholder representatives to the Supervisory Board was held at the Annual General Meeting on May 31, 2017.
The term of office of the employee and shareholder representatives ends upon adjournment of the Annual General Meeting in 2018. This also applies to substitute members and other successors in office of employees and shareholders who subsequently join the Supervisory Board. This is because section 10 para. 4 sentence 1 of the Articles of Association stipulates that where a Supervisory Board member leaves office early, the term of office of the new Supervisory Board member runs only for the remaining term of office of the retiring member.

Corporate Governance report
15
This specifically relates to two employee representatives who were appointed to the Supervisory Board by order of the Augsburg Local Court dated September 10, 2013 and December 8, 2017 respectively. In addition, six shareholder representatives were elected at the Annual General Meeting held on May 31, 2017 to sit on the Supervisory Board for the remainder of the term of office of the members who have retired or were previously appointed by court order.
The Supervisory Board established the following targets for its future makeup to address the requirement regarding diversity in section 5.4.1 of the GCGC, which are also to be taken into account when recommending candidates to the shareholders at the Annual General Meeting:
(i) At least two Supervisory Board members shall have sector- specific experience.
(ii) At least one Supervisory Board member shall have considerable professional experience abroad.
(iii) At least two Supervisory Board members to be elected at the Annual General Meeting shall be independent in terms of sec-tion 5.4.2 of the GCGC and shall not be affected by conflicts of interest in terms of section 5.5.2 of the GCGC.
(iv) Normally, Supervisory Board members shall be no younger than 35 and no older than 73 years of age at the time of their election.
(v) A member of the Supervisory Board may carry out his or her mandate for up to a maximum of three consecutive periods in office, although this limit may be ignored in exceptional cases when it is in the company’s interests to do so.
(vi) In addition, the requirements of the German act to promote equal participation of women and men in management posi-tions in the private and public sector (FührposGleichberG) of April 24, 2015 and the targets set by the full Supervisory Board concerning the number of women are to be observed.
In view of the criteria for independence as specified in section 5.4.2 of the GCGC, it should be noted that on account of their manage-ment roles within the Midea Group the Supervisory Board members in office for fiscal 2017 (i) Dr. Yanmin (Andy) Gu, (ii) Hongbo (Paul) Fang, (iii) Min (Francoise) Liu and (iv) Alexander Liong Hauw Tan cannot be regarded as independent according to the definition in section 5.4.2 of the GCGC. In contrast, the members (i) Professor Dr. Michèle Morner and (ii) Professor Dr. Henning Kagermann are independent as defined in section 5.4.2 of the GCGC, thus meeting the requirement for at least two independent Supervisory Board members who have been elected by the Annual General Meeting.
To the extent that members of the Supervisory Board held or hold key positions with important business partners, transactions with them were subject to the standard terms and conditions for arm’s length transactions.
The Supervisory Board has formed five committees consisting of Supervisory Board members. These are:
(i) the Mediation Committee as per section 27 para. 3 of the German Act on Company Co-Determination (MitbestG),
(ii) the Personnel Committee,
(iii) the Audit Committee (section 5.3.2 GCGC),
(iv) the Nomination Committee (section 5.3.3 GCGC), and
(v) the Strategy and Technology Committee.
In accordance with the provisions of the Corporate Governance Code, the Supervisory Board or the Audit Committee dealt with compliance issues, and the Executive Board reported to this committee accordingly.
It has been agreed with the independent auditor that the Supervisory Board should immediately be notified of any material findings or occurrences related to its work that arise in the course of auditing the financial statements. Finally, it was also agreed with the independ-ent auditor that the independent auditor will inform the Supervisory Board and /or note in its audit report any finding of facts during the performance of the audit indicating that the declarations issued by the Executive Board and the Supervisory Board with respect to the Code are in any way incorrect (section 7.2.3 GCGC). As stipulated in the audit contract, the auditor reviewed the interim report as of June 30, 2017.
The Supervisory Board regularly reviews the efficiency of its activi-ties (section 5.6 GCGC). It most recently reviewed the “Best Practice Scenarios” presented to it.
Supervisory Board compensation
Supervisory Board compensation is also outlined in the compensation report.

KUKA Aktiengesellschaft | Annual Report 2017
16
ShareholdingsThe current members of the Executive Board and Supervisory Board together hold less than 1% of the shares in circulation. The overall investment in KUKA shares held by the remaining members of the Executive and Supervisory Boards is also less than 1% of the compa-ny’s shares in circulation.
Members of the Executive and Supervisory Boards or related parties are obliged according to section 19 of the Market Abuse Regulation (MAR) to disclose the purchase or sale of shares in KUKA Aktien-gesellschaft, or financial instruments relating thereto, if the value of these transactions within one calendar year reaches or exceeds the sum of €5,000. The transactions by persons with management roles or their related parties reported to KUKA Aktiengesellschaft in fiscal 2017 were duly published and can be examined on the company website at www.kuka.com.
Corporate complianceKUKA has always applied a high standard of ethical principles. Essen-tial components are strict obedience to the law and value-oriented conduct. These form the basis of the Corporate Compliance Program adopted by the Executive Board in November 2007 and approved by the Supervisory Board in December 2007, which took effect through-out the Group on February 1, 2008. The key contents of the Corpo-rate Compliance Program are contained in the Corporate Compliance Handbook, which comprises several compliance-related guidelines. The Corporate Compliance Handbook was revised and updated in fiscal 2010. It was again reviewed and updated in fiscal 2013 and the version now applicable is dated April 1, 2013. Various guidelines were adapted as of April 1, 2016 so as to adjust to the altered conditions. The handbook was also made more attractive and usable. This new version of the Compliance Handbook was issued to all employees worldwide.
The Executive Board passed a resolution making the CEO ultimately responsible for the Corporate Compliance Program. A Compliance Committee consisting of persons employed by the Group was estab-lished to steer, implement, monitor and develop the Corporate Com-pliance Program. In addition, compliance officers were established at the Group companies for the individual divisions and regions under the Compliance Committee. The compliance officers are intended to be the employees’ direct and (first) point of contact for compli-ance-related issues. The position of external ombudsman has also been established.
KUKA endeavors to implement compliance together with all employ-ees and external partners. To achieve this goal, various processes and measures are employed which jointly represent the KUKA Compliance Management System (CMS). According to the GCGC recommenda-tions, the KUKA CMS has been recorded in writing and is available for examination by the public on the website at www.kuka.com. As a result of the regular changes occurring in the field of compliance, the CMS is a dynamic system and is therefore continuously being adapted to suit any relevant changes.
For KUKA, regular training of its employees is key to anchoring our val-ue-based standards in the company and avoiding any violations of law. For example, since 2011, all KUKA employees have regularly partici-pated in online compliance training based on an in-house e-learning program designed especially for this purpose. The e-learning program was progressively expanded to include the foreign Group companies.
In fiscal 2016, the “Corporate Compliance” e-learning program was revised. Participation in this revised version of the e-learning program is obligatory for all employees throughout the world.
An offline version has also been produced for issue to all employees worldwide who do not have their own e-mail address and are there-fore unable to participate in digital forms of training. In this manner, all employees are now being consistently reached at their place of work, and awareness of corporate compliance is consequently being fostered throughout the Group.
The company also held a series of seminars on selected topics. These include, for example, worldwide face-to-face training in competi-tion law.
Annual General MeetingThe 2018 Annual General Meeting will take place in Augsburg on June 6, 2018.
Each share is entitled to one vote. No-par-value shares have been issued and global certificates created. The shares are bearer shares. The Executive Board makes it easier for shareholders to exercise their voting rights at the Annual General Meeting by offering them the right to issue powers of attorney to proxies who are appointed by the company and bound by the instructions of the shareholder. The proxies appointed by the company are also available at the Annual General Meeting to the shareholders who are present. In addition, powers of attorney may be issued to financial institutions, share-holder associations or other third parties.

Corporate Governance report
17
Accounting and annual auditSince 2004, the annual financial statements of KUKA Group have been prepared in accordance with the International Accounting Standards (IAS) and the International Financial Reporting Standards (IFRS) as adopted by the European Union. An independent auditor elected at the Annual General Meeting audits the annual financial statements and the consolidated financial statements. At the recommendation of the Supervisory Board, shareholders at the 2015 Annual General Meeting chose KPMG AG Wirtschaftsprüfungsgesellschaft, Berlin, as auditor for the annual financial statements and Group auditor for fiscal 2017 as well as for a potential review of the mid-year report for fiscal 2017. The mid-year report for fiscal 2017 was reviewed by the auditor based on the aforementioned resolution.
In accordance with the provisions of the Corporate Governance Code, the Supervisory Board’s Audit Committee reviewed the independence of the auditor, commissioned the auditor to carry out the audit, deter-mined the key audit points and agreed on the fee.
Opportunity and risk management, controlling
Opportunity and risk management at KUKA Group is described in the risk report included in the annual report on pages 51 to 56. In accordance with legal requirements, the aim of risk management is early identification of any risk that could jeopardize the existence of KUKA Group and its operating companies as going concerns to enable measures to minimize, transfer or avoid risk to be taken. The risk strategy and risk policy is guided in particular by business risks, financial risks (including currency risks), and the specific risks of the divisions – in each case from a short, intermediate and long-term perspective. Controlling in particular is an essential tool for efficient risk management at KUKA Group.
KUKA further optimized opportunity and risk management in 2017. The Executive Board is tasked with adapting opportunity and risk man-agement to changes in the business environment on an ongoing basis.
Financial publicationsThe company informs its shareholders, participants in the capital markets, and the media of its position and of significant business events, in particular by publishing quarterly financial reports, a mid-year financial report, and a business report, holding a financial statements press conference on the annual financial statements and conducting the Annual General Meeting each year. In addition, it issues ad-hoc releases under article 17 of the Market Abuse Regu-lation (MAR), notifications under article 19 of the MAR (Managers’ transactions) and under section 26 of the WpHG (disclosure of notifi-cations by shareholders and holders of certain financial instruments), holds conferences with analysts, meets with analysts and investors in Germany and abroad, and issues other press releases.
All information is published in both German and English and is also available on the company’s website from the time of publication. All regular financial reporting dates are published in the company’s financial calendar, which can be found on the back cover page of the annual report and on the website at www.kuka.com.
Declaration regarding corporate governance
The corporate governance declaration as per section 289f of the Ger-man Commercial Code (HGB) is posted on the company’s website at www.kuka.com.

KUKA Aktiengesellschaft | Annual Report 2017
18
Compensation reportThe compensation report summarizes the basic principles used to deter-mine the compensation of the Executive and Supervisory Boards of KUKA Aktiengesellschaft and describes the structure and compensation of the members of the Executive and Supervisory Boards. The compen-sation report is an integral part of the combined Management Report.
Executive Board compensation
1. Compensation structure
KUKA Aktiengesellschaft’s Executive Board compensation contains fixed and variable components. The latter consist of several variable compensation elements. The Executive Board compensation system thus conforms with section 87 of the German Stock Corporation Act (AktG) and the requirements of the GCGC regarding sustainable cor-porate performance. The variable components take into consideration both positive and negative business developments.
The fixed compensation consists of a base salary and payments in kind. The base salary is paid in twelve equal monthly installments. The payments in kind made to Executive Board members consist mainly of the non-cash benefits for the provision and use of a company vehicle. The Executive Board members also receive fixed compensation – not deductible from the compensation paid by KUKA Aktiengesellschaft – for their activities as members of the administrative board of Swisslog Holding AG as of April 1, 2017. This is paid out by Swisslog Holding AG pro rata at the end of each quarter.
One half of the variable compensation is based on the achievement of personal targets and the other half is dependent on the perfor-mance of KUKA Group’s key indicators, EBIT and free cash flow. The associated details are agreed separately each year. The variable com-pensation component is capped (maximum target achievement of 200%) and achievement of the financial targets is linked to business performance over several years.
In addition, annual allocation volumes for participation in phantom share programs (hereinafter also referred to as the “programs”) are stipulated for members of the Executive Board as a further variable compensation component designed to provide a long-term incen-tive for the period up to and including 2016. Phantom shares are virtual shares that grant the holder the right to a cash payment in the amount of the company’s applicable share price. In contrast to stock options, the proceeds from phantom shares reflect not only the increase in share value, but also the full value of the stock. Moreover, a dividend equivalent that mirrors the actual dividend distributed on real KUKA shares is paid annually during the life of the plan for each virtual share held. There are no voting rights associated with phantom shares.
The programs each run for three financial years. The allocation volume is either already contractually agreed or is set by the Supervisory Board before the respective three-year period commences. The allocation volume divided by a reference price for the KUKA share then results in a provisional number of phantom shares. The Supervisory Board has calculated the provisional number of phantom shares for the last program, covering the years 2016 – 2018, based on the average price of the KUKA share (opening price in Xetra trading on the Frankfurt Stock Exchange) between January 4, 2016 and March 7, 2016 (the last trading day prior to the Supervisory Board’s financial review meeting). The relevant price thus determined for the KUKA share is €77.53.
The Supervisory Board also establishes an EVA (economic value added) for continuing operations (before taxes) at the beginning of the three-year performance period. The EVA is based on the opera-tional planning for the three years of the program, which is geared towards the budget for the first financial year of the three-year period and the projections for the two subsequent financial years.
The cumulative EVA (actual EVA) for the three-year performance period is divided by the EVA for continuing operations in accord-ance with the operational planning for the three program years in order to determine a success factor. The success factor may fluctuate between 0 and 2.0. The final number of phantom shares depends on the success factor achieved, which is multiplied by the provisional number of phantom shares. The upper limit for the final number of phantom shares is capped at twice the number of provisional shares, which would constitute a success factor of 2.0. Payment is based on the final number of phantom shares at the final price of the KUKA share (average price of the KUKA share between January 2 of the year subsequent to the three reference years (“subsequent year”) and the day prior to the financial review meeting of the Supervisory Board in the subsequent year).
In the event that an Executive Board member’s contract is termi-nated – regardless of which party initiates the termination – all phan-tom shares allocated to that member expire. However, this does not apply if an Executive Board member uses their right to step down from their place on the Board owing to a change of control at the company. In this case, a proportionate payment is made in accordance with the terms and conditions of the phantom share program.
The relevant Executive Board member is obliged to purchase a certain number of KUKA shares from the gross proceeds paid out on the basis of the programs, in order to build up a holding volume of 50% of the annual base remuneration (fixed annual remuneration) in the year of allocation. Until the holding volume has been built up, 25% of the gross amount paid out for the relevant year must be spent on pur-chasing KUKA shares. The purchase amount is retained from the net proceeds. The obligation ends with the participant’s departure from KUKA Group. In the context of the Midea takeover bid, the Executive Board was relieved of its holding obligation by the Supervisory Board in relation to the shares currently held. Furthermore, following the Midea takeover bid the Supervisory Board also relieved the Executive Board of its holding obligation relating to the 2014 – 2016 phantom share program.
Compensation report
19
The payment amounts (to be paid out in 2018 and 2019 respectively) for the 2015 – 2017 and 2016 – 2018 phantom share programs were limited for the first time to an amount equal to three times the allo-cation volume.
In place of the previous phantom share programs, the members of the Executive Board have been entitled to participate in long-term incentive plans (hereinafter “LTIPs”) with annual allocation volumes since 2017. The LTIPs are variable compensation components with long-term incentives.
The LTIPs cover a period of three financial years. The allocation volume is either already contractually agreed or is set by the Supervisory Board before the respective three-year period commences.
At the start of the three-year performance period, the Supervisory Board also determines the key indicators and specifications for the target values of the success factors for the LTIP concerned. The rele-vant factors are (i) the performance factor and (ii) the strategy factor.
The key indicator for the performance factor is the EVA over the performance period. The EVA in this context is the Group EBIT (on a consolidated basis) less minimum interest (9%) on the Group’s capital employed. The Supervisory Board stipulates the target values at its discretion, divided into (i) minimum target, (ii) target and (iii) maximum target. The minimum target corresponds to a performance factor of 0.50, the target to a performance factor of 1.00 and the maximum target to a performance factor of 1.50.
The relevant key indicators for the strategy factor are determined by the Supervisory Board at its discretion. The Supervisory Board also defines the target values for each key indicator. The minimum target corresponds to a strategy factor of 0.00, the target to a strategy factor of 1.00 and the maximum target to a strategy factor of 2.00.
The gross disbursement amount is calculated by multiplying the individual allocation value, performance factor and strategy factor for the performance period.
Under specific conditions defined in the LTIP, entitlement to payment of the gross disbursement amount may be waived in full or limited pro rata temporis.
Both the phantom share programs still in effect and the LTIP are lim-ited in terms of amount, with the effect that the total Executive Board compensation (fixed annual salary, variable bonuses and payments from a phantom share program or LTIP) is limited as of 2018 by the accumulation of caps on individual items.
The employment contracts of Executive Board members contain “sev-erance payment caps”. This means that a restriction is agreed upon in the event of the employment contracts being terminated prematurely without good cause in relation to potential severance payments. The regulations specifically stipulate that the settlement shall not exceed the compensation value for the remaining term of the employment contract, restricted to twice the annual compensation.
The employment contracts of Executive Board members additionally contain change-of-control clauses. In the event of a change in control within the company (sections 29 para. 2 and 30 WpÜG), the Executive Board members are entitled to terminate the employment contract within three months of the change in control occurring, subject to a notice period of three months. In the event of a termination, the Exec-utive Board members will be entitled to a severance payment, which is measured against the compensation due for the remainder of their contract, but is restricted to twice the annual compensation at most.
No loans were granted to Executive Board members during the year under review.
2. Compensation for 2017
Executive Board compensation for fiscal 2017 is disclosed for each individual member in accordance with the standardized reference tables recommended in the GCGC. Following this, the compensation is disclosed separately according to “granted benefits” (table 1) and “actual inflow” (table 2). The target values (payment for 100% target achievement) and the minimum and maximum values achieved are also disclosed for the benefits.
Payments granted to members of the Executive Board – taking into account the actual inflow – totaled €6,690,000 in fiscal 2017.

KUKA Aktiengesellschaft | Annual Report 2017
20
Table 1: Executive Board compensation for 2017 – Overview of benefits
in € thousands
Dr. Till ReuterCEO
Peter MohnenCFO
FY 2016 FY 2017 FY 2017 (min)
FY 2017 (max)
FY 2016 FY 2017 FY 2017 (min)
FY 2017 (max)
Fixed compensation 600 775 775 775 425 575 575 575
Fringe benefits 1 25 25 25 25 31 31 31 31
Other compensation 2 300 300 300 – 150 150 150
Subtotal 625 1,100 1,100 1,100 456 756 756 756
One-year variable compensation 3
Bonus 350 475 0 950 225 288 0 575
Multi-year variable compensation
Company targets bonus for 2016 4 350 – – – 225 – – –
Company targets bonus for 2017 5 – 475 0 950 – 288 0 575
Phantom share program 2016 – 2018 6 452 – – – 283 – – –
Long-term incentive plan 2017 – 2019 7 – 500 0 1,500 – 300 0 900
Total 1,777 2,550 1,100 4,500 1,189 1,631 756 2,806
Pension cost 0 0 0 0 0 0 0 0
Total compensation 1,777 2,550 1,100 4,500 1,189 1,631 756 2,806
1 The fringe benefits include expenses and non-cash benefits for the provision of company cars and insurance allowances. The premium for D&O insurance is included in the fringe benefits because, unlike the accident insurance, it cannot be allocated individually, as the company pays a lump-sum premium for the insured group of persons which goes beyond the members of the Executive Board.
2 Compensation for activities as administrative board members of Swisslog Holding AG
3 Variable compensation paid out during the fiscal year
4 Proportion of variable bonus for achieving personal targets (with 100% target achievement) in the specified fiscal year (possible target achievement from 0 to 200%).
5 Deferred percentage (50%) of variable bonus (with 100% target achievement) for the specified fiscal year.
6 Allocation value on the date the phantom share program was established by the Supervisory Board. The price of the KUKA share on this date is multiplied by the provisional number of phantom shares. The share price for the phantom share program 2016 – 2018 was €87.67 (XETRA closing price on March 8, 2016).
7 Allocation values for the long-term incentive plan 2017 – 2019

Compensation report
21
Table 2: Executive Board compensation for 2017 – Overview of inflow
in € thousands
Dr. Till ReuterCEO
Peter MohnenCFO
FY 2016 FY 2017 FY 2016 FY 2017
Fixed compensation 600 775 425 575
Fringe benefits 1 25 25 31 31
Other compensation 2 156 340 0 150
Subtotal 781 1,140 456 756
One-year variable compensation 3
Bonus 542 392 439 383
Multi-year variable compensation
Company targets bonus for 2014 4 694 – 421 –
Company targets bonus for 2015 4 – 452 – 290
Phantom share program 2013 – 2015 5 1,406 – 804 –
Phantom share program 2014 – 2016 5 – 1,928 – 1,339
Other share-based compensation 6 11 6 7 4
Total 3,434 3,918 2,127 2,772
Pension cost 0 0 0 0
Total compensation 3,434 3,918 2,127 2,772
1 The fringe benefits include expenses and non-cash benefits for the provision of company cars and insurance allowances. The premium for D&O insurance is included in the fringe benefits because, unlike the accident insurance, it cannot be allocated individually, as the company pays a lump-sum premium for the insured group of persons which goes beyond the members of the Executive Board.
2 Compensation for activities as administrative board members of Swisslog Holding AG. In fiscal 2016, Dr. Reuter received compensation in the amount of CHF 170,000 (at an exchange rate of €1 = CHF 1.0902 (average rate in 2016) this amounted to €155,935 for 2016). The compensation paid to Dr. Reuter by Swisslog Holding AG in fiscal 2016 amounting to €155,935 counted towards his bonus for fiscal 2016 (disbursed in April 2017). For his activities on the administrative board of Swisslog Holding AG, Dr. Reuter received compensation of CHF 42,500 at the end of the first quarter of fiscal 2017 (at an exchange rate of €1 = CHF 1.0707 at March 31, 2017 this corresponds to €39,694), which counts towards his bonus for fiscal 2017 (to be disbursed in April 2018). Furthermore, for their membership in the administrative board of Swisslog Holding AG, Dr. Reuter received compensation of €300,000 and Mr. Mohnen compensation of €150,000 which will not be offset against other payments.
3 Variable compensation paid out during the fiscal year
4 Deferred proportion of variable compensation from the 2014 and 2015 fiscal years, which was paid out in the 2016 and 2017 fiscal years.
5 Phantom share program 2013 – 2015 payout at a final price of €77.53 (average KUKA share price (opening price in XETRA trading on the Frankfurt Stock Exchange) between January 4, 2016 and March 7, 2016). In the payout for the phantom share program 2014 – 2016, the final price was set at €115.00 on account of the takeover bid of Midea Group and the obligations to purchase KUKA shares were lifted. The amounts paid out each represent the gross proceeds. The net payout results from the gross proceeds less taxes and social contributions, other statutory levies and the purchase price for actual KUKA shares.
6 Payout of dividend equivalents in 2016 of €0.50 per provisional share from the phantom share programs 2014 – 2016, 2015 – 2017, 2016 – 2018 and in 2017 of €0.50 per provisional share from the phantom share programs 2015 – 2017 and 2016 – 2018.
Provisions taking the relevant total expected expense into account were recognized as at December 31, 2017 for all phantom share pro-grams in effect on that date and that have yet to be paid out (i.e. the 2015 – 2017 and 2016 – 2018 programs) and for the ongoing LTIP (2017 – 2019) that has yet to be paid out.
Apart from a few exceptions, former Executive Board members whose terms of office ended no later than 2008 were granted company pen-sion benefits that included old age, professional and employment disability, widows’ and orphans’ pensions. The total sum for the pro-visions recognized in 2017 for current pensions and expected pen-sion benefits for this group of persons totaled €9,824,000 (German Commercial Code) (2016: €10,041,000). The retirement benefits paid in this connection amounted to €0.9 million (2016: €0.8 million).

KUKA Aktiengesellschaft | Annual Report 2017
22
Supervisory Board compensation
1. Compensation structure
Based on a resolution at the company’s Annual General Meeting on January 1, 2006, the Articles of Association were amended to include fixed compensation for members of the Supervisory Board.
In addition to reimbursement of expenses, each member of the Supervisory Board is paid a fixed amount of €30,000, payable at the end of the fiscal year.
The chair of the Supervisory Board is paid four times that amount, and the deputy chair receives double the compensation. Supervisory Board members receive additional compensation of €30,000 for membership in any committee that is not of an interim nature, but at most for three committee memberships. A committee chairman additionally receives half the annual compensation even if he chairs more than one committee. This does not apply to the committee pursuant to section 27 para. 3 of the German Act on Company Co- Determination.
In addition, for each Supervisory Board meeting (including meetings of Supervisory Board committees), each Supervisory Board member is reimbursed for appropriate expenses incurred or is given a lump-sum payment of €450 per meeting (plus the applicable value added tax). The employee representatives on the Supervisory Board who are employed by KUKA Aktiengesellschaft or a KUKA Group company are still entitled to their regular salaries based on their employment contracts.
2. Compensation for 2016 and 2017
The following table compares the net compensation paid to members of the Supervisory Board in the 2016 and 2017 financial years:
Table 3: Supervisory Board compensation in 2017
in € thousandsPayment in
2017 for 2016 1Payment in
2018 for 2017
Dr. Yanmin (Andy) GuChairman of the Supervisory Board Chairman of the Personnel Committee, Mediation Committee and Nomination Committee(from February 10, 2017) 0 199
Bernd Minning Chairman of the Supervisory Board and Chairman of the Personnel Committee, Strategy and Development Committee, Mediation Committee and Nomination Committee(until February 1, 2017) 198 19
Michael Leppek 1Deputy Chairman of the Supervisory Board 123 150
Prof. Dr. Dirk Abel(until January 31, 2017) 60 5
Wilfried Eberhardt 30 30
Hongbo (Paul) Fang(from February 24, 2017) 0 26
Siegfried Greulich 1 93 96
Prof. Dr. Henning Kagermann Chairman of the Strategy and Technology Committee(from May 31, 2017) 0 44
Thomas Knabel 1 24 0
Armin Kolb 1 76 90
Dr. Constanze Kurz 1(from May 27, 2016 to Novem-ber 14, 2017) 35 33
Carola Leitmeir 1 76 90
Dr. Hubert Lienhard(until January 10, 2017) 60 2
Min (Francoise) Liu(from February 10, 2017) 0 74
Dr. Friedhelm Loh(until January 27, 2017) 60 4
Prof. Dr. Uwe LoosChairman of the Technology and Production Committee(until February 28, 2017) 91 17
Prof. Dr. Michèle Morner(from February 10, 2017) 0 53
Tanja Smolenski 1(from December 14, 2017) 0 1
Alexander Liong Hauw Tan(from February 24, 2017) 0 86
Hans Ziegler(until December 1, 2016) 83 0
1 The employee representatives on the Supervisory Board who are also members of IG Metall have declared that they shall pay their Supervisory Board compensation to the Hans Böckler Foundation in line with the guidelines of the Federation of German Trade Unions.

KUKA and the capital market
23
KUKA and the capital marketKUKA shareThe upward trend on the stock markets continued in 2017. The growth in Europe was supported by the loose interest rate policy of the European Central Bank (ECB) after the ECB left the key interest rate unchanged at 0.0%. The development in Europe was also influenced by the presidential election and economic recovery in France, the officially declared exit of the United Kingdom from the EU and the parliamentary election in the Netherlands. The parliamentary election in Germany and the difficult formation of a government, on the other hand, had minimal impact on the stock exchange.
The euro-dollar exchange rate started at a low of EUR /USD 1.0412 at the beginning of the year. The euro regained strength over the course of the year and was listed at EUR /USD 1.2022 in September. The US tax reform passed in December 2017 did not have a lasting impact on the exchange rate, with the euro listed at USD 1.2005 at year-end – an appreciation of 14.5% against the dollar year-on-year.
In Germany, the MDAX, on which the 50 medium-sized German stocks are listed, improved by 18.1% from 22,189 points (year-end 2016) to 26,201 points (year-end 2017).
The KUKA share (WKN: 620440, ISIN: DE0006204407) began the year 2017 at €88.55 and rose continuously. The share reached its peak and an all-time high of €248.90 on October 24, 2017. The price subsequently dropped and reached €121.15 on December 29, 2017, an increase of 36.8% compared to the beginning of the year. KUKA developed very positively in its peer group (companies that have a similar business base and are of a comparable size). The share prices within the peer group developed in a range between 4.7% and 44.1%.
MECCA International (BVI) Limited, a Midea Group company, pub-lished a voluntary public takeover bid in 2016 in the form of a cash offer to the shareholders of KUKA AG to acquire all no-par-value bearer shares of KUKA with a pro rata amount of share capital of €2.60 per share in return for payment of a cash consideration of €115 per KUKA share tendered for sale. A total of 81.04% of KUKA shareholders tendered their shares. Along with the KUKA shares already held by Midea, Midea’s stake has since amounted to 94.55%. The remaining 5.45% are in free float. Even after completion of the takeover bid, the KUKA share is still traded over-the-counter on the stock exchange and belongs to the HDAX, CDAX and Prime All Share indices.
2013 2014 2015 2016 2017
Weighted average number of shares outstanding millions of shares 33.92 34.17 36.14 39.60 39.78
Earnings per share € 1.72 1.99 2.39 2.19 2.22
Dividend per share € 0.30 0.40 0.50 0.50 1 0.50
High for the year (closing price) € 38.50 62.51 85.59 110.00 248.90
Low for the year (closing price) € 26.40 33.85 56.86 68.10 87.38
Closing price for the year (closing price) € 34.05 58.98 83.05 88.55 121.15
Change year-on-year % 23.1 73.2 41.0 6.6 36.8
Market capitalization (Dec. 31) € millions 1,154 2,106 3,198 3,506 4,819
Average daily volume No. of shares 144,000 157,000 156,000 83,000 14,000
1 Subject to approval by shareholders at the Annual General Meeting on June 6, 2018
KUKA share price performance January 1 – December 31, 2017 1
300
250
200
150
100
50Jan May SepMar Jul NovFeb Jun OctApr Aug Dec
KUKA MDAX 1 December 30, 2016 = 100, stock performance indexed, Xetra stock price

KUKA Aktiengesellschaft | Annual Report 2017
24
Consolidated financial reportGroup basis 25
Group structure and business activities 25
Robotics division 25
Systems division 25
Swisslog division 26
Markets and competitive positions 26
Corporate strategy 27
Financial control system and objectives 29
Achievement of targets 29
Research and development 30
Procurement 32
Economic report 33
Macroeconomic and industry conditions 33
Business performance 34
Financial position and performance 36
Notes to the financial statements of KUKA Aktiengesellschaft 45
Non-financial key performance indicators 47
Forecast, opportunity and risk report 51
Opportunity and risk report 51
Forecast 56
Internal control and risk management system 59
Disclosures in accordance with sections 315b, 315c, 289c, sections 315d, 289f and section 15a para. 1 of the German Commercial Code (HGB) including accompanying explanations 61

Consolidated financial report
25
Group basis
Group structure and business activities
In the year under review, KUKA Group consisted of KUKA Aktienge-sellschaft and the Robotics, Systems and Swisslog divisions. KUKA Aktiengesellschaft headquartered in Augsburg is the Group’s holding company and is responsible for managing corporate activities within the group of companies. The management of the individual divisions coordinates the operational business activities in the respective segments. The divisions operate globally and are supported by their regional subsidiaries in both their sales efforts and their assembly and field service work.
KUKA is one of the world’s leading specialists in automation. Its aim is to support its customers in the overall optimization of their value added by providing comprehensive automation and digitiza-tion know-how. As a global technology corporation, KUKA offers its customers everything they need from a single source: from the core component – the robot – to cells, turnkey systems and networking. Through its advanced automation solutions KUKA contributes to increased efficiency and improved product quality for its customers. Industrie 4.0 is bringing digital, networked production, flexible man-ufacturing concepts and logistics solutions, as well as new business models to the fore. With its decades of experience in automation, in-depth process know-how and cloud-based solutions, KUKA ensures its customers are well ahead of the competition.
The Robotics division develops, manufactures and distributes the core component for automation – the robot. In addition to the man-ufacture of industrial and service robots, it also focuses on robot control and software along with the analysis and use of big data in production operations. Robotics additionally offers its customers a wide range of services.
The core competence of the Systems division (with KUKA Industries) lies in customized solutions for the automation of manufacturing pro-cesses. Systems plans and implements automated systems for its cus-tomers, and upgrades existing systems to increase sustainability and efficiency. The focus is on major projects for the automotive industry and production-intensive industries. KUKA bundles this expertise of cell business and in-depth process know-how within the KUKA Industries business unit, which forms part of the Systems division.
The Swisslog division has two units: Healthcare Solutions imple-ments automation solutions for forward-looking hospitals in order to sustainably increase efficiency and improve patient care. In the logistics segment the Warehouse and Distribution Solutions unit supplies automated, robot-based and data-controlled intralogistics systems, covering the spectrum from planning to implementation and service. By combining Swisslog logistics solutions with the robotic automation solutions of the other divisions of the Group, KUKA as an automation powerhouse offers new possibilities of flexible auto-mation along the entire value chain.
Robotics division
The core component for automating manufacturing processes is provided by the Robotics division, which produces industrial robots together with controllers and software. The broad product portfo-lio covers payload ranges from 3 to 1,300 kg. This enables KUKA to meet the various requirements of its customers optimally. Most robot models are developed, assembled, tested and shipped in Augsburg. The control cabinets are produced in two Hungarian plants, in Tak-sony and Füzesgyarmat. For the Asian market, KUKA also produces robots and control cabinets at its Chinese plant in Shanghai. The KUKA Colleges provide technical training courses for customers at more than 30 sites worldwide.
KUKA Robotics is continuously expanding its range of products so as to offer customers from all kinds of sectors the solutions that are appropriate for them and to allow even small and medium enterprises to use robots economically. Research and development has an impor-tant role to play here. KUKA’s new products and technologies open up additional markets and create new applications for robot-based automation.
Open networking and collaboration are the core ideas of Industrie 4.0, the production of the future. This paradigm shift is already underway today, indeed the company is consciously forcing the pace. After all, robots will play the key role in the factory of the future. By taking these measures, industrial nations will be able to expand their com-petitiveness and, at the same time, counteract demographic change. Industrie 4.0 is neither a Big Bang nor a buzzword that is devoid of meaning; instead, it is a sustainable investment in our future.
With a focus on digital business transformation, the KUKA Mar-ketplace offers customers a zero touch IoT solution for smart pro-duction – KUKA Connect. KUKA Connect is a cloud-based software solution, enabling users to access and analyze their KUKA robots at any time and from anywhere. KUKA Connect allows customers to bring their product to market faster, adapt to regulatory require-ments, increase efficiency and, even more importantly, introduce innovations quickly. The KUKA Marketplace enables customers to not only search for and buy the latest KUKA products, it also makes available user manuals and videos for additional information.
Systems division
The Systems division offers customers complete tailor-made solutions for automating manufacturing processes. It plans, designs and builds automated production systems. The range covers the entire value chain of a system: from individual system components, tools and fixtures to automated production cells and even complete turnkey systems. The division’s expertise lies in automating individual pro-duction processes such as welding and joining, processing various materials and integrating different production stages to form a fully automatic system.

KUKA Aktiengesellschaft | Annual Report 2017
26
The Systems division supplies large-scale automated lines principally to the automotive industry for body-in-white production as well as assembling engines and transmissions. Markets in Germany and else-where in Europe are served from Augsburg, while the Greater Detroit area in the USA is responsible for the North /South America region and Shanghai in China handles the Asian market. Automated assem-bly lines and test rigs for engines and transmissions are designed at and supplied from the Systems sites in Bremen, Greater Detroit /USA and Shanghai /China. Systems also operates a production plant for the entire body of Chrysler’s Jeep Wrangler (KTPO) in Toledo /USA. As well as the automotive industry, more and more other sectors are coming to rely on the expertise that Systems has acquired over many years in the automation business.
KUKA bundles this expertise of cell business and in-depth process know-how within the KUKA Industries business unit, which forms part of the Systems division. At its sites worldwide, KUKA Industries offers its customers innovative joining and machining technologies, laser welding and special welding processes, as well as all the process steps in the foundry sector and in photovoltaic and battery produc-tion. KUKA Industries is an expert in process- and customer-oriented cells and solutions, from the initial idea to production support, for customers in the automotive, consumer goods, energy & storage and electronics industries as well as many other sectors.
Swisslog division
With its Swisslog division, KUKA is opening up the growth mar-kets of e-commerce, consumer goods and healthcare in the field of intralogistics. Based in Buchs, Aarau /Switzerland, Swisslog serves customers in over 50 countries worldwide. From planning and design, through to implementation and service over the whole life cycle of the solutions, Swisslog provides integrated systems and services from a single source.
The Healthcare Solutions (HCS) unit provides automation solutions for forward-looking hospitals in order to increase efficiency in a sustained manner and improve patient care. The solutions optimize work procedures in the areas of material transport and medication management. The hospital staff can thus dedicate more of their time to personal patient care. At the same time, medication errors in the medical field are demonstrably reduced through automation.
The Warehouse and Distribution Solutions (WDS) unit implements integrated automation solutions for forward-looking warehouses and distribution centers. As a general contractor, WDS offers complete turn-key solutions, from planning through to implementation and service, employing data-controlled and robot-based automation in particular. Swisslog has an Industrie 4.0 portfolio comprising the latest intralogis-tics technologies, innovative software and a variety of services tailored to customers, covering all aspects of warehouse operation.
Markets and competitive positions
KUKA operates in a highly dynamic, innovation-driven market environ-ment, which is continuously changing and redefining itself under the influence of digitization. By digitizing their manufacturing processes, companies increase their flexibility and can react to changing market conditions.
In 2017 the automotive segment achieved about 50% of total reve-nues and therefore remains a key pillar in KUKA Group’s success. The company is the market leader in the automotive industry. There are also many opportunities to expand business in sectors outside the automotive industry, i.e. in general industry. For several years, KUKA has been successfully building up its business in this sector to reduce its dependence on automotive customers. General industry and the automotive industry contributed about equally to overall sales reve-nues during the year under review. In 2017, KUKA continued to focus on the strategic market segments of automotive, aerospace, electron-ics, consumer goods, metal industry, healthcare and e-commerce.
KUKA has a strong position on the European market. The Asia region shows considerable growth potential, particularly on the Chinese market. KUKA has been represented for years in Asia by several sub-sidiaries. Its Asian headquarters is in Shanghai. Robots are shipped to the Asian market from this location. According to a forecast from the international robotics association IFR, sales of robot units in China are set to increase by an average of 20% per year between 2017 and 2019.
KUKA Robotics
Core competencies of the Robotics division are the development, pro-duction and sale of industrial robots, controllers and software along with the analysis and use of big data in production operations. Ever more sectors are benefiting from the automation solutions, for exam-ple the consumer goods and electronics industries. KUKA Robotics is one of the leading robot manufacturers in the world, and is regarded as the market leader for industrial robotics in Europe.
KUKA Systems
KUKA Systems offers its customers tailor-made solutions for automat-ing production processes. Systems plans and implements automated systems, and converts existing systems. The company is also active in sectors outside the automotive industry. The cell business of KUKA Industries in the Systems division focuses predominantly on the auto-motive, consumer goods, energy & storage and electronics sectors.
Swisslog
Swisslog supplies customers in more than 50 countries. Healthcare Solutions implements automation solutions for forward-looking hos-pitals in order to sustainably increase efficiency and improve patient care. The Warehouse and Distribution Solutions division operates throughout the world and is a leading supplier of automated robotic and data-controlled intralogistics systems in the logistics segment. As a general contractor, WDS offers complete turnkey solutions for its customers.

Consolidated financial report
27
Corporate strategy
KUKA operates in a highly dynamic, innovation-driven market envi-ronment, which is continuously changing and redefining itself under the influence of digitization. Robot-based automation represents a global trend.
Industrie 4.0, the digital networking of automated production, is gain-ing ever more importance. KUKA’s aim is to support its customers in the overall optimization of their value added by providing compre-hensive automation and digitization know-how. KUKA is therefore continuously supplementing its automation expertise with know-how in relation to cloud-based networking of machines and systems as well as data analytics. This is one of the topics addressed by the US development site in Austin, Texas. KUKA also enters into partnerships with start-ups and established companies, such as Roboception or Device Insight, to strengthen its own ability to innovate.
An important aspect in the course of digitization is working on new business models. The KUKA start-up subsidiary connyun is developing a platform that is designed to offer customers an entire ecosystem for new business models. These models will fundamentally and per-manently transform not only production in the future, but also the value creation process as a whole. In addition, an Industrie 4.0 team supports customers with their digitization tasks and in doing so is leveraging the potential of digitization for KUKA.
The “KUKA 2020” program comprising several projects supports the implementation of strategy internally and also pursues the aim of making KUKA’s own corporate structures and employees fit for digitization. For example, the company now features a standard IT architecture, and structures and processes are being harmonized worldwide in the context of global business process management.
KUKA 2020 is also enhancing the corporate culture. Employees com-municate via the digital social business platform “Chatter” across all divisions and national borders, and are networked in work groups, thereby promoting global cooperation.
Important foundations were also laid for a strongly customer-ori-ented organization in the year under review. KUKA is increasingly positioning itself as a solution provider for robot-based automation with this customer centric organization. KUKA supports its customers on the road to automation and digitization with the relevant expertise spanning from components, cells and systems or logistics solutions to their integration into the world of IT. Corporate management and reporting are being adapted in accordance with the new organiza-tional structure in the new fiscal year.
KUKA’s website presents this structure to the outside world, provid-ing customers and visitors with an overview of the entire company’s comprehensive expertise. Via the KUKA Marketplace developed and introduced during the year under review, customers set out on their own “customer journey”. This enables them to become part of the digital KUKA world and to procure products and services from KUKA through the Internet.
KUKA is focusing on three strategic initiatives to ensure its long-term success:
1. Expansion of leadership in technology and innovation
KUKA stands for innovations in automation and is a driver of Indus-trie 4.0. Together with customers and partners, KUKA is developing smart products and solutions for the intelligent factory of the future.
With a new generation of robots that are sensitive and can work hand in hand with humans, KUKA is setting new trends in robotics. Enhanced with mobility and autonomous navigation, robots are being transformed into flexible production assistants that are becoming more and more intelligent. The trend is towards robots that are simple to program, flexible to deploy and easily integrated and networked. In KUKA Connect, KUKA has placed an innovative product on the market which enables customers from a vast range of sectors to network machines and systems in the cloud digitally. With the help of data-based analysis, customers can track their energy consumption or the maintenance intervals in their own production facilities, for example. With the start-up subsidiary connyun, KUKA is developing a platform that is designed to help partner companies to collaborate in creating an ecosystem. Digitization is paving the way for new business models that KUKA is developing together with its customers.
The Industrie 4.0 team advises and supports customers on the way to digitization with the aim of establishing an ecosystem for customers and their production environment.
2. Diversification of business operations in new markets and regions
KUKA is a market leader in the automotive industry. There are also many opportunities to expand business in sectors outside the auto-motive industry, i.e. in general industry.
The focus markets addressed by KUKA are especially important because their growth and profit potential is high. The degree of auto-mation in these sectors is still relatively low, particularly as compared with the automotive industry. KUKA’s aim is to support its customers in the holistic optimization of their value creation processes by pro-viding automation and digitization expertise. This enables processes to be designed for greater efficiency and flexibility. Additionally, it optimizes resource and energy consumption while raising quality. With various acquisitions and their integration, KUKA has selectively expanded its know-how, making use of it to strengthen its own mar-ket position.
In 2017, KUKA further intensified its focus on the following strategic market segments with the customer centric organization:
AutomotiveThe automotive industry has always been of great significance for KUKA. It is a very important driver of technology and innovation. The German premium brands in particular play a key role here. The auto-motive segment currently accounts for about 50% of revenues. KUKA will continue to grow around the world with its automotive customers and support them as a partner in automation and digitization.

KUKA Aktiengesellschaft | Annual Report 2017
28
ElectronicsThe electronics industry is one of the most versatile sectors of modern industries. It embraces not only the production of electrical house-hold appliances, so-called white goods, but also cutting-edge technol-ogies such as solar cells, precision medical equipment or electronic automotive and aerospace components. And of course industrial electronics, such as chip production or display manufacture, is also a major part of the electronics sector. The most important submarket with the highest revenues is the 3C market (computers, communica-tions and consumer electronics). The electronics industry will expe-rience a significant rise in the number of new robots deployed in the coming years. The trend of recent years will thus continue unabated.
Metal industryKUKA can draw on many years of experience in the metalworking industry. In arc welding or laser welding, but also in the foundry industry, customers benefit from KUKA’s expertise.
Consumer goodsRobots have been efficiently and successfully supporting the pro-duction of fast-moving consumer goods (FMCG) for many years, especially in the food and beverage industry, but also in shoe or tex-tile production, cosmetics and pharmaceuticals. New generations of robots that are sensitive and mobile, and thus able to work hand in hand with humans, are opening up new applications along the process chain.
E-commerceElectronic commerce results in large quantities of varied goods being sent to consumers via goods distribution centers – volumes which in the long term can only be catered for through automation. The e-commerce segment is therefore an important sales market for smart logistics concepts combined with innovative, robot-based automation.
HealthcareAutomation solutions ensure greater efficiency in hospitals and improve work procedures. The workload on nursing staff is thus reduced, enabling them to concentrate more on patient care in the future. Solutions from Swisslog help modern hospitals and other healthcare facilities with efficient material transport and manage-ment of medicines.
KUKA has a strong position on the European market. The company sees growth potential in the expansion of global sites, particularly those in the high-growth regions of Asia and North America. The pri-mary focus here is on the potential of the Chinese market. According to a forecast of the International Federation of Robotics (IFR), the Chinese market is expected to undergo strong growth in the coming years. Sales of robot units in China are predicted to increase by an average of more than 20% per year between 2018 and 2020.
China is already the largest growth market worldwide. This is an opportunity which KUKA has been able to grasp during the year under review. Midea, the new majority shareholder, supports this strategic approach and is smoothing the way by facilitating KUKA’s access to the Chinese market.
KUKA has been represented for many years by several subsidiaries in Asia and has greatly expanded its presence on the Chinese market in recent years. The headquarters for its Asian business are in Shanghai, where a hub bundling various functions was established in 2016.
3. Continuous establishment of sustainable and efficient cost structures
In order to support profitable growth and thereby secure long-term competitiveness, various measures are being implemented in the field of operational excellence.
Power ON is a key initiative which, over the coming years, will opti-mize and harmonize procedures, organization and relevant company software across all divisions and core functions. This included a cur-rent release of the enterprise resource planning (ERP) system SAP S /4 HANA being introduced in two operating companies at the Augsburg site, in our headquarters and in the Romanian plant at Sibiu during the year under review. The Group’s own warehouse management sys-tem “WM6” from Swisslog, a new project lifecycle management (PLM) system and a business warehouse (BW) system were implemented at the same time. A new ERP system based on these globally harmonized processes was also launched at the sales companies in Mexico, Malay-sia and Thailand and at our Internet of Things subsidiary connyun. Further roll-outs are also scheduled for several locations in 2018.
In the course of the system roll-outs, the organization in the affected companies was adapted to the new processes, and new functions were introduced. These include the Data Steward Organization and the Project Management Office. It is our declared goal to maintain the high data quality that has been reached in the long term so as to fur-ther enhance the level of efficiency and to create new business mod-els (such as in customer service or in the context of Industrie 4.0).
The global implementation of our new customer relationship man-agement (CRM) system was completed in the year under review. As a result, all customers worldwide are administered on a single platform and can be served from a single source and in the best quality very much in line with the philosophy of ONE KUKA.
This makes Power ON an important basis for the new customer centric organization (CCO) and our sustainable growth strategy.

Consolidated financial report
29
Financial control system and objectives
The Group’s strategy is aimed at sustainably increasing the enter-prise value. The internal Group management and monitoring of the business performance is based on various key financial performance indicators. KUKA Group’s financial targets are also key performance indicators (KPIs) that track the enterprise value of the company.
The most important KPIs for KUKA Group are revenues, EBIT, ROCE and free cash flow. The development of these variables is presented in the “Business performance” section starting on page 34 and under “Financial position and performance” from page 36. Earnings before interest and taxes (EBIT) are compared to sales revenues to determine return on sales. This results in the EBIT margin. EBIT is compared to average capital employed to determine the return on capital employed (ROCE). EBIT and ROCE are determined for KUKA Group and the divisions. Free cash flow – cash flow from operating and investment activities less capital spending – shows whether the investments can be funded from cash flow, and how much cash is available to pay a dividend and service debt.
These key indicators are components of the target and remunera-tion system in place at KUKA Group and are published. This ensures that all employees share the same goals. Please see the glossary that begins on page 128 for definitions of key performance indicators.
In the medium term, in other words between three and five years, KUKA is planning with revenues of between €4 – 4.5 billion and a target EBIT margin in excess of 7.5%. Currently, the largest share of revenues of around 40% is generated in Europe. KUKA plans to further expand activities in Asia and expects about 30% of revenues to be generated there in the medium term. The ability to reach these targets is largely dependent on the expertise and dedication of our employees. This is why it is essential for KUKA to be an attractive employer globally.
An important early indicator of business performance for mechanical and systems engineering companies is the volume of orders received. Order backlog for a certain period is determined by subtracting sales revenues from orders received during that time. Order backlog is a key indicator of the expected utilization of operational capacities in the coming months. Orders received and order backlog are determined for KUKA Group and for the divisions.
All key indicators are continuously tracked and reviewed by KUKA Group’s management companies and its corporate accounting and controlling departments. Management analyzes any deviations from plan and decides on the necessary corrective actions required to achieve the targets.
Key performance indicators for KUKA Group over 5-year period
in € millions 2013 2014 2015 2016 2017
Sales revenues 1,774.5 2,095.7 2,965.9 2,948.9 3,479.1
EBIT 120.4 141.8 135.6 127.2 102.7
ROCE (in %) 36.9 28.9 20.0 16.2 10.9
Free cash flow 95.4 -172.2 95.7 -106.8 -135.7
Achievement of targets
In its outlook in the 2016 annual report and at the annual results press conference on March 22, 2017, the Executive Board forecast sales revenues for 2017 of around €3.1 billion and an EBIT margin in excess of 5.5% before purchase price allocations and growth investments.
KUKA Group was able to surpass the forecast revenue target for 2017. Exceptional costs amounting to almost €40 million at KUKA Systems meant that it was not possible to achieve the planned EBIT margin.
Good levels of demand were expected for 2017 overall, especially from China and North America. A slight increase in demand was antici-pated for Europe as a whole. From a sector perspective, a positive development was predicted for the general industry market. Demand in the automotive industry was expected to remain stable.
On publication of the results for the first half of 2017, the revenue target for 2017 was raised to about €3.3 billion on account of the positive business development in the first six months of the year.
The forecast for sales revenues in 2017 was increased to around €3.45 billion in January 2018. The expectation for the EBIT margin (before purchase price allocations and growth investments) was reduced to approximately 4.3%. In connection with individual projects in the Systems division and with measures for increasing profitabil-ity at KUKA Systems, an impact on earnings in the order of around €40 million was expected for the 2017 fiscal year.
2017 target values
Sales revenues EBIT margin
Annual results press conference for the full year 2016 ~ €3.1 billion > 5.5% 1
1st quarter 2017 ~ €3.1 billion > 5.5% 1
2nd quarter 2017 ~ €3.3 billion > 5.5% 1
3rd quarter 2017 ~ €3.3 billion > 5.5% 1
Ad hoc January 2018 ~ €3.45 billion ~ 4.3% 1
1 Before purchase price allocations and growth investments amounting to approximately €45 million
In the year under review, the target value forecast for sales revenues and increased in January 2018 was met. The Group generated sales revenues of €3,479.1 million (2016: €2,948.9 million). All three divi-sions were able to increase their revenues. The EBIT margin before purchase price allocations and growth investments was 4.3%. The operational objective for 2017 was not achieved due to the aforemen-tioned impact on earnings.
The Robotics division reported an EBIT of €133.1 million in 2017, thus exceeding the previous year’s level of €100.7 million. The EBIT margin was 11.1% compared with 10.1% in 2016. Particularly the improved cost allocation due to the increase in revenues had a positive effect here.

KUKA Aktiengesellschaft | Annual Report 2017
30
The EBIT margin in the Systems division declined from 6.5% in 2016 to 1.1%. Individual projects subject to losses and measures for increasing profitability in the Systems division produced an impact on earnings amounting to around €40 million.
Swisslog recorded an EBIT margin of 1.4% compared to the 2016 result of 0.8%. Adjusted for the effects of purchase price allocation, the margin was 2.9%.
In the year under review, KUKA generated net income of €88.2 million, higher than that of the previous year (2016: €86.2 million). Capital expenditure was €138.8 million (2016: €99.6 million). This reflects the continuing high level of investment in research and development to lay the groundwork for future growth.
Free cash flow in the 2017 fiscal year was negative, amounting to -€135.7 million. An improvement in free cash flow before financial investments was forecast compared to the previous year’s value of -€106.8 million. The development is primarily attributable to the increase in the cash flow from investment activities.
For detailed information, please refer to the chapter “Financial posi-tion and performance” from page 36 onwards.
Research and development
The area of research and development (R & D) is of crucial importance for KUKA as an innovative technology enterprise. That is why KUKA invested heavily in this area once again in the year under review. Research and development expenditure amounted to €128.7 million in 2017, higher than the value for the same period of the previous year (2016: €126.6 million).
R & D expenditure is attributable predominantly to the Robotics division. In the year under review, a total of 160 patent applications were filed by Robotics, and 154 patents were granted. Swisslog filed 12 patent applications and 15 patents were granted. Systems mainly carries out research and development activities within the framework of customer projects. A total of 33 patent applications were filed and 99 granted here.
During the year under review, KUKA focused on key technologies for Industrie 4.0 such as human-robot collaboration and mobility. At the major flagship industrial fairs, KUKA showcased digitization solutions and application examples for networking in the cloud, big data and the smart factory.
Corporate research
KUKA’s Corporate Research is active on a Group-wide scale and devel-ops technologies for future-proof products and solutions of the Group companies. Corporate Research focuses on the areas of intuitive oper-ation and programming; algorithms, sensor technology and geometry as well as on the fields of mechatronics, safety, energy efficiency and smart data /infrastructure. The integration of technology develop-ments into demonstrators allows for customer-focused evaluation. In research cooperation projects, Corporate Research works closely with universities and renowned institutions around the world to jointly implement ground-breaking ideas in the fields of automation technology and robotics.
Five teams of finalists in the “KUKA Innovation Award”, an innovation competition initiated by KUKA, demonstrated their “Advanced Mecha-tronics” applications with the LBR iiwa at the KUKA booth at Han-nover Messe 2017. Dr. Bernd Liepert, KUKA Chief Innovation Officer and patron of the competition, handed over the prize of 20,000 euro to the winners at the KUKA booth. The winning team impressed the panel with an airbag system for human-robot collaboration. Further-more, in May entries were invited for the KUKA Innovation Award 2018 addressing the topic “Real-World Interaction Challenge”.
KUKA presented innovative applications along with research partners at both the IEEE International Conference on Robotics and Automa-tion (ICRA) in Singapore and the IEEE /RSJ International Conference on Intelligent Robots and Systems (IROS), demonstrating the poten-tial of the open hardware and software platforms from KUKA. The sensitive lightweight robot LBR iiwa provides dedicated interfaces for research which offer direct low-level access in real time to the KUKA robot controller with high clock rates of up to 1 kHz. This open hard-ware and software platform allows researchers to realize their ideas.
Robotics division
Volkswagen Corporate Research and KUKA are strengthening their strategic partnership in the field of service concepts for vehicles of the future. A cooperation agreement provides for joint development of robot-based innovation concepts relating to electrically powered and self-driving cars. The cooperation ties in with an existing joint research project dealing with human-robot collaboration. The “e-smart Connect” project that has now been launched consists of a practical and user-friendly solution for charging the high-voltage batteries of the electric vehicles from the Volkswagen Group. A KUKA robot inde-pendently connects the vehicle to a charging station in a specially developed application, thereby relieving the driver of this activity.
The small robots from the KR AGILUS series offer impressive speed, extreme agility in confined spaces, short cycle times and maximum precision. With effect from the end of 2017, the next generation of the KR AGILUS replaced all standard variants of the small robot. Each of the new KR AGILUS generation robots meets the requirements of protection rating IP67 and is thus protected against water spray. For applications with lubricants or coolants, there will still be a special Waterproof (WP) variant. The other variants, such as Cleanroom, Atex protection – for potentially explosive environments – and Hygienic Machine, are also still available.
KR Cybertech is suitable for a wide variety of applications with a pay-load of 8 – 22 kg. Due to its reach of 1600 – 2000 mm, the industrial robot can produce in smaller spaces and cover greater distances. It can be mounted on the floor, wall or ceiling, or at another desired angle.
The KUKA LBR Med lightweight robot is the first robotic component worldwide to be certified for integration into a medical product. The LBR Med thus enjoys a unique selling point in medical robotics. The cer-tification is based on the internationally recognized “ECEE CB Scheme”.

Consolidated financial report
31
The KMR iiwa is a mobile robot system that combines the strengths of the sensitive lightweight robot LBR iiwa and a mobile, autonomous platform. The KMR iiwa can thus be deployed in a highly flexible manner at many locations in a factory – an ideal basis for meeting the requirements of Industrie 4.0. The serial product replaced the previ-ous prototype at the end of 2017, which has already been tested by several customers. The KMP 600 and 1500 products newly developed in 2017 constitute transport vehicles (AGVs) with payloads of 600 and 1500 kg that can be used for logistics applications in all areas.
Applications give the robot the skills required for a wide range of different tasks. The next evolutionary step in spot welding technology was accomplished with KUKA.ServoGun BASIC. The start-up process has been made considerably easier and shortened by automatic pro-cedures. The target forces which must be built up for the process are achieved with high repeat accuracy without an additional force sensor being required and with external influences such as temperatures or aging barely having any impact.
The KUKA.ArcSense software option is used to enhance the portfolio in the arc welding segment to include functions for sensor-guided path correction as required to ensure the joining quality predomi-nantly in thick plate welding. The new version mainly pursues the aim of simplifying operator control of the software and extending the range of welding tasks that can be performed with it.
The KUKA.PickControl system enables the camera-supported pick & place of unsorted components on conveyor belts with one or more robots and is intended primarily for use in the consumer goods market segment. The focus here is also chiefly on a simple start-up procedure using assistants and simulations.
Dürr and KUKA have jointly developed the integrated “ready2_spray” solution for the automated application of paint. The small robot is from the KR AGILUS series and Dürr provides the application tech-nology. The pre-installed, “ready-to-paint” robot with coordinated and tested components is fully tailored to the requirements of general industry. Areas of application include the painting of wood, plastic, glass and metal. The system with its components is completed at Dürr and pre-commissioned. This means that it is ready for paint application and can be quickly installed at the customer’s premises.
With a networked robotic cell featuring two integrated Heller machin-ing centers, KUKA connects the analog and digital worlds. The cell demonstrates how a robot collaborates with two machining centers to produce robot parts. All relevant components are networked with one another and with the KUKA Cloud. The data are collected in the KUKA Connectivity Box and sent to the KUKA Cloud. This was devel-oped by connyun, a start-up and subsidiary of KUKA. Services such as authentication, management of access rights, data storage and processing, component management, predictive maintenance, and evaluation, processing and signaling of events are performed in the cloud. All data are displayed in clearly structured dashboards. In this way, operators, maintenance personnel and management have a com-plete overview of the production process as well as full control – at any time and from any location.
Swisslog division
Swisslog presented a system for fully-automated mixed carton picking and palletizing to a specialist audience for the first time at LogiMAT. Swisslog has introduced ACPaQ to help automate one of the key areas of intralogistics for successful trading enterprises: the process involves assembling mixed pallets tailored to store requirements from unmixed pallets. The innovative palletizing system combines robotics solutions for depalletizing and palletizing with the light goods ware-house technology CycloneCarrier and uses a fully-automated process controlled by the warehouse management software SynQ to ensure that cartons can be picked in the distribution centers in accordance with the store layout, product groups or classes two to three times quicker than with conventional methods.
“Synchronized Intelligence”, or SynQ for short, is the new software platform from Swisslog. It controlled and monitored all of the logistics work steps of the KUKA Smart Factory at Hannover Messe 2017. To do so, SynQ made use of an interface to communicate with the machin-ery and robots and also communicated with each customer by e-mail. The software created replenishment orders, arranged the delivery of materials and produced statistics for all of the automated processes. This ensured that the processes were transparent and verifiable.
Systems division
KUKA showcased the latest applications in the laser industry at the Laser World of Photonics and demonstrated the benefits of process-ing with lasers. The process is precise, wear-free and clean. That is why laser processing is firmly established in metalworking. With a wave-length of 10.6 micrometers, CO2 lasers are suitable for processing non-metallic materials and most plastics. For this reason, CO2 laser robots from KUKA Industries are primarily used in the automotive, consumer goods and aerospace industries for cutting and perforating thermoplastic materials, glass and carbon fiber-reinforced plastics and carbons as well as wood and other materials. New developments in laser technology also call for new safety approaches. KUKA has developed the TÜV-certified laser safety sensor LaserSpy which mon-itors the laser protection wall actively and electronically.
At the flagship trade fair Schweissen & Schneiden, KUKA showcased a comprehensive selection of robot components, welding robots, software packages and solutions. Welding expertise was demon-strated to visitors by means of an exemplary smart factory involving a simulated manufacturing scenario, the KUKA ready2_spot package for spot welding applications, and the software technology package KUKA.ServoGun BASIC.

KUKA Aktiengesellschaft | Annual Report 2017
32
Awards for KUKA products and solutionsThree KUKA products received the Red Dot Design Award in 2017. The KR 20 CYBERTECH industrial robot, the KR 3 AGILUS small robot and the VRS 30 vertical friction welding system came out on top against the competition with their first-class design.
Swisslog won the “Best Product 2017” prize in the “Software, Commu-nications, IT” category with Condition Monitoring at LogiMAT 2017. The solution concept impressed the jury of scientists and specialist journalists, as it makes a significant contribution towards rational-izing, saving costs and increasing productivity in internal logistics. Condition Monitoring is a user-friendly plug-in for the intelligent software SynQ and a component of the Cockpit Manager. Critical elements can be identified precisely and in a targeted manner in the warehouse and unexpected wear-induced system failures can be prevented. The modern data analysis offers important impetus for intralogistics towards the goal of a service-driven industry with performance-related pay-per-use business models.
The Industrie 4.0 solution KUKA SmartConnect.frictionwelding impressed the jury of VDE Verlag and Zentralverband Elektrotechnik- und Elektroindustrie e.V. (ZVEI) in 2017. The jury presented KUKA with the Industrie 4.0 Innovation Award. The software package enables the networked KUKA Genius friction welding machine to communicate in the cloud. This ensures that users have access to the machine’s data worldwide – through their laptop, tablet or smartphone.
Procurement
The global Travel and Expense Management project was launched at the beginning of 2017. Its purpose is to harmonize the procedures for travel applications, approvals, bookings and expense reporting across the entire KUKA Group. This enables significant cost reductions with regard to indirect materials to be achieved.
Procurement at Robotics
The procurement situation at Robotics is characterized in the reporting year by a substantial increase in quantities compared to the previous year. Commensurate price negotiations and volume bundling made up for the price increases caused by markedly higher raw material costs among other factors. As a result, procurement at Robotics was once again able to realize savings in the double-digit million euro range. In order to best safeguard the availability of mate-rials, specific monitoring measures were introduced and an increased logistics effort was implemented across the entire supply chain. This enabled us to address the risk associated with the increasing number of capacity bottlenecks at both suppliers and sub-suppliers. There was also a significant increase in localization in China and the supplier base was expanded considerably.
Procurement at Systems
The all-time high of the previous year (procurement volume +30%) was again achieved in the year under review. The increased capacity utilization of suppliers was taken into account through stricter dead-line management.
Simultaneously, preparations were made towards the end of the year for the changeover to SAP 4 /Hana. Procedures were further opti-mized, interfaces simplified and transparency increased, resulting in an improvement of the organization’s efficiency.
The procurement organization in Romania was reinforced in an effort to improve the cost structure. The objective is to expand sourcing and local manufacturing on site.
Strategic purchasing was further expanded with an employee for the processes and tools area. Tendering schemes pursuant to game-the-ory approaches strengthen negotiation skills and cooperation within the Group.
Procurement at Swisslog
Swisslog Warehouse and Distribution Solutions (WDS) has further intensified the cooperation it started in 2017 with the two locations of KUKA Industries in Kunshan (China) and Chomutov (Czech Republic). The ProMove product line (pallet conveyor systems) is manufactured at both locations according to Swisslog WDS specifications. In addi-tion, the CycloneCarrier (light goods shuttle), a product developed at the Technology Center site in Sipbachzell (Austria), is manufactured in Chomutov for the global market.
The savings targets formulated for the project business of the WDS unit were surpassed. Further improvements were achieved through standardizations and supplier agreements with four evaluated sup-pliers for light-goods racking solutions used in connection with the CycloneCarrier system.

Consolidated financial report
33
Economic report
Macroeconomic and industry conditions
Global economic growth set to continue in 2018
According to the International Monetary Fund (IMF) the global econ-omy grew 3.7% in the past fiscal year. This means an increase of 0.5 percentage points for 2017 compared to the previous year (2016: 3.2%). The global economy is expected to grow 3.9% in 2018 and 2019. The IMF considers the planned tax reform in the USA to be the key influencing factor that will have a positive effect on the growth prospects of the USA, Germany and the entire global economy. The expectations for the USA are 2.7% for 2018 and 2.5% for 2019. The tax relief for the companies would result in rising investments and the trading partners of the USA would benefit from this. Economic growth of 2.3% in 2018 and 2.0% in 2019 is anticipated for Germany. The eurozone is also expected to develop positively as a whole. The IMF is forecasting growth of 2.2% in 2018 and 2.0% in 2019 here. The IMF attributes this to the loose monetary policy of the Euro-pean Central Bank and stronger support for the economy worldwide through fiscal policy.
However, the IMF warned in its forecast of January 2018 that the global recovery could soon come to an end, as the current acceleration in growth is largely attributable to a combination of factors that is not of an enduring nature. The end of the loose monetary policy pursued by the central banks, for example, is looming. The IMF advises gov-ernments to make use of the currently advantageous framework con-ditions for reforms. This includes addressing structural deficiencies quickly, investing in growth-enhancing infrastructure and achieving a fairer distribution of wealth. Given the improved growth outlook, financial policy should focus more on medium-term objectives such as sustainability and an increase in potential growth.
Growth of 6.6% in 2018 and 6.4% in 2019 is expected for China. However, according to the IMF, there is likely to be a decline in growth there as soon as the government reduces its stimulus packages due to the high level of debt.
German industry has also benefited from the international upturn. The Business Climate Index of the Institute of Economic Research (ifo) is regarded as an early indicator of economic development in Germany. Registering 117.6 points last November, the ifo index reached not only the highest level in 2017 but also the highest value since reunification. Companies are therefore optimistic about the future business performance over the course of the next six months.
Significant sales growth in the automotive markets of Germany and China
According to the German Automotive Industry Association (VDA), the automotive business developed positively in 2017. Car sales in Europe increased by 3% to 15.6 million units. The improved economic situation had a positive impact here and is a reason for the increase. Car sales in Germany rose 3% to a good 3.4 million cars. This means that the German car market grew for the fourth time in succession, reaching the highest volume of this decade. The German manufac-turers produced 5.6 million cars in 2017. This corresponds to a decline of 2% on the previous year. 77.4% of all cars made in Germany were exported, which is a new record value.
Sales in China increased by 2% to 24.2 million new vehicles compared to the previous year.
Sales figures in the USA dropped slightly by almost 2% to 17.1 million new vehicles. While car sales were down slightly, the sales of light trucks experienced an increase of 2%. However, German manufac-turers saw their US sales rise by 1% compared to the previous year. They increased their shares in both the car and light truck segments. The market share of German manufacturers for electric cars even amounts to over a third. The US market is not only a strategically important market for German manufacturers but also an increas-ingly significant production location. The trend is moving towards local production, and German manufacturers are strengthening their presence in the world’s large markets.
Mechanical and systems engineering report growth
According to the German Engineering Federation (VDMA), the reve-nues in mechanical engineering will surpass the 220 billion euro mark in 2017 for the first time. The export segment made the most substan-tial contribution to this dynamic growth. Goods worth 124.4 billion euro were shipped abroad in the first nine months – an increase of 6.2% on the previous year in real terms – with the EU remaining by far the largest sales region. The VDMA considers the USA and China to be the largest single export markets for this period. The increase in exports to China was particularly substantial at 24%. A decline of 4.5% was recorded in the first nine months of 2017 for exports to the United Kingdom, the fourth largest single export market. This was caused by the developments relating to Brexit. The VDMA is predict-ing production growth of 3% and expecting an increase in revenues to more than 230 billion euro for the 2018 fiscal year. According to the VDMA, there was a 10% increase in orders in the robotics and automation sectors over the period from January to December 2017.
+2.0
Chin
a
Ger
man
y
Russ
ia
Euro
pe
USA Br
azil
+9.4
+3.0+3.3
-1.9
+11.9
Source: IMF, January 2018
2017 car sales by region /country Change year-on-year in %

KUKA Aktiengesellschaft | Annual Report 2017
34
Growth potential in robotics and automation due to Industrie 4.0
The worldwide trend to robot-based automation of manufacturing processes continued to gather pace in 2017. Research and develop-ment is placing pioneering technologies and products on the mar-ket, leading to new fields of application. Numerous process steps can now be automated where until recently it was hard to imagine robots could be used. Automation enables companies from different industries and small and medium-sized enterprises to make their production more efficient. The focus is on connecting the real and virtual production worlds in the context of Industrie 4.0, as well as on safe collaboration between humans and robots, and on mobile robotics. The safety factor, intuitive operation and solutions for networked digital production are playing an important role. From a regional perspective, China offers huge sales potential as the largest growth market for robotics. The reasons for this are rising labor costs, growing quality requirements and the focus on increasing efficiency and the previously low robot density.
As the global industry association, the International Federation of Robotics (IFR) estimates worldwide sales of 347,000 industrial robots for 2017. This corresponds to an increase of 18% on the previous year with 294,000 units. The IFR anticipated 230,000 industrial robots sold in 2017 for Asia /Australia, of which 115,000 are accounted for by China alone. This corresponds to a rise of 21% in Asia and an increase of even 32% in China. For 2018 to 2020, the IFR forecasts annual average growth of at least 15% worldwide. The Americas and Asia /Australia will each record growth at 15% followed by Europe with 11%. At the end of 2019 about 2.6 million industrial robots are expected to be deployed in factories worldwide, with an estimated 750,000 units used in China.
The automotive and electronics industries were among the world’s largest sales markets in 2016. While 35% of the industrial robots sold worldwide were installed in the automotive industry, the electronics industry has made further advances to 31%.
Business performance
Orders received
During the year under review, KUKA Group recorded orders received totaling €3,614.3 million. This is equivalent to a 5.6% increase on the previous year (2016: €3,422.3 million). KUKA was thus able to surpass the record set in the previous year.
Robotics increased orders received by 12.4% from €1,088.8 million (2016) to €1,223.3 million (2017). In particular, the customer seg-ments General Industry and Service recorded an increase in orders received. The Automotive segment registered a slight decline. From a regional perspective, Asia and North America have seen continued strong development. China, in particular, showed strong growth. Compared with 2016, the share increased by 7% in the year under review. In 2017, the share in General Industry rose from €444.7 million to €572.1 million. This corresponds to an increase of 28.6%. These orders are smaller orders that come from different sectors and tend to offer higher margins. Continued expansion of General Industry business remains one of the main strategic objectives of the Robotics division. In the Service segment too, orders received rose 11.4% to €224.8 million (2016: €201.8 million). This development is attrib-utable to the high demand for industrial robots. In the Automotive sector, orders received reached a value of €426.4 million and were thus slightly below the previous year’s level of €442.4 million. This is a decline of 3.6%.
During the past financial year, Systems generated orders received totaling €1,530.2 million (2016: €1,644.6 million). Compared with the previous year, this represents a decrease of 7%. One reason for this is that orders received in the Systems division fluctuate greatly. They are dependent on the time at which major contracts are awarded. Furthermore, unlike the previous year, no orders were received in the US Aerospace segment, as this business unit has been sold. In other regions such as Germany and China, orders were received from leading automobile manufacturers. In particular, the areas of Body Structure, Assembly & Test and KUKA Industries developed positively.
Orders received at Swisslog reached a value of €926.2 million in 2017 (2016: €742.6 million), thus increasing for the second year running. This corresponds to an increase of 24.7%. The Warehouse and Dis-tribution Solutions (WDS) division achieved a share of 74% and the Healthcare Solutions (HCS) division 26%. WDS benefited primarily from the high rates of growth in the e-commerce segment and the relatively low degree of automation in logistics warehouses.
221
2014
346
2017
254
2015
379 1
2018
294
2016
434 1
2019
521 1
2020
1 IFR forecast in 2017 Source: IFR World Robotics 2017
Global sales of industrial robots in thousands of units

Consolidated financial report
35
Sales revenues
In 2017, the sales revenues of KUKA Group rose from €2,948.9 million (2016) to €3,479.1 million. This corresponds to an increase of 18.0% on the previous year.
The Robotics division reported sales revenues of €1,200.6 million (2016: €993.5 million) and was thus able to increase the value by a further 20.8%. This means that KUKA Robotics has posted an increase in revenues for eight successive years. Business development in China continues to ensure high capacity utilization, with the result that the KUKA management has decided to expand production capacities there.
Systems managed to expand sales revenues from €1,395.5 million to €1,579.2 million in 2017. Despite the missing Aerospace business in the USA, Systems was thus able to achieve a significant increase of 13.2% on the previous year. The Body Structure segment in particular contributed to this.
The Swisslog division generated sales revenues of €763.7 million in 2017. This is an increase of 28.7% after €593.5 million in 2016.
Book-to-bill ratio and order backlog
The book-to-bill ratio, in other words the ratio of orders received to sales revenues, came in at 1.04 at Group level (2016: 1.16). Values around 1 represent good capacity utilization and values above 1 signify an increased volume of business. In 2017, all three business divisions achieved good figures: Robotics 1.02 (2016: 1.10), Swisslog 1.21 (2016: 1.25) and Systems 0.97, thus virtually 1 (2016: 1.18).
KUKA Group’s order backlog amounted to €2,157.9 million at year-end 2017. This was an increase of 5.3% compared to the prior-year value (2016: €2,048.9 million). The persistently high order backlog repre-sents around two thirds of annual sales revenues and will thus ensure good capacity utilization during fiscal 2018 and to some extent, in the case of long-term contracts, already for 2019 as well.
In the Robotics division, the end-of-year order backlog (not including master contracts with the automotive industry) totaled €331.2 million and was thus higher than the previous year’s value of €316.1 million.
The order backlog at Systems totaled €1,073.4 million as at the bal-ance sheet date (2016: €1,139.3 million).
Swisslog recorded an end-of-year order backlog totaling €768.3 mil-lion and was thus 23.0% higher than the comparable figure from the previous year (2016: €624.7 million).
Orders received KUKA Group, Robotics, Systems, Swisslog in € millions
2013
2014
2015
2016
2017
1,881.9 11,111.6
2,229.0 11,456.0
2,838.9 11,428.1
3,614.3 1
3,422.3 1
1,530.2
1,644.6
793.5
805.5
891.2 551.8
1,223.3
1,088.8
926.2
742.6
Robotics Systems Swisslog1 Group incl. consolidation
Orders received – Robotics Automotive, General Industry, Service in € millions
2013
2014
2015
2016
2017
318.3 144.3
327.9 162.6
339.6 177.4
426.4
442.4
224.8
201.8
330.9
315.0
374.2
572.1
444.7
Automotive General Industry Service
Sales revenues KUKA Group, Robotics, Systems, Swisslog in € millions
2013
2014
2015
2016
2017
1,774.5 11,045.9
2,095.7 11,285.6
2,965.9 11,471.7
3,479.1 1
2,948.9 1
1,579.2
1,395.5
754.1
834.6
909.6 620.8
1,200.6
993.5
763.7
593.5
Robotics Systems Swisslog1 Group incl. consolidation

KUKA Aktiengesellschaft | Annual Report 2017
36
in € millions
2016 2017
Orders received
Sales revenues
Book-to-bill ratio
Orders received
Sales revenues
Book-to-bill ratio
Group 3,422.3 2,948.9 1.16 3,614.3 3,479.1 1.04
Robotics 1,088.8 993.5 1.10 1,223.3 1,200.6 1.02
Systems 1,644.6 1,395.5 1.18 1,530.2 1,579.2 0.97
Swisslog 742.6 593.5 1.25 926.2 763.7 1.21
EBITDA and EBIT
EBITDA, in other words earnings before interest, taxes, depreciation and amortization, totaled €180.2 million, after €205.3 million in the previous year. The EBITDA margin in the year under review was thus 5.2%, having been 7.0% in 2016.
Before depreciation for purchase price allocations and before growth investment, EBIT stood at €148.3 million in 2017. This corresponds to an EBIT margin of 4.3%. The value for the previous year was €138.0 million with a margin of 4.7%.
The decline was attributable to impacts on earnings of the Systems division in the order of around €40 million in the 2017 financial year in connection with individual projects and also measures for increasing profitability at KUKA Systems GmbH.
Taking into consideration all expenditure in 2017, the earnings before interest and taxes (EBIT) for KUKA Group totaled €102.7 million (2016: €127.2 million). The corresponding EBIT margin was 3.0% in 2017 (2016: 4.3%). Expenditure for purchase price allocations totaled €13.7 million and expenditure for growth investments amounted to €31.9 million.
In 2017, EBIT at Robotics increased significantly to €133.1 million (2016: €100.7 million). Compared with the value for the previous year, this represents an increase of 32.2%. The EBIT margin was up correspondingly to 11.1% (2016: 10.1%).
Systems achieved an EBIT of €17.8 million in fiscal 2017. This was a considerable drop of 80.5% from the previous year’s value of €91.3 million. At the same time, the EBIT margin fell from 6.5% in 2016 to 1.1% in 2017. The reasons for this were impacts on earnings in connection with individual projects and also measures for increasing profitability at KUKA Systems GmbH.
In fiscal 2017, Swisslog attained an EBIT of €10.4 million compared to €4.8 million in the previous year. This resulted in an EBIT margin of 1.4% in 2017, after a figure of 0.8% in 2016. Before the depreci-ation on the purchase price allocation, Swisslog achieved an EBIT of €22.2 million in 2017 (margin: 2.9%) after €15.6 million in 2016 (margin: 2.6%).
Financial position and performance
Summary
2017 was a satisfactory year overall for KUKA Group. On the one hand, it did not prove possible to meet the earnings targets, due in particular to considerable deterioration of individual projects in the Systems division and recognition in the income statement of meas-ures to increase the profitability of KUKA Systems GmbH, Augsburg. On the other hand, however, the revenue target, which had already been raised to €3.3 billion, was surpassed by almost €200 million and the planned investments of over €30 million in areas of future growth were carried out. The order backlog of around €2.1 billion also indicates further growth in 2018.
The Swisslog division made another positive contribution to EBIT in 2017 including the negative effects of the purchase price allocation. The Robotics division achieved an absolute increase in EBIT of over 30%, thereby surpassing the previous year’s record value. These two divisions were unable, however, to compensate fully for the decline in EBIT of the Systems division and the growth investments of €31.9 mil-lion made during the financial year. KUKA thus achieved an EBIT of €102.7 million (2016: €127.2 million).
Fiscal 2017 can still be regarded as a positive year on the whole for KUKA Group.
Robotics Systems Swisslog1 Group incl. consolidation
Order backlog (Dec. 31) KUKA Group, Robotics, Systems, Swisslog in € millions
2013
2014
2015
2016
2017
991.6 1714.4
1,702.5 1955.4
1,639.0 1923.2
2,157.9 1
2,048.9 1
1,073.4
1,139.3
280.7
241.5
233.4 491.0
331.2
316.1
768.3
624.7

Consolidated financial report
37
Earnings
KUKA Group posted orders received amounting to €3,614.3 million in the year under review – another significant increase over the previ-ous year’s level (2016: €3,422.3 million). KUKA has thus managed to exceed the prior-year figures now for the fourth time running, setting a new record value in 2017.
Sales revenues up by around €200 millionSales revenues totaled €3,479.1 million and were therefore approxi-mately €200 million higher than the target of €3.3 billion.
in € millions 2013 2014 2015 2016 2017
Orders received 1,881.9 2,229.0 2,838.9 3,422.3 3,614.3
Order backlog 991.6 1,702.5 1,639.0 2,048.9 2,157.9
Sales revenues 1,774.5 2,095.7 2,965.9 2,948.9 3,479.1
EBIT 120.4 141.8 135.6 127.2 102.7
in % of revenues 6.8 6.8 4.6 4.3 3.0%
in % of capital employed (ROCE) 36.9 28.8 20.0 16.2 10.9
Growth investments and extraordinary expenses 1 – – – 28.0 31.9
EBIT adjusted 1 120.4 141.8 135.6 155.2 134.6
EBIT adjusted 1 in % of revenues 6.8 6.8 4.6 5.3 3.9
EBIT adjusted 1 in % of capital employed (ROCE) 36.9 28.8 20.0 19.8 14.2
EBITDA 158.4 185.3 259.1 205.3 180.2
in % of revenues 8.9 8.9 8.7 7.0 5.2%
Growth investments and extraordinary expenses 1 – – – 28.0 31.9
EBITDA adjusted 1 158.4 185.3 259.1 233.3 212.1
EBITDA adjusted 1 in % of revenues 8.9 8.9 8.7 7.9 6.1
(Average) capital employed 326.2 492.0 676.8 783.0 950.4
Employees 2 (Dec. 31) 7,990 12,102 12,300 13,188 14,256
1 2016: Extraordinary effect due to the takeover bid by Midea Group 2017: Growth investments
2 Figures for employees are based on the full-time equivalent throughout the annual report.
Since 2009, the Robotics division has reported annual increases in sales revenues and this trend continued in 2017. The average annual growth rate since 2009 has been 17.5%. It was possible to achieve a further 20.8% increase on the very high level of the previous year from €993.5 million to €1,200.6 million. The division’s revenues thus topped the billion euro mark for the first time. This gratifying development has been achieved in part as a result of the generally positive market environment for robotics and also by systematically focusing sales on particular customer-oriented market segments and intensifying the service business. Measures such as developing prod-ucts which are specifically aimed at certain geographical markets or customer groups are proving successful. All in all, orders received in the three segments – automotive, general industry and service – rose in comparison with the previous year and now total €1,223.3 million (2016: €1,088.8 million).
The Systems division registered a new sales record of €1,579.2 million in the past fiscal year. This is 13.2% above the previous year’s figure. Considering that the value for the previous year still included sales revenues from the US Aero sector, this represents an increase in sales of 19.6%. Orders received are also at an impressive level, totaling €1,530.2 million, even though this represents a fall compared with the previous year. All in all, the order backlog at Systems as at the
balance sheet date is thus theoretically equivalent to about 68.0% (2016: about 81.6%) of annual revenues and thus allows a high level of capacity utilization to be anticipated for 2018 as well.
The Swisslog division achieved revenues amounting to €763.7 mil-lion and thus considerably higher than in the previous year (2016: €593.5 million), with about two thirds in Warehouse & Distribution Solutions and one third in Healthcare Solutions.
KUKA saw gross earnings fall slightly by 1.6% on the previous year to €754.3 million (2016: €766.5 million). With increased sales reve-nues, the gross margin was thus 21.7% (2016: 26.0%). This decline is primarily due to the – in some cases considerable – deterioration in projects, particularly in the German systems engineering sector, and the corresponding measures taken to increase the profitability of KUKA Systems GmbH, Augsburg (totaling around €40 million). The measures are currently being implemented and will lead back to adequate margins in subsequent years – in 2017, however, they still have a negative impact on results. Furthermore, all divisions recorded an increase in the cost-of-materials ratios in the financial year, exceeding the efficiency improvements achieved by all divisions in the deployment of personnel.

KUKA Aktiengesellschaft | Annual Report 2017
38
The gross margin in the Robotics division decreased slightly from 37.0% in the previous year to 34.7% in 2017 with gross earnings of €367.5 million in 2016 and €417.0 million in 2017. Swisslog also recorded a slight decrease in the gross margin from 26.9% to 23.8% (gross earnings: 2017: €181.8 million; 2016: €159.6 million). Despite increased sales revenues, the Systems division saw a substantial decline in gross earnings from sales (2017: €154.4 million; 2016: €242.4 million), due particularly to the aforementioned project dete-rioration and profitability measures, and thereby achieved a gross margin of 9.8% (2016: 17.4%).
The key figures for the individual divisions were as follows:
Key figures – Robotics
in € millions 2013 2014 2015 2016 2017
Orders received 793.5 805.5 891.2 1,088.8 1,223.3
Order backlog 280.7 241.5 233.4 316.1 331.2
Sales revenues 754.1 834.6 909.6 993.5 1,200.6
EBIT 77.1 88.9 100.2 100.7 133.1
in % of revenues 10.2 10.7 11.0 10.1 11.1
in % of capital employed (ROCE) 49.6 53.1 56.6 51.7 56.4
EBITDA 101.9 112.0 126.1 123.2 157.2
in % of revenues 13.5 13.4 13.9 12.4 13.1
Capital employed 155.6 167.3 177.1 194.9 235.9
Employees (Dec. 31) 3,416 3,644 4,232 4,726 5,010
Key figures – Systems
in € millions 2013 2014 2015 2016 2017
Orders received 1,111.6 1,456.0 1,428.1 1,644.6 1,530.2
Order backlog 714.4 955.4 923.2 1,139.3 1,073.4
Sales revenues 1,045.9 1,285.6 1,471.7 1,395.5 1,579.2
EBIT 60.8 80.2 114.7 91.3 17.8
in % of revenues 5.8 6.2 7.8 6.5 1.1
in % of capital employed (ROCE) 43.0 67.9 87.9 42.8 6.3
EBITDA 71.0 97.4 135.6 113.5 34.5
in % of revenues 6.8 7.6 9.2 8.1 2.2
Capital employed 141.5 118.1 130.5 213.1 281.9
Employees (Dec. 31) 4,362 5,810 5,146 5,189 5,459
Key figures – Swisslog
in € millions 2014 1 2015 2016 2017
Orders received – 551.8 742.6 926.2
Order backlog 517.2 491.0 624.7 768.3
Sales revenues – 620.8 593.5 763.7
EBIT – -45.9 4.8 10.4
in % of revenues – -7.4 0.8 1.4
in % of capital employed (ROCE) – -14.5 1.5 3.0
EBITDA – 24.5 28.2 36.8
in % of revenues – 3.9 4.8 4.8
Capital employed 154.6 315.9 317.4 346.8
Employees (Dec. 31) 2,369 2,555 2,679 2,904
1 Swisslog was consolidated for the first time as of December 31, 2014.
KUKA Group’s functional costs – the costs of administration and sales as well as research and development – rose year-on-year from €622.7 million (2016) to €646.8 million (2017). These overhead costs amounted to 18.6% of sales revenues, which was considerably below the previous year’s level of 21.1%.
The increase in selling expenses (2016: €267.9 million; 2017: €306.7 million) was partly attributable to the strengthening of the sales team in all segments. KUKA had 1,690 sales employees as at December 31, 2017 – 9.8% more than at the previous year-end, when the number was 1,539. The increase is slightly greater in more prod-uct-oriented areas than in systems engineering. All in all, this planned expansion demonstrates the strategic implementation of increased market penetration and the tapping of new markets. Another step towards this goal is the optimization and technical support of com-munication with customers and partners. By investing in a Group-wide Customer Relationship Management System, KUKA is managing to achieve close interaction of customers and partners with sales, service and marketing employees along the entire value chain.
The effectiveness of these measures is also indicated by the ratio of sales expenditure to sales revenues, the so-called selling expenses ratio. This was down year-on-year from 9.1% in 2016 to 8.8%.
A drop of €16.8 million in administrative expenses was recorded. It must be taken into consideration here that the previous year’s figure was impacted negatively by one-off effects of the takeover by Midea Group (e.g. unplanned consultancy expenses and additional personnel costs for the existing phantom share programs) totaling around €28.0 million.
During the financial year, KUKA also invested in ongoing internal projects, particularly at the Augsburg location, relating to the har-monization, standardization and optimization of processes as well as global IT platforms. The planned roll-out of these projects to other companies in the Group is expected to result in further optimization of the administrative expenses in subsequent years. Already in 2017, it was possible to improve the ratio of administrative expenses to sales revenue from 7.7% (or 6.7% when adjusted to include the one-off effects in the previous year) to 6.1%.

Consolidated financial report
39
The expenses for research and development shown on the income statement for 2017 totaled €128.7 million. The increase of €2.1 million on the previous year is the result of ongoing investments in products, solutions and future-oriented technologies as well as investments in start-up companies and strategic business partners. The invest-ments in research and development range from the upgrading of existing products and solutions to new developments and internal Group projects.
KUKA stands for Industrie 4.0 made in Germany and is a driving force behind the associated digitization of production processes with its products and key technologies. The networking of automated manu-facturing technologies with traditional mechanical engineering and intelligent IT systems lays the foundation for combining high-qual-ity single-piece production with the benefits of series production. Complex process steps are optimized and dovetailed with a focus on flexibility and cost-efficiency.
The approaches on which KUKA focuses for Industrie 4.0 – and which result in expenditure and growth investments in the R & D, sales and administration areas – are just as diverse as the innovations in other technologies. The following projects, implemented in fiscal 2017, are worthy of mention at this point by way of example:
› IT networking in Industrie 4.0: through KUKA Connect, a cloud-based software platform that allows customers to view the data of their robots from anywhere in the world and thus to increase the performance and effectiveness of their production operations.
› Further development of human-robot collaboration (HRC): sen-sitive systems make it possible for safety fences between the human operator and the robot to be made smaller or dispensed with entirely. This enables the installation of cells on an area up to a quarter smaller than that for designs without HRC capability. In the course of the KUKA Innovation Award research competi-tion, the winning team additionally developed an airbag system intended to further improve personnel safety in human-robot collaboration.
› Investment in companies in the cloud technology and Internet of Things (IoT) sector: the company Visual Components specializes in software solutions for 3D simulation in factory planning and thus adds solutions based on KUKA’s simulation ecosystem to the KUKA product portfolio. Together with the subsidiary con-nyun, which joined the Group in 2016, the company Device Insight, specializing in IoT platforms, enables progress to be made in the field of I4.0.
› Cooperative ventures with partners from both inside and out-side the industry: together with VINCI Energies Deutschland, we intend to develop and implement applications for the Indus-trial Internet of Things (IIoT) and digital services. In the past year, KUKA additionally intensified the strategic partnership with Volkswagen Corporate Research for joint development of robot-based innovation concepts for vehicles of the future. Furthermore, the “ready2_spray” solution for automated paint jobs was developed jointly with Dürr AG.
Another main focus of research and development is on the further development of existing robot series. The KR AGILUS small robot series has been convincing customers since 2017, due to its extreme agility in confined spaces, short cycle times and maximum precision; moreover, following further development, it is now also protected against water spray. This robot series, with a payload capacity of six
to ten kilograms, now meets the requirements of protection rating IP67. The LaserSpy laser safety sensor was successfully upgraded in the Laser Industry department, a competence center of the Systems (Industries) division, and showcased at the Laser World of Photonics. The TÜV-certified enclosure with improved monitoring sensors meets the highest safety standards. Linking to Smart Device enables users to access permanent condition monitoring at any time and from any place. Attention is also paid to the optical appearance and design, which are custom-tailored for the customer.
In the Swisslog segment the focus of development in the Health-care division is on upgrading the enterprise-wide software used to control and monitor the flow of materials and the administration of medication, incorporating the various Swisslog components. Also, the existing solutions are being developed further, particularly in the hospital pharmacy area.
In the field of industrial warehouse automation, investments were made this year in new palletizing solutions (“Automated Case Picking” and “Automated Item Picking”) as well as automated guided vehicles. In addition to this, the existing software has been expanded further to include future-oriented technologies; these solutions enable Swisslog customers to achieve even greater gains in efficiency in the automa-tion of their warehouses.
Please refer to the research and development section of this Manage-ment Report for further information and details.
The employees in this field are of vital importance for active exploita-tion of the possibilities opened up by Industrie 4.0 and for safeguard-ing competitive advantages in innovation, quality and customer benefits: at the reporting date, the Group had 1,027 employees (2016: 885 employees) in the field of research and development – this cor-responds to 7.2% (2016: 6.7%) of the workforce.
The costs of €31.7 million (2016: €20.1 million) incurred for new developments in the period under review were capitalized and will be reported as an expense through scheduled amortization in sub-sequent financial statements. Amortization costs were €11.3 million (2016: €8.3 million) and mainly included research and development expenditure.
Other expenses and income amounted to a balance of -€2.6 mil-lion (2016: -€11.6 million). They include expenses for other taxes (2017: €5.6 million; 2016: €6.8 million), income from subsidies (2017: €2.3 million; 2016: €1.9 million) and income from the release of pro-visions that are not required (2017: €3.9 million; 2016: €0.0 million).
EBIT margin of 3.0%Earnings before interest and taxes (EBIT) totaled €102.7 million over the past financial year compared with €127.2 million in 2016. The EBIT margin for the 2017 reporting period decreased to 3.0% compared to the figure of 4.3% for the previous year. As mentioned earlier, the pressure on earnings resulting from project deteriorations in the Sys-tems division and the measures totaling around €40 million to boost profitability had a considerable impact on the EBIT. Nevertheless, KUKA invested €31.9 million in areas of future growth. The focus here was on Industrie 4.0, mobile robotics and human-robot collab-oration as well as expenditure relating to the complete restructuring of the overall organization with a consistent customer focus across all KUKA companies, which is being implemented as of the following financial year.

KUKA Aktiengesellschaft | Annual Report 2017
40
Eliminating the effects of the scheduled amortization relating to the purchase price allocation in connection with corporate acquisitions totaling €13.7 million (2016: purchase price allocation for Swisslog €10.8 million) as well as the one-off effects from the previous year relating to the takeover by Midea Group (€28.0 million) and the growth investments made in 2017 (€31.9 million) results in an EBIT of €148.3 million for 2017 and €166.0 million for 2016 with an EBIT mar-gin of 4.3% for the year under review and 5.6% for the previous year.
2016 2017
EBIT (in € millions) 127.2 102.7
EBIT margin (in %) 4.3% 3.0%
EBIT adjusted 1 (in millions) 166.0 148.3
EBIT adjusted 1 (in %) 5.6% 4.3%
EBITDA (in € millions) 205.3 180.2
EBITDA margin (in %) 7.0% 5.2%
EBITDA adjusted 1 (in millions) 244.1 225.8
EBITDA adjusted 1 (in %) 8.3% 6.5%
1 2016: Elimination of effects due to the takeover by Midea Group (€28.0 million) and purchase price allocation (€10.8 million)
2017: Growth investments (€31.9 million) and purchase price allocations (€13.7 million)
The Robotics division achieved an EBIT amounting to €133.1 million in 2017, clearly exceeding the previous year’s level of €100.7 million by 32.2%. What is particularly noticeable here is the improved cost distribution due to the increased sales revenues.
Systems merely achieved an EBIT of €17.8 million in 2017, significantly below the corresponding figure of €91.3 million in the previous year. The EBIT margin decreased accordingly from 6.5% to 1.1%. Omitting the expenditure for the measures to improve profitability at the Augs-burg location totaling around €15 million, the EBIT margin would have been 2.1%.
At €10.4 million (2016: €4.8 million), Swisslog once again saw a con-siderable improvement in EBIT. This is equivalent to an EBIT margin of 1.4% compared with 0.8% recorded in 2016. Adjusted for the effects of purchase price allocation, the margin is 2.9% (2016: 2.6%).
In keeping with the trend in EBIT, Group EBITDA (earnings before interest, taxes, depreciation and amortization) also fell to €180.2 mil-lion (2016: €205.3 million). Write-downs totaling €77.5 million were posted in the period under review (2016: €78.1 million). €24.1 million of this (2016: €22.5 million) was attributable to Robotics, €16.7 million (2016: €22.2 million) to Systems, €26.4 million (2016: €23.4 million) to Swisslog and €10.3 million (2016: €10.0 million) to other areas.
There was therefore an increase in EBITDA for the Robotics divi-sion with €157.2 million (2016: €123.2 million) and Swisslog with €36.8 million (2016: €28.2 million) compared to the previous year. Systems finished the financial year with an EBITDA of €34.5 million (2016: €113.5 million). The Group EBITDA margin was 5.2% (2016: 7.0%). The EBITDA margin for Robotics was 13.1% (2016: 12.3%), for Systems 2.2% (2016: 8.1%) and for Swisslog 4.8% as in the previous year. Disregarding the one-off effects of the Midea Group takeover bid in the previous year and the growth investments carried out in the year under review, Group EBITDA was €233.3 million in 2016 and €212.1 million in 2017; i.e. the adjusted Group EBITDA margin was 6.1% in the year under review and 7.9% in the previous year.
Financial result below that of previous year, primarily due to currency effectsThe net expenses and income in the financial result equated to an expense of €9.2 million in the 2017 fiscal year. This is a decline compared with the previous year when the financial result was -€4.9 million.
The interest income amounted to €6.2 million (2016: €8.1 million) and mainly included income from bank deposits, income from short-term liquid assets invested in commercial papers and income from financial leases.
The net balance of foreign exchange gains and losses in connec-tion with financial assets led during the past financial year and the previous year to a foreign currency loss (2017: -€5.8 million; 2016: -€2.1 million). In the reporting period, interest expenditure totaled €15.2 million. Most of this relates to the promissory note loan placed in October 2015 with interest expenditure of €3.6 million (2016: €3.6 million) and the net interest expense for pensions of €1.9 mil-lion (2016: €2.2 million). Expenditure on sureties and guarantees amounted to €1.3 million (2016: €1.1 million).
Pursuant to the amendment to the syndicated loan agreement, there were additional expenses of €1.0 million in fiscal 2016 in order to cover transaction costs.
Earnings before taxes (EBT) amounted to €93.5 million (2016: €122.3 million). The tax expense of KUKA Group totaled €5.3 million in 2017 (2016: €36.1 million). The tax rate therefore only amounted to 5.7%, and was thus considerably below the previous year (2016: 29.5%). The effects of the US tax reform, including the rebates for research and development expenditure, and the earnings develop-ment in the German consolidated tax group are having a particularly noticeable impact.
Proposed dividend of €0.50 per shareEarnings after taxes of KUKA Group were positive for the seventh year in a row and a slight rise to €88.2 million was recorded (2016: €86.2 mil-lion). Earnings per share amounted to €2.22 in 2017 (2016: €2.19).
The Executive Board is proposing to the Annual General Meeting that a dividend of €0.50 per share be paid once again for fiscal 2017.

Consolidated financial report
41
Consolidated income statement (condensed)
in € millions 2013 2014 2015 2016 2017
Sales revenues 1,774.5 2,095.7 2,965.9 2,948.9 3,479.1
EBIT 120.4 141.8 135.6 127.2 102.7
EBIT adjusted 1 120.4 141.8 135.6 155.2 134.6
EBITDA 158.4 185.3 259.1 205.3 180.2
EBITDA adjusted 1 158.4 185.3 259.1 233.3 212.1
Financial result -20.0 -25.3 -7.4 -4.9 -9.2
Taxes on income -35.4 -45.2 -39.3 -36.1 -5.3
Earnings after taxes 58.3 68.1 86.3 86.2 88.2
1 2016: One-off effect due to the takeover bid by Midea Group 2017: Growth investments
Financial position
Principles and goals of financial managementKUKA Aktiengesellschaft is responsible for the central financial management of all KUKA Group companies. Acquired companies are successively included in the Group’s financial management. Group financing and interest rate and currency risk management are controlled centrally via KUKA Aktiengesellschaft. The financing and investment needs of Group companies and hedging transactions for interest rate and currency management are bundled by KUKA Aktiengesellschaft, which concludes the necessary internal and external financial transactions with Group companies and banks. KUKA Aktiengesellschaft performs these tasks on the basis of a uni-form planning and reporting system in which risks related to credit, liquidity, interest rates and exchange rates are recorded. The objective of interest rate and currency management is to minimize the risks involved. Only standard derivative financial instruments are used to hedge risk. The hedging transactions are concluded exclusively on the basis of the hedged item or expected transactions. KUKA has issued a standard set of guidelines for all Group companies for the purpose of managing financing risk. As in previous years, the guidelines were continuously reviewed and optimized during the financial year to ensure that they remained up to date and also transferred to the acquired companies.
Group financing and cash poolingThe Group’s financing policy is aimed at securing not only sufficient liquidity reserves in the form of liquid assets and non-utilized, com-mitted long-term credit lines but also sufficient guarantee facilities at all times to be able to ensure the operating and strategic financ-ing requirements of the Group companies and also to have suffi-cient reserves as a buffer against unforeseen events. The financing requirements of the Group companies are calculated on the basis of the multi-year budget and financial projections and monthly rolling liquidity forecasts over twelve months, each of which includes all the relevant companies consolidated in the Group accounts.
Payments received on the basis of operating activities of Group com-panies represent the Group’s most important source of liquidity. KUKA Aktiengesellschaft’s cash management uses the liquidity surpluses of individual Group companies to meet the liquidity requirements of other Group companies. This central, intra-Group cash pooling optimizes the Group’s liquidity position and has a positive impact on net interest income.
Components of the financing structure
Promissory note loanKUKA AG issued an unsecured promissory note loan with a total volume of €250.0 million on October 9, 2015. The total volume was placed in two separate tranches. Tranche 1 has a volume of €142.5 mil-lion with a term to maturity of five years; tranche 2 has a volume of €107.5 million and a term to maturity of seven years. Repayment shall occur at 100.0%, payable in one sum on maturity of each fixed-term tranche. The promissory note loan carries interest coupons of 1.15% for tranche 1 and 1.61% for tranche 2.
Syndicated loan agreementAs at the balance sheet date, there is an SFA (Syndicated Facilities Agreement) that includes a surety and guarantee line (guaranteed credit line) in the amount of €200.0 million and a working capital line (cash line), which can also be used for sureties and guarantees, likewise in the amount of €200.0 million. The syndicated loan agree-ment is unsecured and contains only the customary equal treatment clauses and negative pledges.
After the end of the financial year, KUKA AG concluded a new syndi-cated loan agreement with a bank consortium on February 1, 2018 with a volume of €520.0 million and in doing so replaced and refi-nanced the existing credit facility of €400.0 million. The new agree-ment includes a surety and guarantee line (guaranteed credit line) in the amount of €260.0 million and a working capital line (cash line), likewise in the amount of €260.0 million, which can also be used for sureties and guarantees.
The term of the new loan agreement is five years with two one-year extension options additionally agreed. This gave the Group consid-erably extended leeway for financing further growth until 2025. The syndicated loan agreement remains unsecured as before and contains only the customary equal treatment clauses and negative pledges. Unchanged financial covenants were agreed with thresholds for lever-age (net financial liabilities /EBITDA) and interest coverage (EBITDA /net interest expense).
Guaranteed credit linesIn addition to the guarantee lines and the cash facilities which can be used for guarantees under the syndicated loan agreement there were also further guarantee line agreements in 2017 to support operating business. These guarantee facilities bilaterally agreed with banks and surety companies outside the syndicated loan agreement amounted as at December 31, 2017 to a commitment volume of €118.0 million (2016: €124.0 million) and in accordance with the rules applicable to the SFA in effect on the balance sheet date, and also to the SFA newly agreed in 2018, may be utilized up to a total volume of €100.0 million. None of these guarantee lines contains a change-of-control clause.
In total at December 31, 2017 KUKA therefore had credit lines availa-ble for sureties and guarantees in an amount of €620.0 million (2016: €500.0 million). These were utilized in the amount of €255.7 million (2016: €258.1 million).

KUKA Aktiengesellschaft | Annual Report 2017
42
Asset-backed securities programAlongside this is an unchanged ABS program in the amount of €25 million.
KUKA Group’s financing requirements are currently covered primarily by the following available elements:
1) The €520.0 million syndicated loan agreement signed in February 2018 with a term extending to February 2023. Cash drawings up to a volume of €260.0 million are possible under this agreement.
2) Bilateral agreements with banks and surety companies for surety and guarantee lines in the amount of €118.0 million.
3) The promissory note loan with a nominal value of €250.0 mil-lion issued in October 2015 and maturing in October 2020 and October 2022.
4) The ABS program with a financing volume of €25.0 million.
From the perspective of the Executive Board, the measures taken ensure that KUKA Group has appropriate long-term financing and the necessary leeway to quickly implement important strategic decisions.
Assessment by rating agenciesThe stable financial situation is also reflected in the good credit rating given by the two rating agencies Moody’s and Standard & Poor’s. Since January 2017, Moody’s has rated KUKA as Baa3 with a stable outlook. The latest assessment by Standard & Poor’s dates from March 2017 and indicates a rating of BBB- with a stable outlook.
Consolidated cash flow statement (condensed)
in € millions 2013 2014 2015 2016 2017
Cash earnings 115.3 181.3 260.8 203.9 184.6
Cash flow from current business operation 221.0 184.7 169.2 -9.6 92.0
Cash flow from investment activities -125.6 -356.9 -73.5 -97.2 -227.7
Free cash flow 95.4 -172.2 95.7 -106.8 -135.7
The cash earnings are an indicator derived from the earnings after taxes, adjusted for income taxes, net interest, cash-neutral depreci-ation on tangible assets, together with other non-cash income and expenses. The figure of €184.6 million in 2017 (2016: €203.9 million) indicates that the company is in a good economic position.
With comparable, slightly higher, earnings after taxes, the higher non-cash earnings compared with the previous year, mainly due to the considerable change in deferred taxes (see “Net worth” for further details), resulted in lower cash earnings.
Cash flow from current business operations of KUKA Group rose from -€9.6 million in 2016 to €92.0 million in 2017. This improvement is primarily due to the development of the trade working capital over the course of 2016 and 2017. In fiscal 2016, an increase of €164.5 mil-lion in trade working capital (December 31, 2016: €429.1 million) had to be financed. In fiscal 2017, on the other hand, the trade working capital only rose by a moderate €24.8 million and thus had a consider-ably lower impact on the cash flow from current business operations. As at the balance sheet date of the financial year, trade working capi-tal amounts to €453.9 million (December 31, 2016: €429.1 million).
Overall, trade working capital has developed as follows:
Trade Working Capital
in € millions 2013 2014 2015 2016 2017
Inventories less advance payments 133.9 194.1 225.3 223.2 293.4
Trade receivables and receivables from construction contracts 348.6 612.9 658.3 888.9 923.8
Trade payables and liabilities from construction contracts 304.4 522.2 619.0 683.0 763.3
Trade working capital 178.1 284.8 264.6 429.1 453.9
Year-on-year, it was primarily receivables which rose. This is mainly due to deliveries and orders completed in the Swisslog division at the end of 2017 for which the payment of the outstanding receivables is not expected until the first quarter of 2018. Inventories less advanced payments at €293.4 million are at a considerably higher level than the previous year (2016: €223.2 million), reflecting the high level of orders received with accompanying advance procurement measures. Trade payables increased by €89.9 million to €549.2 million.
High level of investment continuesDuring the 2017 financial year, KUKA again made high investments in the future. In total, the volume of expenditure on intangible and tangible fixed assets amounted to €138.8 million (2016: €99.6 mil-lion). This included major capital expenditure in the research and development sector and increased investment in tangible assets. The carrying amount of the company’s own development work and internally generated intangible assets totaled €72.1 million (2016: €54.0 million). (For information on the development focuses, see the “Research and development” section, page 30 et seq.).

Consolidated financial report
43
Investments in intangible assets and property, plant and equipment
in € millions 2013 2014 2015 2016 2017
Group 74.7 94.3 107.0 99.6 138.8
of which Robotics 30.8 30.4 39.4 29.4 39.9
of which Systems 15.2 28.7 23.5 23.9 53.9
of which Swisslog – – 22.2 20.0 21.6
of which others 1 28.7 35.2 21.9 26.3 23.4
1 incl. consolidation
Investments in intangible assets amounted to €53.3 million in fis-cal 2017 (2016: €49.1 million) and were attributable to rights and assets in an amount of €9.1 million (2016: €14.5 million), internally produced software and development costs in an amount of €31.7 mil-lion (2016: €20.1 million) and advances paid of €12.5 million (2016: €14.5 million).
Investments in tangible assets amounted to €85.5 million in the year under review (2016: €50.5 million) and were attributable to land, property rights and buildings (including buildings on third party land) (2017: €3.2 million; 2016: €6.3 million), technical plant and machin-ery (2017: €12.9 million; 2016: €19.5 million), other plant /operating and office equipment (2017: €18.4 million; 2016: €20.2 million) and advances paid and construction in progress (2017: €51.0 million; 2016: €4.5 million).
Broken down by division, capital expenditure was as follows in 2017: in the Robotics division, the corresponding figure was €39.9 million (2016: €29.4 million). In addition to the capitalized development work, most of the investments were made in technical equipment and machinery, particularly for the optimization of production, but also for operating and office equipment. The Systems division registered additions of €53.9 million (2016: €23.9 million). This is primarily due to the system currently being built for production of the new Jeep Wrangler JT in Toledo /USA (for further details please refer to the “Events after the balance sheet date” section). Here also, most of the investments were again made in technical equipment and machinery. Investments in the Swisslog division of €21.6 mil-lion (2016: €20.0 million) mainly concern investments in internally produced software and development costs to constantly improve the customer software, but primarily in the further development of individual products in the automation solutions for future-oriented warehouse and distribution centers and for hospitals. Investments in the “Other” segment amounted to €24.0 million (2016: €26.3 million) and related mostly to advance payments. These were made for ongo-ing internal projects relating to the harmonization, standardization and optimization of processes as well as the introduction of global IT platforms and the construction of a new production facility and parking garage at the Augsburg location.
Spending on acquisitions of consolidated companies and other busi-ness units during the current fiscal year and spending on settling open purchase price liabilities from acquisitions in the previous years came to a total of €97.0 million (2016: €47.8 million) and were sub-divided as follows:
Company acquisitions
in € millions 2016 2017
Company acquisitions
Talyst Systems LLC, Delaware /USA – 25.7
Visual Components Oy, Espoo /Finland – 19.9
Device Insight GmbH, Munich /Germany – 18.9
Reis Group Holding GmbH & Co. KG, Obernburg /Germany 30.8 9.1
UTICA Enterprises, Shelby Township, Michigan /USA 4.1 6.6
Forte Industrial Equipment Systems Inc., Mason, Ohio /USA 1.6 –
Tecnilab S.p.A., Cuneo /Italy 6.0 –
Other 3.7 1.9
Total 46.2 82.1
Investments accounted for at equity
Pipeline Health Holdings LLC, San Francisco /USA – 13.9
KBee AG, Munich /Germany 1.6 1.0
Total 1.6 14.9
Total payments 47.8 97.0
The sale of business units in the Aerospace segment in connection with the Midea takeover bid contributed €33.5 million during the previous year.
Negative free cash flow Cash flow from investment activities (2017: -€227.7 million; 2016: -€97.2 million) along with cash flow from current business operations resulted in a negative free cash flow of -€135.7 million. In the previous year the free cash flow had also been negative at -€106.8 million. This development is primarily due to the heavy investment activities.
Negative cash flow from financing activitiesAt year-end KUKA had a negative cash flow from financing activities amounting to -€10.7 million. This includes dividend payments to shareholders of €0.50 per share (2016: €0.50 per share) making a total of €19.9 million.
Consolidated net liquidity
2016 2017
Cash and cash equivalents 364.2 223.6
Current financial liabilities 1.6 19.1
Non-current financial liabilities 249.6 249.7
Group net debt (previous year: Group net liquidity) 113.0 -45.2
Cash and guaranteed facilities from Syndicated Senior Facilities Agreement 1 400.0 520.0
Guaranteed facility from banks and surety companies 124.0 118.0
ABS program line 25.0 25.0
1 The 2017 figure includes the changes from the new syndicated loan agreement (see “Events after the balance sheet date”)

KUKA Aktiengesellschaft | Annual Report 2017
44
As a result of the cash flows described above, KUKA had a net debt of €45.2 million at the end of the financial year (the balance of liquid assets and current and non-current financial liabilities). As at the balance sheet date of the previous year, KUKA had a net liquidity of €113.0 million. The cash and cash equivalents of the Group at year-end 2017 totaled €223.6 million (2016: €364.2 million).
Net worth
On the assets side, non-current assets rose to €977.4 million (Decem-ber 31, 2016: €838.1 million). This increase is mainly due to the invest-ments made during the financial year (please refer to notes on the financial position). Amortization of €13.7 million (2016: €11.9 million) on the purchase price allocation for corporate acquisitions had the opposite effect. A value of €300.1 million was recorded for goodwill (December 31, 2016: €257.5 million). The following table shows the change in goodwill:
Change in goodwill
in € millions
As of Jan. 1, 2017 257.5
Additions
Talyst Systems LLC, Delaware /USA 11.2
Device Insight GmbH, Munich /Germany 30.5
Visual Components Oy, Espoo /Finland 15.5
Exchange rate effects and other acquisitions -14.6
As of Dec. 31, 2017 300.1
The increase in tangible assets amounted to €34.8 million.
Amounts totaling €15.7 million were included for investments in asso-ciated companies and joint ventures (December 31, 2016: €4.2 mil-lion) and reported under “At equity financial assets”. This increase results from the acquisition of a 25.0% share in Pipeline Health Holdings LLC, San Francisco /USA, for €13.9 million.
Deferred tax assets amounted to €79.6 million (December 31, 2016: €48.8 million). Of this, €20.7 million is attributable to losses carried forward (December 31, 2016: €9.8 million), particularly for capitaliza-tions during the financial year for the German consolidated tax group.
The value of current assets amounted to €1,662.7 million as at December 31, 2017 (December 31, 2016: €1,705.8 million). The rises in inventories and trade receivables mentioned above had an increasing effect on this value. However, these rises were more than offset by the reduction in cash and cash equivalents, particularly resulting from investment activities.
Group net worth
in € millions 2013 2014 2015 2016 2017
Balance sheet total 1,377.1 1,979.5 2,381.7 2,543.9 2,640.1
Equity 379.1 541.1 732.5 840.2 866.6
in % of balance sheet total 27.5 27.3 30.8 33.0 32.8
Net liquidity /debt 146.5 32.6 199.9 113.0 -45.2
The balance sheet total of KUKA Group rose by €96.2 million from €2,543.9 million as at December 31, 2016 to €2,640.1 million as at December 31, 2017.
Capital ratio of 32.8%Following the growth of the balance sheet total, KUKA had to accept a slight decline in the equity ratio from 33.0% in the previous year to 32.8%. Altogether, equity capital increased by €26.4 million to €866.6 million. While the net income of €88.2 million was up slightly year-on-year (2016: €86.2 million) and had the effect of increasing equity capital, the currency effects recorded in 2017 were highly negative and totaled -€40.9 million. Particularly affected were the Swiss franc, US dollar, Brazilian real and Chinese renminbi. Payment of the 2016 dividend to the shareholders of KUKA Aktiengesellschaft reduced equity capital by €19.9 million. Actuarial losses from pension accounting, including the associated deferred taxes, totaled €0.6 mil-lion. Minority interests in equity capital were reduced through the share in the total result of -€0.3 million by -€0.2 million to an amount of -€0.5 million.
Financial liabilities mainly relate to the promissory note loan of nominally €250.0 million placed in October 2015 as well as the cor-responding interest accruals and the short-term utilization of cash lines in the low double-digit million euro range.
The fall in deferred tax liabilities from €45.3 million to €27.5 million is strongly influenced by the expected change in the tax rate in the USA.
The current liabilities increased from €1,258.1 million as at Decem-ber 31, 2016 to €1,357.9 million as at December 31, 2017. The change in the liability-side trade working capital referred to above was the main reason for this. Other provisions (€132.5 million) and other liabilities and accruals (€297.7 million) are at approximately the same level as the previous year (2016: €437.9 million). Other liabilities include personnel costs of €155.0 million (2016: €142.1 million) and the contingent purchase price liabilities amounting to €37.4 million (2016: €23.1 million). These mainly relate to the acquisitions of the financial year as well as UTICA Enterprises, Shelby Township, Michi-gan, USA in previous fiscal years.
Group assets and financial structure
in € millions 2016 2017
Current assets 1,705.8 1,662.7
Non-current assets 838.1 977.4
Assets 2,543.9 2,640.1
Current liabilities 1,258.1 1,357.9
Non-current liabilities 445.6 415.6
Equity 840.2 866.6
Liabilities 2,543.9 2,640.1

Consolidated financial report
45
Slight increase in working capital and capital employed due to business performanceKUKA continues to focus on active management of the working cap-ital and, in particular, further optimization of supplier-side payment terms. Nevertheless due to the order situation and business perfor-mance, a slight rise in working capital requirements at the end of 2017 could not be avoided. The working capital increased once again during the financial year from €118.4 million at the start of the year to €158.9 million. This meant that in the financial year under review the current business operations had to be financed from the available liquidity of the Group as well as from customer prepayments and supplier liabilities. As far as the individual divisions are concerned, all divisions had a positive working capital in the current reporting period (Robotics: 2017: €129.4 million; 2016: €115.5 million; Systems: 2017: €18.0 million; 2016: €70.4 million; Swisslog: 2017: €54.2 million; 2016: -€16.6 million).
Return on capital employed (ROCE)An important key figure of KUKA Group is the return on capital employed (ROCE). This indicator describes how effectively and prof-itably KUKA uses its capital employed.
The capital employed is calculated as the average of capital employed at the beginning and end of the financial year. On average, KUKA Group’s capital employed in 2017 and 2016 amounted to €950.4 mil-lion and €783.0 million respectively. The ROCE declined from 16.2% in 2016 to 10.9% in 2017.
The ROCE of the individual divisions was as follows: with average cap-ital employed of €235.9 million (2016: €194.9 million) the Robotics division generated a ROCE of 56.4% and was thus slightly above the previous year’s figure of 51.7%. Due to the impacts on earnings in the financial year, the Systems division achieved a ROCE of 6.3% (2016: 42.8%) on an average capital employed of €281.9 million (2016: €213.1 million). With average capital employed of €346.8 million (2016: €317.4 million) the ROCE in the Swisslog division saw a sig-nificant improvement to 3.0% compared with the 2016 figure of 1.5%.
Return on Capital employed (ROCE)
in % of capital employed
2013 2014 2015 2016 2017
Group 1 36.9 28.8 20.0 16.2 10.9
of which Robotics 49.6 53.1 56.6 51.7 56.4
of which Systems 43.0 67.9 87.9 42.8 6.3
of which Swisslog – – -14.5 1.5 3.0
1 incl. consolidation
Notes to the financial statements of KUKA AktiengesellschaftKUKA Aktiengesellschaft acts as the Group’s management holding company with central management responsibilities such as account-ing and controlling, finance, human resources, legal, IT and financial communications. Its financial position is determined primarily by the activities of its subsidiaries, as illustrated by the direct allocation of the management companies of the Robotics division (KUKA Roboter GmbH), Systems division (KUKA Systems GmbH) and Swisslog divi-sion (Swisslog Holding AG).
KUKA Aktiengesellschaft prepares its annual financial statements in accordance with the provisions of the German Commercial Code (HGB) and the German Stock Corporation Act (AktG).
The financial statements of KUKA Aktiengesellschaft are published in the electronic Federal Gazette (Bundesanzeiger) and are also available on the company’s website www.kuka.com.
Events after the balance sheet dateAs far as events after the balance sheet date are concerned, in par-ticular the new syndicated loan agreement and the agreement with Fiat Chrysler Automotive for the production of vehicle bodies for the new Jeep Wrangler JT, we refer you to the “Events after the balance sheet date” section in the Group notes.
Income statement of KUKA Aktiengesellschaft (HGB)
in € millions 2016 2017
Sales revenues 77.4 99.4
Other company-produced and capitalized assets 2.0 0.4
Other operating income 21.1 36.2
Cost of materials -40.8 -54.7
Personnel expense -44.8 -56.4
Depreciation and amortization of tangible and intangible assets -10.1 -10.1
Other operating expenses -64.5 -70.1
Income from equity investments 174.6 20.9
Income from other securities 0.0 –
Other interest and similar income 6.3 11.3
Depreciation of long-term investments – -9.0
Interest and similar expenses -7.0 -6.5
Taxes on income -2.2 -0.1
Net loss /net profit for the year 112.0 -38.7
Profit carry-forward from the previous year 31.6 67.7
Transfer to retained earnings -56.0 –
Balance sheet profit 87.6 29.0

KUKA Aktiengesellschaft | Annual Report 2017
46
Balance sheet of KUKA Aktiengesellschaft (HGB)
Assetsin € millions
2016 2017
Fixed assets
Intangible assets 20.1 30.5
Tangible assets 87.9 90.2
Financial investments 492.9 493.9
600.9 614.6
Current assets
Receivables from affiliated companies 414.6 481.3
Other receivables and assets 4.1 17.3
418.7 498.6
Cash and cash equivalents 150.4 7.8
569.1 506.4
Prepaid expenses 1.4 1.7
1,171.4 1,122.7
Liabilitiesin € millions
2016 2017
Equity
Subscribed capital 103.4 103.4
Capital reserve 305.8 305.8
Other retained earnings 254.3 254.3
Balance sheet profit 87.6 29.0
751.1 692.5
Provisions
Pension provisions 11.5 11.5
Provisions for taxes 8.8 7.0
Other provisions 45.6 31.5
65.9 50.0
Liabilities
Liabilities due to banks 250.9 269.1
Trade payables 5.6 18.5
Accounts payable to affiliated companies 83.8 88.7
Liabilities to provident funds 2.6 2.7
Other liabilities 11.5 1.2
354.4 380.2
1,171.4 1,122.7
Results of operations of KUKA Aktiengesellschaft
The earnings of KUKA Aktiengesellschaft are determined primarily by the earnings of its (direct) subsidiaries, its financing activities and the expenses and income relating to the company’s holding function. Earnings before taxes amounted to -€38.6 million and were therefore considerably below the previous year’s result (2016: €114.2 million).
Sales revenues (2017: €99.4 million; 2016: €77.4 million) mainly include cost allocations and cost transfers to subsidiaries (2017: €89.3 million; 2016: €68.8 million) and income from the rental of buildings to KUKA Group companies (2017: €10.0 million; 2016:
€8.4 million). The associated expenses are reported as cost of mate-rials and services purchased. These amounted to €54.7 million during the financial year (2016: €40.8 million).
The main item under “other operating income” is currency transla-tion gains, particularly from the US dollar, Swiss franc and Brazilian real, which were recognized in an amount of €33.9 million (2016: €15.6 million). The rise in other operating expenses results particu-larly from the considerably higher currency translation losses in the year under review (2017: €35.3 million; 2016: €22.5 million). These are set against higher comparative figures for the previous year for consultancy services in connection with the acquisition of a majority shareholding by Midea Group.
The increase in personnel expenditure from €44.8 million to €56.4 million is primarily attributable to the increase in the number of employees. The average number of employees of the company increased from 443 in the previous year to 512. This rise was mainly due to the takeover in the previous year of the central IT department at the Augsburg site by KUKA Aktiengesellschaft which has now taken full effect in the year under review. Furthermore, the workforce was also expanded as planned in 2017 in the fields of research and devel-opment as well as developments for the Internet of Things.
Income from participations amounted to €20.9 million (2016: €174.6 million) and was therefore considerably below the previous year’s value. This is due to two effects. Firstly, KUKA AG recorded a very high dividend payment of €119.7 million from the US subsidi-ary in the previous year, which comprised the accumulated result of several years. In the year under review, this dividend payment was €29.4 million. Secondly, at -€8.5 million, the earnings contributions from the German companies allocated to KUKA Aktiengesellschaft via profit and loss transfer agreements were considerably down on the previous year (2016: €54.9 million), particularly due to the project deteriorations in systems engineering and the restructuring measures at KUKA Systems GmbH.
The net interest result amounted to €4.8 million, which was signifi-cantly better than the previous year’s value (2016: -€0.7 million). Due to the stronger liquidity supply for subsidiaries, finance interest cred-ited or charged to subsidiaries was higher compared to the previous year. In the previous year KUKA Aktiengesellschaft and its associated companies posted net interest income of €5.8 million – the value this financial year was €10.7 million.
The amortization of financial assets relates to the complete valuation adjustment of the investment in KBee AG, Munich.
Due to the negative earnings before taxes, KUKA Aktiengesellschaft as the controlling company of the German consolidated tax group recorded no income taxes for the tax group in the income statement for 2017 (2016: €2.2 million). The reported sum of +€0.1 million relates to capital gains taxes and tax credits for past assessment periods.
Overall, the net loss for the year of KUKA Aktiengesellschaft amounted to €38.7 million (2016: net profit of €112.0 million). After offsetting against the profit carried forward, the balance sheet profit totals €29.0 million for fiscal 2017 (2016: €87.6 million).

Consolidated financial report
47
Financial position of KUKA Aktiengesellschaft
One of KUKA Aktiengesellschaft’s most important tasks is to provide funds and guarantees for its subsidiaries’ current operations. The resources used for external finance such as the promissory note loan and the syndicated loan agreement, including the changes made to it after the balance sheet date, are described in detail in the section on the financial position of KUKA Group.
KUKA Aktiengesellschaft’s financing role is reflected in its receivables from and liabilities to affiliated companies, which are predominantly the result of cash pooling accounts with subsidiaries and loans provided. The balance of these receivables and liabilities was a net receivables figure of €392.6 million (2016: €330.8 million). This rise in liquidity requirements by subsidiary companies was attributable, in addition to the result transfers during the financial year, to the considerable increase in the working capital due to the good course of business, in particular for the subsidiaries participating in the cash pooling arrangements.
Overall, the liquid assets of KUKA Aktiengesellschaft decreased from €150.4 million to €7.8 million. Financial liabilities amounted to €269.1 million as at the balance sheet date compared with €250.9 million in the previous year and relate primarily, in addition to cash withdrawals, to the promissory note loan and the associated interest accruals.
Net assets of KUKA Aktiengesellschaft
The net assets of KUKA Aktiengesellschaft are impacted by the man-agement of its equity investments as well as the way in which it executes its management function for the companies in KUKA Group. For information on receivables from and liabilities to affiliated com-panies and financial items, please refer to the information on KUKA Aktiengesellschaft’s financial position.
Capital expenditure on intangible and tangible fixed assets amount-ing to €22.8 million (2016: €26.1 million) was accompanied by depre-ciation, amortization and write-downs amounting to €10.1 million (2016: €10.1 million). Investments during the financial year were mainly concentrated on IT-based projects started in previous years to harmonize, standardize and optimize processes as well as on the construction work at the Augsburg plant, where an additional parking garage and a new production facility are currently being built.
KUKA Aktiengesellschaft’s direct equity investments in its subsidiar-ies are reported under financial assets. Additions during the financial year mainly included the capitalization of connyun GmbH. The value of the shares of KBee AG, Munich, was written down.
The increase in other assets (2017: €17.3 million; 2016: €4.1 million) is primarily due to higher receivables from tax authorities for the sales tax group of KUKA AG and from increased income tax receivables.
The changes in equity chiefly reflect the earnings for the financial year. Dividend payments totaling €19.9 million for the 2016 finan-cial year also had the effect of reducing equity. The equity ratio of KUKA Aktien gesellschaft amounted to 61.7% as at December 31, 2017 (2016: 64.1%).
Other provisions were particularly high in the previous year due to expenses connected with the acquisition of a majority shareholding by Midea Group. Other provisions as at the balance sheet date totaled €31.5 million (December 31, 2016: €45.6 million).
In 2016, KUKA acquired the remaining shares in the Reis Group. Par-ticularly due to the settlement in 2017 of the corresponding payment obligation of around €9.2 million, other liabilities were reduced from €11.5 million to €1.2 million.
The net impact of these changes on the balance sheet total of KUKA Aktiengesellschaft was a decrease of €48.7 million to €1,122.7 million compared to the reporting date of the previous year.
Dependency report
The Executive Board has prepared a report on relationships with affil-iated companies in the period under review pursuant to section 312 of the German Stock Corporation Act (AktG), concluding with the following declaration:
“We declare that for each legal transaction in relation to the legal transactions and measures listed in the report on relationships with affiliated companies, the company received appropriate compensation according to the circumstances known to us at the time the legal transaction was performed or the measure was taken and was not put at a disadvantage as a result of the measure being taken. There were no omitted measures.”
Non-financial key performance indicators
Sustainability at KUKA
At KUKA, sustainability is embedded in the corporate culture and stands for responsible business practices aimed at protecting the environment and resources. KUKA bears responsibility for people and products, but also for society and the environment.
In order to align its corporate strategy with this, KUKA has identified the following topics to be addressed within a materiality analysis:
› Digitization /automation › Leadership and culture › Training and further education › Diversity › Product safety › Employment › Procurement › Anti-corruption and fair competition › Sustainable /efficient products › Human rights › Occupational health and safety › Resource-saving production › Social commitment
A detailed report on these focal points can be found in the Sustaina-bility Report for the 2017 fiscal year.

KUKA Aktiengesellschaft | Annual Report 2017
48
Resource-saving productionKUKA products and systems stand for innovation and quality. This is the result of high standards in our own production processes. KUKA contributes to protecting the environment by minimizing pollution and the use of raw materials.
Most of our production locations work according to internationally recognized management systems in the areas of quality (ISO 9001), environment (ISO 14001), energy (ISO 50001) and other industry-spe-cific norms in order to create high-quality and environmentally com-patible standards. These standardized management approaches are implemented in accordance with the specific circumstances at the individual plants. The “KUKA guidelines for health, safety, sustaina-bility and quality” serve as an umbrella policy. They apply to both the KUKA Group and the entire supply chain.
External certifications according to ISO 14001 are already performed on a regular basis by an accredited certification body at several loca-tions. KUKA is currently working on introducing the environmental standard ISO 14001 at a number of locations such as in China.
Conserving energyAs the Swisslog and Systems divisions are primarily active in systems engineering without their own significant energy-intensive produc-tion, the topic of environmental protection in terms of energy savings in production mainly affects the Robotics division. Our production locations for robots are in Augsburg /Germany, in Füzesgyarmat and Taksony /Hungary and in Shanghai /China. The power consumption is regularly evaluated across Germany using a software tool. Detailed analyses, for example of the paint shop or individual assembly areas, help us to initiate improvements according to our requirements. The data are collected by means of a meter installation that currently has 450 measurement points and will be further expanded. The data are collected centrally by KUKA AG and made available to the locations for further optimization. This allows us to identify approaches for further enhancement of the underlying processes. Further measures for reducing our power consumption include:
› ongoing conversion of lighting to LED › automatic switch-off of machines and lighting in defined
breaks and idle times › modern, energy-efficient air compressors and cooling systems › annual generation of an average of 35,000 kWh of solar power
at the Augsburg site.
Strategic energy targets 2020 1
E1Reduction of final energy consumption in relation to revenues by 7.5%
E2Reduction of CO2 emissions in relation to revenues by 20%
E3Raising of energy awareness and employee commitment through initiatives and information campaigns at least every six months
E4Expansion of energy consumption recording and analysis for each location with presentation of relevant energy performance indicators (EnPIs) at least every quarter
1 Baseline: December 31, 2014. Applies to KUKA Germany.
In the year under review, the targets were extended to the KUKA locations in France in the course of implementing an energy man-agement system.
Reducing environmental impactsEvery form of industrial activity impacts the environment in one way or another through either energy consumption or the consequences of production such as emissions, waste and effluents. However, with our certified environmental management systems, we are ensuring that these impacts are kept as low as possible.
We also consider the development of emissions and the volume of waste and effluents to be components of the environmental man-agement system, even if they are less significant than energy con-sumption. Production waste is separated and disposed of or recycled expertly by trained personnel.
At KUKA Robotics, water is only used to a limited extent in the paint shop and in cooling processes. At our largest production loca-tions, water consumption amounted to 104,360 m3 in 2017 (2016: 109,191 m3).
CO2 emissions at our largest production locations totaled 35,209 tonnes in 2017 (2016: 34,522 tonnes). The increase is primarily attributable to the higher production volume as compared to the previous year.
Energy efficiency in systems engineeringAs system integrators, the Systems and Swisslog divisions are also committed to improving energy efficiency, thus benefiting customers through lower power consumption and cost reductions.
KUKA Systems has developed an energy calculation tool, for example. This tool can be used to continuously monitor the consumption of electrical energy, compressed air, cooling water, lighting and air con-ditioning in a system. If necessary, the consumption of systems, the CO2 emissions and the operating costs can be optimized.
Swisslog too helps to save energy and reduce CO2 emissions by using “green” technologies and products. The starting point was the recov-ery of braking energy from mobile machines several years ago by feeding this energy back into the power circuit. This is now the core of its own energy efficiency label GreenLog.

Consolidated financial report
49
Recycling and retoolingWe offer our customers a retooling service for older robots. We also provide the option of recycling or disposing of used robots. Robots that are no longer in use are taken back by KUKA and refurbished. They are placed on the market again as used machines. Together with our customers, we thus strive to achieve a closed-loop materials cycle.
The Used Machines business model was introduced in the Customer Service division in the year under review. This involves old systems being bought back and refurbished to conserve resources and improve the ecological balance. Another positive environmental aspect is accomplished by using innovative technologies such as energy-effi-cient motors and control variants in the systems.
Corporate social responsibility
Social commitment of Orange Care e.V.Orange Care was actively involved in a wide range of initiatives in 2017. One example is the financial support provided to KlinikClowns e.V. The KlinikClowns regularly visit the pediatric ward in the Josefi-num Hospital in Augsburg and help children and their families deal with their illness by distracting them from their worries. In the past year, the organization was also involved with the Regens Wagner Foundation in Holzhausen, one of eight church foundations of the same name in Bavaria. The foundation offers people with disabili-ties broad support for school, training, employment and daycare. A KUKA employee has initiated the project “Children helping children in Kosovo”. This initiative supports the country’s only workshop for the handicapped, in addition to training young people.
Outside of the organization in Augsburg, KUKA is promoting social involvement worldwide with the aim of living out its social respon-sibility. In the USA, for example, all activities and initiatives for soci-ety and healthcare take place under the motto “KUKA Cares”. KUKA employees raised a total of 13,000 US dollars in 2017 for the disaster region after the devastating Hurricane Harvey and donated the money to the Hurricane Relief Fund.
Helping children learn more about technologyKUKA is also committed to social issues beyond the charitable ini-tiatives. The main focus here is on promoting young talent in the fields of robotics and automation. In 2017, for instance, research and technology institutions were supported, including Starkstrom e.V. at Augsburg University or the Aerospace LAB (Jugendforschungszen-trum Herrenberg Gäu e.V.).
European Robotics Week was initiated by the European robotics asso-ciation euRobotics and takes place every year in November. KUKA employees increase the public’s awareness of robotics over the course of this week. Children’s lectures on robotics were offered in schools and kindergartens in the year under review along with tours for school classes through KUKA’s production facilities.
KUKA Robotics also invited interested children in China to learn more about future technologies such as human-robot interaction and robotics.
Occupational health and safety further advancedOccupational health and safety are an essential requirement for ensuring that business operations run smoothly in manufacturing companies like KUKA. Appropriate management systems and the general awareness of occupational health and safety serve to protect the health of employees. Occupational health and safety is therefore firmly embedded in management systems and supported in some cases by external certifications at the major locations of KUKA Group.
In order to advance the topic of occupational health and safety even further in the future, we began to introduce Group-wide safety per-formance indicators (SPIs) in 2017. The awareness of employees is also enhanced by means of specific campaigns. A special campaign on preventing accidents caused by stumbling and falling was launched at the Augsburg location to reduce this frequent cause of accidents as far as possible.
Employees
Global growthAs a global provider of intelligent automation solutions, KUKA is continuing on its growth path. Our employees are the pillars of this expanding business. KUKA therefore places great importance on fur-ther enhancing its appeal as an employer. This includes a pleasant working environment, promoting diversity, high-quality vocational training and a wide range of further education and training courses.
Significant increase in personnel throughout the GroupIn the year under review, the Group’s workforce rose from 13,188 in 2016 to a total of 14,256 in 2017. This is an increase of 8.1%. The work-force was expanded worldwide. The Americas, in particular, recorded strong growth. The Robotics division increased its headcount by 6.0% to 5,010 employees (2016: 4,726). The number of employees in the Systems division rose by 5.2% to 5,459 (2016: 5,189). Swisslog recorded the largest increase with a rise of 8.4% to 2,904 employees (2016: 2,679).
Employees by division (Dec. 31)
2016
2017
4,726
Robotics Swisslog Systems AG /other
5,189 2,679 594
5,010 5,459 2,904 883

KUKA Aktiengesellschaft | Annual Report 2017
50
Vocational training at a high levelAt the end of 2017, KUKA Group was employing a total of 296 appren-tices (FTE) (2016: 305). Apprentices at KUKA are given opportunities for their own development, learning to think and act globally on a Group-wide scale. Apprentices gain experience abroad at other KUKA locations each year such as, for example, company sites in China and the USA. KUKA continues to maintain a high standard in the quality of training and the level of performance. This is repeatedly demon-strated by KUKA apprentice graduates finishing best in their year in their respective training occupation. In the year under review, the Swabian Chamber of Industry and Commerce honored five appren-tices as the best in their year for the occupation of electronics tech-nician for automation technology, industrial clerk, IT specialist and industrial mechanic. 24 apprentices completed their examinations prematurely in summer 2017 – with an average grade of 1.64. The best industrial mechanic in Germany completed his training at KUKA in the year under review. He prevailed against 20,000 competitors and won the award of “Germany’s best apprentice”.
Wide range of training and further education optionsKUKA Group offers a variety of training programs covering both tech-nical and commercial occupations:
› Industrial mechanic and lathe /milling machine operator › Mechatronics technician › Electronics technician for automation technology › Industrial clerk › IT specialist › Technical product designer › Warehouse logistics specialist › Specialist for forwarding and logistics services › Safety and security specialist
KUKA offers training in line with its requirements and provided 50 apprenticeships in Germany in 2017.
In addition to the traditional apprenticeships, KUKA offers a dual, training-integrated degree course at the University of Augsburg with the aim of gaining a Bachelor’s degree. In addition to the dual inte-grated study course for mechanical engineering, mechatronics and electrical engineering, the disciplines of business administration, information technology, technical information systems and business information systems are also available to choose from.
KUKA offers all employees a wide range of courses within the frame-work of the technical, methodical and personal professional develop-ment in the KUKA Academy. These include standard courses, such as computer and language courses, specific professional courses from the fields of sales, purchasing, business administration, strategic implementation and project management, along with seminars for leadership, communication and change management.
KUKA stands for diversity and toleranceAt KUKA, diversity involves promoting and benefiting from the diversity of our employees as a source of creativity, innovation and business success. We need a larger talent pool and are working on further increasing our appeal for employees, especially with a view to the skills shortage forecast for the future. In this regard, we take into account individual life concepts as well as social changes and the zeitgeist. Our employees are given the opportunity to develop on a personal level through flexible and mobile working conditions and models. Accepting and promoting diversity to benefit from different experiences and talents is part of the corporate culture at KUKA. We are convinced that the appreciation of our diversity has a positive effect on KUKA as a company, on how we deal with our customers and on our role in society.
Our aim is to create a working environment that is free of prejudice and characterized by acceptance and tolerance. All employees should be valued – regardless of their ethnicity, origin, gender, religion or religious views, disability, age and sexual orientation. To guarantee equal treatment for everybody, it is also important that there is no distinction between males and females in our remuneration system. At the end of 2017, KUKA signed the “Charta der Vielfalt” (diversity charter) in Germany, making a clear commitment to diversity.
Promoting networksThese measures reflect an understanding of diversity that has been established for years and which is evident in the existence of various networks and initiatives. For instance, we support the internal KUKA women’s network orangeWIN that helps to identify and promote female talents, we have been involved in the Augsburg cross men-toring program since 2011, which is committed to gender equality at work, and we participate in MigraNet with the aim of achieving the professional integration of people from a migrant background.
Employee share programAn employee share program was not launched in 2017 due to the takeover by Midea and the associated major change to the ownership structure.
Employees by region (Dec. 31)
2016
2017
Germany Rest of Europe North America Asia /other regions
5,140
4,739
2,757
2,505
4,183
3,912
2,176
2,032

Consolidated financial report
51
Forecast, opportunity and risk report
Opportunity and risk report
Basic principles
KUKA Group is a global enterprise with international operations. Any entrepreneurial activity provides new business opportunities, but also involves many risks, especially technical ones. The Executive Board of KUKA Aktiengesellschaft aims to systematically and sustainably improve the value of the company for all stakeholders and share-holders by seizing potential opportunities and minimizing said risks.
To achieve this objective, the Executive Board has implemented a comprehensive corporate risk management system to systematically and consistently identify, evaluate, manage, monitor and report the internal and external risks to which its divisions and subsidiaries are exposed.
Group management regularly assesses the likelihood that identified risks will occur and their potential impact on expected earnings (EBIT). Risks are categorized according to worst, medium and best case scenarios including the expected impact of the occurrence of an event. Accruals and write-downs associated with these risks are recognized in the annual financial statements in accordance with applicable accounting principles. The unsecured residual risks, i.e. risks according to risk mitigation measures (net assessment), are therefore depicted as risks.
The risk management system is subject to a monthly reporting pro-cess (risk inventory) which involves identifying new risks and carrying out a follow-up assessment of existing risks. The information that has been collected in this way is summarized in a risk report that is also prepared each month and addressed to the Executive Board of KUKA Group. This report contains a top 10 risk assessment and a risk exposure assessment (overall risk situation) for the divisions, KUKA Aktiengesellschaft as the holding company and KUKA Group. The top 10 risks are also a fixed part of internal monthly Management Report-ing and are discussed at monthly results discussions between the Executive Board of KUKA Group and the management of the divisions. The identified risks are additionally presented and explained in more detail to the Executive Board each quarter by the Risk Management Committee. The committee also determines whether any measures already implemented to minimize risk are adequate or whether further steps need to be initiated. These plenums also assess the plausibility of the reported risks and determine how to avoid similar risks in future. The risk report is also reviewed during Executive and Supervisory Board meetings, especially by the Audit Committee.
The managers of the divisions and subsidiaries are directly responsi-ble for the early identification, control and communication of risks. Risk managers in the central and decentralized business units ensure that the reporting process is uniform with clearly defined reporting channels and reporting thresholds that are in line with the size of the company. Internal ad hoc announcements are mandatory whenever risks exceed the Group’s defined reporting thresholds. The standard risk management procedures applied throughout the Group are effi-cient and effective. The head of risk management coordinates the risk management system. He compiles the individual risks identified into
the aforementioned top 10 risk overviews or risk exposure overviews and communicates and monitors them. This role is based within KUKA Aktiengesellschaft’s Group controlling department, which reports directly to the CFO of KUKA Aktiengesellschaft. This ensures that risk management is an integral component of KUKA Group’s overall planning, control and reporting process.
The Group’s risk management system enables the Executive Board to identify material risks at an early stage, initiate appropriate steps to counter these risks and monitor implementation of the steps. The internal audit department regularly monitors compliance with the risk management guideline of KUKA Group and therefore whether existing procedures and tools are effective. It also audits those responsible for the risks if this is relevant. The internal audit department also regularly audits the risk management process to ensure efficiency and continu-ous improvement. Furthermore, external auditors check that the early risk identification system is suitable for early identification of risks that could threaten the existence of the company as a going concern.
In addition to the risk management system, KUKA Group has an inter-nal control system (see Management Report, “Internal control and risk management system” section, page 59 et seq.) above and beyond the risk management system, which it uses to continuously monitor the appropriateness of the corporation’s business and accounting processes and identify potential improvements.
Strategic risks and opportunities
KUKA’s business divisions aim to be among the technology and mar-ket leaders in their target markets. The key to achieving this is to con-sistently enhance their core technologies on the basis of coordinated innovation programs. One important task is to identify opportunities and risks associated with technical innovations early and to evalu-ate the innovations’ manufacturability. The company mitigates the impact of faulty market assessments by conducting regular market and competitor analyses, some of which are decentralized. Applica-tion-related developments, system partnerships and cooperative ven-tures reduce the risk of development work not conforming to market requirements. Strategic risks and opportunities are not quantified.

KUKA Aktiengesellschaft | Annual Report 2017
52
Operational risks and opportunities – KUKA Group
KUKA Group’s opportunities and risk-related controlling process ensures that the company’s managers take both opportunities and risks into consideration. The Group’s risk exposure, based upon eval-uating operating risks according to the procedure outlined in the “Basic principles” section, is described below. The report includes the total aggregated maximum risk (worst case) and expected risk value, which are calculated on the basis of the various weighted scenarios and their respective likelihood of occurrence.
Opportunities and risks are assessed at division level and are not further aggregated. For this reason, the opportunities are dealt with in greater detail in the following sections on the divisions (Robotics, Systems, Swisslog).
Group risk exposure
in € millions
Worst case Expected risk value
2016 2017 2016 2017
Legal risks 6.1 7.7 -0.5 -0.5
Economic risks 26.4 27.3 -3.8 1.6
Total for the Group 32.5 35.0 -4.3 1.1
Legal and economic risks occur primarily as a result of the activities of the Robotics, Systems and Swisslog divisions. The changes compared to the previous year are mainly attributable to the Robotics and Sys-tems divisions. The Robotics division has registered an improvement
to the risk situation on account of the systematic implementation of measures. The difficult business development in 2017 compared to the previous year has led to increased damage potential for Systems. Intensified risk mitigation measures result in a theoretically negative expected risk value in individual cases.
More detailed explanations of legal and economic risks can be found in this section with regard to cross-division risks that are managed at Group level or in the following sections with regard to the indi-vidual divisions (Robotics, Systems, Swisslog). We also evaluate the potential worst-case damage that could be caused by the individual risks and the likelihood that they will occur, categorized as follows:
Maximum loss Likelihood of occurrence
Low to €5 million to 10%
Medium €5 to 10 million 10 to 25%
High €10 to 20 million 25 to 40%
Very high over €20 million over 40%
Please refer to the Group notes, starting on page 72, for details regard-ing the precautionary balance sheet measures for the identified risks.
Cross-division opportunities and risks such as financing, personnel and IT are analyzed and managed at Group level, not by the individual divisions, which is why said risks are only addressed from the Group perspective in the opportunity and risk report.
Risk management organization
Supervisory Board
Risk management committee
Specifies standardized procedures
Ensures efficiency and effectiveness
Coordination PlausibilityMonitoring
Reporting
IdentificationEvaluation
ManagementMonitoring of individual risks
Internal and external auditors check the risk management system and the risk early detection system
Risk management in the divisions
Executive Board
Central risk management
Risk management at the subsidiaries

Consolidated financial report
53
Since KUKA conducts business around the world, it is obliged to com-ply with many international and country-specific laws and regulations issued by, for example, tax authorities. The company employs spe-cialists familiar with the respective countries’ laws on a case-by-case basis. Opportunities and risks arise as a result of changes to legal frameworks. For example, tax audits discovering non-compliance issues could negatively impact the Group in the form of payment of interest charges, penalties and back taxes. At the present time, there are no foreseeable tax or legal issues that could have a significant negative impact on KUKA Group. Appropriate provisions have been recognized for tax risks based on experience.
Standard general contracts are used whenever possible to cap legal risks. The Group’s legal department supports the operating compa-nies to help limit risks associated with in-house contracts, warranty obligations and guarantees as well as country-specific risks such as the lack of patent and brand protection in Asia. KUKA has developed an independent strategy to safeguard its intellectual property, which is primarily secured by patents and trademark rights.
In addition, Group-wide Directors’ and Officers’ (D&O) liability insur-ance policies are in place that cover the managing bodies (Executive Board and managing directors) and supervisory bodies (Supervisory Board, administrative and advisory boards) of the German and for-eign subsidiaries. Existing insurance policies are reviewed annually in order to weigh the relationship between the insurance protection and deductible amount versus the risk premium.
There are no operating risks in existence for KUKA AG or other com-panies.
Operational risks and opportunities in the divisions
KUKA is exposed to the cyclic investment behavior of its customers in the various market subsectors. A major portion of the Systems, Robotics and Swisslog divisions’ business volume is in the automo-tive sector where oligopolistic structures and constant price pres-sure are ongoing concerns. Fluctuations in the industry’s capital spending plans are also considered in the respective strategic and operative plans by analyzing public announcements and disclosures. The company continuously strives to be as flexible as possible with its own capacities and cost structure to address the cyclic nature of the business.
KUKA benefited from significant investment activities in both the automotive industry and general machinery and systems engineering sector throughout the 2017 fiscal year. The fact that KUKA Group’s key automotive customers enjoy an excellent competitive position in their markets gives rise to additional opportunities. In comparison to its own competitors, KUKA Group sees business growth opportunities due to its customer portfolio, particularly with respect to the growth of its customers’ market shares. Further opportunities arise due to the gen-eral trend toward greater automation in non-industrial sectors, such as the long-term prospects associated with assisting an aging society. KUKA Group improved its depth of value added and continued to imple-ment the digitization strategy with the acquisitions made in 2017.
KUKA works with suppliers that focus on quality, innovative strength, continuous improvement and reliability so that it can supply its own customers with products of the highest possible quality. Generally, KUKA sources product components from several suppliers in order to minimize the risk of sharp price rises for key raw materials, but
in a few cases, due to a lack of alternative sources, is dependent on single suppliers that dominate their markets.
KUKA RoboticsDemands for continuous product innovation from international customers and unrelenting cost awareness are the key challenges for this division’s product portfolio; especially when it comes to the automotive industry and its subsuppliers. The result is permanent price pressure and potentially longer life cycles for the robotic appli-cations combined with demands for ever-improving quality and longer warranties.
KUKA Robotics responds to such trends by continually developing new products and applications that offer customers in existing markets quantifiable financial benefits driven by quick paybacks. Launching new products goes hand in hand with product performance risks and quality guarantees, which could generate additional costs if rework is required. KUKA employs a comprehensive quality management sys-tem that includes extensive validation and test processes to manage such risks or avoid them altogether.
KUKA sees an opportunity to continuously expand its customer base in general industry with a focus on electronics. One of the company’s key strategic thrusts is to penetrate new, non-automotive markets. The company’s profitability will become less and less dependent on exchange-rate fluctuations as it increasingly spreads its value added across different local currencies.
Robotics risk exposure
in € millionsWorst case Expected
risk value
Legal risks 2.6 0.0
Economic risks 4.6 0.0
Total for Robotics 7.2 0.0
The assessed potential damage associated with all individual risks is low (to €5.0 million) and the likelihood of occurrence is low to high (to 40%).
KUKA SystemsThis division’s sales and profits are subject to general business risks due to the length in time it takes to process project orders, the revi-sions to the specifications that are often necessary while already processing the orders, the infrequency of the orders received, and the price and competitive pressures. Other risks associated with these projects include inaccurate prediction of the actual costs as well as penalties for late deliveries. The division therefore uses appropriate risk checklists for individual orders in order to assess the associated legal, economic and technological risks prior to preparing a quotation or accepting a contract. One of the components of project execution is to monitor and track solvency risks and mitigate them using a strict project and receivables management process. Other risks are continuously monitored and if necessary accounted for by way of accruals or write-downs. Opportunities associated with the project business arise mainly when parts can be purchased at a lower cost than originally estimated and by invoicing the customer for any change orders received over the course of the project. There were capacity bottlenecks and delays with numerous projects in Europe in 2017, which resulted in considerable additional costs. Significantly more external resources had to be obtained than planned to address

KUKA Aktiengesellschaft | Annual Report 2017
54
the bottlenecks and make up for the delays. Services in the robot programming sector, in particular, are currently hard to come by on the European market and are subject to considerably higher prices. These effects have been taken into account in the amended project calculation and are already included in earnings for 2017 through provisions for impending losses.
Major automakers throughout the world are currently expanding their global manufacturing capacities with a high level of dynamism. KUKA increasingly works together with internal partners, with several of the division’s regional subsidiaries collaborating on a customer project. In these situations, there are risks involved in information exchange, the value-added process and project management across various IT systems. There are also organizational risks associated with extraor-dinarily rapid and strong growth in business volume, particularly in emerging markets. KUKA mitigates these risks by harmonizing its global IT systems and deploying experienced internal and contract employees when establishing and expanding the local organizations.
The increasing variety of models offered by the automotive industry has a positive impact on the potential market volume, since this generates increasing demand for flexible manufacturing systems, which in turn spurs demand for new or revamped assembly lines. This creates new business opportunities for system providers and subsuppliers. Scarce resources are driving demand for smaller and more fuel-efficient vehicles that will use alternative energy sources. This means automakers, especially American manufacturers, will soon have to invest in new production lines or upgrade their existing assembly lines.
Pay-on-production contracts such as KTPO’s (KUKA Toledo Produc-tion Operations) offer additional opportunities, but also risks. The Jeep Wrangler brand continues to promise above-average growth prospects compared to other American car models. KUKA again participated in this growth during 2017. Here risks involve greater dependence on the volumes produced for the American car market.
Thorough market analyses have shown that KUKA Systems also has long-term business opportunities outside the automotive industry; namely, in general industry. The main risks here when tapping into new market potential relate to technical requirements, since cus-tomers in these sectors often have no experience with automated systems. The aforementioned checklists to review the technical risks associated with applying new automation techniques are therefore an especially important tool for mitigating risks.
Systems risk exposure
in € millionsWorst case Expected
risk value
Legal risks 3.6 0.2
Economic risks 22.0 1.0
Total for Systems 25.6 1.2
The assessed potential damage associated with all individual risks is low to high (to €20.0 million) and the likelihood of occurrence is low to high (to 40%). Intensified risk mitigation measures result in a theoretically negative expected risk value in individual cases.
SwisslogThe division is subject to long-term investment cycles spread over various industries, such as hospitals, pharmaceuticals, food and e-commerce. The competition and the associated pressure on prices vary from one region to another. High investments in its own products to expand its range of solutions serve to strengthen the company’s competitive position considerably. The Swisslog segment broadens KUKA’s product portfolio and makes a decisive contribution to inde-pendence from the automotive industry.
In some cases, projects for the automation of warehouse and dis-tribution centers are subject to long lead times which can give rise to financial risks resulting from miscalculations, failure to meet acceptance specifications or late deliveries. To counter this, regular project risk assessments are carried out at different stages of the projects by those responsible for project implementation in the rel-evant countries. Potential risks are regularly checked, new ones are added or existing ones eliminated, and measures for risk reduction are introduced and their progress documented. Projects requiring particular management attention are classified as “top attention projects” and their status is communicated monthly to the higher management levels.
Market data indicate that the increasing pressure on costs and the strict safety requirements for hospital logistics offer high growth potential for automation. Furthermore, consolidated service centers, in which hospitals standardize their logistics processes and achieve cost advantages, generate greater demand for automation solutions.
Swisslog risk exposure
in € millionsWorst case Expected
risk value
Legal risks 1.5 -0.7
Economic risks 0.8 0.5
Total for Swisslog 2.3 -0.2
The assessed potential damage associated with all individual risks is low (to €5.0 million) and the likelihood of occurrence is low to high (to 40%). Intensified risk mitigation measures result in a theoretically negative expected risk value in individual cases.

Consolidated financial report
55
Financial risks
KUKA Group is under the financial control of KUKA AG. The primary objectives of financial management are to secure the liquidity and creditworthiness of the Group, thus ensuring financial independence. Effective management of foreign exchange, interest rate and default risk also serves to reduce earnings volatility.
KUKA AG identifies, coordinates and manages the financial require-ments of the Group companies and optimizes the financing of the Group. For this it employs a Group-wide standard treasury manage-ment and reporting system. KUKA AG normally procures finance centrally and distributes the funds among the Group companies. In addition, liquidity risk is reduced for KUKA Group by closely monitor-ing the Group’s companies and their management of payment flows.
The significant improvement in the company’s credit rating during recent years is a reflection of the positive development of KUKA Group and guarantees access to a broad investor base as a source of finance while also supporting the Group companies in their negotiations with customers, suppliers and service providers. Both Moody’s and Stand-ard & Poor’s, the two rating agencies which KUKA works with, raised the KUKA Group rating to investment grade in 2017 and now rate KUKA as Baa3 and BBB- respectively with a stable outlook.
KUKA pursues a conservative financing policy with a balanced funding portfolio. This is essentially based on the promissory note loans issued in 2015 with maturity dates up to 2022 and a syndi-cated loan extended and adapted again at the start of 2018 with a term until 2023 and two one-year extension options. Two standard financial covenants (leverage and interest coverage ratio) have been agreed for the syndicated loan. KUKA monitors adherence to these covenants based both on the current figures and on planning; the covenants were complied with throughout the 2017 fiscal year. As at December 31, 2017, both covenants were well within the contractually defined limits. Beyond these two financing agreements, additional financing options are available to KUKA within an ABS and factoring program. Please refer to the notes to the annual financial statements, “Financial liabilities /Financing”, page 103, for comprehensive details of the syndicated loan and the extent to which the agreed credit lines have been utilized.
KUKA hedges the risks from operations, especially currency risks, and risks from financial transactions with financial derivatives. Transactions in financial derivatives are only entered into for hedg-ing purposes, i.e. solely with reference to and for hedging underlying transactions. Whenever possible, KUKA AG is the central hedging partner of the Group companies, and it in turn hedges the Group’s risks by concluding appropriate hedging transactions with banks. Internal guidelines govern the use of derivatives, which are subject to continuous internal risk monitoring. For a more precise descrip-tion of our risk management objectives and the methods employed, please refer to the notes on financial risk management and financial derivatives, starting on page 105.
Currency translation risks, i.e. measurement risks associated with balance sheet and income statement items in foreign currencies, are not hedged, but are continuously monitored. The risk associated with the volatility of leading currencies and the resulting economic exchange risk (competitive risk) is mitigated by having production facilities in several countries (natural hedging).
Personnel risks and opportunities
The success of KUKA Group, a high-tech enterprise, depends to a great degree on having qualified technical and management staff. Person-nel risks arise mainly from employee turnover in key positions within the Group. Improvements in both business and economic prospects enable the company to strengthen the loyalty of its core personnel, train new, highly skilled employees and entice new recruits to join the Group. This applies to the traditional markets in Europe and the United States, but especially to recruiting employees in growth markets, where the need for skilled employees is growing steadily. Last but not least, in-house continuing education programs such as those offered by KUKA Academy or employee suggestion programs generate opportunities resulting from the improved motivation and qualification of the workforce.
IT risks and opportunities
IT risks have risen over the past number of years, not least because of the importance of IT to business processes. These risks relate to both the frequency of viruses or hacking and the damage they could poten-tially cause. The existing IT security and business continuity manage-ment systems as well as guidelines and organizational structures are continuously optimized and reviewed in an effort to predict and minimize possible IT-related risks such as failure of computer centers or other IT systems. One way this is addressed is by continuously upgrading hardware and software. Furthermore, KUKA has launched several transformation projects which are currently running with the objective of harmonizing processes and the supporting IT application system architecture throughout the Group. This will generate long-term cost reduction potential and lead to continuous quality improve-ments. By systematically monitoring the processes concerned, the company reduces the risks associated with an increasing number of external threats as well as dependence on the ever-expanding digiti-zation of business processes.
Compliance risks
Compliance violations may lead to fines, sanctions, judicial orders regarding future conduct, forfeiture of profits, exclusion from certain transactions, loss of trade licenses or other restrictions. Furthermore, involvement in potential corruption proceedings could harm the over-all reputation of KUKA Group and could have a negative impact on efforts to compete for business in both the public and private sectors. Such proceedings could also have a negative impact on the relation-ship KUKA Group has with business partners upon which it depends as well as its ability to find new business partners. They could fur-thermore negatively impact the company’s ability to pursue strategic projects and transactions of potential importance for the business, such as joint ventures or other forms of cooperation. Ongoing or future proceedings could lead to the suspension of some existing contracts, and third parties, including competitors, could initiate legal proceed-ings against KUKA Group for substantial sums of money.
KUKA therefore rolled out a Corporate Compliance Program in early 2008 to make such risks transparent and controllable. The Compli-ance Committee established through this program meets at regular intervals and ad hoc and reports to KUKA Aktiengesellschaft’s CEO, who in turn reports directly to the Supervisory Board’s Audit Commit-tee. The CEO is ultimately responsible for the Corporate Compliance Program, which is regularly updated and subject to strict internal controls. Moreover, mandatory training is organized for employees on

KUKA Aktiengesellschaft | Annual Report 2017
56
compliance issues at regular intervals (as too in 2017, including an e-learning program). No substantial risks were identified in 2017 due to the active countermeasures taken to mitigate risk at an early stage and to eliminate risk sources, e.g. by realigning business processes.
Other risks
KUKA Group continuously monitors other risks and mitigates these to the greatest extent possible. There is no evidence of environmental risks from operational activities, since the company does not use haz-ardous materials. The Group makes use of buildings and properties for its business operations, some of which it owns. As a result, the company is exposed to risks associated with any residual pollution, soil contamination or other damaging substances that may be discov-ered on its properties. There is currently no evidence of any situations that would have a negative impact on the measurement of balance sheet items. However, it cannot be ruled out that any such situa-tions, which could, for example, require costly clean-up operations to be undertaken, will occur in the future. Please refer to page 63 for information about material agreements subject to conditions related to a change of control.
Summary
Overall, KUKA Group’s named risks relate to the business performance of the divisions and financial risks associated with currency exchange rate fluctuations and corporate financing. The Executive Board is not aware of any individual or aggregated risks that could threaten the company’s existence. Strategically and financially, the company is positioned to be able to take advantage of business opportunities.
Forecast
General economic environment
Development of the global economy is generally positive and the upturn is continuing. According to the International Monetary Fund (IMF) the global economy grew 3.7% in the past year. Compared with growth in 2016, this represents an increase of 0.5 percentage points.
For 2018, the IMF expects the global economy to expand again more rapidly and has forecast economic growth of 3.9%. The IMF therefore increased its outlook for global economic growth by 0.2 percentage points. It sees the reasons for this increase in the generally stronger momentum of global growth and the US tax reform. The tax breaks for companies will result in rising investments, from which the trading partners of the USA are also likely to benefit. The North American market is one of the most important sales markets for KUKA Group. For the USA, the Fund specified a growth forecast of 2.7% in its outlook for 2018. However, the IMF warns that a slowdown is to be expected when government incentives for investments are phased out and the rising national debt gradually necessitates appropriate measures.
According to the IMF, the economy has picked up in many eurozone countries. The experts forecast growth of 2.2% in the eurozone for 2018 after an estimated 2.4% in 2017. Demand has increased both domestically and internationally. They expressed slight concern about Spain given the calls for independence of Catalonia. The forecast was reduced here from 2.5% to 2.4%. The experts increased their outlook for Germany in 2018 by half a percentage point to 2.3%. The fund was skeptical about the United Kingdom in view of the planned exit from the EU. Growth of 1.5% is expected here in 2018.
The IMF is anticipating 6.6% growth in China during 2018. This is 0.1 percentage points more than was forecast in the autumn. There are signs of weaker growth in China according to the IMF, as the gov-ernment’s financial incentives of the last few years are to be reduced and lending criteria tightened in order to strengthen the financial system. However, the IMF still sees China as a major driver of global growth. China is an important growth market for KUKA Group.
IMF expectations for the most significant global markets from KUKA’s viewpoint:
Economic growth
in % 2016 2017 2018
Germany 1.9 2.5 2.3
Eurozone 1.8 2.4 2.2
USA 1.5 2.3 2.7
China 6.7 6.8 6.6
Developing /emerging economies 4.4 4.7 4.9
World 3.2 3.7 3.9
Source: IMF, January 2018

Consolidated financial report
57
Robotics and automation continue to grow worldwide
The forecast for further growth in robot-based automation remains high. Demand for automation solutions is growing worldwide. The International Federation of Robotics (IFR) is expecting an average global growth rate between 2018 and 2020 of more than 15%. Indus-trie 4.0 solutions will continue to gain in significance. Connection of the real world to the virtual world allows new business models to be implemented. This makes production more flexible. Efficiency enhancements, quality improvements, higher quantities, rising prod-uct diversity and increasing flexibility continue to drive automation.
Growth opportunities for KUKA
1) ChinaThe demand for automation solutions is continuing to increase in China. China is now not only the world’s largest, but also the fast-est-growing market. According to the IFR, the annual sales figure of 57,100 in 2014 increased to a record high of 87,000 units in 2016. Such a significant rise in such a short space of time is unique in the history of robotics. Robot density, and thus the degree of automa-tion, is significantly lower in developing and emerging countries than in industrialized nations. This applies to both the automotive and the general industry segments. The growth potential of robot-based automation in these markets is therefore much higher than in the industrialized countries, which is why above-average growth rates are forecast, especially for China.
The main reason for the high growth rates in China is the demo-graphic development, which poses new challenges for the country. The percentage of the working population is stagnating, while wages are rising. Automation solutions can help to absorb the increasing cost pressure and to meet the growing quality requirements for the products. The Chinese government is therefore pushing ahead with the automation of its industry. The modernization plan “Made in China 2025” was launched with the aim of improving the interna-tional competitiveness of Chinese industry.
KUKA sees the Chinese robot and automation market as a core ele-ment of its future growth strategy. For this reason, KUKA is expanding in China and increasing its market presence. The production capacity of the robot assembly facility in Greater Shanghai will be doubled by the beginning of 2018. The number of employees in China rose to 1,373 in 2017 and corresponds to around 10% of the total workforce. This means that KUKA has an even stronger local presence. In addi-tion, KUKA will be actively involved in establishing the planned Tech-nology Park in Shunde. A regional center of excellence for robot-based automation solutions is to be created there. Through Midea’s support, KUKA expects to gain an even greater market presence in China over the coming years with positive stimuli for the Group’s growth.
2) General industryThe robot density (number of robots per 10,000 employees) in general industry is still at a relatively low level compared to the automotive industry. According to the IFR, growth potential is mainly expected in the Asian market, especially in the electronics industry (computers, communications and consumer goods). Significant potential is also forecast for the logistics /e-commerce, metal, machine tools and food industries.
This is partly due to the challenges facing manufacturing companies in general industry. These include the ever shortening product life cycles, the desire of consumers for customized products, increasing competitive pressure and the pressure to further reduce emissions.The automation of production processes can assist in overcoming these challenges. This is why the sales potential in the automation sector is high.
Digitization will play an increasingly important role in enabling com-panies to produce flexibly. The right technologies are required here, such as human-robot collaboration, cloud technologies and mobility. Companies can make their production more efficient and flexible with the digital factory.
KUKA is therefore expecting the demand for automation solutions in general industry to be considerably higher over the next few years and is pursuing the strategy of further expanding its market shares in this segment.
3) AutomotiveInvestments of the automotive industry to further expand produc-tion capacities and modernize existing plants have increased since 2010. Further investments are anticipated from car manufacturers in the coming years and the IFR therefore expects the environment to remain positive for automation companies.
Robot density in automotive and general industry Robots per 10,000 employees
Japan
USA
Germany
UK
China
Brazil
India
1,261
1,240
1,131
673
505
79
Automotive General industrySource: IFR World Robotics 2016
(published September 2017)
101
214
181
39
33
1
147 5

KUKA Aktiengesellschaft | Annual Report 2017
58
The automotive industry has the highest level of automation world-wide and is a technology leader in this respect. Declining product life cycles and simultaneously increasing model diversity require flexible production systems in order to avoid the risk of efficiency losses. Despite the already high level of automation in the auto-motive industry, growth potential is therefore mainly expected for applications involving human-robot collaboration. This allows robots to work together directly with people and to support them flexibly with their tasks.
KUKA is working in close cooperation with its customers to shape future technologies such as autonomous driving and e-mobility. For example, the company has planned and set up a production system for manufacturing battery modules and high-voltage batteries for use in electric vehicles for a leading European manufacturer in the automotive industry. The system has a high level of automation and a modular design, allowing for the integration of additional press mod-ules. A cooperation agreement was also concluded between KUKA and Volkswagen Corporate Research for jointly developing robot-based innovation concepts for vehicles of the future. Here too, KUKA expects significant market potential.
4) Digitization and Industrie 4.0The production landscape is being fundamentally transformed by Industrie 4.0: automated manufacturing technologies, mechanical engineering and intelligent IT systems are being networked to cre-ate smart factories. These smart factories are characterized by their versatility, flexibility, resource efficiency and ergonomic workplace design. Customers and business partners are integrated into business and value creation processes. As an automation company, KUKA is actively shaping the transformation of industrial production and is playing a central role in the practical implementation of Industrie 4.0.
The robot serves as the link between the digital and real worlds in Industrie 4.0 and between humans and technology. The robot pro-vides assistance and takes over the monotonous, dangerous or physi-cally demanding work, while the humans can perform more complex and challenging tasks.
Intelligent and flexible manufacturing makes high-quality one-off production possible with the benefits of serial production such as low unit costs. Traditional manufacturing is being superseded by the flexibility of new technologies. An important basis for this is the inter-operability of systems, which is where one of KUKA’s strengths lies: the automation specialist offers hardware and software from a single source. This is an important competitive advantage for our customers since production sequences can be better coordinated by networking.
In order to further strengthen KUKA’s ability to innovate, the company invested in technologies for the factory of the future in the past fiscal year. For example, KUKA invested in Device Insight, a Munich-based IoT company. Device Insight’s IoT platform networks machines, vehi-cles, systems and devices. KUKA also acquired Visual Components, a company offering software solutions for 3D simulation in factory planning. KUKA is thus stepping up its endeavors to automate pro-duction processes and make them more flexible, while also enhancing its own IoT expertise.
Company-specific factors
SummaryGiven the current economic forecasts and general conditions and taking into consideration the existing risk and opportunity potential, KUKA anticipates rising demand in the 2018 fiscal year, particularly from North America and Asia. A slight increase in demand is expected in Europe as a whole. In this region, KUKA will now be more selective when it comes to accepting new projects in systems engineering, which may also lead to a decline in the level of orders in this segment. From a sector perspective, KUKA expects a positive development for the sales markets in general industry. Demand in the automotive industry is anticipated to remain stable, now that customer invest-ments have risen considerably in recent years.
KUKA operates globally and is subject to the impact of exchange rate fluctuations. The US market contributes to approximately one third of worldwide Group revenues and is therefore one of the most important regions. A higher US dollar /euro exchange rate has a positive impact on the key financial indicators for KUKA Group. A weaker US dollar compared to the previous year is likely to have an adverse effect. As KUKA’s main competitors largely produce in Japan, the develop-ment of the yen /euro exchange rate is also relevant. A weaker yen /euro exchange rate has a negative impact. The currency effects are described in detail in the notes, starting on page 72.
Anticipated business development at KUKA
Summary 2017 result 2018 outlook
Sales revenues €3,479.1 million >€3.5 billion
EBIT margin 4.3% 1 ~ 5.5% 2
Net income for the year €88.2 million rising
Investments 3 €138.8 million rising
Free cash flow -€135.7 million at prior-year level
Dividend per share €0.50 at prior-year level
1 Before purchase price allocations (€13.7 million) and before growth investments (€31.9 million)
2 Before purchase price allocations, before growth investments and before reorganization expenditure (€30 million)
3 Before financial investments
Definitions:Rising /declining: absolute change compared to prior year >10%
Sales revenues and EBIT marginOn the basis of the current general conditions and exchange rates, KUKA is expecting sales revenues of more than €3.5 billion in the 2018 fiscal year. Based on the current economic environment and the antic-ipated business development, KUKA Group expects to achieve an EBIT margin of ~ 5.5% before purchase price allocations, investments in growth and reorganization expenditure amounting to about €30 mil-lion. The investments relate, for example, to Group-wide issues such as digitization, Industrie 4.0, mobility, general industry and China. KUKA is expecting these investments to open up additional areas of growth for the Group in the coming years, which should be reflected in higher sales revenues. The expenditure for the amortization of the purchase price allocations should amount to about €15 million in 2018.

Consolidated financial report
59
KUKA AG acts as the Group’s management holding company with central management responsibilities. The income situation of KUKA AG depends on the results of subsidiaries, its financing activities and the expenditure and income relating to the holding function. This includes, for example, income from the rental of buildings to the KUKA companies at the Augsburg location. A forecast for revenues and the EBIT margin is specified exclusively at Group level due to the purely holding function of KUKA AG.
Net incomeIn the 2017 fiscal year, KUKA Group generated net income for the year of €88.2 million. The targeted increase in revenues is likely to have a positive effect on net income for 2018. The purchase price allocations, the expenditure for reorganization and the planned investments in growth will have a negative impact on the result. However, KUKA is expecting an overall increase in the net income at Group level for 2018. KUKA Aktiengesellschaft too is anticipating a further significant improvement in earnings within the range of the previous years.
KUKA AG’s result in the separate financial statements depends pri-marily on the profit transfers of the German subsidiaries and on dividends from subsidiaries.
Research and development /investmentsKUKA operates in a highly dynamic, innovation-driven market envi-ronment. With the aim of securing the long-term success of the company, KUKA is continuing to invest in solutions for the factory of the future. The R & D investment will therefore be further increased in 2018. The expenditure primarily focuses on software solutions and on the enhancement of existing products in terms of performance, costs and customer benefits. KUKA is also investing in digitization /Industrie 4.0, mobility and human-robot collaboration. KUKA plans to invest around 5% of the expected revenue volume in research and development in 2018 (2017: €128.7 million).
Free cash flowKUKA Group’s free cash flow is primarily generated from operating profits and the development of working capital. Based on the current general conditions and the planned revenue growth, KUKA Group expects a free cash flow in 2018 that will be at the level of the pre-vious year.
DividendThe Executive and Supervisory Boards will recommend to sharehold-ers at the Annual General Meeting on June 6, 2018 that a dividend of €0.50 per share be paid for the 2017 fiscal year.
For the 2018 fiscal year, KUKA plans to maintain its dividend, allowing for the general conditions at the time.
Internal control and risk management system
Basic principles
Pursuant to section 289 para. 4 and section 315 para. 4 of the German Commercial Code (HGB), KUKA Aktiengesellschaft as a publicly traded parent company, must describe within the Management Report the key characteristics of its internal control and risk management sys-tem with regard to the accounting process. The description must include the accounting processes of the companies included in the consolidated financial statements.
The risk management system comprises all organizational rules and measures related to identifying risk and dealing with entrepreneurial risk (see the Opportunity and Risk Report on page 51 et seq.). The internal control system is an integral part of the risk management system.
The internal control system (ICS) comprises all principles, processes and measures introduced to the company by management that result in systematic and transparent risk management. The internal control system focuses on organizational implementation of management decisions made to ensure the effectiveness and efficiency of busi-ness operations (including the preservation of assets, which includes preventing and exposing asset misappropriation), adherence to gen-erally accepted accounting principles and the reliability of internal and external accounting and compliance with the legal provisions relevant to the company.
The objective of the ICS is to obtain sufficient certainty using the implemented controls and to be able to monitor and manage risks to ensure that the company’s goals can be achieved. Various monitoring measures – both integrated into and independent of the processes – contribute to the preparation of annual and consolidated financial statements that are in conformity with the legal provisions.
Regardless of its specific form, an ICS is unable to provide absolute certainty as to whether it will achieve its objectives. Taking this into account, the accounting-related ICS can only provide relative cer-tainty rather than absolute certainty that material misstatements in accounting will be avoided or detected.
Structures and processes
With regard to the accounting process, the structures and processes described below have been implemented in KUKA Group. The Exec-utive Board of KUKA Aktiengesellschaft bears full responsibility for the scope and design of the ICS.
The system extends via clearly defined management and reporting structures to all subsidiaries that are included in the consolidated financial statements.
For the Group’s German companies, the Shared Service Center of KUKA Aktiengesellschaft is responsible at a central level for account-ing and human resource operations.

KUKA Aktiengesellschaft | Annual Report 2017
60
Intra-group tasks such as treasury, legal services and taxes are also largely performed centrally by KUKA Aktiengesellschaft on the basis of uniform Group processes.
The principles, organizational structures and processes of the (Group) accounting-related internal control and risk management system are defined in guidelines and organizational procedures. Adjustments based on external and internal developments are integrated on a continuous basis and made available to all employees concerned.
Characteristics of the internal control and risk management systemWith respect to the accounting process, we regard those characteris-tics of the internal control and risk management system as material that can significantly impact the accounting and the overall presenta-tion of the consolidated and annual financial statements, including the combined Management Report. At KUKA Group, these include, in particular:
› Identifying the main areas of risk (see the Opportunity and Risk Report on page 51 et seq.) and control that affect the (Group) accounting process;
› Quality controls to monitor the (Group) accounting process and the accounting results at the level of the Group Executive Board, the management companies and individual reporting entities included in the consolidated financial statements;
› Preventive control measures in the finance and accounting systems of the Group and the companies included in the con-solidated financial statements as well as in operating business performance processes that generate key information for the preparation of the consolidated and annual financial statements and the combined Management Report, including a separation of functions of predefined approval processes in relevant areas;
› Process-integrated monitoring measures such as the principle of dual control for which each material business transaction must be signed or otherwise approved by at least two authorized persons;
› Measures to ensure proper, IT-supported processing of (Group) accounting-related facts and data. These include, for example, central management of access rights to the bookkeeping sys-tems and automated plausibility checks when data are recorded in the reporting and consolidation system;
› Implementation of the control requirements to be met by the accounting-related ICS is defined and monitored by the central Group ICS department, which remains independent of the processes. By means of a defined procedure, the internal controls are documented by the responsible departments and then examined by independent parties – normally the Group ICS department – for functional capability and effectiveness. Any weak points in the control system are targeted through action plans, whose implementation is monitored. Significant control weaknesses and the implementation of action plans are reported to the Executive and Supervisory Boards.
Internal Audit constitutes an additional control entity that is inde-pendent of processes and regularly reviews the organizational structures, processes and orderliness in addition to the defined ICS requirements, thus contributing to compliance with the ICS and risk management system.
In addition, the CFOs of all subsidiaries must provide an internal responsibility statement in the context of external reporting every quarter, confirming that the data reported are correct. Only then do the members of the Executive Board of KUKA Aktiengesellschaft issue and sign a responsibility statement at year-end (see page 121), by which they confirm that they have adhered to the prescribed accounting standards of KUKA Group and that their figures give a true and fair view of the Group’s financial performance, financial position and cash flows.
The elements of the ICS relevant for financial reporting are evaluated by an auditor to determine their effectiveness as part of a risk-ori-ented audit approach.
In its meetings, the Audit Committee of the Supervisory Board reg-ularly reviews the effectiveness of the accounting-related internal control system. The Supervisory Board therefore continuously obtains an appropriate view of the Group’s risk situation and monitors ICS effectiveness. In so doing, the Executive Board of KUKA Aktienge-sellschaft presents the risks associated with financial reporting at least once per year, outlines the control measures implemented, and monitors their correct execution.
Summary
The structures, processes and characteristics of the internal control and risk management system that have been depicted ensure that the accounting processes of KUKA Aktiengesellschaft and KUKA Group are uniform and are implemented in accordance with the legal requirements, generally accepted accounting principles, international accounting standards and internal Group guidelines.
They also ensure that transactions are recognized and measured uni-formly and accurately throughout the Group and that accurate and reliable information is therefore provided to the internal and external recipients of the information reported.

Consolidated financial report
61
Disclosures in accordance with sections 315b, 315c, 289c, sections 315d, 289f and section 315a para. 1 of the German Commercial Code (HGB) including accompanying explanationsThe disclosures in accordance with takeover law required by sec-tions 315d, 289f and 315a para. 1 of the German Commercial Code (HGB) are presented as of December 31, 2017 and explained in the following.
Composition of subscribed capital
As of December 31, 2017, the total share capital of KUKA Aktienge-sellschaft amounted to €103,416,222.00 and consisted of 39,775,470 no-par-value bearer shares with pro rata share capital of €2.60 per share. The share capital is fully paid up. All shares have equal rights and each share guarantees its holder one vote at the Annual General Meeting. Shareholders are not entitled to have share certificates issued for their shares (section 4 para. 1 of the Articles of Associa-tion). When new shares are issued, the start of profit sharing may be established at variance with section 60 para. 2 of the German Stock Corporation Act (AktG) (section 4 para. 3 of the Articles of Association).
Restrictions affecting voting rights or transfer of sharesThere are no restrictions affecting voting rights or transfer of shares.
Shareholdings that exceed 10% of the voting rightsAccording to the German Securities Trading Act (WpHG), any inves-tor who reaches, exceeds or falls below the voting rights threshold pursuant to section 21 of the WpHG through purchase, sale or by other means is obliged to report this to the company and the German Federal Financial Supervisory Authority (BaFin).
KUKA Aktiengesellschaft was informed of the following shareholdings of more than 10% of the voting rights by the following persons and companies until December 31, 2017 as follows:
Midea Group – Notification dated January 9, 2017
1. MECCA International (BVI) Limited 94.55% held directly
2. Midea International Corporation Company Limited
94.55% allocated pursuant to section 22 of the WpHG
3. Midea Group Co., Ltd. Foshan, China
94.55% allocated pursuant to section 22 of the WpHG
Midea Group communicated the following change to the investment of 94.55% on September 1, 2017 due to internal reallocations within the Group:
Midea Group – Notification dated September 1, 2017
1. Midea Electric Netherlands (I) BV 94.55% in part held directly and allocated pursuant to
section 22 of the WpHG
2. MECCA International (BVI) Limited 94.55% in part held directly and allocated pursuant to
section 22 of the WpHG
3. Midea International Corporation Company Limited
94.55% allocated pursuant to section 22 of the WpHG
4. Guangdong Midea Electric Co., Ltd.
94.55% allocated pursuant to section 22 of the WpHG
5. Midea Group Co., Ltd. Foshan, China
94.55% allocated pursuant to section 22 of the WpHG
Shares with special rights that confer powers of controlThere are no shares with special rights conferring powers of control.
Method of voting rights control when employees hold an interest in the share capital and do not directly exercise their rights of controlNo employees hold an interest in the share capital within the mean-ing of section 289a para. 1 no. 5 and section 315a para. 1 no. 5 of the German Commercial Code (HGB).
Legal provisions and provisions of the Articles of Association regarding the appointment and dismissal of Executive Board members and amendments to the Articles of Association
Pursuant to section 6 para. 1 of the Articles of Association, the compa-ny’s Executive Board must consist of at least two persons. The Super-visory Board determines the number of Executive Board members (section 6 para. 2 of the Articles of Association). The appointment and dismissal of members of the Executive Board are governed in sections 84 and 85 of the Stock Corporation Act (AktG), section 31 of the Co-Determination Act (MitbestG) and section 6 of the Articles of Association.
Pursuant to sections 119 para. 1 no. 5 and 179 para. 1 of the Stock Corporation Act (AktG), any changes to the Articles of Association require a resolution by the Annual General Meeting. Section 22 para. 1 of the Articles of Association states that a simple majority of the share capital represented at the Annual General Meeting is sufficient to pass a resolution, provided that a greater majority is not required by law. A greater majority is required in particular for resolutions concerning changes to the company’s business purpose, reductions in the share capital and changes to the form of incorporation.
Pursuant to section 11 para. 3 of the Articles of Association, the Super-visory Board is authorized to make amendments to the company’s Articles of Association that only affect the wording.

KUKA Aktiengesellschaft | Annual Report 2017
62
The resolution passed at the Annual General Meeting held on June 10, 2015 also authorized the Supervisory Board to amend the wording of section 4, para. 1 and 5 of the Articles of Association following complete (or partial) execution of the capital increase after Authorized Capital 2015 has been used and, if Authorized Capital 2015 has not been fully used by June 9, 2020, following expiration of the authorization.
With regard to the changes in the Authorized Capital and Conditional Capital 2010 and in the Conditional Capital 2013, the Supervisory Board was /is authorized by resolutions of the Annual General Meetings held on June 5, 2013 and May 28, 2014 to amend the wording of section 4 para. 1, 6 and 7 of the Articles of Association as per the respective issue of subscription shares and all other associated amendments to the Articles of Association that only affect the wording.
Furthermore, the Supervisory Board was authorized by resolution of the Annual General Meeting of May 28, 2014 to amend the wording of section 4 para. 1 and 8 of the Articles of Association after (fully or partially) increasing the share capital after utilizing Conditional Capital 2014 and, in the event this has not been (fully) utilized by May 25, 2016 or June 4, 2018, after expiry of the respective authori-zations or deadlines for exercising conversion rights.
Executive Board authorization to issue and buy back sharesAuthorized capital
As per the resolution of the Annual General Meeting on June 10, 2015 and section 4 para. 5 of the company’s Articles of Association, which was added on the basis of this resolution, the Executive Board, sub-ject to approval by the Supervisory Board, is authorized to increase the company’s share capital on or before June 9, 2020 by up to €46,420,808.20 through the issue of new shares in exchange for contributions in cash or in kind on one or more occasions (Author-ized Capital 2015). The shareholders shall be granted subscription rights. The new shares may also be underwritten by one or more financial institutions or by enterprises operating according to sec-tion 53 para. 1 sentence 1 or section 53b para. 1 sentence 1 or para. 7 of the German Banking Act, as specified by the Executive Board, subject to the obligation that they are offered to the shareholders for subscription (indirect subscription right). However, the Executive Board shall be authorized, subject to approval by the Supervisory Board, to exclude fractional amounts from shareholder subscription rights and to exclude shareholder subscription rights if a capital increase in exchange for contributions in kind takes place for the purpose of acquiring companies or parts of companies or interests in companies or other assets (including third-party claims against the company). Subject to approval by the Supervisory Board, the Executive Board shall be further authorized to exclude shareholder subscription rights in the event of Authorized Capital 2015 being used once or several times in exchange for cash contributions in an amount not exceeding 10% of the existing share capital at the time this authorization comes into effect and – if this value is lower – at the time this authorization is exercised, in order to issue the new shares at a price that is not significantly lower than the price of the company’s shares already quoted on the stock exchange at the time the new share issue price is finalized. Shares sold as a result of, and during the term of, the authorization granted at the Annual General
Meeting of May 28, 2014 in accordance with section 71 para. 1 no. 8 sentence 5 AktG in conjunction with section 186 para. 3 sentence 4 AktG shall count towards the aforementioned 10% threshold. Fur-thermore, this 10% threshold shall also include shares issued for the purpose of servicing warrant or convertible bonds, participation rights or participating bonds or a combination of these instruments, provided that these instruments were issued as a result of, and during the term of, an authorization granted at the Annual General Meeting of May 28, 2014 in accordance with the appropriate application of section 186 para. 3 sentence 4 AktG.
The Executive Board, subject to approval by the Supervisory Board, is only permitted to use the aforementioned authorization to exclude shareholder subscription rights to the extent that the pro rata amount of the total shares issued under exclusion of subscription rights does not exceed 20% of the share capital at the time the authorization becomes effective or of the existing share capital at the time this authorization is exercised, should this amount be less. The Executive Board is authorized, subject to approval by the Supervisory Board, to stipulate other details regarding the capital increase and its exe-cution, in particular with regard to share rights and the terms and conditions relating to the issuance of shares.
Conditional capital
Section 4 para. 8 of the Articles of Association stipulates a conditional increase in the company’s share capital by up to €33,486,707.80, divided into up to 12,879,503 no-par-value bearer shares (Conditional Capital 2014). The conditional capital increase will only be carried out to the extent that holders or creditors of option or conversion rights or conversion or option obligations exercise their option or conversion rights in exchange for cash for options and or convertible bonds, participation rights or participating bonds (or combinations of these instruments), issued or guaranteed by KUKA Aktienge-sellschaft or a dependent Group company of KUKA Aktiengesellschaft up to May 27, 2019 on the basis of the authorization granted to the Executive Board by shareholders at the Annual General Meeting of May 28, 2014, or, to the extent they were obligated to exercise their conversion or option rights, fulfill their conversion or option obligations, or to the extent that KUKA Aktiengesellschaft exercises its option to grant shares of KUKA Aktiengesellschaft wholly or par-tially instead of paying the monies due, provided no cash settlement or treasury shares or shares of another listed company are used to service the bonds. The new shares will be issued at the option or conversion price to be determined in accordance with the aforemen-tioned authorization resolution. The new shares will participate in the profits as of the beginning of the financial year in which they are created. The Executive Board is authorized, subject to approval by the Supervisory Board, to define the further details of the execution of the conditional capital increase.
There was also Conditional Capital 2010 (section 4 para. 6 of the Arti-cles of Association) and Conditional Capital 2013 (section 4 para. 7 of the Articles of Association) amounting to €2,958.80 and €25,789.40 respectively. This concerns the remaining amounts of the original Conditional Capital 2010 and 2013 after the complete service of con-vertible bonds issued on February 12, 2013 and July 26, 2013 with a total nominal amount of €150,000,000.00.

Consolidated financial report
63
Acquisition of treasury shares
As per the resolution passed by the Annual General Meeting on May 28, 2014, the company is authorized, until May 27, 2019, to buy back its own shares in an amount not to exceed 10% of the share capital existing at the time the resolution was passed via the stock market or in the form of a public purchase offer addressed to all shareholders by the company. In doing so, the purchase price (excluding transaction costs) may not be more than 10% higher or lower than the average stock market price defined in detail in the authorization.
The company may exercise this authorization in whole or partial amounts, once or several times; however, it may also be executed by dependent companies or companies in a majority holding of the company, or through a third party on behalf of the company or its dependants.
Pursuant to the above resolution, the Executive Board is also authorized, subject to approval by the Supervisory Board, to treat the treasury shares acquired subject to the exclusion of shareholder subscription rights on the basis of that and earlier authorizations as follows:
(1) To sell the treasury shares acquired to third parties in connection with company mergers or the acquisition of companies, or parts of companies, or interests in companies, or for the purpose of acquiring other assets (including claims of third parties against the company);
(2) To sell the treasury shares acquired by means other than via the stock exchange or an offer to all shareholders, provided the shares are sold for cash at a price that is not substantially lower than the quoted stock market price of treasury shares at the time of sale.
However, this authorization only applies subject to the proviso that the shares sold subject to the exclusion of subscription rights pursuant to section 186 para. 3 sentence 4 of the German Stock Corporation Act (AktG) may not, in total, exceed 10% of the share capital, whether on the effective date of the authori-zation or on the date on which it is exercised. The limit of 10% of the share capital is to include shares
(a) that are issued to service bonds with warrants or convert-ible bonds, participation rights or participating bonds, or a combination of these instruments, provided the instru-ments were issued on the basis of an authorization resolved by the Annual General Meeting of May 28, 2014 pursuant to the corresponding application of section 186 para. 3 sentence 4 of the German Stock Corporation Act (AktG);
(b) that are issued by exercising an authorization – in effect on the date on which the above authorization took effect or that was resolved by the Annual General Meeting of May 28, 2014, from authorized capital pursuant to sec-tion 186 para. 3 sentence 4 of the German Stock Corpora-tion Act (AktG), under exclusion of subscription rights;
(3) To use the treasury shares acquired to introduce the treasury stock on foreign stock exchanges on which they have not previ-ously been admitted for trading.
Treasury shares acquired on the basis of this authorization or authori-zations granted at an earlier time may be canceled without requiring a further resolution at the Annual General Meeting for the cancelation. Cancelation leads to reduction of the share capital. However, the can-celation can also be effected by means of a simplified process without the reduction of share capital by adjusting the proportionate amount of share capital of the remaining shares according to section 8 para. 3 of the German Stock Corporation Act (AktG). The Executive Board is in this case authorized to change the disclosure of the number of shares in the Articles of Association accordingly. This authorization for the acquisition of treasury shares, as well as the resale or cancelation of such shares, may be used once or several times, in whole or in part. Moreover, subject to approval by the Supervisory Board, the Executive Board is authorized to withdraw or resell the treasury shares acquired. Both the purchase and disposal authorization may be exercised in part on one or more occasions.
Significant company agreements that are conditional upon a change of control, and the resulting impact
Employment contracts of Executive Board members
The employment contracts of the Executive Board members contain change-of-control clauses. In the event of a change of control within the company (sections 29 para. 2 and 30 of the German Securities Acquisition and Takeover Act (WpÜG)), the Executive Board mem-bers are entitled to terminate the employment contract within three months of the change in control occurring, subject to a notice period of three months. In the event of a termination, the Executive Board members will be entitled to a severance payment, which is measured against the compensation due for the remainder of their contract, but is restricted to twice the annual compensation at most.
Syndicated bank loan
On March 30, 2015, KUKA Aktiengesellschaft and its associated companies signed a syndicated loan agreement with a banking syn-dicate led by Commerzbank AG, Deutsche Bank AG Deutschlandg-eschäft branch, Deutsche Bank Luxembourg S.A., UniCredit Bank AG, Landesbank Baden-Württemberg, BNP Paribas S.A. German branch and Credit Suisse AG, which has been amended in part through two amendment agreements dated April 29, 2016 and November 28, 2016. According to the terms of the loan agreement, the creditors provided working capital and guarantee lines of up to €400,000,000.
Within the scope of refinancing, KUKA Aktiengesellschaft and its associated companies signed a new syndicated loan agreement on February 1, 2018 with a banking syndicate led by Commerzbank AG, Deutsche Bank AG Deutschlandgeschäft branch, Deutsche Bank Lux-embourg S.A., UniCredit Bank AG, Landesbank Baden- Württemberg, Bayerische Landesbank, BNP Paribas S.A. German branch, DZ Bank AG Deutsche Zentral-Genossenschaftsbank (Frankfurt am Main) and Credit Suisse AG. According to the terms of the loan agreement, the creditors provide working capital and guarantee lines of up to €520,000,000. Upon conclusion of the new loan agreement, the aforementioned loan agreement for €400,000,000 was canceled.

KUKA Aktiengesellschaft | Annual Report 2017
64
The new loan agreement covers the main credit requirements of KUKA Group (including the furnishing of bank guarantees). The contract contains a change-of-control clause that is typical in the industry, under the terms of which the syndicated banks may demand repayment of the loan in the event that a shareholder (or group of shareholders acting in concert) acquires control of at least 30% of the voting rights of KUKA Aktiengesellschaft, or otherwise has the ability to control the operating policies of the company. A change of the direct owner within the Midea Group is not affected by this provision as long as Midea Group Co., Ltd. directly or indirectly holds 100% of the shares and voting rights. The creditors may also declare the loan agreement due for repayment in the cases of a delisting, a squeeze-out or the conclusion of a control and/or profit transfer agreement with a company of Midea Group. The syndicated banks had waived their rights of termination in advance of the change of control that took place on January 6, 2017 through the closing of the Midea Group’s takeover bid.
Promissory note loan 2015
KUKA Aktiengesellschaft issued a promissory note loan for €250,000,000 on October 9, 2015 led by Landesbank Baden- Württemberg and UniCredit Bank AG.
The terms and conditions of the promissory note loan contain a stand-ard clause referring to a change-of-control provision. Accordingly, immediately it learns of a change of control, KUKA Aktiengesellschaft must disclose this in accordance with the terms and conditions of the loan. The lenders then have the right, within 30 days of receiving notification of a change of control, to demand repayment of their (pro rata) loan at the next interest due date after receipt of the request for repayment and the interest due up to the date of repayment. A “change of control” within the meaning of the terms and conditions of the loan is given if a person or persons acting in concert directly or indirectly (i) either hold more than 30% of the voting shares, (ii) hold more than 30% of the voting rights in the company and/or (iii) otherwise have the possibility of directing the company’s business policy. None of the creditors of the promissory note loan (“promissory note investors”) exercised their rights to repayment of their (pro rata) loan within the contractually stipulated period following the closing of the Midea Group’s takeover bid on January 6, 2017, which consti-tuted such a change of control.
Agreements concluded between the company and members of the Executive Board or employees governing compensation in the event of a takeover bid
No agreements have been concluded between the company and members of the Executive Board or employees governing compensa-tion in the event of a takeover bid. The change-of-control clauses in the employment contracts of the Executive Board members do not constitute compensation clauses as defined in sections 289a para. 4 sentence 1 no. 9 and 315a para. 4 sentence 1 no. 9 of the German Commercial Code (HGB).
Declaration regarding corporate governance
Reference is made to published information on the KUKA AG web-site for the declaration regarding corporate governance pursuant to section 289f HGB: www.kuka.com/en-de/investor-relations/corporate-governance/corporate-management.
Non-financial declaration
Please refer to the website at www.kuka.com for the non-financial declaration pursuant to sections 315b, 315c, 289c of the German Commercial Code (HGB).

Group financial statements
65
Group financial statementsGroup income statement 66
Group statement of comprehensive income 66
Group cash flow statement 67
Group balance sheet 68
Development of Group equity 70
Group notes 72
Group segment reporting 72
General comments 74
Explanation of items in the financial statements 86
Notes to the Group income statement 86
Notes to the Group balance sheet: Assets 90
Notes to the Group balance sheet: Equity and liabilities 96
Notes to the Group cash flow statement 112
Notes to the Group segment reporting 112
Other notes 114
Events after the balance sheet date 115
Corporate bodies 116
Schedule of shareholdings of KUKA Aktiengesellschaft 118
Responsibility statement 121
Independent Auditor’s Report 122

KUKA Aktiengesellschaft | Annual Report 2017
66
Group income statementof KUKA Aktiengesellschaft for the period January 1 – December 31, 2017
in € millions Notes 2016 2017
Sales revenues 1 2,948.9 3,479.1
Cost of sales 2 -2,182.4 -2,724.8
Gross income 766.5 754.3
Selling expenses 2 -267.9 -306.7
Research and development costs 2 -126.6 -128.7
General and administrative expenses 2 -228.2 -211.4
Other operating income 3 6.6 18.8
Other operating expenses 3 -18.2 -21.4
Amortization of goodwill 7 -1.4 –
Loss from companies consolidated at equity 10 -3.6 -2.2
Earnings before interest and taxes (EBIT) 127.2 102.7
Depreciation and amortization 78.1 77.5
Earnings before interest, tax and amortization (EBITDA) 205.3 180.2
Depreciation of financial assets – -0.2
Interest income 4 8.1 6.2
Interest expense 4 -13.0 -15.2
Financial result -4.9 -9.2
Earnings before tax 122.3 93.5
Taxes on income 5 -36.1 -5.3
Earnings after taxes 86.2 88.2
(of which: attributable to minority interests) (-0.4) (-0.3)
(of which: attributable to shareholders of KUKA AG) (86.6) (88.5)
Earnings per share (undiluted / diluted) in € 6 2.19 2.22
Group statement of comprehensive incomeof KUKA Aktiengesellschaft for the period January 1 – December 31, 2017
in € millions Notes 2016 2017
Earnings after taxes 86.2 88.2
Items that may potentially be reclassified to profit or loss
Translation adjustments 8.1 -41.0
Third party translation adjustments – 0.1
Items that are not reclassified to profit or loss
Changes of actuarial gains and losses 23 -10.9 2.5
Deferred taxes on changes of acturial gains and losses 2.4 -2.0
Changes recognized directly in equity -0.4 -40.4
Comprehensive Income 85.8 47.9
(of which: attributable to minority interests) (-0.4) (-0.2)
(of which: attributable to shareholders of KUKA AG) (86.2) (48.1)

Group financial statements
67
Group cash flow statement 1of KUKA Aktiengesellschaft for the financial year 2017
in € millions 2016 2017
Net income after taxes 86.2 88.2
Income taxes 45.0 58.2
Net interest result 4.9 8.9
Depreciation of intangible assets 35.6 36.8
Depreciation of tangible assets 42.5 40.7
Depreciation of financial investments – 0.2
Other non-payment related income -20.3 -59.2
Other non-payment related expenses 10.0 10.8
Cash earnings 203.9 184.6
Result on the disposal of assets 0.6 0.1
Changes in provisions 9.0 -28.1
Changes in current assets and liabilities
Changes in inventories -22.8 -81.4
Changes in receivables and deferred charges -239.1 -75.9
Changes in liabilities and deferred income (excl. financial debt) 94.4 144.1
Income taxes paid -51.3 -46.4
Investments /financing matters affecting cash flow -4.3 -5.0
Cash flow from operating activities -9.6 92.0
Payments from disposals of fixed assets 0.2 4.4
Payments for capital expenditures on intangible assets -50.2 -54.4
Payments for capital expenditures on tangible assets -48.7 -85.7
Payments for investment in financial investments -1.1 -0.9
Payments received from financial assets in the course of short-term funds management 9.0 –
Payments received from the sale of consolidated companies and other business units 33.5 –
Payments for the acquisition of consolidated companies and other business units -47.8 -97.0
Interest received 7.9 5.9
Cash flow from investing activities -97.2 -227.7
Free cash flow -106.8 -135.7
Dividend payments -19.3 -19.9
Change of bank loans -4.1 11.4
Payments from grants received 4.4 5.0
Interest paid -7.4 -7.2
Cash flow from financing activities -26.4 -10.7
Payment-related changes in cash and cash equivalents -133.2 -146.4
Changes due to acquisitions of companies 0.2 5.3
Exchange rate-related and other changes in cash and cash equivalents 1.0 0.5
Changes in cash and cash equivalents -132.0 -140.6
(of which net increase/decrease in restricted cash) (-2.1) (-0.7)
Cash and cash equivalents at the beginning of the period 496.2 364.2
(of which net increase/decrease in restricted cash) (3.2) (1.1)
Cash and cash equivalents at the end of the period 364.2 223.6
(Restricted cash) (1.1) (0.4)
1 See note 30 for further information on the Group cash flow statement.

KUKA Aktiengesellschaft | Annual Report 2017
68
Group balance sheetof KUKA Aktiengesellschaft as of December 31, 2017
Assets
in € millions Notes Dec. 31, 2016 Dec. 31, 2017
Non-current assets
Intangible assets 7 445.1 520.4
Property, plant and equipment 8 261.2 296.0
Financial investments 9 4.9 5.1
Investments accounted for at equity 10 4.2 15.7
715.4 837.2
Finance lease receivables 11 57.7 43.1
Other long-term receivables and other assets 15 16.2 17.5
Deferred taxes 5 48.8 79.6
838.1 977.4
Current assets
Inventories 12 318.8 387.4
Receivables and other assets
Trade receivables 13 353.2 408.1
Receivables from construction contracts 14 535.7 515.7
Finance lease receivables 11 9.6 9.8
Income tax receivables 33.4 32.7
Other assets, prepaid expenses and deferred charges 15 90.9 85.4
1,022.8 1,051.7
Cash and cash equivalents 16 364.2 223.6
1,705.8 1,662.7
2,543.9 2,640.1

Group financial statements
69
Equity and liabilities
in € millions Notes Dec. 31, 2016 Dec. 31, 2017
Equity 17
Subscribed capital 18 103.4 103.4
Capital reserve 19 306.6 306.6
Revenue reserve 20 430.5 457.1
Minority interests 21 -0.3 -0.5
840.2 866.6
Non-current liabilities, provisions and accruals
Financial liabilities 25+26 249.6 249.7
Other liabilities 27 28.0 29.5
Pensions and similar obligations 23 122.7 108.9
Deferred taxes 5 45.3 27.5
445.6 415.6
Current liabilities
Financial liabilities 25+26 1.6 19.1
Trade payables 459.3 549.2
Advances received 95.6 94.0
Liabilities from construction contracts 14 223.7 214.1
Accounts payable to affiliated companies – 0.1
Income tax liabilities 40.0 51.2
Other liabilities and deferred income 27 280.0 297.7
Other provisions 24 157.9 132.5
1,258.1 1,357.9
2,543.9 2,640.1

KUKA Aktiengesellschaft | Annual Report 2017
70
Development of Group equityof KUKA Aktiengesellschaft for the financial year 2017
Notes 18 18 19 20 21
in € millions
Revenue reserves
Number of shares outstanding
Subscribed capital
Capital reserve Translation gains /losses
Actuarial gains and losses
Annual net profit and other reve-
nue reserves
Equity to shareholders
Minority interests Total
Jan. 1, 2016 38,501,259 100.1 265.3 53.0 -15.2 329.8 733.0 -0.5 732.5
Result after tax – – – – – 86.6 86.6 -0.4 86.2
Other income – – – 8.1 -8.5 – -0.4 – -0.4
Comprehensive income – – – 8.1 -8.5 86.6 86.2 -0.4 85.8
Capital increase from conversion 1,274,211 3.3 41.3 – – – 44.6 – 44.6
Dividend of KUKA AG – – – – – -19.3 -19.3 – -19.3
Change in scope of consolidation /other changes – – – – – -4.0 -4.0 0.6 -3.4
Jan. 1, 2017 39,775,470 103.4 306.6 61.1 -23.7 393.1 840.5 -0.3 840.2
Result after taxes – – – – – 88.5 88.5 -0.3 88.2
Other income – – – -41.0 0.6 – -40.4 0.1 -40.3
Comprehensive income – – – -41.0 0.6 88.5 48.1 -0.2 47.9
Dividend of KUKA AG – – – – – -19.9 -19.9 – -19.9
Change in scope of consolidation /other changes – – – – – -1.6 -1.6 – -1.6
Dec. 31, 2017 39,775,470 103.4 306.6 20.1 -23.1 460.1 867.1 -0.5 866.6

Group financial statements
71
Development of Group equityof KUKA Aktiengesellschaft for the financial year 2017
Notes 18 18 19 20 21
in € millions
Revenue reserves
Number of shares outstanding
Subscribed capital
Capital reserve Translation gains /losses
Actuarial gains and losses
Annual net profit and other reve-
nue reserves
Equity to shareholders
Minority interests Total
Jan. 1, 2016 38,501,259 100.1 265.3 53.0 -15.2 329.8 733.0 -0.5 732.5
Result after tax – – – – – 86.6 86.6 -0.4 86.2
Other income – – – 8.1 -8.5 – -0.4 – -0.4
Comprehensive income – – – 8.1 -8.5 86.6 86.2 -0.4 85.8
Capital increase from conversion 1,274,211 3.3 41.3 – – – 44.6 – 44.6
Dividend of KUKA AG – – – – – -19.3 -19.3 – -19.3
Change in scope of consolidation /other changes – – – – – -4.0 -4.0 0.6 -3.4
Jan. 1, 2017 39,775,470 103.4 306.6 61.1 -23.7 393.1 840.5 -0.3 840.2
Result after taxes – – – – – 88.5 88.5 -0.3 88.2
Other income – – – -41.0 0.6 – -40.4 0.1 -40.3
Comprehensive income – – – -41.0 0.6 88.5 48.1 -0.2 47.9
Dividend of KUKA AG – – – – – -19.9 -19.9 – -19.9
Change in scope of consolidation /other changes – – – – – -1.6 -1.6 – -1.6
Dec. 31, 2017 39,775,470 103.4 306.6 20.1 -23.1 460.1 867.1 -0.5 866.6

KUKA Aktiengesellschaft | Annual Report 2017
72
Group notesGroup segment reporting 1of KUKA Aktiengesellschaft for the financial year 2017
in € millions
Robotics Systems Swisslog KUKA AG and other companies Reconciliation and consolidation Group
2016 2017 2016 2017 2016 2017 2016 2017 2016 2017 2016 2017
Orders received 1,088.8 1,223.3 1,644.6 1,530.2 742.6 926.2 – – -53.7 -65.4 3,422.3 3,614.3
Order backlog 316.1 331.2 1,139.3 1,073.4 624.7 768.3 – – -31.2 -15.0 2,048.9 2,157.9
Group external sales revenues 969.6 1,159.9 1,388.1 1,557.0 591.2 761.6 – 0.6 – – 2,948.9 3,479.1
as a % of Group sales revenues 32.9% 33.3% 47.1% 44.8% 20.0% 21.9% – – – – 100.0% 100.0%
Intra-Group sales 23.9 40.7 7.4 22.2 2.3 2.1 – 94.8 -33.6 -159.8 – –
Sales revenues by division 993.5 1,200.6 1,395.5 1,579.2 593.5 763.7 – 95.4 -33.6 -159.8 2,948.9 3,479.1
Operating profit /loss 367.5 417.0 242.4 154.4 159.6 181.8 – 95.7 -3.0 -94.6 766.5 754.3
as a % of sales revenues of the division 37.0% 34.7% 17.4% 9.8% 26.9% 23.8% – – – – 26.0% 21.7%
Earnings before interest and taxes (EBIT) 100.7 133.1 91.3 17.8 4.8 10.4 -41.4 -57.1 -28.2 -1.5 127.2 102.7
as a % of sales revenues of the division 10.1% 11.1% 6.5% 1.1% 0.8% 1.4% – – – – 4.3% 3.0%
as a % of average capital employed (ROCE) 51.7% 56.4% 42.8% 6.3% 1.5% 3.0% – – – – 16.2% 10.9%
Extraordinary expenses 2 – – – – – – – – 28.0 31.9 28.0 31.9
EBIT adjusted 2 100.7 133.1 91.3 17.8 4.8 10.4 -41.4 -57.1 -0.2 30.4 155.2 134.6
EBIT adjusted 2 as a % of sales revenues of the division 10.1% 11.1% 6.5% 1.1% 0.8% 1.4% – – – – 5.3% 3.9%
EBIT adjusted 2 as a % of average capital employed (ROCE) 51.7% 56.4% 42.8% 6.3% 1.5% 3.0% – – – – 19.8% 14.2%
Earnings before interest, tax and amortization (EBITDA) 123.2 157.2 113.5 34.5 28.2 36.8 -31.3 -46.6 -28.3 -1.7 205.3 180.2
as a % of sales revenues of the division 12.4% 13.1% 8.1% 2.2% 4.8% 4.8% – – – 7.0% 5.2%
Extraordinary expenses 2 – – – – – – – – 28.0 31.9 28.0 31.9
EBITDA adjusted 2 123.2 157.2 113.5 34.5 28.2 36.8 -31.3 -46.6 -0.3 30.2 233.3 212.1
EBITDA adjusted 2 as a % of sales revenues of the division 12.4% 13.1% 8.1% 2.2% 4.8% 4.8% – – – – 7.9% 6.1%
Capital employed (annual average) 194.9 235.9 213.1 281.9 317.4 346.8 58.3 87.3 -0.7 -1.5 783.0 950.4
Capital employed (end of the financial year) 211.9 260.0 301.6 262.2 312.3 381.4 57.4 117.2 -0.8 -2.4 882.4 1,018.4
Assets 481.3 575.3 909.4 877.2 613.3 717.7 597.1 668.2 -470.3 -501.4 2,130.8 2,337.0
Liabilities 282.0 327.8 629.1 650.1 342.0 357.5 123.3 131.4 -14.4 -44.3 1,362.0 1,422.5
Investments accounted for at equity 0.0 0.0 4.2 4.0 0.0 11.7 0.0 0.0 – 0.0 4.2 15.7
Earnings of investments accounted for at equity -2.6 -1.0 0.0 -0.1 – -1.1 -1.1 0.0 0.1 0.0 -3.6 -2.2
Capital expenditure 29.4 39.9 23.9 53.9 20.0 21.6 26.3 24.0 0.0 -0.6 99.6 138.8
Depreciation /amortization of intangible assets 22.4 24.0 20.0 16.7 23.4 26.4 10.1 10.5 -0.1 -0.2 75.8 77.4
Impairment losses on intangible and tangible assets – – 2.2 – – – – – – – 2.2 –
Depreciation /amortization of interest capitalized under intangible assets 0.1 0.1 – – – – – – – – 0.1 0.1
Employees (Dec. 31) 4,726 5,010 5,189 5,459 2,679 2,904 594 883 – – 13,188 14,256
1 See note 30 for more information on Group segment reporting.
2 2016: Extraordinary effect due to the takeover bid by Midea Group 2017: Growth investments

Group notes
73
Group segment reporting 1of KUKA Aktiengesellschaft for the financial year 2017
in € millions
Robotics Systems Swisslog KUKA AG and other companies Reconciliation and consolidation Group
2016 2017 2016 2017 2016 2017 2016 2017 2016 2017 2016 2017
Orders received 1,088.8 1,223.3 1,644.6 1,530.2 742.6 926.2 – – -53.7 -65.4 3,422.3 3,614.3
Order backlog 316.1 331.2 1,139.3 1,073.4 624.7 768.3 – – -31.2 -15.0 2,048.9 2,157.9
Group external sales revenues 969.6 1,159.9 1,388.1 1,557.0 591.2 761.6 – 0.6 – – 2,948.9 3,479.1
as a % of Group sales revenues 32.9% 33.3% 47.1% 44.8% 20.0% 21.9% – – – – 100.0% 100.0%
Intra-Group sales 23.9 40.7 7.4 22.2 2.3 2.1 – 94.8 -33.6 -159.8 – –
Sales revenues by division 993.5 1,200.6 1,395.5 1,579.2 593.5 763.7 – 95.4 -33.6 -159.8 2,948.9 3,479.1
Operating profit /loss 367.5 417.0 242.4 154.4 159.6 181.8 – 95.7 -3.0 -94.6 766.5 754.3
as a % of sales revenues of the division 37.0% 34.7% 17.4% 9.8% 26.9% 23.8% – – – – 26.0% 21.7%
Earnings before interest and taxes (EBIT) 100.7 133.1 91.3 17.8 4.8 10.4 -41.4 -57.1 -28.2 -1.5 127.2 102.7
as a % of sales revenues of the division 10.1% 11.1% 6.5% 1.1% 0.8% 1.4% – – – – 4.3% 3.0%
as a % of average capital employed (ROCE) 51.7% 56.4% 42.8% 6.3% 1.5% 3.0% – – – – 16.2% 10.9%
Extraordinary expenses 2 – – – – – – – – 28.0 31.9 28.0 31.9
EBIT adjusted 2 100.7 133.1 91.3 17.8 4.8 10.4 -41.4 -57.1 -0.2 30.4 155.2 134.6
EBIT adjusted 2 as a % of sales revenues of the division 10.1% 11.1% 6.5% 1.1% 0.8% 1.4% – – – – 5.3% 3.9%
EBIT adjusted 2 as a % of average capital employed (ROCE) 51.7% 56.4% 42.8% 6.3% 1.5% 3.0% – – – – 19.8% 14.2%
Earnings before interest, tax and amortization (EBITDA) 123.2 157.2 113.5 34.5 28.2 36.8 -31.3 -46.6 -28.3 -1.7 205.3 180.2
as a % of sales revenues of the division 12.4% 13.1% 8.1% 2.2% 4.8% 4.8% – – – 7.0% 5.2%
Extraordinary expenses 2 – – – – – – – – 28.0 31.9 28.0 31.9
EBITDA adjusted 2 123.2 157.2 113.5 34.5 28.2 36.8 -31.3 -46.6 -0.3 30.2 233.3 212.1
EBITDA adjusted 2 as a % of sales revenues of the division 12.4% 13.1% 8.1% 2.2% 4.8% 4.8% – – – – 7.9% 6.1%
Capital employed (annual average) 194.9 235.9 213.1 281.9 317.4 346.8 58.3 87.3 -0.7 -1.5 783.0 950.4
Capital employed (end of the financial year) 211.9 260.0 301.6 262.2 312.3 381.4 57.4 117.2 -0.8 -2.4 882.4 1,018.4
Assets 481.3 575.3 909.4 877.2 613.3 717.7 597.1 668.2 -470.3 -501.4 2,130.8 2,337.0
Liabilities 282.0 327.8 629.1 650.1 342.0 357.5 123.3 131.4 -14.4 -44.3 1,362.0 1,422.5
Investments accounted for at equity 0.0 0.0 4.2 4.0 0.0 11.7 0.0 0.0 – 0.0 4.2 15.7
Earnings of investments accounted for at equity -2.6 -1.0 0.0 -0.1 – -1.1 -1.1 0.0 0.1 0.0 -3.6 -2.2
Capital expenditure 29.4 39.9 23.9 53.9 20.0 21.6 26.3 24.0 0.0 -0.6 99.6 138.8
Depreciation /amortization of intangible assets 22.4 24.0 20.0 16.7 23.4 26.4 10.1 10.5 -0.1 -0.2 75.8 77.4
Impairment losses on intangible and tangible assets – – 2.2 – – – – – – – 2.2 –
Depreciation /amortization of interest capitalized under intangible assets 0.1 0.1 – – – – – – – – 0.1 0.1
Employees (Dec. 31) 4,726 5,010 5,189 5,459 2,679 2,904 594 883 – – 13,188 14,256
1 See note 30 for more information on Group segment reporting.
2 2016: Extraordinary effect due to the takeover bid by Midea Group 2017: Growth investments

KUKA Aktiengesellschaft | Annual Report 2017
74
General comments
Accounting principles
KUKA Aktiengesellschaft, registered at the district court of Augsburg under HRB 22709 and headquartered in Augsburg, has prepared its consolidated financial statements for the period ending Decem-ber 31, 2017 according to the International Financial Reporting Standards (IFRS) of the International Accounting Standards Board (IASB) applicable and endorsed by the European Union as at the bal-ance sheet date. The term IFRS also includes all valid international accounting standards (IAS). The interpretations of the Standing Inter-pretations Committee (SIC) and the International Financial Reporting Standards Interpretations Committee (IFRS IC) – supplemented by the guidelines stipulated in section 315a para. 1 of the German Com-mercial Code (HGB) – were also taken into consideration.
The accounting policies used conform to the methods applied in the previous year. Exceptions from this are the standards and interpre-tations for which application is mandatory for the first time in the 2017 fiscal year and the other reporting changes described under “Changes in accounting and valuation methods”. The consolidated financial statements comply with German law. The currency reported in the consolidated financial statements is the euro. Unless otherwise noted, all amounts in the notes to the accounts are stated in millions of euros (€ million).
With the exception of specific financial instruments reported in fair values, the Group’s consolidated financial statements are prepared based on historical costs. In this case, fair value is defined under IFRS 13 as the price that would be paid by independent market par-ticipants in an arm’s length transaction on the measurement date if an asset were sold or a liability transferred.
KUKA Group does not carry any assets with an indefinite useful life with the exception of goodwill and a brand name.
The Group’s consolidated income statement is prepared using the cost of sales method. The consolidated financial statements comply with the classification requirements of IAS 1. The presentation in the Group’s consolidated balance sheet distinguishes between current and non-current assets and liabilities.
The identically worded declarations of compliance with the German Corporate Governance Code pursuant to section 161 of the German Stock Corporation Act (AktG) made by the Executive Board on Feb-ruary 5, 2018 and the Supervisory Board on February 15, 2018 can be accessed on the Internet through the company’s website (www.kuka.com). The Executive Board prepared the consolidated financial state-ments on February 23, 2018.
KUKA Aktiengesellschaft is a 94.55% subsidiary of Midea Group Co. Ltd., Foshan City, Guangdong Province /China. KUKA Aktienge-sellschaft is incorporated in the consolidated financial statements of Midea Group Co. Ltd., Foshan City, Guangdong Province /China, which are available from the website www.cninfo.com.cn or directly on the website of Midea Group Co. Ltd. at www.midea.com/global/investors/financial_statements.
Scope of consolidation
In comparison to year-end 2016 the scope of consolidation has changed due to acquisitions and mergers.
The table below shows the development of the scope of consolidation since January 1, 2017:
Number of fully consolidated companies
Number Robotics Systems Swisslog Other Total
As of Jan. 1, 2017 24 39 33 4 100
First-time consolidations 3 – 2 1 6
Mergers – – -2 – -2
As of Dec. 31, 2017 27 39 33 5 104
of which, Germany 2 11 4 4 21
of which, abroad 25 28 29 1 83
Number of companies consolidated at equity
Number Robotics Systems Swisslog Other Total
As of Jan. 1, 2017 1 2 – – 3
First-time consolidations – – 1 – 1
As of Dec. 31, 2017 1 2 1 – 4
of which, associ-ated companies 1 1 1 – 3
of which, joint ventures – 1 – – 1
Additions of companies through company acquisitions
A majority stake was acquired of the following companies during the fiscal year:
› Device Insight GmbH, Munich /Germany › Easy Conveyors B.V., Nuenen /Netherlands › Talyst Systems LLC, Delaware /USA › Visual Components Oy, Espoo /Finland › Visual Components North America Corporation, Lake Orion,
Michigan /USA › Visual Components GmbH, Munich /Germany
25% of shares were also acquired in Pipeline Health Holdings LLC, San Francisco /USA. (For details of the acquisitions: see the following section “Company acquisitions 2017”)
Mergers
Swisslog Automation GmbH, Karlsruhe was merged into Swisslog GmbH, Dortmund during the fiscal year. Furthermore, Talyst Systems LLC, Delaware /USA was merged into Translogic Corp., Denver /USA following its acquisition.
The merger took place within a segment and therefore does not influ-ence the comparability with the previous year.

Group notes
75
Company acquisitions 2017
Talyst Systems LLC, Delaware /USA
All the shares in the company Talyst Systems LLC, Delaware /USA were acquired in the third quarter of 2017.
Talyst is a leading supplier in the pharmacy inventory management sector and the so-called “inpatient pharmacies” and has extensive customer relationships, particularly in the USA. Technology as well as products add to the existing Swisslog business in the Healthcare Solutions sector, particularly in the area of hospital pharmacies in North America. Swisslog thus achieves greater market penetration. The company is allocated to the Swisslog segment. USD 30 million of the USD 33.0 million purchase price was paid in cash on closing. The remaining sum mainly relates to retention in conjunction with a lease receivable. Cash and cash equivalents as well as shares of previously fully consolidated companies were not acquired. The gross amount of trade receivables acquired was €3.1 million. Taking a valuation adjustment of €0.1 million into account, this resulted in a fair value of €3.0 million.
Sales revenues of around €10 million and net income of approxi-mately €0.6 million were attributable to the acquisition during the reporting period. If the company had already been taken over at the beginning of 2017, the contribution to sales revenues would have amounted to around €21 million and net income would have decreased by around €1 million.
The following table shows the carrying amounts assumed as a result of the purchase immediately prior to the acquisition as well as the opening balance sheet in fair values:
in € millions
Carrying amounts assumed
Opening balance sheet in fair values
Intangible assets 0.4 13.7
Tangible assets 0.2 0.2
Inventories 2.9 2.9
Receivables and other assets 7.3 7.3
Liabilities and provisions 7.6 7.5
Total 3.2 16.6
The acquired intangible assets consist to a large extent of customer relationships, technology and the brand name. Receivables and inven-tories primarily concern orders in house at the time of the acquisi-tion. Contingent liabilities were not transferred. Deferred taxes did not have to be allocated due to the company’s legal form and the structure of the acquisition. The transaction thus led to goodwill of €11.2 million. The goodwill particularly reflects the future synergies in the cash generating unit resulting from the acquisition.
Device Insight GmbH, Munich
A total of 50.01% of shares were acquired in the company Device Insight GmbH, Munich in the fourth quarter of 2017 by means of a share purchase and subsequent capital increase. The contracting par-ties also entered into mutual options to acquire the remaining shares with the effect that a future purchase is already to be assumed at
year-end closing. This means that the company is already fully incor-porated in the consolidated financial statements of KUKA Aktienge-sellschaft in accordance with IFRS 10.B47-50 as at December 31, 2017.
Device Insight has established itself as a specialist in IoT platforms in the automation industry and in the field of networked products. Its customers include market leaders in the areas of mechanical engi-neering, heating systems and industrial vehicles. Further key focus areas are the provision of global IoT customer solutions, consultancy services related to IoT business models and IoT applications. With this move, KUKA is looking to strengthen the IoT expertise of the KUKA subsidiary, connyun GmbH, and to expand its own portfolios in this area. The company is allocated to the “Other” segment.
€18.9 million of the €37.5 million purchase price was paid in cash on closing. The remaining sum relates to an option to purchase the remaining shares. The gross amount of trade receivables acquired was €0.1 million. Taking a valuation adjustment of €0.1 million into account, this resulted in a fair value of €0 million. Cash and cash equivalents of €2.2 million were transferred.
Sales revenues of around €0.6 million and net income of approx-imately -€0.2 million were attributable to the acquisition during the reporting period. If the company had already been taken over at the beginning of 2017, the contribution to sales revenues would have amounted to around €7.5 million and net income would have decreased by around €1.3 million.
The following table shows the carrying amounts assumed as a result of the purchase immediately prior to the acquisition as well as the opening balance sheet in fair values based on provisional figures. The fact that these figures are only temporary is due to valuation issues still to be finalized as well as tax assessments.
in € millions
Carrying amounts assumed
Opening balance sheet in fair values
Intangible assets 0.0 6.1
Tangible assets 0.1 0.1
Inventories 0.1 0.1
Receivables and other assets 4.9 4.9
Liabilities and provisions 2.2 4.2
Total 2.9 7.0
The acquired intangible assets consist to a large extent of customer relationships, technology and the brand name. Receivables primarily concern orders in house at the time of the acquisition. Contingent liabilities were not transferred. Deferred taxes valued at €2.0 million were established for the adjustment of the fair value. The transaction thus led to goodwill of €30.5 million. The goodwill particularly reflects the future synergies and the know-how of the employees in the cash generating unit resulting from the acquisition.

KUKA Aktiengesellschaft | Annual Report 2017
76
Visual Components Oy, Espoo /Finland
100% of the shares in Visual Components Oy, Espoo /Finland includ-ing both its subsidiaries (Visual Components North America Corpo-ration, Lake Orion, Michigan /USA and Visual Components GmbH, Munich) were acquired at the end of 2017.
Visual Components is a company specializing in software solutions for 3D simulations in factory planning whose solutions are used world-wide for important planning and decision-making processes. With its easy-to-use products and open architecture, the company sets standards in the visualization and simulation of complete produc-tion processes. For KUKA, the acquisition of Visual Components is an important milestone with great potential for solutions in KUKA’s simulation ecosystem. After all, simulation is one of the key elements for technological innovations such as artificial intelligence, virtual and augmented reality, cloud technology and the Internet of Things. The company was acquired by KUKA Roboter GmbH, Augsburg. €20 mil-lion of the €23.2 million purchase price was paid in cash on closing. The remaining sum of around €3 million relates to future purchase price payments that are due successively by 2020 depending on whether certain earnings, sales revenues and technology objectives are achieved.
Cash and cash equivalents of €3.1 million were transferred in connec-tion with the acquisition. There were no shares in companies already fully consolidated. The gross amount of trade receivables acquired was €1.1 million; it was not necessary to establish impairments for them.
If the company had already been taken over at the beginning of 2017, the contribution to sales revenues would have amounted to around €6.7 million and net income would have increased by around €1.6 million.
The following table shows the carrying amounts assumed as a result of the purchase immediately prior to the acquisition as well as the opening balance sheet in fair values based on provisional figures. The fact that these figures are only temporary is due to valuation issues still to be finalized as well as tax assessments.
in € millions
Carrying amounts assumed
Opening balance sheet in fair values
Intangible assets 0.0 4.6
Tangible assets 0.0 0.0
Inventories 0.0 0.0
Receivables and other assets 1.9 1.9
Liabilities and provisions 0.9 0.9
Total 1.0 5.6
The acquired intangible assets essentially consist of brand names, software and customer relationships. Receivables and inventories primarily concern orders in house at the time of the acquisition. Contingent liabilities were not transferred. Deferred taxes valued at €0.9 million were established. The transaction led to goodwill totaling €15.5 million. The goodwill particularly reflects the future synergies generated from the acquisition and the evaluation of employees taken on.
Other acquisitions
100% of the shares in the company Easy Conveyors B.V., Nuenen /Netherlands were acquired for a low single-digit million amount in the second quarter of 2017. The acquisition in the Swisslog segment in the sector of Warehouse and Distribution Solutions (WDS) was made with the aim of increasing market penetration and enhancing the vertical value chain.
Investments in associates and joint ventures
In the second quarter of 2017, 25% of shares in the American com-pany Pipeline Health Holdings LLC, San Francisco /USA were acquired for a purchase price of €13.9 million (USD 15.2 million) in the Swisslog segment. The company offers telepharmacy services for hospitals. This involves organizing medical staff who provide digital services on demand (so-called remote pharmacists) and providing software solutions for the automated supply of medication. The reason for the acquisition is to expand the product portfolio of integrated automa-tion solutions in the sector of Healthcare Solutions.
In the first nine months of 2017, further shares amounting to €1.0 million were purchased in KBee AG, Munich.
As at the reporting date, the investment carrying amount of the associated companies KBee AG, Munich, Yawei Reis Robot Manufac-turing (Jiangsu) Co., Ltd., Yangzhou /China, Pipeline Health Holdings LLC, San Francisco /USA as well as of the joint venture Chang’an Reis Robotic Intelligent Equipment (Chongqing) Co., Ltd, Chongqing /China, was valued at €15.7 million; the effect on the pro rata earnings of these companies was -€2.2 million.
Consolidation principles
Subsidiaries directly or indirectly controlled by KUKA Aktienge-sellschaft (“control concept” according to IFRS 10) are consolidated in the consolidated financial statements according to the rules of full consolidation. Control prevails if there is a right to the variable returns and the possibility for the company to use the control so that thereby the level of returns from the company can be influenced. To determine the point at which the company is included in consoli-dation or is deconsolidated, the date is crucial on which control is effectively gained or lost.
The consolidated financial statements are based on the financial statements of KUKA Aktiengesellschaft and those of the consolidated subsidiaries and were prepared according to the uniform accounting policies for the Group. Capital consolidation takes place by offsetting the carrying amounts of the investment against the pro rata newly measured equity capital of the subsidiaries at the time of acquisition. In line with IFRS 3, any positive differences are capitalized as goodwill under intangible assets. Any negative differences are recognized in the income statement.
Intra-Group sales, expenses, earnings and receivables and payables are offset, and inter-company profits and losses are eliminated. The deferred tax entries required in connection with the consolidation processes have been recorded.

Group notes
77
Guarantees and warranties that KUKA Aktiengesellschaft issues on behalf of consolidated subsidiaries are eliminated provided they do not have an external effect.
Currency translation
Receivables and payables denominated in foreign currency are translated as of the balance sheet date using the average rate of the year. Any associated translation gains or losses are recognized in the income statement. Where the translation gains or losses are the result of foreign currency transactions in respect of supplies and services, these are reported under the cost of sales; translation gains or losses on financial transactions, such as intra-Group loan transac-tions, are reported in the net interest income.
The annual financial statements of the consolidated foreign subsidi-aries are translated from their functional currency (IAS 21) into euros. With the exception of KUKA Robotics Hungária Ipari Kft., Taksony /Hungary, whose functional currency is the euro, this is the respective local currency, since the foreign subsidiaries operate predominantly
within their currency area. The Group treats newly resulting derivative goodwill from the acquisition of foreign subsidiaries as assets of the economically independent subsidiary and translates this goodwill at the closing rate, if necessary (IAS 21.47). The resulting exchange differences are recognized in the foreign currency translation reserve. Unrealized price differences from the translation of equity-replacing loans to foreign subsidiaries in foreign currency are reported directly in the aggregate income /loss and so recognized directly in equity. On loss of control these effects are released through profit or loss.
Assets and liabilities are translated at the rate effective on the bal-ance sheet date. Derivative goodwill and equity recognized prior to January 1, 2005 are translated using historical rates. Income and expenses are translated using average rates for the year. Differences arising from the translation of assets and liabilities denominated in foreign currencies compared to the prior year as well as translation differences between the income statement and the balance sheet are recognized in the revenue reserves. In the event of the departure of Group entities, existing exchange differences are then recognized in profit or loss. The exchange rates used for the reporting period and the previous year are shown in the following table:
Country Currency Balance sheet date Average rate
Dec. 31, 2016 Dec. 31, 2017 2016 2017
Australia AUD 1.4596 1.5346 1.4886 1.47258
Brazil BRL 3.4305 3.9729 3.8616 3.60273
Canada CAD 1.4188 1.5039 1.4664 1.46398
China CNY 7.3202 7.8044 7.3496 7.62497
China, Hong Kong HKD 8.1751 9.3720 8.5900 8.7992
Czech Republic CZK 27.0210 25.5350 27.0343 26.32757
Hungary HUF 309.8300 310.3300 311.4600 309.2782
India INR 71.5935 76.6055 74.3553 73.50738
Japan JPY 123.4000 135.0100 120.3133 126.68676
Korea KRW 1,269.3600 1,279.6100 1,284.5650 1,276.1977
Malaysia MYR 4.7287 4.8536 4.5842 4.84949
Mexico MXN 21.7719 23.6612 20.6550 21.3363
New Zealand NZD 1.5158 1.6850 1.5895 1.5891
Norway NOK 9.0863 9.8403 9.2927 9.32509
Romania RON 4.5411 4.6597 4.4908 4.56816
Russia RUB 64.3000 69.3920 74.222 65.90797
Singapore SGD 1.5234 1.6024 1.5278 1.55815
Sweden SEK 9.5525 9.8438 9.4673 9.6359
Switzerland CHF 1.0739 1.1702 1.0902 1.11153
Taiwan TWD 34.1403 34.1922 35.6009 34.00556
Thailand THB 37.7260 39.1210 39.0424 38.28389
United Arab Emirates AED 3.8647 4.3743 4.0546 4.15003
United Kingdom GBP 0.8562 0.8872 0.8189 0.87628
USA USD 1.0541 1.1993 1.1066 1.12903

KUKA Aktiengesellschaft | Annual Report 2017
78
Accounting and valuation principles
Orders received
An order is recognized as an incoming order on receipt of a binding purchase order. In the case of framework agreements, only legally binding order releases for volumes qualify for recognition as orders received. Letters of intent are not included in the orders received.
Order backlog
If a binding customer order has not yet been invoiced or not yet realized as a sale in the case of long-term contract production, an order is recorded as an order backlog.
Revenue recognition
Sales revenues are recognized upon the performance of services or transfer of risk to the customer. Thus, sales revenues are recognized when the products or goods have been delivered or the services per-formed, the material risks and rewards associated with ownership have been transferred to the purchaser, the amount derived from the sale can be measured reliably, the inflow of economic benefits resulting from the transaction is probable, and the costs associated with the transaction can be measured reliably.
Revenues for long-term construction contracts that meet the criteria of IAS 11 are recognized according to the percentage of completion method. As a rule, the percentage of completion to be recognized by contract is determined by the cost of work to date as a percent-age of the estimated total costs (cost-to-cost method). The profit from the contract is recognized on the basis of the percentage of completion thus determined. To the extent that services performed to date exceed advances received, the contracts are recorded as receivables from construction contracts. If there is a negative bal-ance after deduction of advances, this is recognized as liabilities from construction contracts. Borrowing costs are taken into account for construction contracts in accordance with IAS 23 as a basic principle. If necessary, provisions or asset-side impairment losses are recog-nized for impending losses.
Since the beginning of the 2016 fiscal year, KUKA has no longer taken any borrowing costs into account in long-term contract production for cost-benefit reasons.
Cost of sales
The cost of sales comprises the cost of production of the goods sold as well as the acquisition cost of any merchandise sold. In addition to the cost of attributable direct materials and labor, this also comprises indirect costs, including the depreciation and amortization of produc-tion plants and intangible assets, write-downs of inventories and the recognized borrowing costs. KUKA Group accounts for provisions for product warranties as part of the cost of sales at the time of revenue recognition. Impending losses from contracts are recognized in the reporting period in which the current estimate for total costs arising from the respective contract exceeds the expected contract revenue.
Business combinations
Business combinations are accounted for using the acquisition method. The cost of acquisition is measured at the fair value of the assets given up and the liabilities incurred or assumed at the acquisition date. An agreed contingent consideration from KUKA as the acquirer is recognized at fair value at the acquisition date. The identifiable assets acquired and the liabilities (including contingent liabilities) assumed in a business combination are initially measured at their fair values at the acquisition date, irrespective of the extent of any non-controlling interests. Uniform accounting policies are used here. After initial recognition, gains and losses are attributed without limit in proportion to the interest held; a negative balance with respect to non-controlling interests can arise as a result. The non-controlling interests are involved in profit sharing during the reporting period.
Investments in associates and joint ventures
Investments in associates and joint ventures are reported at cost in the first instance. A difference between the cash contribution and pro rata equity capital is recognized directly in equity. Subsequent measurement takes place using the equity method as described in IAS 28. The result of associates or joint ventures is recognized in a separate item of the income statement.
Goodwill
Goodwill is tested for impairment at least annually (usually in the fourth quarter). To this end, impairment tests are performed in which the carrying amount of goodwill allocated to the defined cash gen-erating units (CGUs) is compared to the recoverable amount. If the carrying amount exceeds the recoverable amount of the cash gener-ating unit, an impairment loss is recognized for the goodwill allocated to this cash generating unit. The recoverable amount is the higher of the cash generating unit’s fair value less costs to sell and its value in use. KUKA uses a cash generating unit’s value in use to determine its recoverable amount. The data from the detail planning phase from the business plan for the next three years were used as the underlying data to determine the value in use, assuming in subsequent years that the annual cash flows will generally equal those in year three. For the sake of simplification, the perpetuity calculation further assumes that investments equal depreciation /amortization expense and the working capital remains unchanged.
With respect to the segment-specific discount rates as well as the further parameters and their derivation, and also for the identification of the principal items of goodwill, please refer to the discussions under note 7.

Group notes
79
Self-developed software and other development costs
Development costs for newly developed products or internally gener-ated intangible assets (e.g. software) are capitalized provided that the technical feasibility and commercialization of the newly developed products are assured, and that this will result in an inflow of economic benefits to the Group and in the further requirements of IAS 38.57 being met. In this context, the costs of production encompass the costs directly and indirectly attributable to the cost of development.
Depreciation commences when the asset is put into use and is rec-ognized over an expected useful life of, as a rule, three to five years, using the straight-line method. Moreover, the value recognized for capitalized costs of development projects not yet completed is sub-ject to annual impairment tests.
Research and development costs that are not eligible for recognition as an asset are recognized as expenses when they are incurred.
Other intangible assets
Purchased intangible assets, predominantly software, patents and trademarks, are recognized at their acquisition cost and are amortized over their expected useful life of usually three to five years using the straight-line method.
Property, plant and equipment
Property, plant and equipment are recognized at acquisition or pro-duction costs. Depreciation is generally applied using the straight-line method. The selected depreciation method is continuously reviewed.
Depreciation is based predominantly on the following periods of useful life:
Years
Buildings 25 – 50
Property facilities 2 – 15
Technical plant and equipment 2 – 15
Other equipment 2 – 15
Factory and office equipment 2 – 15
Impairment losses on intangible and tangible assets are recorded in accordance with IAS 36 if the recoverable amount of the asset is less than its carrying amount. In addition to changes in individual parameters that affect computation such as a significant increase in market yields, a particular focus is placed on changes with an adverse effect on the company in the technological, market, economic or legal environment in which it operates. By means of these indicators KUKA regularly observes whether a triggering event is present that would necessitate an impairment test in accordance with IAS 36. In this context, the recoverable amount is the higher of the fair value less costs to sell and the value in use of the asset in question. If the reasons for an impairment recorded in prior years no longer apply, the impairment is reversed.
Borrowing costs and qualifying assets
Under the provisions of IAS 23, finance costs must be accrued for qualifying assets. Provided they are material, borrowing costs are capitalized for these qualifying assets. Those assets are defined as qualifying assets within KUKA Group for which a period longer than twelve months is required to make them ready for their intended use or sale (IAS 23.5). Examples here within KUKA Group in particular are manufacturing plants, internally-generated intangible assets and long-term construction contracts.
Since the 2016 fiscal year, KUKA has no longer taken any borrowing costs into account for long-term contract production for the time being.
Government grants
In accordance with IAS 20, government grants are recognized only if there is reasonable assurance that the conditions attaching to them will be complied with and that the grants will be received. Government grants related to assets (e.g. investment subsidies and allowances) are disclosed as deferred income and recognized as profit or loss on a systematic basis throughout the useful life of the asset. Grants related to income are recognized immediately in the income statement.
Finance and operating leases
In the vast majority of cases, KUKA Group acts as the lessee. In con-nection with finance leases, ownership is attributed to the lessee in cases in which the lessee assumes substantially all the risks and rewards incidental to ownership (IAS 17). In such cases, leases are capitalized as of the date of the lease agreement at their fair value or at the lower present value of the minimum lease payments. Depreci-ation is recognized by the straight-line method over the useful life or over the lease term if it is shorter. The discounted value of payment commitments in connection with the lease payments is disclosed under other liabilities.
Finance lease agreements for which KUKA Group is the lessor are recognized as a sales and financing transaction. A receivable is valued at the amount of the net investment in the lease and the interest income is recognized in the income statement.
To the extent that KUKA Group has entered into operating leases (as a lessee) according to IAS 17, lease or rent payments are directly rec-ognized as an expense in the income statement and distributed using the straight-line method over the term of the leasing agreement, unless a different systematic basis more closely corresponds with the utilization period. Relevant total future costs are reported in note 30.

KUKA Aktiengesellschaft | Annual Report 2017
80
Financial instruments
KUKA Group holds both primary financial instruments (e.g. trade receivables or trade payables) and derivative financial instruments (e.g. transactions to hedge the risks of changes in fair value).
Derivative financial instruments are financial contracts whose value is derived from the price of an underlying asset (e.g. stocks, bonds, money market instruments or commodities) or a reference rate (such as currencies, indices or interest rates). They require little or no initial investment and are settled at a future date. Examples of derivative financial instruments include options, forward contracts and interest rate swap transactions. KUKA Group only uses derivative financial instruments to hedge foreign currency risk.
Under IAS 39 the following categories of financial instrument are relevant to KUKA Group (see note 29):
› Loans and receivables › Financial instruments held to maturity › Financial assets and financial liabilities held for trading with
measurement at fair value through profit or loss. › Available-for-sale financial assets › Other financial liabilities (financial liabilities measured at
amortized cost)
As a general rule, financial instruments are initially recognized when the asset is delivered to or by KUKA (settlement date accounting). Subsequent measurement takes place either at fair value or at amortized cost, depending on the measurement category (see also note 29).
› Measurement of loans and receivables, financial instruments held to maturity and other financial liabilities takes place at amortized cost after initial recognition.
› Subsequent measurement of financial assets or financial lia-bilities held for trading takes place at fair value through profit or loss.
› Available-for-sale financial assets are subsequently measured at fair value but are not recognized in profit or loss.
Derivatives
KUKA Group recognizes all derivatives at fair value as of the settle-ment date. The fair value is determined with the aid of standard finan-cial mathematical techniques, using current market parameters such as exchange rates and counterparty credit ratings (mark-to-market method) or quoted prices. Middle rates are used for this calculation.
Derivatives are used to hedge currency fluctuations.
Derivatives with a positive fair value are recognized under other assets. If the fair value of derivatives is negative, this results in rec-ognition under other liabilities.
Investments in non-consolidated companies and financial investments
In KUKA Group, investments in continuing business units that are not material to the net assets, financial position and performance of the Group are reported under available-for-sale financial assets. They are recognized at cost of purchase. Current market values are not available for shares held by KUKA, since no shares are traded in an active market.
Receivables and other assets
Receivables and other assets are recognized at amortized cost, apply-ing the effective interest method with appropriate discounts for all identified individual risks. General credit risk, if detectable, is also accounted for by appropriate valuation allowances. For this purpose, these financial assets are grouped in accordance with similar default risk characteristics and are collectively tested for impairment, and written down if necessary. When calculating any such impairment losses, the empirical default history is taken into account in addition to contractually stipulated payment flows.
The carrying amount of the assets is lowered using separate allow-ance accounts for impairment losses. Actual defaults result in a write-off of the receivables in question. The maximum theoretically possible default risk corresponds to the carrying amounts. The carry-ing amounts largely correspond to the market values.
Cash and cash equivalents
Cash and cash equivalents are measured at cost and include all cash funds recognized on the balance sheet, i.e. cash on hand, checks and cash balances at financial institutions with a remaining term of three months or less. Securities with an original remaining term of more than three months are not recognized in this item but under other assets.
Liabilities
Liabilities are recognized on the balance sheet at amortized cost. Payables arising from finance leases are recognized at the present value of future lease payments.
Long-term liabilities with a term of more than one year are discounted to the balance sheet date on the basis of appropriate interest rates where the interest effect is material.
On initial recognition, financial liabilities are carried at fair value less transaction costs. They are measured at amortized cost in subsequent periods; any difference between the amount paid out (less transaction costs) and the settlement value is recognized in the interest result for the term of the loan using the effective interest method. Fees incurred when setting up credit lines are capitalized as credit trans-action costs and are recognized as interest expense over the term of the corresponding loan commitment.

Group notes
81
Trade payables also include payments due on outstanding supplier invoices. KUKA Group has launched a “supplier finance program” for the purpose of managing trade payables. A separate agreement is made for each supplier based on a framework agreement with banks in which the supplier can discount authorized receivables at the bank at any time (i.e. those that have been approved by KUKA). KUKA Group pays the liability to the bank on the due date, irrespective of the supplier’s discounting date. This gives both suppliers and KUKA added flexibility and security.
Inventories
According to IAS 2, inventories are recognized at the lower of cost and net realizable value. They are valued at the average cost of acquisition or production. In addition to the direct unit costs, production costs also include appropriate costs for indirect materials and production overheads according to IAS 2. Write-downs to lower net realizable value have been taken to the extent required. In addition to valuation allowing disposal at no net loss, these write-downs also cover all other inventory risk. If the reasons that led to a devaluation of inventories in the past no longer exist, impairment losses are reversed.
Current and deferred taxes
Tax receivables and liabilities are assessed using the expected amount of the reimbursement from or payment to the tax authorities. The local tax laws are taken into consideration for the calculation.
Deferred tax assets and liabilities are recorded according to IAS 12 for all temporary differences between the carrying amounts of assets and liabilities on the Group balance sheet and their recognized value for tax purposes (liability method) as well as for tax loss carryforwards. Deferred tax assets for accounting and valuation differences as well as for tax loss carryforwards are only recognized to the extent that there is a sufficiently probable expectation that the corresponding benefit will be realized in the future. Deferred tax assets and liabilities are not discounted. Deferred tax assets are netted against deferred tax liabilities if the tax creditor is the same.
Pension provisions and similar obligations
The measurement of pension provisions and similar obligations is performed according to IAS 19. Pensions and similar obligations comprise obligations of KUKA Group to pay benefits under defined benefit plans. Company obligations from defined benefit plans are determined separately for each defined benefit plan according to actuarial principles. First the retirement benefits are estimated that employees have earned in return for their service in the current period and prior periods. Then these benefits are discounted using the projected unit credit method. In addition to known pensions and vested benefits as of the balance sheet date, this method also takes expected future increases in salaries and pensions into account. The calculation is based on actuarial reports that must be prepared annually based on biometric data. Actuarial gains and losses are rec-ognized in other comprehensive income in the period during which they arise. The company determines the net interest expense (net interest income) by multiplying the net liability (net asset value) at the beginning of the period with the underlying interest rate of the discount of the gross defined benefit pension obligation at the beginning of the period. Past service cost due to changes to the plan
is recognized directly in the period in which the change occurs. The standard return on plan assets is recognized in the amount of the discount rate applied to pension obligations. Administrative expenses for plan assets are recognized as part of the revaluation component in other comprehensive income, whereas other administrative costs are allocated to operating profit at the time the costs are incurred. Insurers hold reinsurance coverage for excess obligations from pre-re-tirement schemes (Altersteilzeit) based on the “block model”. This is recognized using the same interest rate as the corresponding liability. The amount added for obligations from pre-retirement schemes is proportional to the amounts in the applicable collective bargaining agreements.
Other provisions
Other provisions are recognized in the event that there is a current obligation to third parties arising from a past event. It must be pos-sible to estimate the amount reliably, which must then more likely than not lead to an outflow of future resources. Provisions are only recognized for legal and constructive obligations to third parties.
Provisions are recognized for costs of restructuring to the extent that a detailed, formal restructuring plan has been created and commu-nicated to the parties affected by it and it is highly probable that the company can no longer withdraw from these obligations.
No provisions are recognized for future expenses, since these do not represent an external obligation.
Liabilities in the personnel area such as vacation pay, flex-time credits and the statutory German pre-retirement scheme (Altersteilzeit) are recognized under other liabilities.
Liabilities for outstanding vendor invoices are recognized under trade payables.
Provisions are classified as current when it is expected they will be used within the normal business cycle. This may extend for longer than a year in individual cases. Long-term provisions with a term of more than one year are discounted to the balance sheet date on the basis of appropriate interest rates where the interest effect is material.

KUKA Aktiengesellschaft | Annual Report 2017
82
Assets and liabilities held for sale
A non-current asset (or disposal group) is classified as held for sale if the associated carrying amount is mainly realized by a sales transac-tion or a distribution to shareholders and not by continued use. For this to be the case, the asset (or disposal group) in its current state under conditions that are established practice and common for the sale /distribution of such assets (or disposal groups) must be imme-diately available for sale /distribution and such sale /distribution must be highly probable. Non-current assets and disposal groups held for sale are measured at the lower of carrying amount and fair value, less disposal costs, unless the items presented in the disposal group do not fall within the measurement rules of IFRS 5.
Share-based compensation
KUKA employees of German companies had the opportunity to pur-chase KUKA shares as part of an employee share program for the last time in the 2016 fiscal year. Graded according to a holding period (vesting period) of one, three and five years, employees receive an additional share as a bonus share for every ten KUKA shares acquired. Rights to additional shares are forfeited if the employment relation-ship of the beneficiary is terminated before the end of the vesting period. A 50% incentive in the form of extra shares was granted in addition to the subscribed shares. KUKA employees acquired a total of 17,280 shares in the previous year, for which 8,640 incentive shares were credited. The KUKA share price at the time the shares were granted was €105.91. This resulted in an expense of €0.9 million for the previous year, which was recognized as other operating expenses.
In addition to the employee share program, KUKA also had an annual phantom share program for the executive management team, which was introduced in 2012. The last phantom share program was launched in 2016 and relates to the years 2016 to 2018. There are cur-rently two other phantom share programs. The programs are treated as a cash-settled, share-based compensation instrument using the fair value at the balance sheet date. The measurement parameters correspond to the phantom share program of KUKA Aktienge-sellschaft’s Executive Board.
In place of the previous phantom share programs, the members of the executive management team have been entitled to participate in long-term incentive plans (hereinafter “LTIPs”) with annual allocation volumes since 2017. The LTIPs are variable compensation elements with long-term target-based incentives and a timespan of three finan-cial years. The current plan thus covers the period 2017 to 2019. The targets are based on performance and strategy factors. The measure-ment parameters correspond to the LTIP of KUKA Aktiengesellschaft’s Executive Board. The LTIP is not linked to the share price.
The entitlements from both the phantom share programs and the LTIPs are paid out at the end of the contractually agreed period. Early pay-ment is possible only under certain conditions when leaving the Group.
An amount of €9.2 million (2016: €15.1 million) was set aside as at December 31, 2017 for future claims arising from the phantom share program for the executive management team and an amount of €0.4 million for the LTIP.
See the compensation report for further details about the structure of the phantom share program and LTIP.
Assumptions and estimates
KUKA prepares its consolidated financial statements in compliance with the IFRS standards mandatory in the EU. In certain cases it is necessary for management to make assumptions and estimates. This is common practice in the preparation of the Group’s consolidated financial statements. The assumptions and estimates made may change over time and differ from the actual amounts determined at a later time. Moreover, management could have made different assumptions and estimates in the same reporting period for sim-ilarly justifiable reasons. In the application of accounting policies, the company has made the following discretionary decisions, which in some cases have a significant effect on the amounts in the annual financial statements. These do not include those decisions that rep-resent estimates.
It is necessary to make assumptions and estimates, in particular when addressing the following accounting issues:
› Definition of the scope of consolidation › Calculation of fair value › Development costs › Goodwill impairments › Impairments of brand names with an indefinite useful life › Deferred tax assets on loss carryforwards › Trade receivables › Receivables and liabilities from construction contracts › Pensions and other post-employment benefits › Provisions

Group notes
83
Definition of the scope of consolidation
Subsidiaries are those companies over which KUKA AG has existing rights enabling it currently to direct their significant operations. Sig-nificant operations are business operations which have a material impact on the profitability of a company. Control is therefore only present if KUKA AG is exposed to variable returns as a result of its relationship with a company and has the possibility to influence these returns through its power to control the significant operations. As a rule, the possibility of exercising control is based on KUKA AG having direct or indirect majority voting rights. However, since further param-eters are required for the assumption of control over a subsidiary (such as, for example, additional contractual agreements), a judg-ment must always be made on the overall construct and on this basis an assessment concerning the type of consolidation to be applied. Joint ventures have their basis in joint agreements. A joint agreement is present if KUKA Group shares the management of activities con-ducted with a third party on the basis of a contractual agreement. Joint management is only present if decisions on significant activi-ties require unanimous agreement from the parties involved. In the case of joint ventures the parties exercising the joint management hold rights to the net assets of the agreement. Joint ventures are accounted for according to the equity method. Associates are also measured by the equity method for which as a rule KUKA AG exercises significant influence based on a shareholding of between 20% and 50%. In both cases all the parameters of the particular relationship are examined for the type of consolidation and the assessment made concerning the type of consolidation.
Calculation of fair value
IFRS 13 defines how to determine fair market value and expands on disclosures related to the fair market value. The standard does not include any requirements regarding the cases for which fair value is to be used. Here, fair value is defined as the price that would be paid by independent market participants in an arm’s length transaction at the evaluation date if an asset were sold or a liability transferred. In accordance with IFRS 13, assets and liabilities evaluated at market values are to be attributed to the three levels of the fair value hierar-chy. The three levels of the fair value hierarchy are defined as follows:
Level 1Quoted prices in active markets for identical assets or liabilities.
Level 2Inputs other than quoted prices that are observable either directly or indirectly.
Level 3Inputs for assets and liabilities that are not based on observable market data.
Development costs
Development costs are recognized as assets in accordance with the methods described under accounting policies. For the purpose of test-ing the potential impairment of the amounts recognized as assets, management must make assumptions concerning the expected future cash flows from assets, the applicable discount rates and the timing of the inflow of expected future cash flows. Moreover, assump-tions must be made regarding costs yet to be incurred and the period until completion for projects that are still in the development stage.
Goodwill
Assets recognized as goodwill are tested at least once a year for impairment in KUKA Group. This requires an estimate to be made of the value in use for each cash generating unit to which the goodwill has been attributed. To determine the value in use, management must estimate the future cash flows of the respective cash gener-ating units and select an appropriate discount rate for calculating the present value of these cash flows. The selected discount rate, for example, is influenced by volatility in capital markets and interest rate trends. The expected cash flows are also influenced by fluctuations in exchange rates and the expected economic developments. Further-more, continuous review is necessary to determine whether there is any indication of impairment. In addition to changes in individual parameters that affect computation such as a significant increase in market yields, a particular focus is placed on changes with an adverse effect on the company in the technological, market, economic or legal environment in which it operates. By means of these indicators KUKA regularly observes whether a triggering event is present that would necessitate an impairment test in accordance with IAS 36 for goodwill, but also for other non-current assets. For details about the carrying amounts of the assets recognized as goodwill and the performance of the impairment tests please refer to the discussion under note 7.
Brand names with an indefinite useful life
KUKA Group assesses the intrinsic value of brand names with an indefinite useful life at least once a year. This involves estimating the future cash flows based on a potentially fictitious licensing income and selecting an appropriate discount rate for calculating the pres-ent value of these cash flows for each brand name. In this case too, the selected discount rate, for example, is influenced by volatility in capital markets and interest rate trends. The expected cash flows are also influenced by fluctuations in exchange rates and the expected economic developments.
Deferred tax assets on loss carryforwards
Deferred tax assets for loss carryforwards are recognized to the extent that it is probable that taxable income will be available such that the loss carryforwards can actually be used. The determination of the amount of deferred tax assets requires an estimate on the part of management of the expected timing and amount of anticipated future taxable earnings as well as future tax planning strategies. For details please refer to the explanations under note 5.

KUKA Aktiengesellschaft | Annual Report 2017
84
Trade receivables
Impairment of doubtful receivables involves making significant esti-mates and assessments regarding individual receivables based on the creditworthiness of the respective customer, the current economic trends and the analysis of historical bad debts on a portfolio basis. As far as the company derives the impairment on a portfolio basis using historical default rates, a decrease in the volume of receivables reduces such provisions accordingly and vice versa.
Receivables and liabilities from construction contracts
Long-term construction contracts are recognized using the percentage of completion method. A significant share of business in the Systems and Swisslog segments in particular is related to long-term construc-tion contracts. Revenues are reported based on the percentage of completion. A careful estimate of the progress toward completion is essential here. Depending on the method used to determine the per-centage of completion, the most important estimates include the total order costs, the costs yet to be incurred until completion, the total pro-ject revenues and risks as well as other assessments. The management team responsible for the respective project continuously monitors all estimates on a monthly basis and adjusts these as needed.
Pensions and other post-employment benefits
Expenditures under defined-benefit plans and other post-employment benefits are determined on the basis of actuarial calculations. The actuarial calculations are prepared on the basis of assumptions with respect to discount rates, future increases in wages and salaries, mor-tality rates and future pension increases. In line with the long-term orientation of these plans, such estimates are subject to significant uncertainties. Please see note 23 for further details.
Provisions
To a large degree, the designation and measurement of provisions for impending losses from contracts, of provisions for warranty obliga-tions and of litigation provisions involve making estimates.
Long-term construction contracts in particular are awarded based on invitations to tender. KUKA recognizes a provision for impending losses when the current estimated total costs arising from the respec-tive contract exceed the expected total revenue. These estimates may change due to new knowledge as the project progresses. Deficit orders are identified based on continuous project costing. This requires an assessment of the performance standards and warranty costs.
KUKA Group is confronted with litigation in different areas. These proceedings can lead to criminal or civil sanctions or fines. A provision is always recognized when it is likely an obligation will result that will lead to future cash outflows and the amount of which can be reliably assessed. The underlying issues are often complex and associated with great uncertainties. Judgment whether a present obligation aris-ing from a past event is to be recognized on the balance sheet date, whether future cash outflows are probable and the obligation can be reliably assessed is therefore largely at the discretion of management. The company, with the assistance of external legal professionals, reg-ularly assesses the respective stage of the proceeding. New findings can change the assessment and it may be necessary to adjust the provision accordingly. For further details, please refer to note 24.
Changes in accounting and valuation methods
KUKA Group did not apply any standards or interpretations for the first time in the 2017 fiscal year that have a material effect on the Group’s net assets, financial position or performance. The following revised standards and interpretation were applied for the first time in the consolidated financial statements in the 2017 fiscal year:
› Amendments to IAS 7 – Disclosure Initiative › Amendments to IAS 12 – Recognition of Deferred Tax Assets
for Unrealized Losses › Annual Improvements 2014 – 2016 – Amendments to IFRS 12
Amendments to IAS 7 – Disclosure Initiative
Pursuant to the amendments, a company must provide information on the changes to those financial liabilities whose cash receipts and payments are shown in the cash flow statement as cash flow from financing activities. Associated financial assets such as assets from hedging transactions are also to be included in these disclosures.
Amendments to IAS 12 – Recognition of Deferred Tax Assets for Unrealized Losses
The amendments to IAS 12 are serve to clarify that write-downs to a lower market value of debt instruments measured at fair value arising from a change in market interest rates can give rise to deductible temporary differences.
Annual Improvements 2014 – 2016 – Amendments to IFRS 12
The amendment clarifies that the disclosure requirements of the standard also apply to shares that fall within the scope of IFRS 5. Excluded from this are the requirements pursuant to IFRS 12.B10-B16.

Group notes
85
Altogether, the following standards, standard adjustments and inter-pretations were approved by the balance sheet date and have in part already been adopted into EU law:
Standard /Interpretation Effective date Planned application by
KUKA AG
IFRS 9 – Financial Instruments
Jan. 1, 2018 Fiscal year 2018
IFRS 15 – Revenue from Contracts with Customers
Jan. 1, 2018 Fiscal year 2018
Clarification of IFRS 15 – Revenue from Contracts with Customers
Jan. 1, 2018 Fiscal year 2018
Annual Improvements 2014 – 2016 – Amendments to IFRS 1, IAS 28
Jan. 1, 2018 Fiscal year 2018
Amendments to IFRS 2 – Classification and Measurement of Share-based Payment Transactions
Jan. 1, 2018 Fiscal year 2018 1
Amendments to IFRS 4 – Applying IFRS 9 Financial Instruments with IFRS 4 Insurance Contracts
Jan. 1, 2018 Fiscal year 2018
Amendments to IAS 40 – Transfers of Investment Property
Jan. 1, 2018 Fiscal year 2018 1
Amendments to IFRIC 22 – Foreign Currency Transactions and Advance Consideration
Jan. 1, 2018 Fiscal year 2018 1
IFRS 16 – Leases
Jan. 1, 2019 Fiscal year 2019
IFRIC 23 – Uncertainty over Income Tax Treatments
Jan. 1, 2019 Fiscal year 2019 1
Amendments to IFRS 9 – Prepayment Features with Negative Compensation
Jan. 1, 2019 Fiscal year 2019 1
Amendments to IAS 28 – Long-term Interests in Associates and Joint Ventures
Jan. 1, 2019 Fiscal year 2019 1
Annual Improvements 2015 – 2017 – Amendments to IFRS 3, 11 and IAS 12, 13
Jan. 1, 2019 Fiscal year 2019 1
IFRS 17 – Insurance Contracts
Jan. 1, 2021 Fiscal year 2021 1
Amendments to IFRS 10 and IAS 28 – Sale or Contribution of Assets between an Investor and its Associate or Joint Venture
n.a. 2 n.a. 2
1 Pending adoption (endorsement) by the European Union
2 Initial application by the IASB has been postponed indefinitely
The useful life of the “Swisslog” brand, which was capitalized within the scope of the company acquisition of Swisslog Group and has pre-viously been amortized using the straight-line method, was changed to indefinite at the beginning of the 2017 financial year on account of a modified management assessment. The brand name was previously amortized annually at around €1.2 million. The impairment of the residual carrying amount of €22.2 million will therefore be assessed on an annual basis, with an impairment test being carried out if there are relevant indications. The test results for 2017 did not lead to an impairment being required.
Government grants for assets have exclusively been disclosed on a gross basis since the 2017 fiscal year. Grants are therefore accounted for as deferred income and not deducted from the carrying amount.
Effects of new accounting standards to be applied as of the 2018 fiscal year
KUKA does not plan to apply at an early stage the following new or amended standards and interpretations whose application is not mandatory until later fiscal years. The effects of these new standards are being continuously evaluated. A more detailed description is pro-vided below for a number of selected standards.
IFRS 9 – Financial Instruments
The IFRS 9 standard issued in July 2014 replaces the existing guide-lines in IAS 39 Financial Instruments: Recognition and Measurement. IFRS 9 contains revised guidelines for the classification and valuation of financial instruments, including a new model of the expected credit defaults for calculating the impairment of financial assets, and the new general accounting requirements for hedging transactions. It also adopts the guidelines for the recognition and derecognition of financial instruments from IAS 39.
KUKA expects to apply the full retrospective method for the tran-sition. While the changeover to the new standard has been largely completed and the effects of the changeover are currently being ana-lyzed, it has not yet been possible to reliably determine these effects. We are expecting marginally higher impairments on account of the new model for recognizing credit defaults.
IFRS 9 Financial Instruments must be applied by KUKA as of Janu-ary 1, 2018.
IFRS 15 Revenue from Contracts with Customers
Published by the IASB in May 2014, IFRS 15 Revenue from Contracts with Customers lays down a comprehensive framework for determin-ing whether, in what amount and at what time revenues are to be recognized. It replaces existing guidelines for recognizing revenues, including IAS 18 Revenue, IAS 11 Construction Contracts and IFRIC 13 Customer Loyalty Programmes. Pursuant to IFRS 15, a company recognizes revenues in the amount in which it expects corresponding compensation for the transfer of goods and provision of services. This is implemented in a five-step model. This model governs the identification of the contract with a customer, the identification of distinct performance obligations in the contract, the determination of the transaction price, the allocation of the transaction price to the performance obligations of the contract and the recognition of reve-nue when the performance obligations are satisfied. Differences in the timing of revenue recognition may result from the new regulations if the transaction price has to be allocated to various performance obli-gations or if variable price components have to be taken into account.
The implementation project for the accounting of revenues from contracts with customers has been completed; analyses performed throughout the Group indicate that no significant changes are to be expected in relation to the current practice under IAS 18, IAS 11. Revenues from construction contracts may still be recognized on a period-specific basis according to the percentage of completion method. There will be changes in the disclosure such as new items for contract assets and liabilities in the balance sheet. Furthermore, additional quantitative and qualitative explanatory notes are associ-ated with the application of IFRS 15.

KUKA Aktiengesellschaft | Annual Report 2017
86
KUKA must apply IFRS 15 as of January 1, 2018. The Group has opted to apply the modified retrospective method for the changeover to IFRS 15 in its consolidated financial statements, according to which method the accumulated adjustment amounts are recorded as of January 1, 2018.
IFRS 16 Leases
IFRS 16 introduces a uniform accounting model by which leases have to be reported in the balance sheet of the lessee. A lessee reports a right-of-use asset that represents its right to use the underlying asset and a liability from the lease that represents its obligation to make lease payments. There are exceptions for short-term leases and leases for low-value assets. Accounting by the lessor is comparable with the current standard – this means that lessors still classify leases as financing or operating leases.
IFRS 16 replaces the existing guidelines on leases, including IAS 17 Leases, IFRIC 4 Determining Whether an Arrangement Contains a Lease, SIC-15 Operating Leases – Incentives and SIC-27 Evaluating the Substance of Transactions Involving the Legal Form of a Lease.
The standard must be applied for the first time in the first reporting period of a fiscal year starting on or after January 1, 2019. KUKA has started to assess the potential effects of the application of IFRS 16 on its consolidated financial statements but it is not yet possible for them to be conclusively quantified. A decision has not been made yet as to which transitional method should be applied.
Explanation of items in the financial statements
Notes to the Group income statement
1. Sales revenues
Sales revenues include fees and charges billed to customers for goods and services less any sales deductions. Sales revenues primarily include delivered products and downstream services. Services account for €221.0 million (18.4%) of sales revenues in the Robotics division as compared to €191.6 million (19.3%) reported in 2016. At Swisslog, ser-vices account for €275.0 million (36.0%) of sales revenues compared to €254.6 million (42.7%) in 2016. Services play a less significant role in the Systems division. The breakdown of sales revenues by business division and region is shown in Group segment reporting.
In connection with construction contracts, sales revenues in the amount of €1,890.8 million were recognized in the reporting year (2016: €1,579.0 million) according to the percentage of completion method.
2. Cost of sales, selling expenses, research & development expenses and general and administrative expenses
The following is a breakdown of the cost of sales, selling expenses, research and development expenses and general and administrative expenses:
in € millions
Cost of sales Selling expenses Research and develop-ment expenses
General and adminis-trative expenses
Total
2016 2017 2016 2017 2016 2017 2016 2017 2016 2017
Cost of materials 1,468.3 1,959.8 5.1 2.5 9.2 8.3 3.6 8.4 1,486.2 1,979.0
Personnel expense 605.9 651.4 144.5 160.4 68.4 83.8 149.8 142.6 968.6 1,038.2
Amortization 34.2 33.2 12.6 10.7 9.3 12.8 20.6 20.8 76.7 77.5
Other expenses and income 74.0 80.4 105.7 133.1 39.7 23.8 54.2 39.6 273.6 276.9
Total 2,182.4 2,724.8 267.9 306.7 126.6 128.7 228.2 211.4 2,805.1 3,371.6
The increase in the cost of sales was mainly attributable to higher material usage. Altogether the total functional costs increased by significantly less than revenues in the fiscal year. The research & devel-opment expenses include €0.1 million amortization on borrowing costs capitalized in prior years (2016: €0.1 million). Foreign currency gains and losses from operational foreign currency transactions total-ing -€2.8 million (2016: -€0.8 million) are also recognized in other expenses and income under the cost of sales.
Personnel costs are directly allocated to the functional areas. The following figures result:

Group notes
87
in € millions 2016 2017
Wages and salaries 784.2 843.9
Social security payments and contributions for retirement benefits and provident funds 184.4 194.3
(of which, for retirement benefits) (27.1) (27.8)
Personnel costs 968.6 1,038.2
Annual average employees and employees at the balance sheet date in KUKA Group:
Employees by functional areas Annual average Balance sheet date
2016 2017 Total 2016 Total 2017 of which, Germany
of which, abroad
Manufacturing 8,951 9,602 9,150 9,830 3,030 6,800
Sales 1,454 1,611 1,539 1,690 615 1,075
Administration 1,198 1,242 1,225 1,314 543 771
Research and development 828 963 885 1,027 669 358
12,431 13,418 12,799 13,861 4,857 9,004
Apprentices 313 277 305 296 217 79
Student trainees 27 98 84 99 66 33
Total 12,771 13,793 13,188 14,256 5,140 9,116
3. Other operating income and expenses
The line items under other operating income and expenses capture income and expenses that are not allocated to the functional catego-ries cost of sales, selling expenses, research & development expenses, general and administrative expenses or otherwise reported separately.
Other operating income increased from €6.6 million in 2016 to €18.8 million in the current fiscal year 2017 and includes grants, special discounts, income from the payment of damages and the release of provisions that are not required.
Other operating expenses (2017: €21.4 million; 2016: €18.2 million) include other taxes amounting to €5.6 million (2016: €6.8 million).
4. Financial result
The net expenses and income in the financial result equated to an expense of €9.2 million in the 2017 fiscal year. This is an increase in expenditure compared with the previous year when the financial result was -€4.9 million.
in € millions 2016 2017
Depreciation of financial assets – 0.2
Interest income from finance lease 6.2 5.3
Remaining interest and similar income 1.9 0.9
Other interest and similar income 8.1 6.2
Interest component for allocations to pension provisions 2.2 1.9
Guarantee commissions 1.1 1.3
Interest expense for the convertible bond 0.3 –
Interest expense for the promissory note loan 3.6 3.6
Financing costs reclassified to operating results and capitalized -0.3 -0.2
Foreign currency gains and losses 2.1 5.8
Remaining interest and similar expenses 3.0 2.8
Other interest and similar expenses 12.0 15.2
Current financial result -3.9 -9.2
One-off charge on syndicated loan agreement 1.0 –
Financial result -4.9 -9.2
The interest income amounted to €6.2 million (2016: €8.1 million), which mainly includes income in connection with finance leases and income from short-term investments. Currency effects in the area of financing are shown in the financial result. The net balance of foreign exchange gains and losses in the past fiscal year led to a foreign currency loss of €5.8 million (2016: €2.1 million). In the reporting period, interest expense totaled €15.2 million. Most of this relates to the new promissory note loan placed in October 2015 with interest expense of €3.6 million and the net interest expense for pensions of €1.9 million (2016: €2.2 million). Expenditure on sureties and guar-antees amounted to €1.3 million (2016: €1.1 million).

KUKA Aktiengesellschaft | Annual Report 2017
88
The existing syndicated loan agreement was modified substantially in December 2016. This significant change to the agreement resulted in capitalized transaction costs of €1.0 million being recorded in full as interest expense in the previous year.
5. Taxes on income /deferred taxes
Tax expense Income tax expense breaks down by origin as follows:
in € millions 2016 2017
Current taxes 45.1 58.2
(of which, relating to other periods) (1.0) (-10.2)
Deferred taxes -9.0 -52.9
(of which, from temporary differences) (-10.7) (-41.8)
(of which, from loss carryforwards) (1.7) (-11.1)
Tax expense 36.1 5.3
Of the current expenses for tax on earnings, -€0.2 million is attrib-utable to domestic expenditure compared to €7.7 million in 2016, whereas €58.4 million is attributable to foreign expenditure com-pared to €37.4 million in 2016.
Deferred tax income of €19.3 million are attributable to domestic operations and €33.6 million to foreign. This compares with the fig-ures for 2016 of €0.8 million and €8.2 million, respectively.
The expected tax expense based on earnings before taxes and the applicable tax rate for the KUKA companies in Germany remained unchanged at 32.0% and leads to the following actual tax expense:
in € millions 2016 2017
Earnings before tax expense 122.3 93.5
Expected tax expense 39.1 29.9
Tax rate-related differences 2.1 3.4
Tax reductions due to tax-exempt income -12.7 -16.7
Tax increases due to non-deductible expenses 7.7 3.8
Tax expenses (+) / tax income (–) for prior years -13.5 -24.7
Change in allowance on deferred taxes 11.4 12.3
Change in permanent differences 0.5 0.1
First-time recognition of previously unrecognized deferred tax assets on tax loss carryforward 0.0 -2.2
Tax impact of investments accounted for by the equity method 0.8 0.2
Effects resulting from tax rate changes 0.0 -0.9
Other differences 0.7 0.1
Taxes on income (actual tax expense) 36.1 5.3
The applicable tax rate in Germany still comprises corporate income tax (Körperschaftsteuer) of 15.0% as well as reunification tax (Solidar-itätszuschlag) of 5.5% and earned income tax (Gewerbesteuer) based on a uniform tax rate of 16.2% as was the case in the previous year.
In principle, deferred taxes were recognized on the basis of the appli-cable tax rate for each company in question.
There are no tax credits for which deferred taxes would need to be accounted.
Current tax expense in other accounting periods totaling -€10.2 mil-lion (2016 income: €1 million) resulted in the German and foreign operations.
Deferred taxesThe value of deferred tax assets and liabilities due to temporary dif-ferences and tax loss carryforwards in the Group is associated with the following items:
in € millions
Deferred tax assets Deferred tax liabilities
Dec. 31, 2016
Dec. 31, 2017
Dec. 31, 2016
Dec. 31, 2017
Non-current assets 15.6 21.3 88.7 70.6
Current assets 59.4 98.8 66.1 78.9
Provisions 51.3 52.7 4.6 4.0
Liabilities 51.4 39.9 13.2 15.9
Subtotal 177.7 212.7 172.6 169.4
Balancing item -127.3 -141.9 -127.3 -141.9
Valuation allowance -11.4 -11.9 – –
Subtotal 39.0 58.9 45.3 27.5
Deferred taxes on tem-porary differences 39.0 58.9 45.3 27.5
Deferred taxes on tax loss carryforwards 9.8 20.7 – –
Total 48.8 79.6 45.3 27.5
Of which, from items recognized in equity 5.0 2.4 – –
The significant changes to deferred tax assets in a year-on-year compar-ison, especially in relation to current assets, are associated with short-term fluctuations in the valuation of inventory assets in the project business with long-term operations that differs according to tax law.
Valuation allowances to the carrying amount of deferred tax assets are recognized if the realization of the expected benefit of the deferred taxes is not sufficiently probable. The estimates made are subject to change over time, which may result in the reversal of the valuation allowance in subsequent periods.
The recognized values on the balance sheet are written off in the event that the tax benefits that they represent were no longer expected to be realized.

Group notes
89
In the loss carryforwards of €269.0 million (2016: €294.6 million), amounts totaling €200.5 million (2016: €255.6 million) are not con-sidered in the accounting of deferred taxes.
The eligibility of loss carryforwards amounting to €61.6 million (2016: €65.1 million) are available with a time limit and the remaining €200.5 million (2016: €229.5 million) is not subject to a time limit.
The loss carryforwards for which deferred taxes were capitalized relate to the total loss carryforwards as follows:
in € millions
Loss carryforwards for which deferred taxes
were capitalized
Total existing loss carryforwards
Dec. 31, 2016
Dec. 31, 2017
Dec. 31, 2016
Dec. 31, 2017
Swisslog (Deutschland) GmbH – 2.2 – 24.5
Reis GmbH & Co. KG Maschinenfabrik – 0.3 42.7 34.5
KUKA Aktiengesellschaft 10.9 47.2 41.5 65.2
Other 28.1 18.8 210.4 144.8
Total 39.0 68.5 294.6 269.0
Deferred tax income in the amount of €2.2 million (2016: €0 million) results from the recognition of deferred tax receivables on loss carry-forwards from earlier periods which until now had not been included in or written down from the tax accrual /deferral. Deferred tax assets previously recognized but not recognized in the current year in the amount of €7.7 million (2016: €11.4 million) were not reported. In accordance with IAS 12, deferred tax items must be recognized for the difference between the proportionate equity of a subsidiary rec-ognized on the Group balance sheet and the investment carrying amount of this subsidiary on the tax balance sheet of the parent company (so-called “outside basis differences”) if it is likely that this difference will be realized. Since both KUKA Aktiengesellschaft and the subsidiaries in question are corporations, these differences are predominantly tax-exempt under section 8b of the Corporation Tax Law (KStG) upon realization and thus are permanent in nature. According to IAS 12.39, no deferred tax liability should be recognized even for temporary differences (e.g. those resulting from the 5% flat-rate allocation under section 8b KStG) if it is not likely, given control by the parent company, that these differences will reverse in the foreseeable future. Since no such reversal is expected, no deferred tax items had to be recognized on the balance sheet for this purpose. There are outside basis differences in the amount of €13.0 million (2016: €13.6 million).
Overall, the change to deferred tax assets and liabilities of €52.9 mil-lion (2016: -€10.7 million) came from amounts affecting net income totaling €48.6 million (2016: -€9.0 million) as well as, for the most part, amounts not affecting net income due to changes in pension obligations amounting to -€2.6 million and the initial accounting of newly acquired companies in the amount of -€2.9 million. In addition there were relevant currency effects totaling €1.2 million.
Where loss carryforwards have not been written off, it is expected in the planning period that this tax-reducing potential will be utilized via taxable income, which is likely based on the expectations of Group companies.
6. Earnings per share
Undiluted /diluted earnings per share break down as follows:
2016 2017
Net income for the year attributable to the shareholders of KUKA AG (in € millions) 86.6 88.5
Weighted average number of shares outstanding (No. of shares) 39,596,383 39,775,470
Undiluted earnings per share (in €) 2.19 2.22
Diluted earnings per share (in €) 2.19 2.22
Undiluted earnings per share due to shareholders of KUKA Aktienge-sellschaft were calculated in accordance with IAS 33 and the weighted average number of shares outstanding for the year.
In the first quarter of 2016, earnings per share were still diluted by the convertible bond issued in 2013. There was therefore a weighted average of 39,596,383 shares outstanding in 2016.
Following completion of the conversion in the first quarter of 2016, 39,775,470 shares were still outstanding, which means that this num-ber of shares also corresponds to the weighted average of shares outstanding in 2017.

KUKA Aktiengesellschaft | Annual Report 2017
90
Notes to the Group balance sheet: Assets
7. Intangible assets
Schedule of changes in intangible fixed assets in 2017The breakdown of the intangible fixed asset items and their develop-ment through the reporting period are shown in the following table.
in € millions
Acquisition /manufacturing costs Accumulated depreciation and impairment losses Net carrying amount
Status as of Jan. 1, 2017
Exchange rate differences
Additions Disposals Change due to business
combinations /others
Reclassifica-tions
Status as of Dec. 31, 2017
Status as of Jan. 1, 2017
Exchange rate differences
Additions Disposals Change due to business
combinations /others
Status as of Dec. 31, 2017
Status as of Dec. 31, 2017
1. Rights and similar assets 220.0 -12.0 9.1 2.7 25.5 6.3 246.2 100.9 -4.9 25.5 2.4 0.1 119.2 127.0
2. Self-developed software and other development costs 69.2 -3.5 31.7 4.6 0.1 0.0 92.9 15.2 -1.2 11.3 4.5 – 20.8 72.1
3. Goodwill 265.9 -16.5 0.0 – 59.1 – 308.5 8.4 – – – – 8.4 300.1
4. Advances paid 14.5 – 12.5 – – -5.8 21.2 – – – – – – 21.2
569.6 -32.0 53.3 7.3 84.7 0.5 668.8 124.5 -6.1 36.8 6.9 0.1 148.4 520.4
Schedule of changes in intangible fixed assets in 2016
in € millions
Acquisition /manufacturing costs Accumulated depreciation and impairment losses Net carrying amount
Status as of Jan. 1, 2016
Exchange rate differences
Additions Disposals Change due to business
combinations /others
Reclassifica-tions
Status as of Dec. 31, 2016
Status as of Jan. 1, 2016
Exchange rate differences
Additions Disposals Change due to business
combinations /others
Status as of Dec. 31, 2016
Status as of Dec. 31, 2016
1. Rights and similar assets 254.7 2.2 14.5 50.1 0.1 -1.4 220.0 124.7 1.4 25.9 50.1 -1.0 100.9 119.1
2. Self-developed software and other development costs 45.1 0.3 20.1 0.6 1.5 2.8 69.2 7.0 0.2 8.3 0.3 – 15.2 54.0
3. Goodwill 261.9 2.1 – – 1.9 – 265.9 7.0 – 1.4 – – 8.4 257.5
4. Advances paid 0.0 – 14.5 – – 0.0 14.5 – – – – – – 14.5
561.7 4.6 49.1 50.7 3.5 1.4 569.6 138.7 1.6 35.6 50.4 -1.0 124.5 445.1
GoodwillRecognized goodwill amounts to €300.1 million (2016: €257.5 mil-lion). It is distributed across the cash generating units (CGUs) listed below:
in € millions
Dec. 31, 2016 Dec. 31, 2017
Goodwill WACC (%) Goodwill WACC (%)
Aerospace 3.3 14.6 3.3 12.3
Assembly & Test 4.7 15.8 4.7 13.1
Body Structure 45.6 16.3 44.4 14.0
Industries 13.5 11.9 13.5 13.6
Robotics Automotive 3.8 12.1 3.8 11.5
Swisslog 186.2 12.0 184.1 12.3
Other 0.4 12.1 46.0 11.5
Total 257.5 300.1
The “Robotics Automotive” and “Robotics GI (General Industry)” CGUs are allocated to the Robotics division.
The “Body Structure”, “Assembly & Test”, “Industries”, “Advanced Tech-nology Solutions”, “Pay-on-Production” and “Aerospace” CGUs are allo-cated to the Systems division.
The Swisslog division contains the “WDS”, “HCS” and “HQ” CGUs.
The goodwill from the acquisition of Talyst during the fiscal year amounting to €11.2 million was allocated to the “HCS” CGU. The goodwill from the acquisition of Device Insight (€30.5 million) and Visual Components (€15.5 million) was temporarily assigned to the “Other” segment, especially due to the overriding technological focus.
All other amendments to the goodwill listed for each CGU are attribut-able to the currency effects on goodwill in a foreign currency. Goodwill from the “Other” segment amounting to €1.4 million was written down in the previous year based on the impairment test.
The impairment test is based on a three-year detailed planning period and increased steadiness in the last year of the detailed planning, i.e. on a steady return on sales, investments and depreciation. As in the previous year, a moderate perpetual growth rate of 0.5% is applied. The discount rates applied in the financial year before taxes (weighted average cost of capital (WACC)) may be noted from the above table.

Group notes
91
in € millions
Acquisition /manufacturing costs Accumulated depreciation and impairment losses Net carrying amount
Status as of Jan. 1, 2017
Exchange rate differences
Additions Disposals Change due to business
combinations /others
Reclassifica-tions
Status as of Dec. 31, 2017
Status as of Jan. 1, 2017
Exchange rate differences
Additions Disposals Change due to business
combinations /others
Status as of Dec. 31, 2017
Status as of Dec. 31, 2017
1. Rights and similar assets 220.0 -12.0 9.1 2.7 25.5 6.3 246.2 100.9 -4.9 25.5 2.4 0.1 119.2 127.0
2. Self-developed software and other development costs 69.2 -3.5 31.7 4.6 0.1 0.0 92.9 15.2 -1.2 11.3 4.5 – 20.8 72.1
3. Goodwill 265.9 -16.5 0.0 – 59.1 – 308.5 8.4 – – – – 8.4 300.1
4. Advances paid 14.5 – 12.5 – – -5.8 21.2 – – – – – – 21.2
569.6 -32.0 53.3 7.3 84.7 0.5 668.8 124.5 -6.1 36.8 6.9 0.1 148.4 520.4
in € millions
Acquisition /manufacturing costs Accumulated depreciation and impairment losses Net carrying amount
Status as of Jan. 1, 2016
Exchange rate differences
Additions Disposals Change due to business
combinations /others
Reclassifica-tions
Status as of Dec. 31, 2016
Status as of Jan. 1, 2016
Exchange rate differences
Additions Disposals Change due to business
combinations /others
Status as of Dec. 31, 2016
Status as of Dec. 31, 2016
1. Rights and similar assets 254.7 2.2 14.5 50.1 0.1 -1.4 220.0 124.7 1.4 25.9 50.1 -1.0 100.9 119.1
2. Self-developed software and other development costs 45.1 0.3 20.1 0.6 1.5 2.8 69.2 7.0 0.2 8.3 0.3 – 15.2 54.0
3. Goodwill 261.9 2.1 – – 1.9 – 265.9 7.0 – 1.4 – – 8.4 257.5
4. Advances paid 0.0 – 14.5 – – 0.0 14.5 – – – – – – 14.5
561.7 4.6 49.1 50.7 3.5 1.4 569.6 138.7 1.6 35.6 50.4 -1.0 124.5 445.1
The cost of equity capital and borrowing costs were determined on the basis of segment-specific peer groups. The peer group is made up of KUKA’s most important national and international competitors and thus includes companies with similar activity and product portfolios.
The market risk premium is deemed as the key component for the CGUs in the WACC calculation. With the exception of Swisslog (6.50%; previous year: 6.95%), these premiums amount to 6.75% for all CGUs (previous year: 7.0%). The beta factor was determined as a three-year average of the respective peer group; it was 1.064 for the CGUs allocated to the Systems segment (2016: 1.125); except for the Industries CGU 1.063 (2016: 1.104), 1.063 for the CGUs allocated to the Robotics segment (2016: 1.102), 1.012 for Swisslog (2016: 0.975) and 1.098 for the “Other” segment (2016: 1.158).
The ratios for the cost of equity capital and the cost of borrowed capital were determined by CGU based on the average leverage ratios of the respective peer group for the last three years. The tax rate used was 29.7% (2016: 39.7%) with the exception of Swisslog where it was 17.9% (2016: 17.9%).
A 1% higher WACC would only marginally influence the impairment of goodwill – as marginally as a reduction in sales revenues over the entire planning period by 10% with a correspondingly lower cash flow.
Self-developed software and other product development costsTotal expenditures for research and development for the reporting period were €128.7 million compared to €126.6 million in 2016.
According to IAS 38, self-developed software and other product devel-opment costs must be capitalized. For the purpose of such capitaliza-tion, KUKA Group uses the costs of production which include directly attributable costs as well as an appropriate allocation for overheads and depreciation. Borrowing costs are included in the production costs for qualifying assets based on the Group capitalization rate of 1.3% (2016: 1.4%).
In KUKA Group, development costs are recognized as assets mainly at KUKA Roboter GmbH, KUKA Systems GmbH and at Swisslog Group. The companies are working on several projects involving mechan-ical systems and power and control software for robots as well as new applications in the area of medical technology and automation solutions. Borrowing costs of €0.1 million (2016: €0.1 million) were accounted for.
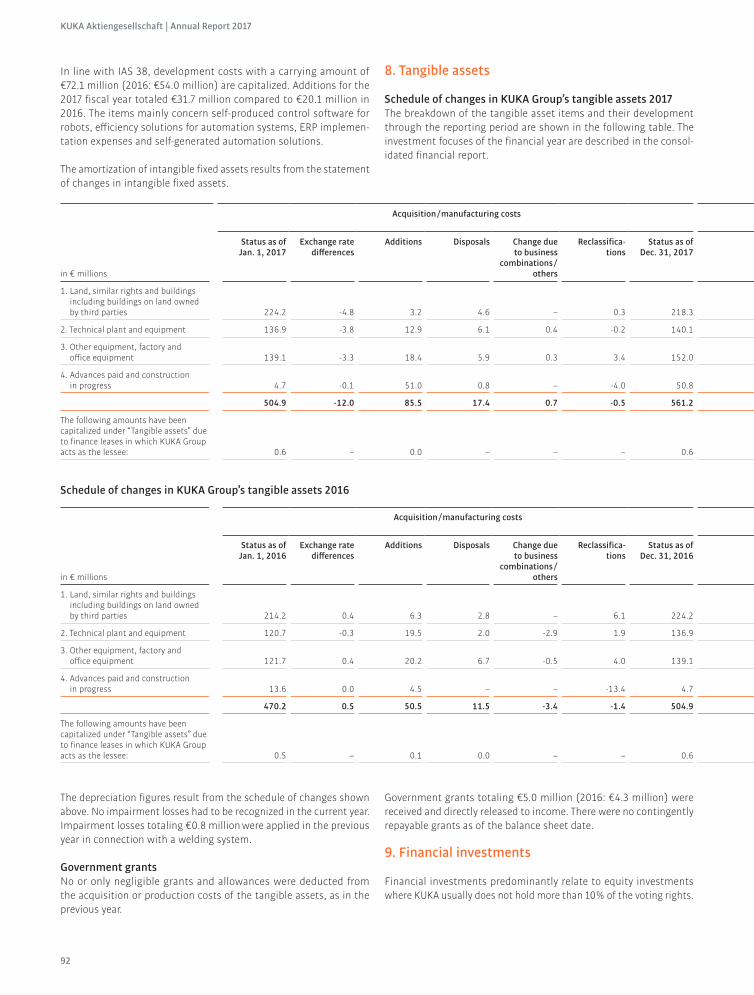
KUKA Aktiengesellschaft | Annual Report 2017
92
In line with IAS 38, development costs with a carrying amount of €72.1 million (2016: €54.0 million) are capitalized. Additions for the 2017 fiscal year totaled €31.7 million compared to €20.1 million in 2016. The items mainly concern self-produced control software for robots, efficiency solutions for automation systems, ERP implemen-tation expenses and self-generated automation solutions.
The amortization of intangible fixed assets results from the statement of changes in intangible fixed assets.
8. Tangible assets
Schedule of changes in KUKA Group’s tangible assets 2017The breakdown of the tangible asset items and their development through the reporting period are shown in the following table. The investment focuses of the financial year are described in the consol-idated financial report.
in € millions
Acquisition /manufacturing costs Accumulated depreciation and impairment losses Net carrying amount
Status as of Jan. 1, 2017
Exchange rate differences
Additions Disposals Change due to business
combinations /others
Reclassifica-tions
Status as of Dec. 31, 2017
Status as of Jan. 1, 2017
Exchange rate differences
Additions Disposals Change due to business
combinations /others
Reclassifica-tions
Status as of Dec. 31, 2017
Status as of Dec. 31, 2017
1. Land, similar rights and buildings including buildings on land owned by third parties 224.2 -4.8 3.2 4.6 – 0.3 218.3 78.4 -1.3 8.0 3.3 – 0.0 81.8 136.5
2. Technical plant and equipment 136.9 -3.8 12.9 6.1 0.4 -0.2 140.1 81.0 -2.1 14.8 4.5 0.1 -1.6 87.7 52.4
3. Other equipment, factory and office equipment 139.1 -3.3 18.4 5.9 0.3 3.4 152.0 83.5 -2.2 17.9 5.0 -0.2 1.7 95.7 56.3
4. Advances paid and construction in progress 4.7 -0.1 51.0 0.8 – -4.0 50.8 0.8 – – 0.8 – 0.0 0.0 50.8
504.9 -12.0 85.5 17.4 0.7 -0.5 561.2 243.7 -5.6 40.7 13.6 -0.1 0.1 265.2 296.0
The following amounts have been capitalized under “Tangible assets” due to finance leases in which KUKA Group acts as the lessee: 0.6 – 0.0 – – – 0.6 0.3 – 0.1 – – – 0.4 0.2
Schedule of changes in KUKA Group’s tangible assets 2016
in € millions
Acquisition /manufacturing costs Accumulated depreciation and impairment losses Net carrying amount
Status as of Jan. 1, 2016
Exchange rate differences
Additions Disposals Change due to business
combinations /others
Reclassifica-tions
Status as of Dec. 31, 2016
Status as of Jan. 1, 2016
Exchange rate differences
Additions Disposals Change due to business
combinations /others
Reclassifica-tions
Status as of Dec. 31, 2016
Status as of Dec. 31, 2016
1. Land, similar rights and buildings including buildings on land owned by third parties 214.2 0.4 6.3 2.8 – 6.1 224.2 72.5 0.2 8.1 2.3 – -0.1 78.4 145.8
2. Technical plant and equipment 120.7 -0.3 19.5 2.0 -2.9 1.9 136.9 67.6 0.0 15.5 1.4 -0.6 -0.1 81.0 55.9
3. Other equipment, factory and office equipment 121.7 0.4 20.2 6.7 -0.5 4.0 139.1 71.1 0.4 18.1 5.9 -0.3 0.1 83.5 55.6
4. Advances paid and construction in progress 13.6 0.0 4.5 – – -13.4 4.7 0.0 – 0.8 0.0 – – 0.8 3.9
470.2 0.5 50.5 11.5 -3.4 -1.4 504.9 211.2 0.6 42.5 9.6 -0.9 -0.1 243.7 261.2
The following amounts have been capitalized under “Tangible assets” due to finance leases in which KUKA Group acts as the lessee: 0.5 – 0.1 0.0 – – 0.6 0.2 – 0.1 – – – 0.3 0.3
The depreciation figures result from the schedule of changes shown above. No impairment losses had to be recognized in the current year. Impairment losses totaling €0.8 million were applied in the previous year in connection with a welding system.
Government grantsNo or only negligible grants and allowances were deducted from the acquisition or production costs of the tangible assets, as in the previous year.
Government grants totaling €5.0 million (2016: €4.3 million) were received and directly released to income. There were no contingently repayable grants as of the balance sheet date.
9. Financial investments
Financial investments predominantly relate to equity investments where KUKA usually does not hold more than 10% of the voting rights.

Group notes
93
in € millions
Acquisition /manufacturing costs Accumulated depreciation and impairment losses Net carrying amount
Status as of Jan. 1, 2017
Exchange rate differences
Additions Disposals Change due to business
combinations /others
Reclassifica-tions
Status as of Dec. 31, 2017
Status as of Jan. 1, 2017
Exchange rate differences
Additions Disposals Change due to business
combinations /others
Reclassifica-tions
Status as of Dec. 31, 2017
Status as of Dec. 31, 2017
1. Land, similar rights and buildings including buildings on land owned by third parties 224.2 -4.8 3.2 4.6 – 0.3 218.3 78.4 -1.3 8.0 3.3 – 0.0 81.8 136.5
2. Technical plant and equipment 136.9 -3.8 12.9 6.1 0.4 -0.2 140.1 81.0 -2.1 14.8 4.5 0.1 -1.6 87.7 52.4
3. Other equipment, factory and office equipment 139.1 -3.3 18.4 5.9 0.3 3.4 152.0 83.5 -2.2 17.9 5.0 -0.2 1.7 95.7 56.3
4. Advances paid and construction in progress 4.7 -0.1 51.0 0.8 – -4.0 50.8 0.8 – – 0.8 – 0.0 0.0 50.8
504.9 -12.0 85.5 17.4 0.7 -0.5 561.2 243.7 -5.6 40.7 13.6 -0.1 0.1 265.2 296.0
The following amounts have been capitalized under “Tangible assets” due to finance leases in which KUKA Group acts as the lessee: 0.6 – 0.0 – – – 0.6 0.3 – 0.1 – – – 0.4 0.2
Schedule of changes in KUKA Group’s tangible assets 2016
in € millions
Acquisition /manufacturing costs Accumulated depreciation and impairment losses Net carrying amount
Status as of Jan. 1, 2016
Exchange rate differences
Additions Disposals Change due to business
combinations /others
Reclassifica-tions
Status as of Dec. 31, 2016
Status as of Jan. 1, 2016
Exchange rate differences
Additions Disposals Change due to business
combinations /others
Reclassifica-tions
Status as of Dec. 31, 2016
Status as of Dec. 31, 2016
1. Land, similar rights and buildings including buildings on land owned by third parties 214.2 0.4 6.3 2.8 – 6.1 224.2 72.5 0.2 8.1 2.3 – -0.1 78.4 145.8
2. Technical plant and equipment 120.7 -0.3 19.5 2.0 -2.9 1.9 136.9 67.6 0.0 15.5 1.4 -0.6 -0.1 81.0 55.9
3. Other equipment, factory and office equipment 121.7 0.4 20.2 6.7 -0.5 4.0 139.1 71.1 0.4 18.1 5.9 -0.3 0.1 83.5 55.6
4. Advances paid and construction in progress 13.6 0.0 4.5 – – -13.4 4.7 0.0 – 0.8 0.0 – – 0.8 3.9
470.2 0.5 50.5 11.5 -3.4 -1.4 504.9 211.2 0.6 42.5 9.6 -0.9 -0.1 243.7 261.2
The following amounts have been capitalized under “Tangible assets” due to finance leases in which KUKA Group acts as the lessee: 0.5 – 0.1 0.0 – – 0.6 0.2 – 0.1 – – – 0.3 0.3

KUKA Aktiengesellschaft | Annual Report 2017
94
10. Investments accounted for at equity
There were four (December 31, 2016: three) investments accounted for at equity as at December 31, 2017.
Taken individually or jointly, the three investments that already existed in the previous year are of minor significance for KUKA Group. For this reason information in the notes pursuant to IFRS 12.B12 and B13 is omitted for these investments.
The following table provides information on the income and financial situation of Pipeline Health Holdings LLC, Delaware /USA acquired in 2017:
in € millions Dec. 31, 2017
Ownership share 25%
Non-current assets 17.2
Current assets 8.1
(of which, cash and cash equivalents) (5.5)
Non-current liabilities 1.1
(of which, non-current financial liabilities with the excep-tion of trade payables and other liabilities and provisions) (1.1)
Current liabilities 7.9
(of which, current financial liabilities with the exception of trade payables and other liabilities and provisions) (-0.3)
Net assets (100.0%) 16.3
Share of KUKA Group in net assets 4.1
Goodwill 7.7
Carrying amount of the share in Pipeline RX 11.7
in € millions 2017 1
Sales revenues 7.0
Scheduled depreciation and amortization 1.5
Net interest expense 0.0
Tax income 0.5
Loss from total earnings (100.0%) 4.3
Loss from total earnings attributable to the KUKA Group share 1.1
Share of KUKA Group in total earnings 1.1
Dividend received by KUKA Group –
1 as of Group affiliation
The aggregate amount of the shares in the loss of the investments accounted for at equity that has to be disclosed pursuant to IFRS 12.B16 is €2.2 million (2016: €3.6 million). The previous year’s amount includes the pro rata earnings of Barrett Technology, LLC, Newton, Massachusetts /USA, which was sold in the fourth quarter of 2016.
11. Finance leases
KUKA as a lessor
KUKA Toledo Production Operations LLC., Toledo /USA (KTPO)KTPO manufactures Jeep Wrangler bodies under the terms of a pay-on-production contract with Chrysler. The contract is set up as a finance lease with KUKA Group acting as lessor.
Because of the existing agreement to supply car bodies to Chrysler, the acquisition of the production system assets was not included on the balance sheet as an asset acquisition, but instead categorized as a finance lease in accordance with IFRIC 4 /IAS 17 guidelines and booked as a receivable from finance leases. A non-current lease receivable of €41.6 million (2016: €57.7 million) and a current lease receivable of €9.2 million (2016: €9.6 million) exist as at the balance sheet date.
Translogic Corporation, Denver /USAFinance leases for portioning systems for medicines were also taken on in the context of the acquisition of Talyst Systems LLC, Delaware /USA in the 2017 fiscal year. A non-current lease receivable of €1.5 mil-lion and a current lease receivable of €0.6 million exist as at the balance sheet date.
Sales revenues shown on KTPO’s and Translogic’s balance sheet are thus reduced by the fictitious leasing rate. The interest component included in the fictitious leasing rate is booked under interest result, while the repayment component of this payment reduces the receiv-ables as per schedule.
Full payout lease agreements exist for both KTPO and Translogic due to the design of the respective leases. Future minimum lease pay-ments thus correspond to the gross investment. The following table shows the reconciliation to the total present value of the outstanding total minimum lease payments:

Group notes
95
in € millions 2016 2017
Future minimum lease payments /Finance lease gross investments 83.3 62.2
(of which, not later than one year) (15.2) (14.1)
(of which, later than one year and not later than five years) (68.1) (48.1)
Unrealized financial income -16.0 -9.3
Present value of outstanding minimum lease payments 67.3 52.9
(of which, not later than one year) (9.6) (9.8)
(of which, later than one year and not later than five years) (57.7) (43.1)
KUKA as a lesseeThe finance leases for technical plant and equipment have inter-est rates between 1.00% p.a. (2016: 1.42%) and 8.99% p.a. (2016: 8.95%). Future payments due for finance lease agreements as well as the present values for future lease payments (the corresponding amounts are recognized under other liabilities) amount to €0.1 mil-lion. In the previous year, both the minimum lease payments and the present values were €0.2 million.
For information on operating lease agreements please see note 30 “Contingent liabilities and other financial commitments”.
12. Inventories
in € millions Dec. 31, 2016 Dec. 31, 2017
Raw materials and supplies 110.9 162.2
Work in process 120.7 128.1
Finished goods 68.7 69.7
Advances paid 18.5 27.4
Inventories 318.8 387.4
The carrying amount of inventories with adjusted valuation in the amount of €157.3 million compares with €123.9 million in 2016 and has been recognized at net realizable value. Write-downs, relative to the gross value, amounted to €51.3 million, as in the previous year.
13. Trade receivables
As at the balance sheet date, trade receivables amounted to €408.1 mil-lion (2016: €353.2 million) and have a term of less than one year.
The following table breaks down receivables by age and recoverability:
in € millions
Not impaired as of the balance sheet date but in arrears by
Less than 30 days
30 to 60 days
61 to 90 days
91 to 180 days
More than 180 days
Total of past due,
unimpaired receivables
Impaired receivables
before recording of impair-
ment losses
Impair-ment loss
Carrying amount of
impaired receivables
Neither impaired nor past
due as of the balance
sheet date
Net carrying amount
As of Dec. 31, 2016 48.0 22.5 6.2 7.3 15.9 99.9 15.5 -11.9 3.6 249.7 353.2
As of Dec. 31, 2017 79.2 18.3 10.5 7.8 16.4 132.2 15.6 13.2 2.4 273.5 408.1
With respect to existing receivables that were neither impaired nor in arrears, there were no indications known as at the balance sheet date that the obligors would not meet their payment obligations.
Receivables of KUKA Roboter GmbH are regularly sold as part of ABS programs. See note 26 for more details.
Bad debt allowances on trade receivables developed as follows:
in € millions 2016 2017
Impairment losses as of Jan. 1 13.2 11.9
Change in scope of consolidation 0.1 0.2
Additions 4.7 5.8
Consumption and foreign currency effects -0.7 -2.4
Reversals -5.4 -2.3
Impairment losses as of Dec. 31 11.9 13.2

KUKA Aktiengesellschaft | Annual Report 2017
96
The total additions amount to €5.8 million (2016: €4.7 million) and break down into additions for specific bad debt allowances of €3.1 million (2016: €3.8 million) and general bad debt allowances of €2.7 million (2016: €0.9 million).
14. Receivables from construction contracts
For receivables from construction contracts, advances received have been offset against costs incurred in connection with the contract, including contributions to earnings on a per contract basis. This results in the following values as at the balance sheet date:
in € millions 2016 2017
Contract costs and recognized profits 2,814.0 3,315.6
Advances received 2,278.4 2,799.9
Receivables from construction contracts 535.7 515.7
Liabilities from construction contracts 223.7 214.1
Receivables from construction contracts have no specific due date and are not impaired.
15. Other assets, prepaid expenses and deferred charges
in € millions 2016 2017
Non-current other assets
Non-current other receivables 10.6 13.2
Other 5.6 4.3
Total 16.2 17.5
Current other assets
Other claims to fiscal authorities 39.4 37.8
Other 51.5 47.6
Total 90.9 85.4
Other assets, prepaid expenses and deferred charges 107.1 102.9
The claims on revenue authorities shown are predominantly sales tax receivables.
The following table shows the financial instruments recognized under other assets as outlined in IFRS 7 according to age and impairment:
in € millions
Impaired receivables
before recording of impair-
ment losses
Impair-ment loss
Carrying amount of
impaired receivables
Neither impaired nor past
due as of the bal-
ance sheet date
Net carrying amount
As of Dec. 31, 2016 1.8 -1.6 0.2 31.7 31.9
As of Dec. 31, 2017 1.6 -1.5 0.1 26.4 26.5
There are no other assets that are past due but not yet impaired as at December 31, 2017 or December 31, 2016.
€0.1 million (2016: €0.2 million) from the impairment losses on other assets amounting to €1.5 million (2016: €1.6 million) as at Decem-ber 31, 2017 was recognized in the fiscal year.
16. Cash and cash equivalents
Cash and cash equivalents include all cash funds recognized on the balance sheet, i.e. cash on hand, checks and cash balances with financial institutions with a remaining term of three months or less.
KUKA Group maintains bank balances exclusively at financial insti-tutions with an excellent credit rating. Furthermore, funds to be invested are distributed across several financial institutions in order to diversify risk.
Cash and cash equivalents of €0.4 million (2016: €1.1 million) are subject to restrictions. There was still a restriction on the govern-ment-funded contract in Brazil and a restriction on government fund-ing for eligible development projects with a German company in 2017.
in € millions Dec. 31, 2016 Dec. 31, 2017
Cash on hand 0.1 0.1
Cash and bank balances 363.0 223.1
Cash with limited availability 1.1 0.4
Total 364.2 223.6
Notes to the Group balance sheet: Equity and liabilities17. Equity
Changes in equity including changes with no effect on profit or loss are presented in the consolidated statement of changes in equity and in the statement of comprehensive income.
For more information on equity see the notes in the Management Report under “Disclosures in accordance with section 315 para. 4 of the German Commercial Code (HGB) including accompanying expla-nations”.
18. Subscribed capital
The company’s share capital amounts to €103,416,222.00 (Decem-ber 31, 2016: €103,416,222.00) and is subdivided into 39,775,470 no-par-value bearer shares outstanding (December 31, 2016: 39,775,470 shares). Each share carries one vote.
Impact of the conversion of the convertible bond in the first quarter of 2016Convertible bond units with a nominal value of €46.9 million were converted into 1,274,211 shares in the first quarter of 2016 as a result of the termination of the convertible bond as of March 24, 2016.
Through the issue of new shares, the total number of KUKA shares has risen by 1,274,211, from 38,501,259 to 39,775,470 shares.

Group notes
97
The no-par-value bearer shares have a theoretical portion of the share capital amounting to €2.60.
Pursuant to section 200 of the German Stock Corporation Act (AktG), the issue of new shares caused the company’s share capital to rise by €3,312,949 from €100,103,273.40 to €103,416,222.00.
19. Capital reserve
The capital reserve applies to KUKA Aktiengesellschaft.
20. Revenue reserves
The revenue reserves include:
› The accumulated retained earnings of KUKA Aktien-gesellschaft and its consolidated subsidiaries
› Consolidation and exchange rate effects › Actuarial gains and losses included in provisions for pensions
and the associated deferred taxes › Components from the employee share program for KUKA
employees
Deferred taxes totaling €2.4 million (2016: €5.0 million) from trans-actions not recognized in profit or loss are included in equity. These are primarily attributable to actuarial gains and losses from pensions.
Based on the resolution of the Annual General Meeting held in 2016, a dividend of €0.50 per share was distributed in the 2017 fiscal year.
21. Minority interests
The minority interests relate to Swisslog Healthcare Trading MEA LLC, Dubai /United Arab Emirates and Swisslog Middle East LLC, Dubai /United Arab Emirates.
Taking into account the effects of exchange rate variations and pro rata minority earnings, the carrying amount in equity arising from the minority holdings decreased from -€0.3 million to -€0.5 million.
22. Management of capital
The primary goal of managing capital for KUKA Group is to sup-port ongoing business operations by providing adequate financial resources and to increase shareholder value.
This requires sufficient equity (equity ratio), liquidity (net debt /net liquidity), and a sufficient return on capital employed (ROCE). Man-agement and controlling of the business divisions therefore also takes place based on these key indicators.
2016 2017
Equity € millions 840.2 866.6
/Total equity € millions 2,543.9 2,640.1
Equity ratio % 33.0 32.8
EBIT € millions 127.2 102.7
/Capital employed € millions 783.0 950.4
ROCE % 16.2 10.8
Cash and cash equivalents € millions 364.2 223.6
Non-current financial liabilities € millions -249.6 -249.7
Current financial liabilities € millions -1.6 -19.1
Net debt /Net liquidity € millions 113.0 -45.2
23. Pension provisions and similar obligations
Corresponding pension provisions were established for liabilities from vested benefits and from current benefits paid to vested and former employees of KUKA Group as well as their surviving depend-ents. Depending on the legal, economic and tax situation in each of the countries concerned, various retirement benefit systems are in place that are as a rule based on employees’ length of service and compensation.
Company retirement benefit coverage in the Group is provided through both defined contribution and defined benefit plans.
Defined benefit plansDefined benefit plans in KUKA Group primarily concern plans in Germany, the United States, Switzerland, the United Kingdom and Sweden. The country-specific characteristics and legal regulations relating to defined benefit plans are presented in the following.
GermanyObligations in Germany arise from agreements on company pension schemes concluded with various insurance institutions. The prerequi-sites regarding the type and amount of the entitlement depend on the employee’s age and number of years with the company. The benefits include the components old-age pension, disability pension, widow’s pension, death benefits and emergency assistance.
USAThe Systems division makes pension payments to its employees after they retire. Employees who entered the worker’s union before September 14, 2004 are eligible to participate in the pension plan. The benefits are calculated on the basis of the rate applicable on the date they retire. This rate is composed of the years of service credited to the employee. Eligible employees are also provided with medical care. Owing to their benefit character, the obligations for post-em-ployment medical benefits are also disclosed in this item accord-ing to IAS 19. These post-employment benefit provisions represent €0.6 million (2016: €0.7 million) of the total provisions and accruals. The Employee Retirement Income Security Act (ERISA) in the United States provides the legal and regulatory framework for these plans.

KUKA Aktiengesellschaft | Annual Report 2017
98
The defined benefit plan of the Swisslog division exists for both the salaried workforce and the factory workers. Both plans are managed by an insurance company and are legally independent. Both are closed to new participants and are financed entirely by the employer. Swisslog Group is able to determine the distribution of the assets. The plans are designed to avoid the necessity to provision for the expenses of additional benefits. However, each individual savings basket bears a fixed percentage of interest (guaranteed minimum return).
SwitzerlandThe plan is affiliated to a larger collective pension fund which is legally independent and exceeds the statutory minimum requirements in Switzerland (Occupational Old Age, Survivors’ and Invalidity Pension Provision, BVG). All employees in this are insured for the financial con-sequences of age, invalidity and death. Contributions to the collective pension fund are made by the employer and employees. Responsibility for investing the assets is borne by the board of the collective pension fund, whilst Swisslog Group is only able to define the investment style. In addition Swisslog Group sets the interest rate on the indi-vidual age tranches – subject to the statutory rules. In the event of a deficit for the Swisslog pension tranche within the collective pension fund, various measures can be taken such as a reduced interest rate or additional pension contributions. The level of cover pursuant to BVG exceeds 100% as at the balance sheet date, as was the case at the balance sheet date of the previous year. The Swiss pension plan is based on the BVG 2015 generation tables (without risk sharing).
UKThe British defined benefit plan is also independent and has been closed to new participants since 2001. The assets are invested in an insurance fund. The plan is financed by the employer with the employ-ees. Based on the statutory requirements a valuation is undertaken by an actuary every three years. In the event a deficit is calculated, it is necessary to establish a restructuring plan which also sets the future amortization payments to make good the deficit.
SwedenThe Swedish defined benefit plan is legally mandatory and is based on a collective agreement (agreement between the trade union and the Swedish employers). The plan cannot be changed by the company. The plan is available to all employees born before 1979. It covers the financial consequences of age, invalidity and illness. There is a defined contribution plan for those employees born after 1979. The defined benefit plan is financed by the employer. The liability is covered by plan assets in a pension institution administered by an external insur-ance company.
Defined contribution plansFor the defined contribution plans, the company pays contributions to a public or private pension insurance carrier. Upon payment of the contributions, the company has no further obligations. Total pay-ments for pensions under defined contribution plans in the amount of €56.0 million compared to €49.5 million in 2016 are disclosed as expenses for the respective years. Under defined benefit plans, the company incurs an obligation to provide the benefits promised by the plan to current and former employees.
Disclosures on actuarial assumptionsThe amount of pension obligations (defined benefit obligation) was calculated by actuarial methods for which estimates are unavoidable. In addition to assumptions related to life expectancy, this involves assumptions detailed below, which are dependent on the economic environment for each country in question:
Dec. 31, 2017 Germany Switzerland UK Sweden USA Other
Demographic assumptions RT 2005G BVG 2015 GT mod
MA08 /PFA08, using the CMI
2016 projection model with a
long term rate of improvement
of 1.25%
FFFS 2007:31 RP-2006 /MP-2016 Blue
Collar; RP2014 projected MP2017
diverse
Discount factor 1.55% 0.60 – 0.65% 2.50% 2.54% 3.50 – 3.68% 1.55 – 7.60%
Expected rate of return on assets n /a 0.60 – 0.65% 2.50% 2.54% 3.50 – 3.68% 1.55 – 7.60%
Wage dynamics 0.50% 1.0% 2.70% 2.40% n /a 1.00 – 5.0%
Pension dynamics 1.00 – 2.50% 0.0% 3.70% 1.90% n /a 0.00 – 3.0%
Changes in cost of medical services n /a n /a n /a n /a 6.75% n /a

Group notes
99
Dec. 31, 2016 Germany Switzerland UK Sweden USA Other
Demographic assumptions RT 2005G BVG 2010 GT without risk
sharing
PMA08 /PFA08 FFFS 2007:31 RP-2006 /MP-2017 Blue
Collar; RP2014 projected
diverse
Discount factor 1.50% 0.60% 2.60% 2.50% 3.96 – 4.00% 0.75 – 7.60%
Expected rate of return on assets n /a 0.60% 2.60% 2.50% 3.96 – 4.00% 0.75 – 7.60%
Wage dynamics 0.00 – 2.50% 1.00% 3.10% 2.30% n /a 1.00 – 4.40%
Pension dynamics 1.00 – 2.50% 0.00% 3.70% 2.30% n /a 0.00 – 2.50%
Changes in cost of medical services n /a n /a n /a n /a 6.75% n /a
The discount factor is determined based on the returns from high-quality, fixed-rate corporate bonds.
Wage dynamics encompass future increases in wages and salaries that are estimated annually by reference to factors such as inflation and economic conditions, among others.
The expected returns are derived from consensus forecasts for the respective asset classes. The forecasts are based on experience, eco-nomic data, interest forecasts and stock market expectations.
For funded plans, the pension obligations are reduced by an amount equal to the fund assets. If the fund assets exceed the defined benefit obligation, an asset is recognized according to IAS 19 and disclosed under other assets. If the fund assets do not cover the commitment, the net obligation is recognized as a liability under pension provisions.
Increases or decreases in either the present value of the defined benefit obligation or the fair value of the plan assets may give rise to actuarial gains or losses. This may be caused by factors such as changes in actuarial parameters, changes to estimates for the risk profile of the pension obligations and differences between the actual and expected returns on the fund assets.
The sensitivity analysis illustrates the extent to which changes in actuarial assumptions would impact defined benefit obligations rec-ognized as at December 31, 2017:
Sensitivity analysis
Nature and degree of change in actuarial assumptions
in € millions
Present value of the
defined benefit obligation after
change
Change 1
Increase in the discount rate by +0.25% 275.6 -8.6
Decrease in the discount rate by -0.25% 293.7 9.5
Pension increase by +0.25% 290.5 6.3
Pension reduction by -0.25% 280.8 -3.4
Increase in life expectancy by +1 year 294.5 10.3
Decrease in life expectancy by -1 year 274.4 -9.8
Increase in wages and salaries by +0.25% 284.5 0.3
Decrease in wages and salaries by -0.25% 284.1 -0.1
1 The changes in the actuarial assumptions have no linear impact on the calculation of the present value of the defined benefit obligation due to specific effects such as compound interest. Changing multiple assumptions simultaneously does not always correspond to the cumulative effect because there are interdependencies between factors. A new calculation of the defined benefit obligation must be made for each case.

KUKA Aktiengesellschaft | Annual Report 2017
100
Funding status of defined benefit pension obligations
in € millions
Germany Switzerland UK Sweden USA Other Total
2016 2017 2016 2017 2016 2017 2016 2017 2016 2017 2016 2017 2016 2017
Present value of pension benefits covered by provisions 78.3 74.4 – – – – – – – – 8.2 5.7 86.5 80.1
Present value of pension benefits based on plan assets – – 145.0 137.7 21.2 21.5 18.0 16.7 29.5 26.8 1.8 1.4 215.5 204.1
Defined benefit obligation 78.3 74.4 145.0 137.7 21.2 21.5 18.0 16.7 29.5 26.8 10.0 7.1 302.0 284.2
Fair value of plan assets – – 125.4 121.6 13.7 16.0 14.5 14.3 22.7 22.2 3.0 1.2 179.3 175.3
Net obligation as of Dec. 31 78.3 74.4 19.6 16.1 7.5 5.5 3.5 2.4 6.8 4.6 7.0 5.9 122.7 108.9
Reconciliation /Development of the defined benefit obligationThe reconciliation of the obligation for key items from the beginning to the end of the fiscal year breaks down as follows:
in € millions
Germany Switzerland UK Sweden USA Other Total
2016 2017 2016 2017 2016 2017 2016 2017 2016 2017 2016 2017 2016 2017
Jan. 1 75.9 78.3 139.5 145.0 17.0 21.2 16.7 18.0 27.8 29.5 8.1 10.0 285.0 302.0
Change in scope of consolidation and other changes – -0.3 – – – – – – – – 0.8 -0.6 0.8 -0.9
Current service costs 0.8 0.5 4.3 3.5 0.2 0.2 0.3 0.4 – – 0.4 0.5 6.0 5.1
Interest expense (+)/interest income (–) 1.6 1.1 1.0 0.8 0.6 0.5 0.5 0.4 1.1 1.2 0.2 0.2 5.0 4.2
Actuarial gains (–)/losses (+) 5.3 -0.4 -1.3 5.0 6.1 0.5 1.4 -1.3 0.9 1.0 0.8 -2.6 13.2 2.2
Past service cost – – – -3.6 – – – – – – – – – -3.6
Plan curtailments and modifications – – 0.1 – – – – – – – – – 0.1 –
Payments made -5.3 -4.8 0.1 -1.1 -0.1 -0.1 -0.3 -0.3 -1.3 -1.1 -0.2 -0.3 -7.1 -7.7
Currency translation – – 1.3 -11.9 -2.6 -0.8 -0.6 -0.5 1.0 -3.8 -0.1 -0.1 -1.0 -17.1
Dec. 31 78.3 74.4 145.0 137.7 21.2 21.5 18.0 16.7 29.5 26.8 10.0 7.1 302.0 284.2
(of which, funded by provisions) (78.3) (74.4) (–) (–) (–) (–) (–) (–) (–) (–) (8.2) (5.7) (86.5) (80.1)
(of which, based on plan assets) (–) (–) (145.0) (137.7) (21.2) (21.5) (18.0) (16.7) (29,5) (26.8) (1.8) (1.4) (215.5) (204.1)
Current service costs and interest expenses totaling €9.2 million (2016: €11.0 million) compare to benefit payments of €7.7 million during the financial year (2016: €7.1 million).
While significant exchange rate effects, especially in the case of the Swiss franc and US dollar, resulted in a decrease of €17.1 million in the defined benefit obligation in the 2017 fiscal year, there had been only a slight reduction in the defined benefit obligation from currency conversion in the previous year.
Reconciliation /Development of plan assetsThe reconciliation of plan assets and asset classes at the close of the fiscal year breaks down as follows:
in € millions 2016 2017
Jan. 1 171.0 179.3
Interest expense (–)/interest income (+) 2.8 2.3
Change in scope of consolidation and other changes -0.1 –
Actuarial gains (+)/losses (–) 2.2 4.7
Employer contributions 9.4 8.4
Payments -5.3 -5.4
Currency translation -0.7 -14.0
Fair value of plan assets as of Dec. 31 179.3 175.3
Cash and cash equivalents 4.0 3.6
Shares 49.0 50.9
Bonds 88.2 86.6
Real estate 19.8 20.5
Other 18.3 13.7
Total 179.3 175.3

Group notes
101
Investment and risk strategyThe allocation of plan assets to the various asset classes is deter-mined taking potential returns and risks into account. Ratings and forecasts are used as the basis for selecting high-quality stocks and bonds. An optimal portfolio is achieved by ensuring a good balance of risky and risk-free investments. A corresponding committee has been set up for this to monitor the results at least once every half-year and to make changes if necessary to the composition of the plan assets. The company has identified the deterioration of the funded status due to the unfavorable development of plan assets and /or defined benefit obligations as a risk. KUKA monitors its financial assets and defined benefit obligations to identify this risk. In the case of the Swisslog Group pension plans the plan assets are managed by an independent entity as a rule. It provides a regular report so that by this means risk management is possible.
Maturity profile of defined benefit obligationsThe following table provides an overview of the expected benefit payments over the next ten years:
in € millions 2016 2017
Not later than one year 13.5 13.2
Later than one year and not later than five years 47.2 48.7
Later than five years and not later than ten years 60.9 59.6
Funding status of defined benefit pension obligations
in € millions
Germany Switzerland UK Sweden USA Other Total
2016 2017 2016 2017 2016 2017 2016 2017 2016 2017 2016 2017 2016 2017
Present value of pension benefits covered by provisions 78.3 74.4 – – – – – – – – 8.2 5.7 86.5 80.1
Present value of pension benefits based on plan assets – – 145.0 137.7 21.2 21.5 18.0 16.7 29.5 26.8 1.8 1.4 215.5 204.1
Defined benefit obligation 78.3 74.4 145.0 137.7 21.2 21.5 18.0 16.7 29.5 26.8 10.0 7.1 302.0 284.2
Fair value of plan assets – – 125.4 121.6 13.7 16.0 14.5 14.3 22.7 22.2 3.0 1.2 179.3 175.3
Net obligation as of Dec. 31 78.3 74.4 19.6 16.1 7.5 5.5 3.5 2.4 6.8 4.6 7.0 5.9 122.7 108.9
in € millions
Germany Switzerland UK Sweden USA Other Total
2016 2017 2016 2017 2016 2017 2016 2017 2016 2017 2016 2017 2016 2017
Jan. 1 75.9 78.3 139.5 145.0 17.0 21.2 16.7 18.0 27.8 29.5 8.1 10.0 285.0 302.0
Change in scope of consolidation and other changes – -0.3 – – – – – – – – 0.8 -0.6 0.8 -0.9
Current service costs 0.8 0.5 4.3 3.5 0.2 0.2 0.3 0.4 – – 0.4 0.5 6.0 5.1
Interest expense (+)/interest income (–) 1.6 1.1 1.0 0.8 0.6 0.5 0.5 0.4 1.1 1.2 0.2 0.2 5.0 4.2
Actuarial gains (–)/losses (+) 5.3 -0.4 -1.3 5.0 6.1 0.5 1.4 -1.3 0.9 1.0 0.8 -2.6 13.2 2.2
Past service cost – – – -3.6 – – – – – – – – – -3.6
Plan curtailments and modifications – – 0.1 – – – – – – – – – 0.1 –
Payments made -5.3 -4.8 0.1 -1.1 -0.1 -0.1 -0.3 -0.3 -1.3 -1.1 -0.2 -0.3 -7.1 -7.7
Currency translation – – 1.3 -11.9 -2.6 -0.8 -0.6 -0.5 1.0 -3.8 -0.1 -0.1 -1.0 -17.1
Dec. 31 78.3 74.4 145.0 137.7 21.2 21.5 18.0 16.7 29.5 26.8 10.0 7.1 302.0 284.2
(of which, funded by provisions) (78.3) (74.4) (–) (–) (–) (–) (–) (–) (–) (–) (8.2) (5.7) (86.5) (80.1)
(of which, based on plan assets) (–) (–) (145.0) (137.7) (21.2) (21.5) (18.0) (16.7) (29,5) (26.8) (1.8) (1.4) (215.5) (204.1)

KUKA Aktiengesellschaft | Annual Report 2017
102
24. Other provisions
in € millions
Status as of Jan. 1, 2017
Exchange rate differences
Other changes and change in scope of
consolidation
Consumption Reversals Additions Status as of Dec. 31, 2017
Warranty commitments and risks from pending transactions 55.2 -1.0 -0.8 28.3 5.1 33.8 51.8
Provisions for restructuring obligations – – – – – 15.9 15.9
Miscellaneous provisions 104.7 -4.2 -2.2 50.3 11.7 28.5 64.8
Total 157.9 -5.2 -3.0 78.6 16.8 78.2 132.5
The provisions for warranty commitments and risks from pending transactions include provisions for impending losses of €3.8 mil-lion (2016: €4.0 million) and warranty risks of €48.0 million (2016: €49.2 million).
Provisions for restructuring obligations totaling €15.0 million were established in connection with measures for increasing the profita-bility of KUKA Systems GmbH, Augsburg. These measures include a reduction of around 250 employees through early retirement schemes and pre-retirement plans, severance pay, internal changes and normal staff turnover by 2019. The remaining amount of the restructuring provision mainly relates to the closure of the Swisslog Robogistics business unit in Ettlingen and its relocation to Dortmund.
Of the miscellaneous provisions, €27.1 million (2016: €29.4 million) relates among other items to costs still to be incurred for orders already invoiced and litigation risks of €2.3 million (2016: €3.8 million).
The expected remaining term of the other provisions is up to one year.
25. Liabilities
in € millions
Remaining maturity Dec. 31, 2017 Total
Up to one year
More than one year
Liabilities due to banks 19.1 249.7 268.8
Financial liabilities 19.1 249.7 268.8
Trade payables 549.2 – 549.2
Advances received 94.0 – 94.0
Liabilities from construc-tion contracts 214.1 – 214.1
Accounts payable to affilited companies 0.1 – 0.1
Income tax liabilities 51.2 – 51.2
Other liabilities and deferred income 297.7 29.5 327.2
(of which, for other taxes) (58.7) – (58.7)
(of which, for social security payments) (10.7) – (10.7)
(of which, liabilities relating to personnel) (155.0) (11.7) (166.7)
(of which, for leases) (0.1) (0.0) (0.1)
(of which, for forward exchange transactions for currency hedging) (6.1) – (6.1)
Total 1,225.4 279.2 1,504.6

Group notes
103
in € millions
Remaining maturity Dec. 31, 2016 Total
Up to one year
More than one year
Liabilities due to banks 1.6 249.6 251.2
Financial liabilities 1.6 249.6 251,2
Trade payables 459.3 – 459.3
Advances received 95.6 – 95.6
Liabilities from construc-tion contracts 223.7 – 223.7
Accounts payable to affiliated companies – – –
Income tax liabilities 40.0 – 40.0
Other liabilities and deferred income 280.0 28.0 308.0
(of which, for other taxes) (62.4) (–) (62.4)
(of which, for social security payments) (11.3) (–) (11.3)
(of which, liabilities relating to personnel) (142.1) (12.0) (154.1)
(of which, for leases) (0.1) (0.1) (0.2)
(of which, for forward exchange transactions for currency hedging) (13.0) (–) (13.0)
Total 1,100.2 277.6 1,377.8
26. Financial liabilities /Financing
The existing financial liabilities are mainly the promissory note loan issued in October 2015.
Fixed interest rate agreements /Promissory note loan
in € millions
Face value as of balance sheet date
Nominal interest rate
Original maturity
Net carrying amount
Dec. 31, 2016 Dec. 31, 2017 2016 2017
Promissory note loan
Tranche 1142.5 142.5
1.15% p. a. (MS +80bps) 2015 – 2020 142.1 142.6
Tranche 2107.5 107.5
1.61% p. a. (MS +100bps) 2015 – 2022 107.1 107.1
Total promissory note loan 250.0 250.0 ø 1.35% p. a. 5 /7 years 249.2 249.7
Variable interest rate liabilities to banks
in € millions
Net carrying amount Avg. nomi-nal interest
rate
Year of latest
maturity
Liabilities due to banks as of Dec. 31, 2017 18.3 € 18.3 € 1.20% p. a. 2018
Liabilities due to banks as of Dec. 31, 2016 0.7 € 0.7 € 1.91% p. a. 2017
The nominal interest rates correspond to those interest rates which were payable on outstanding amounts at year-end in the respective currency.

KUKA Aktiengesellschaft | Annual Report 2017
104
Promissory note loanKUKA AG issued an unsecured promissory note loan with a total vol-ume of €250.0 million on October 9, 2015. After deducting the trans-action costs, KUKA received a total of €248.9 million from this issue.
The total volume was placed in two separate tranches. Tranche 1 has a volume of €142.5 million with an original term to maturity of five years; tranche 2 has a volume of €107.5 million and an original term to maturity of seven years. The issue price was 100.0% with a denom-ination per unit of €0.5 million. Repayment shall occur at 100.0%, payable in one sum on maturity of each fixed-term tranche. The prom-issory note loan carries interest coupons of 1.15% for tranche 1 and 1.61% for tranche 2. Interest payments are made at yearly intervals on October 9. Interest of €0.8 million (2016: €0.8 million) was accrued as of the balance sheet date.
The promissory note loans contain a change-of-control clause that entitles the promissory note investors to request repayment of the investment on the next interest payment date after a change of con-trol. The closing of the takeover bid by Midea was a change of control pursuant to the promissory note document. The shares announced as part of the change of control have now been taken by other investors, so there were no repayments.
On initial recognition, the promissory note loan was carried on the balance sheet at fair value less transaction costs of €1.1 million. The difference between the amount paid out (less transaction costs) and the repayment amount is recognized in the interest result for the term of each tranche using the effective interest method. Taking account of the transaction costs, the effective interest rate rises to 1.24% for tranche 1 and 1.67% for tranche 2.
The carrying amount stands at €249.7 million as of December 31, 2017 (2016: €249.2 million).
Syndicated loan for KUKA AktiengesellschaftIn a refinancing transaction, a syndicated loan agreement (SFA – Syn-dicated Facilities Agreement) came into force in April 2015 with a total volume of €230 million an original term until March 30, 2020. After an amendment in November 2016, lines for €400 million were available to KUKA from this agreement. The guarantee facility increased from €140 million to €200 million and the working capital line permitting cash and guarantee utilization rose from €90 million also to €200 million. After drawing the two extension options with the approval of the banks, the term was extended until March 2022.
As at the balance sheet date the utilization of the guarantee facility and cash credit line from the syndicated loan agreement of KUKA AG amounted to a total of €182.1 million (2016: €170.9 million).
After the end of the financial year, KUKA AG concluded a new syndicated loan agreement on February 1, 2018 with a volume of €520.0 million and in doing so replaced and refinanced the exist-ing credit facility of €400.0 million. The new agreement includes a surety and guarantee line (guaranteed credit line) in the amount of €260.0 million and a working capital line (cash line), which can also be used for sureties and guarantees, likewise in the amount of €260.0 million.
The term of the new loan agreement is five years with two one-year extension options additionally agreed. This gave the Group consid-erably extended leeway for financing further growth until 2025. The syndicated loan agreement remains unsecured as before and contains only the customary equal treatment clauses and negative pledges. Unchanged financial covenants were agreed with thresholds for lever-age (net financial liabilities /EBITDA) and interest coverage (EBITDA /net interest expense).
Guarantee facility lines from banks and surety companiesThe guarantee facility lines pledged by banks and surety companies outside the syndicated loan agreement total €118.0 million (2016: €124.0 million) as at December 31, 2017, and can be utilized up to a total volume of €100.0 million in accordance with the provisions of the SFA. The limit for utilizing bilateral guarantee facility lines was raised to €150.0 million in the new syndicated loan agreement. At the end of the reporting year, the company had utilized €73.6 million ver-sus €87.2 million in 2016. None of these bilaterally agreed guarantee facility lines contains a change-of-control clause.
Asset-backed securities programKUKA Group had launched an ABS (asset-backed securities) program in June 2011 with a financing volume of €25.0 million and maturing on June 30, 2018. Under this program, trade receivables of KUKA Roboter GmbH can be sold in regular tranches to a special purpose vehicle (SPV) of Landesbank Baden-Württemberg. Receivables of €22.1 million were sold as at the balance sheet date. The SPV finances the purchase of the receivables by issuing securities on the capital market or through utilization of a corresponding credit line. Cove-nants for gearing and leverage are in place for this financing program.
Default guarantees from credit insurers ensure adequate creditwor-thiness of the receivables sold. KUKA Roboter GmbH assumes the first 1.15% of credit risk from the sale of receivables. The retention for this credit risk (continuing involvement) amounted to €0.3 million as at December 31, 2017 (2016: €0.3 million) and was fully written off. KUKA Roboter GmbH manages and processes the receivables that are sold. As in the previous year, no claims to be recognized in the income statement resulted from this.
The existing ABS program also contains a change-of-control clause. The receivables purchaser did not make use of his right of termination resulting from the change of control.

Group notes
105
Financial instruments measured at fair valueThe following table shows the breakdown of the financial assets and liabilities measured at fair value:
2017in € millions
Level 1 1 Level 2 1 Level 3 1 Total
Financial assets – 8.0 3.2 11.2
Financial liabilities – 6.1 – 6.1
2016in € millions
Level 1 1 Level 2 1 Level 3 1 Total
Financial assets – 9.6 3.0 12.6
Financial liabilities – 13.0 – 13.0
1 With regard to the meaning of the individual levels, please refer to the assumptions and estimates /calculation of the fair values.
There were no level 1 financial assets in the current fiscal year or the previous year. The assets in level 2 mainly relate to forward exchange transactions carried as assets or liabilities. The rise mainly results from the increased hedging volumes in the Group and substantial fluctuations in the exchange rates of significant currencies such as USD, JPY or CNY. The value is determined with the aid of standard financial mathematical techniques, using current market parameters such as exchange rates and counterparty credit ratings (mark-to-mar-ket method) or quoted prices. Middle rates are used for this calcula-tion. The financial assets of level 3 include units in investments not traded on the market and are measured using the discounted future cash flows from the sale of a minority interest.
All other financial instruments are reported at amortized cost and mainly correspond to the carrying amounts.
27. Other current /non-current liabilities and prepaid expenses /deferred charges
The other liabilities for other taxes are primarily from sales, wage and church tax.
Other liabilities in the personnel area are mostly related to obligations from vacation entitlements (2017: €23.4 million; 2016: €23.6 million), flex-time credits (2017: €22.6 million; 2016: €20.6 million), variable compensation elements (2017: €78.8 million; 2016: €72.9 million) and pre-retirement (“Altersteilzeit”) (2017: €11.4 million; 2016: €10.3 mil-lion). Pre-retirement obligations were reduced by the fair value of the corresponding fund assets (2017: €10.5 million; 2016: €8.7 million). The present value of entitlements from pre-retirement obligations (DBO) before offsetting was €21.9 million (2016: €19.0 million). Also reported under this item are, among other things, special payments, inventor’s compensation, long-service awards and trade association fees.
Liabilities arising from finance leases are recognized at the present value of future lease payments and disclosed as other liabilities.
28. Assets and liabilities held for sale
As at December 31, 2017, there were no plans to divest business units or sub-units, meaning that there are no circumstances to report as defined in IFRS 5.
29. Financial risk management and financial derivatives
a) Principles of risk managementAs part of its general business activities, KUKA Group is exposed to various financial risks, in particular from movements in exchange rates and interest rates as well as counterparty risk and liquidity risk. The purpose of financial risk management is to identify, assess and manage these risks. The aim is to limit the potential negative impact on the financial position.
Derivatives may be a part of financial risk management depending on the risk assessment. Derivatives are exclusively used as hedging instruments with reference to an underlying transaction and are thus not held for trading or other speculative purposes. To reduce the credit risk, hedging transactions are only concluded with financial institutions with an excellent credit rating.
The fundamentals of the Group’s financial policy are established by the Executive Board and implemented by Group Treasury in close cooperation with Group companies. Certain transactions require the approval of the CFO. The CFO is also informed on a regular basis of the current risk positions and safeguards.
b) Currency riskRisks arising from fluctuations in exchange rates that may affect the Group’s cash flow – for example from investments, financing and already fixed or planned incoming and outgoing operational payments in foreign currencies – are hedged as they arise or become known through the use of derivative financial instruments with banks or by offsetting opposing cash flows. Hedging may also cover future planned transactions such as planned purchases in foreign currencies, where hedging is used to cover exchange rate fluctuations congru-ent with the respective maturities and amounts. Group Treasury is principally responsible for the conclusion of hedging transactions with banks.
Exchange rate risks that do not influence the Group’s cash flows, e.g. risks resulting from translation of balance sheet and income statement items of foreign KUKA companies into the Group currency (translation risks), are generally not hedged.
All intra-Group loans denominated in foreign currencies were hedged accordingly. KUKA was not exposed to any significant exchange rate risk in the area of financing at the reporting date on account of these hedging activities.
The individual KUKA companies handle their operating activities mainly in the relevant functional currency. However, some KUKA com-panies are exposed to corresponding exchange rate risk in connection with planned payments outside their own functional currencies. Such risks are hedged according to the policy outlined above. KUKA was not exposed to any significant exchange rate risks from its operating activities at the reporting date on account of these hedging activities.

KUKA Aktiengesellschaft | Annual Report 2017
106
Currency risk as defined by IFRS 7 arises on account of financial instru-ments that are denominated in a currency other than the functional currency and are of a monetary nature. Differences resulting from the translation of financial statements into the Group’s presentation currency are not taken into consideration. Relevant risk variables are generally all non-functional currencies in which KUKA has financial instruments.
For the presentation of market risks, IFRS 7 requires sensitivity anal-yses that show the effects of hypothetical changes of relevant risk variables (e.g. interest rates, exchange rates) on profit or loss and shareholders’ equity. The periodic effects are determined by relat-ing the hypothetical changes in the risk variables to the balance of financial instruments at the reporting date. It is assumed that the balance at the reporting date is representative for the year as a whole.
Currency sensitivity analyses are based on the following assumptions:
› Major non-derivative monetary financial instruments (liquid assets, receivables, liabilities) are either directly denominated in the functional currency or are transferred as far as possible into the functional currency through the use of derivatives.
› Major interest income and interest expense from financial instruments are also either recorded directly in the functional currency or transferred into the functional currency by using derivatives. For this reason, there can be no material effect on the variables considered in this connection.
The most important currency pairs for KUKA are considered when cal-culating currency sensitivities. This involves applying a hypothetical upward or downward revaluation of the national currency concerned against the relevant foreign currency.
in € millions Dec. 31, 2016 Dec. 31, 2017
National currency: EUR
EUR /USD
EUR +10% 6.0 3.9
EUR -10% -7.4 -4.7
EUR /JPY
EUR +10% 0.2 -2.8
EUR -10% -0.3 3.4
EUR /CNY
EUR +10% 0.1 0.7
EUR -10% -0.1 -0.8
EUR /HUF
EUR +10% -0.8 -1.0
EUR -10% 0.9 1.2
EUR /BRL
EUR +10% -2.1 -0.4
EUR -10% 2.6 0.5
EUR /CHF
EUR +10% -1.1 -1.6
EUR -10% 1.4 2.0
EUR /SEK
EUR +10% 0.6 -0.5
EUR -10% -0.7 0.6
in € millions Dec. 31, 2016 Dec. 31, 2017
EUR /TWD
EUR +10% – -0.3
EUR -10% – 0.4
EUR /THB
EUR +10% – -0.3
EUR -10% – 0.3
EUR /NOK
EUR +10% -0.1 -0.3
EUR -10% 0.2 0.4
National currency: CNY
CNY /USD
CNY +10% 0.9 0.7
CNY -10% -1.1 -0.8
CNY /EUR
CNY +10% -0.4 1.2
CNY -10% 0.5 -1.5
CNY /JPY
CNY +10% -0.5 -0.7
CNY -10% 0.6 0.9
National currency: CHF
CHF /SEK
CHF +10% -0.5 -1.0
CHF -10% 0.6 1.2
CHF /USD
CHF +10% -8.3 -8.5
CHF -10% 10.1 10.3
CHF /EUR
CHF +10% -6.8 -8.3
CHF -10% 8.3 10.2
National currency: USD
USD /SEK
USD +10% -0.7 -0.8
USD -10% 0.9 1.0
USD /EUR
USD +10% -1.1 -0.2
USD -10% 1.3 0.3
Assumptions concerning the future cannot be derived from this pres-entation of currency effects.

Group notes
107
c) Interest rate riskRisks from interest rate changes at KUKA are essentially the result of short-term investments /borrowings. These are not hedged at the reporting date.
Interest rate risk is presented by way of sensitivity analyses in accord-ance with IFRS 7. These show the effects of changes in market inter-est rates on interest payments, interest income and expense, other income components and shareholders’ equity. Interest rate sensitivity analyses are based on the following assumptions:
› Changes in the market interest rates of non-derivative financial instruments with fixed interest rates only affect income if these are measured at their fair value. As such, all financial instru-ments with fixed interest rates that are carried at amortized cost (e.g. the issued convertible bond and promissory note loan) are not subject to interest rate risk as defined in IFRS 7.
› Changes in market interest rates affect the interest income or expense of non-derivative variable-interest financial instru-ments, the interest payments of which are not designated as hedged items of cash flow hedges against interest rate risks.
An increase in market interest rates by 100 basis points at Decem-ber 31, 2017 would have a positive effect on results of €2.1 million (2016: €3.6 million positive). A decrease in market interest rates by 100 basis points would have a negative effect on results of -€1.2 mil-lion (2016: €2.0 million negative). The assumption was made for financial investments at the balance sheet date that the lower limit amounts to -50 basis points. This hypothetical effect results solely from the financial investments and borrowings with variable interest rates totaling €223.6 million (financial investments) and €18.3 mil-lion (borrowings) at the balance sheet date (2016: €363.1 million and €0.7 million respectively).
d) Credit riskKUKA Group is exposed to credit risk from its operating activities and certain financing activities. A default can occur if individual business partners do not meet their contractual obligations and KUKA Group thus suffers a financial loss. With regard to financing activities, important transactions are only concluded with counterparties that have at least an investment grade credit rating.
At the level of operations, the outstanding debts are continuously monitored in each area locally. There are regular business relations with major customers at multiple KUKA Group companies. The associated credit risks are subject to separate quarterly credit rating monitoring as part of the risk management system at the Group’s Executive Board level for early detection of an accumulation of indi-vidual risks. Added to these measures are comprehensive routine checks implemented at segment level as early as the order initiation process (submission of offers and acceptance of orders) to verify the credit rating of potential business partners. Credit risk is accounted for accordingly through individual impairments.
The maximum exposure to credit risk is represented by the carrying amounts of the financial assets that are carried in the balance sheet (including derivatives with positive market values). No agreements reducing the maximum exposure to credit risk had been concluded as of the reporting date.
e) Liquidity riskOne of KUKA AG’s primary tasks is to coordinate and control the Group’s financing requirements and to ensure the financial independ-ence of KUKA and its ability to pay on time. With this goal in mind, KUKA Group optimizes the Group’s financing and limits its financial risks. The standardized, Group-wide treasury reporting system imple-mented in 2007 is enhanced on a regular basis for this purpose. New companies are included in consolidation concurrently. In addition, the Group’s overall liquidity risk is reduced by closely monitoring Group companies and their control of payment flows.
As a first step to ensure the payment capability at all times and the financial flexibility of KUKA Group, a liquidity reserve is kept by KUKA Aktiengesellschaft in the form of credit lines and cash funds. For this purpose, KUKA has placed a promissory note loan, signed a syndicated facilities agreement with a consortium of banks and arranged for surety companies and banks to commit guarantee facility lines. The funding and guarantee requirements for business operations are ensured to a large extent internally by transferring cash funds (intercompany loans) and providing guarantees from the banks and the Group itself. This ensures that Group-wide liquidity management takes place at the individual company level, thereby further optimizing the Group’s financing on the whole.
The following figures show the commitments for undiscounted interest and redemption repayments for the financial instruments subsumed under IFRS 7:
Dec. 31, 2017in € millions
Cash flows 2018
Cash flows 2019
Cash flows 2020 – 2022
Cash flows 2023 et seq.
Non-current financial liabilities 3.9 3.9 151.0 109.2
Current financial liabilities 18.3 – – –
Trade payables 549.2 – – –
Accounts payable to affiliated companies 0.1 – – –
Other non-current lia-bilities and provisions – 0.1 0.1 –
(of which, for leases) (–) (0.1) (0.1) (–)
Other current liabilities and provisions 115.0 – – –
(of which, for leases) (0.2) (–) (–) (–)

KUKA Aktiengesellschaft | Annual Report 2017
108
Dec. 31, 2016in € millions
Cash flows 2017
Cash flows 2018
Cash flows 2019 – 2021
Cash flows 2022 et seq.
Non-current financial liabilities 3.4 3.4 151.0 109.2
Current financial liabilities 1.4 – – –
Trade payables 459.3 – – –
Accounts payable to affiliated companies – – – –
Other non-current lia-bilities and provisions – 0.1 0.1 –
(of which, for leases) (–) (0.1) (0.1) (–)
Other current liabilities and provisions 105.3 – – –
(of which, for leases) (0.1) (–) (–) (–)
All financial instruments are included which were held at the balance sheet dates and for which payments have already been contractually agreed. Foreign currency amounts are expressed at the spot rate on the key date. The variable interest payments from the financial instru-ments were determined on the basis of the interest rates last fixed prior to December 31, 2017. Financial liabilities repayable at any time are always allocated to the earliest period.
f) HedgesHedges are used by KUKA Group exclusively in the form of forward exchange transactions to secure existing balance sheet items as well as to hedge future payment flows. These are exclusively for the pur-pose of hedging currency risk.
Other disclosures on financial instrumentsThe following shows the carrying amounts of the financial instru-ments by measurement category according to IAS 39:
Abbreviation Dec. 31, 2016 Dec. 31, 2017
Available-for-Sale Finan-cial Assets AfS 3.1 3.3
Held-to-Maturity HtM 0.0 0.0
Loans and Receivables LaR 1,277.3 1,167.8
Financial Assets Held for Trading FAHfT 9.6 8.0
Total financial instruments (assets) 1,290.0 1,179.1
Financial Liabilities Measured at Amortized Cost FLAC 805.8 927.0
Financial Liabilities Held for Trading FLHfT 13.0 6.1
Total financial instruments (liabilities) 818.8 933.1

Group notes
109
Carrying amounts and fair values by measurement categories for 2017The carrying amounts and the fair values are derived from the fol-lowing table:
Assets
in € millions
IAS 39 measure-ment category
Net carrying amount /Status
as of Dec. 31, 2017
of which, other assets and
liabilities not covered by
IFRS 7
of which, other assets and lia-
bilities covered by IAS 17
Net carrying amount of
financial instru-ments /Status as of Dec. 31,
2017
Fair value /Status as of
Dec. 31, 2017
Financial investments 5.1 – – 5.1 5.1
(of which, loans) LaR (1.8) (–) (–) (1.8) (1.8)
(of which, participations) AfS (3.3) (–) (–) (3.3) (3.3)
(of which, participations at cost) LaR (0.0) (–) (–) (0.0) (0.0)
Investments accounted for by the equity method n.a. 15.7 15.7 – – –
Long-term finance lease receivables n.a. 43.1 – 43.1 – -15.6
Other long-term receivables and other assets 17.6 13.9 – 3.7 3.7
(of which, derivatives without a hedging relationship) FAHfT (0.6) (–) (–) (0.6) (0.6)
(of which, from the category LaR) LaR (3.1) (–) (–) (3.1) (3.1)
(of which, other) n.a. (13.9) (13.9) (–) (–) (–)
Trade receivables LaR 408.1 – – 408.1 408.1
Receivables from construction contracts LaR 515.7 – – 515.7 515.7
Current finance lease receivables n.a. 9.8 – 9.8 – –
Other assets, prepaid expenses and deferred charges 85.4 62.5 – 22.9 22.9
(of which, derivatives without a hedging relationship) FAHfT (7.4) (–) (–) (7.4) (7.4)
(of which, other from the category LaR) LaR (15.5) (–) (–) (15.5) (15.5)
(of which, other from the category HtM) HtM (0.0) (–) (–) (0.0) (0.0)
(of which, other) n.a. (62.5) (62.5) (–) (–) (–)
Cash and cash equivalents LaR 223.6 – – 223.6 223.6
Total financial instruments (assets) 1,179.1 1,179.1

KUKA Aktiengesellschaft | Annual Report 2017
110
Liabilities
in € millions
IAS 39 measure-ment category
Net carrying amount /Status
as of Dec. 31, 2017
of which, other assets and
liabilities not covered by
IFRS 7
of which, other assets and lia-
bilities covered by IAS 17
Net carrying amount of
financial instru-ments /Status as of Dec. 31,
2017
Fair value /Status as of
Dec. 31, 2017
Non-current financial liabilities FLAC 249.7 – – 249.7 249.7
Other non-current liabilities and provisions 29.5 29.5 – – –
(of which, for leases) n.a. (0.0) (–) (–) (–) (–)
(of which, other) n.a. (29.5) (29.5) (–) (–) (–)
Current financial liabilities FLAC 19.1 – – 19.1 19.1
Trade payables FLAC 549.2 – – 549.2 549.2
Liabilities from construction contracts n.a. 214.1 (214.1) – – –
Accounts payable to affiliated companies FLAC 0.0 – – 0.0 0.0
Other current liabilities, prepaid expenses and deferred charges 297.7 182.5 0.1 115.1 115.1
(of which, for leases) n.a. (0.1) (–) (0.1) (–) (–)
(of which, derivatives without a hedging relationship) FLHfT (6.1) (–) (–) (6.1) (6.1)
(of which, other from the category FLAC) FLAC (109.0) (–) (–) (109.0) (109.0)
(of which, other) n.a. (182.5) (182.5) (–) (–) (–)
Total financial instruments (liabilities) 933.1 933.1
Carrying amounts and fair values by measurement categories for 2016 Assets
in € millions
IAS 39 measure-ment category
Net carrying amount /Status
as of Dec. 31, 2016
of which, other assets and
liabilities not covered by
IFRS 7
of which, other assets and lia-
bilities covered by IAS 17
Net carrying amount of
financial instru-ments /Status as of Dec. 31,
2016
Fair value /Status as of
Dec. 31, 2016
Financial investments 4.9 – – 4.9 4.9
(of which, loans) LaR (1.8) (–) (–) (1.8) (1.8)
(of which, participations) AfS (3.1) (–) (–) (3.1) (3.1)
(of which, participations at cost) LaR (–) (–) (–) (–) (–)
Investments accounted for by the equity method n.a. 4.2 4.2 – – –
Long-term finance lease receivables n.a. 57.7 – 57.7 – –
Other long-term receivables and other assets 16.2 11.5 – 4.7 4.7
(of which, derivatives without a hedging relationship) FAHfT (0.7) (–) (–) (0.7) (0.7)
(of which, trade receivables) LaR (–) (–) (–) (–) (–)
(of which, from the category LaR) LaR (4.0) (–) (–) (4.0) (4.0)
(of which, other) n.a. (11.5) (11.5) (–) (–) (–)
Trade receivables LaR 353.2 – – 353.2 353.2
Receivables from construction contracts LaR 535.7 – – 535.7 535.7
Current finance lease receivables n.a. 9.6 – 9.6 – –
Other assets, prepaid expenses and deferred charges 90.9 51.7 0.0 39.2 39.2
(of which, derivatives without a hedging relationship) FAHfT (8.9) (–) (–) (8.9) (8.9)
(of which, derivatives with a hedging relationship) FAHfT (0.0) (–) (–) (0.0) (0.0)
(of which, other from the category LaR) LaR (18.4) (–) (–) (18.4) (18.4)
(of which, other from the category HtM) HtM (0.0) (–) (–) (0.0) (0.0)
(of which, other) n.a. (63.6) (-51.7) (–) (11.9) (11.9)
Cash and cash equivalents LaR 364.2 – – 364.2 364.2
Total financial instruments (assets) 1,301.9 1,301.9
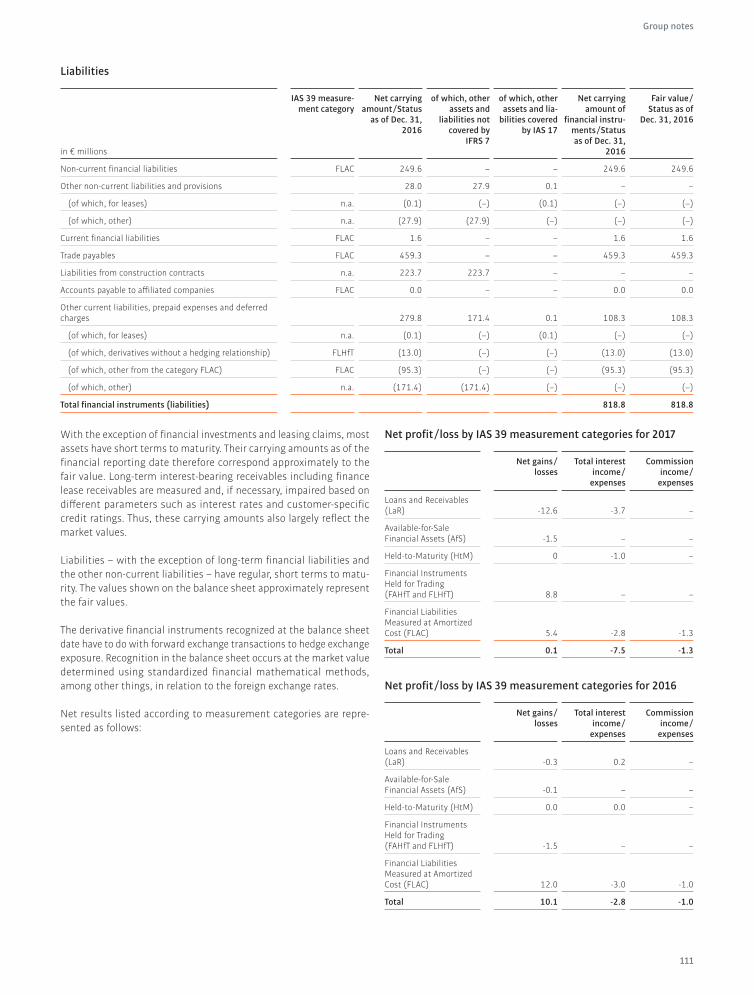
Group notes
111
Liabilities
in € millions
IAS 39 measure-ment category
Net carrying amount /Status
as of Dec. 31, 2016
of which, other assets and
liabilities not covered by
IFRS 7
of which, other assets and lia-
bilities covered by IAS 17
Net carrying amount of
financial instru-ments /Status as of Dec. 31,
2016
Fair value /Status as of
Dec. 31, 2016
Non-current financial liabilities FLAC 249.6 – – 249.6 249.6
Other non-current liabilities and provisions 28.0 27.9 0.1 – –
(of which, for leases) n.a. (0.1) (–) (0.1) (–) (–)
(of which, other) n.a. (27.9) (27.9) (–) (–) (–)
Current financial liabilities FLAC 1.6 – – 1.6 1.6
Trade payables FLAC 459.3 – – 459.3 459.3
Liabilities from construction contracts n.a. 223.7 223.7 – – –
Accounts payable to affiliated companies FLAC 0.0 – – 0.0 0.0
Other current liabilities, prepaid expenses and deferred charges 279.8 171.4 0.1 108.3 108.3
(of which, for leases) n.a. (0.1) (–) (0.1) (–) (–)
(of which, derivatives without a hedging relationship) FLHfT (13.0) (–) (–) (13.0) (13.0)
(of which, other from the category FLAC) FLAC (95.3) (–) (–) (95.3) (95.3)
(of which, other) n.a. (171.4) (171.4) (–) (–) (–)
Total financial instruments (liabilities) 818.8 818.8
With the exception of financial investments and leasing claims, most assets have short terms to maturity. Their carrying amounts as of the financial reporting date therefore correspond approximately to the fair value. Long-term interest-bearing receivables including finance lease receivables are measured and, if necessary, impaired based on different parameters such as interest rates and customer-specific credit ratings. Thus, these carrying amounts also largely reflect the market values.
Liabilities – with the exception of long-term financial liabilities and the other non-current liabilities – have regular, short terms to matu-rity. The values shown on the balance sheet approximately represent the fair values.
The derivative financial instruments recognized at the balance sheet date have to do with forward exchange transactions to hedge exchange exposure. Recognition in the balance sheet occurs at the market value determined using standardized financial mathematical methods, among other things, in relation to the foreign exchange rates.
Net results listed according to measurement categories are repre-sented as follows:
Net profit /loss by IAS 39 measurement categories for 2017
Net gains /losses
Total interest income /
expenses
Commission income /
expenses
Loans and Receivables (LaR) -12.6 -3.7 –
Available-for-Sale Financial Assets (AfS) -1.5 – –
Held-to-Maturity (HtM) 0 -1.0 –
Financial Instruments Held for Trading (FAHfT and FLHfT) 8.8 – –
Financial Liabilities Measured at Amortized Cost (FLAC) 5.4 -2.8 -1.3
Total 0.1 -7.5 -1.3
Net profit /loss by IAS 39 measurement categories for 2016
Net gains /losses
Total interest income /
expenses
Commission income /
expenses
Loans and Receivables (LaR) -0.3 0.2 –
Available-for-Sale Financial Assets (AfS) -0.1 – –
Held-to-Maturity (HtM) 0.0 0.0 –
Financial Instruments Held for Trading (FAHfT and FLHfT) -1.5 – –
Financial Liabilities Measured at Amortized Cost (FLAC) 12.0 -3.0 -1.0
Total 10.1 -2.8 -1.0

KUKA Aktiengesellschaft | Annual Report 2017
112
As in the previous year, net losses from the category Loans and Receivables also include exchange rate effects as well as results from additions and reversals of provisions for receivables and other assets. In addition to foreign currency effects, the net profits from Financial Liabilities Measured at Amortized Cost also include income from writing off liabilities.
Interest income for financial instruments from the category Loans and Receivables comes from the investment of cash and cash equiv-alents. The interest result from financial liabilities from the category Financial Liabilities Measured at Amortized Cost largely reflects inter-est expenses from the promissory note loan as well as from financial liabilities due to banks. In addition, the interest income and interest expense also incorporate foreign currency gains and losses from financial assets and liabilities.
Commission expenses are recorded as the transaction costs for finan-cial liabilities due to banks and fees for the provision of guarantees.
30. Contingent liabilities and other financial commitments
There were no liabilities from guarantees and warranty agreements to third parties in the Group as at December 31, 2017. At the end of the previous fiscal year, there were liabilities from guarantees amounting to €4.9 million and liabilities from warranty agreements amounting to €0.2 million.
in € millions 2016 2017
Purchase commitments (discounted notes) 2.0 13.6
Rent /lease liabilities 136.2 144.0
Other financial commitments 5.9 6.7
Total 144.1 164.3
The rise in rental and leasing commitments is largely the result of new or extended tenancies and foreign currency effects.
The increase in the purchase commitments is primarily associated with construction measures for a multi-story car park in Augsburg and the expansion of production facilities.
Commitments in connection with leases for passenger cars, office and factory buildings, technical office equipment and production facili-ties primarily include liabilities from leases and rental agreements in connection with operating leases. The lease payments and due dates are broken down as follows:
in € millions Dec. 31, 2016 Dec. 31, 2017
Due within one year 32.9 36.2
Due between one and five years 79.6 80.8
Due after more than five years 23.7 27.0
Total 136.2 144.0
Total rental expenses for the fiscal year were €42.6 million compared to €41.2 million in 2016; rental income totaled €0.0 million compared to €0.0 million in 2016.
Notes to the Group cash flow statement
The cash flow statement reports cash flows separately for incoming and outgoing funds from operating, investing and financing activities in accordance with IAS 7. The calculation of cash flows is derived from the consolidated financial statements of KUKA Aktiengesellschaft by using the indirect method.
Cash and cash equivalents in the cash flow statement comprise all cash and cash equivalents disclosed on the balance sheet, i.e. cash on hand, checks and cash with banks provided they are available within three months.
Cash and cash equivalents of €0.4 million (2016: €1.1 million) are sub-ject to restrictions. These restrictions relate to a government-funded contract in Brazil and government funding for eligible development projects with a German company.
Cash flow from operating activities is derived indirectly from the earnings after taxes.
Under the indirect method, the relevant changes to the balance sheet items associated with operating activities are adjusted for currency translation effects and changes to the scope of consolidation.
Notes to the Group segment reporting
The data for the individual annual financial statements have been segmented by business field and region. The structure follows internal reporting (management approach). The segmentation is intended to create transparency with regard to the earning power and the prospects, as well as the risks and rewards for the various business fields within the Group.
Segment reporting is designed to accommodate the structure of KUKA Group. KUKA Group was engaged in three major business seg-ments in the reporting year and the previous year.
KUKA Robotics
This segment offers customers from the automotive sector and gen-eral industry – as well as those supported by comprehensive customer services – industrial robots, from small models to heavy-duty robots. Medical robotics activities are also bundled in this segment.

Group notes
113
KUKA Systems
This segment provides customers in the fields of automotive and gen-eral industry with innovative solutions and services for automated production. Applications range from welding, bonding, sealing, assem-bling and testing, to forming solutions tailored to meet the specific customer needs and production of castings and plastic components.
Swisslog
This segment produces leading automation solutions for future-ori-ented hospitals, warehouse and distribution centers with the focus on the segments of trading, including e-commerce, pharmaceuticals, and chilled and frozen foods.
KUKA AG and other companies
KUKA Aktiengesellschaft and other investments that are supplemen-tary to the operating activities of KUKA Group are aggregated in a separate segment. Cross-divisional consolidation items are shown in a separate column. The allocation of Group companies to the individual business segments is shown in the schedule of shareholdings.
The breakdown of sales revenues by region is based on the customer’s registered office /delivery location. Non-current assets (tangible and intangible assets) are calculated by company location.
in € millions
Revenues acc. to customer location
Non-current assets acc. to registered office
of the company
2016 2017 2016 2017
Germany 632.7 553.5 233.5 330.7
Rest of Europe 659.6 765.4 335.8 332.9
North America 1,060.8 1,351.7 109.3 123.4
Other regions 595.8 808.5 27.7 29.4
Total 2,948.9 3,479.1 706.3 816.4
KUKA Group did not achieve more than 10% of total sales revenues with any customer in the 2017 fiscal year or in the previous year.
The calculations for segment reporting are based on the following principles, as in the previous year:
› Group external sales revenues show the divisions’ respective percentage of consolidated sales for the Group as presented in the Group income statement.
› Intra-Group sales revenues are sales transacted between seg-ments. In principle, transfer prices for intra-Group sales are determined based on the market.
› Sales revenues for the segments include revenues from sales to third parties as well as sales to other Group segments.
› EBIT reflects operating earnings, i.e. the earnings from ordinary activities before financial results and taxes.
› Elimination of scheduled and unscheduled depreciation on tan-gible and intangible assets from EBIT produces EBITDA.
› ROCE (return on capital employed) is the ratio of EBIT to average capital employed, which is largely non-interest bearing. To cal-culate ROCE the capital employed is based on an average value.
The reconciliation of capital employed to segment assets and seg-ment liabilities is shown in the following table:
in € millions 2016 2017
Capital employed
Intangible assets 445.1 520.4
+ Tangible assets 261.2 296.0
+ Long-term finance lease receivables 57.7 43.1
+ Asset-side working capital 1,357.8 1,456.7
Inventories 318.8 387.4
Receivables from construction contracts 535.7 515.7
Trade receivables 353.2 408.1
Other receivables and assets 150.1 145.5
= Asset items of capital employed 2,121.8 2,316.2
./. Other provisions 157.9 116.6
./. Liabilities from construction contracts 223.7 214.1
./. Advances received 95.6 94.0
./. Trade payables 459.3 549.2
./. Other liabilities except for liabilities similar to bonds (incl. deferred income) 302.9 323.9
= Liability-side working capital 1,239.4 1,297.8
= Liability items of capital employed 1,239.4 1,297.8
= Capital employed 882.4 1,018.4
Average capital employed 783.0 950.4
Segment assets
Asset items of capital employed 2,121.7 2,316.2
+ Other participations 4.9 5.1
+ Investments accounted for at equity 4.2 15.7
= Segment assets 2,130.8 2,337.0
Segment liabilities
Liability items of capital employed 1,239.3 1,297.8
+ Pension provisions and similar obligations 122.7 108.9
+ Substantial restructuring provisions – 15.9
= Segment liabilities 1,362.0 1,422.6
Working capital
Asset-side working capital 1,357.8 1,456.7
Liability-side working capital 1,239.4 1,297.8
= Working capital 118.4 158.9
Additional elements of the segment reports are contained in the Management Report on the operating business divisions Robotics, Systems and Swisslog, as well as in the tables at the beginning of the Group notes.

KUKA Aktiengesellschaft | Annual Report 2017
114
Other notes
Related party disclosures
Persons or companies that may be influenced by or have influence on the reporting company must be disclosed in accordance with IAS 24, provided they have not already been included as consolidated com-panies in the financial statements.
Parties related to KUKA Group include mainly members of the Execu-tive and Supervisory Boards as well as non-consolidated KUKA Group companies in which KUKA Aktiengesellschaft directly or indirectly holds a significant proportion of the voting rights or companies that hold a significant proportion of the voting rights in KUKA Aktien-gesellschaft.
The group of related companies and persons has changed year-on-year, especially as a result of the change to the ownership structure compared to the previous year. Voith Group and Loh Group left the group of related companies, while the companies of Midea Group were added.
The group of related companies and associates increased compared to the previous year with the purchase of shares in Pipeline Health Holding LLC, San Francisco /USA. As was the case in 2016, the related companies also include the associates Freadix FryTec GmbH, Augs-burg, IWK Unterstützungseinrichtung GmbH, Karlsruhe, KUKA Unter-stützungskasse GmbH, Augsburg as non-consolidated subsidiaries and the joint venture Chang’an Reis Robotic Intelligent Equipment (Chongqing) Co., Ltd, Chongqing /China.
The contractually agreed, future capital contributions to KBee AG are to be made depending on the achievement of certain milestones and amount to a further €1.3 million. There are currently significant differences in opinion between the parties regarding the different interpretation of various components of the contract in relation to the stage of development and series maturity of the robot developed by KBee AG and the arrangements for further collaboration, including the associated company and licensing agreements.
The following receivables from and liabilities to related parties existed as at the balance sheet date:
in € millions
Shares of KUKAin %
Group receivables from related parties
Group liabilities from related parties
Dec. 31, 2016 1 Dec. 31, 2017 Dec. 31, 2016 1 Dec. 31, 2017
Midea Group – – 0.3 – 0.2
Chang’an Reis (Chongqing) Robotic Intelligent Equipment Co. Ltd 50.0 – 0.5 – 0.4
Yawei Reis Robot Manufacturing (Jiangsu) Co. Ltd., Yangzhou City, Yang-zhou City /China 49.0 0.3 0.2 1.3 0.9
KBee AG, Munich 45.0 0.2 0.4 – –
Others /less than €1 million 0.4 0.0 0.4 0.1
Total 0.9 1.4 1.7 1.6
1 Furthermore, there were receivables of €0.6 million and liabilities of €0.1 million relating to Voith Group.
Over the reporting year, the following services were provided to or purchased from related parties:
in € millions
Shares of KUKAin %
Goods and services provided by the Group to related parties
Goods and services provided to the Group by related parties
2016 1 2017 2016 1 2017
Midea Group – – 2.0 – 0.0
Chang’an Reis (Chongqing) Robotic Intelligent Equipment Co. Ltd 50.0 7.3 2.3
Yawei Reis Robot Manufacturing (Jiangsu) Co. Ltd./China 49.0 1.5 2.1 4.0 8.0
KBee AG, Munich 45.0 0.1 0.2 – 0.0
RoboCeption GmbH, Munich 25.1 0.0 0.0 2.0 1.2
Other 2.1 0.0 1.6 0.3
Total 3.7 11.6 7.6 11.8
1 Furthermore, the volume of goods and services supplied and received in relation to Voith Group amounted to €4.7 million and €0.8 million respectively.

Group notes
115
Business with all related parties is transacted under the “dealing at arm’s length” principle at transfer prices that correspond to market conditions. No business subject to reporting rules was conducted between any KUKA Group companies and members of KUKA Aktien-gesellschaft’s Executive or Supervisory Boards with the exception of the legal transactions outlined in the compensation report.
Executive Board and Supervisory Board compensation
The Executive Board of KUKA Aktiengesellschaft received total compensation of €6.7 million (2016: €5.5 million). Altogether over the fiscal year, the Executive Board received a fixed salary including payments in kind and other compensation of €1.9 million (2016: €1.2 million). Target achievement and performance-based compen-sation totaled €4.8 million (2016: €4.3 million). €3.3 million (2016: €2.2 million) of this was paid out for compensation in accordance with the phantom share program.
With a few exceptions, former Executive Board members have been granted benefits from the company pension scheme, which include old-age, vocational and employment disability, widow’s and orphan’s pensions. The amount of accruals included for this group of persons in 2017 for current pensions and vested pension benefits totals €9.8 million (HGB) compared to €10.0 million in 2016. The retirement benefits paid in this connection amounted to €0.9 million (2016: €0.8 million).
KUKA Aktiengesellschaft has no compensation agreements with the members of the Executive Board or with employees that would come into effect in the event of a takeover bid.
In the 2017 fiscal year, the members of the Supervisory Board received a total of €1.0 million (2016: €1.0 million) for their activities as mem-bers of this board.
Please refer to the notes in the audited compensation report for fur-ther information and details about the compensation of individual Executive Board and Supervisory Board members. The compensation report is part of the corporate governance report and summarizes the basic principles used to establish the compensation of the Executive and Supervisory Boards of KUKA Aktiengesellschaft. The compensa-tion report is an integral part of the Group Management Report.
Audit fees
The fee for the auditor, KPMG AG, Wirtschaftsprüfungsgesellschaft, Munich, recognized as an expense in 2017 totals €1.7 million (2016: €1.1 million) for services provided in Germany. €0.6 million (2016: €0.6 million) was recognized for financial statement auditing ser-vices. €0.7 million (2016: €0.4 million) was recognized as an expense for tax advisory services performed by the auditor and €0.4 million (2016: €0.1 million) for other services.
€1.1 million (2016: €1.1 million) was recognized as an expense for financial statement auditing services performed for foreign subsidi-aries. €0.1 million (2016: €0.2 million) was incurred for tax advisory services abroad and the same sum of €0.1 million (2016: €0.0 million) was incurred for other consultancy services.
Declaration regarding corporate governance
Reference is made to published information on the KUKA AG web-site for the declaration regarding corporate governance pursuant to section 289f HGB: www.kuka.com/en-de/investor-relations/corporate-governance/corporate-management.
Events after the balance sheet dateKUKA AG concluded a new syndicated loan agreement with a bank consortium on February 1, 2018 with a volume of €520.0 million and in doing so replaced and refinanced the existing credit facility of €400.0 million. The new agreement includes a surety and guarantee line (guaranteed credit line) in the amount of €260.0 million and a working capital line (cash line), which can also be used for sureties and guarantees, likewise in the amount of €260.0 million. The term of the new loan agreement is five years with two one-year exten-sion options additionally agreed. This gave the Group considerably extended leeway for financing further growth until 2025. The syn-dicated loan agreement remains unsecured as before and contains only the customary equal treatment clauses and negative pledges. Unchanged financial covenants were agreed with thresholds for lever-age (net financial liabilities /EBITDA) and interest coverage (EBITDA /net interest expense).
KUKA is currently on the verge of concluding an agreement with Fiat Chrysler Automotive regarding the construction of vehicle bod-ies for the new Jeep Wrangler JT in Toledo as the successor to the existing model. The existing finance lease was amended as a result of this agreement. The new agreement has a term of six years and also includes the manufacture of vehicle bodies on new production systems to be built by KUKA at the existing site in Toledo. It is recog-nized as a finance lease transaction in the balance sheet in line with the previous agreement. No bodies can be produced for the existing model from the second quarter of 2018 prospectively until the end of the first quarter of 2019 due to the construction of the new system.
Apart from this there have been no events subject to reporting requirements that had an impact on the financial position and per-formance of the company since the balance sheet reporting date.

KUKA Aktiengesellschaft | Annual Report 2017
116
Corporate bodies
Supervisory Board
Prof. Dr. Dirk Abel (until January 31, 2017)Aachen /Germany University professor Director of the Institute of Automatic Control at RWTH Aachen
Membership in comparable controlling bodies in Germany and abroad:
› ATC GmbH (Aldenhoven Testing Center of RWTH Aachen University), Aachen /Germany
Wilfried EberhardtAichach /Germany Employee representativeChief Marketing Officer of KUKA Aktiengesellschaft
Hongbo (Paul) Fang (since February 24, 2017)Chairman and CEO Midea Group
Siegfried GreulichAugsburg /Germany Employee representativeDeputy Chairman of the Works Council of the KUKA Plants at Augsburg
Dr. Yanmin (Andy) Gu (since February 10, 2017)Chairman of the Supervisory Board of KUKA AktiengesellschaftBoard Director, Vice President Midea Group
Membership in comparable controlling bodies of business enter-prises in Germany and abroad:
› Guangdong Midea Refrigeration Equipment Co. Ltd., Foshan /China
› Guangdong Midea Commercial Conditioning Equipment Co. Ltd., Foshan /China
› Midea Group Wuhan Refrigeration Equipment Co. Ltd., Wuhan /China
› Guangdong Midea Group Wuhu Refrigeration Equipment Co. Ltd., Foshan /China
› Guangdong Midea Household Appliances Import and Export Trade Co., Ltd., Foshan /China
› Foshan Midea Carrier Air-Conditioning Equipment Co. Ltd., Foshan /China
› Guangdong Midea Intelligent Technologies Co. Ltd., Foshan /China
› Midea Investment (Asia) Company Limited, Hong Kong /China › Midea Electric Trading (Singapore) Co. Pte. Ltd. /Singapore › Midea Electrics Netherlands B.V., Amsterdam /Netherlands › Midea Intelligent Technologies (Singapore) Pte. Ltd. /Singapore › Midea Italia S.R.L., Milan /Italy › Midea Electric Espana S.R.L., Madrid /Spain › Servotronix Motion Control Ltd. /Israel
Prof. Dr. Henning Kagermann (since May 31, 2017)President of Acatech – German Academy of Science and Engineer-ing, Berlin /Germany
Membership in other statutory supervisory boards:
› Deutsche Bank AG, Frankfurt am Main /Germany › Deutsche Post AG, Bonn /Germany › Munich Reinsurance Company, Munich /Germany
Armin KolbAugsburg /GermanyEmployee representative Chairman of the Works Council of the KUKA Plants at Augsburg
Dr. Constanze Kurz (until November 14, 2017)Frankfurt am MainEmployee representative on the Supervisory BoardUnion Secretary to the Executive Committee of the IG Metall trade union
Membership in other statutory supervisory boards:
› SMS GmbH and SMS group GmbH, Hilchenbach /Germany (until November 30, 2017)
› DMG MORI AG, Bielefeld /Germany (until November 30, 2017)
Michael LeppekStadtbergen /Germany Deputy Chairman of the Supervisory Board of KUKA AktiengesellschaftEmployee representative on the Supervisory Board1st Authorized Representative of IG Metall trade union, Augsburg branch
Membership in other statutory supervisory boards
› MAN Diesel & Turbo SE, Augsburg /Germany › SGL Carbon SE, Wiesbaden /Germany › AIRBUS Helicopters Deutschland GmbH,
Donauwörth /Germany
Carola LeitmeirGroßaitingen /Germany Employee representative Member of the Works Council of the KUKA Plants at Augsburg
Dr. Hubert Lienhard (until January 10, 2017)Heidenheim /Germany CEO of Voith GmbH & Co. KGaA
Membership in other statutory supervisory boards:
› EnBW AG, Karlsruhe /Germany › Heraeus Holding GmbH, Hanau /Germany › SGL Carbon SE, Wiesbaden /Germany › SMS Holding GmbH, Düsseldorf /Germany › Voith Turbo Beteiligungen GmbH (Chairman), Heidenheim /
Germany
Membership in comparable controlling bodies in Germany and abroad:
› Voith Hydro Holding GmbH & Co. KG (Chairman), Heiden-heim /Germany

Group notes
117
› Voith Digital Solutions Holding GmbH (Chairman), Heiden-heim /Germany
› Voith Turbo GmbH & Co. KG (Chairman), Heidenheim /Ger-many
Dr. Friedhelm Loh (until January 27, 2017)Dietzhölztal /Germany Owner and CEO of the Friedhelm Loh Group, Haiger Senator of Fraunhofer Gesellschaft
Membership in statutory supervisory boards:
› Deutsche Messe AG, Hannover /Germany › Klöckner & Co SE, Duisburg /Germany
Membership in comparable controlling bodies of business enter-prises in Germany and abroad:
› Fraunhofer-Gesellschaft zur Förderung der angewandten Forschung e.V., Senator, Munich /Germany
Group mandates of Friedhelm Loh Group:
› Cito Benelux B.V., Zevenaar /Netherlands, member of Supervisory Board
› Cito Benelux (Onroerend Goed) B.V., Zevenaar /Netherlands, member of Supervisory Board
› Rittal Corporation, Urbana (OH), USA, Chairman of the Board › Rittal Electrical Equipment (Shanghai) Co. Ltd., Shanghai /
China, Legal Representative and Chairman of the Board › Rittal Electro-Mechanical Technology (Shanghai) Co. Ltd.,
Shanghai /China, Legal Representative and Chairman of the Board
Prof. Dr. Uwe Loos (until February 28, 2017)Stuttgart /Germany Industrial Consultant
Membership in other statutory supervisory boards:
› Dorma Holding GmbH + Co. KGaA, Ennepetal
Membership in comparable controlling bodies in Germany and abroad:
› Bharat Forge Aluminiumtechnik, Brand-Erbisdorf /Germany › CDP Bharat Forge GmbH, Ennepetal /Germany
Min (Francoise) Liu (since February 10, 2017)HR Director Midea Group
Membership in comparable controlling bodies of business enter-prises in Germany and abroad:
› Guangdong GMCC Refrigeration Equipement Co. Ltd., Foshan /China
› Midea Smart Home Technology Co. Ltd., Shenzhen /China › Guangdong Midea Smart Link Home Technology Co. Ltd.,
Foshan /China › Midea Electric Espana S.R.L., Madrid /Spain › Midea Polska SP.Z.O.O, Warsaw /Poland
Bernd Minning (until February 1, 2017)Kaisheim /Germany Chairman of the Supervisory Board of KUKA Aktiengesellschaft
› President and CEO of WM Technologies GmbH, Kaisheim /Germany
Membership in comparable controlling bodies in Germany and abroad:
› WM Technologies (Shanghai) Ltd., Shanghai /China › KARL WÖRWAG Lack- und Farbenfabrik GmbH & Co. KG,
Stuttgart
Prof. Dr. Michèle Morner (since February 10, 2017)Incumbent of the Chair of Public Management and Leadership at the German University of Administrative Sciences in SpeyerScientific Director at the Institute of Corporate Management and Governance in Berlin [wifucg]
Membership in other statutory supervisory boards:
› Storch-Ciret Holding GmbH, Wuppertal /Germany
Tanja Smolenski (since December 14, 2017)Berlin /Germany Employee representativePolitical Secretary to the Executive Committee of the IG Metall trade unionHead of the Fundamental Issues and Social Policy department of the Executive Committee of the IG Metall trade union, Berlin office
Alexander Liong Hauw Tan (since February 24, 2017)Deputy CFO Midea Group
Membership in comparable controlling bodies of business enter-prises in Germany and abroad:
› Misr Refrigeration and Air Conditioning Manufacturing Company, S.A.E., Giza /Egypt
Executive Board
Dr. Till Reuter Pfäffikon /SwitzerlandChief Executive Officer
Membership in other statutory supervisory boards:
› Dr. Steiner Holding AG, Berlin /Germany
Membership in comparable controlling bodies of business enter-prises in Germany and abroad:
› Rinvest AG, Pfäffikon /Switzerland › Midea Group Executive Committee, Foshan /China
Peter Mohnen Munich /Germany Chief Financial Officer

KUKA Aktiengesellschaft | Annual Report 2017
118
Schedule of shareholdings of KUKA Aktiengesellschaft
As at December 31, 2017
Name and registered office of the company Currency Method of consolidation
Share of equityin %
Germany
1 Bopp & Reuther Anlagen-Verwaltungsgesellschaft mbH, Augsburg EUR k 100.00
2 connyun GmbH, Augsburg EUR k 100.00
3 Device Insight GmbH, Munich EUR k 50.01
4 Faude Automatisierungstechnik GmbH, Gärtringen EUR k 100.00
5 KUKA Industries GmbH, Augsburg 1 EUR k 100.00
6 KUKA Industries GmbH & Co. KG, Obernburg 1 EUR k 100.00
7 KUKA Roboter GmbH, Augsburg 1 EUR k 100.00
8 KUKA Systems GmbH, Augsburg 1 EUR k 100.00
9 Reis Asia Pacific GmbH, Obernburg EUR k 100.00
10 Reis GmbH, Obernburg EUR k 100.00
11 Reis Group Holding GmbH & Co. KG, Obernburg 1 EUR k 100.00
12 Reis Holding GmbH, Obernburg EUR k 100.00
13 Swisslog (Deutschland) GmbH, Puchheim EUR k 100.00
14 Swisslog Augsburg GmbH, Augsburg EUR k 100.00
15 Swisslog GmbH, Dortmund EUR k 100.00
16 Swisslog Healthcare GmbH, Westerstede EUR k 100.00
17 Verwaltungsgesellschaft Walter Reis GmbH, Obernburg EUR k 100.00
18 Visual Components GmbH, Munich EUR k 100.00
19 Walter Reis GmbH & Co KG, Obernburg 1 EUR k 100.00
20 WR Vermögensverwaltungs GmbH, Obernburg EUR k 100.00
21 KBee AG, Munich EUR at 45.00
22 RoboCeption GmbH, Munich EUR b 25.10
23 Freadix FryTec GmbH, Augsburg EUR nk 100.00
24 IWK Unterstützungseinrichtung GmbH, Karlsruhe EUR nk 100.00
25 KUKA Unterstützungskasse GmbH, Augsburg EUR nk 100.00
26 Schmidt Maschinentechnik GmbH i.L., Niederstotzingen EUR nk 100.00
Other Europe
27 Easy Conveyors B.V. , Nuenen /Netherlands EUR k 100.00
28 KUKA Automatisering + Robots N.V., Houthalen /Belgium EUR k 100.00
29 KUKA Automatisme + Robotique S.A.S., Villebon-sur-Yvette /France EUR k 100.00
30 KUKA Industries ČR spol. s r.o., Chomutov /Czech Republic CZK k 100.00
31 KUKA Industries Italia srl, Bellusco /Italy EUR k 100.00
32 KUKA Nordic AB, Västra Frölunda /Sweden SEK k 100.00
33 KUKA Roboter CEE GmbH, Linz /Austria EUR k 100.00
34 KUKA Roboter Italia S.p.A., Rivoli /Italy EUR k 100.00
35 KUKA Roboter Schweiz AG, Neuenhof /Switzerland CHF k 100.00
36 KUKA Robotics Hungária Ipari Kft., Taksony /Hungary EUR k 100.00
37 KUKA Robotics Ireland LTD, Dublin /Ireland EUR k 100.00
38 KUKA Robotics OOO, Moskau /Russia RUB k 100.00
39 KUKA Robotics UK LTD, Wednesbury /United Kingdom GBP k 100.00
40 KUKA Robots IBÉRICA S.A., Vilanova i la Geltrú /Spain EUR k 100.00
41 KUKA S-BASE s.r.o. (in liquidation), Roznov p.R. /Czech Republic CZK k 100.00

Group notes
119
Name and registered office of the company Currency Method of consolidation
Share of equityin %
42 KUKA Sistemy OOO, Togliatti /Russia RUB k 100.00
43 KUKA Systems Aerospace SAS, Bordeaux-Merignac /France EUR k 100.00
44 KUKA Systems France S.A., Montigny /France EUR k 100.00
45 KUKA Systems Slowakei, spol. S r.o., Dubnica nad Váhom /Slovakia EUR k 100.00
46 KUKA Systems SRL, Sibiu /Romania RON k 100.00
47 KUKA Systems UK Ltd., Halesowen /United Kingdom GBP k 100.00
48 Reis Espana S.L. , Esplugues de Llobregat (Barcelona) /Spain EUR k 100.00
49 Reis France SCI, Pontault Combault /France EUR k 100.00
50 Swisslog (UK) Ltd., Redditch /United Kingdom GBP k 100.00
51 Swisslog AB, Partille /Sweden SEK k 100.00
52 Swisslog Accalon AB, Boxholm /Sweden SEK k 100.00
53 Swisslog AG, Buchs /Switzerland CHF k 100.00
54 Swisslog AS, Oslo /Norway NOK k 100.00
55 Swisslog B.V., Culemborg /Netherlands EUR k 100.00
56 Swisslog Ergotrans B.V., Apeldoorn /Netherlands EUR k 100.00
57 Swisslog Evomatic GmbH, Sipbachzell /Austria EUR k 100.00
58 Swisslog France SAS, Saint-Denis /France EUR k 100.00
59 Swisslog Holding AG, Buchs /Switzerland CHF k 100.00
60 Swisslog Italia SpA, Mailand /Italy EUR k 100.00
61 Swisslog Luxembourg S.A., Ell /Luxembourg EUR k 100.00
62 Swisslog N.V., Wilrijk /Belgium EUR k 100.00
63 Tecnilab S.p.A., Cuneo /Italy EUR k 100.00
64 Visual Components Oy, Espoo /Finland EUR k 100.00
65 Metaalwarenfabriek’s-Hertogenbosch B.V., s-Hertogenbosch /Netherlands EUR nk 100.00
North America
66 KUKA Aerospace Holdings LLC, Michigan /USA USD k 100.00
67 KUKA Assembly and Test Corp., Saginaw, Michigan /USA USD k 100.00
68 KUKA de Mexico S. de R.L. de C.V., Mexico City /Mexico MXN k 100.00
69 KUKA Recursos S. de R.L. de C.V., Mexico City /Mexico MXN k 100.00
70 KUKA Robotics Canada Ltd., Saint John NB /Canada CAD k 100.00
71 KUKA Robotics Corp., Sterling Heights, Michigan /USA USD k 100.00
72 KUKA Systems de Mexico S. de R.L. de C.V., Mexico City /Mexico MXN k 100.00
73 KUKA Systems North America LLC., Sterling Heights, Michigan /USA USD k 100.00
74 KUKA Toledo Production Operations, LLC., Toledo, Ohio /USA 2 USD k 100.00
75 KUKA U.S. Holdings Company LLC., Shelby Township, Michigan /USA USD k 100.00
76 Reis Robotics USA Inc., Elgin, Illinois /USA USD k 100.00
77 Swisslog Logistics, Inc., Newport News /USA USD k 100.00
78 Swisslog USA Inc., City of Dover /USA USD k 100.00
79 Translogic CORPORATION, Denver /USA USD k 100.00
80 Translogic Ltd. (Canada), Mississauga /Canada CAD k 100.00
81 Visual Components North America Corporation, Michigan /USA USD k 100.00
82 Pipeline Health Holdings LLC., Delaware /USA USD at 25.00
Latin America
83 KUKA Industries Brasil Sistemas de Automoção Ltda., São Paulo /Brazil BRL k 100.00
84 KUKA Roboter do Brasil Ltda., São Paulo /Brazil BRL k 100.00
85 KUKA Systems do Brasil Ltda., São Bernardo do Campo SP /Brazil BRL k 100.00
86 Reis Robotics do Brasil Ltda., São Paulo /Brazil BRL k 100.00

KUKA Aktiengesellschaft | Annual Report 2017
120
Name and registered office of the company Currency Method of consolidation
Share of equityin %
Asia /Austalia
87 KUKA Industries Automation (China) Co., Ltd., Kunshan /China CNY k 100.00
88 KUKA Industries Singapore PTE. Ltd., Singapur /Singapore SGD k 100.00
89 KUKA Management (Shanghai) Co. Ltd., Shanghai /China CNY k 100.00
90 KUKA Robot Automation Malaysia Sdn BhD, Kuala Lumpur /Malaysia MYR k 100.00
91 KUKA Robot Automation Taiwan Co. Ltd., Chung-Li City /Taiwan TWD k 99.90
92 KUKA Robotics (China) Co. Ltd., Shanghai /China CNY k 100.00
93 KUKA Robotics (India) Pvt. Ltd., Haryana /India INR k 100.00
94 KUKA Robotics (Thailand) Co., Ltd., Bangkok /Thailand THB k 100.00
95 KUKA Robotics Australia Pty. Ltd., Victoria /Australia AUD k 100.00
96 KUKA Robotics Japan K.K., Tokyo /Japan JPY k 100.00
97 KUKA Robotics Korea Co. Ltd., Kyunggi-Do /South Korea KRW k 100.00
98 KUKA Robotics Manufacturing China Co. Ltd., Shanghai City /China CNY k 100.00
99 KUKA Systems (China) Co. Ltd., Shanghai /China CNY k 100.00
100 KUKA Systems (India) Pvt. Ltd., Pune /India INR k 100.00
101 Reis Robotics China Co. Ltd. (Shanghai), Shanghai /China CNY k 100.00
102 Swisslog (Kunshan) Co. Ltd., Kunshan /China CNY k 100.00
103 Swisslog Asia Ltd., Hongkong /China HKD k 100.00
104 Swisslog Australia Pty Ltd., Sydney /Australia AUD k 100.00
105 Swisslog Healthcare Trading MEA LLC., Emirate of Dubai /United Arab Emirates AED k 49.00
106 Swisslog Korea Co. Ltd, Bucheon si, Kyeonggi-do, Südkorea /South Korea KRW k 100.00
107 Swisslog Malaysia Sdn Bhd, Selangor Darul Ehsan /Malaysia MYR k 100.00
108 Swisslog Middle East LLC., Dubai /United Arab Emirates AED k 51.00
109 Swisslog Pte Ltd Singapur, Singapore /Singapore SGD k 100.00
110 Swisslog Shanghai Co. Ltd., Shanghai /China CNY k 100.00
111 Swisslog Singapore Pte Ltd., Singapore /Singapore SGD k 100.00
112 Yawei Reis Robot Manufacturing (Jiangsu) Co. Ltd., Yangzhou City /China CNY at 49.00
113 Chang’an Reis (Chongqing) Robotic Intelligent Equipment Co. Ltd, Chongqing /China CNY at 50.00
1 Companies that have made use of the exemption pursuant to section 264 para. 3 or section 264b of the German Commercial Code
2 Principal place of business
Method of consolidation as of December 31, 2017
k Fully consolidated companies
nk Non-consolidated companies
at Financial asset accounted for by the equity method
b Participating interest

Group notes
121
Responsibility statement“To the best of our knowledge, and in accordance with the applicable reporting principles, the consolidated financial statements give a true and fair view of the assets, liabilities, financial position and profit or loss of the Group, and the Management Report of the Group includes a fair review of the development and performance of the business and the position of the Group, together with a description of the principal opportunities and risks associated with the expected development of the Group.”
Augsburg, February 23, 2018
KUKA AktiengesellschaftThe Executive Board
Dr. Till Reuter Peter Mohnen

KUKA Aktiengesellschaft | Annual Report 2017
122
Independent Auditor’s ReportTo KUKA Aktiengesellschaft, Augsburg
Report on the Audit of the Consolidated Financial Statements and of the Group Management Report
Opinions
We have audited the consolidated financial statements of KUKA AG, Augsburg, and its subsidiaries (the Group), which comprise the Group statement of financial position as at December 31, 2017, the Group income statement, Group statement of comprehensive income, Group cash flow statement, and development of Group equity for the financial year from January 1, 2017 to December 31, 2017, and notes to the consolidated financial statements, including a summary of significant accounting policies. In addition, we have audited the group management report of KUKA AG and the KUKA Group (here-inafter: “group mananagement report) for the financial year from January 1, 2017 to December 31, 2017.
In our opinion, on the basis of the knowledge obtained in the audit,
› the accompanying consolidated financial statements comply, in all material respects, with the IFRSs as adopted by the EU, and the additional requirements of German commercial law pursuant to Section 315e (1) HGB [Handelsgesetzbuch: German Commercial Code] and, in compliance with these requirements, give a true and fair view of the assets, liabilities, and financial position of the Group as of December 31, 2017, and of its finan-cial performance for the financial year from January 1, 2017 to December 31, 2017, and
› the accompanying group management report as a whole pro-vides an appropriate view of the Group’s position. In all material respects, this group management report is consistent with the consolidated financial statements, complies with German legal requirements and appropriately presents the opportunities and risks of future development.
Pursuant to Section 322 (3) sentence 1 HGB, we declare that our audit has not led to any reservations relating to the legal compliance of the consolidated financial statements and of the group management report.
Basis for the Opinions
We conducted our audit of the consolidated financial statements and of the group management report in accordance with Section 317 HGB and the EU Audit Regulation No. 537 /2014 (referred to subsequently as “EU Audit Regulation”) and in compliance with German Generally Accepted Standards for Financial Statement Audits promulgated by the Institut der Wirtschaftsprüfer [Institute of Public Auditors in Germany] (IDW). We performed the audit of the consolidated financial statements in supplementary compliance with the Inter-national Standards on Auditing (ISAs). Our responsibilities under those requirements, principles and standards are further described
in the “Auditor’s Responsibilities for the Audit of the Consolidated Financial Statements and of the Group Management Report” section of our auditor’s report. We are independent of the group entities in accordance with the requirements of European law and German com-mercial and professional law, and we have fulfilled our other German professional responsibilities in accordance with these requirements. In addition, in accordance with Article 10 (2) point (f) of the EU Audit Regulation, we declare that we have not provided non-audit services prohibited under Article 5 (1) of the EU Audit Regulation. We believe that the evidence we have obtained is sufficient and appropriate to provide a basis for our opinions on the consolidated financial state-ments and on the group management report.
Key Audit Matters in the Audit of the Consolidated Financial Statements
Key audit matters are those matters that, in our professional judg-ment, were of most significance in our audit of the consolidated financial statements for the financial year from January 1, 2017 to December 31, 2017. These matters were addressed in the context of our audit of the consolidated financial statements as a whole, and in forming our opinion thereon, we do not provide a separate opinion on these matters.
Recognition of deferred tax assetsPlease refer to notes to the notes to the consolidated financial statements “General information and accounting principles” as well as note 5 in the notes to the consolidated financial statements for further information on the recognition and measurement principles applied as well as the deferred tax assets recognized.
The financial statement riskShown in the consolidated financial statements of KUKA AG as of December 31, 2017 are deferred tax assets in the amount of EUR 79.6 million.
For the recognition of deferred tax assets, KUKA AG estimates to what extent the deferred tax claims can be utilized in the following reporting periods. The realization of these claims requires that in the future, taxable income will be generated in an adequate amount. If there is justified doubt as to the future realization of the deferred tax claims determined, deferred tax assets are not recognized, or valuation allowances are recognized for deferred tax assets already recorded.
The accounting for deferred tax assets depends to a large extent on the assessment and assumptions of management with respect to the operational development of the companies and the tax planning of the Group is therefore subject to significant uncertainties. Fur-thermore, the realization is dependent on the respective legal tax environment.
The risk exists for the financial statements that the assessment of KUKA is not appropriate and the recognized deferred tax assets are not recoverable.

Group notes
123
Our audit approachFor the assessment of the tax situation, we have involved our tax specialists in the audit. Initially, we took a critical look at the tem-porary differences between the IFRS carrying amounts and the car-rying amounts for tax purposes. In addition, we reconciled the loss carryforwards to the tax assessments and the tax calculations for the current financial year, and we also assessed the off-balance-sheet adjustments.
We assessed the recoverability of the deferred tax assets on the basis of the internal forecasts prepared by the Company of the future income situation, and we critically evaluated the underlying assump-tions. In this connection, we especially compared the planning of the future taxable income with the planning prepared by the Executive Board and approved by the Supervisory Board and reviewed them for consistency. The appropriateness of the planning utilized was assessed based on the tax planning calculations. Furthermore, we convinced ourselves as to the forecasting quality of the Company by comparing the planning of earlier financial years with subsequent actually realized results and by analyzing variances.
Our observationsThe assumptions underlying the deferred tax assets are appropriate on an overall basis.
Recoverability of goodwill Please refer to notes to the notes to the consolidated financial state-ments “General information and accounting principles” as well as note 7 in the notes to the consolidated financial statements for fur-ther information on the recognition and measurement principles as well as assumptions utilized.
The financial statement riskAs of December 31, 2017, goodwill amounts to EUR 300.1 million (11.4% of the total assets).
The recoverability of goodwill is reviewed annually at the level of the cash generating units. For this purpose, the carrying amount is com-pared to the recoverable amount of the respective cash generating unit. If the carrying amount is higher than the recoverable amount, there is a need for an impairment write-down. The recoverable amount is the higher amount of the fair value and the value in use of the cash generating unit. The reference date for the impairment test was November 30, 2017.
The goodwill impairment test is complex and is based on a num-ber of discretionary assumptions. These include, among others, the expected development of the business and the results of the business segments for the next three years, the assumed long-term growth rates and the discount rate utilized.
As a result of the impairment test, the Company determined no need for an impairment write-down.
The risk exists for the financial statements that as of the closing date an existing impairment is not recognized in an adequate amount. Furthermore, the risk exists that the related disclosures in the notes are not appropriate.
Our audit approachWith the involvement of our valuation specialists, we have assessed, among other factors, the appropriateness of the significant assump-tions and the Company’s calculation method. For this purpose, we have discussed the expected development of the business and the results, as well as the assumed long-term growth rate (where avail-able with external forecasts) with the individuals responsible for the planning. Furthermore, we performed reconciliations with other internally-available forecasts, for example, for tax purposes, with external forecasts (where available) and the planning prepared by the Executive Board and approved by the Supervisory Board.
Furthermore, we convinced ourselves regarding the previous forecast-ing quality of the Company by comparing planning of earlier financial years with the actual results realized and by analyzing variances. Since changes in the discount rate can have a significant effect on the results of the impairment test, we compared the assumptions and parameters underlying the discount rate, in particular the risk-free interest rate, the market risk premium and the beta factor, with our own assumptions and publicly available data.
To ensure the computational correctness of the valuation model uti-lized, we developed an understanding of the Company’s calculations on the basis of a risk-oriented selection of elements.
In order to account for the existing forecast uncertainty and the early reference date for the impairment test, we have investigated potential changes in the discount rates on the recoverable amount (sensitivity analysis) by calculating alternative scenarios and comparing these with the amounts determined by the Company.
Finally, we assessed whether the note disclosures regarding the recoverability of goodwill are appropriate. This comprised also the assessment of the appropriateness of the note disclosures accord-ing to IAS 36.134(f) regarding sensitivity in the case of a reasonably possible change in the value of significant assumptions underlying the valuation.
Our observationsThe calculation method underlying the impairment test for goodwill is appropriate and is consistent with valuation principles to be applied.
The Company’s assumptions and parameters underlying the valuation are reasonable.
The related disclosures in the notes are proper.
Accounting for long-term production orders in the Systems Segment and SwisslogPlease refer to notes to the notes to the consolidated financial state-ments “General information and accounting principles” as well as notes 1 and 14 in the notes to the consolidated financial statements for further information on the recognition and measurement princi-ples as well as the respective amounts.

KUKA Aktiengesellschaft | Annual Report 2017
124
The financial statement riskIn the 2017 financial year, revenues from long-term production orders amount to EUR 1,891 million. As of the December 31, 2017 closing date, receivables from long-term production orders amount to EUR 516 million, and liabilities from long-term production orders amount to EUR 214 million.
KUKA AG accounts for its long-term production orders according to the percentage-of-completion method. Under the percentage-of-com-pletion method, revenues and proportionate income contributions are realized according to the stage of completion of the order. According to IAS 11, a necessary condition for this is that the results from the order can be reliably estimated. If a loss is expected on the order, this loss is to be recognized at its full amount.
The accounting for long-term production orders is complex and requires discretionary judgment. Estimation uncertainty exists in particular regarding the total contract costs to be estimated and the determination of the stage of completion achieved (cost-to-cost method).
The risk exists for the financial statements, that the revenues and results from the long-term production orders, as well as the receiv-ables and liabilities, are assigned incorrectly to the financial years and that impending losses on long-term production orders are not recognized on a timely basis.
Our audit approachOn the basis of our understanding of the process which we obtained, we have assessed the design, establishment and functionality of iden-tified internal controls, especially relating to the monitoring of costs, risks and plan revenues of the individual orders.
In addition, in connection with our audit, we assessed, among other facets, the group-wide requirements of the accounting guidelines with respect to the accounting for long-term production orders, and we evaluated the accounting for long-term production orders selected on the basis of risk-oriented aspects.
We assessed the discretionary decisions, such as the estimate of the stage of completion achieved and the costs still to come, as well as follow-up costs, as to their appropriateness. For this purpose, we discussed the long-term production orders, including the existing risks (e. g., legal risks or warranty risks), with management of the segments and with individuals responsible for the projects, and we analyzed the project calculation. Furthermore, for already-completed and still ongoing projects we compared the actual costs incurred with the original calculation in order to be able to assess the overall quality of the planning.
Building upon the knowledge previously obtained, we assessed the proper determination of the respective stage of completion achieved as well as the accounting and income statement recognition.
Our observationsThe approach of KUKA for the accounting for long-term production orders is proper. The assumptions underlying the accounting for long-term production orders are appropriate.
Other Information
Management is responsible for the other information. The other infor-mation comprises the remaining parts of the annual report, with the exception of the audited consolidated financial statements and group management report and our auditor’s report.
Our opinions on the consolidated financial statements and on the group management report do not cover the other information, and consequently we do not express an opinion or any other form of assurance conclusion thereon.
In connection with our audit, our responsibility is to read the other information and, in so doing, consider whether the other information
› is materially inconsistent with the consolidated financial state-ments, with the group management report or our knowledge obtained in the audit, or
› otherwise appears to be materially misstated. If, based on the work we have performed, we conclude that there is a material misstatement of this other information, we are required to report that fact. We have nothing to report in this regard.
Responsibilities of Management and the Supervisory Board for the Consolidated Financial Statements and the Group Management ReportManagement is responsible for the preparation of the consolidated financial statements that comply, in all material respects, with IFRSs as adopted by the EU and the additional requirements of German commercial law pursuant to Section 315e (1) HGB and that the consol-idated financial statements, in compliance with these requirements, give a true and fair view of the assets, liabilities, financial position, and financial performance of the Group. In addition, management is responsible for such internal control as they have determined neces-sary to enable the preparation of consolidated financial statements that are free from material misstatement, whether due to fraud or error.
In preparing the consolidated financial statements, management is responsible for assessing the Group’s ability to continue as a going concern. They also have the responsibility for disclosing, as applicable, matters related to going concern. In addition, they are responsible for financial reporting based on the going concern basis of accounting unless there is an intention to liquidate the Group or to cease opera-tions, or there is no realistic alternative but to do so.
Furthermore, management is responsible for the preparation of the group management report that, as a whole, provides an appropriate view of the Group’s position and is, in all material respects, consistent with the consolidated financial statements, complies with German legal requirements, and appropriately presents the opportunities and risks of future development. In addition, management is responsible for such arrangements and measures (systems) as they have consid-ered necessary to enable the preparation of a group management report that is in accordance with the applicable German legal require-ments, and to be able to provide sufficient appropriate evidence for the assertions in the group management report.

Group notes
125
The Supervisory Board is responsible for overseeing the Group’s finan-cial reporting process for the preparation of the consolidated financial statements and of the group management report.
Auditor’s Responsibilities for the Audit of the Consolidated Financial Statements and of the Group Management ReportOur objectives are to obtain reasonable assurance about whether the consolidated financial statements as a whole are free from material misstatement, whether due to fraud or error, and whether the group management report as a whole provides an appropriate view of the Group’s position and, in all material respects, is consistent with the consolidated financial statements and the knowledge obtained in the audit, complies with the German legal requirements and appro-priately presents the opportunities and risks of future development, as well as to issue an auditor’s report that includes our opinions on the consolidated financial statements and on the group management report.
Reasonable assurance is a high level of assurance, but is not a guaran-tee that an audit conducted in accordance with Section 317 HGB and the EU Audit Regulation and in compliance with German Generally Accepted Standards for Financial Statement Audits promulgated by the Institut der Wirtschaftsprüfer (IDW) and supplementary com-pliance with the ISAs will always detect a material misstatement. Misstatements can arise from fraud or error and are considered material if, individually or in the aggregate, they could reasonably be expected to influence the economic decisions of users taken on the basis of these consolidated financial statements and this group management report.
We exercise professional judgment and maintain professional skep-ticism throughout the audit. We also:
› identify and assess the risks of material misstatement of the consolidated financial statements and of the group management report, whether due to fraud or error, design and perform audit procedures responsive to those risks, and obtain audit evidence that is sufficient and appropriate to provide a basis for our opin-ions. The risk of not detecting a material misstatement resulting from fraud is higher than for one resulting from error, as fraud may involve collusion, forgery, intentional omissions, misrep-resentations, or the override of internal control.
› obtain an understanding of internal control relevant to the audit of the consolidated financial statements and of arrangements and measures (systems) relevant to the audit of the group man-agement report in order to design audit procedures that are appropriate in the circumstances, but not for the purpose of expressing an opinion on the effectiveness of these systems.
› evaluate the appropriateness of accounting policies used by management and the reasonableness of estimates made by management and related disclosures.
› conclude on the appropriateness of management’s use of the going concern basis of accounting and, based on the audit evi-dence obtained, whether a material uncertainty exists related to events or conditions that may cast significant doubt on the Group’s ability to continue as a going concern. If we conclude that a material uncertainty exists, we are required to draw
attention in the auditor’s report to the related disclosures in the consolidated financial statements and in the group man-agement report or, if such disclosures are inadequate, to modify our respective opinions. Our conclusions are based on the audit evidence obtained up to the date of our auditor’s report. How-ever, future events or conditions may cause the Group to cease to be able to continue as a going concern.
› evaluate the overall presentation, structure and content of the consolidated financial statements, including the disclosures, and whether the consolidated financial statements present the underlying transactions and events in a manner that the consoli-dated financial statements give a true and fair view of the assets, liabilities, financial position and financial performance of the Group in compliance with IFRSs as adopted by the EU and the additional requirements of German commercial law pursuant to Section 315e (1) HGB.
› obtain sufficient appropriate audit evidence regarding the finan-cial information of the entities or business activities within the Group to express opinions on the consolidated financial state-ments and on the group management report. We are responsi-ble for the direction, supervision and performance of the group audit. We remain solely responsible for our opinions.
› evaluate the consistency of the group management report with the consolidated financial statements, its conformity with [Ger-man] law, and the view of the Group’s position it provides.
› perform audit procedures on the prospective information pre-sented by management in the group management report. On the basis of sufficient appropriate audit evidence we evaluate, in particular, the significant assumptions used by management as a basis for the prospective information, and evaluate the proper derivation of the prospective information from these assump-tions. We do not express a separate opinion on the prospective information and on the assumptions used as a basis. There is a substantial unavoidable risk that future events will differ mate-rially from the prospective information.
We communicate with those charged with governance regarding, among other matters, the planned scope and timing of the audit and significant audit findings, including any significant deficiencies in internal control that we identify during our audit.
We also provide those charged with governance with a statement that we have complied with the relevant independence requirements, and communicate with them all relationships and other matters that may reasonably be thought to bear on our independence, and where applicable, the related safeguards.
From the matters communicated with those charged with govern-ance, we determine those matters that were of most significance in the audit of the consolidated financial statements of the current period and are therefore the key audit matters. We describe these matters in our auditor’s report unless law or regulation precludes public disclosure about the matter.

KUKA Aktiengesellschaft | Annual Report 2017
126
Other Legal and Regulatory Requirements
Further Information pursuant to Article 10 of the EU Audit Regulation
We were elected as group auditor by the annual general meeting on May 31, 2017. We were engaged by the Supervisory Board on Janu-ary 19, 2018. We have been the group auditor of the KUKA AG without interruption since the financial year 2011.
We declare that the opinions expressed in this auditor’s report are consistent with the additional report to the audit committee pursu-ant to Article 11 of the EU Audit Regulation (long-form audit report).
The fee for the year-end audit services of KPMG AG WPG related in particular to the audit of the consolidated financial statements and the annual financial statements of KUKA AG as well as various year-end audits of its subsidiaries, including legal engagement extensions and audit emphasis areas agreed to with the Supervisory Board. In addition, an audit-integrated review took place of the half-year report.
In the 2017 financial year, we rendered tax advisory services in con-nection with the preparation of the income tax return for employees of KUKA AG deployed abroad and for its subsidiaries. In addition, we carried out consulting services in connection with a software asset management project. All services were approved by the Audit Com-mittee. The services, individually or in the aggregate, had no effect on the audited financial statements.
German Public Auditor Responsible for the EngagementThe German Public Auditor responsible for the engagement is Rainer Rupprecht.
Munich, February 23, 2018
KPMG AG Wirtschaftsprüfungsgesellschaft
Rainer Rupprecht Matthias KruckerWirtschaftsprüfer Wirtschaftsprüfer[German Public Auditor] [German Public Auditor]

Group notes
127
Disclosures in accordance with pay transparency act
Promoting diversity in KUKA Group
KUKA promotes diversity among its employees, as we need a larger talent pool, especially considering the skills shortage forecast for the future. Living and promoting diversity and benefiting from different experiences and talents is part of the corporate culture at KUKA. We are convinced that the appreciation of our diversity has a positive effect on KUKA as a company, on how we deal with our customers and on our role in society.
Our aim is to create a working environment that is free of preju-dice and characterized by acceptance and tolerance. KUKA therefore supports the internal KUKA “Women in Network” orangeWIN to pursue diversity within the Group and to promote the advancement of women. The orangeWIN women’s network organized 21 different event formats during the year under review with some 360 women taking part. KUKA has also been involved in the Augsburg cross men-toring program since 2011, which is committed to gender equality at work and is involved in MigraNet that aims to achieve the professional integration of people from a migrant background.
Measures for ensuring equal pay for women and men
Application of collective wage agreementsAt its Bavarian locations covered by collective bargaining, KUKA continues to consistently apply the regional collective agreements for the Bavarian metal and electrical industry, especially the collec-tive wage agreement and the framework remuneration agreement. In some instances, in-company wage agreements are in place for locations outside of Bavaria. The employees are always allocated to groups on a gender-neutral basis according to the requirements of the work assignment as a whole and the knowledge and skills required to complete the requested work assignment. The payment of all var-iable components of remuneration is based solely on the collective agreements without a gender-specific distinction.
Gender-neutral job descriptionsInternal and external advertisements for positions to be filled are always neutral in terms of gender.
Personnel selection with headhuntersWhen working together with external headhunters, we always take great care to ensure we have an application from at least one woman among the top 3 candidates for a position to be filled.
Agreement of targets and profit sharingThe remuneration for corporate success through employee profit sharing is paid regardless of the number of working hours. In par-ticular, this prevents indirect discrimination of female employees, for example, who more frequently work part time.
Consistent regulations and approaches are employed for both genders in the agreement of targets for non pay-scale employees.
The average number of full-time employees in Germany in 2016 was 4,717 while part-time employees numbered 356. Broken down by gen-der, there were 864 female and 4,209 male employees in Germany in 2016 on average. The average number of employees in total was thus 5,072.
Full-time and part-time employees in Germany
Gender Full-time Part-time Ø employees 1 2016
female 633 231 864
male 4,084 125 4,209
Total 4,717 356 5,072
1 Reporting period in accordance with pay transparency act

KUKA Aktiengesellschaft | Annual Report 2017
128
GlossaryABSAsset-backed securities. Asset-backed securities are bonds or notes that are collateralized with assets (usually receivables). Receivables of KUKA Roboter GmbH are purchased within the framework of an ABS program.
Capital employedCapital employed includes working capital as well as intangible assets and tangible fixed assets. Capital employed therefore represents the difference between operating assets and non-interest-bearing outside capital.
Cash earningsCash earnings are a measurement for the inflow or outflow of cash from the operating profits (EBIT). They are the resulting balance from operating profits, interest, taxes, depreciation as well as other non-payment-related expenses and income.
Corporate complianceCorporate compliance means that all employees conform to the company’s legislative framework and internal guidelines and do not contravene any applicable laws. Proactive risk minimization is also part of a company’s compliance management system.
Corporate governanceCommon international term for responsible corporate management and control that aims at creating long-term value.
DAXGerman stock index of blue chip companies. It includes the 30 larg-est German companies admitted to the Prime Standard in terms of market capitalization and volume of stocks traded.
Declaration of complianceDeclaration of the Executive Board and the Supervisory Board in accordance with section 161 of the German Corporation Act (AktG) regarding the implementation of the recommendations of the Gov-ernment Commission in the German Corporate Governance Code.
Deferred taxesTemporary differences between calculated taxes on the commercial and tax balance sheets designed to disclose the tax expense in line with the financial accounting income.
DerivativesFinancial instruments whose value is largely derived from a specified price and the price fluctuations /expectations of an underlying base value, e. g. exchange rates.
EBITEarnings before interest and taxes.
EBIT marginEBIT in relation to sales revenues.
EmployeesAll figures for employees in the annual report are based on full time equivalent.
Equity ratioRatio of equity to total assets.
Earnings per shareEarnings per share are calculated on the basis of Group consolidated earnings after taxes and the average number of shares outstanding for the year.
ExposureA key figure used to assess risk. This key figure includes all incoming payments in a 90-day period prior to the record date of the down payments, payments based on percentage of completion or compen-sation after acceptance of the work carried out. In addition, the key figure also comprises all customer payments made within 90 days and which have not yet been supplied with deliveries /services includ-ing the sum of unpaid invoices following delivery or service supplied to the customer, the POC receivables and any purchase commitments.
Free cash flowCash flow from operating activities plus cash flow from investing activities. Free cash flow shows the extent of the funds generated by the company in the business year.
Free floatShares of a public company owned by diverse shareholders.
GCGCGerman Corporate Governance Code: the German Government Com-mission’s list of requirements for German companies (since 2002).
General industryGeneral industrial markets not including the automotive industry.
Gross marginGross margin is determined by dividing gross profit by sales, expressed as a percentage.
Gross profitGross profit on sales is defined as total sales minus cost of goods sold. Cost of goods sold includes all direct costs associated with sales revenues generated. Other costs, such as research and development, marketing and administration, are not included.

Group notes
129
HGBGerman Commercial Code.
IASInternational Accounting Standards.
IFRIC /SICInternational Financial Reporting Interpretation Committee – inter-preter of the international financial reporting standards IAS and IFRS, formerly also SIC. IFRIC is the new name for the Standing Interpreta-tions Committee adopted by the trustees of the IASC foundation in March 2002. SIC was created in 1997 to improve the application and worldwide comparability of financial reports prepared in accordance with International Accounting Standards (IAS). It outlines financial statement practices that may be subject to controversy.
IFRSInternational Financial Reporting Standards: The IFRS ensure inter-national comparability of consolidated financial statements and help guarantee a higher degree of transparency.
MAPKUKA Aktiengesellschaft’s employee share program.
Market capitalizationThe market value of a company listed on the stock exchange. This is calculated by taking the share price and multiplying it by the number of shares outstanding.
MDAXThis stock index comprises the 50 largest German companies (after those of the DAX) according to market capitalization and volume of stocks traded.
Net liquidity /Net debtNet liquidity /net debt is a financial control parameter consisting of cash, cash equivalents and securities minus current and non-current financial liabilities.
Percentage of completion method (POC)Accounting method of revenue and profit recognition according to the stage of completion of an order. This method is used for custom-er-specific construction contracts.
R & D expensesExpenditures related to research and development.
RatingAssessment of a company’s creditworthiness (solvency) determined by a rating agency based on analyses of the company. The individual rating agencies use different assessment levels.
Reis GroupReis Group refers to Reis Group Holding GmbH & Co. KG and its sub-sidiaries.
ROCEReturn on capital employed (ROCE) is the ratio of the operating profit /loss (EBIT) to the capital employed (see Capital employed). To calculate ROCE the capital employed is based on an average value.
SDAXThis stock index comprises 50 smaller German companies that in terms of order book turnover and market capitalization rank directly below the MDAX shares.
Swisslog GroupSwisslog Group comprises Swisslog Holding AG and its subsidiaries.
Trade working capitalTrade working capital is defined as current assets minus current lia-bilities directly associated with everyday business operations; that is, inventories minus advance payments, trade receivables and receiva-bles for manufacturing orders minus liabilities for trade receivables and manufacturing orders.
VolatilityIntensity of fluctuations in share prices and exchange rates or changes in prices for bulk goods compared to market developments.
Working capitalWorking capital consists of the inventories, trade receivables, other receivables and assets, accrued items and the balance of receiva-bles and payables from affiliated companies, as far as these are not allocated to financial transactions, minus other provisions, trade payables, other payables with the exception of liabilities similar to bonds and deferred income.
WPHGGerman Securities Trading Act.

KUKA Aktiengesellschaft | Annual Report 2017
130
KUKA Aktiengesellschaft Zugspitzstr. 14086165 AugsburgGermanyT +49 821 797 - 0F +49 821 797 - [email protected]
Corporate Communications T +49 821 797 - 3722F +49 821 797 - [email protected]
Investor Relations T +49 821 797 - 5226F +49 821 797 - [email protected]
Concept, design and setting sam waikiki, Hamburg /Germany
Text KUKA Aktiengesellschaft
Photographs Andreas Pohlmann (7) KUKA Aktiengesellschaft (9)
Translation AMPLEXOR Digital GmbH, Augsburg /Germany
Print Eberl Print GmbH, Immenstadt /Germany
Contact and imprint
Financial calendar 2018
First quarter interim report April 27, 2018
Annual General Meeting, Augsburg /Germany June 6, 2018
Interim report to mid-year August 6, 2018
Interim report for the first nine months October 29, 2018
The annual report was published on March 22, 2018 and is available in German and English from KUKA Aktien gesellschaft Corporate Communications /Investor Relations department. In the event of doubt, the German version applies.


www.kuka.com