robust selectivity for faces in the human amygdala in the
TRANSCRIPT

Robust Selectivity for Faces in the Human Amygdala in theAbsence of Expressions
Peter Mende-Siedlecki1, Sara C. Verosky1,2, Nicholas B. Turk-Browne1,and Alexander Todorov1,2,3
Abstract
■ There is a well-established posterior network of corticalregions that plays a central role in face processing and thathas been investigated extensively. In contrast, although re-sponsive to faces, the amygdala is not considered a core face-selective region, and its face selectivity has never been a topicof systematic research in human neuroimaging studies. Here,we conducted a large-scale group analysis of fMRI data from215 participants. We replicated the posterior network observedin prior studies but found equally robust and reliable responsesto faces in the amygdala. These responses were detectable in
most individual participants, but they were also highly sensitiveto the initial statistical threshold and habituated more rapidlythan the responses in posterior face-selective regions. A multi-variate analysis showed that the pattern of responses to facesacross voxels in the amygdala had high reliability over time.Finally, functional connectivity analyses showed stronger cou-pling between the amygdala and posterior face-selective regionsduring the perception of faces than during the perception ofcontrol visual categories. These findings suggest that the amyg-dala should be considered a core face-selective region. ■
INTRODUCTION
Of the countless stimuli that populate our visual uni-verse, faces are one of the richest sources of social infor-mation. Attentional biases to faces are present early indevelopment. Newborns with virtually no visual experi-ence show robust preferences for faces over otherequally complex objects (Pascalis & Kelly, 2009; Farroniet al., 2005; Johnson, 2005). A human face conveys criticalinformation about who a person is (i.e., identity), whatsocial groups they belong to (i.e., race, gender), and whatthey may be feeling or intending (i.e., emotional expres-sion, gaze direction). People need minimal visual informa-tion to identify faces (Grill-Spector & Kanwisher, 2005;Yip & Sinha, 2002), identify their race and gender (Martin& Macrae, 2007; Cloutier, Mason, & Macrae, 2005), recog-nize their emotional expressions (Esteves &Öhman, 1993),and make a variety of social judgments such as aggres-siveness (Bar, Neta, & Linz, 2006) and trustworthiness(Todorov, Pakrashi, & Oosterhof, 2009). This informationis extracted rapidly and affects social interactions (Todorov,Mende-Siedlecki, & Dotsch, 2013).
Not surprisingly, faces are one the most studied cate-gories of stimuli in psychology (Calder, Rhodes, Johnson,& Haxby, 2011). In cognitive neuroscience, faces haveserved as a key tool for understanding the brain, andthe neural underpinnings of face perception have been
a focal point of ongoing debates about the nature ofbrain representations of high-level categories (see Haxbyet al., 2001, 2011; Kanwisher, 2010; Scherf, Behrmann,Humphreys, & Luna, 2007; Bukach, Gauthier, & Tarr,2006; Kanwisher & Yovel, 2006). As a result of this re-search, we know that there is a well-established posteriornetwork of cortical regions contributing to face perception(Freiwald & Tsao, 2012; Haxby & Gobbini, 2012; Kanwisher& Barton, 2012; Nestor, Plaut, & Behrmann, 2011; Said,Haxby, & Todorov, 2011; Turk-Browne, Norman-Haignere,& McCarthy, 2010; Pinsk et al., 2009; Fairhall & Ishai, 2007;Kanwisher & Yovel, 2006; Pinsk, DeSimone, Moore, Gross,& Kastner, 2005; Haxby, Hoffman, & Gobbini, 2000). Theseregions include the fusiform face area (FFA; Tong,Nakayama, Moscovitch, Weinrib, & Kanwisher, 2000;Kanwisher, McDermott, & Chun, 1997; McCarthy, Puce,Gore, & Allison, 1997), the occipital face area (OFA;Gauthier, Skudlarski, Gore, & Anderson, 2000; Puce,Allison, Asgari, Gore, & McCarthy, 1996), and a region inthe posterior STS (pSTS; Allison, Puce, & McCarthy, 2000;Puce et al., 1996), although there is recent evidence that thisorganization may be more fine-grained with multiple face-selective patches (Freiwald & Tsao, 2012; Weiner & Grill-Spector, 2010, 2012; Rajimehr, Young, & Tootell, 2009).Although the specific functions ascribed to individualregions are still debated, they all show stronger responsesto faces than to other categories of stimuli. Hence, theseregions have been characterized as face selective.However, we argue that this view of the neural under-
pinnings of face perception is limited in scope and misses
1Princeton University, 2Harvard University, 3Radboud UniversityNijmegen
© 2013 Massachusetts Institute of Technology Journal of Cognitive Neuroscience 25:12, pp. 2086–2106doi:10.1162/jocn_a_00469

a critical subcortical node, the amygdala. In models of theneural basis of face perception, if the amygdala is men-tioned at all, it is accorded a secondary role at best, alongwith a host of other regions (e.g., Haxby & Gobbini,2012; Haxby et al., 2000), although there are many stud-ies implicating amygdala in face processing. In fact, meta-analyses of functional neuroimaging studies show thatfaces are one of the most potent stimuli for eliciting amyg-dala responses (Costafreda, Brammer, David, & Fu, 2008;Sergerie, Chochol, & Armony, 2008). Yet, the amygdalaand its subnuclei have not been characterized as generallyface selective and on equal footing with regions like theFFA, OFA, or pSTS.Here, using functional localizer data from 215 partici-
pants, we test the hypothesis that the amygdala showsrobust selectivity for faces—selectivity that does not re-quire processing of emotional expressions. Before we de-scribe the methods and findings, we consider reasonswhy past studies may have failed to characterize theamygdala as face selective and review evidence support-ing the role of the amygdala in face processing. On thebasis of this review and our findings, we argue the amyg-dala should be accorded a central role in face processing.
Single-unit Studies on Face Selectivity
In the 1970s, Gross et al. incidentally stumbled upon ahand-selective neuron while trying to characterize thebasic visual properties of neurons in inferior temporal(IT) cortex (Gross, Rocha-Miranda, & Bender, 1972). Inthe same article, they mentioned that for some units “com-plex colored patterns (e.g., photographs of faces, trees)were more effective than the standard stimuli.” The firstformal description of face-selective neurons was publishedin 1981 (Bruce, Desimone, & Gross, 1981; see also Perrett,Rolls, & Caan, 1982). Ten years later, the existence of suchneurons was firmly established (Desimone, 1991). Recentstudies combining fMRI and single-unit recording in mon-keys have found patches in temporal cortex almost entirelypopulated with face-selective neurons (Tsao, Freiwald,Tootell, & Livingstone, 2006).In parallel with single-unit recording studies that have
identified face-selective neurons in temporal cortex(Desimone, 1991), studies have also identified such neu-rons in the amygdala (Gothard, Battaglia, Erickson, Spitler,& Amaral, 2007; Kuraoka & Nakamura, 2006; Wilson &Rolls, 1993; Nakamura, Mikami, & Kubota, 1992; Leonard,Rolls, Wilson, & Baylis, 1985; Rolls, 1984; Perrett et al.,1982; for a review, see Rolls, 2000). In fact, as early as1979, visual neurons in the amygdala responsive to faceswere reported (Sanghera, Rolls, & Roper-Hall, 1979).Importantly, a high-resolution fMRI study in monkeysfound greater activation in the amygdala to images ofmonkey faces and bodies than to their scrambled versions(Logothetis, Guggenberger, Peled, & Pauls, 1999). A laterhigh-resolution fMRI study from Hoffman and colleaguesobserved similar face-selective responses within the
amygdala and moreover observed that dissociable aspectsof face stimuli activated separate subnuclei within theamygdala (Hoffman, Gothard, Schmid, & Logothetis, 2007).
Findings of face-selective neurons in the monkey amyg-dala have been generalized to humans in studies ofpatients undergoing treatment for epilepsy (Rutishauseret al., 2011; Viskontas, Quiroga, & Fried, 2009; Quiroga,Reddy, Kreiman, Koch, & Fried, 2005; Kreiman, Koch, &Fried, 2000; Fried, MacDonald, & Wilson, 1997). Consis-tent with these single-unit studies, a recent study record-ing intracranial field potentials in the amygdalae ofsix patients showed stronger gamma-band activity to facesthan to houses and scrambled faces (Sato et al., 2012; seealso Pourtois, Spinelli, Seeck, & Vuilleumier, 2010).Despite these findings, the amygdala is not consideredto contain large populations of face-selective neuronson par with face-selective patches in IT cortex and STS.
Functional Neuroimaging Studies onFace Selectivity
Consistent with the single-unit findings, PET studies ofhumans in the 1990s found face-sensitive patches of cor-tex in fusiform and IT regions (Haxby et al., 1993; Sergent,Ohta, & MacDonald, 1992). Similarly, electrophysiologicalstudies recording from the same regions in epilepticpatients found negative potentials (N200) evoked by faces(Allison, Ginter, et al., 1994; Allison, McCarthy, Nobre,Puce, & Belger, 1994). Subsequently, fMRI studies pio-neered the functional localizer approach (Kanwisheret al., 1997; McCarthy et al., 1997), in which responsesto faces were compared with responses for a variety ofobjects from other visual categories (e.g., houses) toidentify face-selective BOLD responses. The first regionidentified in this approach was the FFA. A recent meta-analysis of face localizer studies showed that the FFAcan be reliably identified in individual participants andits location is robust with respect to task demands andcontrol visual categories (Berman et al., 2010). As men-tioned above, the OFA and the face-selective pSTS canbe consistently identified across most participants as well.These three regions—FFA, OFA, and pSTS—comprise thecore system for perceptual analysis of faces (Haxby &Gobbini, 2012; Said et al., 2011; Haxby et al., 2000).
Although fMRI localizer studies and neurophysiologicalstudies have relied on the same approach—presentingparticipants with stimuli from different categories (e.g.,faces, everyday objects, novel objects, etc.) and lookingfor voxels or neurons that show preference for one ormore categories—localizer studies have rarely labeled theamygdala as containing face-selective voxels (cf. Engell &McCarthy, 2013; Rossion, Hanseeuw, & Dricot, 2012). Asa result, the face selectivity of the amygdala has never beena topic of systematic research in humans.
We consider three interrelated reasons for this omis-sion in turn: (1) measurement limitations of fMRI, (2) lowstatistical power, and (3) theoretical biases. First, the
Mende-Siedlecki et al. 2087

amygdalaʼs small size and locationmake it difficult to imagebecause of a reduced signal-to-noise ratio relative to corticalregions (Zald, 2003; LaBar, Gitelman, Mesulam, & Parrish,2001). In fact, because of the generally low signal-to-noiseratio in fMRI, many early studies opted for partial coverageof the brain typically covering only occipital and temporalcortex (e.g., Kanwisher et al., 1997; Puce et al., 1996; Puce,Allison,Gore,&McCarthy, 1995). This is often the case evenfor new studies that strive to increase the spatial resolu-tion of the measurement in cortical regions (e.g., Weiner& Grill-Spector, 2013).
Second, functional localizer studies typically have lim-ited statistical power to detect face-selective voxels in theamygdala. There is tremendous variation in localizer datafrom individual brains (Figure 1). Whereas some partici-pants show only a few (and occasionally no) face-selectiveregions, others show more than a dozen. Typically, aresearcher would use a relatively stringent statisticalthreshold (e.g., p < .005) to identify the regions showingreliably stronger activation to faces than control cate-gories. Although this strategy is defensible, it penalizessmall subcortical regions. In fact, the number of face-selective neurons rarely exceeds 10% of the recordedneurons in the amygdala (Rutishauser et al., 2011; Viskontaset al., 2009; Quiroga et al., 2005; Kreiman et al., 2000; Friedet al., 1997), suggesting that there would be very few face-selective amygdala voxels (Todorov, 2012). This problem isfurther compounded by the fact that group analyses oflocalizer data are not typically performed to avoid corticalmisalignment. However, this increases measurement errorand reduces statistical power to detect face-selectiveregions outside the posterior network. The Berman et al.(2010) meta-analysis on face localizer studies included 49studies that were conducted onhealthy adults and reportedthe coordinates of the FFA and the localization task. Asdescribed in Todorov (2012), only nine of these studies
reported group analyses. Although only four of thesenine studies reported face-selective amygdala activation, adetailed inspection of the studies showed that the remain-ing five studies were statistically underpowered withsmall sample sizes and stringent statistical thresholds (fordetails, see Todorov, 2012). In other cases, researcherswould note that they observed amygdala activation inface localizer tasks but would not report the coordinatesor inspect further (Berman et al., 2010, p. 69; Jiang, Blanz,& OʼToole, 2009, p. 1085). There are also studies—notincluded in the Berman et al. meta-analysis—that reportgroup level activation for faces in the amygdala (Ishai,Schmidt, & Boesiger, 2005; Reinders, den Boer, & Büchel,2005; Blonder et al., 2004).Finally, in addition to measurement limitations and low
statistical power, theoretical biases may have further ob-structed the study of the face selectivity of the amygdala.Specifically, studies on category selectivity are often con-ducted by vision scientists who reasonably focus on visualcortex and have little a priori interest in the amygdala. Incontrast, most researchers who focus on the amygdalaare interested in affect and emotion and rarely interestedin the functions of visual cortex. In fact, fMRI studies onemotion occasionally use paradigms that look like local-izer studies—comparing faces with other visual categories(e.g., fearful faces vs. fearful scenes)—but the analysisrarely goes beyond subcortical regions and other puta-tively affective regions (e.g., Goossens et al., 2009; Hariri,Tessitore, Mattay, Fera, & Weinberger, 2002).
The Present Study
To overcome these challenges, we performed group ana-lyses of functional localizer data from 215 human partici-pants. These data were collected as part of 10 studies,using various behavioral tasks and visual control cate-
Figure 1. Sample data fromnine individual participants inthe Faces > Control localizercontrast. Face-selective activityis displayed at two uncorrectedone-tailed thresholds forvisualization purposes: p < .05(red) and p < .01 (yellow).Although the extent andintensity varies acrossparticipants, face-selectiveresponses could be observedin the amygdala for almost allparticipants at the morelenient level of thresholding.
2088 Journal of Cognitive Neuroscience Volume 25, Number 12

gories. Beyond the posterior network of cortical regionsobserved in prior studies, we found robust face-selectiveresponses in the amygdala. Because imaging parametersvaried across studies and this could affect the results, weperformed a conservative conjunction analysis across allstudies. This analysis again identified face-selective re-sponses in the amygdala, in addition to the FFA. Wevalidated these findings using the NeuroSynth platform(neurosynth.org), which automatically synthesizes theresults of numerous fMRI studies (Yarkoni, Poldrack,Nichols, Van Essen, & Wager, 2011).We also found that face-selective responses in the
amygdala are detectable in most individual participants,and we explored how this detectability varies as a func-tion of the initial statistical threshold. More stringentthresholds have a larger impact on the amygdala thanon the FFA, which we explain in terms of decreasedsignal-to-fluctuation-noise ratios (SFNRs) in the amygdalacompared with posterior cortical regions. To furthercharacterize the face-selective properties of the amyg-dala, we examine habituation across runs and compareit with other face-selective regions. The amygdala habitu-ates more rapidly than the FFA.In addition to these standard univariate analyses, we
conducted multivariate and connectivity analyses. Wefound that the pattern of responses across face-selectiveamygdala voxels has high reliability over time. Examiningthe covariance of these reliability scores across face-selective regions reveals separable cortical and subcor-tical face-processing networks. Finally, a psychophysio-logical interaction analysis shows stronger functionalconnectivity between the face-selective amygdala andposterior regions during the perception of faces com-pared with the perception of objects from other visualcategories.
METHODS
Participants
A total of 215 participants (85 men, 130 women) wererecruited to 10 separate studies conducted at PrincetonUniversity. Almost all participants were right-handed, sixwere left-handed. All participants had normal or corrected-to-normal vision and reported no neurological history.We obtained informed consent for participation using pro-tocols approved by the Institutional Review Board forHuman Subjects at Princeton University. Participants weredebriefed at study conclusion and compensated $20/hr.Some of the data sets have already been published for otherpurposes (Turk-Browne, Simon, & Sederberg, 2012; Verosky& Turk-Browne, 2012; Said, Dotsch, & Todorov, 2010).
Stimuli
The 10 studies used a variety of stimuli. All studiesincluded color photographs of faces with neutral expres-
sions and, as control visual object categories, eitherscenes, chairs, or flowers. Face photographs were ob-tained from several sources, including the FERET data-base (Phillips, Moon, Rizvi, & Rauss, 2000; Phillips,Wechsler, Huang, & Rauss, 1998), the NimStim face set(Tottenham et al., 2009), the Karolinska Directed Emo-tional Faces set (Lundqvist, Flykt, & Öhman, 1998), andprevious literature (Downing, Chan, Peelen, Dodds, &Kanwisher, 2006). Scene stimuli were collected fromweb resources, including the SUN data set (Xiao, Hays,Ehinger, Oliva, & Torralba, 2010). Chair and flower stim-uli were borrowed from a stimulus set used in a previousinvestigation of visual perception (Downing et al., 2006).
Procedure
The 10 studies also differed in terms of procedure. Forthe five faces versus scenes studies (n = 77; 45 women),participants were asked to judge whether faces weremale or female and whether scenes were indoors oroutdoors (judgment tasks). Twelve blocks of stimuliwere presented (six face blocks and six scene blocks),each containing 12 images. Each image was presentedfor 500 msec, separated by an ISI of 1000 msec. Partici-pants had a 1300-msec response window, which beganas soon as each image was presented. Each block ofimages was followed by 12 sec of rest. In four of thesestudies, participants completed only one localizer run,whereas the fifth study contained two localizer runs.Blocks were presented in alternating order, with a sceneblock first (n = 33) or a face block first (n = 22) in thefour studies with one localizer run, and block ordercounterbalanced in the one study with two localizer runs(n = 22).
For the four faces versus chairs studies (n = 120;75 women), participants were asked to judge whetherthe current face or chair was identical to the one thatimmediately preceded it (n-back tasks). Sixteen blocksof stimuli were presented (eight face blocks and eightscene blocks), each containing 20 images. Each imagewas presented for 350 msec, followed by 400 msec ofresponse time window. Four blocks were presented ina row, followed by 15 sec of rest, after which the nextset of blocks would begin. Within these smaller sets ofblocks, category order was counterbalanced betweenparticipants. For half of these participants, the blockorder for the first block was face–chair–face–chair,whereas the next blockʼs order was chair–face–chair–face. The other half of these participants received theopposite ordering.
For the faces versus flowers study (n= 18; 10 women),participants were asked to judge whether the currentface or flower was identical to the one that immediatelypreceded it. Aside from the control stimulus category,parameters and timing for this study were identical tothe faces versus chairs studies.
Mende-Siedlecki et al. 2089

Imaging Parameters
All participants were scanned on a Siemens 3.0-T Allegrahead-dedicated scanner (Siemens, Erlangen, Germany)with a volume head coil at Princeton University. For138 participants, functional data were acquired with aT2*-weighted EPI sequence and a resolution of 3 × 3 ×4 mm (repetition time [TR] = 2000 msec, echo time[TE] = 30 msec, flip angle = 80°, matrix = 64 × 64,slices = 32). In addition, a high-resolution anatomicalimage was acquired with a T1-weighted MPRAGE sequenceand a resolution of 1 × 1 × 1 mm (TR = 2500 msec, TE =4.3 msec, flip angle = 8°, matrix = 256 × 256, slices =160) for registration and normalization.
An additional 77 participants were scanned with differ-ent parameters, where functional data were acquiredwith EPI at a resolution of 3.5 × 3.5 × 5 mm (TR =1500 msec, TE = 28 msec, flip angle = 64°, matrix =64 × 64, slices = 26). The same high-resolution MPRAGEimage as above was acquired for registration and normal-ization. In addition, for 55 of these participants, a co-planar T1-weighted FLASH image with a resolution of0.875 × 0.875 × 5 mm (TR = 400 msec, TE = 4.6 msec,flip angle = 90°, matrix = 256 × 256, slices = 26) wasacquired.
Imaging Analyses
Data were analyzed using FSL 4.1 and FMRIB softwarelibraries (Analysis Group, FMRIB, Oxford, UK). The firstseveral EPI volumes from each run were discarded toallow T1 equilibrium (the exact number varied by studyfrom 3 to 6 volumes). Data were corrected for sliceacquisition time and head motion, high-passed filteredwith a period cutoff of 128 sec, spatial smoothing witha 4-mm FWHM Gaussian kernel. Functional runs wereregistered to the high-resolution anatomical scan andsubsequently normalized into Montreal NeurologicalInstitute (MNI) space. A coplanar anatomical scan wasused as an intermediate step when available.
In the first level of analysis, each localizer run was fitwith a general linear model (GLM) composed of boxcarregressors convolved with a canonical hemodynamicresponse function representing face and control blocks.The Face > Control contrast was calculated for eachlocalizer run by subtracting the corresponding parameterestimates. When two localizer runs were available for aparticipant, a second-level fixed-effects GLM was usedto combine these contrast maps from each run.
Finally, we performed a third-level group analysisacross the localizer data of all 215 participants. Contrastmaps that remained in participant space (participantswith only one localizer run) were first registered intostandard space. We then combined across all 215 datasets using a mixed-effects GLM (FLAME1 in FSL). Givenour unusually large sample size, we sought to thresholdthe resulting statistical maps as stringently as possible.
Consequently, we applied the strictest correction proce-dure in FSL, voxel-based Gaussian random field theorymaximum height thresholding (corrected familywisep < .05, one-tailed). This thresholding technique isanalogous to, but slightly less conservative than, theBonferroni correction. To ensure that the Face versusControl contrast reflected the modulation of a positiveresponse, the corrected statistical map was masked byanother map of all voxels that showed above-baselineresponses to either Face or Control blocks.
Amygdala ROI Definition
We sought to ensure that all responses associated withthe amygdala were extracted from a region that reflecteda canonical definition of the amygdala size and location inthe medial-temporal lobe. To accomplish this, we inter-sected the face-selective ROIs in right and left amygdalaobserved in our full group analyses with anatomicallydefined right and left amygdala ROIs, using the Harvard-Oxford Atlas. The areas of overlap in right and left amyg-dala were isolated, defined as new “trimmed” ROIs, andused in all subsequent ROI-based analyses (Figure 2).We performed the same process of intersection and defi-nition to create additional “trimmed” amygdala ROIs forthe reliability analyses, which were based on the groupanalysis restricted to multirun participants.
SFNR Analysis
We also tested whether the amygdala suffers from a weaksignal-to-noise ratio compared with posterior corticalareas, which would reduce sensitivity for detecting face-selective responses. Because face selectivity is definedas the difference in mean BOLD activity for face versuscontrol conditions in a voxel, the most relevant noiseterm is the variance of the activity over time within voxel.Thus, we calculated the voxelwise SFNR for all runs fromeach individual participant: SFNR = √[(temporal mean)2/(temporal variance)] (Friedman & Glover, 2006; Glover &Lai, 1998). We then extracted SFNR from anatomicallydefined ROIs by averaging over voxels in right and leftamygdala, as well as in fusiform cortex (for purposes ofcomparison), then averaged across runs for multirunparticipants. Comparisons of SFNR between ROIs wereperformed across all 215 participants using t tests.
Habituation Analyses
To assess the habituation of responses in each face-selective region, we restricted our analyses to the 119participants who completed two localizer runs. We firstran a group analysis on only the first run of data fromthese participants (corrected for multiple comparisonsas described above), yielding a set of face-selective func-tional ROIs. We assessed the mean response in each ROI
2090 Journal of Cognitive Neuroscience Volume 25, Number 12

during both the first and second run and performed aseries of t tests to test for significant habituation acrossthe two runs.
Psychophysiological Interaction Analyses
As an assay of functional connectivity, we performed aseries of psychophysiological interaction (PPI; Fristonet al., 1997) analyses on each face-selective ROI. Spe-cifically, we sought to identify which regions showedenhanced functional connectivity with each other duringthe presentation of faces, relative to the presentation ofcontrol stimuli.Before our analyses, we extracted the full average
time course across each ROI, for each participant. Next,in the first level of analysis, we ran a GLM analysis thatincluded three regressors: (a) a psychological regressor,coding when faces and controls were presented duringthe task, convolved with a canonical hemodynamicresponse function; (b) a physiological regressor, theaverage time course across a given seed ROI; and (c)the interaction (product) between the psychologicaland physiological regressors. When two localizer runswere available for a participant, a second-level fixed-effects GLM was used to combine the resulting mapsfrom each run.Finally, we performed a third-level group analysis
across the PPI data of all 215 participants. The setupfor this full group analysis was identical to the setup ofthe full Faces > Controls group analysis discussed pre-viously. As this analysis was more exploratory than thefull localizer contrast, we examined these data at severallevels of thresholding: (a) uncorrected p< .01 (z= 2.3),(b) corrected p < .05 using cluster-mass correction(cluster forming threshold, z = 2.3), and (c) corrected
p < .05 using voxel-based correction. Using these threethresholds allows us to convey the robustness of theresults.
Reliability Analyses
Finally, to assess the reliability of responses for eachface-selective region, we again limited our analysis tothe 119 participants who completed two localizer runs.Having identified a set of functional ROIs displaying face-selective responses across these multirun participants, wethen used these ROIs to extract the patterns of BOLDresponses across voxels for the first and second run ofeach participant.
The reliability of face selectivity for a given ROI andparticipant was calculated as the Pearson correlation be-tween these patterns. To the extent that the pattern ofactivation in an ROI is category specific, this correlationshould be positive. The resulting correlation coefficientswere Fisher-transformed and tested for whether theywere greater than zero with one-sample t tests (one-tailed). Paired t tests (one-tailed) were used to assesswhether these correlations were also greater than thereliability scores extracted from control regions in bi-lateral primary auditory cortex (A1), which were definedanatomically using the Harvard-Oxford Atlas. Thesecontrol ROIs were chosen because they are unlikely tobe involved in face processing and thus provide anempirical baseline for various analyses.
To assess functional relationships between regions,we tested for significant correlations between reliabilityscores in each possible pairing of ROIs. To the extentthat two regions are functionally related, high reliabilityin one region for a given participant might predict highreliability in the other region for that participant, and we
Figure 2. Definition ofamygdala ROIs. All ROI-basedanalyses in amygdala wereconducted using a regiondefined as the intersection(purple) of functionallydefined amygdala ROIsfrom the full group analysis(blue) and anatomicallydefined amygdala ROIs takenfrom the Harvard-OxfordAtlas (red).
Mende-Siedlecki et al. 2091

should observe a positive correlation between reliabilityscores across participants. Specifically, we computedcorrelations of reliability scores of each participantbetween every possible pairing of ROIs, including con-trol ROIs, for comparison. Finally, we submitted thesereliability scores to a PCA. Extraction of componentswas followed by a Varimax rotation with Kaiser normal-ization. Only the first two components displayed eigen-values greater than 1, and as such, only these componentswere included in the rotation.
RESULTS
Identifying Face-selective ROIs
Our full analysis (n = 215) revealed face-selective BOLDresponses (Faces > Control, corrected p < .05) in pos-terior brain regions, including bilateral FFA, right STS,and right OFA. Importantly, we found several additionalregions not typically observed in single-participant locali-zer analyses, including bilateral amygdala, right dorso-lateral pFC (dlPFC), and superior colliculus (SC), aswell as smaller activations in anterior temporal lobe,precentral gyrus, and hippocampus (Figure 3A–C; seeTable 1 for specific coordinates). A conjunction analysis,
in which the minimum statistic across the behavioraltasks of the component studies was assigned to eachvoxel, showed that the face selectivity of bilateral FFA,bilateral amygdala, and right pSTS were robust withrespect to task constraints (Table 2).To assess differential responses between tasks, we per-
formed separate group analyses within task type. Withinn-back tasks, we observed face-selective responses in SC,dlPFC, ACC, and bilateral anterior insula that were notobserved in participants in judgment tasks. Conversely,within judgment tasks, we observed face-selective re-sponses in anterior temporal lobe that were not observedin participants in n-back tasks.
Figure 3. Full group analysis and NeuroSynth “replication.” (A–C)Hot colors denote greater BOLD responses to face vs. control stimuli(n = 215, p < .05, corrected): bilateral amygdala, bilateral FFA, rightpSTS, right dlPFC, and right FFA. For validation, we report data obtainedfrom NeuroSynth, a tool for automatically synthesizing the results ofmultiple neuroimaging studies. (D–F) Results of a forward inferenceanalysis on the same slices, showing activation across the NeuroSynthdatabase for the term “face.” These maps indicate the consistency ofactivation for the term. (G–I) Results of a reverse inference analysison the same slices. These maps indicate the relative selectivity ofactivation for the term (see Yarkoni et al., 2011, for details).
Table 1. Regions Showing Face-selective BOLD Responses(Faces > Control) across All Participants (n = 215)
Region Hemi # Voxels x y z z Value
Amygdala R 281 20 −6 −20 12.9
Amygdala L 241 −20 −8 −18 11.8
Fusiform gyrus R 415 48 −52 −24 10
pSTS R 213 52 −42 6 8.07
Fusiform gyrus L 90 −44 −50 −24 7.95
dlPFC R 336 52 18 20 6.59
SC – 21 2 −32 −8 5.91
Anterior temporallobe
R 2 38 −2 −44 5.05
Hippocampus R 11 30 0 −40 4.91
Precentral gyrus R 9 52 0 44 4.88
OFA R 5 42 −82 −12 4.83
Hippocampus R 1 34 −20 −14 4.54
Group results thresholded using FSLʼs conservative voxel-based proce-dure (corrected for multiple comparisons, p < .05). Coordinates referto the peak voxel in MNI space. For each cluster, we report its hemi-sphere (Hemi), size in voxels (# Voxels), and z value at the peak voxel.
Table 2. Regions from Conjunction Analysis of Face Selectivity,Showing Independent Significance ( p < .05 Corrected) in Boththe n-back Task (n = 138) and Discrimination Task (n = 77)
Region Hemi # Voxels x y z z Value
Amygdala L 129 −18 −10 −18 7.87
Amygdala R 128 22 −8 −18 7.87
Fusiform gyrus R 95 48 −52 −24 6.92
pSTS R 46 50 −42 8 5.51
Fusiform gyrus L 6 −42 −50 −24 5.13
pSTS R 1 58 −58 8 4.57
Coordinates refer to the peak voxel in MNI space. For each cluster, wereport its hemisphere (Hemi), size in voxels (# Voxels), and theminimum z value across the two tasks at the peak voxel.
2092 Journal of Cognitive Neuroscience Volume 25, Number 12

In the overall analysis, we observed clusters of 281 and241 voxels in the vicinity of right and left amygdala,respectively, showing stronger responses to faces thanto control stimuli. As shown in Figure 2, these function-ally defined ROIs largely overlapped with an anatomicallydefined mask of the amygdala. For all subsequent ana-lyses, we use only those functionally defined voxels thatintersected with the anatomical amygdala mask.
External Validation
We capitalized on the framework of NeuroSynth (neuro-synth.org)—a tool for automatically synthesizing theresults of multiple neuroimaging studies (Yarkoni et al.,2011)—to test whether activation in the amygdala isassociated with face processing. Relying on a library of4393 fMRI studies, the platform creates interactive statis-tical brain maps for specific terms (over 2000) that arefrequently mentioned in neuroimaging articles. Theplatform performs two types of calculations, referred toas forward inference and reverse inference. The forwardinference maps show the likelihood of activation in aregion given the term. For the term “face,” the strongestactivations were centered in bilateral amygdalae and bi-lateral FFA (see Figure 3D–F). Almost all of the regionsdetected in our group analysis were also found in thisautomated analysis, including bilateral FFA, bilateralamygdala, right pSTS, and right dlPFC.The reverse inference maps show the likelihood that a
term is used in a study given the presence of activation.Thus, whereas the forward inference maps indicate the
consistency of activation for a specific term, the reverseinference maps indicate the relative selectivity of activa-tion for the term. As in the case of the forward inferencemaps, the strongest activations in the reverse inferencemaps were observed in bilateral amygdalae and FFA(see Figure 3G–I). At the same time, many of the activa-tions in other regions (e.g., dlPFC) were no longer pre-sent in the reverse inference maps, indicating that theiractivation is non-specific for faces. Importantly, all of theregions identified in our conjunction analysis (see Table 2)were also observed in the reverse inference maps.
Face Selectivity in Individual Participants
To assess whether face selectivity in the amygdala isdetectable in individual participants, we tabulated howmany individuals displayed face-selective responses inright and left amygdala-defined as any voxels showingFace > Control within the left and right anatomicalmasks of the amygdala (Table 3). We performed this cal-culation at three different uncorrected statistical thresh-olds ( p < .05, p < .01, and p < .001) to test how thestringency of the statistical threshold affects the like-lihood of detecting face-selective amygdala voxels inindividual brains (our motivation for this is that suchinformation may prove useful to researchers in futurestudies). For purposes of comparison, we also tabulatedface-selective responses in the more established nodes ofthe face processing network (right and left FFA, rightpSTS, and right OFA) as well as additional regions thatemerged in our full group analysis (right dlPFC and SC).
Table 3. Tabulation of Individual Participant Responses
ROI Hemi
A. % of ParticipantsPresenting Activation
in ROIB. Average % ofROI Activated
C. Average Maximumz Value
<.05 <.01 <.001 <.05 <.01 <.001 <.05 <.01 <.001
Amygdala R 86.5 63.3 41.9 23.3 10.9 4.6 3.37 3.83 4.32
Amygdala L 84.2 59.5 34.4 18.8 8.2 3.2 3.09 3.58 4.18
FFA R 99.1 96.3 93.0 34.8 25.6 17.8 7.11 7.26 7.44
FFA L 92.1 82.3 72.6 34.7 25.0 17.2 5.43 5.83 6.28
pSTS R 92.1 80.0 63.7 20.7 10.3 4.8 4.01 4.33 4.77
dlPFC R 78.6 59.5 34.9 15.8 7.7 3.2 3.21 3.63 4.27
SC – 32.1 17.2 6.5 10.8 4.8 1.5 2.56 3.11 3.92
OFA R 54.0 42.8 32.1 37.1 26.2 17.2 3.86 4.36 4.90
Primary auditory cortex R 56.3 25.6 7.4 4.5 1.3 0.2 2.50 2.92 3.54
Primary auditory cortex L 56.7 28.4 7.4 5.0 1.0 0.1 2.42 3.00 3.85
(A) Percentage of participants who displayed any face-selective voxels. (B) Extent of ROI activation, as measured by the number of face-selectivevoxels divided by the total number of voxels in the ROI. (Participants with subthreshold activity were coded as “0.”) (C) Average peak activity (z score)in participants presenting face-selective responses. For each metric, we present the data at three levels of thresholding ( p < .05, p < .01, and p <.001). (Participants with subthreshold activity were coded as “0.”) Data from control ROIs in right and left A1 are included for comparison.
Mende-Siedlecki et al. 2093

As shown in Table 3A, face-selective amygdala activitywas more strongly affected by increases in statisticalthreshold than face-selective activity in FFA. For example,although a large majority of participants displayed face-selective responses in the amygdala at a lenient thresholdof p < .05 (right: 86.5%, left: 84.2%), these responseswere substantially impacted by more stringent levels ofthresholding (at p < .01, right: 63.3%, left 59.5%; andp< .001, right: 41.9%, left 34.4%). In contrast, the percent-age of participants showing face-selective FFA responsesdecreased minimally at greater thresholds, especiallyright FFA ( p < .05: 99.1%, p < .01: 96.2%, p < .001:92.9%). This pattern was reflected in a significant inter-action between ROI (amygdala or FFA) and threshold( p = .05, p = .01, or p = .001), separately for both
right (F(2, 428) = 61.31, p < .001, ηp2 = .22) and left
ROIs (F(2, 428) = 31.08, p < .001, ηp2 = .13).This sensitivity to threshold may partly explain why the
amygdala is rarely a target of investigation in functionallocalizer studies, relative to the more stable FFA. None-theless, a greater percentage of participants displayedface-selective responses in the amygdala compared withright A1 ( p < .05: 56.3%, p < .01: 25.6%, p < .001: 7.4%)and left A1 ( p < .05: 56.7%, p < .01: 28.4%, p < .001:7.4%). These levels for A1 were significantly lower thanthose for the amygdala in both right and left hemispheres(one-tailed t tests at each threshold, all ps < .001).Moreover, we extracted the peak z value across voxels
in each ROI for each participant and calculated thegroup average across all participants. (For participants
Figure 4. Intensity and extent of face-selective responses in individual participants. For each ROI, histograms across all 215 participants of peakand proportion activation. Data were thresholded at uncorrected p < .01 (one-tailed). Peak activation graphs (red-to-yellow gradients in left panels)reflect the distribution of the maximum z value within each ROI for each participant, with participants showing only subthreshold activityrepresented by the bin at the far left of the x axis. Proportion activation graphs (purple-to-cyan gradients in right panels) reflect the percent ofvoxels in each ROI that showed above threshold face-selective activation. Although face-selective responses in right and left amygdala (A, B) were notas intense or extensive as those observed in right and left FFA (C, D), they were considerably more intense and extensive than the responsesobserved in the control regions defined anatomically in right and left A1 (E, F).
2094 Journal of Cognitive Neuroscience Volume 25, Number 12

with subthreshold activity, the peak z value was enteredas “0.”) Face-selective activations in right ( p < .05: z =2.98, p< .01: z= 2.54, p< .001: z= 1.98) and left amyg-dala ( p < .05: z = 2.59, p < .01: z = 2.08, p < .001: z =1.43) were more intense than those observed in right( p < .05: z = 1.36, p < .01: z = 0.77, p < .001: z =0.29) and left A1 ( p < .05: z = 1.42, p < .01: z = 0.83,p < .001: z = 0.26). Activations in A1 were significantlyless intense than those in the amygdala in both right andleft hemispheres (one-tailed t tests at each threshold, allps < .001).Finally, we calculated the proportion of voxels active
in each ROI compared with the total voxels present inthat ROI. (Once again, when calculating group averages,participants with subthreshold activity were assigned a“0.”) Face-selective activations in right ( p < .05: 23.3%,p < .01: 10.9%, p < .001: 4.6%) and left amygdala ( p <.05: 18.8%, p< .01: 8.2%, p< .001: 3.2%) was more wide-spread than those observed in right ( p < .05: 4.5%, p <.01: 1.3%, p < .001: 0.2%) and left A1 ( p< .05: 5.0%, p <.01: 1.0%, p < .001: 0.1%). Activations in A1 were signifi-cantly less extensive than those in the amygdala in bothright and left hemispheres (one-tailed t tests at eachthreshold, all ps < .001).We display comparisons between bilateral amygdala,
bilateral FFA, and bilateral A1 at the intermediate thresh-old of p < .01 in Figure 4 (activation intensity is pre-sented in red-to-yellow gradients, whereas activationextent is presented in purple-to-cyan gradients). For thefull details of average intensity and extent in each ROIand at each threshold, see Table 3 (sections B and C,respectively).The greater consequence of statistical thresholding for
the amygdala than other regions may be because of lowerSFNR in this region. To test this possibility, we comparedaverage SFNR extracted from anatomically defined ROIsin right and left amygdala and fusiform cortex. Pairedt tests (two-tailed) suggested that, across our sample,average SFNR was much greater in fusiform cortex (M =
149.95, SD = 31.74) than either right (M = 121.26, SD =32.16; t(214)=19.94, p<.001) or left amygdala (M=121.82,SD = 30.71; t(214) = 18.80, p < .001). SFNR did notdiffer between right and left amygdala (t(214) = 0.49,p = .627).
Habituation of Face-selective Responsesacross Runs
A meta-analysis of neuroimaging studies on the amygdalashows that the right amygdala rapidly habituates torepeated stimuli (Sergerie et al., 2008). We tested forthe habituation of face-selective responses across runs(i.e., decreases in responses to face stimuli comparedwith control stimuli from Runs 1 to 2 in multirun partici-pants) across the seven face-selective ROIs (see Table 4for means). Right and left amygdala showed significanthabituation from Run 1 to Run 2, as did SC, whereas rightdlPFC displayed only marginally significant habituation.Right and left FFA did not display significant habituationof face-selective responses, nor did right pSTS. The factthat we defined these regions as face-selective using onlythe first run might have biased us to find habituation inthe second run (simply because of regression to themean). However, given that certain regions did not habit-uate, including the most strongly responsive ones, therobust habituation observed in the amygdala is unlikelyto reflect a statistical artifact.
PPI Analysis
Our chief interest in the PPI analyses was identifyingregions that showed enhanced connectivity while faceswere presented, compared with when control stimuliwere presented. The right amygdala seed displayedface-specific connectivity with bilateral fusiform, as wellas right dlPFC and a large portion of primary visual cortex(cluster-based correction, p < .05; Figure 5A). At morelenient thresholds (uncorrected, p < .01, z = 2.3), right
Table 4. Habituation of Responses in Face-selective ROIs in Multirun Participants
ROI Hemi Run 1, Mean Percent Signal Change Run 2, Mean Percent Signal Change t Statistic
Amygdala R .079 (.078) .054 (.080) 2.99***
Amgydala L .077 (.080) .054 (.070) 2.90***
SC – .044 (.068) .025 (.084) 2.19**
dlPFC R .050 (.085) .034 (.098) 1.69*
pSTS R .054 (.097) .045 (.098) 0.94
FFA L .110 (.169) .103 (.158) 0.55
FFA R .134 (.167) .121 (.177) 0.49
*p < .10.
**p < .05.
***p < .01.
Mende-Siedlecki et al. 2095
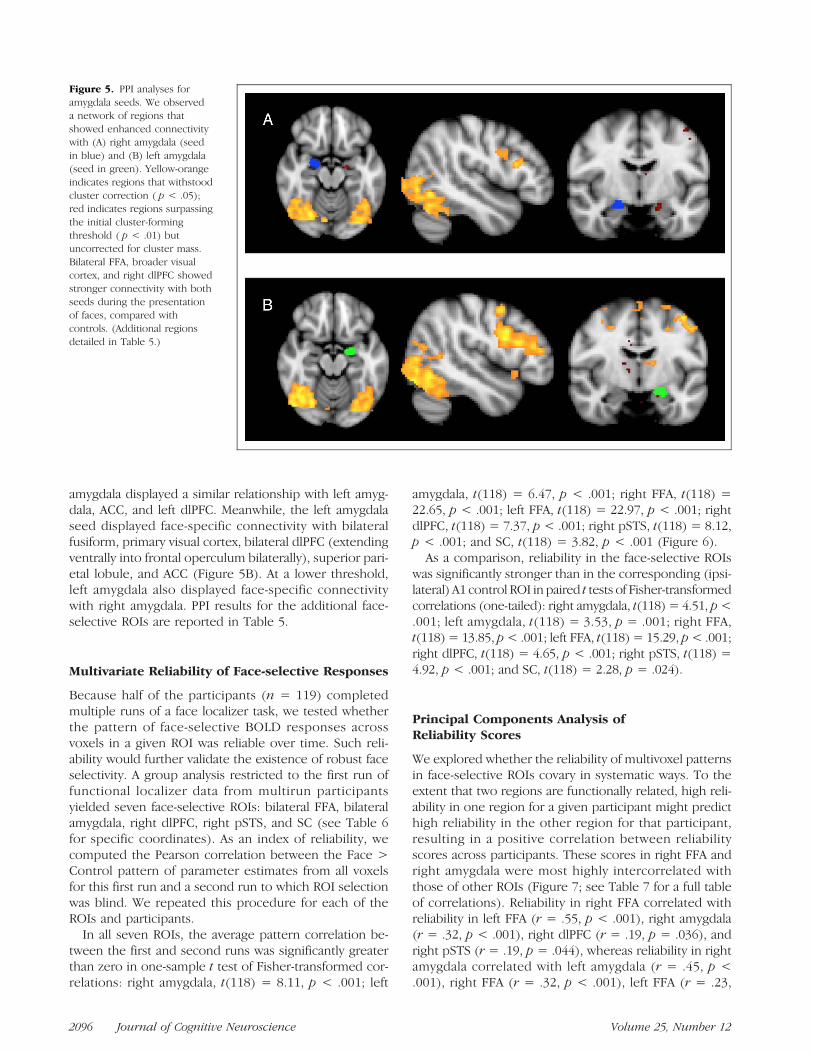
amygdala displayed a similar relationship with left amyg-dala, ACC, and left dlPFC. Meanwhile, the left amygdalaseed displayed face-specific connectivity with bilateralfusiform, primary visual cortex, bilateral dlPFC (extendingventrally into frontal operculum bilaterally), superior pari-etal lobule, and ACC (Figure 5B). At a lower threshold,left amygdala also displayed face-specific connectivitywith right amygdala. PPI results for the additional face-selective ROIs are reported in Table 5.
Multivariate Reliability of Face-selective Responses
Because half of the participants (n = 119) completedmultiple runs of a face localizer task, we tested whetherthe pattern of face-selective BOLD responses acrossvoxels in a given ROI was reliable over time. Such reli-ability would further validate the existence of robust faceselectivity. A group analysis restricted to the first run offunctional localizer data from multirun participantsyielded seven face-selective ROIs: bilateral FFA, bilateralamygdala, right dlPFC, right pSTS, and SC (see Table 6for specific coordinates). As an index of reliability, wecomputed the Pearson correlation between the Face >Control pattern of parameter estimates from all voxelsfor this first run and a second run to which ROI selectionwas blind. We repeated this procedure for each of theROIs and participants.
In all seven ROIs, the average pattern correlation be-tween the first and second runs was significantly greaterthan zero in one-sample t test of Fisher-transformed cor-relations: right amygdala, t(118) = 8.11, p < .001; left
amygdala, t(118) = 6.47, p < .001; right FFA, t(118) =22.65, p < .001; left FFA, t(118) = 22.97, p < .001; rightdlPFC, t(118) = 7.37, p < .001; right pSTS, t(118) = 8.12,p < .001; and SC, t(118) = 3.82, p < .001 (Figure 6).As a comparison, reliability in the face-selective ROIs
was significantly stronger than in the corresponding (ipsi-lateral) A1 control ROI in paired t tests of Fisher-transformedcorrelations (one-tailed): right amygdala, t(118) = 4.51, p<.001; left amygdala, t(118) = 3.53, p = .001; right FFA,t(118) = 13.85, p< .001; left FFA, t(118) = 15.29, p< .001;right dlPFC, t(118) = 4.65, p < .001; right pSTS, t(118) =4.92, p < .001; and SC, t(118) = 2.28, p = .024).
Principal Components Analysis ofReliability Scores
We explored whether the reliability of multivoxel patternsin face-selective ROIs covary in systematic ways. To theextent that two regions are functionally related, high reli-ability in one region for a given participant might predicthigh reliability in the other region for that participant,resulting in a positive correlation between reliabilityscores across participants. These scores in right FFA andright amygdala were most highly intercorrelated withthose of other ROIs (Figure 7; see Table 7 for a full tableof correlations). Reliability in right FFA correlated withreliability in left FFA (r = .55, p < .001), right amygdala(r = .32, p < .001), right dlPFC (r = .19, p = .036), andright pSTS (r = .19, p = .044), whereas reliability in rightamygdala correlated with left amygdala (r = .45, p <.001), right FFA (r = .32, p < .001), left FFA (r = .23,
Figure 5. PPI analyses foramygdala seeds. We observeda network of regions thatshowed enhanced connectivitywith (A) right amygdala (seedin blue) and (B) left amygdala(seed in green). Yellow-orangeindicates regions that withstoodcluster correction ( p < .05);red indicates regions surpassingthe initial cluster-formingthreshold ( p < .01) butuncorrected for cluster mass.Bilateral FFA, broader visualcortex, and right dlPFC showedstronger connectivity with bothseeds during the presentationof faces, compared withcontrols. (Additional regionsdetailed in Table 5.)
2096 Journal of Cognitive Neuroscience Volume 25, Number 12

p= .013), right pSTS (r= .21, p= .024), and SC (r= .22,p = .015). Reliability in all face-selective ROIs was uncor-related with reliability in A1 control ROIs, except for SCand right A1 (r = .19, p = .044).
Submitting these zero-order correlations to a PCA sug-gested two distinct sources of variance. Whereas the cor-tical regions of right and left FFA and right dlPFC loadedhighly on the first PC, the three subcortical regions (right
Table 5. Regions Showing Enhanced Connectivity with Face-selective ROIs (Faces > Control), across All Participants (n = 215)
Region Hemi # Voxels x y z z Value
Right Amygdala Seed
Primary visual cortex/fusiform gyrus R 4126 34 −84 6 5.01
Primary visual cortex/fusiform gyrus L 2335 −42 −66 −8 4.84
dlPFC R 409 46 18 18 3.92
Amygdala L 15 −20 −8 −16 2.69a
Left Amygdala Seed
Primary visual cortex/fusiform gyrus R 5514 36 −84 6 5.65
Primary visual cortex/fusiform gyrus L 3076 −40 −64 −10 4.86
dlPFC/frontal operculum/anterior insula R 2179 48 8 24 4.88
dlPFC L 857 −44 −8 56 4.19
ACC – 808 4 10 54 4.40
Intraparietal sulcus L 590 −36 −46 36 4.02
Frontal operculum/anterior insula L 149 −34 20 0 3.30
Cerebellum – 112 −32 −36 −34 3.32
Thalamus L 94 −14 −6 12 3.39
Amygdala R 8 28 2 −24 2.72a
Right FFA Seed
Bilateral primary visual cortex/bilateral fusiform gyrus – 4270 −14 −100 2 6.96
Left FFA Seed
Primary visual cortex/fusiform gyrus R 3100 36 −88 6 5.70
Primary visual cortex/fusiform gyrus L 2606 −20 −96 8 6.30
Right pSTS Seed
Primary visual cortex/fusiform gyrus R 5188 32 −82 2 6.35
Primary visual cortex/fusiform gyrus L 4384 −28 −92 6 6.03
dlPFC/frontal operculum/anterior insula R 738 −34 26 0 4.20
Right dlPFC Seed
Bilateral primary visual cortex/bilateral fusiform gyrus – 7994 34 −82 2 5.91
Intraparietal sulcus L 127 −28 −50 46 3.48
Amygdala L 120 −20 −2 −22 3.87
ACC – 85 −6 10 52 3.44
Group results thresholded using FSLʼs cluster-based procedure (corrected for multiple comparisons, p < .05). Coordinates refer to the peak voxel inMNI space. For each cluster, we report its hemisphere (Hemi), size in voxels (# Voxels), and z value at the peak voxel.aIndicates regions surpassing the initial cluster-forming threshold ( p < .01) but uncorrected for cluster mass.
Mende-Siedlecki et al. 2097
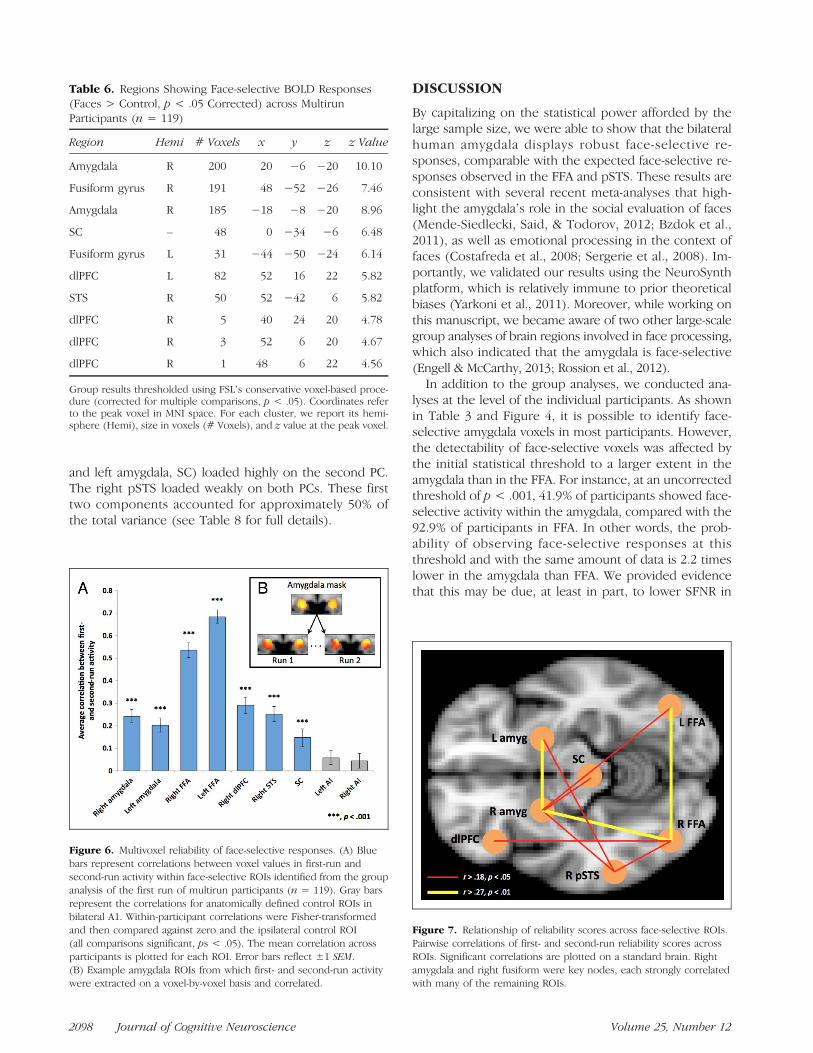
and left amygdala, SC) loaded highly on the second PC.The right pSTS loaded weakly on both PCs. These firsttwo components accounted for approximately 50% ofthe total variance (see Table 8 for full details).
DISCUSSION
By capitalizing on the statistical power afforded by thelarge sample size, we were able to show that the bilateralhuman amygdala displays robust face-selective re-sponses, comparable with the expected face-selective re-sponses observed in the FFA and pSTS. These results areconsistent with several recent meta-analyses that high-light the amygdalaʼs role in the social evaluation of faces(Mende-Siedlecki, Said, & Todorov, 2012; Bzdok et al.,2011), as well as emotional processing in the context offaces (Costafreda et al., 2008; Sergerie et al., 2008). Im-portantly, we validated our results using the NeuroSynthplatform, which is relatively immune to prior theoreticalbiases (Yarkoni et al., 2011). Moreover, while working onthis manuscript, we became aware of two other large-scalegroup analyses of brain regions involved in face processing,which also indicated that the amygdala is face-selective(Engell & McCarthy, 2013; Rossion et al., 2012).In addition to the group analyses, we conducted ana-
lyses at the level of the individual participants. As shownin Table 3 and Figure 4, it is possible to identify face-selective amygdala voxels in most participants. However,the detectability of face-selective voxels was affected bythe initial statistical threshold to a larger extent in theamygdala than in the FFA. For instance, at an uncorrectedthreshold of p < .001, 41.9% of participants showed face-selective activity within the amygdala, compared with the92.9% of participants in FFA. In other words, the prob-ability of observing face-selective responses at thisthreshold and with the same amount of data is 2.2 timeslower in the amygdala than FFA. We provided evidencethat this may be due, at least in part, to lower SFNR in
Table 6. Regions Showing Face-selective BOLD Responses(Faces > Control, p < .05 Corrected) across MultirunParticipants (n = 119)
Region Hemi # Voxels x y z z Value
Amygdala R 200 20 −6 −20 10.10
Fusiform gyrus R 191 48 −52 −26 7.46
Amygdala R 185 −18 −8 −20 8.96
SC – 48 0 −34 −6 6.48
Fusiform gyrus L 31 −44 −50 −24 6.14
dlPFC L 82 52 16 22 5.82
STS R 50 52 −42 6 5.82
dlPFC R 5 40 24 20 4.78
dlPFC R 3 52 6 20 4.67
dlPFC R 1 48 6 22 4.56
Group results thresholded using FSLʼs conservative voxel-based proce-dure (corrected for multiple comparisons, p < .05). Coordinates referto the peak voxel in MNI space. For each cluster, we report its hemi-sphere (Hemi), size in voxels (# Voxels), and z value at the peak voxel.
Figure 6. Multivoxel reliability of face-selective responses. (A) Bluebars represent correlations between voxel values in first-run andsecond-run activity within face-selective ROIs identified from the groupanalysis of the first run of multirun participants (n = 119). Gray barsrepresent the correlations for anatomically defined control ROIs inbilateral A1. Within-participant correlations were Fisher-transformedand then compared against zero and the ipsilateral control ROI(all comparisons significant, ps < .05). The mean correlation acrossparticipants is plotted for each ROI. Error bars reflect ±1 SEM.(B) Example amygdala ROIs from which first- and second-run activitywere extracted on a voxel-by-voxel basis and correlated.
Figure 7. Relationship of reliability scores across face-selective ROIs.Pairwise correlations of first- and second-run reliability scores acrossROIs. Significant correlations are plotted on a standard brain. Rightamygdala and right fusiform were key nodes, each strongly correlatedwith many of the remaining ROIs.
2098 Journal of Cognitive Neuroscience Volume 25, Number 12

the amygdala compared with posterior regions like thefusiform cortex. Investigators interested in exploringthe face-selective properties of the amygdala should thusconsider using more lenient statistical thresholds (andvalidating the results with other methods, such as MVPAor connectivity). We also found that the amygdalaresponse to faces habituated more rapidly than the FFAresponse. In localizer studies that average responsesacross multiple runs, this could disproportionatelyimpact the amygdala. At the same time, it is advisableto use multiple runs, as this allows for MVPA of the reli-ability of face-selective responses.
Connectivity Analysis
The PPI analyses showed that both the right and leftamygdala seeds displayed face-specific connectivity withbilateral fusiform gyri, as well as right dlPFC and a largeportion of visual cortex (Figure 5). These results dovetailwith animal work on anatomical connections betweenamygdala and IT cortex, as well as striate and extrastriatecortex (Amaral, Behniea, & Kelly, 2003; Amaral, Price,Pitkänen, & Carmichael, 1992). Moreover, these resultsare consistent with human diffusion tensor imagingwork, suggesting strong connectivity between amygdalaand early visual areas via direct, long-range projections(Avidan, Hadj-Bouziane, Liu, Ungerleider, & Behrmann,2013; Gschwind, Pourtois, Schwartz, van de Ville, &Vuilleumier, 2012; Pugliese et al., 2009; Catani, Jones,Donato, & Ffytche, 2003). They are also consistent withdynamic causal modeling work observing increasedcoupling between amygdala and FFA in response to emo-tional faces (Fairhall & Ishai, 2007). Taken in context, thePPI results further strengthen the hypothesis that theamygdala is a core region in the face processing system.
Reliability Analysis (MVPA)
Not only did the amygdala show stronger responses tofaces than to objects from other visual categories, butalso these responses were reliable over time, as indicatedby significant multivoxel correlations between first-runand second-run amygdala activity. These correlationswere significantly stronger than those in anatomicallydefined control regions. In fact, given the disadvanta-geous signal-to-noise ratio encountered when imagingsubcortical structures, the correlations between first-runand second-run activity in bilateral amygdala are likelysomewhat conservative estimates of reliability.
We observed several other nontraditional regions dis-playing face-selective responses as well, including SC and
Table 7. Reliability Correlations between Face-selective ROIs
Right Amygdala Left Amygdala Right FFA Left FFA Right dlPFC Right pSTS SC
Right amygdala – .446**** .317**** .226** .036 .207** .222**
Left amygdala – .149 .195** .109 .209** .179*
Right FFA – .550**** .192** .185** .044
Left FFA – .178* .125 .047
Right dlPFC – .122 −.024
Right pSTS – .019
SC –
*p < .10.
**p < .05.
***p < .01.
****p < .001.
Table 8. Loadings of First/Second Run Reliability Scores inFace-selective ROIs onto the First Two Principal Components(n = 119) Extracted from a Principal Components Analysis withVarimax Rotation
ROI Hemi Component 1 Component 2
FFA R .792*** .185*
FFA L .773*** .151
dlPFC R .545*** −.098
pSTS R .317*** .317***
Amygdala R .235* .759***
Amgydala L .157 .730***
SC – −.206 .628***
Explained variance 31.19% 17.59%
Factor loadings indicate the correlation of each ROIʼs reliability scorewith each principal component.
*p < .05.
**p < .01.
***p < .001.
Mende-Siedlecki et al. 2099

right dlPFC. The latter finding is consistent with a recentstudy showing face-selective responses in lateral pFC, pri-marily driven by the presence of eyes (Chan & Downing,2011; see also Engell & Haxby, 2007). However, theseregions did not survive the conjunction analysis acrosstask type and were not observed in the reverse inferencestatistical maps. Given the dlPFCʼs role in working mem-ory (Wagner, Maril, Bjork, & Schacter, 2001; Courtney,Petit, Maisog, Ungerleider, & Haxby, 1998; Cohen et al.,1997) and the SCʼs contributions to visual attention(Sparks, 2002; Desimone & Duncan, 1995; Sprague,1991; Posner & Peterson, 1990; Lee, Rohrer, & Sparks,1988), the activity in these regions may be reflective ofparticular aspects of the stimuli or task that are not spe-cific to faces, but still different from the control cate-gories. Ultimately, we remain agnostic as to whetherthese other obtained regions are truly face selective aswell, because the amygdala is the focus of the currentwork.
The results of the PCA are suggestive of separate cor-tical and subcortical streams of face processing, with theright fusiform and right amygdala serving as primarynodes, respectively. However, as these results are ulti-mately correlational, this dissociation is speculative atpresent, although thematically consistent with priorresearch (Garrido, Barnes, Sahani, &Dolan, 2012; deGelder,van Honk, & Tamietto, 2011; Santos, Mier, Kirsch, & Meyer-Lindenberg, 2011; Williams et al., 2006). Future work shouldexplore this possibility more explicitly. Nevertheless, therobustness and reliability of the face-selective amygdalaresponse that we observed suggests that the amygdalamay play a central role in face processing as part of anextended network outside posterior visual areas (Todorov,2012; Said et al., 2011; Fairhall & Ishai, 2007; Haxby et al.,2000), providing some of the first evidence that sub-cortical regions can be specialized for high-level cognitiveprocesses.
The Role of the Amygdala in Face Processing
Here we showed that there are face-selective voxels inthe amygdala, at least according to standard criteria fordefining face-selective regions in the brain. The next gen-eration of questions should be about the computationalrole of the amygdala in face processing. Our findings sug-gest that the conventional view—that the main functionof the amygdala in this context is processing emotionalexpressions—is incomplete at best and inaccurate atworst. All of the faces that were used in the face localizerstudies here were emotionally neutral. Hence, emotionalexpressions are not a necessary condition to observeamygdala activation to faces. It is worth noting, however,that although the faces were neutral based on a standarddefinition, the neutrality of any given face can vary be-tween individuals (Somerville, Kim, Johnstone, Alexander,& Whalen, 2004). Moreover, even objectively neutral facesmay engage the amygdala because they provide a scaffold-
ing for previously encountered facial expressions (Whalen,Davis, Oler, Kim, Kim, & Neta, 2009).Regardless, our results add to the growing evidence
from neuroimaging studies that amygdala activation doesnot depend on emotional expressions per se. First,although early fMRI studies focused on the role of theamygdala in processing of fearful expressions (e.g., Whalenet al., 1998; Morris et al., 1996), many later studies ob-served amygdala responses not only to fearful but also toother emotional expressions, including positive expres-sions (e.g., Sergerie et al., 2008; Pessoa, Japee, Sturman,& Ungerleider, 2006; Winston, OʼDoherty, & Dolan, 2003;Yang et al., 2002). Second, meta-analyses of face evaluationstudies that typically use emotionally neutral faces showthat the amygdala is one of the most consistently activatedregions (Bzdok, Laird, Zilles, Fox, & Eickhoff, in press;Mende-Siedlecki et al., in press). Third, several studieshave reported nonlinear amygdala activation, with strongerresponses to both negatively valenced (i.e., untrustworthy-looking or unattractive) and positively valenced faces (i.e.,trustworthy-looking or attractive) than to neutral faces atthe middle of the continuum (Todorov, Said, Oosterhof,& Engell, 2011; Said et al., 2010; Said, Baron, & Todorov,2009; Winston, OʼDoherty, Kilner, Perrett, & Dolan, 2007).Fourth, amygdala responses have been observed to bizarrefaces (faces with inverted features; Rotshtein, Malach,Hadar, Graif, & Hendler, 2001) and to novel faces (Kosakaet al., 2003; Schwartz et al., 2003). These findings suggesta broader role of the amygdala in face processing.A promising approach is to use computational models
of face representation to probe the role of the amygdalain face processing. One of the best empirically supportedmodels is the norm-based model, according to whichfaces are represented as vectors in a multidimensionalface space centered on the average face (Rhodes &Leopold, 2012; Rhodes & Jeffery, 2006; Tsao & Freiwald,2006; Leopold, Rhodes, Müller, & Jeffery, 2005; Leopold,OʼToole, Vetter, & Blanz, 2001). Versions of these modelshave been successful in characterizing the social per-ception of faces (Todorov & Oosterhof, 2011; Walker &Vetter, 2009; Oosterhof & Todorov, 2008). In thesemodels,the distance from the average face is a critical variable.This distance maps onto the psychological dimension oftypicality, with more distant faces perceived as less typical.Interestingly, both single-unit recording and fMRI studieshave shown increased responses in face-selective regionsas a functionof thedistance from the average face (Leopold,Bondar, & Giese, 2006; Loffler, Yourganov, Wilkinson, &Wilson, 2005; but see Davidenko, Remus, & Grill-Spector,2011).Several studies have used faces generated by computa-
tional models of social judgments to test how neural re-sponses change as a function of the face variation alongthe respective model (Todorov et al., 2011; Said et al.,2010). All of these studies have observed U-shaped re-sponses in bilateral amygdala and fusiform gyri as thefaces become more extreme with respect to the average
2100 Journal of Cognitive Neuroscience Volume 25, Number 12
face (see Said et al., 2011). In these studies, the twoextremes typically correspond to positive (e.g., trustworthylooking) and negative (e.g., untrustworthy looking) faces.Hence, one interpretation is that the amygdala tracks theaffective salience of faces. However, two recent studiessuggest that it may track even more general face proper-ties (Mattavelli, Andrews, Asghar, Towler, & Young, 2012;Said et al., 2010). Specifically, these studies tested whetherthe amygdala and posterior face-selective regions respondto the distance from the average face per se (i.e., facetypicality), rather than to the positivity and negativity offaces. Both studies found that the amygdala and FFAtracked typicality, with stronger responses to atypical thantypical faces, and that these responses were not modulatedby valence.These findings help to account for both linear and
nonlinear responses to faces in the amygdala (Todorovet al., 2013), as well as stronger responses to bizarrefaces (Rotshtein et al., 2001), novel faces (Kosaka et al.,2003; Schwartz et al., 2003), and emotional expressions(Whalen et al., 2009). Moreover, the typicality hypothesisprovides a computationally parsimonious framework forthe development of face evaluation. The perception oftypicality is shaped over time through the statistical learn-ing of facial attributes, whereby more frequently seen facesshape what is perceived as “typical.” By definition, facesappearing atypical will be encountered less frequentlyand are therefore a greater source of uncertainty, com-pared with typical faces. For example, although the amyg-dala is typically thought of as responding to fearful facesbecause they signal an imminent threat (Adolphs, 2008;Whalen, 1998), some behavioral work suggests that thisresult can just as easily be explained by a relatively lowfrequency of real-world experience with fearful faces(Somerville & Whalen, 2006).The amygdala is an excellent candidate for monitoring
this kind of stimulus—rare and unpredictable, bearingmotivational significance for an individual—given its recip-rocal connections with IT cortex and back-projections tostriate and extrastriate cortex (Amaral et al., 1992, 2003).This proposal is consistent with animal work demon-strating the role of the amygdala in the regulation ofattention (Davis & Whalen, 2001; Gallagher, 2000; Holland& Gallagher, 1999). Specifically, the amygdala has an excit-atory influence on sensory neurons in cortical regions viapathways connecting the amygdala and the nucleus basalisof Meynert (located in the substantia innominata) andsubsequent cholinergic projections from the nucleus bas-alis of Meynert to the cortex (Whalen, 1998; Kapp, Whalen,Supple, & Pascoe, 1992). Within this framework, amygdalaresponses can ultimately serve to facilitate responses ofneurons in sensory regions (for instance, visual cortex).Along the same lines, Vuilleumier (2005) later argued thatthe amygdala regulates attention in a bottom–up fashion:Unexpected and unpredictable stimuli can elicit responsesin amygdala, which subsequently, may act to bias attentiontoward those stimuli. In the context of face evaluation and
perception, the role of the amygdala may be to regulateattention toward atypical faces.
Subsequent to face processing in posterior regions (e.g.,the FFA), atypical and/or unexpected faces could driveamygdala activity, potentially further augmenting re-sponses in posterior regions to these faces via feedbackprojections. Not only is this account in line with recent con-ceptualizations of the amygdala with respect to vigilance(Whalen, 2007) and the detection of salient or motivation-ally relevant stimuli (Adolphs, 2010; Sander, Grafman, &Zalla, 2003), but it is also in line with a myriad of morespecific findings across a host of domains, including vision(Sabatinelli, Bradley, Fitzsimmons, & Lang, 2005), olfaction(Anderson et al., 2003), gustation (Small et al., 2003), andaudition (Bach et al., 2008; Herry et al., 2007). We acknowl-edge the speculative nature of this framework at this junc-ture. However, the present research opens the door to ahost of more specific questions about the computationalrole of the amygdala in face processing.
Caveats and Future Directions
Although this study offers substantial evidence that theamygdala possesses face-selective properties, many openquestions remain. First and foremost, it is important tonote that the amygdala is composed of at least 13 indi-vidual subnuclei, each of which has distinct functionalityand connectivity (Freese & Amaral, 2005, 2006, 2009;Aggleton, 2000). Moreover, in the context of face process-ing, research has demonstrated that separate subnucleiare involved in processing dissociable aspects of facestimuli (Hoffman et al., 2007). Because of spatial resolu-tion constraints, it is difficult to precisely identify whichsubnuclei might be displaying face-selective responsesacross our group analysis. Indeed, the amygdala ROIobserved in that analysis encompasses almost the entireamygdala. That said, we note that the peak area of activitywithin the amygdala includes portions of the central,medial, and basal nuclei of the amygdala. Future workshould attempt to pinpoint the precise locus of face-selective responses within the amygdala potentially throughthe use of diffusion tensor imaging (Bach, Behrens, Garrido,Weiskop, &Dolan, 2011; Saygin, Osher, Augustinack, Fischl,& Gabrieli, 2011; see also Bzdok et al., in press, for a meta-analytic method of parcellating the human amygdala).
Along the same lines, it will be important to addresswhat differentiates face-selective regions in the amygdalafrom other regions in the brain with face-selective prop-erties, such as FFA and pSTS. Similar patterns of faceselectivity could reflect vastly different underlying neuro-nal selectivity. For example, in the primate literature,face-selective neurons in the amygdala have been foundintermingled with neurons that do not show selectivityfor faces (Fried et al., 1997; Nakamura et al., 1992;Sanghera et al., 1979), whereas face-selective regions inposterior regions are, by and large, entirely composed
Mende-Siedlecki et al. 2101

of face-selective neurons (e.g., the middle face patch inTsao et al., 2006).
One criticism of studies that focus on face selectivity isthat, even if a region displays robust responses to facescompared with control stimuli, there may always be someuntested stimulus class that evokes even stronger re-sponses in that region than faces. Beyond this generalcritique, this study also does not identify the specificfunction of the amygdala in face processing. Face-selective amygdala responses may reflect visual proper-ties of faces per se, differences in attention provokedby faces, the social meaning inherent in faces, or somecombination of these possibilities. It is also importantto stress that the current study in no way suggests thatthe amygdalaʼs duties are limited to the domain of faces.Rather, we have provided evidence that the amygdalaresponds preferentially to faces over other categoriesand thus has relative selectivity for faces during objectperception.
We established face selectivity using the same criteriathat are applied when examining posterior cortical areas.By generalizing across 10 separate studies, we have takena first step toward showing that responses in the amygdalato faces occur irrespective of control category, imagingparameters, and task constraints. Additional research isneeded to clarify the precise nature and anatomical loca-tion of face-specific computations within the amygdala.
Conclusions
The present research adds to a growing compendium ofevidence reframing the role of the amygdala in social per-ception (Todorov, 2012; Adolphs, 2010; Cunningham,Van Bavel, & Johnsen, 2008; Sander et al., 2003). Theseaccounts cast the amygdala as a “relevance detector,” ameans of directing attention based on motivational orcontextual significance. The robust amygdala responseto faces observed in this large-scale group analysis isconsistent with this account—faces are powerful socialstimuli to which we, as social animals, must be attentive.Moreover, our findings suggest that the human amygdalacontains populations of neurons specialized for process-ing one of the most relevant social stimuli—the faces ofconspecifics.
Acknowledgments
We thank Alexa Tompary for assistance in locating data andimaging parameters for studies included in our data set as wellas advice on FSL procedures. We also thank Chris Said, RonDotsch, and Hillel Aviezer for making their localizer data avail-able to us. This research was supported by National ScienceFoundation grant BCS-0823749 to A. T., National Institutes ofHealth grant R01EY021755 to N. B. T.-B., and National ScienceFoundation grant DGE 1148900 to P. M.-S.
Reprint requests should be sent to Alexander Todorov, Depart-ment of Psychology, Princeton University, Princeton, NJ 08540,or via e-mail: [email protected].
REFERENCES
Adolphs, R. (2008). Fear, faces, and the human amygdala.Current Opinion in Neurobiology, 18, 166–172.
Adolphs, R. (2010). What does the amygdala contribute to socialcognition? Annals of the New York Academy of Sciences,1191, 42–61.
Aggleton, J. P. (2000). The amygdala: A functional analysis.Oxford, UK: Oxford University Press.
Allison, T., Ginter, H., McCarthy, G., Nobre, A. C., Puce, A.,Luby, M., et al. (1994). Face recognition in human extrastriatecortex. Journal of Neurophysiology, 71, 821–825.
Allison, T., McCarthy, G., Nobre, A. C., Puce, A., & Belger, A.(1994). Human extra striate visual cortex and the perceptionof faces, words, numbers, and colors. Cerebral Cortex, 4,544–554.
Allison, T., Puce, A., & McCarthy, G. (2000). Social perceptionfrom visual cues: Role of the STS region. Trends in CognitiveSciences, 4, 267–278.
Amaral, D. G., Behniea, H., & Kelly, J. L. (2003). Topographicorganization of projections from the amygdala to the visualcortex in the macaque monkey. Journal of Neuroscience,118, 1099–1120.
Amaral, D. G., Price, J. L., Pitkänen, A., & Carmichael, S. T.(1992). Anatomical organization of the primate amygdaloidcomplex. In J. P. Aggleton (Ed.), The amygdala:Neurobiological aspects of emotion, memory, and mentaldysfunction (pp. 1–66). New York: Wiley-Liss.
Anderson, A. K., Christoff, K., Stappen, I., Panitz, D.,Ghahremani, D. G., Glover, G., et al. (2003). Dissociatedneural representations of intensity and valence in humanolfaction. Nature Neuroscience, 6, 196–202.
Avidan, G., Hadj-Bouziane, F., Liu, N., Ungerleider, L., &Behrmann, M. (2013). Selective dissociation between coreand extended regions in the face processing network incongenital prosopagnosia. Cerebral Cortex. doi:10.1093/cercor/bht007.
Bach, D. R., Behrens, T. E., Garrido, L., Weiskop, N., & Dolan,R. J. (2011). Deep and superficial amygdala nuclei projectionsrevealed in vivo by probabilistic tractography. The Journal ofNeuroscience, 31, 618–623.
Bach, D. R., Grandjean, D., Sander, D., Herdener, M., Strik,W. K., & Seifritz, E. (2008). The effect of appraisal level onprocessing of emotional prosody in meaningless speech.Neuroimage, 42, 919–927.
Bar, M., Neta, M., & Linz, H. (2006). Very first impressions.Emotion, 6, 269–278.
Berman, M. G., Park, J., Gonzalez, R., Polk, T. A., Gehrke, A.,Knaffla, S., et al. (2010). Evaluating functional localizers:The case of the FFA. Neuroimage, 50, 56–71.
Blonder, L. X., Smith, C. D., Davis, C. E., Kesler-West, M. L.,Garrity, T. F., Avison, M. J., et al. (2004). Regional brainresponse to faces of humans and dogs. Cognitive BrainResearch, 20, 384–394.
Bruce, C., Desimone, R., & Gross, C. G. (1981). Visual propertiesof neurons in a polysensory area in superior temporal sulcusof the macaque. Journal of Neurophysiology, 46, 369–384.
Bukach, C. M., Gauthier, I., & Tarr, M. J. (2006). Beyond facesand modularity: The power of an expertise framework.Trends in Cognitive Sciences, 10, 159–166.
Bzdok, D., Laird, A. R., Zilles, K., Fox, P. T., & Eickhoff, S. B. (inpress). An investigation of the structural, connectional, andfunctional subspecialization in the human amygdala. HumanBrain Mapping. doi:10.1002/hbm.22138.
Bzdok, D., Langner, R., Caspers, S., Furth, F., Habel, U., Zilles,K., et al. (2011). ALE meta-analysis on facial judgments oftrustworthiness and attractiveness. Brain Structure &Function, 215, 209–233.
2102 Journal of Cognitive Neuroscience Volume 25, Number 12

Calder, A. J., Rhodes, G., Johnson, M. H., & Haxby, J. V. (2011).The Oxford handbook of face perception. Oxford, UK:Oxford University Press.
Catani, M., Jones, D. K., Donato, R., & Ffytche, D. H. (2003).Occipito-temporal connections in the human brain. Brain,126, 2093–2107.
Chan, A. W., & Downing, P. E. (2011). Faces and eyes in humanlateral prefrontal cortex. Frontiers in Human Neuroscience,5, 51.
Cloutier, J., Mason, M. F., & Macrae, C. N. (2005). Theperceptual determinants of person construal: Reopening thecognitive toolbox. Journal of Personality and SocialPsychology, 88, 885–894.
Cohen, J. D., Perlstein, W. M., Braver, T. S., Nystrom, L. E., Noli,D. C., Jonides, J., et al. (1997). Temporal dynamics of brainactivation during a working memory task. Nature, 386,604–608.
Costafreda, S. G., Brammer, M. J., David, A. S., & Fu, C. H. Y.(2008). Predictors of amygdala activation during the processingof emotional stimuli: A meta-analysis of 385 PET and fMRIstudies. Brain Research Reviews, 58, 57–70.
Courtney, S. M., Petit, L., Ungerleider, L. G., Maisog, J. M., &Haxby, J. V. (1998). An area specialized for spatial workingmemory in human frontal cortex. Science, 279, 1347–1351.
Cunningham, W. A., Van Bavel, J. J., & Johnsen, I. R. (2008).Affective flexibility: Evaluative processing goals shapeamygdala activity. Psychological Science, 19, 152–160.
Davidenko, N., Remus, D., & Grill-Spector, K. (2011).Face-likeness and image variability drive responses inhuman face-selective ventral regions. Human BrainMapping, 33, 2334–2349.
Davis, M., & Whalen, P. J. (2001). The amygdala: Vigilanceand emotion. Molecular Psychiatry, 6, 13–34.
de Gelder, B., van Honk, J., & Tamietto, M. (2011). Emotion inthe brain: Of low roads, high roads and roads less travelled.Nature Reviews Neuroscience, 15, 425.
Desimone, R. (1991). Face-selective cells in the temporalcortex of monkeys. Journal of Cognitive Neuroscience, 3,1–8.
Desimone, R., & Duncan, J. (1995). Neural mechanisms ofselective visual attention. Annual Review of Neuroscience,18, 193–222.
Downing, P. E., Chan, A. W. Y., Peelen, M. V., Dodds, C. M., &Kanwisher, N. (2006). Domain specificity in visual cortex.Cerebral Cortex, 16, 1453–1461.
Engell, A. D., & Haxby, J. V. (2007). Facial expression andgaze-direction in human superior temporal sulcus.Neuropsychologia, 45, 3234–3241.
Engell, A. D., & McCarthy, G. (2013). Probabilistic atlases forface and biological motion perception: An analysis of theirreliability and overlap. Neuroimage, 74, 140–151.
Esteves, F., & Öhman, A. (1993). Masking the face: Recognitionof emotional facial expressions as a function of the parametersof backward masking. Scandinavian Journal of Psychology,34, 1–18.
Fairhall, S. L., & Ishai, A. (2007). Effective connectivity withinthe distributed cortical network for face perception. CerebralCortex, 17, 2400–2406.
Farroni, T., Johnson, M. H., Menon, E., Zulian, L., Faraguna, D.,& Csibra, G. (2005). Newbornsʼ preferences for face-relevantstimuli: Effects of contrast polarity. Proceedings of theNational Academy of Sciences, U.S.A., 102, 17245–17250.
Freese, J. L., & Amaral, D. G. (2005). The organization ofprojections from the amygdala to visual cortical areas TEand V1 in the macaque monkey. Journal of ComparativeNeurology, 486, 295–317.
Freese, J. L., & Amaral, D. G. (2006). Synaptic organization ofprojections from the amygdala to visual cortical areas TE
and V1 in the macaque monkey. Journal of ComparativeNeurology, 496, 655–667.
Freese, J. L., & Amaral, D. G. (2009). Neuroanatomy of theprimate amygdala. In P. J. Whalen & E. A. Phelps (Eds.), Thehuman amygdala (pp. 3–42). New York: The Guilford Press.
Freiwald, W., & Tsao, D. (2012). Taking apart the neuralmachinery of face processing. In A. Calder, G. Rhodes,M. Johnson, J. Haxby, & J. Keane (Eds.), Handbook of faceperception (pp. 707–719). Oxford, UK: Oxford University Press.
Fried, I., MacDonald, K. A., & Wilson, C. (1997). Single neuronactivity in human hippocampus and amygdala duringrecognition of faces and objects. Neuron, 18, 753–765.
Friedman, L., & Glover, G. H. (2006). Report on a multicenterfMRI quality assurance protocol. Journal of MagneticResonance Imaging, 23, 827–839.
Friston, K. J., Buchel, C., Fink, G. R., Morris, J., Rolls, E., &Dolan, R. (1997). Psychophysiological and modulatoryinteractions in neuroimaging. Neuroimage, 6, 218–229.
Gallagher, M. (2000). The amygdala and associative learning.In J. P. Aggleton (Ed.), The amygdala: A functional analysis(pp. 391–423). Oxford, UK: Oxford University Press.
Garrido, M. I., Barnes, G. R., Sahani, M., & Dolan, R. J. (2012).Functional evidence for a dual route to the amygdala.Current Biology, 22, 129–134.
Gauthier, I., Skudlarski, P., Gore, J. C., & Anderson, A. W.(2000). Expertise for cars and birds recruits brain areasinvolved in face recognition. Nature Neuroscience, 3,191–197.
Glover, G. H., & Lai, S. (1998). Self-navigated spiral fMRI:Interleaved versus single-shot. Magnetic Resonance inImaging, 39, 361–368.
Goossens, L., Kukolja, J., Onur, O. A., Fink, G. R., Maier, G.,Griez, E., et al. (2009). Selective processing of social stimuliin the superficial amygdala. Human Brain Mapping, 30,3332–3338.
Gothard, K. M., Battaglia, F. P., Erickson, C. A., Spitler, K. M., &Amaral, D. G. (2007). Neural responses to facial expressionand face identity in the monkey amygdala. Journal ofNeurophysiology, 97, 1671–1683.
Grill-Spector, K., & Kanwisher, N. (2005). Visual recognition:As soon as you know it is there, you know what it is.Psychological Science, 16, 152–160.
Gross, C. G., Rocha-Miranda, C. E., & Bender, D. B. (1972).Visual properties of neurons in inferotemporal cortex ofthe macaque. Journal of Neurophysiology, 35, 96–111.
Gschwind, M., Pourtois, G., Schwartz, S., van de Ville, D., &Vuilleumier, P. (2012). White-matter connectivity betweenface-responsive regions in the human brain. Cerebral Cortex,22, 1564–1576.
Hariri, A. R., Tessitore, A., Mattay, V. S., Fera, F., & Weinberger,D. R. (2002). The amygdala response to emotional stimuli: Acomparison of faces and scenes. Neuroimage, 17, 317–323.
Haxby, J. V., & Gobbini, M. I. (2012). Distributed neural systemsfor face perception. In A. Calder, G. Rhodes, M. Johnson,J. Haxby, & J. Keane (Eds.), Handbook of face perception(pp. 93–111). Oxford, UK: Oxford University Press.
Haxby, J. V., Gobbini, M. I., Furey, M. L., Ishai, A., Schouten,J. L., & Pietrini, P. (2001). Distributed and overlappingrepresentations of faces and objects in ventral temporalcortex. Science, 28, 2425–2430.
Haxby, J. V., Grady, C. L., Horwitz, B., Salerno, J. A., Ungerleider,L. G., Mishkin, M., et al. (1993). Dissociation of object andspatial visual processing pathways in human extrastriatecortex. In B. Gulyas, D. Ottoson, & P. E. Roland (Eds.),Functional organization of human visual cortex(pp. 329–330). Oxford, UK: Pergamon.
Haxby, J. V., Guntupalli, J. S., Connolly, A. C., Halchenko, Y. O.,Conroy, B. R., Gobbini, M. I., et al. (2011). A common,
Mende-Siedlecki et al. 2103

high-dimensional model of the representational space inhuman ventral temporal cortex. Neuron, 72, 404–416.
Haxby, J. V., Hoffman, E. A., & Gobbini, M. I. (2000). Thedistributed human neural system for face perception. Trendsin Cognitive Sciences, 4, 223–233.
Herry, C., Bach, D. R., Esposito, F., Di Salle, F., Perrig, W. J.,Scheffler, K., et al. (2007). Processing of temporalunpredictability in human and animal amygdala. Journal ofNeuroscience, 27, 5958–5966.
Hoffman, K. L., Gothard, K. M., Schmid, M. C., & Logothetis,N. K. (2007). Facial-expression and gaze-selective responsesin the monkey amygdala. Current Biology, 17, 766–772.
Holland, P. C., & Gallagher, M (1999). Amygdala circuitry inattentional and representational processes. Trends inCognitive Sciences, 3, 65–73.
Ishai, A., Schmidt, C. F., & Boesiger, P. (2005). Face perceptionis mediated by a distributed cortical network. Brain ResearchBulletin, 67, 87–93.
Jiang, F., Blanz, V., & OʼToole, A. J. (2009). Three-dimensionalinformation in face representation revealed by identity after-effects. Psychological Science, 20, 318–325.
Johnson, M. H. (2005). Subcortical face processing. NatureReviews Neuroscience, 6, 766–774.
Kanwisher, N. (2010). Inaugural article: Functional specificity inthe human brain: A window into the functional architectureof the mind. Proceedings of the National Academy ofSciences, U.S.A., 107, 11163–11170.
Kanwisher, N., & Barton, J. J. S. (2012). The functionalarchitecture of the face system: Integrating evidence fromfMRI and patient studies. In A. Calder, G. Rhodes, M. Johnson,J. Haxby, & J. Keane (Eds.), Handbook of face perception(pp. 111–131). Oxford, UK: Oxford University Press.
Kanwisher, N., McDermott, J., & Chun, M. M. (1997). Thefusiform face area: A module in human extrastriate cortexspecialized for face perception. Journal of Neuroscience,17, 4302–4311.
Kanwisher, N., & Yovel, G. (2006). The fusiform face area:A cortical region specialized for the perception of faces.Philosophical Transactions of the Royal Society of London,Series B, Biological Sciences, 361, 2109–2128.
Kapp, B. S., Whalen, P. J., Supple, W. F., & Pascoe, J. P. (1992).Amygdaloid contributions to conditioned arousal and sensoryinformation processing. In J. P. Aggleton (Ed.), The amygdala:Neurobiological aspects of emotion, memory, and mentaldysfunction (pp. 229–254). New York: Wiley-Liss.
Kosaka, H., Omori, M., Iidaka, T., Murata, T., Shimoyama, T.,Okada, T., et al. (2003). Neural substrates participating inacquisition of facial familiarity: An fMRI study. Neuroimage,20, 1734–1742.
Kreiman, G., Koch, C., & Fried, I. (2000). Category-specificvisual responses of single neurons in the human medialtemporal lobe. Nature Neuroscience, 3, 946–953.
Kuraoka, K., & Nakamura, K. (2006). Responses of singleneurons in monkey amygdala to facial and vocal emotions.Journal of Neurophysiology, 97, 1379–1387.
LaBar, K. S., Gitelman, D. R., Mesulam, M.-M., & Parrish, T. B.(2001). Impact of signal-to-noise on functional MRI of thehuman amygdala. NeuroReport, 12, 3461–3464.
Lee, C., Rohrer, W. H., & Sparks, D. L. (1988). Populationcoding of saccadic eye movements by neurons in thesuperior colliculus. Nature, 332, 357–360.
Leonard, C. M., Rolls, E. T., Wilson, F. A. W., & Baylis, G. C.(1985). Neurons in the amygdala of the monkey withresponses selective for faces. Behavioural Brain Research,15, 159–176.
Leopold, D. A., Bondar, I. V., & Giese, M. A. (2006). Norm-basedface encoding by single neurons in the monkeyinferotemporal cortex. Nature, 442, 572–575.
Leopold, D. A., OʼToole, A. J., Vetter, T., & Blanz, V. (2001).Prototype-referenced shape encoding revealed by high-levelaftereffects. Nature Neuroscience, 4, 89–94.
Leopold, D. A., Rhodes, G., Müller, K.-M., & Jeffery, L. (2005).The dynamics of visual adaptation to faces. Proceedings ofthe Royal Society of London, Series B, 272, 897–904.
Loffler, G., Yourganov, G., Wilkinson, F., & Wilson, H. R. (2005).fMRI evidence for the neural representation of faces. NatureNeuroscience, 8, 1386–1390.
Logothetis, N. K., Guggenberger, H., Peled, S., & Pauls, J.(1999). Functional imaging of the monkey brain. NatureNeuroscience, 2, 555–562.
Lundqvist, D., Flykt, A., & Öhman, A. (1998). The KarolinskaDirected Emotional Faces – KDEF. CD ROM from Departmentof Clinical Neuroscience, Psychology section, KarolinskaInstitutet, ISBN 91-630-7164-9.
Martin, D., & Macrae, C. N. (2007). A face with a cue: Exploringthe inevitability of person categorization. European Journalof Social Psychology, 37, 806–816.
Mattavelli, G., Andrews, T. J., Asghar, A. U., Towler, J. R., &Young, A. W. (2012). Response of face-selective brain regionsto trustworthiness and gender of faces. Neuropsychologia,50, 2205–2211.
McCarthy, G., Puce, A., Gore, J. C., & Allison, T. (1997). Face-specific processing in the human fusiform gyrus. Journal ofCognitive Neuroscience, 9, 605–610.
Mende-Siedlecki, P., Said, C., & Todorov, A. (2012). The socialevaluation of faces: A meta-analysis of functional neuroimagingstudies. Social Cognitive and Affective Neuroscience, 8,285–299.
Morris, J. S., Frith, C. D., Perrett, D. I., Rowland, D., Young,A. W., Calder, A. J., et al. (1996). A differential neural responsein the human amygdala to fearful and happy facial expressions.Nature, 383, 812–815.
Nakamura, K., Mikami, A., & Kubota, K. (1992). Activity of singleneurons in the monkey amygdala during performance of avisual discrimination task. Journal of Neurophysiology, 67,1447–1463.
Nestor, A., Plaut, D. C., & Behrmann, M. (2011). Unraveling thedistributed neural code of facial identity through spatiotemporalpattern analysis. Proceedings of the National Academy ofSciences, U.S.A., 108, 9998–10003.
Oosterhof, N. N., & Todorov, A. (2008). The functional basis offace evaluation. Proceedings of the National Academy ofSciences, U.S.A., 105, 11087–11092.
Pascalis, O., & Kelly, D. J. (2009). The origins of face processingin humans: Phylogeny and ontogeny. Perspectives onPsychological Science, 2, 200–209.
Perrett, D. I., Rolls, E. T., & Caan, W. (1982). Visual neuronsresponsive to faces in the monkey temporal cortex.Experimental Brain Research, 47, 329–342.
Pessoa, L., Japee, S., Sturman, D., & Ungerleider, L. G. (2006).Target visibility and visual awareness modulate amygdalaresponses to fearful faces. Cerebral Cortex, 16, 366–375.
Phillips, P. J., Moon, H., Rizvi, S. A., & Rauss, P. J. (2000).The FERET evaluation methodology for face recognitionalgorithms. The IEEE Transactions on Pattern Analysis andMachine Intelligence, 22, 1090–1104.
Phillips, P. J., Wechsler, H., Huang, J., & Rauss, P. (1998).The FERET database and evaluation procedure for facerecognition algorithms. Image and Vision Computing, 16,295–306.
Pinsk, M. A., Arcaro, M., Weiner, K., Kalkus, J., Inati, S., Gross,C. G., et al. (2009). Neural representations of faces and bodyparts in macaque and human cortex: A comparative fMRIstudy. Journal of Neurophysiology, 101, 2581–2600.
Pinsk, M. A., DeSimone, K., Moore, T., Gross, C. G., &Kastner, S. (2005). Representations of faces and body parts
2104 Journal of Cognitive Neuroscience Volume 25, Number 12

in macaque temporal cortex: An fMRI study. Proceedings ofthe National Academy of Sciences, U.S.A., 102, 6996–7001.
Posner, M. I., & Peterson, S. E. (1990). The attention system of thehuman brain. Annual Review of Neuroscience, 13, 25–42.
Pourtois, G., Spinelli, L., Seeck, M., & Vuilleumier, P. (2010).Temporal precedence of emotion over attention modulationsin the lateral amygdala: Intracranial ERP evidence from apatient with temporal lobe epilepsy. Cognitive, Affective, &Behavioral Neuroscience, 10, 83–93.
Puce, A., Allison, T., Asgari, M., Gore, J. C., & McCarthy, G.(1996). Differential sensitivity of human visual cortex to faces,letterstrings, and textures: A functional magnetic resonanceimaging study. Journal of Neuroscience, 16, 5205–5215.
Puce, A., Allison, T., Gore, J. C., & McCarthy, G. (1995). Face-sensitive regions in human extrastriate cortex studied byfunctional MRI. Journal of Neurophysiology, 74, 1192–1199.
Pugliese, L., Catani, M., Ameis, S., DellʼAcqua, F., Thiebaut deSchotten, M., Murphy, C., et al. (2009). The anatomy ofextended limbic pathways in Asperger syndrome: Apreliminary diffusion tensor imaging tractography study.Neuroimage, 47, 427–434.
Quiroga, R. Q., Reddy, L., Kreiman, G., Koch, C., & Fried, I.(2005). Invariant visual representation by single neurons inthe human brain. Nature, 435, 1102–1107.
Rajimehr, R., Young, J. C., & Tootell, R. B. H. (2009). An anteriortemporal face patch in human cortex, predicted by macaquemaps. Proceedings of the National Academy of Sciences,U.S.A., 106, 1995–2000.
Reinders, A. A., den Boer, J. A., & Büchel, C. (2005). Therobustness of perception. European Journal of Neuroscience,22, 524–530.
Rhodes, G., & Jeffery, L. (2006). Adaptive norm-based coding offacial identity. Vision Research, 46, 2977–2987.
Rhodes, G., & Leopold, D. A. (2012). Adaptive norm-basedcoding of face identity. In A. Calder, J. V. Haxby, M. Johnson, &G. Rhodes (Eds.),Handbook of face perception (pp. 263–286).Oxford, UK: Oxford University Press.
Rolls, E. T. (1984). Neurons in the cortex of the temporal lobeand in the amygdala of the monkey with responses selectivefor faces. Human Neurobiology, 3, 209–222.
Rolls, E. T. (2000). Neurophysiology and function of the primateamygdala, and neural basis of emotion. In J. P. Aggleton (Ed.),The amygdala: A functional analysis (pp. 447–478). Oxford,UK: Oxford University Press.
Rossion, B., Hanseeuw, B., & Dricot, L. (2012). Defining faceperception areas in the human brain: A large-scale factorialfMRI face localizer analysis. Brain and Cognition, 79,138–157.
Rotshtein, P., Malach, R., Hadar, U., Graif, M., & Hendler, T.(2001). Feeling or features: Different sensitivity to emotion inhigh-order visual cortex and amygdala. Neuron, 32, 747–757.
Rutishauser, U., Tudusciuc, O., Neumann, D., Mamelak, A. N.,Heller, A. C., Ross, I. B., et al. (2011). Single-unit responsesselective for whole faces in the human amygdala. CurrentBiology, 21, 1654–1660.
Sabatinelli, D., Bradley, M. M., Fitzsimmons, J. R., & Lang, P. J.(2005). Parallel amygdala and inferotemporal activationreflect emotional intensity and fear relevance. Neuroimage,24, 1265–1270.
Said, C. P., Baron, S., & Todorov, A. (2009). Nonlinear amygdalaresponse to face trustworthiness: Contributions of high andlow spatial frequency information. Journal of CognitiveNeuroscience, 21, 519–528.
Said, C. P., Dotsch, R., & Todorov, A. (2010). The amygdala andFFA track both social and non-social face dimensions.Neuropsychologia, 48, 3596–3605.
Said, C. P., Haxby, J. V., & Todorov, A. (2011). Brain systems forassessing the affective value of faces. Philosophical
Transactions of the Royal Society of London, Series B,Biological Sciences, 336, 1660–1670.
Sander, D., Grafman, J., & Zalla, T. (2003). The humanamygdala: An evolved system for relevance detection.Reviews in the Neurosciences, 14, 303–316.
Sanghera, M. F., Rolls, E. T., & Roper-Hall, A. (1979). Visualresponse of neurons in the dorsolateral amygdala of thealert monkey. Experimental Neurology, 63, 61–62.
Santos, A., Mier, D., Kirsch, P., & Meyer-Lindenberg, A. (2011).Evidence for a general face salience signal in humanamygdala. Neuroimage, 14, 3111–3116.
Sato, W., Kochiyama, T., Uono, S., Matsuda, K., Usui, K.,Inoue, Y., et al. (2012). Temporal profile of amygdala gammaoscillations in response to faces. Journal of CognitiveNeuroscience, 24, 1420–1433.
Saygin, Z. M., Osher, D. E., Augustinack, J., Fischl, B., & Gabrieli,J. D. (2011). Connectivity-based segmentation of humanamygdala nuclei using probabilistic tractography. Neuroimage,56, 1353–1361.
Scherf, K. S., Behrmann, M., Humphreys, K., & Luna, B. (2007).Visual category-selectivity for faces, places, and objects emergesalong different developmental trajectories. DevelopmentalScience, 10, F15–F30.
Schwartz, C. E., Wright, C. I., Shin, L. M., Kagan, J., Whalen, P. J.,McMullin, K. G., et al. (2003). Differential amygdalar responseto novel versus newly familiar neutral faces: A functionalMRI probe developed for studying inhibited temperament.Biological Psychiatry, 53, 854–862.
Sergent, J., Ohta, S., & MacDonald, B. (1992). Functionalneuroanatomy of face and object processing. A positronemission tomography study. Brain, 115, 15–36.
Sergerie, K., Chochol, C., & Armony, J. L. (2008). The role ofthe amygdala in emotional processing: A quantitative meta-analysis of functional neuroimaging studies. Neuroscienceand Biobehavioral Reviews, 32, 811–830.
Small, D. M., Gregory, M. D., Mak, Y. E., Gitelman, D., Mesulam,M.M., & Parrish, T. (2003). Dissociation of neural representationof intensity and affective valuation in human gustation.Neuron, 39, 701–711.
Somerville, L. H., Kim, H., Johnstone, T., Alexander, A., &Whalen, P. J. (2004). Human amygdala response duringpresentation of happy and neutral faces: Correlations withstate anxiety. Biological Psychiatry, 55, 897–903.
Somerville, L. H., & Whalen, P. J. (2006). Prior experience asa stimulus category confound: An example using facialexpressions of emotion. Social, Cognitive and AffectiveNeuroscience, 1, 271–274.
Sparks, D. L. (2002). The brainstem control of saccadic eyemovements. Nature Reviews Neuroscience, 3, 952–964.
Sprague, J. (1991). The role of the superior colliculus infacilitating visual attention and form perception. Proceedingsof the National Academy of Sciences, U.S.A., 88, 1286–1290.
Todorov, A. (2012). The role of the amygdala in face perceptionand evaluation. Motivation and Emotion, 36, 16–26.
Todorov, A., Mende-Siedlecki, P., & Dotsch, R. (2013). Socialjudgements from faces. Current Opinion in Neurobiology,23, 373–380.
Todorov, A., &Oosterhof, N. N. (2011). Modeling social perceptionof faces. Signal Processing Magazine, IEEE, 28, 117–122.
Todorov, A., Pakrashi, M., & Oosterhof, N. N. (2009). Evaluatingfaces on trustworthiness after minimal time exposure. SocialCognition, 27, 813–833.
Todorov, A., Said, C. P., Oosterhof, N. N., & Engell, A. D. (2011).Task-invariant brain responses to the social value of faces.Journal of Cognitive Neuroscience, 23, 2766–2781.
Tong, F., Nakayama, K., Moscovitch, M., Weinrib, O., &Kanwisher, N. (2000). Response properties of humanfusiform face area. Cognitive Neuropsychology, 12, 257–279.
Mende-Siedlecki et al. 2105
Tottenham, N., Tanaka, J. W., Leon, A. C., McCarry, T., Nurse,M., Hare, T. A., et al. (2009). The NimStim set of facialexpressions: Judgments from untrained research participants.Psychiatry Research, 168, 242–249.
Tsao, D. Y., & Freiwald, W. A. (2006). Whatʼs so special aboutthe average face? Trends in Cognitive Sciences, 10, 391–393.
Tsao, D. Y., Freiwald, W. A., Tootell, R. B. H., & Livingstone,M. S. (2006). A cortical region consisting entirely of face-selective cells. Science, 311, 670–674.
Turk-Browne, N. B., Norman-Haignere, S. V., & Mc Carthy, G.(2010). Face-specific resting functional connectivity betweenthe fusiform gyrus and posterior superior temporal sulcus.Frontiers in Human Neuroscience, 4, 176.
Turk-Browne, N. B., Simon, M. G., & Sederberg, P. B. (2012).Scene representations in parahippocampal cortex depend ontemporal context. Journal of Neuroscience, 32, 7202–7207.
Verosky, S. C., & Turk-Browne, N. B. (2012). Representations offacial identity in the left hemisphere require right hemisphereprocessing. Journal of Cognitive Neuroscience, 24, 1006–1017.
Viskontas, I. V., Quiroga, R. Q., & Fried, I. (2009). Humanmedial temporal lobe neurons respond preferentially topersonally relevant images. Proceedings of the NationalAcademy of Sciences, U.S.A., 106, 21329–21334.
Vuilleumier, P. (2005). How brains beware: Neural mechanisms ofemotional attention. Trends in Cognitive Sciences, 9, 585–594.
Wagner, A. D., Maril, A., Bjork, R. A., & Schacter, D. L. (2001).Prefrontal contributions to executive control: fMRI evidencefor functional distinctions within lateral prefrontal cortex.Neuroimage, 14, 1337–1347.
Walker, M., & Vetter, T. (2009). Portraits made to measure:Manipulating social judgments about individuals with astatistical face model. Journal of Vision, 9, 1–13.
Weiner, K. S., & Grill-Spector, K. (2010). Sparsely-distributedorganization of face and limb activations in human ventraltemporal cortex. Neuroimage, 52, 1559–1573.
Weiner, K. S., & Grill-Spector, K. (2012). The improbablesimplicity of the fusiform face area. Trends in CognitiveSciences, 16, 251–254.
Weiner, K. S., & Grill-Spector, K. (2013). Neural representationsof faces and limbs neighbor in high-level visual cortex:Evidence for a new organization principle. PsychologicalResearch, 77, 74–97.
Whalen, P. J. (1998). Fear, vigilance, and ambiguity: Initialneuroimaging studies of the human amygdala. CurrentDirections in Psychological Science, 7, 177–188.
Whalen, P. J. (2007). The uncertainty of it all. Trends in CognitiveSciences, 11, 499–500.
Whalen, P. J., Rauch, S. L., Etcoff, N. L., McInerney, S. C., Lee, M.,& Jenike, M. A. (1998). Masked presentations of emotionalfacial expressions modulate amygdala activity without explicitknowledge. Journal of Neuroscience, 18, 411–418.
Whalen, P. J., Davis, F. C., Oler, J. A., Kim, H., Kim, M. J., & Neta,M. (2009). Human amygdala responses to facial expressions ofemotion. In P. J. Whalen, & E. A. Phelps (Eds.), The HumanAmygdala (pp. 265–288). New York: The Guilford Press.
Williams, L. M., Das, P., Liddell, B. J., Kemp, A. H., Rennie, C. J.,& Gordon, E. (2006). Mode of functional connectivity inamygdala pathways dissociates level of awareness forsignals of fear. Journal of Neuroscience, 6, 9264–9271.
Wilson, F. A. W., & Rolls, E. T. (1993). The effects of novelty andfamiliarity on neuronal activity recorded in the amygdala ofmonkeys performing recognition memory tasks. ExperimentalBrain Research, 93, 367–382.
Winston, J., OʼDoherty, J., & Dolan, R. J. (2003). Common anddistinct neural responses during direct and incidental processingof multiple facial emotions. Neuroimage, 20, 84–97.
Winston, J. S., OʼDoherty, J., Kilner, J. M., Perrett, D. I., & Dolan,R. J. (2007). Brain systems for assessing facial attractiveness.Neuropsychologia, 7, 195–206.
Xiao, J., Hays, J., Ehinger, K., Oliva, A., & Torralba, A. (2010).SUN database: Large-scale scene recognition from abbey tozoo. In IEEE Conference on Computer Vision and PatternRecognition (pp. 3485–3492).
Yang, T. T., Menon, V., Eliez, S., Blasey, C., White, C. D., Reid, A.J., et al. (2002). Amygdalar activation associated with positiveand negative facial expressions. NeuroReport, 13, 1737–1741.
Yarkoni, T., Poldrack, R. A., Nichols, T. E., Van Essen, D. C., &Wager, T. D. (2011). Large-scale automated synthesis of humanfunctional neuroimaging data. Nature Methods, 8, 665–670.
Yip, A., & Sinha, P. (2002). Role of color in face recognition.Perception, 31, 995–1003.
Zald, D. H. (2003). The human amygdala and the emotionalevaluation of sensory stimuli. Brain Research Review, 41,88–123.
2106 Journal of Cognitive Neuroscience Volume 25, Number 12