robust supramolecular nano-tunnels built from molecular bricks
TRANSCRIPT
doi.org/10.26434/chemrxiv.12646919.v1
Robust Supramolecular Nano-Tunnels Built from Molecular BricksPeifa Wei, Zheng Zheng, Junyi Gong, Jun Zhang, Herman H.-Y. Sung, Ian Duncan Williams, Jacky W. Y.Lam, Ben Zhong Tang
Submitted date: 13/07/2020 • Posted date: 14/07/2020Licence: CC BY-NC-ND 4.0Citation information: Wei, Peifa; Zheng, Zheng; Gong, Junyi; Zhang, Jun; Sung, Herman H.-Y.; Williams, IanDuncan; et al. (2020): Robust Supramolecular Nano-Tunnels Built from Molecular Bricks. ChemRxiv. Preprint.https://doi.org/10.26434/chemrxiv.12646919.v1
Chemists are always seeking new methods to construct porous lattice frameworks using simple motifs as theimpetus. Different from the extensively reported frameworks which were stabilized by extended bonding,porous crystals of discrete organic molecules is an emerging area of porous materials with dynamic andflexible conformation, consisting exclusively of non-covalent interactions. Herein we report geometricallysimple linear molecule that assemble into a supramolecular nano-tunnel through synergy of anionic trident andmultiple intermolecular pi-pi stacking interactions. The nano-tunnel crystal exhibit exceptional chemicalstability in concentrated HCl and NaOH aqueous solutions, which is rarely been seen in supramolecularorganic frameworks and often related to designed extensive hydrogen bonding interactions. Upon thermaltreatment, the formed nano-tunnel crystals go through multistage single-crystal-to-single-crystal phasetransformations accompanied by thermosalient effect. Aggregation-induced emission joins with the adaptivepores render the crystals with responsive fluorescent change from blue to yellow and visible self-healingporosity transformation upon being stimulated. Furthermore, the desolvated pores exhibit highly selective CO2adsorption at ambient temperature.
File list (3)
download fileview on ChemRxivNano-tunnel-MS.pdf (1.20 MiB)
download fileview on ChemRxivNano-tunnel-SI.pdf (2.78 MiB)
download fileview on ChemRxivMovie.zip (42.08 MiB)
Robust supramolecular nano-tunnels built from molecular
bricks
Peifa Wei,1,2 Zheng Zheng,1 Junyi Gong,1 Jun Zhang,1 Herman H.-Y. Sung,1 Ian D. Williams,1
Jacky W. Y. Lam,1 & Ben Zhong Tang*,1,3
1Department of Chemistry, The Hong Kong Branch of Chinese National Engineering Research
Center for Tissue Restoration and Reconstruction, Institute for Advanced Study, Department
of Chemical and Biological Engineering, The Hong Kong University of Science and
Technology, Clear Water Bay, Kowloon, Hong Kong, China 2Institutes of Physical Science and Information Technology, Anhui University, Hefei 230601,
China 3Center for Aggregation-Induced Emission, SCUT-HKUST Joint Research Institute, State Key
Laboratory of Luminescent Materials and Devices, South China University of Technology,
Guangzhou, 510640, China
Abstract
Chemists are always seeking new methods to construct porous lattice frameworks using
simple motifs as the impetus. Different from the extensively reported frameworks
which were stabilized by extended bonding, porous crystals of discrete organic
molecules is an emerging area of porous materials with dynamic and flexible
conformation, consisting exclusively of non-covalent interactions. Herein we report
geometrically simple linear molecule that assemble into a supramolecular nano-tunnel
through synergy of anionic trident and multiple intermolecular - stacking interactions.
The nano-tunnel crystal exhibit exceptional chemical stability in concentrated HCl and
NaOH aqueous solutions, which is rarely been seen in supramolecular organic
frameworks and often related to designed extensive hydrogen bonding interactions.
Upon thermal treatment, the formed nano-tunnel crystals go through multistage single-
crystal-to-single-crystal phase transformations accompanied by thermosalient effect.
Aggregation-induced emission joins with the adaptive pores render the crystals with
responsive fluorescent change from blue to yellow and visible self-healing porosity
transformation upon being stimulated. Furthermore, the desolvated pores exhibit highly
selective CO2 adsorption at ambient temperature.
Introduction
Nature is unrivaled in its ability to create structural complexity from small organic
molecules. Chemists have been also always pursing the virtues of simplicity in
constructing functional structures using simple motifs, with the benefit of readily
synthetic feasibility and more structural tunability.1-3 Recently, an emerging area of
porous materials is the study of porous crystals of discrete organic small molecules,
consisting exclusively of non-covalent interactions.4-8 Such organic molecular crystals
can exhibit porosity that can compete with porous networks such as metal–organic and
covalent organic frameworks.9-11

To obtain robust porous molecular crystals constructed using simple tectons relies on
ingenious molecular design.12 The topology of the tectons should geometrically
favorable for the formation of stable framework with “vitual porosity” by maximum
the interactions with minium the contact points. Up to now, the most common tectons
in reported frameworks are predesigned three- or multi-armed scaffolds.13,14 Linear
two-armed tectons is easier to synthesize, but geometrically difficult to form
architectures with open pores. Therefore, few supramolecular structure/material based
on linear tectons has been reported so far.
On the other hand, the linkage interactions that strong enough to stabilize
supramolecular frameworks are still limited. H-bonding is still the most common and
most effective linkage to construct such frameworks. Among those H-bonded
frameworks, a few examples, reported by Miljanic, Aida, Schroder and others, have
shown good thermal and chemical stability. However, these systems are often required
specific functional groups and can be labile to solvents that will interfere H-bonds.15,16
Other interactions, such as π-π stacking and ionic interactions, has been explored
recently as effective protocol that can strengthen the intermolecular interactions.17 Here
we reported that a simple linear molecule can be used to construct a robust framework
with open pores. The linear tectons are firstly forming specific three-armed
supramolecular synthons, which further assembling into stable framework through a
combination of trident-type anionic interactions and - stacking interactions.
Noteworthy, the linear cyanostilbene-based tecton is a readily accessible aggregation-
induced emission (AIE) fluorophore which gives the framework luminescent in the
solid state.18 This inherent AIE feature, with high sensitivity and low background noise
visualization signals, 19 is useful tool to monitor the variability of pores, for example,
their fluorescent response when including guest molecules. The tunnel material has a
visible self-healing behavior with on-off-on porosity transformation upon grinding and
solvent-fuming. Rarely, this supramolecular tunnel shows good chemical stability and
retain crystalline and porous at strong acid and base condition. The material also exhibit
multistage polymorphic single-crystal-to-single-crystal phase transformations,
accompanied by thermosalient effect, in response to thermal treatment. The formed
porous structure has been proven very selective to CO2 at room temperature.
Results
Paraquat is a well-known planar electron-acceptor and dicyanostilbene is an AIE
fluorophore with twisted conformation. By combining these two units, we designed a
new molecule, PCS, which is readily available in gram-scale quantities via a four-step
synthetic method (Fig. 1a, Supplementary Figs. 1-4 and Scheme S1). The sharp single
peak in as synthesised HPLC of PCS and identification of the Z-conformation only in
the single crystal indicated that the E-isomer was not formed during the reaction.
(Supplementary Figs. 5 and 6). The electrostatic potential (ESP) diagram
(Supplementary Fig. 7a) of PCS shows that there are no electron rich parts in the
structure. This further leads to weak intermolecular interactions, such as weak
intermolecular - interactions, as confirmed by intermolecular independent gradient
model (IGM) surface mapping (Supplementary Fig. 7b). The structure is linear with
two crystallographically distinct arms. The four phenyl rings on the two arms twist in
different angles out of the plane of the central dicyanoethylene (Supplementary Fig. 6).
The twisted conformation in association with intermolecular - interactions lead to
inefficient molecular packing which can in principle fulfill the requirement of “point
contact” for porous structure (Fig. 1h). Single-crystal X-ray diffraction reveals that one
PF6 can act as a joint that interacts with up to five PCS molecules through multiple C-
H…F and F… ionic interactions with distance vary between 2.14 3.16 Å
(Supplementary Fig. 8). Each PF6 counteranion acts as an anionic trident to connect
three PCS at three adjacent layers to form a stable three-armed supramolecular synthon
(Fig. 1h). The anionic trident has been seen to play a similar role as metal nodes in
MOFs which can control the direction of supramolecular synthon. It should be noted
that for the single crystal structure of PCS with I as counteranion, a dense packing
without pore structure was observed which proved the contribution on the formation of
open pores brought by PF6 (Supplementary Fig. 9). Two supramolecular synthons can
pack in a brickwork type of arrangement to form dumbbell-type units (Fig. 1e and f)
and then further propagated into a three-dimensional (3D) supramolecular structure
with one-dimensional (1D) pores that have a diameter of 6.2 Å (Fig. 1b-d). The energy
profile provided by density functional theory calculation suggests that X-aggregation of
tectons can deliver the honeycomb-type hexagonal packing with minimum system
energy (Supplementary Figs. 11 and 12). This exquisite packing style can exhibit many
advantages, such as practicality, material saving and strong bearing capacity.20 A space
filling diagram viewed along c-axis and cross-section further confirmed the “virtual
porosity” of the columnar (Supplementary Fig. 10). The total solvent-accessible volume
was estimated to be 26.2% of its unit cell volume according to PLATON anaylsis.21
PCS exhibits AIE behavior, proven by its weak emission in a good solvent (CH3CN)
and enhanced photoluminescence (PL) in a bad solvent (isopropyl ether)
(Supplementary Fig. 13). Transparent colorless hexagonal prism shaped single crystals
of PCS, referred to as C3, with blue-green emission can readily be obtained by slow
vapor diffusion of diisopropyl ether into its acetonitrile solution (Fig. 2a). Meanwhile,
the tunnel structure of C3 inspired us to investigate whether specific guest vapor
molecules can be adsorbed and diffuse directionally inside the crystals which may
accompany with vapochromism behavior. Herein, we choose I2 as the transported guest
because its strong fluorescent quenching effect which can be used for monitoring the
diffusion; on the other hand radioactive iodine is a public safety hazard therefore
effective scavenger is highly desirable.22 C3 crystal was placed in vials and then
exposed to iodine vapor in a sealed container at room temperature. A few seconds later,
staining started from the two capping faces and extended continuously into the central
part of the crystals. As seen in Fig. 1i, the face-indexing graphic of C3 indicates the top
and bottom capping face (001) of the hexagonal prism is actually the entrance of the
tunnel. After about 2 h, the crystal was entirely colored (Supplementary Fig. S14).
Figure 1j and Supplementary Movie S1 records the time-dependent diffusion process
from initial to final state accompanied by apparent color change from light yellow to
almost black. This phenomenon also excludes the possibility of crystal surface loading.
TGA shows the weight capacity of iodine loading was about 18% (Supplementary Fig.
S15). When one end of the capping faces of the needle crystal was immersed into
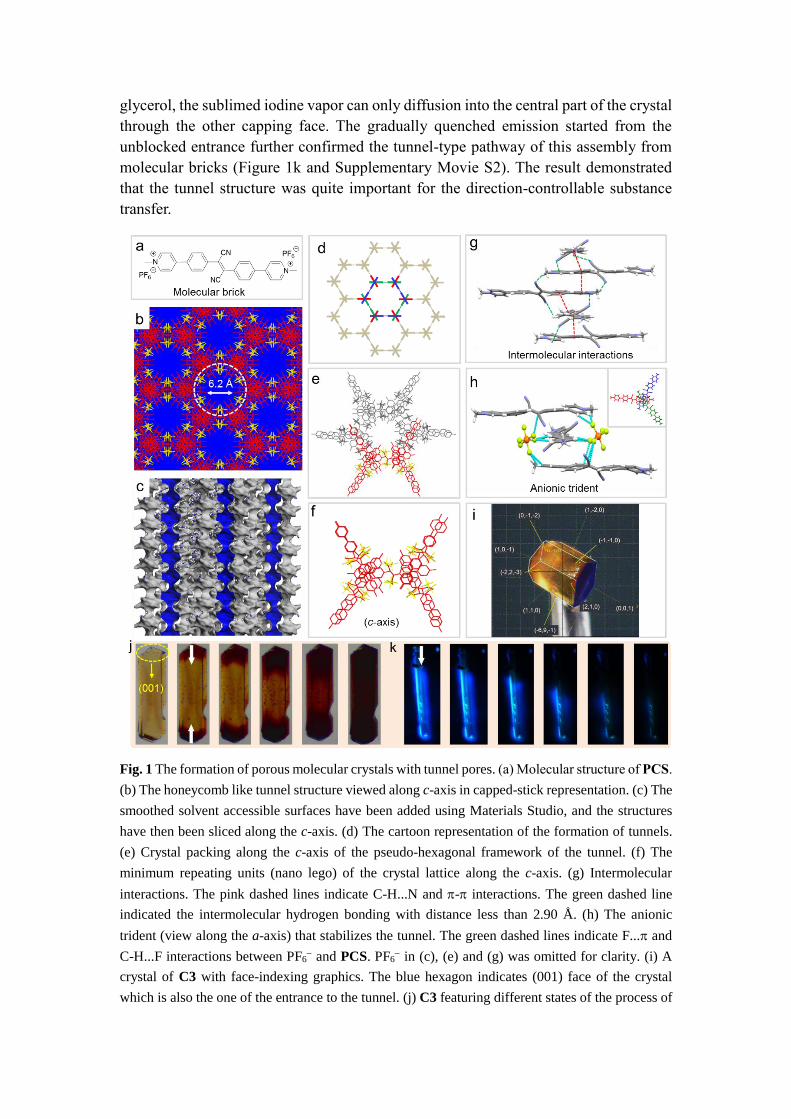
glycerol, the sublimed iodine vapor can only diffusion into the central part of the crystal
through the other capping face. The gradually quenched emission started from the
unblocked entrance further confirmed the tunnel-type pathway of this assembly from
molecular bricks (Figure 1k and Supplementary Movie S2). The result demonstrated
that the tunnel structure was quite important for the direction-controllable substance
transfer.
Fig. 1 The formation of porous molecular crystals with tunnel pores. (a) Molecular structure of PCS.
(b) The honeycomb like tunnel structure viewed along c-axis in capped-stick representation. (c) The
smoothed solvent accessible surfaces have been added using Materials Studio, and the structures
have then been sliced along the c-axis. (d) The cartoon representation of the formation of tunnels.
(e) Crystal packing along the c-axis of the pseudo-hexagonal framework of the tunnel. (f) The
minimum repeating units (nano lego) of the crystal lattice along the c-axis. (g) Intermolecular
interactions. The pink dashed lines indicate C-H...N and - interactions. The green dashed line
indicated the intermolecular hydrogen bonding with distance less than 2.90 Å. (h) The anionic
trident (view along the a-axis) that stabilizes the tunnel. The green dashed lines indicate F... and
C-H...F interactions between PF6 and PCS. PF6
in (c), (e) and (g) was omitted for clarity. (i) A
crystal of C3 with face-indexing graphics. The blue hexagon indicates (001) face of the crystal
which is also the one of the entrance to the tunnel. (j) C3 featuring different states of the process of

diffusion in of iodine from initial to final state. Diffusion started progressing from the two capping
faces to the central part. (k) Fluorescence images of C3 at different diffusion states with the bottom
capping face immersed into glycerole. Diffusion started progressing from only the top capping face
to the central part.
Discrete molecules tend to maximize attractive interactions and leave minimal voids
as possible in their crystal packing.23 Therefore most solvates do not commonly retain
their incipient porosity on guest removal, but rather collapse to form a denser phase
which may accompany with thermosalient behavior.24-26 The morphological evolution
of one single crystal was monitored under hot stage microscopy (Supplementary Movie
S3). The hexagonal prism crystals rapidly crack into small pieces along the longest axis
with a gradual color change from transparent colorless to non-transparent light-yellow,
some of which can move and even jump out of the visual field under heating (Fig. 2a
and b, Supplementary Movie S4). It is found that the crystal dramatically shrinks by
12% volume and turn dark orange around 220 °C (Fig. 2c). The thermosalient behavior
occurs as two kinematic effects stages: shrink and shrink followed by hopping. This
thermo-responsive mechanical process can not only magnify the underlying molecular-
scale mechanism but also lead to an enlightening application for such tunnel structure,
such as highly efficient molecular/crystalline actuators and sensors.
TGA profile of crystals with tunnels occupied by solvent molecules (named CS)
showed multistep mass loss to reach a plateau at ca. 280 ºC and this plateau was
maintained until decomposition of the material ensues beyond 320 °C (Supplementary
Fig. S20). In a DSC profile over a wide temperature range from 5 to 280 ºC, porous CS
in the first heating process displayed a significant broad endothermic peak around 30-
100 °C which was attributed to the loss of solvents (red curve Fig. 2d). This indicates
solvents in the voids of CS can be removed by heating to 100 °C which also causes the
cracking of the crystal. Notably, another single exothermic peak at 220 °C also appeared
which was ascribed to a crystalline phase transition.27 Upon subsequent cooling, neither
an exothermic peak nor an endothermic peak appeared (blue curve in Fig. 2d),
indicating that the phase transition at 220 °C is irreversible and the new form is
thermodynamically more favored than CS. To further confirm this hypothesis, variable-
temperature powered XRD (PXRD) data for CS was measured from 50 to 280 °C (Fig.
2e). Its PXRD profile did not show any obvious change below 140 °C. During 140 to
180 °C, broad peaks appear between 10° and 25° suggesting the loss of crystallinity. It
should be noted that the PXRD pattern exhibited a sharp and strong peak at 2θ = 5.80°
which corresponds to the lattice spacing of d (2,1,0) plane in the crystal (Fig. 2b). The
measured diameter of 15.18 Å of the pore is nearly the same as the calculated layer
distance from the Bragg equation (Supplementary Fig. S16), which can be assigning
the peak at 2θ = 5.80° relating to the existence of pores. Thus, the unchanged sharp
peak at 2θ = 5.80° indicates that the persistence of tunnel structure up to 180 °C. The
retained open pore structure even after the removal of the solvents demonstrates the
high thermal stability of the porous structure. Upon further heating to 220 °C the PXRD
profile changed abruptly and irreversibly with new peaks observed, affording a new
crystalline phase.

Fig. 2 Thermosalient behavior and multistage polymorphic SCSC phase transformations upon
heating. (a) Morphology and colors of single crystals of CS that were heated. (b) The crystal jumping
behavior of CS. (c) Crystal morphology shows the volumn shrinking after phase transition. (d) DSC
traces of CS in the first heating (red curve) and first cooling (blue curve) processes (scan rate = 5 °C
min–1). The phase transition temperature is indicated in red dashed circle. Figures were captured
from Movie S1 and Movie S2. (e) PXRD profiles of CS measured at different temperatures upon

heating. (f) An energy diagram for the heating process. Energy levels were estimated on the basis
of the DSC profiles. Inserted are wireframe representations of the crystal-packing diagrams of CS,
CNS and C. Ea: Activation energy. CS = Solvated porous crystal. CNS = Non-solvated porous crystal.
C = Nonporous crystal.
Although under high temperature perturbations, organic crystals are generally fragile
to be eligible for single crystal analysis, PCS is thermostable in that respect. There was
almost no loss of crystallinity for PCS after desolvation at 80 °C for 15 h under vacuum.
TGA confirms the absence of solvent in the desolvated crystal (Supplementary Fig.
S17). The XRD pattern of the desolvated sample was consistent with that of CS which
confirms the preserved structure (Supplementary Fig. S18). We have also able to
resolve the desolvated crystal structure (CNS) which further confirms the intermolecular
interactions can survive during crystal evacuation to yield robust structure with pores
(Fig. 4a). More surprisingly, the crystalline sample can undergo single-crystal-to-
single-crystal (SCSC) transitions at 220 °C to its nonporous polymorph (C) which also
has enough quality for single crystal XRD analysis. This provides us concrete transition
information at molecular level. The packing modes of PCS molecules in C and CS
changes from X-style to J-style although their molecular conformations are similar
(Supplementary Fig. S19). PCS molecules in C were connected by infinite
intermolecular - stacking between adjacent molecules and reoriented in slip-stack
with a slip angle of 35° (Supplementary Fig. S20). The shrink of the crystal volume
indicates the packing in C is denser than that in CS. The total solvent-accessible
volume of C was estimated to be 0% of its unit cell volume at the same condiation as
that for CS according to PLATON anaylsis. As shown in Supplementary Movie S5 and
Supplementary Fig. S21, the closed tunnel after SCSC transition was also proven by
the blocked diffusion of I2 into the C crystal.
Based on the DSC and TGA profiles, a possible energy diagram for the overall
crystalline transformation was proposed. It is suggested that kinetically stable CS
consecutively undergoes polymorphic transition to the solvent-free CNS and then
nonporous thermodynamic C. The solvents releasing from CS to CNS likely requires
only a very small activation energy, as evidenced by the TGA profile of CS
(Supplementary Fig. S17). By contrast, the DSC result features a single exothermic
peak at 220 °C during the transformation of CNS into C, for which enthalpy change
was evaluated to be 4.7 kJ mol–1 (Fig. 3d). DSC analysis with different scan rates
revealed that the phase transition temperature varied with the heating rate, proving that
it is indeed a case of kinetically irreversible enantiotropic transition. By means of the
Kissinger method the activation energy for this process was calculated to be as high as
202 kJ mol–1 which confirms the high thermal stability of the tunnel (Supplementary
Fig. S22).
Compared with the extended frameworks, the porous molecular crystals formed by
exclusively non-covalent bonding has less stable structure and only a few examples of
them have been reported to be stable at acidic or basic condition to date. In fact, most
of those supramolecular frameworks would collapse after the solvents being removed.
However, the desolvated pore (C3) showed surprisingly high stability toward both acid
(HCl) and base (NaOH). There was no loss of crystallinity, nor any chemical

decomposition, when solid C3 was soaked in acidic (pH = 1.0) and alkaline (pH = 10)
solutions for 1h, as shown by the PXRD (Fig. 3a) and 1H NMR (Supplementary Fig.
S23) results. The excellent robustness of the tunnel may be ascribed to the strong
structural support of the anionic trident.
Fig. 3 Stability and selectivity of gas adsorption of the tunnel. (a) PXRD patterns of simulated C3,
desolvated C3, desolvated C3 in pH = 1 HCl and pH = 10 NaOH aqueous for 20 h. (b) CH4 (298
K), CH4 (273 K), CO2 (298 K) and CO2 (273 K) adsorption isotherms of CNS. (c) CO2/N2 selectivity
values of CNS versus pressure calculated from a 50/50 mixture and applying IAST caculation..
Encouraged by the observed virtual porosity in the activated crystals of CNS, we
performed a series of gas sorption measurments using N2, H2, Ar, CH4 and CO2 (Fig.
5). At 77K, CNS has a modest uptake of N2 at 0.6 mmol/g at 1 bar, which suggests a
Brunauer–Emmett–Teller (BET) surface area at 27 m2 g1. Similarly, the H2 uptake
experiment shows a unusual linear isotherm and shows 0.5 mmol/g H2 was absorbed at
1bar, 77 K. The N2 and H2 sorption results are unexpected considering there are
channels with size over 6Å presence in the structure, which can normally accomodate
N2 and H2. On the contrary to other investigated gases, the CO2 isotherm showed that
guest-free CNS can adsorb a dencent amount of CO2 at 2.8 mmol/g at 1bar, 273K. The
adsorption value at 273 K, 68.1 cm3 g-1 has outperformanced many porous hydrogen-
bonds and supramolecular organic frameworks9,28,29 at 1 bar room temperature. The
calculated pore size of 7.5 Å (Supplementary Fig. S25) from the CO2 isotherm is not
far from the value (6.2 A, Fig 1b) obtained from the crystal structure. Ideal adsorbed
solution theory (IAST) was used to predict binary 50:50 feed CO2 and CH4 mixture
adsorption, giving predicted CO2/CH4 selectivity at 16.8 (273 K) and 7.4 (298 K),
respectively.30 The absorption enthalpy of 25 kJ mol1 at 273 K for CO2 ruled out the
possibility of chemisorption (Supplementary Fig. S26). Though there are many PF6
surrounded the inner circle of the pores, the existing models may not be well-suited for
fluorine lined pores such as those of our porous molecular crystal,31 crystal structure
data of CNS suggests an ultramicropore with 0.6 nm in diameter (Fig. 1b). The highly selective adsorption may be ascribed to the higher quadrupole moment of CO2 (−1.4 ×
10−39 C m2) than those of N2 (4.7 × 10−40 C m2), H2 (2.2 × 10−40 C m2) and CH4 (0),
which can thus enhance the electrostatic interactions between CO2 and the framework,
resulting in the increase of CO2 binding.32 Chargs on the surface of the pores have
prohibite the adsorption of gases such as N2, H2 and CH4, while not affect the uptake of

CO2 molecules. Similar behaviour has also been observed in other charged channel
system.33
Fig. 4 Visible self-healing porosity transformation upon stimulating. (a) Fluorescence images of
C1C6 and their grinded and further fumed samples. Normalized emission spectra of (b) C1 and
(c) C5 and their corresponding grinded and fumed spectra.
X-ray crystal analysis reveals that the PF6 anions and the methyl groups of C3 are
exposed on the pore surfaces for potential interactions with guest molecules (Fig. 1b).
Considering the AIE character of the tecton, these interactions with adsorbents may
further leads to responsive fluorescence change.34 Thanks to the strong crystallization
tendency, we obtained crystals under different cultivating conditions and six kinds of
crystals named C1-C6 were obtained, with different emission wavelengths ranging
from 441 to 532 nm (Fig. 4a). All the six single crystals have the sharp peak at 2θ =
5.80° in their PXRD profile which suggests the existence of pores (Supplementary Fig.
S27). However, because of the highly disordered solvents and the resulted in
asymmetrical molecular structure, we can only resolve three crystal structures of them:
the blue emissive C1 (441 nm), the aforementioned blue-green emissive C3 (474 nm)
and the green emissive C5 (500 nm). Simulated PXRD of C1, C3, and C5 from the
single crystal data show almost identical patterns which means they have very similar
crystal packing (Supplementary Fig. S28). This was further confirmed by the same pore
along c-axis in their crystal structures (Supplementary Fig. S29). TGA of freshly
prepared six crystals and 1H NMR spectra of their solution of freshly prepared crystals
in DMSO-d6 indicates the possible included solvents in their voids (Supplementary Figs.
S30 and 31). Moreover, crystallographically, one PCS molecule interacts with four
surrounding molecules; and all these participated molecules adopt twisted
conformation with different rotation angles and different distances of intermolecular
hydrogen bonds / - interactions (Supplementary Fig. S32). Thus, it is assumed that
the different emission of six porous structures are caused by the synergy effect of the

variation of intermolecular distances, the conformation change of the methyl groups,
and the solvents effects on the exposed PF6 ions.
The exclusive non-covalent interactions endow the porous molecular crystals with
dynamic behavior. Grinding can destruct the highly ordered crystalline porous structure
and result the characteristic peak in PXRD pattern disappear (Supplementary Fig. S26).
After grinding, the emission of all samples shifted to 468 nm which was ascribed to the
stable nonporous state C. Notably, for C1, the emission color red-shifted after grinding,
while the emission of C5 blue-shifted after grinding (Fig. 4b and c). Further exposing
the nonporous powder with dichloromethane or acetonitrile vapors, the recovery of
reflection peaks in the PXRD patterns assignable to C1 was observed, indicated grinded
samples could self-heal to regain its parental structure (Supplementary Fig. S26). For
grinded C1, its emission return to the initial state (441 nm), while for grinded C5,
fuming induced further blue-shifting the emission to 441 nm (Fig. 4b and c and
Supplementary Fig. S33). This means after recrystallization C1 should be the energy-
minimal structure in solid state. Similar mechanochromic luminescent was observed
for the other three porous crystals C2, C4 and C6 (Supplementary Fig. S34). Therefore,
we are able to realize on-off-on switching of porosity through grinding and vapor-
fuming, simultaneously accompanied by hypochromatic or bathochromatic shifts. The
self-healing porosity transformations are easily visualized, making this tunnel structure
holds promise for applications such as chemical sensors, data recording and other smart
materials.
Discussion
In summary, we have successfully assembled a robust porous molecular crystal through
a synergy arrangement of strong anionic trident and intermolecular - interactions
from a geometrically simple molecule. Upon thermal treatment, the formed nano-tunnel
crystals go through multistage polymorphic SCSC phase transformations accompanied
by thermosalient effect. The nano-tunnel crystal exhibit exceptional chemical stability
in concentrated HCl and NaOH aqueous solutions, which is rarely been seen in
supramolecular organic frameworks. Aggregation-induced emission joins with the
adaptive pores render the crystals with responsive fluorescent change from blue to
yellow and visible self-healing porosity transformation upon being stimulated.
Furthermore, the desolvated pores exhibit highly selective CO2 adsorption at ambient
temperature. This scarce two-armed organic building unit in combination with anionic-
facilitated strategy opens a new vista in construction of functional porous molecular
frameworks.
Methods
Preparation of the single crystals. The single crystal of PCS-I was obtained by slow
evaporation of a saturated solution in methanol at room temperature for one week. The
preparations of single crystals of C1 and C2 are similar to that of PCS-I but with
acetone instead of methanol. The single crystals of C3 and C5 suitable for X-ray
diffraction analysis were grown at room temperature for 2-3 days by slow vapor
diffusion of diisopropyl ether into their acetonitrile solution. The single crystal of C4
was grown by slow vapor diffusion of n-pentane into their acetone solution. The
preparation of single crystal of C6 is similar to that of PCS-I, but with acetonitrile
instead of methanol and meanwhile with addition of a drop of ethanol.
Gas Sorption Analysis. All samples were tested with gases of the following purities:
hydrogen (99.9995%-BOC gases), carbon dioxide (SCF grade-BOC gases) and
methane (ultrahigh purity-BOC). Surface areas and pore size distributions were
measured by nitrogen adsorption and desorption at 77.3 K using a Micromeritics ASAP
2020 volumetric adsorption analyzer. Samples were degassed at offline at 80 °C for 15
h under vacuum (10-5 bar) before analysis, followed by degassing on the analysis port
under vacuum, also at 80 °C. Both methane and carbon dioxide isotherms were
measured at ambient temperature, while argon at 87 K and hydrogen were measured at
77.3 K (liquid N2), using a Micromeritics 2420 volumetric adsorption analyzer using
the same degassing procedure.
Data availability
The data that support the findings of this study are available from the authors on
reasonable request, see author contributions for specific data sets. The X-ray
crystallographic coordinates for the structures reported in this article have been
deposited at the Cambridge Crystallographic Data Centre (CCDC). These data can be
obtained free of charge from The Cambridge Crystallographic Data Centre via
www.ccdc.cam.ac.uk/data_request/cif.
Acknowledgements
This work was supported by the National Science Foundation of China (21788102,
81372274, 81501591 and 8141101080), the Research Grants Council of Hong Kong
(16308016, C6009-17G and 16305618 and 16304819), the Innovation and Technology
Commission (ITC-CNERC14SC01) and the Science and Technology Plan of Shenzhen
(JCYJ20160229205601482, JCYJ20170818113602462 and
JCYJ20170818113348852).
Author contributions
P.W. and B.T. conceived and designed the experiments. P.W. synthesized and
characterized the compounds. P.W. performed the experiments. Z.Z., J.G. and other
authors were all involved in the analyses and interpretation of data. J.Z., H.H.Y.S. and
I.D.W. did the crystal analysis. P.W. and J.W.Y.L. wrote the manuscript with comments
from all authors.
Additional information
Supplementary information is available in the online version of the paper. Reprints and
permissions information is available online at www.nature.com/reprints.
Correspondence and requests for materials should be addressed to B.Z.T.
Competing interests
The authors declare no competing interests.

Reference
1 Bezzu, C. G., Helliwell, M., Warren, J. E., Allan, D. R. & McKeown, N. B.
Heme-like coordination chemistry within nanoporous molecular crystals.
Science 327, 1627-1630 (2010).
2 Beaudoin, D., Maris, T. & Wuest, J. D. Constructing monocrystalline covalent
organic networks by polymerization. Nat. Chem. 5, 830-834 (2013).
3 Barrer, R. M. & Shanson, V. H. Dianin's compound as a zeolitic sorbent. J.
Chem. Soc., Chem. Commun., 333-334 (1976).
4 Mastalerz, M. & Oppel, I. M. Rational construction of an extrinsic porous
molecular crystal with an extraordinary high specific surface area. Angew. Chem.
Int. Ed. 51, 5252-5255 (2012).
5 McKeown, N. B. Nanoporous molecular crystals. J. Mater. Chem. 20, 10588-
10597 (2010).
6 Sozzani, P., Bracco, S., Comotti, A., Ferretti, L. & Simonutti, R. Methane and
Carbon Dioxide Storage in a Porous van der Waals Crystal. Angew. Chem. Int.
Ed. 44, 1816-1820 (2005).
7 Tian, J., Thallapally, P. K. & McGrail, B. P. Porous organic molecular materials.
CrystEngComm 14, 1909-1919 (2012).
8 Lü, J. & Cao, R. Porous organic molecular frameworks with extrinsic porosity:
A platform for carbon storage and separation. Angew. Chem. Int. Ed. 55, 9474-
9480 (2016).
9 Yang, W. et al. Exceptional thermal stability in a supramolecular organic
framework: porosity and gas storage. J. Am. Chem. Soc. 132, 14457-14469
(2010).
10 Cooper, A. I. Nanoporous organics enter the cage age. Angew. Chem. Int. Ed.
50, 996-998 (2011).
11 Atwood, J. L., Barbour, L. J. & Jerga, A. Storage of methane and freon by
interstitial van der Waals confinement. Science 296, 2367-2369 (2002).
12 Evans, J. D. et al. Computational identification of organic porous molecular
crystals. CrystEngComm 18, 4133-4141 (2016).
13 Xing, G., Yan, T., Das, S., Ben, T. & Qiu, S. Synthesis of crystalline porous
organic salts with high proton conductivity. Angew. Chem. Int. Ed. 57, 5345-
5349 (2018).
14 Zhang, K.-D. et al. Toward a single-layer two-dimensional honeycomb
supramolecular organic framework in water. J. Am. Chem. Soc. 135, 17913-
17918 (2013).
15 Hisaki, I., Xin, C., Takahashi, K. & Nakamura, T. Designing Hydrogen‐Bonded
Organic Frameworks (HOFs) with Permanent Porosity. Angew. Chem. Int. Ed.
58, 11160-11170 (2019).
16 Lin, R.-B. et al. Multifunctional porous hydrogen-bonded organic framework
materials. Chem. Soc. Rev. 48, 1362-1389 (2019).
17 Yamamoto, A., Hamada, T., Hisaki, I., Miyata, M. & Tohnai, N. Dynamically
Deformable Cube‐like Hydrogen‐Bonding Networks in Water‐Responsive
Diamondoid Porous Organic Salts. Angew. Chem. Int. Ed. 52, 1709-1712 (2013).
18 Mei, J., Leung, N. L., Kwok, R. T., Lam, J. W. & Tang, B. Z. Aggregation-
induced emission: together we shine, united we soar! Chem. Rev. 115, 11718-
11940 (2015).
19 Zhang, M. et al. Two-dimensional metal–organic framework with wide
channels and responsive turn-on fluorescence for the chemical sensing of
volatile organic compounds. J. Am. Chem. Soc. 136, 7241-7244 (2014).
20 Kataoka, K. et al. A molecular-sized tunnel-porous crystal with a ratchet gear
structure and its one-way guest-molecule transportation property. Nanoscale 5,
1298-1300 (2013).
21 Spek, A. PLATON, a multipurpose crystallographic tool (Version 10M). Utrecht
University, Utrecht, The Netherlands (2003).
22 Riley, B. J., Vienna, J. D., Strachan, D. M., McCloy, J. S. & Jerden Jr, J. L.
Materials and processes for the effective capture and immobilization of
radioiodine: A review. J. Nucl. Mater. 470, 307-326 (2016).
23 Dunitz, J. D. & Gavezzotti, A. How molecules stick together in organic crystals:
weak intermolecular interactions. Chem. Soc. Rev. 38, 2622-2633 (2009).
24 Barbour, L. J. Crystal porosity and the burden of proof. Chem. Commun., 1163-
1168 (2006).
25 Sahoo, S. C., Panda, M. K., Nath, N. K. & Naumov, P. e. Biomimetic crystalline
actuators: structure–kinematic aspects of the self-actuation and motility of
thermosalient crystals. J. Am. Chem. Soc. 135, 12241-12251 (2013).
26 Brunet, P., Simard, M. & Wuest, J. D. Molecular tectonics. Porous hydrogen-
bonded networks with unprecedented structural integrity. J. Am. Chem. Soc. 119,
2737-2738 (1997).
27 Ge, C. et al. Visualization of Single-Crystal-to-Single-Crystal Phase Transition
of Luminescent Molecular Polymorphs. J. Phy. Chem. C 122, 15744-15752
(2018).
28 Li, P. et al. A rod‐packing microporous hydrogen‐bonded organic framework
for highly selective separation of C2H2/CO2 at room temperature. Angew.
Chem. Int. Ed. 54, 574-577 (2015).
29 Lu, J. et al. A robust binary supramolecular organic framework (SOF) with high
CO2 adsorption and selectivity. J. Am. Chem. Soc. 136, 12828-12831 (2014).
30 Lee, S., Lee, J. H. & Kim, J. User-friendly graphical user interface software for
ideal adsorbed solution theory calculations. Korean J. Chem. Eng. 35, 214-221
(2018).
31 Chen, T.-H. et al. Thermally robust and porous noncovalent organic framework
with high affinity for fluorocarbons and CFCs. Nat. Commun. 5, 1-8 (2014).
32 Luo, X.-Z. et al. A microporous hydrogen-bonded organic framework:
exceptional stability and highly selective adsorption of gas and liquid. J. Am.
Chem. Soc. 135, 11684-11687 (2013).
33 Xing, G. et al. A double helix of opposite charges to form channels with unique
CO 2 selectivity and dynamics. Chem. Sci. 10, 730-736 (2019).
34 Wang, B. et al. A Microporous Hydrogen-Bonded Organic Framework for
Highly Efficient Turn-Up Fluorescent Sensing of Aniline. J. Am. Chem. Soc.
DOI: 10.1021/jacs.0c05277 (2020).

download fileview on ChemRxivNano-tunnel-MS.pdf (1.20 MiB)

S1
Supplementary Information
Robust supramolecular nano-tunnels built from molecular bricks
Wei et al.

S2
All reagents were commercially available and used as supplied without further purification. Solvents
were either employed as purchased or dried according to procedures described in the literature. 1S1 and 2S2
were synthesized according to literature reported procedures. NMR spectra were recorded on a Bruker
Advance DMX 400 MHz spectrophotometer in deuterated solvents and referenced using residual solvent
peaks or by using tetramethylsilane (TMS) as the internal reference. Chemical shifts were reported relative
to residual solvent signals. High-resolution mass spectra were obtained on a Finnigan MAT TSQ 7000
Mass Spectrometer operated at MALDI-TOF mode or a Bruker Daltonics Apex IV spectrometer at ESI
mode. Absorption and photoluminescence spectra were recorded on a Milton Roy Spectronic 3000 Array
spectrophotometer and a Perkin-Elmer spectrofluorometer LS 55. Fluorescent micrographs were obtained
on a Carl-Zeiss LSM 10 META confocal laser scanning microscope. The lifetime was measured on an
Edinburgh FLSP920 fluorescence spectrophotometer equipped with a xenon arc lamp (Xe900). The DFT
and TD-DFT calculations were performed on a Gaussian 09 program. The absolute fluorescence quantum
yields were recorded on a Hamamatsu Quantaurus-QY C11347 spectrometer. Thermogravimetric analysis
(TGA) was carried out on a PerkinElmer TGA 7 at a heating rate of 10 °C/min under dry nitrogen. X-ray
diffraction was performed on a D/max-2550 PC X-ray diffractometer (XRD; Rigaku, Cu-Ka radiation).
Single crystal data sets were collected on an Oxford Diffraction Xcalibur Atlas Gemini ultra instrument or
a Rigaku MicroMax-007 HF rotating anode diffractometer (Mo-Kα radiation, Kappa 4-circle goniometer,
Rigaku Saturn724+ detector). The photoreaction was carried out under irradiation from a hand-held UV
lamp. Gas Sorption Analysis: All samples were tested with gases of the following purities: hydrogen
(99.9995%-BOC gases), carbon dioxide (SCF grade-BOC gases) and methane (ultrahigh purity-BOC).
Surface areas and pore size distributions were measured by nitrogen adsorption and desorption at 77.3 K
using a Micromeritics ASAP 2020 volumetric adsorption analyzer. Samples were degassed at offline at
80 °C for 15 h under vacuum (10-5 bar) before analysis, followed by degassing on the analysis port under
vacuum, also at 80 °C. Both methane and carbon dioxide isotherms were measured at ambient temperature,
while argon at 87 K and hydrogen were measured at 77.3 K (liquid N2), using a Micromeritics 2420
volumetric adsorption analyzer using the same degassing procedure.
S3
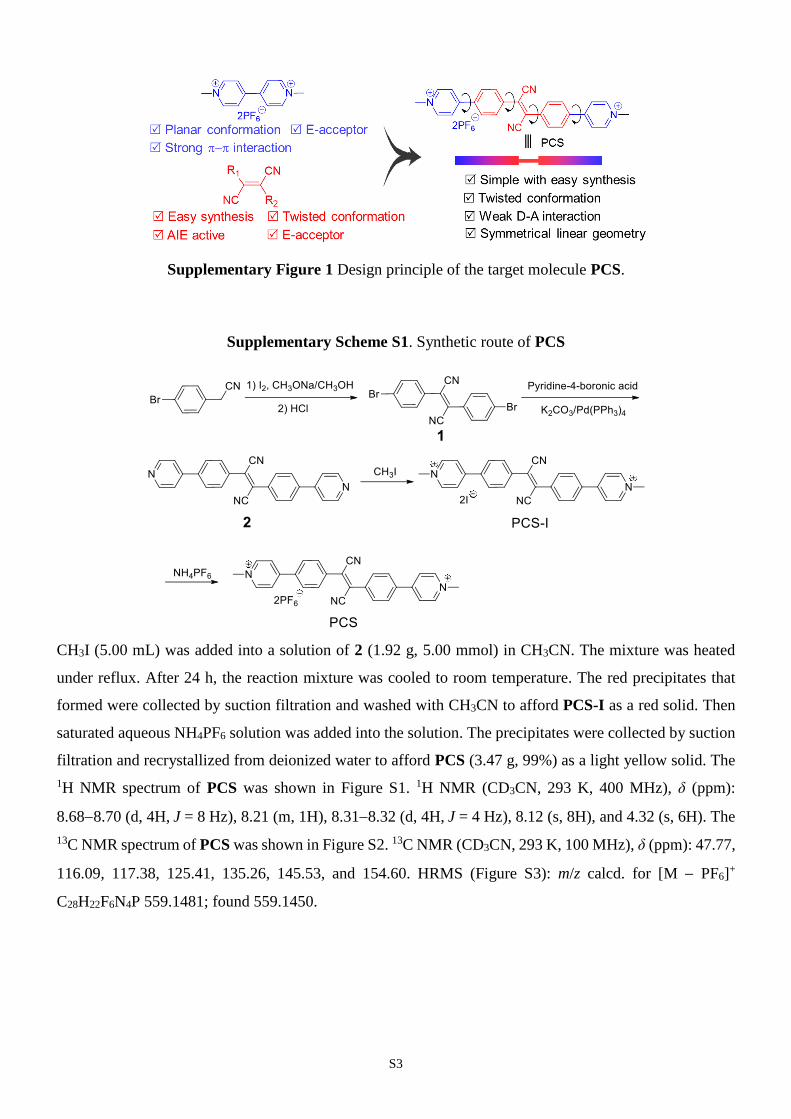
Supplementary Figure 1 Design principle of the target molecule PCS.
Supplementary Scheme S1. Synthetic route of PCS
CH3I (5.00 mL) was added into a solution of 2 (1.92 g, 5.00 mmol) in CH3CN. The mixture was heated
under reflux. After 24 h, the reaction mixture was cooled to room temperature. The red precipitates that
formed were collected by suction filtration and washed with CH3CN to afford PCS-I as a red solid. Then
saturated aqueous NH4PF6 solution was added into the solution. The precipitates were collected by suction
filtration and recrystallized from deionized water to afford PCS (3.47 g, 99%) as a light yellow solid. The
1H NMR spectrum of PCS was shown in Figure S1. 1H NMR (CD3CN, 293 K, 400 MHz), δ (ppm):
8.688.70 (d, 4H, J = 8 Hz), 8.21 (m, 1H), 8.318.32 (d, 4H, J = 4 Hz), 8.12 (s, 8H), and 4.32 (s, 6H). The
13C NMR spectrum of PCS was shown in Figure S2. 13C NMR (CD3CN, 293 K, 100 MHz), δ (ppm): 47.77,
116.09, 117.38, 125.41, 135.26, 145.53, and 154.60. HRMS (Figure S3): m/z calcd. for [M PF6]+
C28H22F6N4P 559.1481; found 559.1450.

S4
Supplementary Figure 2 1H NMR spectrum of PCS in CD3CN.
Supplementary Figure 3 13C NMR spectrum of PCS in CD3CN.

S5
Supplementary Figure 4 MALDI-TOF mass spectrum of PCS.
0 3 6 9 12 15
Ab
so
rban
ce@
350 n
m (
au
)
Time (min)
Supplementary Figure 5 Retention time of PCS in high-pressure liquid chromatography (HPLC). Mobile
phase: CH3CN; speed: 10 mL/min; column: C18.
Supplementary Figure 6 Top and side view of PCS from C3.
S6
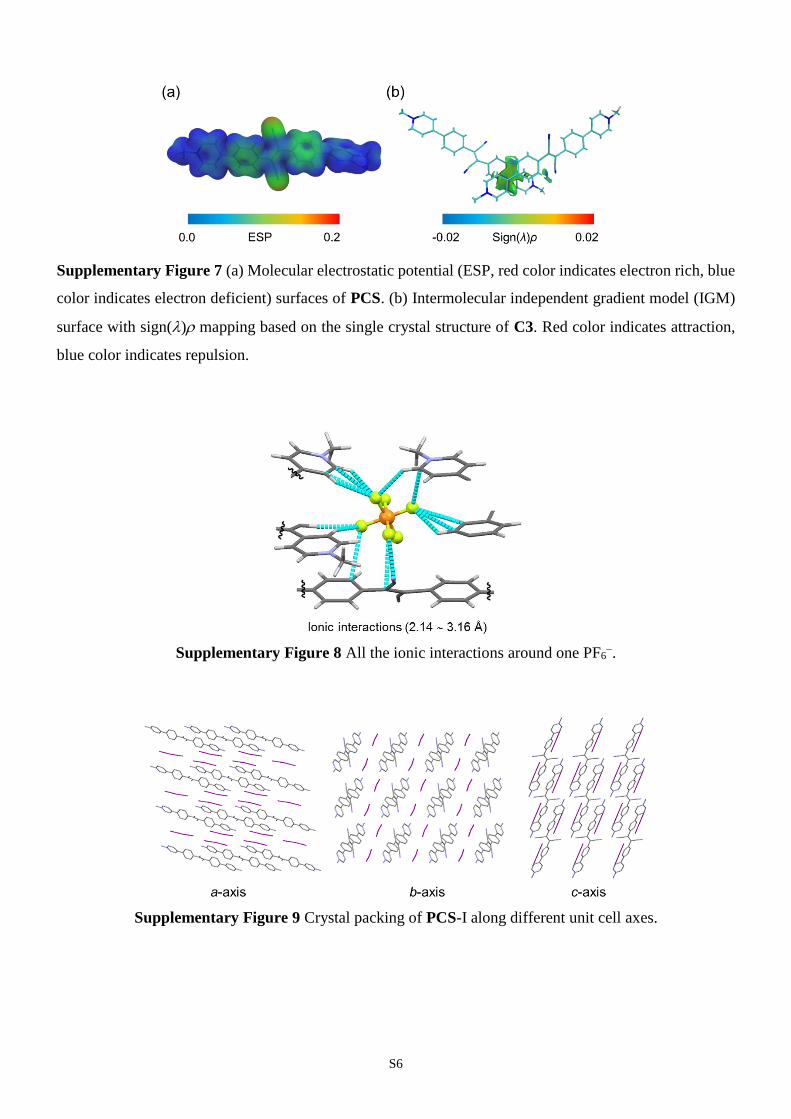
Supplementary Figure 7 (a) Molecular electrostatic potential (ESP, red color indicates electron rich, blue
color indicates electron deficient) surfaces of PCS. (b) Intermolecular independent gradient model (IGM)
surface with sign() mapping based on the single crystal structure of C3. Red color indicates attraction,
blue color indicates repulsion.
Supplementary Figure 8 All the ionic interactions around one PF6
.
Supplementary Figure 9 Crystal packing of PCS-I along different unit cell axes.

S7
Supplementary Figure 10 The honeycomb like channel structure in space filling representation viewed
along (a) c-axis and (b) crosssection.
To obtain further mechanistic insight the formation of channel, we performed density functional theory
(DFT) calculations. The calculated system energy based on two molecules with fixed contacting point while
different packing angles (). The energy profiles given in Supplementary Fig. 11 confirmed that the system
energy reached minimum when = 120º which perfectly matched with the experimental observation. The
3D extension of the X-aggregation can deliver the honeycomb-type hexagonal close packing
(Supplementary Fig. 12)
0 30 60 90 120 150 1800
5
10
15
20
25
30
Rela
tive e
nerg
y (
kJ/m
ol)
(degree)
Supplementary Figure 11 The calculated system energy based on two molecules with different rotation
angles ().
S8
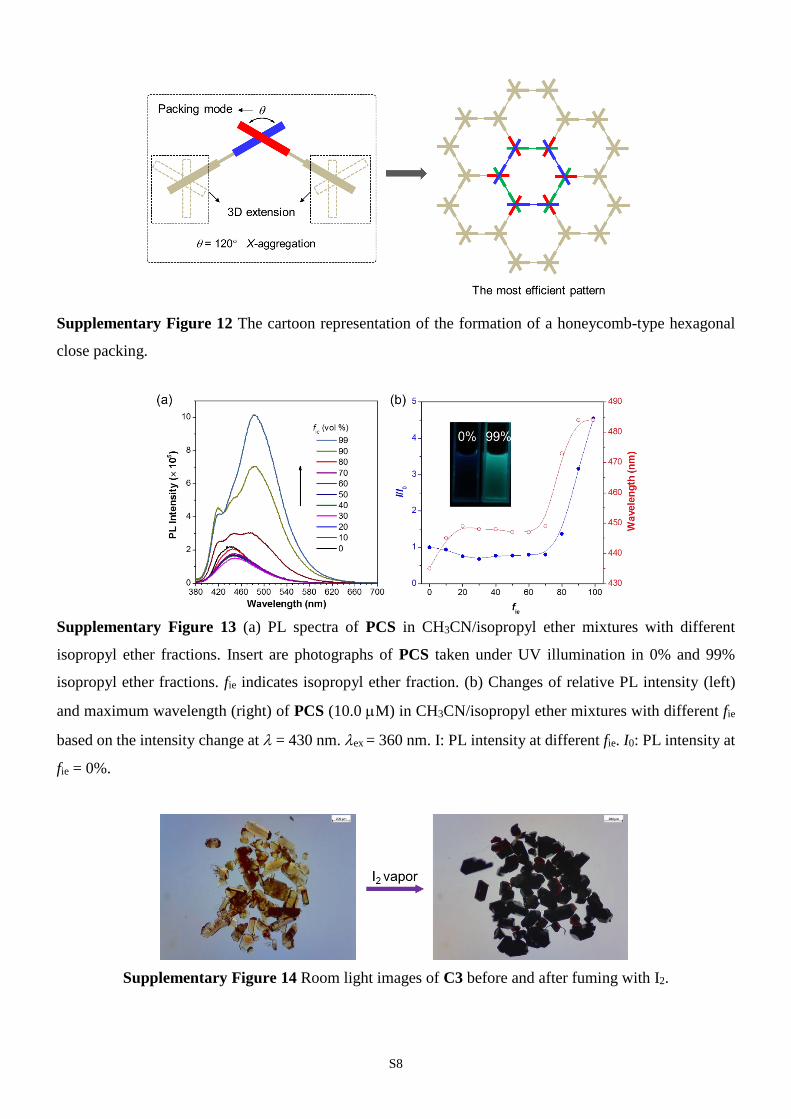
Supplementary Figure 12 The cartoon representation of the formation of a honeycomb-type hexagonal
close packing.
Supplementary Figure 13 (a) PL spectra of PCS in CH3CN/isopropyl ether mixtures with different
isopropyl ether fractions. Insert are photographs of PCS taken under UV illumination in 0% and 99%
isopropyl ether fractions. fie indicates isopropyl ether fraction. (b) Changes of relative PL intensity (left)
and maximum wavelength (right) of PCS (10.0 M) in CH3CN/isopropyl ether mixtures with different fie
based on the intensity change at = 430 nm. ex = 360 nm. I: PL intensity at different fie. I0: PL intensity at
fie = 0%.
Supplementary Figure 14 Room light images of C3 before and after fuming with I2.

S9
Supplementary Figure 15 Thermogravimetric analysis of C3 after adsorption of iodine vapor for 2 h.
Supplementary Figure 16 The channel viewed along c-axis. The lattice spacing of d (2,1,0) plane in
crystal corresponds to the peak at 2θ = 5.80° in their XRD patterns.

S10
50 100 150 200 250 300 350 40030
40
50
60
70
80
90
100
We
igh
t (%
)
Temperature (C)
CS
C
Supplementary Figure 17 Thermogravimetric analysis scan (TGA) of CS before and after degassing.
5 10 15 20 25 30
CS before gas adsorption-desorption
CS simulated from SC
Inte
nsity
2θ/degree
CS after N2 adsorption-desorption
CS after CO2 adsorption-desorption
Supplementary Figure 18 PXRD profiles of CS before gas adsorption-desorption (red) and after gas
adsorption-desorption (N2 in blue and CO2 in pink) and simulated profile (black).

S11
Supplementary Figure 19 Crystal packing of C with packing distance.
Supplementary Figure 20 The cartoon representation of the transformation from X-aggregation to J-
aggregation.
Supplementary Figure 21 C fummed with I2. Diffusion was blocked as the crystal channel collapsed
after SCSC transition.

S12
Supplementary Figure 22 (a) DSC traces of CS in the first heating process with heating rates of 15 (blue
curve), 10 (pink curve), 5 (red curve), and 2 (black curve) °C min–1. The peak-top positions of the traces
are indicated with black bars. (b) Kissinger plot for the phase transition of CS. In the Kissinger method, β
and Tp denote heating rate and temperature at the maximum of the DSC peak due to the transformation,
respectively, and Ea denotes activation energy.
Supplementary Figure 23 Partial 1H NMR (CD3CN) spectra of (a) CNS after being treated with (b) pH =
1 HCl and (c) pH = 10 NaOH aqueous for 20 h.
S13
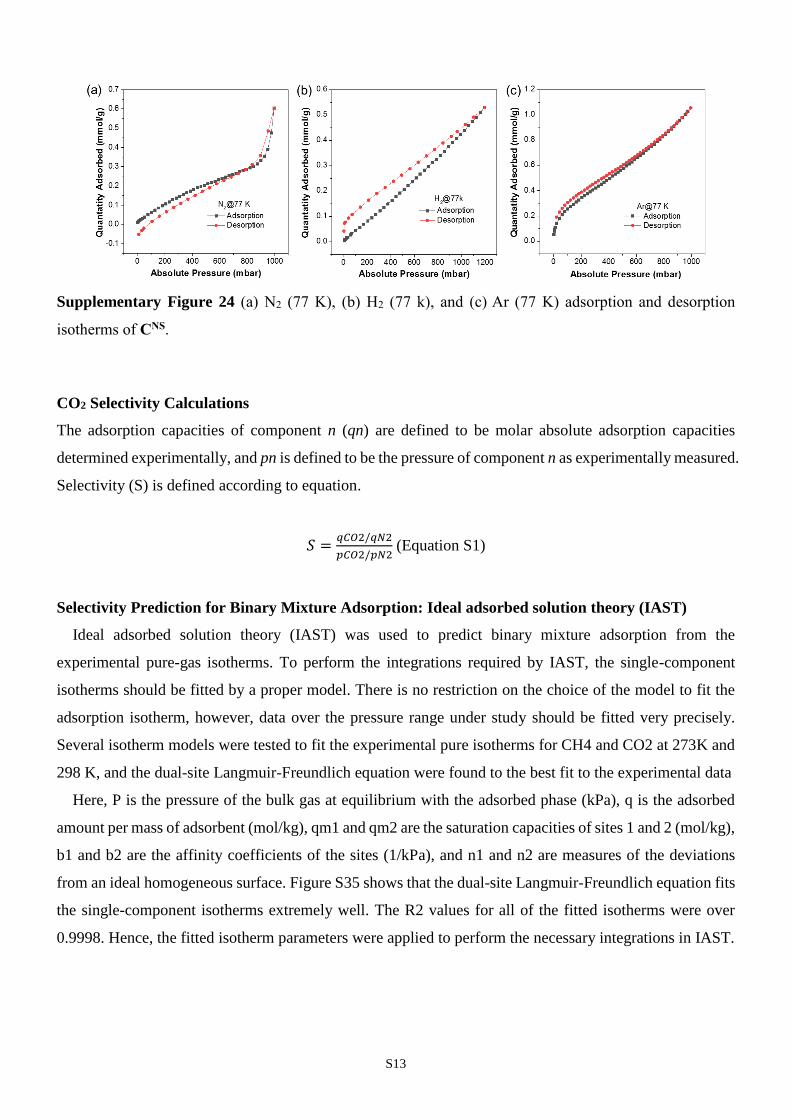
Supplementary Figure 24 (a) N2 (77 K), (b) H2 (77 k), and (c) Ar (77 K) adsorption and desorption
isotherms of CNS.
CO2 Selectivity Calculations
The adsorption capacities of component n (qn) are defined to be molar absolute adsorption capacities
determined experimentally, and pn is defined to be the pressure of component n as experimentally measured.
Selectivity (S) is defined according to equation.
𝑆 =𝑞𝐶𝑂2/𝑞𝑁2
𝑝𝐶𝑂2/𝑝𝑁2 (Equation S1)
Selectivity Prediction for Binary Mixture Adsorption: Ideal adsorbed solution theory (IAST)
Ideal adsorbed solution theory (IAST) was used to predict binary mixture adsorption from the
experimental pure-gas isotherms. To perform the integrations required by IAST, the single-component
isotherms should be fitted by a proper model. There is no restriction on the choice of the model to fit the
adsorption isotherm, however, data over the pressure range under study should be fitted very precisely.
Several isotherm models were tested to fit the experimental pure isotherms for CH4 and CO2 at 273K and
298 K, and the dual-site Langmuir-Freundlich equation were found to the best fit to the experimental data
Here, P is the pressure of the bulk gas at equilibrium with the adsorbed phase (kPa), q is the adsorbed
amount per mass of adsorbent (mol/kg), qm1 and qm2 are the saturation capacities of sites 1 and 2 (mol/kg),
b1 and b2 are the affinity coefficients of the sites (1/kPa), and n1 and n2 are measures of the deviations
from an ideal homogeneous surface. Figure S35 shows that the dual-site Langmuir-Freundlich equation fits
the single-component isotherms extremely well. The R2 values for all of the fitted isotherms were over
0.9998. Hence, the fitted isotherm parameters were applied to perform the necessary integrations in IAST.

S14
7 8 9 10 11 12
0.00000
0.00004
0.00008
0.00012
0.00016
Inc
rem
en
tal
po
re v
olu
me
(cm
3/n
m g
)
Pore width (Å)
Supplementary Figure 25 Incremental pore area versus pore widths of CNS based on the CO2 (273 K)
adsorption isotherms.
0.0 0.5 1.0 1.5 2.020
21
22
23
24
25
CO2 273 K
Heat
of
Ad
so
rpti
on
(kJ/m
ol)
Quantity Adsorbed (mmol/g)
Supplementary Figure 26 CO2 (273 K) adsorption enthalpy of CNS.
S15
5 10 15 20 25 30
C6
Simulated
C1
C2
C3
C5
C4Inte
ns
ity
2/degree
Grinding
(2,1,0)
Fuming
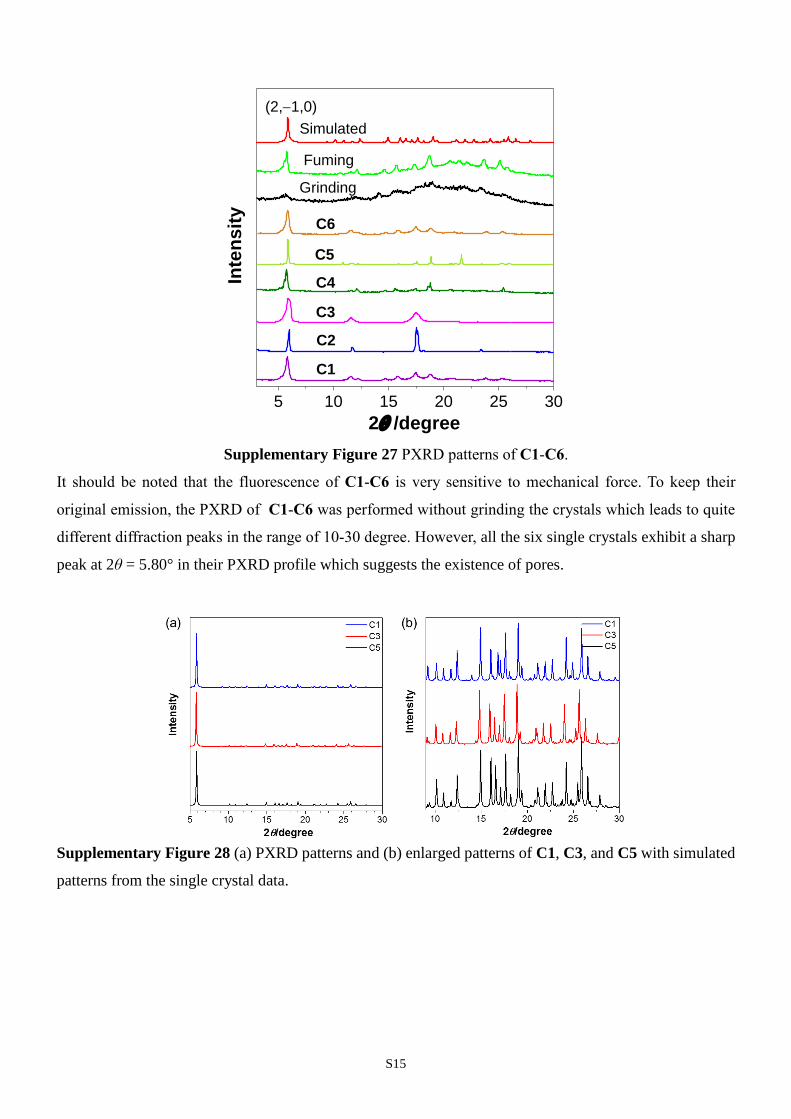
Supplementary Figure 27 PXRD patterns of C1-C6.
It should be noted that the fluorescence of C1-C6 is very sensitive to mechanical force. To keep their
original emission, the PXRD of C1-C6 was performed without grinding the crystals which leads to quite
different diffraction peaks in the range of 10-30 degree. However, all the six single crystals exhibit a sharp
peak at 2θ = 5.80° in their PXRD profile which suggests the existence of pores.
Supplementary Figure 28 (a) PXRD patterns and (b) enlarged patterns of C1, C3, and C5 with simulated
patterns from the single crystal data.

S16
Supplementary Figure 29 Crystal packing of (a) C1, (b) C3 and (c) C5 along c-axis. Inserted are the
corresponding fluorescent images in the crystalline states.
Supplementary Figure 30 Partial 1H NMR spectra of crystals of C1-C6 dissolved in DMSO-d6 shows
their possible solvents in the pores based on the TGA and 1H NMR data.

S17
20 80 140 200 260 320 38060
70
80
90
100
Weig
ht
(%)
Temperature (C)
C1
C2
C3
C4
C5
C6
Supplementary Figure 31 Thermogravimetric analysis scan (TGA) of C1-C6 at a heating rate of 10
C/min.
Supplementary Figure 32 Part of the crystal lattice of (a) C1, (b) C3 and (c) C5. The green dashed line
indicated the intermolecular hydrogen bonding. The yellow dashed line indicated - interactions with
centroid-to-centroid separations. Inserted are the corresponded fluorescent image in the crystalline states.
S18
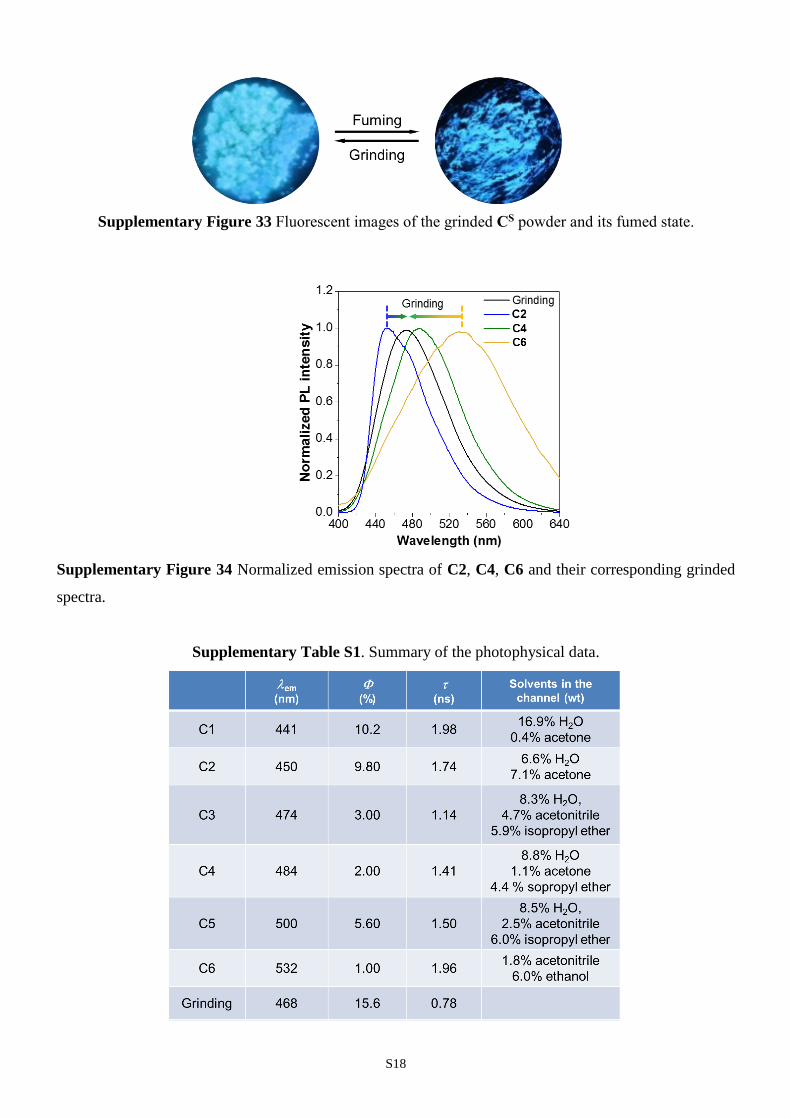
Supplementary Figure 33 Fluorescent images of the grinded CS powder and its fumed state.
Supplementary Figure 34 Normalized emission spectra of C2, C4, C6 and their corresponding grinded
spectra.
Supplementary Table S1. Summary of the photophysical data.

S19
Supplementary Figure 35 Fluorescence decay of (a) C1, (b) C2, (c) C3, (d) C4, (e) C5, (f) C6, and (g)
grinded samples.

S20
C1 C3 C5
Crystallisation Solvent acetone diisopropyl ether
/acetonitrile
diisopropyl ether /acetonitrile
Space Group R3c
Wavelength [Å] 1.54184
Collection Temperature 100 K
Formula C28 H22 N4, 2(PF6), CH3CN, 2H2O
Mr 781.52
Crystal Size (mm) 0.12 x 0.12 x 0.1
Crystal System Trigonal
a [Å] 30.1651(17)
c [Å] 41.393(2)
V [Å3] 32619(4)
Z 36
Dcalcd [g cm-3] 1.432
μ [mm-1] 1.978
F(000) 14328
2θ range [°] 4.343 - 67.475
Reflections collected 37395
Independent reflections,
Rint
6300,0.0630
Obs. Data [I > 2σ] 3590
Data /
restraints /
parameters
6300/ 0/ 435
Final R1 values (I > 2σ(I)) 0.0956
Final R1 values (all data) 0.1416
Final wR(F2) values (all
data)
0.2467
Goodness-of-fit on F2 1.072
Largest difference peak
and hole [e.A-3]
0.701
Flack parameter -0.397
CCDC
S21
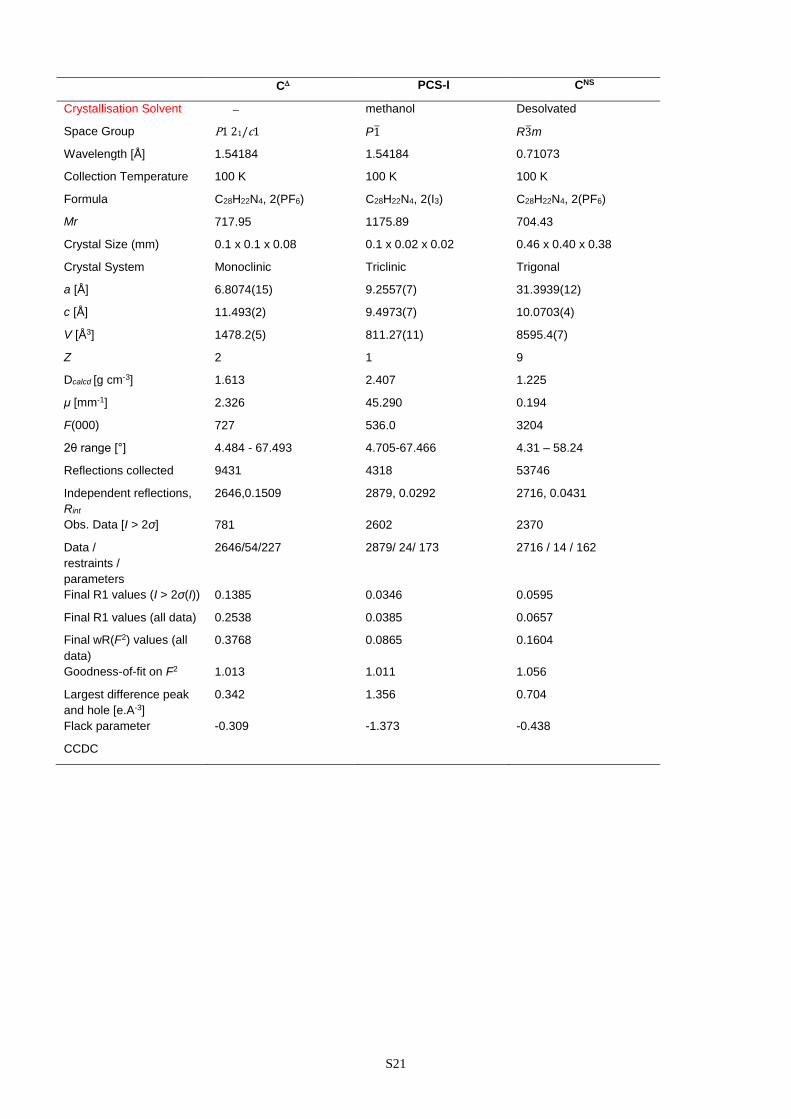
C PCS-I CNS
Crystallisation Solvent methanol Desolvated
Space Group P1 21/c1 P1 R3m
Wavelength [Å] 1.54184 1.54184 0.71073
Collection Temperature 100 K 100 K 100 K
Formula C28H22N4, 2(PF6) C28H22N4, 2(I3) C28H22N4, 2(PF6)
Mr 717.95 1175.89 704.43
Crystal Size (mm) 0.1 x 0.1 x 0.08 0.1 x 0.02 x 0.02 0.46 x 0.40 x 0.38
Crystal System Monoclinic Triclinic Trigonal
a [Å] 6.8074(15) 9.2557(7) 31.3939(12)
c [Å] 11.493(2) 9.4973(7) 10.0703(4)
V [Å3] 1478.2(5) 811.27(11) 8595.4(7)
Z 2 1 9
Dcalcd [g cm-3] 1.613 2.407 1.225
μ [mm-1] 2.326 45.290 0.194
F(000) 727 536.0 3204
2θ range [°] 4.484 - 67.493 4.705-67.466 4.31 – 58.24
Reflections collected 9431 4318 53746
Independent reflections,
Rint
2646,0.1509
2879, 0.0292
2716, 0.0431
Obs. Data [I > 2σ] 781 2602 2370
Data /
restraints /
parameters
2646/54/227 2879/ 24/ 173 2716 / 14 / 162
Final R1 values (I > 2σ(I)) 0.1385 0.0346 0.0595
Final R1 values (all data) 0.2538 0.0385 0.0657
Final wR(F2) values (all
data)
0.3768 0.0865 0.1604
Goodness-of-fit on F2 1.013 1.011 1.056
Largest difference peak
and hole [e.A-3]
0.342 1.356 0.704
Flack parameter -0.309 -1.373 -0.438
CCDC

S22
Supplementary Movie S1. Diffusion process of iodine from two capping faces to the central part.
Supplementary Movie S2. Diffusion under fluorescence microscope started progressing from one capping
face to the central part.
Supplementary Movie S3. Morphological evolution of one single crystal monitored under hot stage
microscopy.
Supplementary Movie S4. Thermosalient behavior of one single crystal monitored under hot stage
microscopy.
Supplementary Movie S5. Diffusion process of iodine of C1 and C.
References:
S1. Yeh, H.-C. et al. Derivative of ,-Dicyanostilbene: Convenient Precursor for the Synthesis of
Diphenylmaleimide Compounds, E-Z Isomerization, Crystal Structure, and Solid-State Fluorescence, J.
Org. Chem. 69, 6455-6462 (2004).
S2. Nishio, S., Higashiguchi, K. & Matsud, K. The Effect of Cyano Substitution on the Fluorescence
Behavior of 1,2-Bis(pyridylphenyl)ethane, Asian J. Org. Chem. 3, 686-690 (2014).

download fileview on ChemRxivNano-tunnel-SI.pdf (2.78 MiB)

Other files
download fileview on ChemRxivMovie.zip (42.08 MiB)