robustness and precision: how data quality may influence ... - precision and accuracy.pdf ·...
TRANSCRIPT

Robustness and Precision: How DataQuality May Influence Key Dependent
Variables in Infant Eye-Tracker Analyses
Sam V. WassMedical Research Council Cognition and Brain Sciences Unit, Cambridge, UK
Linda Forssman and Jukka Lepp€anenSchool of Medicine
University of Tampere, Finland
In recent years, eye-tracking has become a popular method for drawing con-clusions about infant cognition. Relatively little attention has been paid,however, to methodological issues associated with infant eye-tracking. Here,
we consider the possibility that systematic differences in the quality of raweye-tracking data obtained from different populations and individuals mightcreate the impression of differences in gaze behavior, without this actually
being the case. First, we show that lower quality eye-tracking data areobtained from populations who are younger and populations who are morefidgety and that data quality declines during the testing session. Second, we
assess how these differences in data quality might influence key dependentvariables in eye-tracking analyses. We show that lower precision data canappear to suggest a reduced likelihood to look at the eyes in a face relativeto the mouth. We also show that less robust tracking may manifest as
slower reaction time latencies (e.g., time to first fixation). Finally, we showthat less robust data can manifest as shorter first look/visit duration.We argue that data quality should be reported in all analyses of infant
eye-tracking data and/or that steps should be taken to control for dataquality before performing final analyses.
Correspondence should be sent to Sam V. Wass, MRC Cognition and Brain Sciences
Unit, 15 Chaucer Road, Cambridge CB2 7EF, United Kingdom. E-mail: sam.wass@mrc-cbu.
cam.ac.uk
Infancy, 1–34, 2014Copyright © 2014 The Authors. Infancy published byWiley Periodicals, Inc. on behalf of International Society on Infant StudiesThis is an open access article under the terms of the Creative Commons Attribution License,which permits use, distribution and reproduction in any medium, provided the original workis properly cited.ISSN: 1525-0008 print / 1532-7078 onlineDOI: 10.1111/infa.12055
INTRODUCTION
Eye-tracking has become an increasingly widespread research method inrecent years. The number of articles on Web of Science featuring the word“eye-tracking” in the title or abstract increased from 345 in 2008 to 641 in2013. Data presented in these articles have been used to motivate a num-ber of claims about early cognitive development—for example, that infantswith variation in serotonin-system genes show heightened attention tosocial signals of fear (Forssman et al., 2014a), that 24-month-old infantsare capable of making false belief attributions (Southgate et al., 2007),and that children with language impairments show deficits in fine-grainedinhibitory control (Kelly et al., 2013). The variety of conceptual challengesinvolved in making these inferences have been discussed elsewhere (Aslin,2007, 2011).
Although eye-tracking has countless advantages over other means ofmeasuring infants’ eye movements (e.g., higher temporal and spatial reso-lution), the use of this technology is also associated with several methodo-logical issues that have been relatively little discussed hitherto (see Aslin,2011; Gredeback, Johnson, & von Hofsten, 2010; Oakes, 2010a; Shic,Chawarska, & Scassellati, 2008, 2009). One issue, which is the focus of thepresent paper, is the possibility that systematic differences might be identi-fiable in the quality of raw eye-tracking data obtained from different indi-viduals and that these differences might cause the appearance ofdifferences in gaze behavior, without this actually being true. Such anexplanation might be seen as analogous to the ongoing debate on motionbiases in connectivity analyses based on magnetic resonance imaging–where, for example, it has been speculated that systematic differences inthe amount of in-scanner movement between typical individuals and thosewith autism spectrum disorders (ASD) might in fact be the cause of thewidely reported apparent differences in functional and structural brainconnectivity (Power, Barnes, Snyder, Schlaggar, & Petersen, 2012;Yendiki, Koldewyn, Kakunoori, Kanwisher, & Fischl, 2013).
Our concerns pertain to three types of eye-tracking paradigm in particu-lar. First, instances in which a single paradigm is shown both to typicalindividuals and an atypical group, as defined either clinically, epidemiologi-cally, or based on some other facet of behavior. (Take, for example, studiescomparing infants from high vs. low socioeconomic status backgrounds orstudies comparing eye movements in good vs. poor language learners.)Could it be the case that the groups differ on some other aspect of behavior(such as fidgetiness or irritability during testing) which causes differences indata quality—which can cause the appearance of differences in gaze behav-ior, without this actually being the case? Second, instances in which a single
2 WASS, FORSSMAN, & LEPPANEN

paradigm is shown to younger and to older individuals. In such a case,could it be that lower quality data obtained from younger individuals mightcause apparent differences in gaze behavior? Third, studies in which dataquality might vary systematically between conditions of an experiment. Thismight be the case in instances where one condition is more engaging thananother or where one condition is consistently presented before another.Again, this might lead to differences in data quality between conditions,which might misleadingly cause the appearance of actual differences in gazebehavior.
If such differences were to exist, they would go largely undocumented.Even current best practices in infant eye-tracking (Oakes, 2010b) requestonly that experimenters describe the quality of the calibration obtainedprior to recording in terms of the number of calibration points successfullyobtained (see Table 1 for a definition of calibration and of other key tech-nical terms described in this paper). They do not request any informationabout the quality of tracking obtained during recording. Yet this can varysubstantially between individuals, as we describe below.
TABLE 1
Glossary
More detailed descriptions of these terms can be found in Holmqvist et al., (2011)
Areas of Interest (AOI) – Participants’ gaze is typically analyzed relative to certain user-
defined Areas of Interest (AOIs) within the stimulus presentation screen. See Figures 6a,c
and Figure 9a for examples
Calibration – a series of small objects are presented at predetermined locations on the
screen; the participant’s position of gaze is recorded during this sequence. All subsequent
gaze data have a correction that was calculated during calibration. When calibration data
is absent, the eye tracker uses a default calibration based on a prototypical eyeball
Corneal reflection – all commercial eye trackers work by tracking the position of the
participant’s pupil (which moves as the eye moves) relative to the position of an infra-red
light reflected from the participant’s cornea (which remains still as the eye moves)
Fixation duration – when viewing a visual array we spontaneously manifest a sequence of
eye movements in order to ensure that light from objects of interest is projected onto the
fovea. Our eyes alternate between periods in which the eye is static and visual processing
occurs (fixations) and rapid eye movements (saccades) during which visual processing is
suppressed. Within the infant literature, the same term has also sometimes been used
more approximately to refer to looks to vs away from the screen
Interpolation – the process of ‘filling in’ missing sections of data
Look/visit durations – these are typically reported as the time interval elapsed between gaze
entering an AOI and leaving it. A number of fixations (refoveating eye movements) can
therefore be contained within a look
Position of gaze (POG) – eye trackers typically return the participant’s position of gaze
(POG) relative to a 2-D stimulus presentation area (usually a computer screen). POG is
typically returned in X (horizontal) and Y (vertical) screen coordinates
Precision – the degree to which reporting of POG is consistent between samples
INFANT EYE-TRACKER DATA QUALITY 3

DATA QUALITY IN INFANT EYE-TRACKING—WHY MIGHT IT BEAN ISSUE?
Most eye-trackers used in infant eye-tracking require three separateelements to be identified to estimate where an infant is looking: the posi-tion of the pupil, the reflection of a point-light that is projected from theeye-tracker on the infant’s eyeball, and the position of the infant’s head in3D space (Aslin & McMurray, 2004; Duchowski, 2007; Holmqvist et al.,2011; Kolakowski & Pelz, 2006). Figure 1a shows an example of a typicaleye image in which the pupil and corneal reflection have been identified.
Infants, unlike adults, often fidget and move in sitting position duringrecording. This can lead to changes both in the position of the headrelative to the tracker and in the angle of the eyes relative to the tracker(see Figure 1b,c). These can disrupt the accuracy of eye-tracking in anumber of ways (Holmqvist et al., 2011). In instances where the child isleaning back, or viewing the eye-tracker at an angle, the corneal reflectionmay be obscured by a “droopy” eyelid. Similarly, the pupil can beinaccurately identified if either the pupil or iris is partially obscured by theeyelid, or due to shadows on the iris. Positioning of the face nonperpen-dicular to the camera can disrupt the algorithms used to identify the posi-tion of the face in 3D space. Infants also present a number of furtherchallenges during tracking. For example, increased wateriness in infants’eyes (even in the absence of crying) can lead to the identification ofmultiple corneal reflections, causing inaccurate gaze tracking. Large pupils(common in infants) can be hard to identify by pupil detection algorithmsdesigned for adult eyes. And finally, infant eye-tracking experiments ofteninclude displays with abrupt changes in luminance and participant move-ment, which can lead to inaccuracies in the automated techniques used for
Proportion looking to AOIs - the proportion of gaze data within a particular AOI relative
to the total gaze data available for that trial
Robustness – how broken or fragmented contact with the eye tracker is during recording.
Saccadic reaction times – the time interval between an event taking place and the first
recorded oculomotor response to that event
Sampling frequency – the number of POGs returned by the eye tracker per second.
Commercial eye trackers vary from c. 25 Hz (i.e. 25 POGs returned per second) to
2000 Hz
Smoothing – the process of compensating for inconsistent reporting of position of gaze (i.e.
low precision)
Spatial accuracy – the disparity between where the participant is actually looking and the
POG reported by the eye tracker
Table 1 (Continued)
4 WASS, FORSSMAN, & LEPPANEN

finding and maintaining the correct threshold for identification of thepupil and/or corneal reflection.
These problems can affect the quality of data obtained during eye-tracking in four ways. The first problem, known as low precision data(Blignaut & Beelders, 2012; Blignaut & Wium, 2014; Holmqvist et al.,2011), occurs when one of the elements (pupil, corneal reflection, or headposition) is incorrectly identified by the eye-tracking software. In caseswhere this error is random and varies from one gaze sample to the next,this can lead to increased sampling error (i.e., increased variance, akin toa “noisier signal”) in the reporting of the infant’s position of gaze. SeeFigure 2, Sample 2 for an example.
A second problem, known as low robustness, can occur if any one ofthe three elements is unavailable during tracking (e.g., a corneal reflectionbeing obscured by an eyelid). This can lead to the tracker failing to reporton the position of gaze at all. Inspection of the raw data obtained duringtracking suggests that data often “flicker” off for periods ranging froma few milliseconds to several seconds. See Figure 2, Sample 3 for anexample.
A third parameter of data quality, which we do not discuss in the pres-ent article, is that of spatial accuracy during tracking. This is a disparitybetween where an infant is actually looking and the reported positionof gaze returned by the eye-tracker; often this is a consistent error andmanifests as the eye-tracker recording gaze accurately but “throwing”every measurement off by a certain amount. Figure 3 illustrates the differ-ence between spatial accuracy and precision. Frank, Vul, and Saxe (2011)and Morgante, Zolfaghari, and Johnson (2012) have both previouslyexamined spatial accuracy in eye-tracking and reported substantial inaccu-
(a) (b) (c)
Figure 1 Panel a shows an eye image obtained during recording, with the blue
square showing the pupil, and the yellow cross-hairs showing the corneal reflection.
This image is taken from a Positive Science eye-tracker although similar eye images
are available with most trackers (although not with Tobii eye-trackers). Panels b and c
show variability in positions during tracking from human infants, with Panel b
showing an infant early in the testing session and Panel c showing the same infant
later in the testing session, after a change in position.
INFANT EYE-TRACKER DATA QUALITY 5

Posi�on of gaze
Fixa�on dura�ons (�me intervals between eye movements)
Good quality sample
Low precision sample
Low robustness sample
X - le� eye
Y - le� eye
X - right eye
Y - right eye
X - le� eye
Y - le� eye
X - right eye
Y - right eye
X - le� eye
Y - le� eye
X - right eye
Y - right eye
0 1
0
1
X dimension
Y d
imen
sion
0 1
0
1
X dimension
Y d
imen
sion
Figure 2 Samples of viewing data from a Tobii 1750 tracker recording at 50 Hz.
Data are from 11-month-old typically developing infants. In eyetracking data four
datapoints are available at each time point — showing where on the X dimension of the
screen the left and right eyes are looking, and where on the Y dimension the left and
right eyes are looking. The first sample illustrates high quality data, with continuous
data and individual fixations and saccades clearly visible. Fixations (time intervals
between eye movements) are clearly visible and are marked in red along the top. The
position of gaze at each instant can be analyzed with a high degree of confidence (see
sample frames). The second sample illustrates low precision data, in which reported
POG is not stable. The third sample illustrates low robustness with periods of missing
data ranging from one iteration to several 100 msec. Figure based on Wass et al.
(2013). See Figure S1 for further samples of raw data, obtained from a Tobii TX300.
6 WASS, FORSSMAN, & LEPPANEN

racies that can become more severe over time (“drift”). They assess spatialaccuracy by adding an additional, user-defined calibration check duringdata recording (e.g., using scripts downloaded from: http://langcog.stan-ford.edu/materials/calib.html). Based on these data, Frank and colleaguescalculated two regressions for the X and Y coordinates independently andused these to correct the gaze estimates returned by the eye-tracker (Franket al., 2011).
In addition, there is a fourth parameter of data quality, which we alsodo not discuss in depth in this article. This is temporal delay—that is,
Samples (120 Hz)
Samples (120 Hz)
(a)
(b)
Figure 3 The difference between spatial accuracy (or offset) and precision (or
consistency). (a, b) Shows samples of data recorded during a post hoc calibration
check (using techniques similar to those described in Frank et al., 2011). In each plot,
time is represented on the X axis and reported POG (just in the X dimension) on the
Y. Red shows the position of a small object (subtending c. 0.4°) presented on-screen;
this is assumed to the point at which the infant is actually looking. The gaze
coordinates reported by the eye-tracker are shown in blue. (a) The reporting of the
position of gaze is highly consistent between samples, but all the samples are
“thrown” off by a certain amount, relative to the point where the participant is
actually looking. This sample shows high precision but low spatial accuracy. (b) The
reporting of the position of gaze is more inconsistent between samples, but the
accuracy—that is, the average of all gaze coordinates returned relative to the position
where the participant is actually looking—is relatively normal. This sample therefore
shows low precision but relatively normal spatial accuracy. Post hoc verification
checks (video-coding) confirmed that both errors are attributable to measurement
errors in the eye-tracker.
INFANT EYE-TRACKER DATA QUALITY 7

the latency between an eye gaze event taking place and the eye gazeevent being reported by the eye-tracker. Morgante et al. (2012) examinedthis parameter by comparing the POG overlay and the stimulus in avideo exported from a Tobii Studio recording. The latency was measuredby comparing the exported POG video with the Tobii Studio combinedfile (Text Export file). They found that the eye movement latency mea-sured from the exported video might deviate up to 54 msec when com-pared with the Tobii Studio combined file. When the stimuli werepresented in E-prime and recorded simultaneously in Tobii Studio as avideo, they also observed a drift—that is, an increase in recording dis-crepancy with increasing time, between the exported POG video fromTobii Studio and the E-prime gaze data file. Similarly, Shukla, Wen,White, and Aslin (2011) used a separate video camera to analyze thetime delay between an eye movement taking place and being recorded bythe eye-tracker. They compared results from a high-speed camera run-ning at 300 frames per second directed at their participant’s eye with thatof a Tobii 1750 interfacing with Matlab via Talk2Tobii and Smart-T.Their results suggested that more than 95% of samples showed a dis-crepancy of under 100 msec. Although important, this error is less ofinterest in the present case, as there is no reason to believe that thiserror might vary systematically between individuals, when the hardwaresetup used is kept constant.
THE PRESENT STUDY
In the present study we concentrate on the first two parameters ofdata quality, as these have received little attention hitherto in the litera-ture. The first is precision, the consistency in the reported POG betweensamples. And the second is robustness, how broken or fragmented contactwith the tracker is during recording.
In Wass, Smith, and Johnson (2013; see also Shic et al., 2008, 2009),we have previously examined how precision and robustness can affect theaccuracy of the automated parsing techniques used to identify fixationdurations—that is, the time intervals between saccadic eye movements (seeTable 1). Our analyses suggested that robustness strongly influences fixa-tion durations as returned by standard, commercially available fixationduration parsing algorithms (r = .66/.47/.19 in the 6-/12-month-old/adultsamples we examined): More robust data are associated with apparentlylonger fixation durations. We also identified strong relationships betweenprecision and the fixation durations returned by standard fixation parsingalgorithms (r = �.67/�.14/�.47 in the 6-/12-month-old/adult samples we
8 WASS, FORSSMAN, & LEPPANEN

examined): Less precise data are associated with apparently shorter fixa-tion durations. Through simulations and hand-coding, we identified possi-ble underlying causes for these relationships (Wass et al., 2013). To ourknowledge, however, no previous research has investigated whether similarconfounding influences can be identified between data quality and otherkey dependent variables in eye-tracking analyses, such as proportion look-ing to areas of interest (AOIs) and look/visit durations and saccadic reac-tion times (see Table 1).
We have also investigated whether systematic differences in precisionand robustness can be identified between clinical and nonclinicalpopulations. One study compared eye-tracking quality in data from 6- to11-month-old infants at high vs. low familial risk of developingASD (Wass, Jones, Gliga, Smith, Charman, Johnson, & BASIS team,under review). Although precision did not vary between populations, non-significantly (but consistently across two independent cohorts) lowerrobustness was identified in data from high-risk (ASD) relative to low-riskinfants. However, to our knowledge, no previous research has examinedwhether eye-tracker data quality varies systematically as a result of factorssuch as age and testing time, as well as other aspects of behavior, such asfidgetiness during tracking.
Our aims for the present study were therefore twofold. First, we wishedto examine whether systematic differences could be identified in data qual-ity from different individuals—for example, whether younger individualstend to show lower quality tracking. Second, we wished to explore howdata quality might influence other key dependent variables in eye-trackeranalyses. Previously, we have shown that lower quality data can create theimpression of shorter fixation durations. Here, we examine whether dataquality can relate to three other dependent variables, namely proportionlooking to particular AOI (e.g., to the eyes relative to the mouth in aface), to reaction times and visit/look duration.
To address these questions we have conducted a number of analysesbased on preexisting datasets, collected from different populations, ondifferent eye-trackers and during the administration of different eye-track-ing paradigms. For each analysis, we have laid out our specific predictionsand hypotheses, as we describe case by case below.
The analyses presented are in six parts. In analyses 1–3, we evaluatehow data quality varies systematically between and within individuals. Weconsidered this important because, whereas some degree of random mea-surement error is inevitable, it leads to a risk of false-negative but not offalse-positive findings—whereas systematic measurement error leads to arisk of false-positive findings. The three specific factors we examined areage (analysis 1), testing time (early vs. late in the testing session’ analysis
INFANT EYE-TRACKER DATA QUALITY 9

2), and noncognitive factors such as the amount of movement duringrecording (analysis 3).
In analyses 4–6, we evaluate how data quality may systematically influ-ence a number of key dependent variables in eye-tracking analyses. Previ-ously we have shown that participants from whom worse quality tracking isobtained give the impression of showing shorter fixation durations. Here,we examine how data quality might lead to systematic biases on otherparameters, namely proportion looking reported to AOI (analysis 4),reaction time latencies (analysis 5), and first look/visit duration (analysis 6).
METHODS
Participants
Data included in these analyses are taken from two sources. The first is anongoing cross-sectional study that comprises a series of laboratory assess-ments administered to 9-, 12- and 15-month-olds typically developinginfants (unpublished data). The second is an ongoing randomized-con-trolled study examining the training of attentional control in 9-month-oldinfants (Forssman, Wass, & Lepp€anen, 2014b). All of the data reportedhere are taken from the first visit in this repeat-visit study, before anytraining was conducted. For both studies, the eye-tracking data includedin this paper were recorded concurrently with electrocardiogram measure-ments, which have not been included in this report. Analysis 1 alsoincludes a comparison sample of data from typical young adults that wascollected specially for this study.
Stimuli
Analyses 1, 3, 5, and 6 are based on a gaze following experiment that usesstimuli taken from Condition 1 (the eye contact condition) of Senju and Csi-bra (2008). Twelve 8-sec clips were presented. In each video, an actress seatedat a table began each trial with her head lowered. 2,400 msec after the start ofeach trial she raised her head and looked directly at the camera. 4,200 msecafter the start of each trial, she looked at one of the two objects; her gazeremained on that object until the end of the trial. Figure 9a illustrates thescreen layout and shows the AOI on which analyses were based.
Analyses 2 and 4 are based on a visual paired comparison task featur-ing a number of different faces (taken from Lundqvist, Flykt, & €Ohman,1998; see Figure 6a,c, e.g.). All data included in this study are taken fromthe familiarization phase of this experiment. In this phase, a single facewas presented on-screen continuously until 10 sec of accumulated looking
10 WASS, FORSSMAN, & LEPPANEN
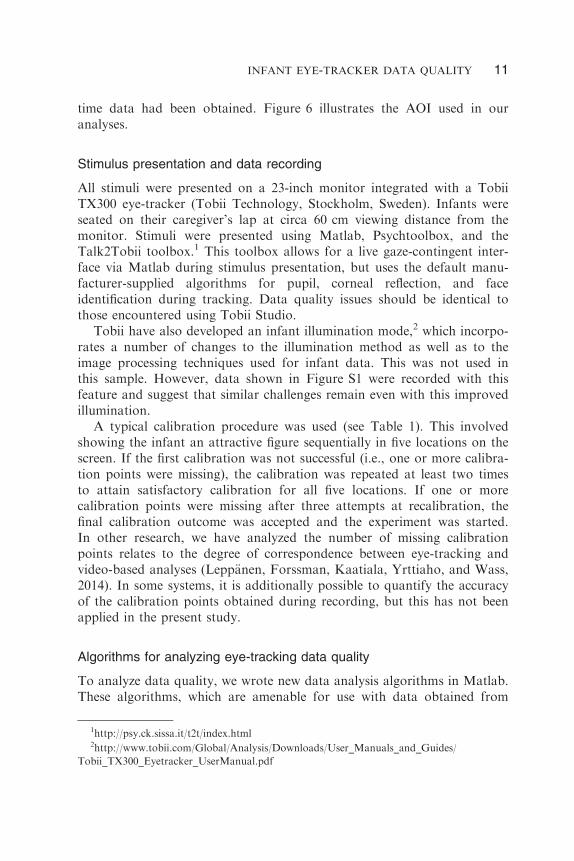
time data had been obtained. Figure 6 illustrates the AOI used in ouranalyses.
Stimulus presentation and data recording
All stimuli were presented on a 23-inch monitor integrated with a TobiiTX300 eye-tracker (Tobii Technology, Stockholm, Sweden). Infants wereseated on their caregiver’s lap at circa 60 cm viewing distance from themonitor. Stimuli were presented using Matlab, Psychtoolbox, and theTalk2Tobii toolbox.1 This toolbox allows for a live gaze-contingent inter-face via Matlab during stimulus presentation, but uses the default manu-facturer-supplied algorithms for pupil, corneal reflection, and faceidentification during tracking. Data quality issues should be identical tothose encountered using Tobii Studio.
Tobii have also developed an infant illumination mode,2 which incorpo-rates a number of changes to the illumination method as well as to theimage processing techniques used for infant data. This was not used inthis sample. However, data shown in Figure S1 were recorded with thisfeature and suggest that similar challenges remain even with this improvedillumination.
A typical calibration procedure was used (see Table 1). This involvedshowing the infant an attractive figure sequentially in five locations on thescreen. If the first calibration was not successful (i.e., one or more calibra-tion points were missing), the calibration was repeated at least two timesto attain satisfactory calibration for all five locations. If one or morecalibration points were missing after three attempts at recalibration, thefinal calibration outcome was accepted and the experiment was started.In other research, we have analyzed the number of missing calibrationpoints relates to the degree of correspondence between eye-tracking andvideo-based analyses (Lepp€anen, Forssman, Kaatiala, Yrttiaho, and Wass,2014). In some systems, it is additionally possible to quantify the accuracyof the calibration points obtained during recording, but this has not beenapplied in the present study.
Algorithms for analyzing eye-tracking data quality
To analyze data quality, we wrote new data analysis algorithms in Matlab.These algorithms, which are amenable for use with data obtained from
1http://psy.ck.sissa.it/t2t/index.html2http://www.tobii.com/Global/Analysis/Downloads/User_Manuals_and_Guides/
Tobii_TX300_Eyetracker_UserManual.pdf
INFANT EYE-TRACKER DATA QUALITY 11

any eye-tracker, are available for download.3 Below is a detailed descrip-tion of how the two parameters of data quality on which we report in thisstudy, precision and robustness, were calculated.
Precision
Previous research on both adults (Blignaut & Beelders, 2012; Holmqvistet al., 2011) and infants (Frank et al., 2011; Morgante et al., 2012) hasanalyzed eye-tracker accuracy by recording eye gaze position as the eyeviews a series of stationary targets presented at different places on thescreen (akin to a post hoc calibration). If we assume that the infant is look-ing at the calibration point presented, any difference between the positionwhere the target is presented and the position of gaze reported by the eye-tracker is the error involved in eye-tracking. From this error, two measuresare calculated—spatial accuracy (or offset) and precision (or consistency).Figure 3 illustrates the difference between the two. It shows two samplesrecorded during a post hoc calibration check. In each case, the position ofthe calibration target has been plotted in red. As in all calibrationsequences, it is assumed that the position of this target (normally a small,salient target on an otherwise blank screen) corresponds to the actual POGof the participant. The POG reported by the eye-tracker is, in each case,drawn in blue. Sample (a) shows high consistency (stability) in reportedPOG but a large stable offset between reported POG and assumed actualPOG. It therefore suggests low spatial accuracy but high precision (consis-tency). Sample (b), in contrast, shows markedly more inconsistent report-ing of POG between samples. It therefore suggests low precision.
We wished to develop a technique for measuring precision that can beapplied post hoc to any previously recorded data—even that for whichpost hoc calibration data are unavailable. In Wass et al. (2013), we usedwithin-fixation variance to estimate precision. However, this techniquerequires fixation parsing first to be performed; in contrast, the techniquepresented here requires no prior calculations.
Precision was calculated in three stages. First, the raw sample-by-sam-ple X and Y screen coordinates obtained during tracking were exportedfrom the recording software (e.g., Tobii Studio or E-prime) originally usedand imported into Matlab. Second, data were smoothed using a simpledown-sampling procedure: They were chunked into consecutive window-sized segments using a 100 msec window size, and a single median averagewas calculated per window. For windows in which fewer than 50% ofsamples (i.e., 15 samples in 100 msec window with 300 Hz data) were
3https://www.mrc-cbu.cam.ac.uk/people/sam.wass/
12 WASS, FORSSMAN, & LEPPANEN

Position on screen (0 to 1) (redand blue)
Itera
tions
(300
Hz)
Itera
tions
(300
Hz)
(a)
(b)
Position on screen (0 to 1)
Itera
tions
(50H
z)
(d)
(c)
Diff rough vs smooth (black)
Position on screen (0 to 1) (redand blue)
Diff rough vs smooth (black)
Orig
inal
Inte
rpol
ated
Ava
ilabl
e da
ta fr
agm
ent
No
data
ava
ilabl
e
Position on screen (0 to 1)
Itera
tions
(50H
z)
Orig
inal
Inte
rpol
ated
Ava
ilabl
e da
ta fr
agm
ent
No
data
ava
ilabl
e
Figure
4Dem
onstrationofprecisionandrobustnesscalculations.
Forprecisioncalculations(a,b),theredlineshowstheroughdata,
thebluelineshowsthedown-sampleddata,andtheblack
lineshowsthedifference
betweenthetw
o,calculatediterationbyiteration.
Themediandifference
wastaken
asourprecisionmeasure.Forrobustnesscalculations(c,d),
two30-sec
samplesof50Hzdata
are
shown.Thebluediamondsshow
theraw
data;theredcirclesshow
thedata
forwhichasuccessfulinterpolationcould
beperform
ed.
Theyellow
bars,alongthexaxis,show
thefragments
ofusable
data
obtained.
INFANT EYE-TRACKER DATA QUALITY 13

available, the entire window was returned as blank and excluded from fur-ther calculations. Third, the precision of the raw data was calculated byanalyzing the average difference between the down-sampled and the unfil-tered data across all samples obtained.
Figures 4a,b illustrates these analyses. Figure 4a shows an example of“high precision” data and 4b an example of “low precision” data. Foreach, the rough (unsmoothed) and the smoother gaze data have beendrawn; the black lines (with a separate y axis) show the difference betweenthe smoothed and unsmoothed data. It can be seen that the “low preci-sion” data show more “jitter” or variation from sample to sample; thiscorresponds to a larger differences (drawn black) between the smoothedand unsmoothed data. (Video-based analyses confirm that this does notarise from oculomotor instability in the participant, but rather from sam-pling inaccuracy in the eye-tracking device.) The median differencebetween filtered and unfiltered data was calculated as an estimate of preci-sion. A higher value of the precision metric therefore represents less pre-cise tracking. The calculation was performed separately for the x and ygaze coordinates and then averaged.
Robustness
Robustness is calculated as the relative proportion of periods of datapresence vs. absence during recording. There are two causes of dataabsence: First, the participant is not looking at the screen; second, theparticipant is looking at the screen but the eye-tracker is failing to detectit. As previously described, the eye-tracker aims to perform three separateidentifications per frame to perform POG parsing: pupil, corneal reflec-tion, and head position. An inability to perform any of these identifica-tions accurately can lead to the eye-tracker returning null values for thatframe, leading to periods of data loss ranging from a single samplethrough to periods of several seconds (see Figures 2, 4 and S1).
Previous discussions of robustness have reported the total proportionof data within the testing session for which data are available (Holmqvistet al., 2011). Following previous research (Wass et al., 2013), we havetaken a different approach and reported the duration of mean usable datafragments obtained. This allows us to differentiate between (1) cases inwhich the participant showed unbroken looking during the first half of atrial, followed by completely absent data for the second half, and (2)instances in which the infant was looking continuously throughout thetrial but contact with the eye-tracker flickered on and off throughout thetrial. Figure 4c,d illustrates the difference between the two. Both of thesecases might manifest as, say, 50% of data available, although the effect
14 WASS, FORSSMAN, & LEPPANEN

of robustness on key dependent variables in eye-tracking data would bevery different between the two cases. Calculating average fragment dura-tion as a measure of robustness allows us to differentiate between the two.See Figure S2 for a detailed comparison of how the two measuresinterrelate.
Average fragment duration was calculated in the following manner.First, raw data were exported from the recording software originally used(e.g., Tobii Studio) and imported into Matlab. Second, interpolation(see Table 1) was performed to give a more accurate estimate of theamount of usable data available for each individual. The interpolationalgorithm became active once a gap in the data was located. If the gap inthe data was more than 150 msec, no interpolation was attempted. If thedata gap was <150 msec, data were linearly interpolated until the firstusable data sample was reached. The figure of 150 msec was selected asour experience suggests that this is the minimum approximate timebeneath which no complete saccade-fixation-saccade sequences will bepresent (e.g., Wass et al., 2013). However, it is possible that blinks willlast <150 msec (Holmqvist et al., 2011).
Following interpolation, the velocity was calculated between the lastinterpolated sample and the first sample after interpolation; if the veloc-ity change was above a threshold of 35° sec�1, it was judged that thedata before or after the interpolated sample were insufficiently accurateor that a saccade may have taken place during the interpolated sample,and the interpolation was rejected (see Wass et al., 2013 for detailedmotivation). Third, the mean duration of the usable data fragments wascalculated, as well as frequency distributions of all usable data fragmentsobtained.
Our algorithms also return two other robustness measures: First, thetotal proportion of available data and second a frequency distributionshowing how the available data fragments were distributed. Figure S2illustrates the results of these analyses in a sample dataset. It includes ascatterplot showing how average fragment duration relates to proportionof available data samples.
The strength of the relationship between these two parameters of dataquality may vary between eye-trackers. In previous research, based ondata from a Tobii 1750, we conducted similar (not identical) calculationsto estimate how robustness and precision covary within a dataset andreported low correlations (average r = �.12; Wass et al., 2013). In thepresent dataset (based on data from a Tobii TX300), however, these rela-tionships were found to be markedly higher. In one sample we analyzed,for example, they were found to be as high as r (49) = �.58, p < .001. Thereasons for these differences may be to do with different tracking method-
INFANT EYE-TRACKER DATA QUALITY 15
ologies used by different eye-trackers. We have reported both dimensionsof data quality separately in the analyses that follow.
RESULTS
Our results are presented in six parts. In analyses 1–3, we evaluate howdata quality varies between and within individuals as a function of age,testing time, and gross behaviors during tracking. In analyses 4–6, weevaluate how data quality relates to a range of common eye-tracking vari-ables, namely proportion looking to AOI, reaction time latencies, and firstlook/visit duration.
In the analyses that follow, unless otherwise stated any group meancomparison reported was calculated using an independent samples t-test(two-tailed), and any bivariate correlation was calculated using a Pearson’sproduct moment correlation.
Analysis 1—How does data quality vary between infants and adults?
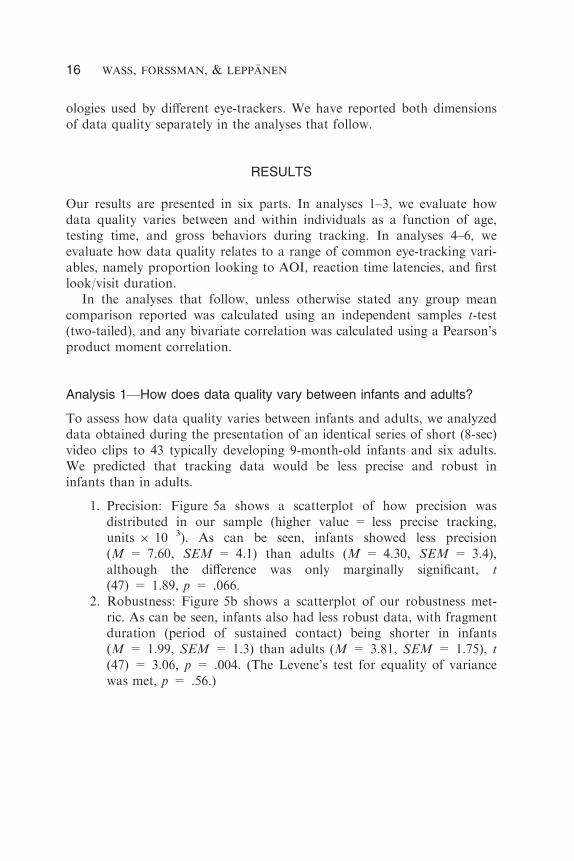
To assess how data quality varies between infants and adults, we analyzeddata obtained during the presentation of an identical series of short (8-sec)video clips to 43 typically developing 9-month-old infants and six adults.We predicted that tracking data would be less precise and robust ininfants than in adults.
1. Precision: Figure 5a shows a scatterplot of how precision wasdistributed in our sample (higher value = less precise tracking,units 9 10�3). As can be seen, infants showed less precision(M = 7.60, SEM = 4.1) than adults (M = 4.30, SEM = 3.4),although the difference was only marginally significant, t(47) = 1.89, p = .066.
2. Robustness: Figure 5b shows a scatterplot of our robustness met-ric. As can be seen, infants also had less robust data, with fragmentduration (period of sustained contact) being shorter in infants(M = 1.99, SEM = 1.3) than adults (M = 3.81, SEM = 1.75), t(47) = 3.06, p = .004. (The Levene’s test for equality of variancewas met, p = .56.)
16 WASS, FORSSMAN, & LEPPANEN

Analysis 2—How does data quality vary between early and late in atesting session?
In addition to analyzing how eye-tracker data quality varies betweenindividuals as a function of factors such as age (Analysis 1) and risk
(a) (b)
(c) (d)
(e) (f)
Figure 5 Top—Scatterplots showing how data quality varies between infants and
adults. Each data point represents the mean values obtained for one individual; (a)
precision, (b) robustness. Middle—Scatterplots showing how data quality varies
between individuals over time. Two datapoints are obtained per individual, one
recorded early and one late in the session; (c) precision, (d) robustness. Bottom—Scatterplots showing the relationship between head movement and data quality;
(e) precision, (f) robustness.
INFANT EYE-TRACKER DATA QUALITY 17

group status (clinical vs. nonclinical; Wass, Jones, Gliga, Smith, Char-man, Johnson, & BASIS team, under review), we also wished to assesshow data quality varies within individuals over time. To assess this, weanalyzed data obtained during the presentation of a visual paired com-parison task to 16 typically developing 9-month-old infants. Figure 5c,dshows scatterplots illustrating the results of these analyses. This taskwas presented in different blocks, interspersed with other tasks in a het-erogeneous testing battery that lasted circa 15 min in duration. Wecompared eye-tracking data obtained during the presentation of the firstblock, which was presented typically 4–5 min into the testing session,with the last block, which was presented typically 12–13 min into thetesting session. The data plotted are averages of the trials within eachblock. We predicted that lower quality data would be obtained later inthe testing session.
1. Precision: As can be seen in Figure 5c, and as expected, dataobtained from infants were significantly less precise early in the ses-sion (M = 4.21, SEM = 0.34) than later (M = 4.80,SEM = 0.38), t (15) = 3.00, p = .008). It is noteworthy that,despite this fall-off in performance as testing continued, test–retestreliability was high (r = .80), suggesting that precision is stable asan index of individual differences.
2. Robustness: As the data shown in Figure 5d for robustness werenot normally distributed, as indicated by a one-sample Kolmogo-rov–Smirnov test, Z (18) = .24, p = .006), nonparametric testswere used. The results indicated that the median fragment dura-tions from early in the session (M = 1.5, SEM = 0.6) and later(M = 0.9, SEM = 0.2) were not appreciably different, Wilcoxonsigned-rank test, Z = �.1.1, p = .26. Thus, the robustness oftracking was not found to decline across the session.
Analysis 3—How does data quality vary contingent on head movement?
To explore how data quality relates to other parameters of behavior, suchas subject movement during data recording, we analyzed head movementvelocity. All Tobii trackers record the positions of the two eyes indepen-dently in 3D space relative to the screen at all times during recording.These data were exported from the data analysis software into Matlabwhere the following processing steps were applied. First, because visualinspection of the data suggested they were vulnerable to occasional egre-gious artifact, the velocity of all samples was calculated separately for the
18 WASS, FORSSMAN, & LEPPANEN

three dimensions (x, y, and z) and samples showing a shift in position of>1.25 cm between individual iterations (in 300 Hz data) were excluded onthe basis that such values were above the maximum velocity with whichan infant could move their head and were therefore likely to be artifac-tual. Second, data were down sampled to 30 Hz using a median movingwindow. Third, three-dimensional head velocity data were collapsed intoone dimension. Fourth, the median head velocity throughout the wholetrial was calculated.
Our analyses used the same infant data as that used in Analysis 1, inwhich 43 typically developing 9-month-olds viewed a series of short videoclips. Head velocity and data quality were calculated independently for eachtrial, and then, a single per-participant average was calculated. Figure 5e,fshows the results of these analyses. A Kolmogorov–Smirnov test showedthat head movement data were not normally distributed (Z (42) = .28,p < .001), and so nonparametric statistics (Spearman’s ϱ) were used.
We hypothesized that increased head velocity would be associated withlower eye-tracking data quality, due to an increased likelihood of prob-lems being encountered at various stages of the data processing. Consis-tent with our hypothesis, a significant negative correlation was observedbetween head velocity and robustness, ϱ (42) = �.41, p = .006, suggestingthat increased head movement was associated with less robust data. Forhead movement and precision, the relationship was not significant, ϱ(42) = .15, p = .32.
We considered the possibility that, as both head movement and eyegaze data were obtained from the same eye-tracker during recording, per-vasive data quality issues might influence all aspects of data quality andtherefore lead to a circular relationship. However, head movement datawere only calculated (because they were only available) for those samplesfor which eye-tracking data were also obtained. Furthermore, although itis conceivable that less precise estimation of head position and less preciseestimate of POG could have a shared cause (imprecise face estimation—asopposed either to imprecise pupil or glint estimation which would affectPOG but not head position estimates), we found that the relationship ofhead movement to precision was less strong than that of head movementto robustness, which is seemingly free of this possible shared artifact. Thissuggests that shared artifact is probably not the cause of the relationshipwe observed between head movement and data quality.
To assess the degree to which the differences observed in Analysis 2(on change in precision early vs. late in the session) were attributable todifferences in head movement, the change in head velocity early vs. late inthe testing session was calculated for these data using an identical proce-dure to that used for the data quality analyses described above. A Kol-
INFANT EYE-TRACKER DATA QUALITY 19
mogorov–Smirnov test suggested that all data were not normally distrib-uted (Z (18) = .33, p < .001) and so nonparametric tests were used.Although median (SEM) head velocity was marginally lower at the earlytesting session (2.2 9 103 [1.0 9 103]) relative to the later testing session(2.4 9 103 [0.5 9 103]), a Wilcoxon signed-rank test suggested that thisdifference was not significant (Z = �.50, p = .62). This suggests that thedecrease in precision observed in Analysis 2 between the earlier and latertesting sessions was not attributable to an increase in head movement.
Interim summary
The results presented in analyses 1–3 suggest that data quality varies sys-tematically between individuals, as a function of age, and within individuals,as a function of testing time and amount of movement during recording.In the following three analyses, we examine how differences in data qual-ity may relate to a range of commonly reported dependent variables ineye-tracking analyses.
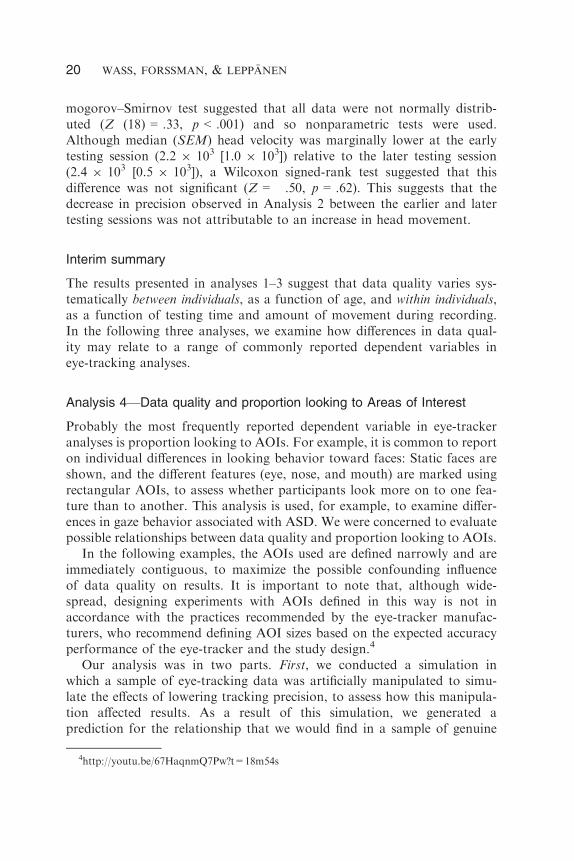
Analysis 4—Data quality and proportion looking to Areas of Interest
Probably the most frequently reported dependent variable in eye-trackeranalyses is proportion looking to AOIs. For example, it is common to reporton individual differences in looking behavior toward faces: Static faces areshown, and the different features (eye, nose, and mouth) are marked usingrectangular AOIs, to assess whether participants look more on to one fea-ture than to another. This analysis is used, for example, to examine differ-ences in gaze behavior associated with ASD. We were concerned to evaluatepossible relationships between data quality and proportion looking to AOIs.
In the following examples, the AOIs used are defined narrowly and areimmediately contiguous, to maximize the possible confounding influenceof data quality on results. It is important to note that, although wide-spread, designing experiments with AOIs defined in this way is not inaccordance with the practices recommended by the eye-tracker manufac-turers, who recommend defining AOI sizes based on the expected accuracyperformance of the eye-tracker and the study design.4
Our analysis was in two parts. First, we conducted a simulation inwhich a sample of eye-tracking data was artificially manipulated to simu-late the effects of lowering tracking precision, to assess how this manipula-tion affected results. As a result of this simulation, we generated aprediction for the relationship that we would find in a sample of genuine
4http://youtu.be/67HaqnmQ7Pw?t=18m54s
20 WASS, FORSSMAN, & LEPPANEN

eye-tracking data. Second, we then evaluated this prediction in a analysisof real eye-tracking data.
Simulation and prediction
To generate a prediction as to how raw data quality might relate toproportion looking to AOIs we first conducted a simulation to assess theeffect of adding inaccuracies of up to 2° to our data. Although this levelof noise is greater than that commonly claimed by eye-tracker manufac-turers for adults,5 our own observations (see, e.g., Figs 2, 3 and S1)suggest that it is not uncommon in infants. For example, Sample 2 inFigure 2 shows a continuous measurement error of approximately 15%on the Y dimension, corresponding to 3.6° in a monitor subtending 24°.The measurement error shown in Figure 3b is still higher.
Figure 6 shows a graphical overview of this simulation, which is basedon a single trial that was excerpted from a typically developing 9-month-old infant viewing a static picture of a face for 10 sec. First, the raw gazesample was plotted (Figure 6a), and the results were analyzed for propor-tion looking time to eyes, nose, and mouth (Figure 6b). These were foundto be 0.77 (eyes), 0.03 (nose), and 0 (mouth). Then, the precision of thedata was artificially manipulated by adding, iteration by iteration, randomnoise up to 2° to the X and Y gaze coordinates, to simulate the effects oflow precision tracking (Figure 6c). Following addition of the simulatednoise, the data were reanalyzed for proportion looking time to eyes, nose,and mouth (see Figure 6d). The new proportion looking times observedwere 0.31 (eyes), 0.12 (nose), and 0.04 (mouth).
As a result of this simulation, we predicted therefore that the generaleffect of this artifact would be that of a flattening out of the distributionof gaze. In cases, such as face viewing, where gaze is naturally concen-trated in one area (the eyes; Johnson, 2010), the effect of low precisionwould be to create the appearance of a reduced concentration of gaze inthat area and an apparently increased concentration in other areas.
Evaluation of prediction from simulation with real data
To evaluate this prediction, we analyzed a corpus of viewing dataobtained from 22 typically developing 9-month-old infants. Sixty-fiveusable trials were available for analysis. Figure 7 shows scatterplots illus-trating the results of these analyses. Consistent with our predictions, we
5http://www.tobii.com/Global/Analysis/Downloads/User_Manuals_and_Guides/
Tobii_TX300_Eyetracker_UserManual.pdf
INFANT EYE-TRACKER DATA QUALITY 21

found that less precise data were associated with less looking time to eyes:r (64) = �.28, p = .03. A Kolmogorov–Smirnov test suggested that resultsfor proportion looking to nose and mouth were not normally distributed(Z (64) = .25, p < .001), and so Spearman’s ϱ was calculated to assessthe relationship between precision and proportion looking to nose and
0
0.2
0.4
0.6
0.8
eyes nose mouth other
Pro
por
tion
look
ing
0
0.2
0.4
0.6
0.8
eyes nose mouth other
Pro
por
tion
look
ing
(a)
(b)
(c)
(d)
Figure 6 Ten seconds of viewing data from a 9-month infant. (a, b) Shows the
original data sample, (c, d) shows the same gaze data sample, but subjected to a “low
precision” simulation by adding Gaussian noise. In each case, (a, c) shows the gaze
data superimposed on the image that was being viewed. Looking time to different
areas of interests (AOIs) has been calculated; gaze coded as to the eye region is drawn
red, to the nose region is drawn green, to the mouth region is drawn blue, and to
other areas is drawn black. (b, d) Shows the proportion looking times recorded,
subdivided by AOI.
22 WASS, FORSSMAN, & LEPPANEN

mouth. A positive relationship was observed: ϱ (64) = .29, p = .02. Thissuggests that, consistent with our hypothesis, lower quality data tend tobe associated with a lower proportion of looking time recorded to the eyesand a higher proportion of looking time recorded to the nose and mouth.The analysis was repeated with number of samples recorded to eyes andnose/mouth (rather than proportion of samples) as the dependent variable.Figure S3 shows the results. Outcomes were similar, although the relation-ship between precision and number of samples to the nose/mouth was notsignificant (p = .11).
Analysis 5—Data quality and reaction time latencies
Another common variable in eye-tracker analyses is look latency—that is,the time delay between an event taking place and the participant firstlooking toward a particular area of the screen.
Again, our analysis was in two parts. First, we conducted a simulationin which a sample of eye-tracking data was artificially manipulated to sim-ulate the effects of lowering tracking robustness, to assess how this manip-ulation affected results. As a result of this simulation, we generated aprediction for the relationship that we would find in a sample of genuineeye-tracking data. We then evaluated this prediction in a full cohortanalysis.
(a) (b)
Figure 7 Scatterplots (with regression lines) showing the results of individual trials
from 9-month-old infants viewing static pictures of a human face. (a) Shows precision
vs. proportion looking time recorded to eyes and (b) shows precision vs. proportion
looking time recorded to nose and mouth.
INFANT EYE-TRACKER DATA QUALITY 23

Simulation and prediction
Figure 8 shows a simulation we conducted to predict how data qualitymight influence results recorded using reaction time measures. Reactiontime is calculated as the latency between an event taking place and thefirst recorded POG within the response window—which is the techniqueused in Tobii Studio, for example, to calculate time to first fixation (Tobii,2012). Figure 8a shows a single trial of a typically developing infant’slooking behavior during a 1-sec time window. The black line shows the
RT = 300ms
RT = 480ms
(a)
(b)
Figure 8 (a) Gaze data from a typically developing 12-month-old infant during a
1-sec gaze window. The black line shows the position of the target, and the red line
the position of gaze of the infant viewing the target. The latency between the shift in
the target location and the first valid position of gaze recorded within the areas of
interest is the oculomotor reaction time (in this instance 300 msec). (b) Shows the
same data sample, but subjected to a robustness simulation.
24 WASS, FORSSMAN, & LEPPANEN

position of a target, which at one point during the trial moves from oneposition on the screen to another. Figure 8b shows exactly the same data,but subjected to a stimulation in which random segments of the data havebeen removed to vary robustness. Exactly the same coding criteria wereapplied: Reaction time is recorded as the latency between the event takingplace and the first valid sample looking to the target. In the complete datasample, the RT is recorded as 300 msec; in the second (identical but lessrobust) sample, it is 480 msec.
As a result of this simulation we predicted that less robust eye-trackerdata would be associated with increased reaction time latencies and adecreased likelihood of a look being recorded within a particular timewindow.
Evaluation of prediction from simulation with real data
To assess these predictions we analyzed data from a corpus of 92typically developing 9- to 15-month-old infants viewing a gaze followingparadigm (Senju & Csibra, 2008). The dependent variable analyzed waslatency to respond to direct gaze. We predicted that robustness wouldrelate negatively with response latency. To assess this we calculated therobustness of data quality obtained, trial by trial, during the direct gazeperiod (starting 2,400 msec and ending 4,200 msec into each trial). Wealso calculated the latency between the start of the direct gaze period andthe first POG within a rectangular window drawn around the face. Trialsin which the position of gaze was within the response area at the start of
(a) (b)
Figure 9 (a) Shows a screenshot of the stimuli used in this analysis (from Senju &
Csibra, 2008). The Areas of interests are superimposed onto the screen in red and
blue. (b) Shows participant-by-participant the relationship between the mean duration
of usable data fragments and the latency to respond to direct gaze. The linear
regression line shows the significant relationship identified between the two variables.
INFANT EYE-TRACKER DATA QUALITY 25

(b)
(a)
Tim
e (s
econ
ds)
Position of gaze (x and y coords) 01
y
01
0 . 2
0 . 4
0 . 6
0 . 8
0
0 . 20 . 40 . 60 . 81
x
Figure
10
(a,b)Shows15secofviewingmaterialfrom
a6-m
onth-old
infantviewingastaticim
age.
Six
differentareasofinterests
(AOIs)havebeendrawnonto
thescreen
indifferentcolors.Gaze
data
obtained
duringthattrialare
alsodrawnonto
thescreen.Raw
gaze
data
(gray)havebeencorrected,andgaze
classified
asbeingwithin
aparticularAOIis
drawnin
thecolorofthatAOI.
(b)Shows
thesamedata
withtimeonthexdim
ension.Sectionsduringwhichtherecorded
POG
waswithin
thepinkAOIhavebeenculturedpink,
andso
on.Thebars
abovetheplotshow
theresultsoftw
ocodingschem
esapplied
tothedata.In
“CodingA”,thealgorithm
treats
a
lookto
anAOIasendingwhen
thefirstvalidsample
isobtained
outsideofthatAOI.
In“CodingB”,thealgorithm
treats
alookto
an
AOIascontinuingonly
whilegaze
data
are
beingrecorded
within
thatAOI.
Theinstancesofmarked
discrepancy
between
thetw
o
codingschem
esare
marked
withreddashed
rectangles.
26 WASS, FORSSMAN, & LEPPANEN

the window were excluded. Figure 9 contains a scatterplot illustrating theresults of this analysis. The relationship was found to be negative as pre-dicted (r (91) = �.22, p = .035), suggesting that shorter mean fragmentduration (i.e., less robust data) was associated with longer response timelatencies.
Analysis 6—Data quality and first look/visit duration
Another common dependent variable in eye-tracker analyses is “visit dura-tion” or “look duration”—the time spent by the infant looking towardeach of the different areas (AOIs) on the screen. One particularly populardependent variable is “first look duration”—the duration of the first lookrecorded toward a particular AOI.
A particular challenge with these analyses is how best to cope with thefrequent, and often lengthy, periods of data loss encountered in infants.Figure 10 illustrates this problem. Is a look considered to have endedwhen the first valid sample is obtained outside that AOI (“Coding A” inFigure 10)? Or is a look registered only as long as gaze data are recordedwithin that AOI (“Coding B”)? Or is a look during which any data sam-ples are not present to be rejected and not stored? These are similar to theproblems discussed in Wass et al. (2013) regarding the relationshipbetween robustness and fixation duration.
In this experiment, we evaluated “Coding A”, which is the techniqueused to compute “Visit duration” in Tobii Studio (Tobii, 2012). We pre-dicted that we would observe a positive relationship between first look
(a) (b)
Figure 11 (a) Participant-by-participant scatterplot showing the relationship
between robustness (average fragment duration) and first look duration (in seconds).
The linear regression line shows the relationship observed between the two variables.
(b) Participant-by-participant scatterplot showing the relationship between robustness
(average fragment duration) and average duration of all looks to areas of interests.
The linear regression line shows the relationship observed between the two variables.
INFANT EYE-TRACKER DATA QUALITY 27

duration and fragment duration (i.e., longer look durations associatedwith more robust data).
Evaluation of prediction with real data
To evaluate this prediction, we analyzed data from a corpus of 49 typi-cally developing 9- to 15-month-old infants viewing the same gaze follow-ing experiment as in Analysis 5. Analyses were conducted using the AOIillustrated in Figure 9. Robustness was calculated on a per-participantbasis as reported previously. Prior to calculating look duration, data werefirst smoothed using a 100-msec median moving window.
The first dependent variable analyzed was first look duration. This wascoded as the duration (in seconds) of the first look to either of the objectsafter the actress had looked to one of the two objects. The end of a lookwas coded as the first reported POG outside the AOI, including instancesof data loss. Figure 11a shows the results of this analysis. Longerfragment duration (more robust data) was found to be associated withlonger first look duration (r (49) = .30, p = .04.
The second dependent variable analyzed was the average duration ofall looks recorded to AOIs. Three AOIs were recorded: the two objectsand the face of the actress. Looks to other areas of the screen wereexcluded from this analysis. Figure 11b contains a scatterplot illustratingthe results of this analysis. The average (SEM) total number of looksrecorded per participant was 65.9 (23.4). The average (SEM) duration inmilliseconds of all looks to AOIs was 810 (403) msec. Longer fragmentduration (more robust data) was associated with longer average lookduration to AOIs (r (49) = .85, p < .001).
DISCUSSION
Systematic variations in data quality between and within individuals
From our analyses we believe that two conclusions can be drawn. First,test–retest reliability for most measures was high, suggesting that dataquality is a relatively stable metric. Second, data quality varies systemat-ically both between and within individuals, as a function of age, testingtime, and fidgetiness. For age, our analyses suggest that longer usablefragment durations are obtained from adults relative to infants.Although only marginally significant (with a small sample size (N = 6)in our adult sample), our findings also suggest that less precise trackingdata are obtained from infants relative to adults. We also examinedhow data quality varies early vs. late in the testing session. We found
28 WASS, FORSSMAN, & LEPPANEN

that the precision of eye-tracker data is markedly lower later in the ses-sion (see also Blignaut & Beelders, 2012). We also examined how dataquality relates to fidgetiness, as measured via head velocity. We foundthat greater head velocity was associated with lower robustness,although no significant relationship with precision was identified.Although we did not examine systematic differences between clinical andnonclinical populations here, in previous research we have compareddata obtained from infants at high risk of ASD with infants at low risk(Wass, Jones, Gliga, Smith, Charman, Johnson, & BASIS team, underreview). We found that although precision did not vary between popula-tions, there was nonsignificantly (but consistently across two independentcohorts) lower robustness in data from high-risk (ASD) relative to low-risk infants.
Relationship of data quality to key dependent variables in eye-trackinganalyses
In the analyses presented here, we have assessed whether data qualitymay influence a number of key dependent variables in infant eye-track-ing experiments. From analysis 4, we concluded that lower precisiondata can appear to suggest a reduced likelihood to look at the eyes ina face relative to the mouth. We predict that the same pattern oughtto be present in any analysis in which infants naturally look to onearea of the screen relative to another. The effect of lower precisionwould be that of a “flattening out” of the distribution across the differ-ent AOIs.
From analysis 5, we concluded that less robust tracking may mani-fest as slower reaction time latencies (e.g., time to first fixation). InLepp€anen et al. (2014), we examine this issue in more detail. Fromanalysis 6, we concluded that less robust data can manifest as shorterfirst look/visit duration. It should also be noted that the effect sizesobserved varied markedly between analyses. The effect identified inanalysis 5 was significant but relatively weaker (r = �.22), whereasthose in analysis 6 were extremely strong (r = .85). Our findings herecan be compared with our previous findings on how data quality relatesto fixation durations as parsed using the standard dispersal-based pars-ing algorithms supplied with most eye-trackers (Wass et al., 2013).There we found that participants with poorer quality data werereturned as showing markedly shorter fixation durations than thosewho did not.
INFANT EYE-TRACKER DATA QUALITY 29

Suggestions for further work
There are a number of limitations to these analyses. As with all correla-tions, the relationships we have documented are vulnerable to the possibil-ity that the observed relationship may be mediated by some unobservedthird factor. For example, we cannot entirely distinguish between twoexplanations: (1) Frequent movement during tracking causes the appear-ance of decreased looking to the eye region due to increased artifact and(2) poorer quality tracking data are associated with a genuinely reducedlikelihood to look to the eye region because both parameters are attribut-able to some third factor that has not been tracked in the current analysis.However, we also conducted simulations throughout the paper, by experi-mentally manipulating parameters of eye-tracker quality to measure theeffects on eye-tracker dependent variables. The fact that the simulationswere consistent with the results of our correlational analyses goes someway to precluding possibility #2.
What can be done to address these issues? First, it should be standardto report on how data quality varies between populations and betweenconditions—particularly if the experiment is based on examining behaviorduring response windows. The Matlab scripts we have used in this studyare available for download (see link above). Calculating data quality alsoallows for the inclusion of data quality as a covariate in analyses. Futurework should also investigate in more detail how differences in data qualityrelate to extrinsic factors such as the accuracy of the calibration obtainedprior to recording.
Second, our analyses suggesting that data quality (both robustness andprecision) varies as a function of time suggest that possible order effectsshould be tracked with care. Different conditions of experiments should bepresented interleaved in blocks rather than consecutively. It is also usefulto interleave short, engaging movie clips within experiments, which helpsto maintain engagement.
Third, more care should be taken in devising data processing tech-niques that are specifically designed to be independent of variation in dataquality. Unfortunately many of the “off-the-peg” analysis programs avail-able with commercial eye-trackers do not do this. In user-defined dataprocessing, judicious use of techniques such as interpolating and smooth-ing can help here, although no “one-size-fits-all” solution is available:Optimal parsing techniques may vary between different analyses. For theanalysis we conducted in Analysis 4, examining the relationship betweenprecision and proportion looking to AOI, filtering data using a medianmoving window would be effective for reducing error, as would designingtest stimuli with noncontiguous AOI (Holmqvist et al., 2011). For the
30 WASS, FORSSMAN, & LEPPANEN

analyses in Analysis 5, looking at robustness and reaction time latencies,it is possible apply interpolation to those periods during which the posi-tion of gaze remains within either target area, while rejecting sections inwhich the position of gaze changes during the lost data segment. Thosesections with missing data segments should then be excluded from thereaction time analyses. Matlab algorithms that perform these functions,and that are available for download, are described in Lepp€anen et al.(2014). However, for the analyses in Analysis 6, looking at the relation-ship between robustness and first look/observation duration, no easy solu-tion exists (see Figure 10).
Similar developments are already ongoing within the field of fixationduration parsing. Tobii have developed the IV-T filter which allows usersto vary a number of key parameters associated with fixation parsing—including interpolation across gaps, options for dealing with loss of oneeye, noise reduction (median or mean of a three- sample moving window),variable velocity thresholds (30° sec�1 over a 20-msec period), and theoption to merge adjacent fixations (<0.5°) separated by a brief period oflost data (<75 msec; Olsen, 2012; Olsen & Matos, 2012). Features such asthe Velocity Chart afford an easy means of visualizing the data,6 andresearchers can process their data multiple times post hoc while varyingthe settings to identify the (often substantial) way in which these manipu-lations can influence results. In Wass et al. (2013), we also presentedMatlab fixation parsing algorithms that we designed to perform fixationparsing independent of data quality—although in subsequent papers wehave found that relationships with data quality remain (Wass, Jones,Gliga, Smith, Charman, Johnson, & BASIS team, under review). Alterna-tive methods include semi-automated techniques for identifying fixationsby hand (Rodriguez Saez de Urabain, Johnson, & Smith, 2013).
CONCLUSION
We believe that the analyses presented here open the possibility that differ-ences in eye-tracking data quality between and within individuals maycause the appearance of differences in gaze behavior, without this actuallybeing the case.
A number of different experimental designs may be vulnerable to thisconfound. First, instances in which a paradigm is applied to individuals ofdifferent ages. In this case, eye-tracking data obtained from youngerindividuals may be of lower quality, which in turn may cause the false
6http://youtu.be/kgBtLAwDFRY?t=41m6s
INFANT EYE-TRACKER DATA QUALITY 31

appearance of observed differences in dependent variables. Second,instances in which gaze behavior is compared between two populations. Thisapplies to studies comparing clinical and typical populations, to studiescomparing “high-risk” and “low-risk” groups (such as infants from lowsocioeconomic status backgrounds, or infants with particular familiar char-acteristics), as well as to studies comparing groups defined by some otherbehavioral characteristic, such as good and poor learners. In each case, thedanger is that between-group differences in factors such fidgetiness or irrita-bility may lead to differences in eye-tracking data quality, which can causethe false appearance of differences in gaze behavior. A third possibility isthat systematic differences in data quality may exist between conditionswithin particular experiments. This applies, for example, in instances inwhich certain conditions were more novel or engaging than others or pre-sented later in the testing session. Above we have described a number ofsteps that we consider can help to address these possibilities.
The increased spatial and temporal resolution afforded by eye-tracking isvital in allowing researchers to address new and unanswered questionswithin infant psychology. The same relationships that we have identifiedhere, between data quality to gross behavioral measures such as fidgetiness,are likely to apply to other techniques widely used with infants—includingelectroencephalography (EEG), event-related potentials (ERPs), and nearinfrared spectroscopy (NIRS). It seems also possible that differences in dataquality obtained from these other recording techniques might also cause theappearance of differences on key dependent variables without this actuallybeing the case. Every method is flawed, but the upside is that many of thedata quality issues we have discussed here are relatively easy to assess, andsystematic artifact can potentially be minimized through careful experimen-tal design and/or appropriate data processing techniques.
ACKNOWLEDGMENTS
Thanks to Tim Smith, Tibor Auer, Nic Farhi, Dennis Norris, Emily Jonesfor advice and useful discussions. Thanks to Jason Babcock for permissionto use the eye image used in Figure 1, taken from the Yarbus software.Thanks to Tommy Strandvall and Ricardo Matos from Tobii and toSusan Rose, Hayley White, and Sarah Smith for reading earlier versionsof the manuscript and giving comments. This work was supported by aBritish Academy Postdoctoral Fellowship to the first author and by grantsfrom the Academy of Finland (#218284) and the European ResearchCouncil (#283763) to J. M. L.
32 WASS, FORSSMAN, & LEPPANEN

REFERENCES
Aslin, R. N. (2007). What’s in a look? Developmental Science, 10(1), 48–53.Aslin, R. N. (2011). Infant eyes: A window on cognitive development. Infancy, 17(1), 126–140.Aslin, R. N., & McMurray, B. (2004). Automated corneal-reflection eye tracking in infancy:
Methodological developments and applications to cognition. Infancy, 6, 155–163.Blignaut, P., & Beelders, T. (2012). The precision of eye-trackers: a case for a new measure.
Paper presented at the Proceedings of the Symposium on Eye Tracking Research and
Applications, New York, NY.
Blignaut, P., & Wium, D. (2014). Eye-tracking data quality as affected by ethnicity and
experimental design. Behavior Research Methods, 46(1), 67–80.Duchowski, A. T. (2007). Eye tracking methodology: Theory and practice. New York:
Springer-Verlag.
Forssman, L., Peltola, M., Yrttiaho, S., Puura, K., Mononen, N., Lehtimäki, T., & Leppä-nen, J. (2014a). Regulatory variant of the TPH2 gene and early life stress are associated
with hightened attention to social signals of fear in infants. Journal of Child Psychology &
Psychiatry, 55(7), 793–801.Forssman, L., Wass, S. V., & Lepp€anen, J. M. (2014b). Training non-social attention control
improves infants’ socio-cognitive abilities. Poster session presented at the Biennial Interna-
tional Conference on Infant Studies, Berlin, Germany.
Frank, M. C., Vul, E., & Saxe, R. (2011). Measuring the development of social attention
using free-viewing. Infancy, 17, 355–375.Gredeback, G., Johnson, S., & von Hofsten, C. (2010). Eye tracking in infancy research.
Developmental Neuropsychology, 35(1), 1–19.Holmqvist, K., Nystr€om, M., Andersson, R., Dewhurst, R., Jarodzka, H., & van de Weijer,
J. (2011). Eye tracking: A comprehensive guide to methods and measures. Oxford, UK:
Oxford University Press.
Johnson, M. H. (2010). Developmental cognitive neuroscience, 3rd ed. Oxford, UK: Wiley-
Blackwell.
Kelly, D. J., Walker, R., & Norbury, C. F. (2013). Deficits in volitional oculomotor control
align with language status in autism spectrum disorders. Developmental Science, 16(1), 56–66.
Kolakowski, S. M., & Pelz, J. B. (2006). Compensating for eye tracker camera movement.
Paper presented at the Proceedings of the 2006 Symposium of Eye-Tracking Research &
Applications. New York, NY.
Lepp€anen, J., Forssman, L., Kaatiala, J., Yrttiaho, S., & Wass, S. (2014). Widely applicable
MATLAB routines for automated analysis of saccadic reaction times. Behavior Research
Methods. doi:10.3758/s13428-014-0473-z.
Lundqvist, D., Flykt, A., & €Ohman, A. (1998). The Karolinska Directed Emotional Faces—KDEF, CD ROM from Department of Clinical Neuroscience, Psychology section, Karo-
linska Institutet, ISBN 91-630-7164-9.
Morgante, J. D., Zolfaghari, R., & Johnson, S. P. (2012). A critical test of temporal and
spatial accuracy of the Tobii T60XL eye tracker. Infancy, 17(1), 9–32.Oakes, L. M. (2010a). Advances in eye tracking in infancy research. Infancy, 17(1), 1–8.Oakes, L. M. (2010b). Infancy guidelines for publishing eye-tracking data. Infancy, 15(1), 1–5.Olsen, A. (2012). The Tobii I-VT fixation filter. Copyright © Tobii Technology AB.
Olsen, A., & Matos, R. (2012). Identifying parameter values for an I-VT fixation filter
suitable for handling data sampled with various sampling frequencies. Proceedings of the
Symposium on Eye Tracking Research and Applications. New York, NY: ACM.
INFANT EYE-TRACKER DATA QUALITY 33
Power, J. D., Barnes, K. A., Snyder, A. Z., Schlaggar, B. L., & Petersen, S. E. (2012).
Spurious but systematic correlations in functional connectivity MRI networks arise from
subject motion. NeuroImage, 59(3), 2142–2154.Rodriguez Saez de Urabain, I., Johnson, M. H., & Smith, T. J. (2013). Typical development
across the lifespan: Investigating infants’ inhibitory control and fixation durations in
complex naturalistic and non-naturalistic scenes. Journal of Vision, 13, 737.
Senju, A., & Csibra, G. (2008). Gaze following in human infants depends on communicative
signals. Current Biology, 18, 668–671.Shic, F., Chawarska, K., & Scassellati, B. (2008). The incomplete fixation measure. Proceed-
ings of the 2008 symposium on eye tracking research & applications (pp. 111–114). Savan-nah, Georgia: ACM.
Shic, F., Chawarska, K., & Scassellati, B. (2009). The amorphous fixation measure revisited:
With applications to autism, 30th Annual Meeting of the Cognitive Science Society, Wash-
ington, DC: 2008.
Shukla, M., Wen, J., White, K. S., & Aslin, R. N. (2011). SMART-T: A system for
novel fully automated anticipatory eye-tracking paradigms. Behavior Research Methods, 43,
384–398.Southgate, V., Senju, A., & Csibra, G. (2007). Action anticipation through attribution of
false belief in two-year-olds. Psychological Science, 18(7), 587–592.Tobii Studio 2.X User Manual (2012). Software release 3.2. Copyright © Tobii Technology
AB.
Wass, S. V., Smith, T. J., & Johnson, M. H. (2013). Parsing eye-tracking data of variable
quality to provide accurate fixation duration estimates in infants and adults. Behavior
Research Methods, 45(1), 229–250.Yendiki, A., Koldewyn, K., Kakunoori, S., Kanwisher, N., & Fischl, B. (2013). Spurious
group differences due to head motion in a diffusion MRI study. NeuroImage, 88C, 79–90.
SUPPORTING INFORMATION
Additional supporting information may be found in the online version ofthis article:
Figure S1 Further raw data samples.Figure S2 Supplementary analyses for our robustness measures.Figure S3 An identical analysis to that shown in Figure 7, but examin-
ing the number of samples recorded to eyes and nose/mouth instead ofthe proportion of available samples.
34 WASS, FORSSMAN, & LEPPANEN