robustness validation and failure rates -...
TRANSCRIPT
Robustness Validation and Failure Rates
“Sample Sizes in Reliability Testing”
Werner Kanert – InfineonRené Rongen – NXP

Robustness Validation: refreshingAwareness about numbers in Q100 sampling for reliabilityDefining sample sizes for reliability testsBack to Robustness Validation: RIF
Outline
4/15/2014 2Tutorial Robustness Validation & Sample Sizes

Robustness Validation: refreshingAwareness about numbers in Q100 sampling for reliabilityDefining sample sizes for reliability testsBack to Robustness Validation: RIF
Outline
4/15/2014 3Tutorial Robustness Validation & Sample Sizes

Is the device “sufficiently reliable” in the application?Robustness Validation is a method, described in ZVEI handbooks and SAE standards, to demonstrate that a semiconductor component is “sufficiently” reliable
What Really Matters…
4/15/2014 4
Note, that the component capability can change over life due to degradations
Tutorial Robustness Validation & Sample Sizes

4/15/2014 5
Determination of reliability test criteria for a new component based on mission profile requirements of intended application
Process at Component Manufacturer (CM):Assess whether a new component can be qualified according to AEC‐Q100 test conditions
Flow chart 1
A
B
CRemember?
Tutorial Robustness Validation & Sample Sizes

The mission profile is translated into an equivalent stress with the same conditions as the qualification standard test. This calculated stress duration tcalc (in hours or number of cycles) has to be compared to the standard qualification duration tstand.
RV Flow Chart (slide from last year)
4/15/2014 6
Flow chart 1
Flow chart 2
Remember?
Tutorial Robustness Validation & Sample Sizes
But what about failure rates and sample sizes?

Robustness Validation: refreshingAwareness about numbers in Q100 sampling for reliabilityDefining sample sizes for reliability testsBack to Robustness Validation: RIF
Outline
4/15/2014 7Tutorial Robustness Validation & Sample Sizes

LTPD Sampling Plans
4/15/2014 8
Decision on Lot Population Value (% Defective)
Target Target
Accept Correct Type II error(consumer‘s risk)
Reject Type I error(producer’s risk)
Correct
LTPD (Lot Tolerance Percent Defective):The LTPD is a defect level that is unacceptable to the consumer. The consumer would like the sampling plan to have a low probability of accepting a lot with a defect level as high as the LTPD.Ref.: MIL‐S‐19500 and MIL‐M‐38510
Tutorial Robustness Validation & Sample Sizes

LTPD plans originated back in the period 1920‐40 as part of acceptance sampling.
1/77 = criterion to assure, with 90% confidence, that a lot having 5% defective is rejectedHowever … to allow fails as part of your qualification requirements is not good for the imageTherefore, zero fail tests (success‐runs) were adopted for qualification
Origin of 0/77
4/15/2014 9Tutorial Robustness Validation & Sample Sizes

Statistical Meaning of 0/77 (Exercise 1)
4/15/2014 10
Sample
failures 077 N *
*
**
*
Question 1: How likely is this result, when actual defectivity is 50% (500.000 PPM)?
Probability to get the sample result (0/77): (0.5)77 = 6.6E‐24… or:
With almost 100% confidence: “PPM < 500.000”
Total Population
defect
Tutorial Robustness Validation & Sample Sizes

Statistical Meaning of 0/77 (Exercise 2)
4/15/2014 11
Question 2: How likely is this result, when actual defectivity is 5% (50.000 PPM)?
Probability to get the sample result (0/77): (0.95)77 = 0.019… or:
With 98.1% confidence: “estimated PPM < 50.000”
Sample
failures 077 N *
*
**
*
Total Population
defect
Tutorial Robustness Validation & Sample Sizes

Statistical Meaning of 0/77 (Exercise 3)
4/15/2014 12
Question 3: How likely is this result, when actual defectivity is 3% (30.000 PPM)?
Probability to get the sample result (0/77): (0.97)77 = 0.10… or:
With 90% confidence: “estimated PPM < 30.000”
Sample
failures 077 N *
*
**
*
Total Population
defect
Tutorial Robustness Validation & Sample Sizes

Statistical Meaning of 0/77 (Summary)
4/15/2014 13
With a result of 0 failures for a small sample of 77 devices from a much larger total population of which the actual defectivity level is unknown, this means:
By lowering the confidence level the prediction is more optimisticBy increasing the confidence level the prediction is more pessimistic
Tutorial Robustness Validation & Sample Sizes
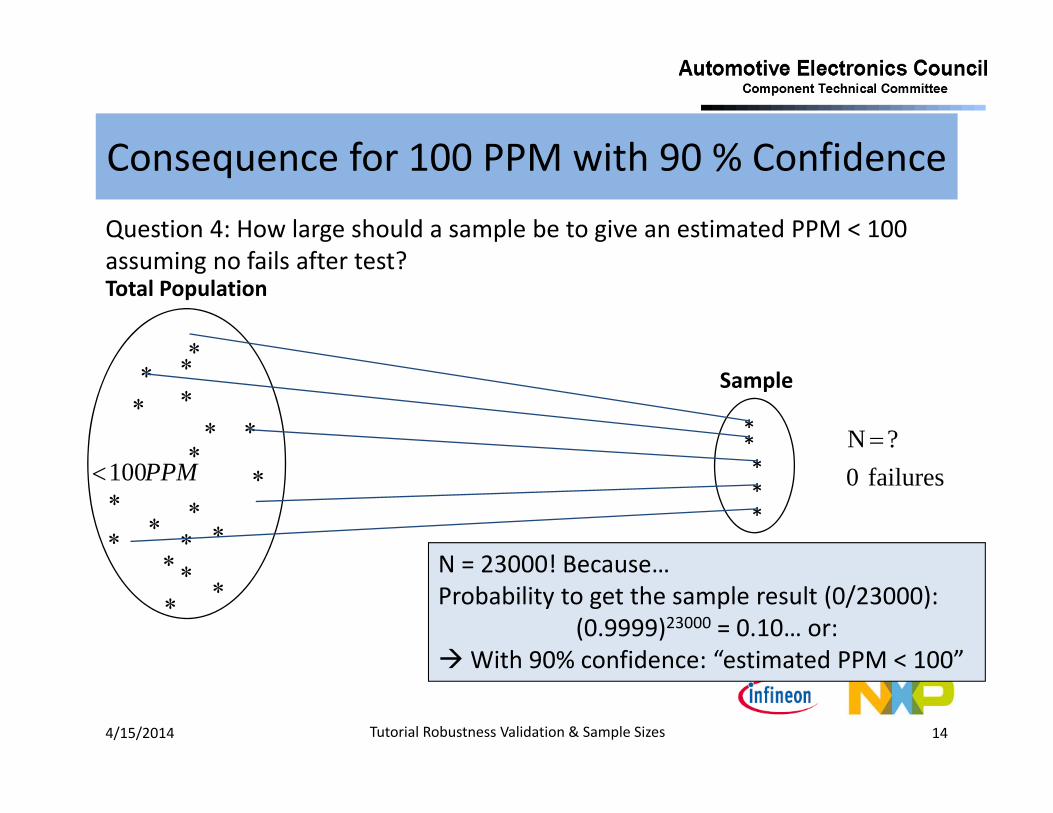
Consequence for 100 PPM with 90 % Confidence
4/15/2014 14
Question 4: How large should a sample be to give an estimated PPM < 100 assuming no fails after test?
N = 23000! Because…Probability to get the sample result (0/23000):
(0.9999)23000 = 0.10… or:With 90% confidence: “estimated PPM < 100”
Sample
failures 0? N *
*
**
*
Total Population
100PPM
Tutorial Robustness Validation & Sample Sizes

Sample Size Needed to Prove 100 ppm
4/15/2014 15
Proving low level failure probabilities by simply accumulating statistics is no viable approach for qualification.
Tutorial Robustness Validation & Sample Sizes

Robustness Validation: refreshingAwareness about numbers in Q100 sampling for reliabilityDefining sample sizes for reliability testsBack to Robustness Validation: RIF
Outline
4/15/2014 16Tutorial Robustness Validation & Sample Sizes

Defining Sample Sizes for Reliability Tests
4/15/2014 17
Pass / fail decision based on fulfillment of electrical spec may not be sufficient and 0/45 would be almost as good as 0/77
Tutorial Robustness Validation & Sample Sizes
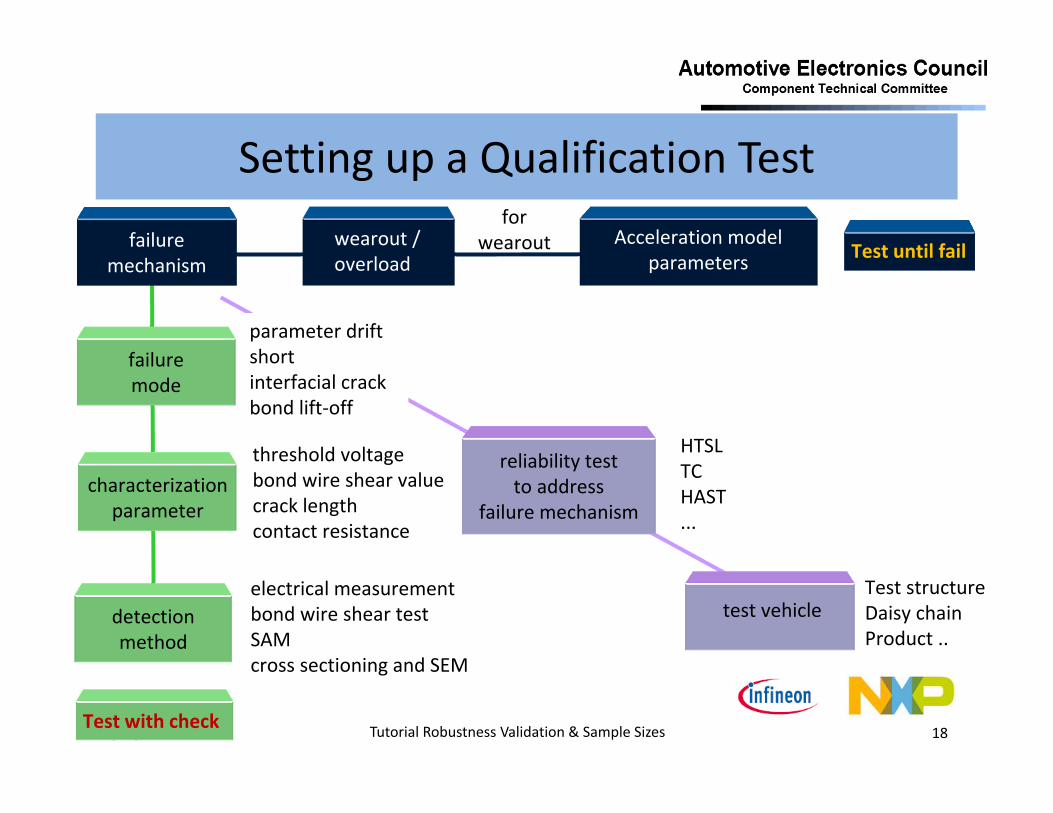
Setting up a Qualification Test
4/15/2014 18
wearout /overload
for wearout
parameter driftshortinterfacial crackbond lift‐off
threshold voltagebond wire shear valuecrack lengthcontact resistance
electrical measurementbond wire shear testSAMcross sectioning and SEM
HTSLTCHAST...
test vehicle
failuremechanism
detectionmethod
failuremode
characterizationparameter
Acceleration modelparameters
reliability testto address
failure mechanism
Test structureDaisy chainProduct ..
Test until fail
Test with check Tutorial Robustness Validation & Sample Sizes

Resistance R(t)
Example (1): Electromigration
4/15/2014 19
Time t
incubation time
failure criterion
time to failure
Time To Failure (TTF) is defined by the time until a certain resistance increase to original value (R/R0) is reached.
Assess degradation by monitoring resistance
Test until fail
Tutorial Robustness Validation & Sample Sizes

Example (1): Electromigration
4/15/2014 20
sample size10-20 per test
time tofailure
extract t50
resistanceRi(t)
Test until fail
Tutorial Robustness Validation & Sample Sizes

Example (2): Solder Joint Fatigue
4/15/2014 21
Time To Failure (TTF) is defined by the maximum number of sequential events in which a certain resistance increase to original value (R/R0) is observed.
Assess degradation by “event detection”
Test until fail
QFP
WL‐CSP
Tutorial Robustness Validation & Sample Sizes
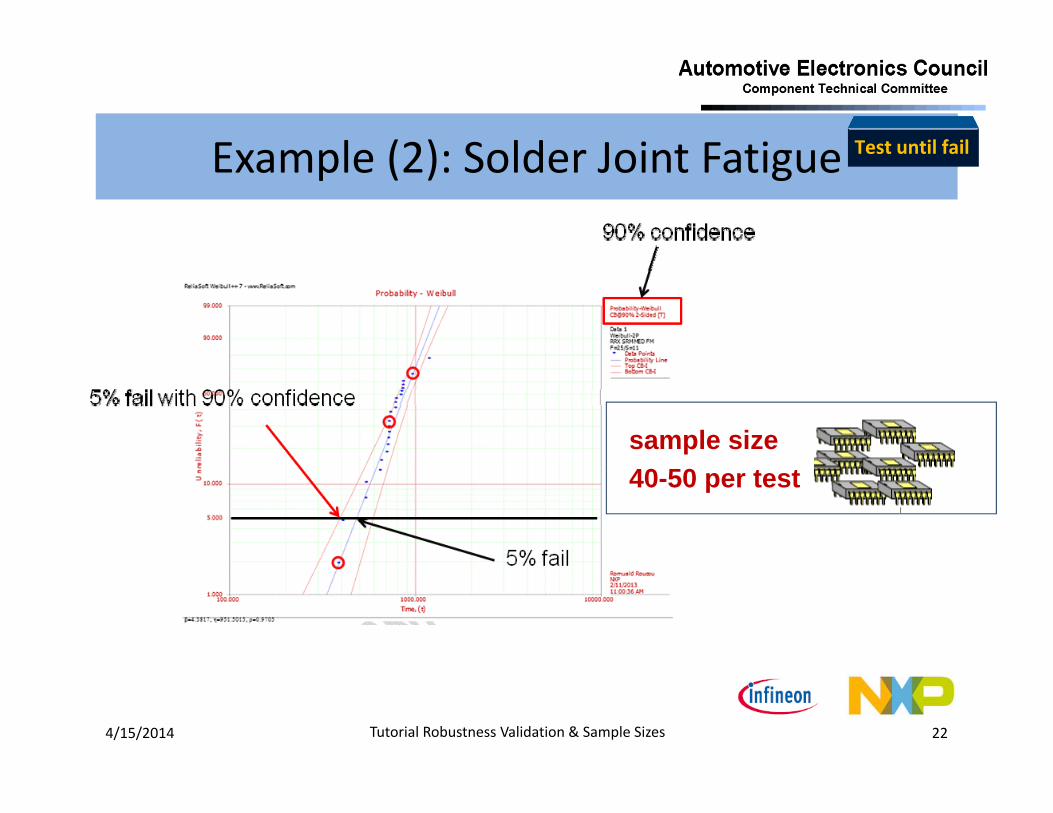
Example (2): Solder Joint Fatigue
4/15/2014 22
sample size40-50 per test
Test until fail
Tutorial Robustness Validation & Sample Sizes
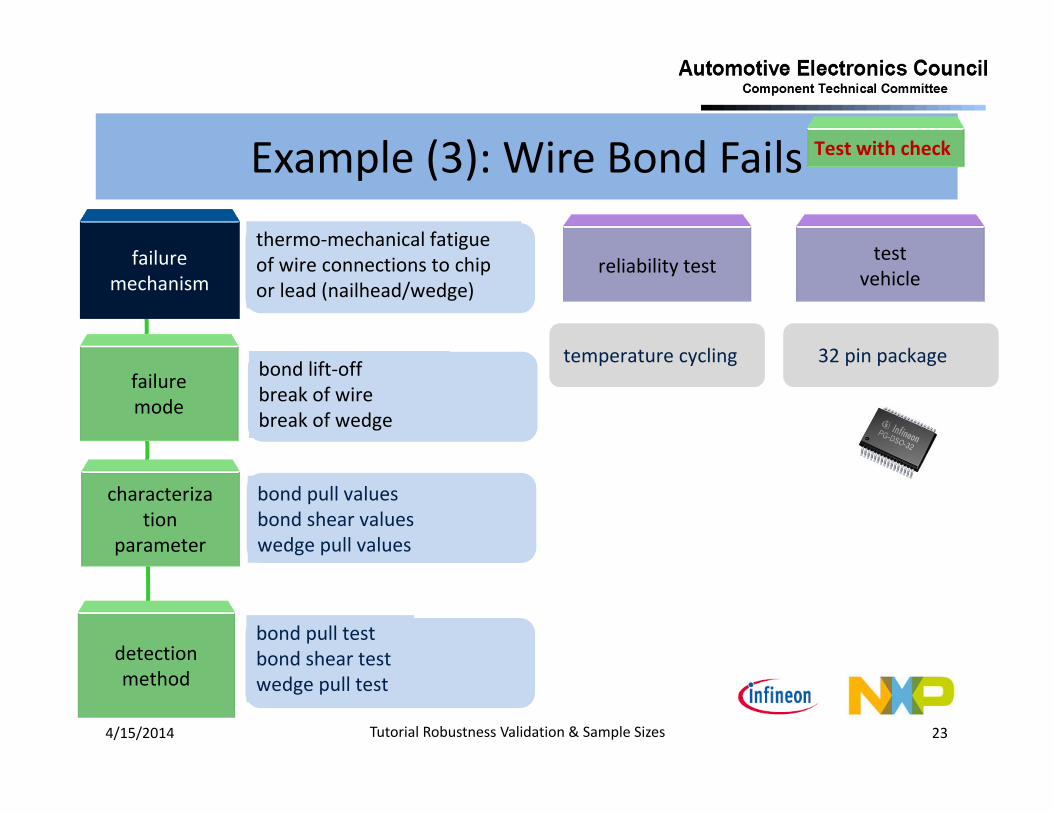
Example (3): Wire Bond Fails
4/15/2014 23
failuremechanism
detectionmethod
failuremode
characterization
parameter
bond pull valuesbond shear valueswedge pull values
bond lift‐offbreak of wirebreak of wedge
thermo‐mechanical fatigue of wire connections to chip or lead (nailhead/wedge)
reliability test
temperature cycling
test vehicle
32 pin package
Test with check
Tutorial Robustness Validation & Sample Sizes
bond pull testbond shear testwedge pull test

Example (3): Wire Bond Fails
4/15/2014 24
Tempe
rature cycling calculate backward
how many parts are needed at the start
Test with check
sample size80 per test
Tutorial Robustness Validation & Sample Sizes

Failure mechanism: Thermo‐mechanical fatigueFailure mode: Bond lift‐off, wedge breakWhat do I want to look at (characterization parameter)?
Degradation of bond pull value, bond shear value, wedge pull value Define duration of test and intermediate readoutsHow many devices are needed per readout?How many devices should be left over at the end of test?E.g. to further extend the test?Sum up all devices to get the sample size you start with
Example (3): Wire Bond Fails
4/15/2014 25
Test with check
Tutorial Robustness Validation & Sample Sizes

Different test methods need different approaches, e.g.Accelerated life tests (ALT)Accelerated degradation tests with repeated measurements Accelerated degradation tests with destructive measurements at readouts
Sample sizes have to be adapted to the requirements determined by the test method
Defining Sample Sizes for Reliability Tests (Summary)
4/15/2014 26Tutorial Robustness Validation & Sample Sizes

Robustness Validation: refreshingAwareness about numbers in Q100 sampling for reliabilityDefining sample sizes for reliability testsBack to Robustness Validation: RIF
Outline
4/15/2014 27Tutorial Robustness Validation & Sample Sizes

Probability of Detecting Failures (1)
4/15/2014 28
AEC‐Q100: 231 pcsProbability to have at least 1 fail in N samples
If defect level is 50 PPM: the probability to find a fail is only 10 %
Tutorial Robustness Validation & Sample Sizes
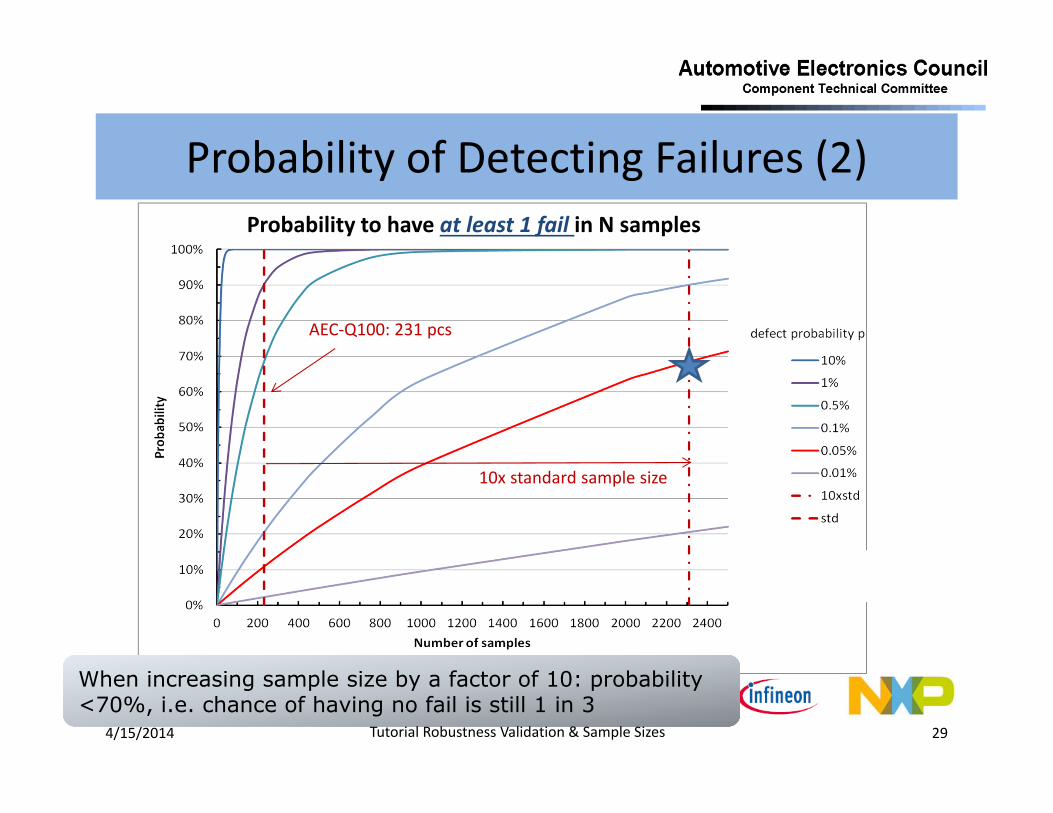
Probability of Detecting Failures (2)
4/15/2014 29
AEC‐Q100: 231 pcs
When increasing sample size by a factor of 10: probability <70%, i.e. chance of having no fail is still 1 in 3
Probability to have at least 1 fail in N samples
Tutorial Robustness Validation & Sample Sizes
10x standard sample size
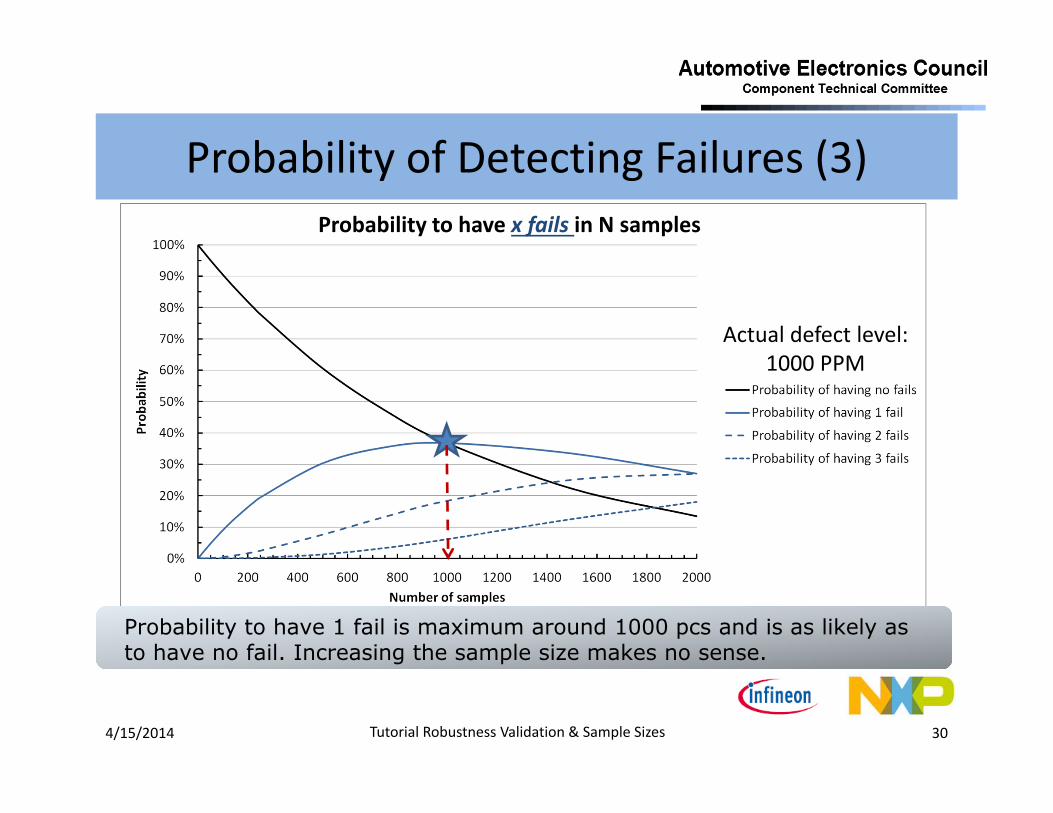
Probability of Detecting Failures (3)
4/15/2014 30
If you have a defect with a probability of 0.1%, what is the number of samples to give you a 10% chance of finding 1 failure?How many samples are needed for a 10% chance to find 2 failures?
Probability to have x fails in N samples
Actual defect level:1000 PPM
Probability to have 1 fail is maximum around 1000 pcs and is as likely as to have no fail. Increasing the sample size makes no sense.
Tutorial Robustness Validation & Sample Sizes

Weibull with 0 Fails Assuming Wearout (ß = 3)
4/15/2014 31
0/231, 90 % confidence
Failure Rate @ 1000 hr: ≈ 1 % (assumed: 0 fails)
Tutorial Robustness Validation & Sample Sizes

Effect of Larger Sample Sizes
4/15/2014 32
0/231 ≈ 2/231 with 90 % confidence
Sample size * 10 = 2310
Sample size * 100 = 23100
1 %
0.1 %
0.01 %
By increasing sample sizes: failure rate @ 1000 hr will drop
Tutorial Robustness Validation & Sample Sizes

Effect of Longer Test Times
4/15/2014 33
Test duration * 2 = 2000 hr
Test duration * 4 = 4000 hr1 %
0.1 %
0.01 %
By increasing test duration: failure rate @ 1000 hr will drop
Tutorial Robustness Validation & Sample Sizes

Samples Sizes & Test Times (Summary)
4/15/2014 34
For a given 1000 h test result of 0/231, the predicted failure rate can be improved by increasing the sample size OR increasing the test timeReally large sample sizes are needed to significantly improve the statistics, but this increase is limited by the amount of test positionsHowever, extended read points allow for determining the (intrinsic) robustness margin, while contributing also to improved statisticsat 1000 hr
Robustness Indication Figure (RIF)
Tutorial Robustness Validation & Sample Sizes

The mission profile is translated into an equivalent stress with the same conditions as the qualification standard test. This calculated stress duration tcalc (in hrs or number of cycles) has to be compared with the standard qualification duration tstand.Let us talk about RIF again
RV Flow Chart (slide from last year)
4/15/2014 35
Flow chart 1
Flow chart 2
Remember?
Tutorial Robustness Validation & Sample Sizes
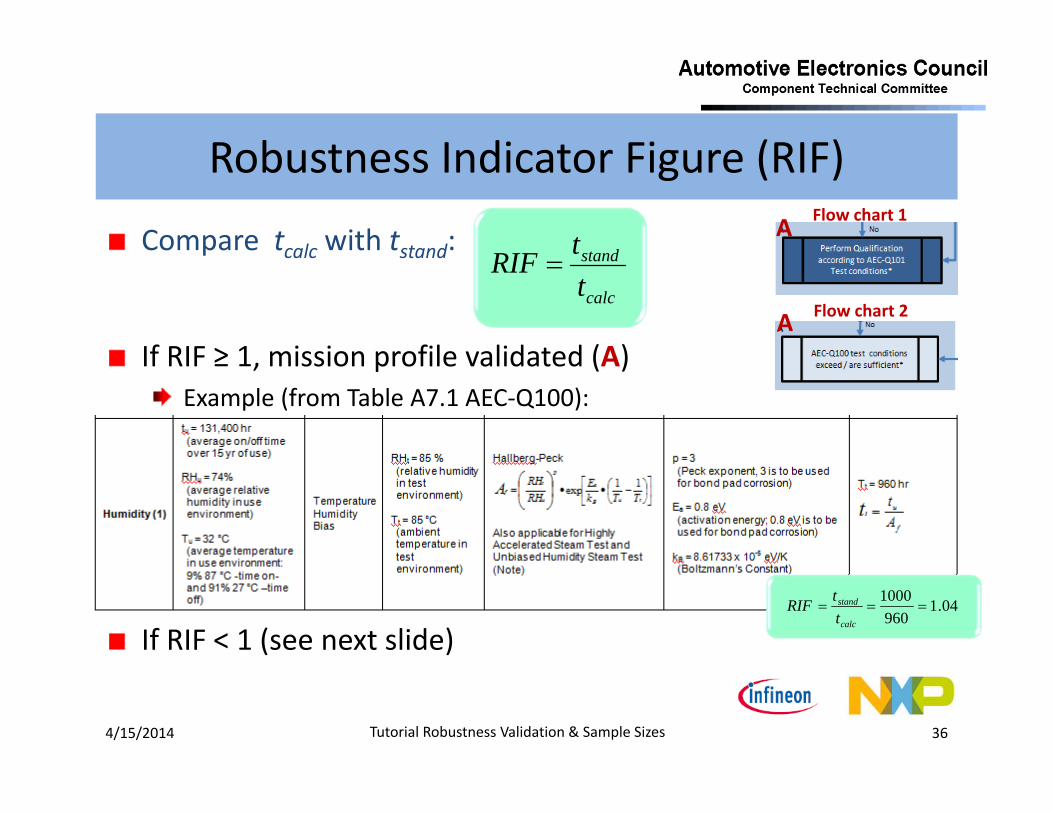
Robustness Indicator Figure (RIF)
4/15/2014 36
calc
stand
ttRIF
Compare tcalc with tstand:
If RIF ≥ 1, mission profile validated (A)Example (from Table A7.1 AEC‐Q100):
If RIF < 1 (see next slide)04.1
9601000
calc
stand
ttRIF
A
A
Flow chart 1
Flow chart 2
Tutorial Robustness Validation & Sample Sizes

Robustness Indicator Figure (RIF)
4/15/2014 37
calc
extended
ttRIF
If RIF < 1, then tcalc > tstandExtended test available orpossible?Compare tcalc with textended:
RIF ≥ 1, mission profilevalidated (B)If RIF < 1 (see next slide)
Flow chart 1
Flow chart 2 B
B
Tutorial Robustness Validation & Sample Sizes

Robustness Indicator Figure (RIF)
4/15/2014 38
In case test to fail data are available:
If RIF ≥ 1, robustness validated (C)If RIF < 1, assess potential solutions(Appendix 7, section A7.3.3.3)
Lesson 8 and 9:Test‐to‐fail may result in unrealistic long test durationIn these cases change or degradation of electrical or physical properties during or after stress can be used to reduce test duration
Flow chart 1 & 2
calc
fail
tt
RIF C
Examples in Ref. 12
Tutorial Robustness Validation & Sample Sizes
0/77 is rather an industry consensus based value than having a relevant statistical valueSample sizes have to be adapted to the requirements determined by the test methodTesting longer is better than testing more
Lessons Learned
4/15/2014 39Tutorial Robustness Validation & Sample Sizes

Questions?
4/15/2014 40Tutorial Robustness Validation & Sample Sizes