rock physical aspects of co2 injection in chalk - dtu orbitorbit.dtu.dk/files/6578772/mohammad m...
TRANSCRIPT

General rights Copyright and moral rights for the publications made accessible in the public portal are retained by the authors and/or other copyright owners and it is a condition of accessing publications that users recognise and abide by the legal requirements associated with these rights.
Users may download and print one copy of any publication from the public portal for the purpose of private study or research.
You may not further distribute the material or use it for any profit-making activity or commercial gain
You may freely distribute the URL identifying the publication in the public portal If you believe that this document breaches copyright please contact us providing details, and we will remove access to the work immediately and investigate your claim.
Downloaded from orbit.dtu.dk on: Dec 30, 2020
Rock physical aspects of CO2 injection in chalk
Alam, Mohammad Monzurul
Publication date:2011
Document VersionPublisher's PDF, also known as Version of record
Link back to DTU Orbit
Citation (APA):Alam, M. M. (2011). Rock physical aspects of CO2 injection in chalk. Kgs. Lyngby, Denmark: TechnicalUniversity of Denmark.

PhD ThesisApril 2011
Mohammad Monzurul Alam
Rock physical aspects of CO injection in chalk2


Rock physical aspects of CO2 injection in chalk
Mohammad Monzurul Alam
PhD Thesis April 2011
DTU Environment
Department of Environmental Engineering Technical University of Denmark

DTU Environment
April 2011
Department of Environmental Engineering
Technical University of Denmark
Miljoevej, building 113
DK-2800 Kgs. Lyngby
Denmark
+45 4525 1600
+45 4525 1610
+45 4593 2850
http://www.env.dtu.dk
Vester Kopi
Virum,
Torben Dolin
978-87-92654-32-8
Address:
Phone reception:
Phone library:
Fax:
Homepage:
E-mail:
Printed by:
Cover:
ISBN:
Mohammad Monzurul Alam
Rock physical aspects of CO injection in chalk2
PhD Thesis,
The thesis will be available as a pdf-file for downloading from the homepage of
the department: www.env.dtu.dk
April 2011

I
Preface This PhD thesis entitled “Rock physical aspects of CO2 injection in chalk” is based on the research carried out in parallel to the project “Øget olieudvinding gennem CO2 udnyttelse (Enhanced Oil Recovery through CO2 utilization)”, financed by Danish Advanced Technology Fund (Højteknologifonden). The work was supervised by Associate Professor Ida Lykke Fabricius at the Department of Environmental Engineering, Technical University of Denmark (DTU). This research has been accomplished in collaboration with DONG Energy, Geological Survey of Denmark and Greenland (GEUS), Danish Geotechnical Institute (GEO) and Department of Chemical Engineering, DTU. The laboratory experiments in this thesis were carried out at DTU, GEO, GEUS, Copenhagen University (Life Science), Imperial College, London and University of Stavanger, Norway. Four months external research (theoretical and experimental) was performed at the Colorado School of Mines, USA under the supervision of Associate Professor Dr. Manika Prasad at the department of Petroleum Engineering. The thesis consists of a synopsis and six papers. Chapter 4 of the synopsis is written as a substitute for a technical report on “work package 1.1: Monitoring changes in pore-structure and fluid properties as a result of CO2 injection into hydrocarbon reservoirs” under the research project “Enhanced oil recovery through CO2 utilization”. The papers comprise one published paper, one accepted manuscript, two submitted manuscripts and two peer reviewed extended abstracts, which were not converted into a journal paper due to time constraints. They are placed after the synopsis and marked and cited by roman numbers. In addition an appendix with laboratory results is included and referred to by the roman number VII.
I Alam, M.M., Borre, M.K., Fabricius I.L, Hedegaard, K., Røgen, B, Hossain, Z and Krogsbøll, A.S., 2010, Biot’s coefficient as an indicator of strength and porosity reduction: Calcareous sediments from Kerguelen Plateau. Journal of Petroleum Science and Engineering 70 (2010) 282-297.
II Alam, M.M., Prasad, M and Fabricius, I.L., Permeability prediction in Chalks. Accepted manuscript in AAPG Bulletin.

II
III Alam, M.M., Fabricius, I.L. and Christensen H.F., Static and dynamic effective stress coefficient of chalk. Submitted to Geophysics.
IV Alam, M.M., Hjuler, M.L., Christensen H.F. and Fabricius, I.L., Petrophysical and rock-mechanics effects of CO2 injection for enhanced oil recovery: chalk from South Arne field, North Sea. Submitted to Geophysical Prospecting.
V Alam, M.M., Ahsan, R., Shaik, A. K. and Fabricius, I. L., 2010, Surface charge of calcite and its influence on the electrical conductivity in chalk. Presented in the SEG International Exposition and 80th Annual Meeting, 17–22 October 2010, Denver, Colorado, USA.
VI Alam, M.M. and Fabricius, I.L., 2010, NMR as a Tool for Estimation of Excess Conductivity in Chalk. Poster presented in 72nd EAGE Conference and Exhibition, Barcelona, Spain 14-17 June 2010.
VII Appendix with detailed experimental results. The papers and appendix are not included in this www-version, but can be obtained from the library at DTU Environment. Contact [email protected] or Department of Environmental Engineering, Technical University of Denmark, Miljoevej, Building 113, DK-2000 Kgs. Lyngby, Denmark.
Mohammad Monzurul Alam April 2011

III
Summary Enhanced oil recovery by CO2 injection (CO2-EOR) is a tertiary oil recovery process which has a great potential for being used at the same time as an effective technique for carbon dioxide capture and storage (CCS). Impact of supercritical CO2 on the petrophysical and rock-mechanics properties of Ekofisk Formation and Tor Formation chalk from South Arne field, Danish North Sea, chalk was investigated. Chalk is a carbonate rich sedimentary rock. The chalk of the studied field is characterized by high porosity and low permeability. Injection of supercritical CO2 increases mobility of the oil in these low permeable chalk and at the same time high porosity provides large storage capacity. However, our current knowledge on the interaction between particles of chalk and CO2 and its influence on the reservoir characteristics for long time storage is limited. A series of laboratory experiments was performed on core material collected from the reservoir zone of the South Arne field in order to reveal the changes with respect to porosity, specific surface, pore stiffness, wettability, mineralogy and mechanical failure. In addition, a theoretical rock physical background was also established in order to be able to make sensible interpretation of laboratory data. Sound wave velocity was used as the central tool to study any change in petrophysical and rock mechanical properties. The main focus was to achieve a better understanding of effective stress coefficient (also known as Biot’s coefficient); by means of which effective stress can be predicted more accurately. Independent theoretical studies were made on diagenesis, surface properties and stiffness of chalk and their relation with sonic velocity (or Boit’s coefficient calculated from sonic velocity). The knowledge and experience from these studies was combined to achieve the main research objective of monitoring changes in hydrocarbon reservoirs in chalk due to CO2 injection. In order to understand the development of chalk from calcareous ooze and achieving pore stiffness, the diagenesis process of a sedimentary sequence from Kerguelen Plateau in the Indian Ocean was studied. The principal objective of the study was to explore how different porosity reduction mechanisms change the strength of these deep sea carbonate-rich sediments and how these mechanisms
can be traced from the change in Biot’s coefficient, . In calcareous ooze, was
found close to one. Mechanical compaction reduces porosity, but only leads to a
minor decrease in . Recrystallization process renders particles smoother, but do

IV
not lead to reduction in unless it gives rise to pore stiffening cementation. Pore
stiffening cementation causes to fall, even when porosity remains constant.
Fluid flow mechanism in the pores of chalk was studied by means of a widely used concept of flow zone indicator (FZI) and a more realistic model for chalk based on specific surface of the grains (Sg). The aim of the study was to use sonic velocity for permeability prediction. It was found that permeability prediction in chalk can be improved significantly by knowing the approximate specific surface of a stratigraphic sequence. Reservoir compaction is a result of both elastic and plastic deformation (static), while sound velocity only characterizes elastic properties of rocks (dynamic). Studies on Biot’s coefficient suggest that the stress dependence of the static effective stress coefficient, n must be established in order to use 4D seismic data for monitoring reservoir compaction and changes in pore pressure. In addition, an investigation on how static effective stress coefficient, n is related to the dynamic
effective stress coefficient (Biot’s coefficient), was made in order to be able to
estimate n from sonic velocity data. Due to supercritical CO2 injection 2-3% increase in porosity, minor smoothening of particle surface and consequent small increase in permeability and a decrease in elastic stiffness (as indicated by Biot’s coefficient) was observed. However, no significant change in wettability was noticed. It was found that the effect of CO2 injection on both petrophysical and mechanical properties of chalk depend on carbonate content. Pure chalk with high carbonate content is relatively prone to mechanical weakening due to CO2 injection, while no significant effect was observed in relatively impure chalk of Ekofisk Formation during the span of the experimental study. It was noted that, in spite of mechanical weakening only minor compaction is expected because effective stress is decreased due to an increase in effective stress coefficient. Extensive time-lapse monitoring strategies are required during a CO2-EOR process for the measurement of changes in reservoir properties that may cause deformation of and leakage from a reservoir. Results of this study will provide data for designing future monitoring strategies based on 4D seismic.

V
Dansk resume Øget olieindvinding ved CO2 injektion (CO2-EOR) er en tertiær indvindingsteknik, som kan bruges samtidig med CO2-lagring. I afhandlingen undersøges, hvordan injektion af superkritisk CO2 påvirker de petrofysiske og bjergartsmekaniske egenskaber af kridt fra Ekofisk og Tor Formationen i Syd Arne feltet i Nordsøen. Kridt er en sedimentær bjergart, der overvejende består af karbonat. I det undersøgte oliefelt har kalken høj porøsitet, men lav permeabilitet. Når superkritisk CO2 injiceres, øges oliens mobilitet i den lavpermeable bjergart, og samtidig betinger den høje porøsitet stor lagerkapacitet. Imidlertid har vi kun begrænset viden om vekselvirkningen mellem kalkens partikler og CO2, og om hvordan denne påvirker reservoiregenskaberne i lageret. Derfor blev der udført laboratorieeksperimenter på kernemateriale fra reservoirintervallet i Syd Arne feltet for at måle ændringerne i porøsitet, specifik overflade, porestivhed, fugtpræference, mineralogi og mekanisk styrke. Derudover blev den teoretiske bjerartsfysiske baggrund uddybet som udgangspunkt for tolkningen af laboratorieeksperimenterne. Hastigheden af elastiske bølger blev anvendt som det centrale redskab til at undersøge ændringer i petrofysiske og bjergartsmekaniske egenskaber. Der blev lagt vægt på at opnå en bedre forståelse af den effektive spændingskoefficient (Biot’s koefficient): ved hjælp af denne kan den effektive spænding estimeres med større nøjagtighed. Der blev udført uafhængige teoretiske undersøgelser af diagenese, overfladeegenskaber og stivhed af kalk, og af hvordan disse relaterer til hastigheden af elastiske bølger (eller af Biot’s koefficient, som kan beregnes ud fra bølgehastighederne). Resultaterne fra disse undersøgelser blev integreret for at belyse mulighederne for monitering af ændringer af kulbrintereservoirer på grund af CO2 injektion. For at kunne forstå udviklingen fra kalkslam til kalk og dermed etableringen af porestivhed undersøgtes diagenesen i en sedimentær lagsøjle i Kerguelen Plateauet i Det indiske Ocean. Hovedformålet var at se, hvordan forskellige porøsitetsreduktionsmekanismer ændrer styrken af disse karbonatrige dybhavssedimenter, og at se, hvordan disse mekanismer kan afsløres ud fra
ændringer i Biot’s koefficient, . I kalkslam er nær en. Mekanisk kompaktion
reducerer porøsiteten, men fører kun til en mindre reduktion af.
Rekrystallisering gør sedimentpartiklerne glattere, men fører ikke til reduktion af
VI
,med mindre den giver anledning til kontaktcementering. Kontaktcement øger
porestivheden og får til at falde, også selvom porøsiteten forbliver uændret.
Væskestrømning i kalkens porer blev undersøgt ud fra det velkendte “flow zone indicator” (FZI) koncept, der blev sammenlignet med en mere realistisk model for kalk, der bygger på partiklernes specifikke overflade (Sg). Hovedformålet med denne undersøgelse var at introducere brugen af elastisk bølgehastighed til at forudsige permeabiliteten. Resultatet blev, at forudsigelsen af permeabiliten kan forbedres væsentligt, hvis den specifikke overflade af en given stratigrafisk enhed kendes. Reservoirkompaktion skyldes både elastisk og plastisk deformation (statisk deformation), mens elastiske bølger kun giver elastisk deformation (dynamisk deformation). Undersøgelser af Biot’s koefficient tyder på, at det er den statiske effektive spændingskoefficient, n, der skal kendes, for at man kan bruge 4D seismiske data til at monitere reservoirkompaktion og ændringer i poretryk. Derfor undersøgtes det, hvordan den statiske effektive spændingskoefficient, n,
afhænger af den dynamiske effektive spædingskoefficient (Biot’s koefficient), ,
så at n kan estimeres ud fra hastigheden af elastiske bølger. Injektion af superkritisk CO2 gav anledning til en porøsitetsstigning på 2-3% samt en mindre udglatning af partikeloverflader. Derfor sås også en mindre permeabilitetesforøgelse og et fald i porestivheden som afspejlet i Biot’s koefficient. Derimod sås der ingen ændring i fugtpræference. Virkningen af CO2 på petrofysiske og mekaniske egenskaber ser ud til at afhænge af kalkens karbonatindhold. Ren kalk med højt karbonatindhold svækkes forholdsvis meget af CO2 injektion, mens der, i det tidsrum eksperimentet strakte over, kun blev fundet en ubetydelig svækkelse af den relativt urene kalk fra Ekofisk Formationen. Det blev observeret, at der på trods af den mekaniske svækkelse kun blev observeret ubetydelig mekanisk kompaktion ved de geotekniske forsøg. Dette kan skyldes, at den effektive spænding mindskes, når den effektive spændingskoefficient øges. Det anbefales at bruge 4D seismisk monitering af øget olieudvinding med CO2, for at ændringer i reservoiregenskaberne kan opdages, før de fører til deformation af reservoiret og mulig lækage. Resultater fra nærværende undersøgelse giver data til fremtidige moniteringsstrategier baseret på 4D seismik.

VII
Acknowledgement I would like to take this opportunity to express my gratitude and appreciation to the people who have given me their assistance throughout my studies. My sincere gratitude goes to my supervisor Ida Lykke Fabricius for her assistance, guidance, technical and moral support. She showed me different ways to approach a problem; also in the daily life: most importantly how to survive in Danish weather. I feel lucky to get Casper Olsen, Morten Hjuler, Zakir Hossain, Ahmed Awadalkarim, Morten Sørensen, Ernest Ncha Mbia and as my colleagues. I would like to thank you all for providing me with a friendly, creative and productive work environment. I thank Manika Prasad of Colorado School of Mines for accepting me for my external study and for her kind assistance and advice during my stay in Golden. I thank Rajib Ahsan, Milton Barua, Naweed Al-Haque and Kaushal Sagar: with you I got a homely feeling in Denmark. A huge thank to Sinh Nguyen and Hector Diaz of DTU-environment for assisting laboratory work. Lars Christensen of Danish Geotechnical Institute (GEO) is thanked for setting up the resistivity measurement equipment. I gratefully acknowledge the support from Igor Loboda, Pierre Tjørnehøj and Kai West of GEO during my laboratory work at GEO. I appreciate the interest of Helle Foged Christensen on my work and thank for technical discussions. Sevket Durucan and Syed S. Amer of Imperial College London and Ola K. Siqveland, Megawati of University of Stavanger and Carlos Grattoni of University of Leeds are gratefully acknowledged for assisting with NMR measurement and interpretation The financial support from HTF (Danish Advanced Technology Fund) and Technical University of Denmark is gratefully acknowledged. I thank DONG Energy for providing well log and core data. I am thankful to all members of the CO2-EOR project for valuable discussions, suggestion and technical assistance. Special thanks to Dan Olsen of Geological Survey of Greenland and Denmark (GEUS) for helping with saturating the samples and also providing HTF brine. I thank my dear parents, brother and sister for encouragement and immense support to pursue my interests. Last but not the least; I thank my dear wife Swarna for her patience, consideration and unconditional support. Mohammad Monzurul Alam Lyngby, April 2011

VIII

IX
Content 1 Introduction ................................................................................................................. 1
1.1 Statement of problem ............................................................................................. 1 1.2 Scope of study ........................................................................................................ 2
2 Pore stiffness and effective stress ............................................................................... 5 2.1 Petrography............................................................................................................. 5 2.2 Porosity................................................................................................................... 8
2.2.1 Porosity change during diagenesis .................................................................. 9 2.2.2 Production induced porosity change ............................................................... 9 2.2.3 Use of sonic velocity for monitoring porosity change .................................. 10
2.3 Effective stress...................................................................................................... 11 2.3.1 Effective stress coefficient (Biot’s coefficient) ............................................. 11 2.3.2 Bounds for Biot’s coefficient for chalk ......................................................... 13
2.4 Static and dynamic effective stress coefficient..................................................... 14 2.4.1 Background study of static and dynamic behaviour...................................... 14 2.4.2 Stress dependent behavior of Biot’s coefficient ............................................ 15 2.4.3 Static effective stress coefficient ................................................................... 17 2.4.4 Relationship between dynamic and static effective stress coefficient........... 17
2.5 Fluid effect on stiffness ........................................................................................ 18
3 Chalk surface and fluid flow .................................................................................... 19 3.1 Fluid flow in chalk................................................................................................ 20
3.1.1 Conventional concept of flow in porous media............................................. 20 3.1.2 Effective Specific Surface concept of fluid flow in chalk............................. 21
3.2 Permeability prediction ........................................................................................ 23 3.2.1 Flow Zone Indicator (FZI)............................................................................. 25 3.2.2 Specific Surface of the Grains, Sg.................................................................. 26 3.2.3 Use of sonic velocity for permeability monitoring........................................ 26
3.3 Surface charge in chalk......................................................................................... 27 3.3.1 Surface charge of clay in chalk...................................................................... 27 3.3.2 Surface charge of calcite in chalk.................................................................. 27 3.3.3 Cation exchange capacity and excess conductivity....................................... 27 3.3.4 Excess conductivity due to surface charge of calcite .................................... 28 3.3.5 Influence of calcite surface on excess conductivity ...................................... 29
4 Petrophysical effect of CO2 EOR in chalk .............................................................. 31 4.1 Material................................................................................................................. 31 4.2 Geophysical analysis on 1½ inch core plugs........................................................ 32
4.2.1 Test plan ........................................................................................................ 32 4.2.2 Cold flush cleaning........................................................................................ 34 4.2.3 Grain density and porosity............................................................................. 34 4.2.4 Gas permeability............................................................................................ 35 4.2.5 Establishing experimental condition ............................................................. 36
4.2.5.1 Stress condition for sonic velocity and electrical resistivity measurement............................................................................................................................ 36 4.2.5.2 Irreducible water saturation to be used during CO2 flooding................. 37
X
4.2.5.3 Injection rate required to avoid worm holes resulting from CO2 injection............................................................................................................................. 39
4.2.6 Saturating fluid .............................................................................................. 40 4.2.6.1 South Arne synthetic brine (HTF brine)................................................. 40 4.2.6.2 Supercritical CO2.................................................................................... 41
4.2.7 Saturation processes ...................................................................................... 41 4.2.7.1 Initial water saturation............................................................................ 41 4.2.7.2 Irreducible water saturation.................................................................... 42 4.2.7.3 Residual oil saturation ............................................................................ 42 4.2.7.4 CO2 injection .......................................................................................... 42 4.2.7.5 Final water saturation ............................................................................. 43
4.2.8 Data collection and analysis .......................................................................... 43 4.2.8.1 Sonic velocity measurements ................................................................. 44 4.2.8.2 Modulus and Biot’s coefficient from sonic velocity .............................. 45 4.2.8.3 Electrical resistivity measurements ........................................................ 46 4.2.8.4 Archie’s cementation factor, m from electrical resistivity ..................... 47 4.2.8.5 NMR T2 relaxation time measurements ................................................. 47 4.2.8.6 Surface relaxivity from transverse relaxation time, T2 ........................... 48
4.3 Characterization by chips and side trims.............................................................. 49 4.3.1 Soxhlet extraction cleaning ........................................................................... 49 4.3.2 Carbonate content .......................................................................................... 49 4.3.3 Collection of Irreducible Residue (IR) .......................................................... 50 4.3.4 Specific surface.............................................................................................. 50 4.3.5 Mineral composition...................................................................................... 51 4.3.6 Cation Exchange Capacity (CEC) ................................................................. 52
4.3.6.1 BaCl2 method.......................................................................................... 52 4.3.6.2 Mg2+ adsorption method......................................................................... 53
4.4 Uncertainty analysis ............................................................................................. 54 4.4.1 Dependencies of strain rate ........................................................................... 54
4.4.1.1 Dependencies of strain rate on velocity measurement ........................... 54 4.4.1.2 Dependencies of strain rate on resistivity measurement ........................ 55
4.4.2 Dependency of frequency on resistivity measurement.................................. 55 4.4.3 Precision of instrument.................................................................................. 56 4.4.4 Uncertainty .................................................................................................... 56
4.4 Results and discussion.......................................................................................... 57 4.4.1 Sample characterization................................................................................. 57 4.4.1 Saturation....................................................................................................... 58 4.4.3 Petrophysical properties ................................................................................ 59 4.4.4 Geophysical properties .................................................................................. 61
5 Conclusions ................................................................................................................ 67
6 Recommendation for future work............................................................................ 69
7 List of references........................................................................................................ 71
8 Papers ......................................................................................................................... 81
9 Appendix ..............................................................................................................VIII-1

1
1 Introduction 1.1 Statement of problem Enhanced oil recovery by injecting supercritical CO2 (CO2-EOR) in depleted hydrocarbon reservoirs addresses two global issues at the same time: reducing CO2 in the atmosphere and increasing oil production. Chalk reservoirs in the Danish North Sea are of particular interest for applying this method. Because of high porosity the storage capacity in these chalk reservoirs are high. On the other hand, conventional oil recovery processes, as waterflooding is less effective in North Sea chalk, especially in Ekofisk Formation chalk, due to the low (<0.5 mD) matrix permeability (Blunt et al., 1993; Austad et al., 1998). By injecting supercritical CO2 in these low permeable reservoirs, a miscible flow of low kinematic viscosity fluid (CO2 dissolved in oil) is achieved and recovery of oil can be increased by up to 15% (Gozalpour et al., 2005; Darvish et al., 2006; Ferguson et al., 2009; Shaffer, 2010). However, there is a concern that CO2 can dissolve in the aqueous phase and produce weak acids which could be a threat for the carbonate frame in chalks and compaction or failure in the reservoir. If this happens there is a possibility to change the reservoir characteristics with respect to porosity, permeability, wettability, stiffness and strength (Plummer and Busenberg, 1982; Wolcott et al., 1989; Wellman et al., 2003; Hawkes et al., 2005; Madland et al., 2006; Xu et al., 2007; Zuta and Fjelde, 2008). These changes may influence the overall productivity from the reservoir and the stability of the reservoir rock, sealing rock and wellbore. North Sea chalks are composed of nanometer to a few micrometer sized fossils (coccolith fragments or aggregates of coccolith platelets) which is developed from the diagenesis of pelagic calcareous ooze (Scholle, 1977). Due to small particle size, chalk has a homogeneous structure with high specific surface area. A high specific surface of particles means that the solid has large exposure to the fluid. Therefore, the degree of change in the reservoir properties will be high if any reactive fluid is produced due to CO2 injection. Hydrocarbon reservoirs in the North Sea chalk are well known for its susceptibility under changed effective stress. Due to a high porosity and low induration, compaction in the reservoir and subsidence at the surface as result of

2
production induced decrease in pore pressure in the North Sea chalk fields has been reported by several authors (e.g. Hermansson and Gudmundsson, 1990; Kristiansen, 1998; Barkved and Kristiansen, 2005; Tjetland et al., 2007). Effective stress in a reservoir alters both by the change in pore pressure and degree of cementation as indicated by effective stress coefficient (Biot, 1941). Change in kinematic viscosity of pore fluid also affects the stiffness of chalk (Andreassen and Fabricius, 2010). Geomechanics modeling related to stress and strain associated with reservoir compaction and surface subsidence is required for estimating the stability of a reservoir during CO2-EOR and for long time storage of CO2. In addition, permanent monitoring techniques as 4D seismic are required to be applied in a CO2 injected field. Theoretical background on fluid-chalk interaction as well as laboratory-determined petrophysical and rock-mechanics properties are required for both modeling and monitoring purposes. Physical properties that are responsible for reservoir stability has been addressed in this project by conducting supercritical CO2 injection in core plugs collected from the reservoir zone of the South Arne field, North Sea. In addition a theoretical study was made on the relation of these properties with velocity of elastic wave propagation in chalk. The aim of this project is to provide data for rock physical models to describe changes after CO2 storage and to assess which geophysical method would be suitable for the monitoring purposes.
1.2 Scope of study Velocity of elastic waves is the primary data available for acquiring information about subsurface characteristics. Therefore, sound wave velocity has been used as the central tool to study any change in petrophysical and rock mechanical properties. In this thesis Gassmann (1951) fluid substitution, Biot (1941) effective stress law, Biot theory of fluid flow in porous medium (Biot, 1956a, b), effective medium model theories (Fabricius, 2003) and modified Mohr-Coulomb (p’-q) failure criteria was applied. This study can be divided into four parts: 1.) diagenesis and development of pore stiffness (Paper I), 2.) characteristics of the surface properties of the particles in chalk (Paper II, V and VI), 3.) static and dynamic behaviour (Paper III) and 4.) effect of supercritical CO2 (Paper IV). Both petrophysical and rock-mechanics

3
effect of CO2 injection were studied. However, experimental work only related to petrophysical properties were done under this project. For rock-mechanics properties (pore collapse, shear failure, static elastic moduli and creep) experimental data of Hjuler et al. (2010) were used in this study. In the study on diagenesis and development of pore stiffness (Paper I), calcareous sediments of Kerguelen plateau were used as reference chalk. The primary objective was to understand the pore structure and grain size and shape of chalk and how it changes during burial diagenesis. Biot’s coefficient was calculated from sonic velocity and density for water-saturated chalk samples. The change in Biot’s coefficient was investigated with respect to the diagenetic processes: mechanical compaction, recrystallization, grain-contact cementation and pore-filling cementation. Furthermore, an experimental study was made on the relation between Biot’s coefficient and the stress of pore collapse and creep. How Biot’s coefficient influences the rapid porosity reduction during mechanical testing was examined to mimic the rapid compaction of high porosity hydrocarbon-producing reservoirs. This may point to a route for prediction pore collapse in porous North Sea chalk from data on porosity and seismic velocity. The calcite surface was studied for its influence on fluid flow and electrical current flow (Paper II). Earlier studies of chalk indicate that specific surface of the grains (Sg) tends to be closer to constant for a given stratigraphic unit (Fabricius et al., 2007a). Changes in specific surface affect both permeability and sonic velocity (Alam et al., 2010). The variation of permeability and compressional velocity of sound waves in chalk with the variation in Sg was examined. In addition the applicability of the Flow Zone Indicator (FZI) method in chalk that Prasad (2003) had successfully applied in sandstones and limestones was examined. The main objective of this study was to understand the controls on permeability in the high-specific surface area chalks as opposed to the low-specific surface area sandstones and limestones. The exchangeability property of Ca2+ ions from calcite surface was studied for its relation to excess electrical conductivity (Paper V). Nuclear Magnetic Resonance (NMR) technique was used to quantify the contribution from the non-calcite and from the calcite fraction to the overall specific surface of chalk (Paper VI). Moreover specific surface of the individual components were compared with the excess conductivity of the chalk in order to identify the component which
4
contribute most to the overall excess conductivity. Ahsan and Fabricius’s (2010) experimental data on synthetic calcite was utilized in this study. An important aspect of this thesis is to investigate the relationship between static and dynamic properties of rock (Paper III). Variation of physical properties with the change in stress was studied. Dynamic effective stress coefficient calculated form sonic velocity was compared with the static effective stress coefficient measured from the rock mechanical compaction test. An investigation was made to find the effective stress coefficient relevant for rapid change in effective stress state. Investigating the impact of supercritical CO2 injection on petrophysical and rock-mechanics properties of chalk was the main objective of this project (Paper IV). In order to address this issue, a series of laboratory experiments were performed to gather data to be used for reservoir modeling and provide a better understanding of the interaction between chalk and CO2 for future monitoring purposes. Porosity, permeability, carbonate content, specific surface, wettability, compressional and shear wave velocity, NMR T2 relaxation and electrical resistivity. All parameters were measured before and after the CO2 injection. Experimental data of triaxial compression experiments (Hjuler et al., 2010) on waterflooded (reference) and water/CO2 injected cylindrical chalk cores were compiled in terms of strength envelopes to detect the effect of CO2 on the mechanical properties of chalk. Changes in porosity, permeability, stiffness, wettability and strength have been discussed from combined petrophysical and rock-mechanics perspective. Furthermore, moduli calculated from sonic velocity have been compared with two static moduli calculated 1.) from Linear Voltage Deformation Transducer (LVDT) measurement and 2.) strain gauge measurement.

5
2 Pore stiffness and effective stress Chalk reservoirs in the North Sea are characterized by high porosity, which could be as high as 50% (Munns, 1985; Andersen, 1995). High porosity of chalk makes it mechanically weak (Teufel and Warpinski, 1990; Ruddy et al., 1989). For instance, chalk from the North Sea reservoir zone demonstrates a significant impact on pore stiffness under changed effective stress state (Ruddy et al., 1989; Hermansson and Gudmundsson, 1990; Pattillo et al., 1998; Kristiansen et al., 2005; Tjetland et al., 2007). Decrease in stiffness causes porosity reduction, reservoir compaction, subsidence at the seafloor as well as increased pressure at the pore space which acts as compaction drive for increased oil production. Thus, pore space stiffness is an important parameter for reservoir simulation to model stability of reservoir under altered condition of pore fluid, overburden stress and pore pressure. Change in pore stiffness and effective stress due to CO2 injection could be a crucial factor and should be considered in assessing reservoirs in chalk as a CO2 storage site and for enhanced oil recovery by CO2 injection (CO2 EOR).
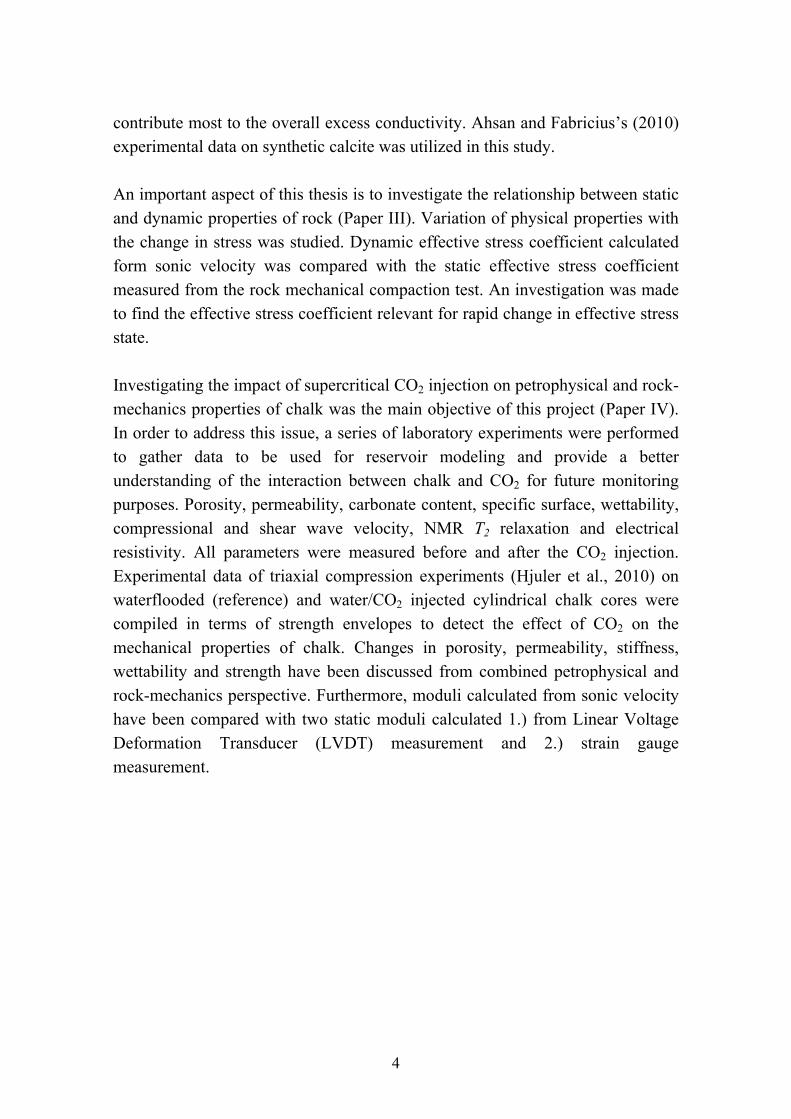
2.1 Petrography Chalk is a firm pelagic sediment composed predominantly of CaCO3 particles, which develops as a result of diagenesis of calcareous ooze. Mazzullo et al. (1988) defined ooze as an unconsolidated calcareous and/or siliceous pelagic sediment. Particles in calcareous ooze are primarily the skeletons of algae called coccospheres. The spherical shaped coccospheres are between 10 and 30 μm in diameter and composed of 7-20 wheel shaped coccolith platelets of 2 to 20 μm diameter and 0.5 to 2.5 μm across (Scholle, 1977; D'Heur, 1984) (Figure 2.1). North Sea chalk is predominantly composed of coccolith fragments or aggregates of coccolith platelets: entire coccospheres are relatively rare (Scholle, 1977) (Figure 2.1c). Due to the mineralogical and textural similarity with North Sea chalk, in order to understand the diagenetic process and its relation to the development of chalk from calcareous ooze and achieving pore stiffness, a sedimentary sequence from Kerguelen Plateau in the Indian Ocean was studied (Paper I). In Kerguelen Plateau, the upper 660 m of sediments are carbonate-rich, mostly carbonate mudstone with occasional wakestone texture (according to Dunham, 1962 classification) and the porosity ranges from 75% at the top to 25% at the bottom (Figure 2.2). Some intervals are rich in amorphous silica (Opal A), indeed the
6
amount of non-carbonate fraction exceeds 60% in the top 120 meters (Late Pliocene and Late Miocene). More than 15% non carbonate fraction (mainly amorphous silica) was also found in samples near 340 mbsf (Late Eocene to Early Oligocene) and below 625 mbsf (Santonian to Turonian). High specific surface was found in intervals where the amount of non carbonate fraction is high. This may be due to the high specific surface of amorphous silica and clay.
300μm 300μm 300μm
30μm 30μm 30μm
(a) Kerguelen plateau (South Indian Ocean) Depth: 393.65 mbsf) Age: Middle Eocene Description: Foraminifer-bearing nannofossil chalk Texture: Mudstone Carbonates: 94% Porosity: 47% Permeability: 0.7 mD
(b) Ontong Java plateau (West Pacific Ocean) Depth: 751.83 mbsf Age: Lower Oligocene Description: Foraminifer-bearing nannofossil chalk Texture: Mudstone Carbonates: 93% Porosity: 51% Permeability: -
(c) South Arne field (North Sea) Depth: 2837.1 mbsf Age: Upper Cretaceous Description: Foraminifer-bearing nannofossil chalk Texture: Wackstone Carbonates: 99% Porosity: 28% Permeability: 0.8 mD
Figure 2.1: Backscatter micrographs (BSE) of epoxy-impregnated and polished chalk samples from three different places of the world, (a) Kerguelen plateau (Paper I), (b) Ontong Java plateau (Fabricius, 2003), (c) North Sea (Paper IV). The North Sea samples are from oil bearing zone and deeper burial depth (higher temperature). The deep sea samples are normally brine saturated and come from shallower depth. North Sea chalk contains high degree of
recrystallization (grain smoothening) as seen in large magnification image (30 μm30 μm).

7
008R4-Depth: 70.2 m; : 69%, CaCO3: 31%
042R2-Depth: 393.7 m; : 47%, CaCO3: 94%
013R4-Depth: 117.9 m; : 73%, CaCO3: 39%
048R1-Depth: 449.9 m; : 50%, CaCO3: 94%
019R2-Depth: 172.6 m; : 60%, CaCO3: 93%
051R1-Depth: 478.5 m; : 42%, CaCO3: 91%
024R1-Depth: 219.2 m; : 58%, CaCO3: 95%
059R1-Depth: 554.8 m; : 41%, CaCO3: 94%
029R2-Depth: 268.8 m; : 55%, CaCO3: 93%
061R2-Depth: 575.6 m; : 35%, CaCO3: 96%
036R4-Depth: 338.9 m; : 49%, CaCO3: 83%
066R3-Depth: 625.5 m; : 26%, CaCO3: 86%
Figure 2.2: Backscattered Electron (BSE) images of chalk from Kerguelen Plateau shows variation in porosity and grain size distribution according to depth.
Small pores Small calcite matrix grains (<3.16 sq. micron)Large pores Large calcite matrix grains (316-3.16 sq. micron)Amorphorus silica and clay Large calcite grains (>316 sq. micron)
8
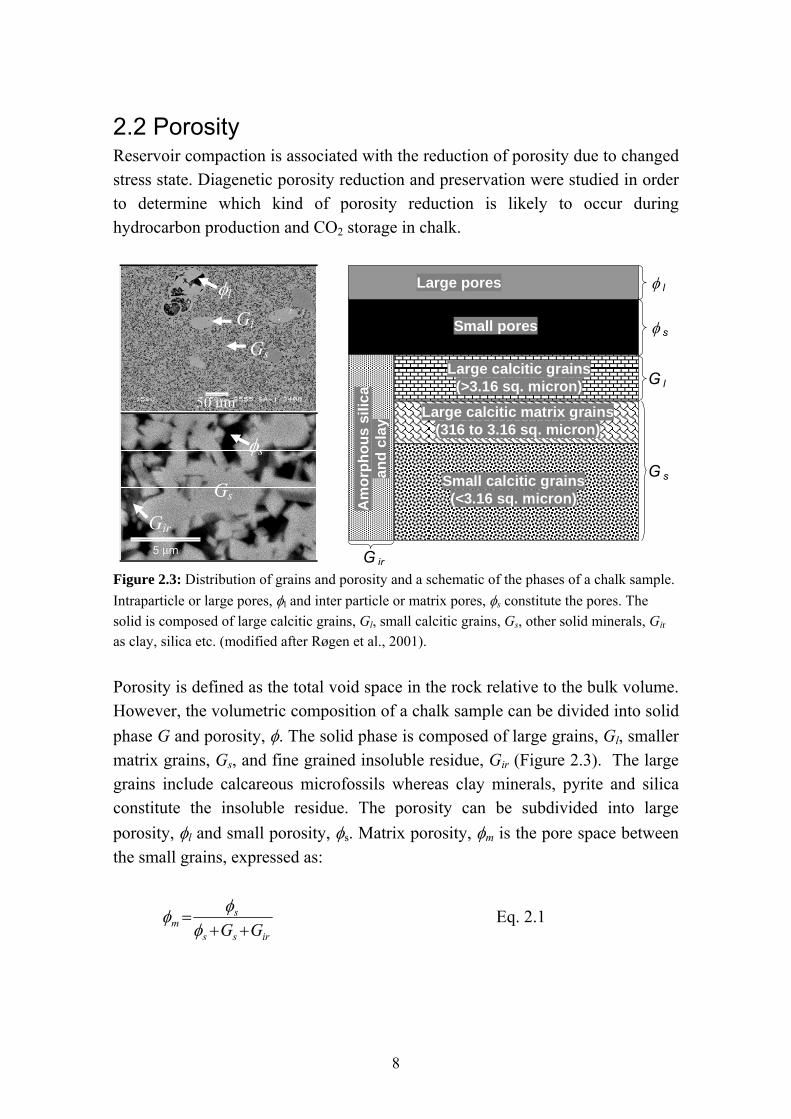
2.2 Porosity Reservoir compaction is associated with the reduction of porosity due to changed stress state. Diagenetic porosity reduction and preservation were studied in order to determine which kind of porosity reduction is likely to occur during hydrocarbon production and CO2 storage in chalk.
l
Gl
50 μm
Gir
Gs
s
Gs
G ir
s
l
G l
G s
Large calcitic grains (>3.16 sq. micron)
Large calcitic matrix grains (316 to 3.16 sq. micron)
Small calcitic grains (<3.16 sq. micron)
Large pores
Small pores
Am
orp
ho
us
sil
ica
an
d c
lay
Figure 2.3: Distribution of grains and porosity and a schematic of the phases of a chalk sample.
Intraparticle or large pores, l and inter particle or matrix pores, s constitute the pores. The
solid is composed of large calcitic grains, Gl, small calcitic grains, Gs, other solid minerals, Gir as clay, silica etc. (modified after Røgen et al., 2001).
Porosity is defined as the total void space in the rock relative to the bulk volume. However, the volumetric composition of a chalk sample can be divided into solid
phase G and porosity, . The solid phase is composed of large grains, Gl, smaller
matrix grains, Gs, and fine grained insoluble residue, Gir (Figure 2.3). The large grains include calcareous microfossils whereas clay minerals, pyrite and silica constitute the insoluble residue. The porosity can be subdivided into large
porosity, l and small porosity, s. Matrix porosity, m is the pore space between
the small grains, expressed as:
irss
sm GG
Eq. 2.1
9
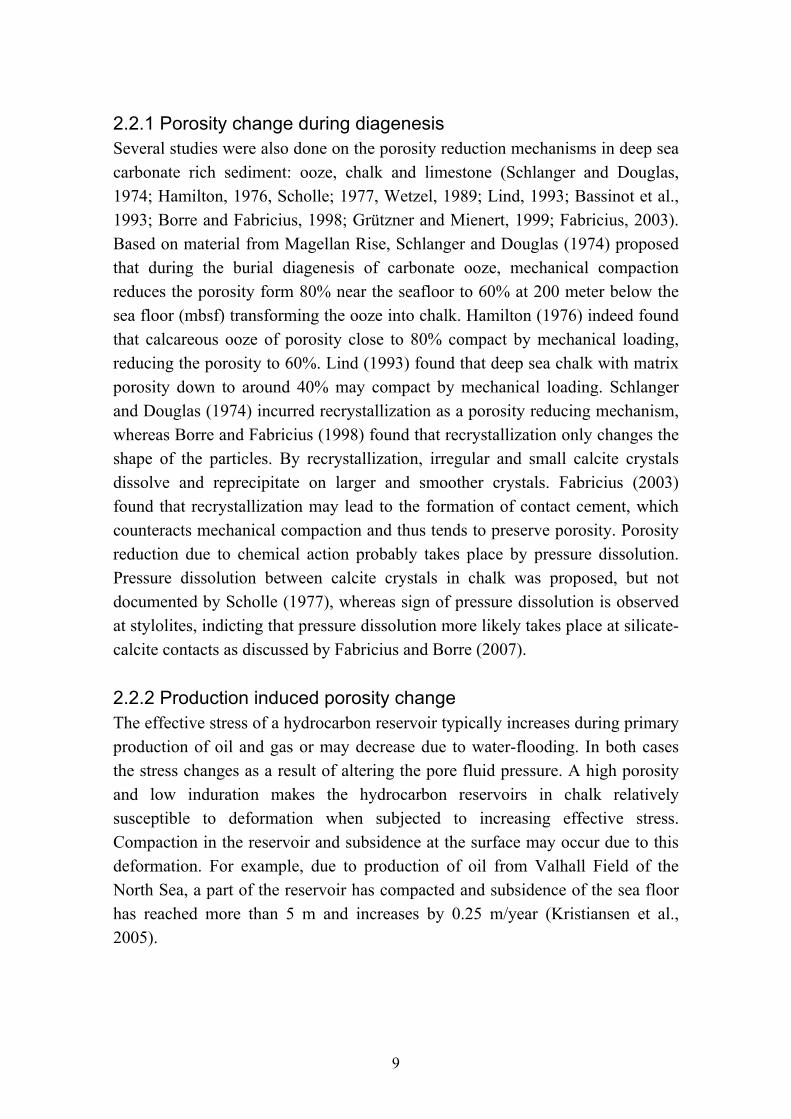
2.2.1 Porosity change during diagenesis Several studies were also done on the porosity reduction mechanisms in deep sea carbonate rich sediment: ooze, chalk and limestone (Schlanger and Douglas, 1974; Hamilton, 1976, Scholle; 1977, Wetzel, 1989; Lind, 1993; Bassinot et al., 1993; Borre and Fabricius, 1998; Grützner and Mienert, 1999; Fabricius, 2003). Based on material from Magellan Rise, Schlanger and Douglas (1974) proposed that during the burial diagenesis of carbonate ooze, mechanical compaction reduces the porosity form 80% near the seafloor to 60% at 200 meter below the sea floor (mbsf) transforming the ooze into chalk. Hamilton (1976) indeed found that calcareous ooze of porosity close to 80% compact by mechanical loading, reducing the porosity to 60%. Lind (1993) found that deep sea chalk with matrix porosity down to around 40% may compact by mechanical loading. Schlanger and Douglas (1974) incurred recrystallization as a porosity reducing mechanism, whereas Borre and Fabricius (1998) found that recrystallization only changes the shape of the particles. By recrystallization, irregular and small calcite crystals dissolve and reprecipitate on larger and smoother crystals. Fabricius (2003) found that recrystallization may lead to the formation of contact cement, which counteracts mechanical compaction and thus tends to preserve porosity. Porosity reduction due to chemical action probably takes place by pressure dissolution. Pressure dissolution between calcite crystals in chalk was proposed, but not documented by Scholle (1977), whereas sign of pressure dissolution is observed at stylolites, indicting that pressure dissolution more likely takes place at silicate-calcite contacts as discussed by Fabricius and Borre (2007).
2.2.2 Production induced porosity change The effective stress of a hydrocarbon reservoir typically increases during primary production of oil and gas or may decrease due to water-flooding. In both cases the stress changes as a result of altering the pore fluid pressure. A high porosity and low induration makes the hydrocarbon reservoirs in chalk relatively susceptible to deformation when subjected to increasing effective stress. Compaction in the reservoir and subsidence at the surface may occur due to this deformation. For example, due to production of oil from Valhall Field of the North Sea, a part of the reservoir has compacted and subsidence of the sea floor has reached more than 5 m and increases by 0.25 m/year (Kristiansen et al., 2005).

10
The study on chalk from Kerguelen plateau (Paper I) indicates that porosity reduction in chalk subjected to mechanical load is more likely due to the volume change of the small pores (inter-particle porosity). It is in accordance with other geotechnical studies (Valent et al., 1982; Lind, 1993). In the deep sea pelagic carbonates in the Kerguelen Plateau, porosity reduction by compaction and creep takes place by the reduction of the matrix porosity, whereas the large (intra-particle) porosity does not change significantly. However, in geological time scale, the majority of the porosity loss with depth at Kerguelen Plateau was found to be due to the time dependent creep which is a very slow process. Porosity reduction due to the depletion of pore fluid pressure in hydrocarbon reservoir is a fast process. Porosity reduces mainly due to the increase of effective stress in this case. Therefore, results from compaction test should be used to predict compaction in a hydrocarbon reservoir.
2.2.3 Use of sonic velocity for monitoring porosity change
Figure 2.4: Relationship between porosity and compressional wave velocity (Vp) as measured in brine saturated North Sea chalk and a few other sedimentary rocks.
Porosity is considered to be the major controlling factor of the velocity of elastic waves in rocks (Figure 2.4). However, the velocity-porosity relationship is made complicated by the geometric distribution of pores and cements (Prasad, 2003). Based on data from ODP Leg 130, site 807, Fabricius (2003) showed that the porosity-velocity trend changes during the diagenetic process depending on the changes in pore space, grain surface and contact cement between the grains. The study on Kerguelen chalk (Paper I) confirms the finding of Fabricius (2003).
1
2
3
4
5
6
0 0.1 0.2 0.3 0.4 0.5 0.6
Porosity
Vp
-sa
t (k
m/s
)
Chalk (Røgen et al., 2005)Chalk (Olsen et al., 2008)Limestone (Prasad, 2003)Sandstone (Prasad, 2003)Sandstone (Han et al., 1986)Ocean bottom sediment(Prasad and Dvorkin, 2001)

11
Compressional wave velocity remains almost constant until the ooze starts to transform into chalk. Velocity increases with depth in the chalk interval indicating the growth of grain contact cement. Limestone develops as a result of pore filling cementation. Decrease in porosity and increase of velocity over a short depth interval occurs at the transition between chalk and limestone. Therefore, it may be possible to separate chemical effects from mechanical effects on porosity reduction during CO2-EOR from velocity porosity trends.
2.3 Effective stress Effective stress defines the actual stress the sediment undergoes in a subsurface condition. Stresses arise from the weight of the overlying sediments, σov which works downwards due to gravity. On the other hand, in a simple subsurface condition hydrostatic pressure Pp develops in the fluid inside the pore space due to the weight of the fluid. Pore fluid can also be overpressured if it fails to escape when overburden stress increases during the diagenetic process, e.g. due to the presence of a low permeable overlying sediments (seal), as in most hydrocarbon reservoirs. Effective stress in a reservoir is determined by a combination of these two stresses. In the simplest formulation effective stress can be defined as the
difference between the overburden stress, ov and pore pressure, Pp (Terzaghi,
1923). Biot (1941) gave a robust definition of an effective stress by introducing
effective stress coefficient (Biot’s coefficient), :
poveff P Eq. 2.2
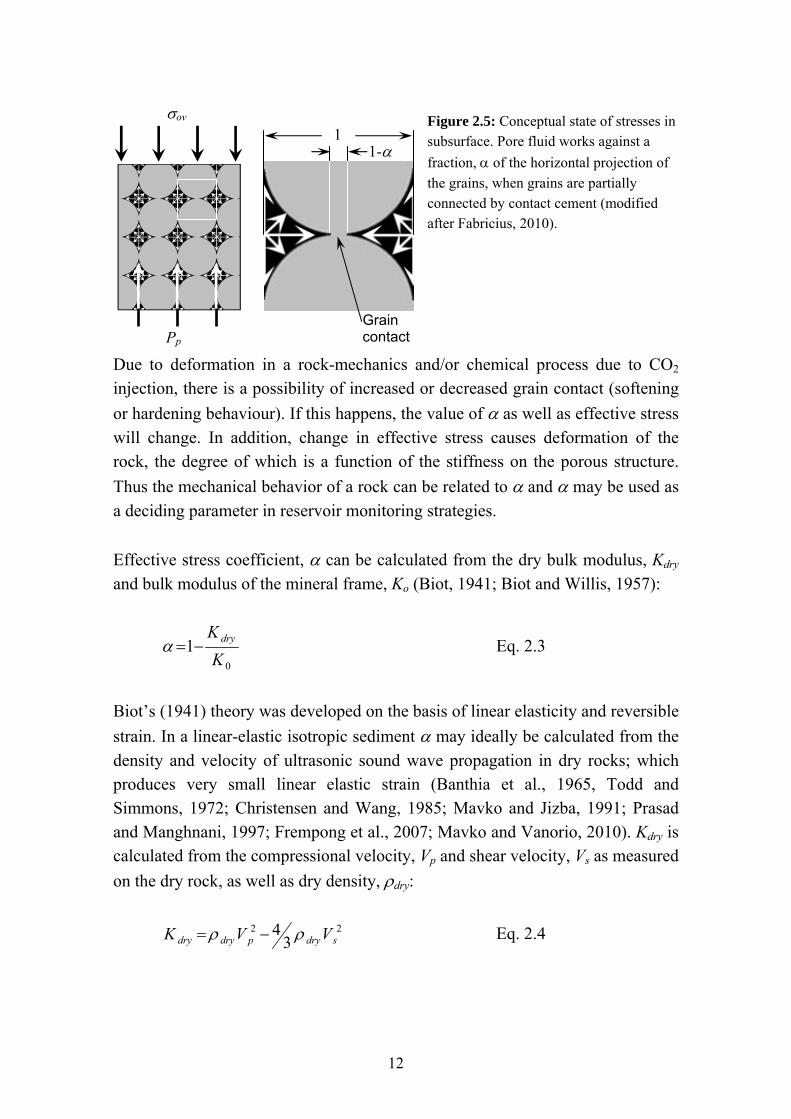
2.3.1 Effective stress coefficient (Biot’s coefficient) From a rock mechanics view, pressure in the wetting phase works on the internal surface of the rock. The more the horizontal projection of surface of grains are in contact with the wetting fluid, the more resistance the fluid can offer against the overburden stress. A reduction of the pore pressure effect on the effective stress is caused by an increase in surface contact between the rock grains (Figure 2.5).
Biot (1941) characterized this reduction by a effective stress coefficient, .
Terzaghi (1923) studied loose granular sediments, where the contact area among
the grain surfaces is negligible and consequently is close to unity. Therefore
the differential overburden stress (ov – Pp) is equal to the effective stress for
these sediments. However, most rocks are cemented to some extent and therefore
have more stable grain to grain contacts. It makes less than unity.
12
ov
Pp
1- 1
Grain contact
Figure 2.5: Conceptual state of stresses in subsurface. Pore fluid works against a
fraction, of the horizontal projection of
the grains, when grains are partially connected by contact cement (modified after Fabricius, 2010).
Due to deformation in a rock-mechanics and/or chemical process due to CO2 injection, there is a possibility of increased or decreased grain contact (softening
or hardening behaviour). If this happens, the value of as well as effective stress
will change. In addition, change in effective stress causes deformation of the rock, the degree of which is a function of the stiffness on the porous structure.
Thus the mechanical behavior of a rock can be related to and may be used as
a deciding parameter in reservoir monitoring strategies.
Effective stress coefficient, can be calculated from the dry bulk modulus, Kdry
and bulk modulus of the mineral frame, Ko (Biot, 1941; Biot and Willis, 1957):
0
1K
K dry Eq. 2.3
Biot’s (1941) theory was developed on the basis of linear elasticity and reversible
strain. In a linear-elastic isotropic sediment may ideally be calculated from the
density and velocity of ultrasonic sound wave propagation in dry rocks; which produces very small linear elastic strain (Banthia et al., 1965, Todd and Simmons, 1972; Christensen and Wang, 1985; Mavko and Jizba, 1991; Prasad and Manghnani, 1997; Frempong et al., 2007; Mavko and Vanorio, 2010). Kdry is calculated from the compressional velocity, Vp and shear velocity, Vs as measured
on the dry rock, as well as dry density, dry:
22
34
sdrypdrydry VVK Eq. 2.4

13
Figure 2.6: (a) Thoritical bound for (a) dry bulk moduls and (b) Biot’s coefficient. Calcite
(bulk modulus K=75 GPa; Mavko et al., (1998)) and air (bulk modulus K= 14.210-6 GPa)
mixed in a rock by assuming a part (IF) of the solid to be in the solid frame and the remaining solid to be in suspension. Voigt (1910) defines the stiffest mixing. Critical porosity is considered as 0.7 (Fabricius, 2003) for the plot. If critical porosity is 1, the IF=1 line coincide with the modified upper Hashin-Shtrikman bound (Hashin and Shtrikman, 1963; Mavko et al., 2009), and IF=0 is equal to the Reuss (1929) bound. (b) Theoretical bounds for effective stress coefficient for the system described in (a). Degree of cementation is indicated by the isoframe curves (IF) (Fabricius, 2003).
2.3.2 Bounds for Biot’s coefficient for chalk The amount of resistance a pore fluid can offer against the overburden stress in a cemented rock frame can be quantified by an effective medium model called isoframe modelling (Fabricius, 2003). By isoframe modelling the solid content of the rock is separate into a suspended portion and a skeleton of cemented grains. The suspended solid portion has no ability to bear load and is treated like a fluid.
For porosities lower than critical porosity, c the mineral grains start to bear
mechanical load (Mavko et al., 1998). If a rock with 100% porosity can still bear a mechanical load, its critical porosity will be 100%. Critical porosity is rarely 100% (Nur et al., 1998) and for North Sea 70% is a reasonable assumption (Alam, 2007). Isoframe modeling allows the determination of theoretical modulus of a rock, using a modified upper Hashin-Strikman bound (Hashin and Shtrikman, 1963) for mixing of a solid frame and a suspension. If compressional wave velocity and bulk density is known, by changing the isoframe value (IF) the theoretical compressional modulus is set equal to the actual compressional modulus. The higher the IF value the higher the grain contact cement and likewise the load bearing capacity of the grains. When large amounts of the
Voigt
Reuss
bound
Shtrikrnan
Hashin-
Upper
0
10
20
30
40
50
60
70
80
0 0.2 0.4 0.6 0.8 1Porosity
Dry
bu
lk m
od
ulu
s (G
Pa
).
(a)
Voigt
bound
Upp
er
Shtrikrnan
Hashin
-
00.10.20.30.40.50.60.70.80.9
1
0 0.2 0.4 0.6 0.8 1Porosity
Bio
t's c
oe
ffic
ien
t
(b)

14
surface area of the grains are in contact, pore fluids get less surface to react against the overburden stress. It makes the effective stress coefficient lower.
The variation of can be illustrated by means of isoframe model (Figure 2.6)
(Fabricius, 2003). For chalk of constant porosity, decreases as the cementation
increases (Olsen et al., 2008a). For poorly cemented chalks (low isoframe value),
does not change significantly with porosity and remains close to unity, whereas
for strongly cemented rocks, decreases rapidly with decreasing porosity
(Figure 2.6). Any chemical interaction of chalk with supercritical CO2 will
change the degree of cementation and will move from one IF curve to another
(Figure 2.6). On the other hand if supercritical CO2 reacts only with the particle
surface and increase the porosity will move along the same IF curve as long as
the degree of cementation remains unchanged.
2.4 Static and dynamic effective stress coefficient Reservoir compaction is monitored by 4D seismic utilizing changes in sonic velocity and changing thickness of reservoir layers. Changing thickness in reservoir (static) is due to both elastic and plastic deformations. In contrast, sound wave propagation (dynamic) characterizes purely elastic behaviour. So the question arises, how accurately deformations in reservoirs due to changes in pore pressure can be predicted by using the dynamic effective stress coefficient (Biot’s coefficient). Therefore, a study was made to investigate the relationship between static and dynamic effective stress coefficient (Paper III)
2.4.1 Background study of static and dynamic behaviour Elastic moduli can be obtained from acoustic measurements often called dynamic moduli and from rock mechanics loading experiments often called static moduli. Numerous studies of elastic rock properties as Young’s modulus, Poisson’s ratio, bulk modulus and shear modulus, show significant difference between static and dynamic elastic properties (Simmons and Brace, 1965; King, 1969; Cheng and Johnston, 1981; Montmayeur and Graves, 1985; Jizba and Nur, 1990; Tutuncu and Sharma, 1992; Tutuncu et al., 1994; Plona and Cook, 1995; Yale et al., 1995; Wang, 2000; Olsen et al., 2008b; Fjær, 2009). Most authors point to micro-cracks as a major cause of the discrepancy. Other inferred causes include strain amplitude (Simmons and Brace, 1965; Cheng and Johnston, 1981; Plona and Cook, 1995), frequency (Simmons and Brace, 1965; Tutuncu and Sharma, 1992),

15
viscoelasticity (Tutuncu and Sharma, 1992), inelasticity (Cheng and Johnston, 1981; Jizba and Nur, 1990) and stress path (Montmayeur and Graves, 1985; Yale et al., 1995; Fjær, 2009). Polna and Cook (1995) suggested that crack formation at grain contacts during mechanical loading could significantly deviate the static Young’s modulus from the dynamic Young’s modulus. Olsen et al. (2008b) suggested that the difference in drainage condition between a static and a dynamic experiment is a major source of difference between measured static and dynamic properties. They pointed out that the correct way of comparing dynamic and static Young’s modulus for saturated samples is to compare dynamic Young’s modulus to the undrained static Young’s modulus.
2.4.2 Stress dependent behavior of Biot’s coefficient Theoretically the effective stress coefficient is well studied (e.g. Geertsma, 1957; Nur and Byerlee, 1971; Todd and Simmons, 1972; Carroll and Katsube, 1983; Mavko and Jizba, 1991; Berryman, 1992; Dvorkin and Nur, 1993; Gurevich, 2004; Ciz et al., 2008). The pressure dependent dynamic effective stress
coefficient is measured by several authors (e. g. Banthia et al., 1965; Todd and
Simmons, 1972; Christensen and Wang, 1985; Mavko and Jizba, 1991, Hornby 1996, Prasad and Manghnani, 1997; Frempong et al., 2007; Mavko and Vanorio 2010). In addition Geertsma (1957), Nur and Byerlee (1971), Frempong et al. (2007), Omdal et al. (2009) design an experimental setup and conducted mechanical tests to measure the effective stress coefficient. Although, most studies are made on sandstones, Banthia et al. (1965) studied Austin chalk and Omdal et al., (2009) studied chalk from the Stevns outcrop, Denmark. Based on laboratory measurements of stress dependent sonic velocity, several
authors have noted that is a function of stress (e.g. Banthia et al., 1965; Todd
and Simmons, 1972; Christensen and Wang, 1985; Engstrøm, 1992; Frempong et
al., 2007) although in the ideal case should be constant. Failure to satisfy the
assumptions of Biot’s (1941) theory, such as, drainage condition, linear elasticity
and reversibility could be reasons for non-constant . Several authors have found
that may be different for different physical properties. Teufel and Warpinski
(1990) found different effective stress coefficient for velocity and for permeability. Berryman (1992) derived a set of effective stress coefficients for different physical properties of rocks, such as porosity, permeability, electrical conductivity, pore volume compressibility and bulk compressibility. However, the effective stress that is relevant for compaction and subsidence is the effective

16
stress coefficient for strain. This static effective stress coefficient n ideally should be determined from rock mechanics tests designed on the basis of the theoretical definition of Biot (1941). For the 20% porous Austin chalk, Banthia et al. (1965) find that the dynamic effective stress coefficient varies from 0.70 to 0.60 in the differential stress range from 3.5 MPa to 14 MPa. Omdal et al. (2009) defined two different static effective stress coefficients from hydrostatic loading tests; the elastic and the plastic. For the >40% porosity water saturated Stevns chalk, they found that the elastic static effective stress coefficient varies from 0.60 to 0.80 in the differential stress range between 0 MPa and 30 MPa. The plastic effective stress coefficient for the same calk ranges between 0.75 and 0.60 in the same stress range. The most important aspect of their finding is the opposite trend of elastic and plastic effective stress coefficient. While the elastic effective stress coefficient increases with increasing effective stress the plastic effective stress coefficient decreases (Omdal et al., 2009).
Figure 2.7: Dynamic
effective stress coefficient
calculated from velocity data measured in dry chalk core plugs from Valhall field. Porosity of the samples varies between 10% and 40% as
indicated by colours. shows
dependency on the confining stress. For the same porosity,
decreases with increasing
stress. Variation of with
stress is higher in the high porosity samples .The rate of
decrease of decrease for
differential hydrostatic stress above 20 MPa.
A large dataset from the Valhall field (Paper III), North Sea also show a significant variation in dynamic effective stress coefficient in a broad stress interval (Figure 2.7).
0 5 10 15 20 25 30 35Hydrostatic stress (MPa)
40
10
0.5
0.6
0.7
0.8
0.9
1
0 5 10 15 20Eq. axial differential stress (MPa)
40
10

17
2.4.3 Static effective stress coefficient Studies on Biot’s coefficient suggest that the stress dependence of the static effective stress coefficient, n must be established in order to use 4D seismic data for monitoring reservoir compaction and changes in pore pressure. In addition, an
investigation on how this stress dependent n is related to would allow
estimation of n from sonic velocity data (wireline logging). If it is possible to
establish the relationship between and n, the prediction of pore pressure will
become easier and more accurate. In a related study (Paper III) n was measured
from mechanical loading tests and compared with measured from elastic wave
velocities. During mechanical loading n is determined based on Biot’s (1941) general theory of three-dimensional consolidation. A relation was derived from Biot’s (1941) equations in order to measure n under uniaxial stress conditions (Paper III) as:
p
d
Pd
a
p
a
e
P
e
n
1 Eq. 2.5
where ea is the axial strain in a one dimensional deformation, Pp is the pore
pressure and d is the differential stress.
Laboratory (static) measurements of n indicate that n may change more than 10% for a probably insignificant porosity change of 0.5% (Figure 2.8) (Alam et al., 2009). Their test results show that n increases significantly during an unloading cycle and increases during the loading cycle.
2.4.4 Relationship between dynamic and static effective stress coefficient Details of the study on dynamic and static effective stress coefficient are
presented in Paper III. Mechanical measurement of indicate that predicts the
effective stress coefficient, n, well for chalk with porosity near 30%, and acceptably for chalk with porosity near 40%. However, for rapid change in stress it may be more relevant to use the effective stress coefficient, n, derived from
mechanical tests rather than .

18
2.5 Fluid effect on stiffness The stiffness of a sedimentary rock can be influenced by the pore fluid. Andreassen and Fabricius (2010) showed that failure in rocks occurs at lower stresses if it is saturated with fluid having lower kinematic viscosity. The fluid effect on the stiffness of rocks can be characterized by Biot’s (1956a, b) critical frequency:
kf
flc
2
Eq. 2.6
which is calculated from porosity, , liquid permeability, k, fluid density, fl and
viscosity, . The higher the critical frequency the stiffer is the rock (Andreassen
and Fabricius, 2010). The effect is more prominent in low permeability rocks as chalk, as fluid flow is highly controlled by the specific surface due to smaller effective pore radius (Fabricius et al., 2010).
Figure 2.8: Critical frequency (Eq. 2.6) as an indicator of stiffness. Symbols indicate that the rock is saturated with air (dry) (triangles), oil (squares with cross), brine (diamonds) and 30 percent (volume) CO2 dissolved in oil (circles). Grey data points are Ekofisk Formation samples (permeability <0.5 mD) and black data points are Tor Formation samples (permeability >1 mD). Fluid properties and sample description is given in Paper IV.
Figure 2.8 shows that chalk becomes less stiff at fluid saturated condition compared to dry condition. Due to lower permeability, Ekofisk Formation samples show less fluid effect compared to Tor Formation samples. Samples saturated with live oil with 30% dissolved CO2 show least stiffness at reservoir condition among the fluid (brine and live oil) saturated samples due to lower
kinematic viscosity (/fl). This suggests that possible decrease in stiffness in
chalk due to CO2 injection may not only be due to chemical interaction but also due to fluid effects resulting from altered viscosity and density.
1
10
100
1000
10000
0.15 0.25 0.35 0.45
Porosity
Cri
tical
fre
quen
cy (
MH
z).
Stiff
Soft
Air
Oil
Brine
CO2+oil

19
3 Chalk surface and fluid flow Due to a smaller particle size (nanometre to a few micrometer), specific surface (surface per volume) of chalk is high (typically 1 m2/g to 10 m2/g). As a result, despite high porosity as described in chapter 2, matrix permeability of North Sea chalk is low (a fraction of mD to a few mD). For porosity over 20%, permeability of chalk may be several orders of magnitude lower than that in sandstones (Figure 3.1). The porosity-permeability relationship in North Sea chalk is highly influenced by the non-carbonate fraction (clay and silica) that sometimes determines the specific surface area of chalk (Røgen and Fabricius, 2002). Despite having similar porosity, permeability of North Sea chalk varies up to two orders of magnitude (Figure 3.1). Chalk with high carbonate content (pure chalk) and a porosity above 20% has around 1 mD (10-15 m2) permeability. In contrast, permeability of chalk having same porosity but having more than 10% non-carbonate fraction is typically 0.01 mD (10-13 m2).
Figure 3.1: Porosity-permeability trends for chalk published in literature. Dark closed and dark open data points are chalk from Tor Formation and Ekofisk Formation of North Sea respectively. Grey closed points represent North Sea chalk, from unknown formations. Limestone and sandstone (samples of Prasad, 2003) are indicated respectively by grey and black dashes with a circle in the middle. Trends for North Sea chalk can be primarily divided into two segments. Sandstone and limestone as studied by Prasad (2003) have significantly higher permeability for a given porosity than North Sea Chalk.
A high specific surface of particles means that the solid has large exposure to the fluid. Alteration in the pore fluids due to CO2 injection may cause dissolution of the solid phase and/or precipitation of solids, so that the reservoir rock may change with respect to porosity, pore-geometry, permeability, wettability,
0.01
0.1
1
10
100
1000
0 0.1 0.2 0.3 0.4 0.5 0.6Porosity
Per
mea
bilit
y (m
D)
Sandstone (Prasad, 2003)Limestone (Prasad, 2003)Pure chalk (Scholle, 1977)Coarser chalk (Scholle, 1977)Valhall Field (Munns et al., 1985)Tor Field (Munns et al., 1985)Gorm Field, Cretaceous (Mortensen et al., 1998)Gorm Field, Paleocene (Mortensen et al., 1998)Outcrop, Cretaceous (Frykman, 2001)Outcrop, Top Cretaceous (Frykman, 2001)Valhall Field, Cretaceous (Frykman, 2001)Dan Field, Cretaceous (Frykman, 2001)South Arne Field, Cretaceous (Røgen et al., 2005)Dan Field, Cretaceous (Røgen et al., 2005)South Arne Field, Paleocene (Fabricius et al., 2007)Shale volume 0%-3% (Bramwell et al., 1999)Shale volume 3%-50% (Bramwell et al., 1999)

20
stiffness and compaction behaviour (Plummer and Busenberg, 1982; Wolcott et al., 1989; Wellman et al., 2003; Hawkes et al., 2005; Madland et al., 2006; Xu et al., 2007; Zuta and Fjelde, 2008). These changes may influence the overall productivity from the reservoir and the stability of the reservoir rock, sealing rock and wellbore. A manuscript has been prepared on the studies on permeability and fluid flow (Paper II). Influence of surface charge on calcite surface in aqueous environment is published in conference proceedings as extended abstracts (Paper V; Paper VI).
3.1 Fluid flow in chalk Due to the unique pore structure of chalk, models of fluid flow in other rocks, as sandstone, may be inappropriate to define fluid flow in chalk. Tortuosity is extensively described in literature to model fluid flow in porous media. Mortensen et al. (1998) found that air permeability in chalk is independent of the type of porosity (e.g. intra-particle, inter-particle) and they suggested a porosity-permeability relationship avoiding the tortuosity.
3.1.1 Conventional concept of flow in porous media It is widely defined in literature that fluid flow in porous media occurs in a tortuous path (Kozeny, 1927; Carman, 1937; Amaefule et al., 1993), where the length of actual equivalent channel for fluid flow is longer than the physical length of a porous medium (Figure 3.2a). On the more simple assumption that a granular bed is analogous to a group of capillaries parallel to the direction of flow, Darcy (1856) developed a fluid flow equation through porous media:
l
PAkQ
Eq. 3.1
where k is permeability, P is the pressure difference over length, l, with cross
sectional area A. is the dynamic viscosity of the flowing fluid. Darcy’s
equation is based on Poiseuille’s law for the flow of a viscous fluid through a capillary tube:

21
l
PdQ e
128
4
Eq. 3.2
where, de is the equivalent diameter of the capillary tube.
Figure 3.2: Conceptual flow through a porous rock. All porosity shown in grey shade. (a) Flow in a tortuous path. Actual equivalent flow length (le) is longer than the net travelled distance, due to the curved flow path. (b) Concept of flow path in pore space with high connectivity (adapted form the concept of Mortensen et al., 1998). Branches with dark grey shade are aligned in the direction of flow.
3.1.2 Effective Specific Surface concept of fluid flow in chalk Based on laminar flow of fluid in porous media, Kozeny (1927) derived:
2
3
Sck
Eq. 3.3
23
2 1
1
gS
ck Eq. 3.4
where k is liquid permeability (Klinkenberg, 1941), is porosity and c is
Kozeny’s constant. Kozeny (1927) found that the value of c is around 0.25. S and Sg are grain surface per unit bulk volume and grain surface per volume of grains, respectively.

22
For homogeneous, fine-grained sediments like chalk, pores are likely to have high connectivity, so the concept of a torturous flow path is difficult to perceive. In such rocks, in addition to the capillaries parallel to the direction of flow (as defined by Darcy, 1856), there should be capillaries in the directions perpendicular to the flow (Figure 3.2b). Even though the resultant flow occurs only in one direction, fluid flows in all capillaries. Major loss of pressure (according to Poiseuille’s law) occurs in the direction of resultant flow. In the direction normal to the direction of pressure drop, fluid flow may be seen as practically instantaneous pressure transfer (Røgen and Fabricius, 2002). This perception could be compared with the process of climbing a hill, where work required for the movement parallel to the horizon is negligible compared to the work required for vertical movement. Mortensen et al. (1998) used this concept by projecting the pore space into the form of orthogonal interpenetrating tubes. Rocks with high connectivity in pore space could be imagined as a system of such tubes (Figure 3.2a). A part of the porosity in such a system is thus insignificant in the resultant flow due to shielding by solid. Mortensen et al. (1998) quantified the porosity that is active to the flow in a given direction where Poiseuille’s law is valid by introducing a
porosity dependent c() (to distinguish from Kozeny’s constant c in Eq. 3.3):
1
43
412arccos
3
1cos4)(
c Eq. 3.5
Theoretically value of c is 0.5 when all the pores are aligned as parallel tubes in the direction of flow and is 0 when aligned as perpendicular tubes to the flow.
This porosity dependent c() replaces the term c of Kozeny’s equation (Eq. 3.3).
c() increases with increasing porosity as visualized by the volume of
perpendicular interpenetrating tubes in Figure 3.2b. The point is that this volume
increases as porosity increases. Decreasing c() results in higher shielding effect
and will have the same effect in the equation as a conceptual tortuous path with higher actual equivalent travel length (le). The advantage of using the concept of
c() is that it can be predicted directly from , and does not affect the specific
surface term. With porosity dependent c, Kozeny’s equation becomes:

23
2
3
Sck
Eq. 3.6
Specific surface with respect to the bulk, S and specific surface with respect to
pore, S is calculated as (Borre and Fabricius, 1998):
gSS 1 Eq. 3.7
S
S Eq. 3.8
Therefore:
2
3
2 1
1
effgS
ck Eq. 3.9
where Sg-eff is the effective specific surface, which in chalk is similar to or only slightly lower than Sg measured by BET (Mortensen et al., 1998). A high homogeneity at particle scale is probably the reason why chalk permeability in this way may be predicted directly from Kozeny’s equation without fitting factors. Sg-eff can be calculated from rearranging Eq. 3.9 by using core permeability and porosity measured in the laboratory:
kcS effg
1
1
Eq. 3.10
Sg-eff does not depend on the porosity as it is not a property of the bulk rock but a property of the particles that make up the rock. For homogeneous rocks the variation of effective porosity for flow, due to varying porosity is determined by
c(), so for a given porosity, permeability variation can be resolved by the
difference of specific surface alone.
3.2 Permeability prediction In order to monitor fluid flow in a CO2 injected reservoir time lapse permeability measurement is also required. Permeability is preferably measured in the laboratory on core plugs. However, it is unrealistic to collect core material from a

24
CO2 injected reservoir. Therefore, prediction of permeability is required from other physical properties of rocks, e.g. porosity, seismic velocity and attenuation. Permeability is classically described as a logarithmic function of porosity. Several authors reported variation in the porosity-permeability relationship, which largely depends on sediment composition and diagenesis (Amaefule et al., 1993; Mortensen et al., 1998; Prasad, 2003; Fabricius et al., 2007a). In order to account for differences in sediment composition Kozeny (1927) described permeability as a function of porosity and specific surface as a physical measure of pore radius. Biot (1956a; 1956b) showed theoretically that velocity of elastic waves in rocks depends on both porosity and pore radius as derived from permeability. The findings of Kozeny and Biot indicate that permeability should be related to sonic velocity. Velocity of elastic waves is the primary data available for acquiring information about subsurface characteristics as lithology and porosity. Cheap and quick (spatial coverage; ease of measurement) information of permeability can be achieved, if sonic velocity is utilized for permeability prediction. Unfortunately velocity-permeability relationships have received less attention compared to velocity-porosity relationships (Wyllie et al., 1956; Raymer et al., 1980; Nur et al., 1998; Prasad and Dvorkin, 2001; Røgen et al., 2005). Prasad (2003) showed that velocity-permeability relationships exist in various rocks according to hydraulic reservoir units as defined by the Flow Zone Indicator (FZI), and that FZI may be used in Biot’s theory. The concept of FZI unit is based on modifying Kozeny’s (1927) equation so as to improve the porosity-permeability relationships in sandstones (Amaefule et al., 1993). Also based on Kozeny’s (1927) equation, Fabricius et al. (2007a) used Vp/Vs ratio and porosity to estimate permeability in carbonate rocks. Therefore an investigation was made on the use of velocity data to predict permeability (Paper II). Two methods were applied for permeability prediction from sonic velocities. Relationships between permeability and porosity from core data were first examined by using Kozeny’s equation. The data were analyzed for any correlations with specific surface of the grains, Sg and with the hydraulic property defined as Flow Zone Indicator (FZI). These two methods use two different approaches to enhance permeability prediction from Kozeny’s equation. The FZI is based on a concept of a tortuous flow path in a granular bed. The specific surface of grains, Sg concept considers the pore space which is exposed to fluid

25
flow, and models permeability as resulting from effective flow parallel to pressure drop. The porosity-permeability relationships were replaced by relationships between velocity of elastic waves and permeability by using laboratory data, and the relationships were then applied to well log data. 3.2.1 Flow Zone Indicator (FZI) FZI describes geometrical distributions of pores and grains, Prasad (2003) used this approach to describe the variations in velocity–porosity relations. The geometrical control of pore volume distribution was found to also describe velocity variations with permeability (Prasad, 2003). FZI concept was originated from Carman’s (1937) definition of Kozeny’s equation;
2
3
22 1
1
gs SFk Eq. 3.11
where Fs is a dimensionless shape factor and is tortuosity defined as the ratio
between a conceptual actual flow length, la and sample length, l ( = la/l) (Figure
3.2a). It can be seen that, 1/Fs2 replaces Kozeny’s constant. It varies with the
internal structure of the sediments and thus with specific surface, but may be assumed as fairly constant within the same hydraulic unit (Amaefule et al., 1993). Rearranging Eq. 3.11, Amaefule et al. (1993) addressed the variability of Kozeny’s constant as follows:
gs SF
k
1
1 Eq. 3.12
FZIRQI Eq. 3.13
FZIRQI loglog log Eq. 3.14
where RQI is called Reservoir Quality Index, ε is the void ratio and FZI is described as Flow Zone Indicator:
k
SF gs
11 FZI Eq. 3.15

26
If permeability and FZI are expressed in mD and μm respectively:
k0314.0
FZI Eq. 3.16
3.2.2 Specific Surface of the Grains, Sg Surface area of minerals is widely estimated by the nitrogen adsorption technique introduced by Brunauer, Emmett and Teller (Brunauer et al., 1938). In this method surface area, SBET per unit weight is estimated by allowing nitrogen gas to
adsorb on the surface of the rock. Knowing the grain density, g of the minerals,
specific surface of the grains, Sg is calculated:
gBETg SS Eq. 3.17
3.2.3 Use of sonic velocity for permeability monitoring It was found that, permeability prediction in chalk, and possibly other sediments with large surface areas could be improved significantly by using effective specific surface of the fluid flow concept (Paper II). Separation into FZI unit is appropriate for high permeable sedimentary rocks as sandstones and limestones that have small surface areas. For low permeability (<10 mD) sedimentary rocks as North Sea chalk, permeability variation for the same porosity rock could be described well by separating into units of specific surface, Sg or into Flow Zones Indicator, FZI. Grouping samples according to Sg units and FZI units improves the permeability prediction from compressional velocity. Sg unit or FZI unit splitting according to lithology enables us to predict permeability within less than a single order of magnitude, while the general porosity-permeability relationship varies up to three orders of magnitude in chalk. If specific surface of a particular chalk unit is known, the velocity-permeability relationship for that unit can be applied to predict permeability directly from the compressional wave velocity. Sg unit splitting could be applied effectively to predict permeability of low permeable chalk. Separation into FZI unit may give better results for high permeability (>1 mD) sedimentary rocks.

27
3.3 Surface charge in chalk Studies on surface chemistry of chalk demonstrated that Ca2+ ions on the calcite surface could be exchanged by other ions, e.g. Mg2+ (Zhang et al., 2005; Madland et al., 2006; Ahsan and Fabricius, 2010). Several authors described changes in surface charges of chalk particle due to the change in fluid property (as due to supercritical CO2 injection) as a reason for water weakening (Pierre et al., 1990; Risnes et al., 2005; Strand et al., 2006; Korsnes et al., 2008). An investigation was made on the source of surface charge, its characteristics and influence on petrophysical properties (Paper V; Paper VI).
3.3.1 Surface charge of clay in chalk The sheet like structure of clay consists of two to three layers of aluminium octahedral or silica tetrahedral lattices. An excess of negative charge may build inside clay due to the replacement of Al3+ ion by Mg2+ ions. In order to balance this negative charge a positive ion adheres on the surface of clay. In presence of water, silicate layers in clay become negatively charged and positive current-conducting ions adsorbs to the clay surface, which is known as cation exchange capacity (CEC) (Wyllie, 1960).
3.3.2 Surface charge of calcite in chalk The surfaces of calcite in chalk are primarily rhombohedral crystal surfaces. In the calcite atomic structure, calcium atoms are octahedrally coordinated by oxygen from six different CO3 groups. Net charge on the unreacted crystal surfaces is zero. In presence of water, electrical charges form in the interface between the calcite surface and water. Several authors reported that in a pure aqueous suspension of calcite, the potential determining ions (PDIs) on the surface are Ca2+ and HCO3
- (e.g. Yarar and Kitchener, 1970; Thompson et al., 1989).
3.3.3 Cation exchange capacity and excess conductivity Archie’s (1942) equation is widely used to predict brine (and hydrocarbon) saturation by knowing resistivity of the hydrocarbon bearing rock, Rt and pore water resistivity, Rw:
t
wnw R
RFS Eq. 3.18
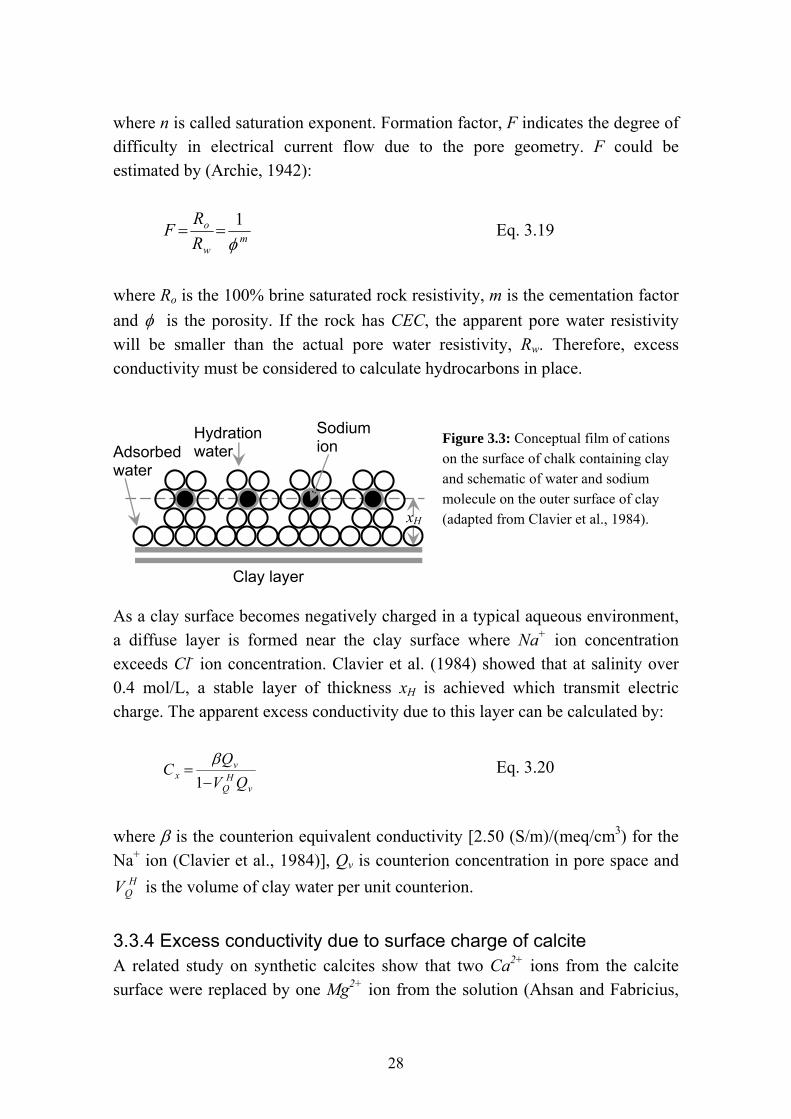
28
where n is called saturation exponent. Formation factor, F indicates the degree of difficulty in electrical current flow due to the pore geometry. F could be estimated by (Archie, 1942):
mw
o
R
RF
1
Eq. 3.19
where Ro is the 100% brine saturated rock resistivity, m is the cementation factor
and is the porosity. If the rock has CEC, the apparent pore water resistivity
will be smaller than the actual pore water resistivity, Rw. Therefore, excess conductivity must be considered to calculate hydrocarbons in place.
Figure 3.3: Conceptual film of cations on the surface of chalk containing clay and schematic of water and sodium molecule on the outer surface of clay (adapted from Clavier et al., 1984).
As a clay surface becomes negatively charged in a typical aqueous environment, a diffuse layer is formed near the clay surface where Na+ ion concentration exceeds Cl- ion concentration. Clavier et al. (1984) showed that at salinity over 0.4 mol/L, a stable layer of thickness xH is achieved which transmit electric charge. The apparent excess conductivity due to this layer can be calculated by:
vH
Q
vx
QV
QC
1
Eq. 3.20
where is the counterion equivalent conductivity [2.50 (S/m)/(meq/cm3) for the
Na+ ion (Clavier et al., 1984)], Qv is counterion concentration in pore space and H
QV is the volume of clay water per unit counterion.
3.3.4 Excess conductivity due to surface charge of calcite A related study on synthetic calcites show that two Ca2+ ions from the calcite surface were replaced by one Mg2+ ion from the solution (Ahsan and Fabricius,
xH
Adsorbed water
Hydration water
Sodium ion
Clay layer

29
2010). CEC of synthetic calcite was measured to be between 13 μEq/m2 and 16 μEq/m2. Calculated CEC of Ekofisk Formation chalk varies between 3 μEq/m2 and 6 μEq/m2 and CEC of Tor Formation is approximately 2.5 μEq/m2 (Paper V). Therefore, CEC of calcite has a possibility to take part in the excess conductivity in chalk. Excess conductivity may be calculated from CEC of the total particles in chalk (CECrock) and specific surface for bulk volume, S, by rearranging the formula of Clavier et al. (1984):
H
grockx xS
SSACECC
)1(
Eq. 3.21
where g is the grain density and is porosity. SSA is the specific surface area
measured by BET method. CECrock, for the North Sea chalk may be expressed as:
11SSA
SSAIRCEC
SSA
SSAIRCECCEC ir
calciteir
irrock Eq. 3.22
where CECir and CECcalcite are the CEC of non-carbonates and the calcite part of the chalk respectively. IR is the fraction of irreducible residue by weight (IR=1-CaCO3 fraction).
3.3.5 Influence of calcite surface on excess conductivity
Figure 3.4: Excess conductivity as a function of (a) non-calcite specific surface, (b) calcite specific surface and (c) total specific surface, each with respect to the total porosity. Filled data point indicates less than 5% non-carbonate fraction and unfilled data points indicate more than 15% non-carbonate.
0
0.2
0.4
0.6
0.8
1
1.2
1.4
0 100 200 300
Total sp. surface of pore (m-1)
0
0.2
0.4
0.6
0.8
1
1.2
1.4
0 20 40 60
Calcite sp. surface (m-1)
0
0.2
0.4
0.6
0.8
1
1.2
1.4
0 100 200 300
Non-calcite sp. surface (m-1)
Cx (
S/m
)
(a) (b) (c)

30
Although it is widely described in literature that excess conductivity is only due to the CEC of clay, it was observed that calcite dominates in determining excess conductivity in chalk. Plots of excess conductivity versus non-calcite specific surface and versus total specific surface show no significant relationship (Figure 3.4a, 3.4c). Excess conductivity rather increases with the increase of calcite specific surface in the total pore space (Figure 3.4b). However, if the chalk contains high amount of smectite clay (as in the highly deviated sample) excess conductivity could be significantly higher than the excess conductivity due to calcite (Figure 3.4b).
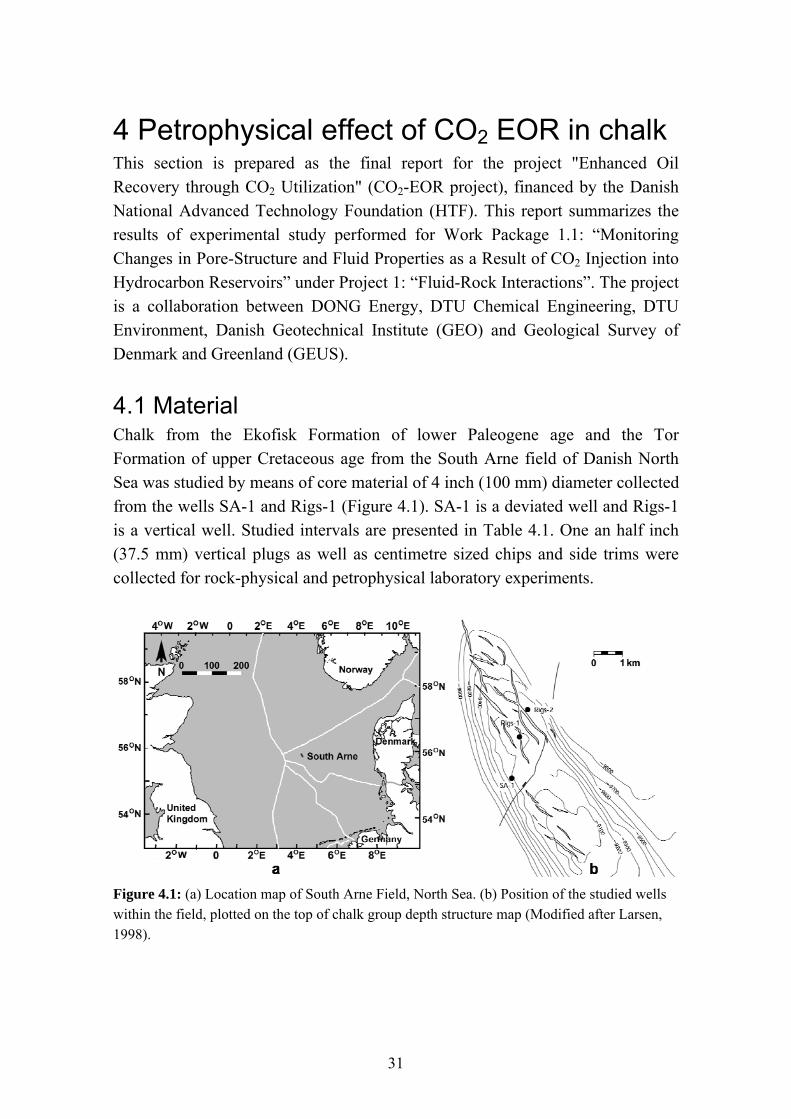
31
4 Petrophysical effect of CO2 EOR in chalk This section is prepared as the final report for the project "Enhanced Oil Recovery through CO2 Utilization" (CO2-EOR project), financed by the Danish National Advanced Technology Foundation (HTF). This report summarizes the results of experimental study performed for Work Package 1.1: “Monitoring Changes in Pore-Structure and Fluid Properties as a Result of CO2 Injection into Hydrocarbon Reservoirs” under Project 1: “Fluid-Rock Interactions”. The project is a collaboration between DONG Energy, DTU Chemical Engineering, DTU Environment, Danish Geotechnical Institute (GEO) and Geological Survey of Denmark and Greenland (GEUS).
4.1 Material Chalk from the Ekofisk Formation of lower Paleogene age and the Tor Formation of upper Cretaceous age from the South Arne field of Danish North Sea was studied by means of core material of 4 inch (100 mm) diameter collected from the wells SA-1 and Rigs-1 (Figure 4.1). SA-1 is a deviated well and Rigs-1 is a vertical well. Studied intervals are presented in Table 4.1. One an half inch (37.5 mm) vertical plugs as well as centimetre sized chips and side trims were collected for rock-physical and petrophysical laboratory experiments.
Figure 4.1: (a) Location map of South Arne Field, North Sea. (b) Position of the studied wells within the field, plotted on the top of chalk group depth structure map (Modified after Larsen, 1998).

32
Table 4.1: Studied geological interval and lab number of the studied samples. The underlined samples were flooded with supercritical CO2.
Well Depth (m)
Formation Samples for geophysical tests Samples for rock-mechanics tests
Rigs-1 2803.9 Ekofisk RE-06A, RE-08B, RE-09B, RE-10A, RE-12B
Rigs-1 2806.9 Ekofisk RE-14
Rigs-1 2813.0 Ekofisk RE-22A, RE-23A, RE-24
Rigs-1 2816.1 Ekofisk ***RE-26B2 RE-26B1, RE-28A1, RE-29, RE-31
Rigs-1 2840.6 Tor RT-01, RT-02
Rigs-1 2844.4 Tor RT-03
SA-1 3319.8 Ekofisk SE-05A
SA-1 3331.8 Ekofisk SE-02, SE-03
SA-1 3381.7 Tor ST-23A, ST-24A, ST-24B, **ST-26 ST-25B
SA-1 3390.5 Tor ST-20
SA-1 3399.7 Tor ST-16B, ST-17B
SA-1 3408.7 Tor ST-12B, ST-13B
SA-1 3418.8 Tor ST-01B, ST-03B
SA-1 3427.7 Tor *ST-08A, *ST-08B ST-07
SA-1 3437.8 Tor ST-04B
* used primarily as filter for the CO2 flooding test. ** Flooded with rock-mechanics test set of Tor Formation *** Flooded with rock-mechanics test set of Ekofisk Formation
4.2 Geophysical analysis on 1½ inch core plugs Sixteen 1½ inch (37.5 mm) vertical plugs of variable length were prepared by rotary drilling for porosity, permeability, sonic velocity, electrical resistivity and Nuclear Magnetic Resonance (NMR) transverse relaxation time (T2) measurements. In addition, porosity, permeability and sonic velocity data were collected from twenty 1½ inch (37.5 mm) vertical plugs, which were used primarily by GEO for rock-mechanics testing. An overview of the studied samples is given in Table 4.1. Based on test plan established at the beginning of the study, the following procedures were applied to collect data from 1½ inch (37.5 mm) samples.
4.2.1 Test plan Three groups of samples were selected for sonic velocity, electrical resistivity and NMR measurements (Table 4.2). Each group contains four samples representing each of the studied intervals: SA-1 Ekofisk Formation (SE), SA-1 Tor Formation (ST), Rigs-1 Ekofisk Formation (RE) and Rigs-1 Tor Formation

33
(RT). The test plan was designed so that sonic velocity and electrical resistivity (where possible) could be recorded at initial dry conditions (Dry-I), initial brine saturated (Sw-I), irreducible water saturated (Swir), residual oil saturated (Sor), after supercritical CO2 injected at reservoir condition (SCO2), cleaned-dry after CO2 injection (Dry-F), and brine re-saturated after CO2 injection (Sw-F). Table 4.2: Test design for geophysical measurements. Grey boxes indicate intermediate stages of measurement taken on a sample. Black boxes indicate final test of a sample.
Condition Dry-I Sw-I Swir Sor SCO2 Dry-F Sw-F
Sample
Vel
ocity
R
esis
tivity
N
MR
T
hin
sect
ion
Vel
ocity
R
esis
tivity
N
MR
T
hin
sect
ion
Vel
ocity
R
esis
tivity
N
MR
T
hin
sect
ion
Vel
ocity
R
esis
tivity
N
MR
T
hin
sect
ion
Vel
ocity
R
esis
tivity
N
MR
T
hin
sect
ion
Vel
ocity
R
esis
tivity
N
MR
T
hin
sect
ion
Vel
ocity
R
esis
tivity
N
MR
T
hin
sect
ion
RE-22A
RT-03
SE-03
ST-24A
RE-24
RT-01
SE-05A
ST-24B
RE-23A
RT-02
SE-02
ST-23A
RE-26B2
ST-26
In addition, samples ST-26 and RE-26B2 were processed with samples for rock-mechanics tests carried out by Danish Geotechnical Institute (GEO) under the CO2-EOR project. Geophysical and petrophysical data were collected on these samples and used as a representative of the other samples from the same formation. Details on processing these samples can be found in Paper IV. Simulated formation brine (HTF brine) and South Arne crude oil were used as water and oil phase respectively for all samples. Due to low permeability (<0.1 mD), South Arne Ekofisk Formation samples were removed from the process after the Sw-I condition. Among the three groups, Group-1 samples were kept at initial brine saturated condition (Sw-I) and used for reference NMR signal in the wettability study. CO2 was injected into Group-2 samples at Sor condition and

34
into Group-3 samples at Swir condition. NMR T2 relaxation time was measured in all CO2 injected samples before they were cleaned for salt and dried. Porosity and permeability were measured at this final condition to quantify the effect of CO2 injection on these properties. After sonic velocity measurement in dry condition, these samples were re-saturated with brine. Sonic velocity and electrical resistivity were measured at this condition (Sw-F) and compared with data of the Sw-I condition.
4.2.2 Cold flush cleaning The 1½ inch vertical plugs were first cleaned for salt and hydrocarbons by cold flush cleaning method with a mixture of methanol and toluene. The plugs were mounted in a Hassler core holder and a confining pressure of 400 psi (2.75 MPa) was applied. The liquids were flushed through the sample with a positive displacement pump. Each step in a cleaning cycle may require a liquid throughput of 5-20 pore volumes or until the effluent is free of salt and colorless. Methanol and toluene were used for the removal of salt and hydrocarbons respectively. Clean samples were dried in an oven at 55°C for two days.
4.2.3 Grain density and porosity The grain density and porosity was measured on cleaned and dried plugs by a helium porosimeter. The He-porosimeter measures the grain volume Vg of the sample. The empty sample container of the porosimeter has a volume VS before the sample is inserted. A reference volume Vr is filled by helium and the pressure Pr is recorded. The gas is expanded from the reference volume to the sample container and the resulting pressure PX is recorded. The grain volume is determined by applying Boyles low: PIVI = P2V2 or PrVr = PX(Vr+Vs-Vg).
The sample mass m was obtained by using an electric balance (0.01 gram
accuracy) and the grain density g was calculated. The total volume of the sample
Vt of the oven dried (24 hours at 60°C) sample was calculated form the length l
and diameter d as measured by a calliper (accuracy 0.05 mm):
ldVt2
4
Eq. 4.1
Dry density was calculated as:

35
td V
m Eq. 4.2
Grain density was calculated as:
gg V
m Eq. 4.3
Helium porosity, was calculated as:
t
gt
V
VV Eq. 4.4
4.2.4 Gas permeability The permeability is defined by Darcy's law:
l
PAkq
Eq. 4.5
where q is the velocity of flow through the sample, k is permeability, ΔP is
pressure drop along sample, is the absolute viscosity and l is sample length.
Cleaned and dried plug was mounted in a Hassler core holder, and a confining pressure of 400 psi was applied to the sleeve. Nitrogen gas pressures of 3, 5 and 8 atm (0.3, 0.5, 0.8 MPa) (abs) were applied at the upstream end of the plug, and the downstream pressure was regulated until a suitable flow was obtained. The differential pressure was kept approximately constant in order to maintain a similar flow regime during the 3 measurements. When a steady state was reached, the upstream pressure, the differential pressure across the plug and the flow reading were recorded. A linear regression of permeability on inverse mean pressure was performed for the 3 measurements, and the intercept on the permeability axis is the Klinkenberg corrected gas permeability. A permeability value pertaining to a mean pressure of 1.5 atm. (abs) was calculated from the Klinkenberg regression coefficients. This value was recorded as gas permeability.

36
4.2.5 Establishing experimental condition Based on initial porosity, permeability, specific surface and sonic velocity data suitable experimental conditions for sonic velocity, electrical resistivity, irreducible water saturation and fluid flow rate in core plugs was defined before initiating the measurement process.
4.2.5.1 Stress condition for sonic velocity and electrical resistivity measurement Stress in the horizontal direction in a reservoir is a fraction of the vertical stress. Therefore, a uniaxial confined compression is the most suitable condition in order to mimic the actual reservoir stress on rock. The relationship between
radial stress (r) and axial stress (a) for linear elastic media can be expressed by
means of Poisson’s ratio (ν) (Teeuw, 1971):
v
v
a
r
1
Eq. 4.6
Figure 4.2: Poisson’s ratio of South Arne field as calculated from sonic velocity measured under uniaxial unconfined condition (Eq. 4.7).
In order to establish a uniaxial condition similar to the South Arne field, Poisson’s ratio was calculated from sonic velocity measured under uniaxial unconfined compression:
22
22
2
2
sp
sp
VV
VV
Eq. 4.7
0
0.1
0.2
0.3
0.4
20 25 30 35 40Helium Porosity (%)
Po
isso
n's
ratio
Rigs 1 Ekofisk Rigs 1 TorSA 1 Ekofisk SA 1 Tor

37
where Vp is the compressional wave velocity and Vs is the shear wave velocity. Calculated Poisson’s ratio ranges mostly between 0.20 and 0.30 (Figure 4.2). However, for simplicity it was decided to apply a general ν ≈ 0.25. For this ν:
ar 33.0 Eq. 4.8
A generalized radial to axial stress ratio also ease establishing a better control over the radial stress, as the pump for controlling radial stress was semi-automatic. The pump requires adjusting manually with the change in stress level. By using a constant stress ratio for all samples it is possible to control the pump based on experience so that the desired ratio between radial and axial stress can be maintained continuously.
4.2.5.2 Irreducible water saturation to be used during CO2 flooding In a water wet system, at irreducible water saturation all the particle surface
exposed to pores (S) will be covered by a film of water. The samples collected
for testing vary with respect to porosity and permeability (Figure 4.3), so in order to obtain a common water film thickness in pores during CO2 injection, a common water saturation for all samples cannot be applied. A suitable water saturations was estimated by using the pseudo water film thickness (PWFT) model of Larsen and Fabricius (2004). From logging data and conventional core analysis data specific surface of the pores was calculated as:
lk
cS
Eq. 4.9
where is porosity and kl is liquid permeability. When gas permeability (kg) data
is available kl can be calculated as (Mortensen et al., 1998):
083.1)mD/(25.0 gl kk mD Eq. 4.10
for North Sea chalk and the factor c may be approximated as a function of porosity (Mortensen et al., 1998):
1
43
412arccos
3
1cos4)(
c Eq. 4.11

38
Figure 4.3: Water saturation from log analysis compared to the water saturation recommended for CO2 flooding, as well as resulting calculated pseudo water film thickness (PWFT); (a) for Rigs-1 well, (b) SA-1 well. Porosity and permeability used for PWFT calculation are given in (i) and (ii). Large black dots are measurements taken in this project. Small circles and dots are core data collected from Geological Survey of Denmark and Greenland (GEUS) core lab database. Permeability indicated by closed data points is measured in the vertical direction whereas open data points represent measurements in the horizontal direction.
Pseudo water film thickness (PWFT) is then calculated from S and water
saturation at irreducible condition, Swir, by (Larsen and Fabricius, 2004):
S
SPWFT wir Eq. 4.12
Larsen and Fabricius (2004) found that PWFT is not constant but decreases with increasing capillary pressure. Water saturation and PWFT for Rigs-1 and SA-1 are presented in Figure 4.3. The water saturation of SA-1 and Rigs-1 was
0 0.2 0.4 0.6 0.8 1
Water saturation
(b-iv)
0 20 40 60 80 100
PWFT (nm)
(b-iii)
0.01 1 100
Gas permeability (mD)
(b-ii)
Horizontal
Vertical3300
3320
3340
3360
3380
3400
3420
3440
3460
3480
3500
0 0.1 0.2 0.3 0.4 0.5
Porosity
Me
asu
red
De
pth
(m
)
(b-i)
Ekofisk Fm.
Tor Fm.Present dataset
0 0.2 0.4 0.6 0.8 1
Water saturation
(a-iv)
0 20 40 60 80 100
PWFT (nm)
(a-iii)
0.01 1 100
Gas permeability (mD)
(a-ii)
Horizontal
Vertical2770
2780
2790
2800
2810
2820
2830
2840
2850
2860
2870
0 0.1 0.2 0.3 0.4 0.5
Porosity M
ea
sure
d D
ep
th (
m)
(a-i)
Ekofisk Fm.
Tor Fm.
Present dataset

39
Reaction control, Pe
Uniform dissolution
Wormhole
Tra
nspo
rt c
ontr
ol, P
eDa
Com
pact
di
ssol
utio
n
Reaction control, Pe
Uniform dissolution
Wormhole
Tra
nspo
rt c
ontr
ol, P
eDa
Com
pact
di
ssol
utio
n
assumed irreducible and that the generally higher PWFT in Rigs-1 was assumed to be the result of lower capillary pressure in that well. So a common PWFT of approximately 20 nm for all samples were selected and Swir was calculated for individual samples corresponding to this PWFT.
4.2.5.3 Injection rate required to avoid worm holes resulting from CO2 injection. Previous laboratory test series on carbonates experienced the formation of wormholes, making the interpretation of test results difficult (e.g. Hoefner and Fogler, 1989; Egerman et al., 2005; Lombard et al., 2010). Thus, to avoid wormholes, a suitably low CO2 injection rate was estimated for this project.
Figure 4.4: Dissolution patterns caused by transport of a reactive fluid in a porous medium. The raise of different dissolution patterns may be described as a function of the Damköhler, Da, and Peclet, Pe, numbers.
Transport of fluid in a reactive porous medium can result in dissolution of the solid phase. The geometric pattern of dissolution is controlled by flow rate and rate of reaction (Egerman et al., 2005). Where transport of the fluid is the limiting factor, compact dissolution takes place. Where rate of reaction is the limiting factor, uniform dissolution throughout the pore space dominates. Where both factors play a significant role, worm holes may arise (Figure 4.4). In order to facilitate interpretation of geophysical data after CO2 injection, uniform dissolution is required. The reactive transport may be described in terms of the Peclet number (Pe) and the Damköhler number (Da). Pe, describes the time for diffusion relative to time for convection and Da describes time for convection relative to time for dissolution. Time for diffusion relative to time for dissolution is thus described by the product PeDa. For simplicity and to be on the safe side, injection of a strong acid was assumed. Pe and PeDa was calculated as functions of injection rate to find a suitable injection rate which will not create wormholes. According to this interpretation, injection rates should be below 6 m/s (10 ml/hr for a 1½ inch plug).

40
4.2.6 Saturating fluid Simulated formation brine (HTF brine) was used as the aqueous phase. Depending on the purpose (described later) South Arne crude oil (dead oil) or South Arne live oil (recombined oil) or Isopar-L was used as hydrocarbon phase. Fluid properties are listed in Table 4.3. Table 4.3: Properties of the used fluid at ambient conditions (15oC/0.1 MPa) and at South Arne reservoir condition (115oC/38 MPa).
Density (g/cm3) Viscosity (cP) Fluid
15°C (atm.) 115°C (38 MPa) 15°C (atm.) 115°C (38 MPa)
Simulated formation brine (HTF brine)
1.065 1.028b 0.779 0.36b
South Arne stock tank oil 0.845 - 13.5 -
South Arne live oil - 0.63c - 0.25c
Isopar-L 0.779c - 1.29c -
Supercritical CO2 - 0.71c - 0.06c aSupercritical CO2 in SA-1 live oil - 0.67c - 0.21c
a 30 (mol%) CO2 at 115°C and 38 MPa, b Calculated by Batzle and Wang (1992) equations and c Yan and Stenby (2010).
4.2.6.1 South Arne synthetic brine (HTF brine) According to the field operators, formation brine composition in the South Arne field is variable and a perfect match with the actual composition of the water in the Rigs-1 and SA-1 wells cannot be expected. For this study brine (HTF brine) was prepared on the basis of a water analysis from well SA-2 from the South Arne field (Table 4.4). The water composition was modified relative to the SA-2 analysis as follows:
1) The water analysis is not stoichiometric and to be used as a recipe some Cl- were omitted.
2) Sr2+ and Ba2+ are omitted together with an appropriate amount of Cl- to avoid precipitation of celestine, strontianite, barite and witherite.
3) Fe (total) was omitted because; in the experimental work it was not possible to control oxygen fugacity.
4) Al3+ was omitted because the amount is insignificant. 5) B3+ was omitted because of lack of experience with this component. 6) Si4+ was omitted because; in order to make it soluble in water it is
necessary to add components that are not included in the analysis. 7) SO4
2- was omitted to avoid precipitation of sulphate minerals. An amount of CaCO3 could precipitate from the solution during mixing. The water was filtered and the amount of precipitate was quantified.

41
Table 4.4: Composition of synthetic brine: salinity 90423 ppm and resistivity 0.077 Ωm at 25°C.
Simulated formation brine (HTF brine) Element SA-2 Water analysis (mg/l) Compound Compound
g/l Concentration
mg/l Concentration
mol/l
Na+ 31021 NaCl 78.847 31016 1.3491
NaHCO3 0.018 5 0.0002
K+ 522 KCl 0.995 522 0.0134
Mg2+ 665 MgCl2.6H2O 5.562 665 0.0274
Ca2+ 5667 CaCl2.2H2O 20.788 5667 0.1414
Sr2+ 461 - - - -
Ba2+ 627 - - - -
Fe(total) 30 - - - -
Al3+ 2 - - - -
B3+ 106 - - - -
Si4+ 31 - - - -
Cl- 64040 - - 60270 1.7000
HCO3- 500 - - 13 0.0002
SO42- 17 - - - -
4.2.6.2 Supercritical CO2 Above the critical point of 31°C and 7.3 MPa, CO2 behaves as a gas with liquid-like density, which is known as supercritical CO2. At this condition CO2 dissolves in the hydrocarbon phase and creates a mixed fluid of lower absolute viscosity and higher density than the original hydrocarbon phase. For South Arne recombined oil (live oil) supercritical CO2 injection at South Arne reservoir conditions (115°C) increases density from 0.63 g/cm3 to 0.67 g/cm3, while decreasing the viscosity from 0.25 cP to 0.21 cP. 30 (mol %) of CO2 is dissolved in the oil phase at this condition (Yan and Stenby, 2010). Details of the behavior of supercritical CO2 dissolved in South Arne live oil are reported by Yan and Stenby (2010).
4.2.7 Saturation processes Samples were saturated according to the test plan (section 4.2.1). How the desired saturation was achieved is described in the following sections.
4.2.7.1 Initial water saturation All samples were first saturated with HTF brine aiming at 100% saturation. A vacuum procedure was used for initial brine saturation. Samples were placed in

42
desiccators and vacuum were created by a water pump while brine was poured into the desiccators gradually until the samples were covered with brine. To increase degree of saturation, while these samples were immersed in brine they were pressurized in a pressure chamber with elevated pressure of 1600 psi (11 MPa) for 3 days. Afterwards the degree of saturation was tested by the Archimedes method. The samples were subsequently subjected to primary drainage, water flooding and CO2 injection.
4.2.7.2 Irreducible water saturation To obtain irreducible water saturation (Swir) the brine saturated samples were mounted in a core holder and were heated at 80ºC for 2 days to establish uniform reservoir temperature. Holding the sample at 18 barg (1.8 MPa) sleeve pressure, at least 1.9 pore volume of South Arne Crude oil at room temperature (23ºC) was then flushed through the samples at a rate of less than 0.5 ml/h to achieve an uniform distribution of the oil phase throughout the sample. Samples were then aged at 80ºC for 24 days at 18 barg (1.8 MPa) sleeve pressure. Afterwards, samples were flushed with at least 2.3 pore volume of oil at a rate of less than 0.5 ml/h at a temperature of 23ºC and sleeve pressure of 18 barg (1.8 MPa). By this operation any gas evolved during the ageing should be removed from the pores. Archimedes test was then done in oil to calculate oil saturation.
4.2.7.3 Residual oil saturation To obtain residual oil saturation by waterflooding (Sor), the following procedure was followed: Mounted in a core holder the samples at Swir were heated at 80ºC for 2 days. The samples were then flushed with degassed HTF brine. The oil produced from each core holder was collected. Differential pressure over samples was aimed not to surpass 5 bar (0.5 MPa). The flushing of each sample was completed with brine flow for 1 day at 2 ml/h, if allowed by the differential pressure. Archimedes test was done in HTF brine to calculate brine saturation.
4.2.7.4 CO2 injection The injection experiments were conducted in a reservoir condition rig utilizing a Hassler-type core holder for 1.5" (37.5 mm) plugs with a floating end piece, a number of pressure cylinders for the experimental fluids, two acoustic separators for quantifying the fluid production, a differential pressure transducer for measuring the pressure difference across the sample, a densitometer, and a high pressure pump system for generating confining pressure, flow and pore fluid

43
pressure. Details of the experimental setup are given in Olsen (2010). A series of samples were placed in a core holder. Plugs were mounted with increasing permeability towards the outlet end of the core holder to form a composite core. A good fit between the individual samples is aimed to assure good capillary contact. The core holder with core plugs was mounted in a vertical position and CO2 injection was performed vertically from the bottom of the stacked samples towards the top. The injection experiments were conducted at 380 bara (38 MPa) pore pressure, 500 bara (50 MPa) hydrostatic confining pressure and a temperature of 115ºC.
For the present study, the objective of CO2 injection was to identify the changes in chalk when CO2 is injected into an already waterflooded field and when CO2 is injected from the beginning of production. Therefore a group of irreducible water saturated and a group of residual water saturated (waterflooded) samples were placed in the rig. In addition filter samples were placed at the inlet and at the outlet in order to minimize possible back-flow and saturation end effects. Arrangement of samples: (inlet) ST-08B » ST-24B » RE-24 » RT-01 » RE-23A » ST-23A » RT-02 » ST-08A (outlet). After mounting the samples in the core holder, the core holder was mounted in the reservoir condition rig. Temperature, fluid pressure and hydrostatic confining pressure were increased simultaneously until reservoir pressure conditions were achieved. Samples were held at this condition for one week. The composite core was then injected with 352.5 ml (2.83 PV) supercritical CO2 at a rate of 2 ml/h.
4.2.7.5 Final water saturation After necessary data collection CO2 injected samples were cleaned for salt and oil and re-saturated with HTF brine using the same procedure as described in section 4.2.7.1.
4.2.8 Data collection and analysis Sonic velocity, electrical resistivity and NMR T2 data were collected by laboratory measurement at various stages as defined in section 4.2.1.

44
4.2.8.1 Sonic velocity measurements Measurements were taken by placing the sample between the two pistons of a loading frame and inside a triaxial cell (Figure 4.5). Maximally 4 MPa axial stress was applied in loading/reloading cycles while pore pressure was kept atmospheric. Each test contains four cycles: (i) loading to 3 MPa axial steress, (ii) unloading to 1 MPa axial steress, (iii) Reloading to 4MPa axial steress, and (iv) unloading to atmospheric condition. In all cycles the radial stress was controlled to satisfy Eq. 4.8. Reservoir rocks are subjected to both vertical and lateral stress as well as high pore pressure (overpressure) in the North Sea Chalk reservoirs. To simulate reservoir stress in a laboratory experiment, only requires the application of the differential stress (total stress minus pore pressure) instead of the actual stresses (Teeuw, 1971). The effective vertical stress in South Arne is between 10 MPa and 20 MPa. However, the velocity variation in North Sea chalk samples was found to be less than 3% between 4 MPa and 11 MPa (Borre and Fabricius, 2001). Therefore, a maximum axial stress of 4 MPa was used in order to avoid damage to the sample as the same sample was used repetitively (Table 4.2).
Ext. 1 2 Trg.
Sync. Out
7
9
8
1. Load frame 2. Piston with piezoelectrical crystals3. Triaxial cell 4. Pressure sleeve 5. Hydraulic oil 6. To automatic pump 7. Oscilloscope 8. Function generator 9. Variable resistor 10. Sample for testing
R1
Varia
ble resistor
R2 Chalk Sample
AC supply
i2
i1
2
2
1
3
45
6
10
Figure 4.5: Experimental setup for sonic velocity and resistivity measurements.
Compressional wave velocity Vp and shear wave velocity Vs were measured by recording the travel time of a transmitted ultrasonic wave at 200 KHz through a sample of known length. Travel time was calculated from the first break for P-wave and from the zero crossing for the S-wave (Figure 4.6). Overall accuracy of
the measurement is 50 m/s for P-waves and 100 m/s for S-waves.

45
Figure 4.6: Selection of arrival time indicated by a circle, (a) P-wave at first break, (b) S-wave at zero crossing. Saverage=(S1+S1)/2. Shear wave value used for further calculations is Saverage.
4.2.8.2 Modulus and Biot’s coefficient from sonic velocity
Biot’s coefficient, was calculated from bulk modulus of the mineral frame,
Kdry and bulk modulus of the mineral, Ko:
P
-0.2
-0.15
-0.1
-0.05
0
0.05
0.1
0.15
0.2
0 5 10 15 20 25 30 35 40 45 50
Vol
ts
S1
-0.04
-0.03
-0.02
-0.01
0
0.01
0.02
0.03
0.04
0 5 10 15 20 25 30 35 40 45 50
Vol
ts
S2
-0.04
-0.03
-0.02
-0.01
0
0.01
0.02
0.03
0.04
0 5 10 15 20 25 30 35 40 45 50
Vol
ts
Saverage
-0.04
-0.03
-0.02
-0.01
0
0.01
0.02
0.03
0.04
0 5 10 15 20 25 30 35 40 45 50s
Vol
ts

46
0
1K
K dry Eq. 4.13
Kdry is calculated from the compressional velocity, Vp and shear velocity, Vs, as
measured on the dry rock, as well as dry density, dry:
22
34
sdrypdrydry VVK Eq. 4.14
From Vp and Vs measured on rocks saturated by a fluid, Kdry may be calculated by using Gassmann (1951) fluid substitution:
)( 000 fl
fl
dry
dry
sat
sat
KK
K
KK
K
KK
K
Eq. 4.15
where Ksat is the bulk modulus for the saturated rock and Kfl is the modulus of the saturating fluid.
4.2.8.3 Electrical resistivity measurements Experimental setup for electrical resistivity measurements is shown in Figure 4.5. The electrical resistance of the samples was measured at 23°C simultaneously with velocity, from a variable resistor connected in series with the sample in a 1 kHz AC circuit of 1 volt power supply. As current flows through the sample and the variable resistor is equal (i1=i2):
resistor variable
samplesupply
sample
sample
R
VV
R
V Eq. 4.16
The variable resistor was adjusted by looking at the oscilloscope, so that the voltage drop across the sample becomes half of the supply voltage. At this condition the resistivity set in the variable resistor gives the resistivity of the sample:
resistor variablesample RR Eq. 4.17

47
Low frequency and supply voltage were selected so that the phase angle shift remains close to zero. Precautions in the sample handling during this procedure setup were taken to avoid evaporation and sample drying.
4.2.8.4 Archie’s cementation factor, m from electrical resistivity Archie’s (1942) equation correlates resistivity of brine Rw with the resistivity of a rock saturated with brine Ro by defining a formation factor, F:
w
o
R
RF Eq. 4.18
The electrical current travels a longer path than the geometrical length of a rock. F indicates the degree of difficulty in electrical current flow due to the pore geometry. F is primarily controlled by porosity and specific surface, but the
cementation factor, m determines the degree to which porosity, should be
decreased, so that the pores could be considered as straight continuous channels. F is then (Archie, 1942):
mF
1
Eq. 4.19
The exponent m increases significantly with specific surface (Olsen et al., 2008c) which characterizes the pore geometry. Therefore, if CO2 changes the pore geometry it would possibly change the cementation factor.
4.2.8.5 NMR T2 relaxation time measurements Transverse (spin-spin) relaxation time, T2 was measured by a standard CPMG (Carr-Purcell-Meiboom-Gill) pulse sequence by using a resonance instruments Maran spectrometer at two steps with different parameter setup due to the use of two different labs. 1.) At initial brine saturated condition taking one representative sample from each of the studied formations of both wells (Table 4.2, group 1). 2.) All CO2 injected samples after geophysical tests (Table 4.2). Measurement was also repeated in the samples measured at step 1 with the setup of step 2.

48
Setup for step 1 measurements: Experiments were made at 35ºC with Larmor frequency of 2.12 MHz and low magnetic field, B0. Number of echoes collected was 8000 with 300 scans. Echo spacing (τ) which is the time between successive rephasing (P180) pulses of τ=200 microseconds was chosen. Setup for step 2 measurements: Experiments were made at 35ºC with Larmor frequency of 1.83 MHz and magnetic field, B0, as 0.044T. Number of echoes collected was 8192 with 128 scans. Echo spacing (τ) which is the time between successive rephrasing (P180) pulses of τ=200 microseconds was chosen. The relaxation time (T2) distribution was obtained with the DXP programmed from Resonance Instruments. With the short echo spacing and low applied magnetic field (B0) in both steps, the T2 relaxation is dominated by surface relaxation (Kleinberg et al., 1993) and the contribution from diffusion in T2 relaxation time can be neglected (Hürlimann, 1998).
4.2.8.6 Surface relaxivity from transverse relaxation time, T2 Transverse relaxation time, T2 is the characteristic time that proton aligned by a magnetic field take to flip 90o after the magnetic field disappears. Relaxation of protons close to the solid surface is faster than of protons in the free flowing fluid (Kenyon, 1997). Transverse relaxation rate, 1/T2 in an NMR experiment is proportional to the surface to volume ratio (S/V) (Coates et al., 1999):
SV
S
T
2
1, Eq.4.20
where is relaxivity and S is the specific surface of pore space.
Protons in water relax faster in water-wet system than in an oil-wet system (Brown and Fatt, 1956; Williams, 1982, Hsu, 1992; Chen et al., 2006). Therefore, a change in wettability may result in a change in transverse relaxation time, T2.

49
4.3 Characterization by chips and side trims An overview of the studied samples is given in Table 4.1. Side trims of all 1½ inch samples were collected to prepare polished thin sections for backscattered electron (BSE) microscopy. Centimetre size chips were also collected from the core material from the wells SA-1 and Rigs-1 for measurement of carbonate content, specific surface, cation exchange capacity (CEC) and mineralogical composition. After finishing the designed geophysical tests the samples were cleaned for brine and dried. These samples were then characterized by measuring carbonate content, specific surface of both crushed sample and insoluble residue and by Backscatter Electron microscopy of thin sections.
4.3.1 Soxhlet extraction cleaning Trims were cleaned for salt and hydrocarbons by Soxhlet extraction. The samples were first refluxed by methanol to remove salts. Methanol was boiled at 110°C and the vapour was condensed by flowing water at 12°C. The absence of measurable chloride was checked by 0.03M AgNO3 after stopping the process for three days, while the samples in the flask were immersed in methanol. After removing chloride, the samples went through toluene refluxing for hydrocarbon removal. Toluene was boiled at 64.5°C and the vapour was condensed by flowing water at 12°C. This process continued until clear toluene solution was found after interrupting the process for three days, with the samples immersed in toluene. Clean samples were dried in an oven at 55°C for two days.
4.3.2 Carbonate content Approximately 0.30 gram of the powdered sample was weighed with accuracy
0.01. The sample was suspended in 250 ml distilled water and 25.00 ml (0.01)
of 0.500 N (0.001) HCl was added. After 24 hours the solution was boiled on a
hot plate for 20 minutes to remove CO2. The solution was then cooled to room temperature. After adding 5 drops of Phenolphthalein indicator, the solution was
titrated with NaOH of 0.50N (0.01). Carbonate content was calculated by using
the following equation:
100
10002
M)N(ml)N(ml%CaCO 3CaCONaOHNaOHHClHCl
3
m Eq. 4.21

50
where mlHCl is the volume of HCl added in ml, NHCl is the normality of HCl, mlNaOH is the volume of NaOH used to get endpoint of titration in ml (accuracy
0.025), NNaOH is the normality of NaOH, 3CaCOM is the molecular weight of
CaCO3 (100.09 g/mol) and m is the sample weight. Quality control: Because of the hygroscopic nature of the NaOH solution, its normality can be changed by absorbing moisture. Therefore, normality of the NaOH solution was checked immediately before the test. It was done by titrating
25.00 ml (0.01) of 0.500N (0.001) HCl and noting the amount (accuracy
0.025 ml) of NaOH required:
NaOH
HClHClNaOH ml
NmlN
Eq. 4.22
4.3.3 Collection of Irreducible Residue (IR) Carbonate was totally dissolved in 2 N CH3COOH solution at pH = 2.23:
CaCO3 + 2CH3COOH → 2CH3(COO)2⎯ + Ca2+ + H2O + CO2 Eq. 4.23
The products of the reaction and excess acetic acid were removed by washing with distilled water. The insoluble residue was dried at 60°C for 48 hours to make it ready for specific surface measurement (of IR) and qualitative determination of insoluble minerals by XRD.
4.3.4 Specific surface The nitrogen adsorption technique by Brunauer, Emmet and Teller (BET) (Brunauer et al., 1938) was applied to determine the specific surface by using a Micrometritics Gemini III 2375 analyzer. The accuracy of the instrument is
0.5%. 1.500 to 2.250 g of coarsely ground sample or 0.600 to 1.500 grams of IR
was placed in a tube. The sample was degasified inside the tube with nitrogen gas at 70°C for 4 hours before putting it in the instrument for adsorption. Both multipoint and single point data were recorded. In order for quality control two tests were done for each sampling interval (Table 4.1).

51
4.3.5 Mineral composition
Figure 4.7: A set of XRD diffractograms from which minerals in the studied sample were determined
Both powdered original sample and IR were analyzed by X-ray diffraction
(XRD) by using Cu K- radiation with a Philips PW 1830 diffractometer. For the
Bulk sample
0200
400600
8001000
1200
0 5 10 15 20 25 30 35 40 45 50 55 60 652q
Inte
nsi
ty C
PS
IR - air dried
0200
400600
8001000
1200
0 5 10 15 20 25 30 35 40 45 50 55 60 652q
Inte
nsi
ty C
PS
IR - glycol treated
0200
400600
8001000
1200
0 5 10 15 20 25 30 35 40 45 50 55 60 652q
Inte
nsi
ty C
PS
IR - dried at 350°C
0200
400600
8001000
1200
0 5 10 15 20 25 30 35 40 45 50 55 60 652q
Inte
nsi
ty C
PS
IR - dried at 550°C
0200
400600
8001000
1200
0 5 10 15 20 25 30 35 40 45 50 55 60 652
Inte
nsi
ty C
PS

52
identification of clay minerals, a film of IR was produced on a 15mm30mm test
slide. Approximately 0.03g (0.0001) of ground residue was mixed with 1.5 ml
water and then the mixture was spread over the entire slide. The slide was then kept at laboratory temperature (22°C) for 24 hours for air drying. Four X-ray diffractograms was produced, following the sequence: Air-dried > Ethylene Glycol-Solvated at 60°C for two days > Oven-dried at 350°C for 1 hour (cooled to room temperature before putting into the machine) > Oven-dried at 550°C for 1 hour (cooled to room temperature before putting into the machine). The heating steps transform some of the clay minerals. Diffraction data were recorded in the
Bragg’s angle 2 interval of 2° to 65° for the powdered original material and 2°
to 40° for the residue (Figure 4.7). All diffractrograms are given in Appendix VII.
4.3.6 Cation Exchange Capacity (CEC) CEC of the irreducible residue was estimated by replacing the exchangeable bases by Barium using BaCl2. CEC of calcite was estimated by adsorbing Mg2+ ions onto the calcite surface and replacing Ca2+ ions.
4.3.6.1 BaCl2 method The exchangeable bases are removed with an excess of Ba2+. Thereafter, the sample is brought to an ionic strength of about 0.01M. Then the Ba2+ is removed with an excess of MgSO4. The Mg lost for the exchange with Ba2+ is measured to determine the CEC. The exchangeable bases and the Mg2+ are measured with inductively coupled plasma optical emission spectrometry (ICP-OES). A Varian Vista MPX Axial View Inductively Coupled Plasma OES was used for all measurements. A 0.5g (with 4 decimals) sample was weighted into a clean, dry, numbered centrifuge tube with screw cap. Weight of the tube with sample (FW) was recorded. 30 ml of 0.1M BaCl2 was added into the tube from a diluter and shaken (200 /min.) for 1 hour. The solution was then centrifuged for 10 min. at 2500 rpm. The supernatant was decanted into a 100 ml volumetric flask. Shaking/centrifugation steps were repeated two times. Every time, the supernatant was decanted into a 100 ml volumetric flask. The volumetric flask was filled with 0.1M BaCl2 and homogenized. In this solution (I) the exchangeable bases are measured:

53
Cation mEq/100g = 1000
100100)(
ED
DBC Eq. 4.24
where B is the concentration of cation in blank (mg/L), C is the concentration of cation in sample (mg/L), D is dilution factor, W is the sample weight (g) and E is the equivalent mass of respective cation. Thirty ml of -25M BaCl2 was added to solution I. The sample was shaken overnight in a centrifuge tube. The solution was then centrifuged for 10 min. at 2500 rpm. The supernatant was decanted and weight of the tube with the sample (SW) was measured. After adding 30 grams of 0.02 M MgSO4 solution to the sample, the tube with the sample was weighted and it was shaken for 2 hours. It was then centrifuged for 10 min. at 2500 rpm and the supernatant was decanted over an OOR-filter into a bottle. In this filtrated solution (II) the CEC is measured:
CEC mEq/100g = 1000
100)30()(
EW
FWSWDCB Eq. 4.25
where B is the concentration of Mg2+ in blank (mg/L), C is the concentration of Mg2+ in sample (mg/L), D is the dilution factor, W is the sample weight (g), E is the equivalent mass of Mg2+ and 30 is the added weight of 0.02M MgSO4.
4.3.6.2 Mg2+ adsorption method Two synthetic calcites, CCL (low specific surface area, 0.24 ±0.05 m2/g) and CCH (high specific surface area, 11.0 ±0.2 m2/g) were used by Ahsan and Fabricius (2010) to study the effect of grain size on the ion exchange capacity of calcite. Results of Ahsan and Fabricius (2010) were used to calculate the CEC of bulk sample (section 3.3.4). Synthetic calcites were washed for more than 50 hours with a Mg2+ containing (50 ppm) solution to displace Ca2+ from the calcite surface until Ca2+ ions concentration in the solution became stable. The initial concentration of Mg2+ ions is less than 5% of the concentration in sea water. The concentration is so low that it has insignificant effect on calcite solubility (Berner 1975). The Mg2+ containing solution was prepared from an equilibrated calcite solution, so that, it cannot cause net dissolution of calcite.

54
Concentrations of Ca2+ and Mg2+ were measured at time intervals by Atomic Adsorption Spectroscopy. The longer the Mg2+ containing solution is allowed to come in contact with calcite surface, the more Ca2+ goes into the solution and the more Mg2+ ions adsorbs on the surface, until it approaches equilibrium
4.4 Uncertainty analysis In order to simplify the experimental work and due to instrumental limitations, the experimental conditions used may differ from ideal conditions. In the following section the error involved in the experimental data is described.
4.4.1 Dependencies of strain rate In order to avoid evaporation of pore fluid and to complete one combined sonic velocity and electrical resistivity test a day, a strain rate of 1% per hour was used. Experimental studies were made by taking one sample from each interval to examine the effect of strain on the measured values. Three strain rates were used
in order 2%/h→1%/h→0.5%/h, while following the procedure described in
section 4.2.8.1 and 4.2.8.3 for recording sonic velocity and electrical resistivity.
4.4.1.1 Dependencies of strain rate on velocity measurement
Figure 4.8: Dependencies of strain rate on velocity measurement
The average value of sonic velocity is plotted in Figure 4.8 which has an uncertainty of 0.05 km/s for the compressional wave velocity and 0.1 km/s for the shear wave velocity. Within the applied strain rates all data points remain within the uncertainty range. An effect of strain rate is difficult to recognize. However, data recorded at the later stage of the experimental procedure (lower strain rate) shows a minor increasing trend. This may be due to the closing of micro-fractures due to the repetitive loadings so that the variation becomes
1
1.5
2
2.5
3
3.5
4
4.5
0 1 2 3 4 5Stress (MPa)
Ve
loci
ty (
km/s
)
RT-01
1
1.5
2
2.5
3
3.5
4
4.5
0 1 2 3 4 5Stress (MPa)
velo
city
(km
/s)
RE-24
1
1.5
2
2.5
3
3.5
4
4.5
0 1 2 3 4 5Stress (MPa)
Ve
loci
ty (
km/s
)
ST-24B
Vp-0.5 %/h Vp-1 %/h Vp-2 %/h Vs-0.5 %/h Vs-1 %/h Vs-2 %/h

55
smaller at higher stresses. Within the studied formation the influence of strain rate on different formation chalk is fairly similar.
4.4.1.2 Dependencies of strain rate on resistivity measurement
Figure 4.9: Dependency of strain rate on resistivity measurement
The average value of electrical resistivity is plotted in Figure 4.8 which has an uncertainty of 3%-5% (Table 4.5). Within the applied strain rates the variation of resistivity data at a particular stress is slightly larger than the uncertainty of the value. The variation is larger at lower stresses and tends to diminish at higher stresses. This observation is accordance with the sonic velocity measurement. However the variation is larger compared to sonic velocity as the influence of micro-cracks on electrical current flow is larger than the propagation of elastic waves. However, a variation might have occurred also due to evaporation of pore fluid as tests using three strain rates take approximately 10 hours. Therefore higher resistivity values were obtained at the later stage of the measurement
(2%/h→1%/h→0.5%/h). Within the studied formation the influence of strain rate
on different formation chalk is fairly similar.
4.4.2 Dependency of frequency on resistivity measurement
Figure 4.10: Dependency of frequency on resistivity measurement
0.001 0.1 10 1000
Frequency (KHz)
RT-01
0.001 0.1 10 1000
Frequency (KHz)
RE-24
0.1
1
10
0.001 0.1 10 1000
Frequency (KHz)
Re
sist
ivity
(o
hm
-m) ST-24B
0.1
1
10
0 1 2 3 4 5Stress (MPa)
Re
sist
ivity
(o
hm
-m) 0.5 %/h
1 %/h2 %/h
RT-01
0.1
1
10
0 1 2 3 4 5Stress (MPa)
Re
sist
ivity
(o
hm
-m) RE-24
0.1
1
10
0 1 2 3 4 5Stress (MPa)
Re
sist
ivity
(o
hm
-m) ST-24B

56
In porous rocks, the electrical field in the low frequency range causes the ions to polarize around the grains (Maxwell-Wagner polarization) and may give rise to large dipoles and to large apparent dielectric constants (Mendelson and Cohen, 1982; Chelidze and Guéguen, 1999). Therefore, rocks appear less conductive (high resistance) at low frequency. On the other hand, at higher frequency phase shift occurs. An optimal frequency of 1 kHz was used when phase shift is close to zero and lower capacitance effect is expected (Figure 4.10).
4.4.3 Precision of instrument For uncertainty calculation by the error propagation method, the following general instrumental errors were assumed for the measurements. Errors associated with each individual procedure are mentioned in section 4.2 and 4.3.
1. Diameter and length measurement by calliper: 0.1 mm 2. Weight <0.1g =0.0001g and 0.1g-100g =0.01g 3. Axial stress: 0.01 MPa Confining stress: 0.05 MPa 4. Resistance by variable resistor: 1Ω
4.4.4 Uncertainty Uncertainties calculated by the error propagation method for the most used data are presented in Table 4.5. Table 4.5: Uncertainty associated with the measurement of petrophysical properties.
Measurement Range Uncertainty
Bulk volume 37.5 mm30mm to 50 mm 1% Grain density - 0.5% Helium porosity > 20%
10-20% 1% 2%
Liquid permeability (Klinkenberg correction)
0.01-0.1 mD 0.1-1 mD > 1 mD
15% 10% 4%
Brine saturation (Archimedes method)
- 1%
Carbonate content (by titration)
>90% 75%-90%
0.5% 1%
Specific surface (BET method)
Chalk (<4 m2/g) IR (>10 m2/g)
0.2% 2.5%
P-wave velocity - 50 m/s S-wave velocity - 100 m/s Electrical resistivity < 1 Ωm
1-10 Ωm 5 % 3 %

57
4.4 Results and discussion This section contains the experimental results and a discussion of the achieved values. Discussion on the CO2 effect on chalk along with rock-mechanics test results is given in Paper IV.
4.4.1 Sample characterization Rigs-1 and SA-1 Ekofisk Formation samples contain up to 25% and 20% non-carbonate fraction respectively. By contrast Tor Formation samples from Rigs-1 and SA-1 contains less than 5% and 2% non-carbonate respectively (Table 4.6). Quartz is the dominant non-carbonate mineral in both wells. Clay minerals in the Rigs-1 samples are predominantly kaolinite whereas in SA-1 smectite dominates. Distribution of non-carbonates is recognizable in BSE images at large magnification and pores are found to be partially filled with clay in samples from Ekofisk Formation of both wells (Figure 4.11a). The Ekofisk Formation also contains considerable amounts of preserved large hollow microfossils and has carbonate wackstone or mudstone texture. The Tor Formation samples by contrast typically contain a homogeneous matrix of calcareous nannofossil debris and have carbonate wackstone or mudstone texture. Table 4.6: Physical properties of the studied interval.
Well Depth Formation Carbonate content
(%)
Sp. surface of chalk (m2/g)
Sp. surface of residue
(m2/g)
Minerals Cation Exchange Capacity (CEC)
(μEq/m2)
Before After Before After Before After Calcite IR Bulk
Rigs-1 2803.9 Ekofisk 75.9 3.88 9.6 C, Q, K 1.9 10 5.1
Rigs-1 2806.9 Ekofisk 77.9 3.74 7.9 C, Q, K 1.6 8 3.9
Rigs-1 2813.0 Ekofisk 86.4 89.0 3.77 3.4 11.9 15.0 C, Q, K 1.6 8 3.7
Rigs-1 2816.1 Ekofisk 89.7 2.93 11.2 C, Q, K 2.0 7 3.1
Rigs-1 2840.6 Tor 95.2 97.3 2.05 1.5 8.9 12.3 C, Q, K 2.4 8 2.4
Rigs-1 2844.4 Tor 96.7 1.91 9.9 C, Q, K 2.4 9 2.3
SA-1 3319.8 Ekofisk 80.8 5.50 23.4 C, Q, S 3.3 9 6.0
SA-1 3331.8 Ekofisk 80.3 6.40 34.5 C, Q, S 2.5 9 6.3
SA-1 3381.7 Tor 98.5 97.2 1.61 1.4 20.1 25.4 C, Q, S, K* 3.0 10 2.7
SA-1 3390.5 Tor 98.0 2.19 30.5 C, Q, S, K* 2.5 9 3.1
SA-1 3399.7 Tor 99.3 1.82 12.5 C, Q, S, K* 2.3 16 2.3
SA-1 3408.7 Tor 99.0 1.86 14.4 C, Q, S, K* 2.3 17 2.6
SA-1 3418.8 Tor 99.1 1.71 14.6 C, Q, S 2.5 14 2.4
SA-1 3427.7 Tor 99.7 94.5 1.70 1.4 16.6 9.5 C, Q, S 2.4 14 1.9
SA-1 3437.8 Tor 99.4 1.63 14.8 C, Q, S 2.6 17 2.4

58
Figure 4.11: Backscatter electron (BSE) micrographs of epoxy-impregnated and polished samples from the two studied formations of the wells SA-1 and Rigs-1: (a) before CO2 injection and (b) after CO2 injection. Dark is porosity and bright is calcite. Clay and quartz appear as grey as indicated with arrows. Ekofisk Formation: porosity: 32%, CaCO3: 88%, gas permeability: 0.6 mD, sp. surface: 3.5 m2/g and Tor Formation: porosity: 26%, CaCO3: 98.6%, gas permeability: 0.8 mD, sp. surface: 1.7 m2/g. All BSE images (before and after CO2 injection) is given in Appendix VII.
4.4.1 Saturation Brine saturation achieved at different stages of the tests is shown in Table 4.7. It is apparent from the brine saturation at SCO2 conditions that supercritical CO2 injection allows extraction of more oil than waterflooding alone.

59
Table 4.7: Brine saturation achieved at different stages of the geophysical tests.
Sample Sw-I Swir Sor SCO2 Sw-F
RE-22A 0.98 - - - -
RT-03 0.96 - - - -
SE-03 0.98 - - - -
ST-24A 0.98 - - - -
RE-24 0.99 0.32 0.68 0.94 0.97
RT-01 0.99 0.20 0.80 0.86 0.95
SE-05A 0.97 - - - -
ST-24B 0.98 0.30 0.70 0.82 0.93
RE-23A 0.98 0.28 - 0.69 0.90
RT-02 0.98 0.17 - 0.83 0.96
SE-02 0.93 - - - -
ST-23A 0.94 0.18 - 0.51 0.89
RE-26B2 0.99 0.28 - 0.93 -
ST-26 0.99 - - 0.84 0.93
ST-08A 0.99 - - 0.98 0.98
ST-08B 0.99 - - 0.98 0.98
4.4.3 Petrophysical properties The average porosity of Rigs-1 Ekofisk, Rigs-1 Tor, SA-1 Ekofisk and SA-1 Tor is 30%, 35%, 20% and 30% respectively (Table 4.8). The relationship between porosity and permeability is influenced by the non carbonate content as specific surface of the bulk is mostly determined by it. Due to high specific surface of Ekofisk Formation chalk, permeability is lower than Tor Formation chalk (Figure
4.12a). Kozeny permeability (kk) calculated from the specific surface (kk=c3/S2)
is less than the measured permeability. This is expected, as some fractures may open during the core retrieval process which may increase the permeability measured in core plugs. In addition, during crushing of chalk in preparation for the specific surface measurement (BET method) some grain contacts are exposed, which will be included in the measured specific surface and reduce Kozeny permeability. However, the consistent increasing trend indicates homogeneity of the tested samples (Fig. 4.12b). Due to supercritical CO2 injection an increase in porosity of 1% to 2% was observed in Ekofisk Formation samples, while the increase in Tor Formation samples is 2% to 3% (Figure 4.13a). In most cases an increase in permeability was also observed (Figure 4.13b, c).

60
Table 4.8: Physical properties of the studied samples before and after CO2 injection. Sample Diameter
(mm) Length (mm)
Grain density (g/m3)
Porosity (V/V)
Gas Permeability
(mD)
Carbonate content
(%)
Sp. surface Chalk (m2/g)
Sp. surface IR
(m2/g)
Before After Before After Before After Before After Before After
RE-22A 37.3 30.9 2.71 0.33 - 1.1 - 88 - 3.8 - 12 -
RT-03 36.8 31.3 2.71 0.42 - 4.8 - 97 - 1.9 - 10 -
SE-03 37.4 45.4 2.71 0.18 - 0.04 - 78 - 6.4 - 35 -
ST-24A 37.4 43.7 2.72 0.26 - 0.8 - 98 - 1.7 - 20 -
RE-24 37.3 38.9 2.72 0.36 0.37 0.9 0.8 88 90 3.6 3.6 12 16
RT-01 37.0 29.7 2.71 0.39 0.41 4.4 8.2 95 97 2.1 1.6 9 13
SE-05A 37.5 30.7 2.72 0.26 - 0.1 - 81 - 5.2 - 23 -
ST-24B 37.4 34.0 2.72 0.25 0.26 0.8 0.9 98 97 1.7 1.0 20 26
RE-23A 37.2 26.5 2.72 0.32 0.33 0.6 1.3 88 88 3.5 3.2 12 14
RT-02 37.1 24.8 2.72 0.35 0.36 2.3 8.2 95 97 2.1 1.3 9 11
SE-02 37.5 20.8 2.71 0.16 - 0.02 - 78 - 6.4 - 35 -
ST-23A 37.5 27.0 2.72 0.26 0.28 0.8 1.9 99 97 1.7 1.7 20 25
RE-26B2 37.5 44.3 2.71 0.29 - 0.5 - 90 - 2.9 - 11 -
ST-26 37.5 72.7 2.71 0.28 0.29 1.1 0.4 99 97 1.6 1.5 20 26
ST-08A 36.8 30.0 2.71 0.32 0.35 3.2 4.7 100 94 1.7 1.2 19 9
ST-08B 37.2 40.5 2.71 0.31 0.32 2.6 2.2 100 95 1.6 1.5 19 10
RE-14 37.4 74.8 2.701 0.31 - 0.5 - 78 - 4.7 - 8 -
RE-08B 37.4 74.9 2.698 0.32 - 0.5 - 76 - 3.9 - 10 -
RE-09B 37.4 74.7 2.694 0.30 - 0.5 - 79 - 3.6 - 10 -
RE-28A1 36.9 74.7 2.704 0.29 - 0.8 - 90 - 2.9 - 11 -
RE-31 37.3 69.4 2.707 0.29 - 0.6 - 89 - 3.2 - 11 -
RE-26B1 37.5 72.8 2.71 0.31 0.32 0.5 - 90 - 2.9 - 11 -
RE-06A 37.5 75.3 2.70 0.32 0.33 0.5 - 76 - 3.9 - 10 -
RE-12B 37.6 75.2 2.69 0.30 0.34 0.5 - 79 - 3.6 - 10 -
RE-29 37.4 75.1 2.71 0.28 0.29 0.4 - 89 - 3.2 - 11 -
RE-10A 37.5 75.2 2.70 0.31 0.31 0.5 - 79 - 3.6 - 10 -
ST-01B 38.2 74.7 2.71 0.30 - 1.8 - 99 - 1.7 - 15 -
ST-12B 37.0 75.0 2.714 0.31 - 1.6 - 99 - 1.9 - 14 -
ST-20 37.4 75.2 2.712 0.28 - 1.6 - 98 - 2.1 - 31 -
ST-17B 37.3 75.2 2.713 0.29 - 1.1 - 99 - 1.8 - 13 -
ST-25B 37.4 75.1 2.713 0.28 - 1.0 - 99 - 1.6 - 20 -
ST-03B 37.5 75.5 2.71 0.29 0.32 1.7 - 99 - 1.7 - 15 -
ST-07 37.1 74.9 2.72 0.31 0.29 2.7 - 100 - 1.6 - 19 -
ST-16B 37.5 75.2 2.72 0.28 0.29 1.2 - 99 - 1.8 - 13 -
ST-13B 37.2 75.2 2.71 0.31 0.28 2.2 - 100 - 1.9 - 14 -
ST-04B 37.5 74.9 2.71 0.28 0.31 1.3 - 99 - 1.6 - 15 -

61
Figure 4.12: (a) Variation of porosity-permeability relationship according to the specific surface (BET method). Liquid (equivalent to Klinkenberg corrected) permeability was calculated from air permeability by using (Eq. 4.10). (b) Relationship between liquid permeability and permeability calculated from porosity and specific surface (by BET method) by using Kozeny’s equation. Unfilled markers represent Ekofisk Formation and filled markers represent Tor Formation. Black markers indicate before CO2 injection and grey markers indicate after CO2 injection.
Figure 4.13: Change in physical properties due to CO2 injection, (a) porosity, (b) liquid (klinkenberg corrected) permeability, (c) equivalent liquid permeability calculated from porosity and specific surface by Kozeny’s equation. Filled data points represent Tor Formation and unfilled data points represent Ekofisk Formation.
4.4.4 Geophysical properties Compressional wave velocity, shear wave velocity and electrical resistivity measured at different stages of the experimental procedure are presented in Table 4.9. Shear wave velocity is significantly lower in saturated samples as compared to the dry samples. There is a minor increase in compressional wave velocity in the saturated Tor Formation samples and notable increase in SA-1 Ekofisk Formation samples. Unexpectedly a decrease is observed in compressional wave velocity of the Rigs-1 Ekofisk samples. There is a possibility of water weakening in these samples due to high content of kaolinite. The effect of brine saturation is
0.01
0.1
1
10
0.01 0.1 1 10
Calculated permeability (mD)
Mea
sure
d pe
rmea
bilit
y (m
D)
Rigs-1 EkofiskSA-1 EkofiskRigs-1 TorSA-1 Tor
(b)
1 m2 /g
2 m2 /g
3 m2 /g
4 m2 /g
5 m2 /g
0.01
0.1
1
10
0.15 0.25 0.35 0.45
Porosity
Liqu
id p
erm
eabi
lity
(mD
)
(a)
0.15
0.25
0.35
0.45
0.15 0.25 0.35 0.45
Porosity (before)
Por
osity
(af
ter)
(a)
0.1
1
10
0.1 1 10
Liquid perm. (mD) (Before)
Liqu
id p
erm
. (m
D)
(aft
er)
(b)
0.1
1
10
0.1 1 10
Kozeny perm. (mD) (Before)
Koz
eny
Per
m.
(mD
) (a
fter
)
(c)

62
better understood from the Vp /Vs plots (Figure 4.14b). In contrast, no marked effect of replacing brine with hydrocarbon was observed. Only SA-1 Tor Formation indicates an increase in Vp/Vs after CO2 injection. Table 4.9: Compressional and shear wave velocity as well as electrical resistivity at different experimental conditions. Data presented here were taken at 3 MPa axial stress and 1 MPa confining stress because it is the maximum stress level in a reloading cycle (minimum bedding effect under the experimental condition). Pore pressure was atmospheric for all tests.
Compressional wave velocity (km/s) Shear wave velocity (km/s) Resistivity (ohm-m)
Sample Dry-I Sw-I Swir Sor SCO2 Dry-FSw-F Dry-I Sw-I Swir Sor SCO2 Dry-FSw-F Sw-I Swir Sor SCO2 Sw-F
RE-22A 3.20 3.17 - - - - - 1.95 1.60 - - - - - 0.9 - - - -
RT-03 1.98 2.43 - - - - - 1.26 1.48 - - - - - 0.4 - - - -
SE-03 2.80 3.32 - - - - - 1.89 1.77 - - - - - 4.6 - - - -
ST-24A 3.68 3.67 - - - - - 2.23 1.97 - - - - - 1.7 - - - -
RE-24 2.80 2.86 2.75 2.82 2.74 2.59 2.78 1.84 1.43 1.40 1.47 1.48 1.77 1.35 0.7 7.7 3.2 0.8 1.0
RT-01 2.70 2.81 2.60 2.79 2.70 2.41 2.73 1.68 1.65 1.58 1.54 1.59 1.57 1.65 0.6 17.6 1.4 0.7 0.7
SE-05A 3.10 3.01 - - - - - 2.07 1.63 - - - - - 1.5 - - - -
ST-24B 4.11 4.12 3.91 3.99 3.83 3.75 3.87 2.42 2.20 2.21 2.22 2.02 2.39 2.26 1.0 14.9 1.3 1.5 1.6
RE-23A 3.29 3.28 3.07 - 3.05 2.97 3.09 1.97 1.64 1.68 - 1.54 1.81 1.68 0.5 10.5 - 1.3 1.0
RT-02 3.37 3.40 3.19 - 3.18 3.09 3.29 2.02 1.70 1.66 - 1.64 1.75 1.66 0.7 16.2 - 0.9 0.9
SE-02 2.99 3.39 - - - - - 1.99 1.54 - - - - - 3.9 - - - -
ST-23A 3.59 3.82 3.61 - 3.47 3.22 3.58 2.31 1.90 1.85 - 1.70 1.90 1.86 1.1 22.2 - 2.1 1.8
RE-26B2 - 3.30 3.26 - 3.24 - - - 1.77 1.75 - 1.76 - - 2.2 12.5 - 1.1 -
ST-26 3.55 3.54 - - 3.41 3.30 3.46 2.14 1.84 - - 1.76 2.02 1.79 - - - - 1.3
ST-08A 3.04 3.13 - - 2.99 2.51 2.97 1.91 1.66 - - 1.52 1.97 1.70 0.8 - - 0.9 0.9
ST-08B 2.84 3.02 - - 2.86 2.55 2.90 1.80 1.48 - - 1.43 1.71 1.45 - - - - -
RE-14A - 3.28 - - - - - - 1.72 - - - - - 1.6 - - - -
RE-08B 3.52 3.28 - - - - - 2.06 1.59 - - - - - 1.6 - - - -
RE-09B 3.49 3.39 - - - - - 2.05 1.85 - - - - - 1.7 - - - -
RE-28A1 - 3.30 - - - - - - 1.77 - - - - - 2.4 - - - -
RE-31 - 3.29 - - - - - - 1.65 - - - - - 2.4 - - - -
RE-26B1 - 3.21 3.11 - - - - - 1.66 1.64 - - - - 2.1 11.4 - - -
RE-06A 3.63 3.10 3.16 - - - - 2.16 1.57 1.67 - - - - 1.6 6.8 - - -
RE-12B 3.85 3.43 3.35 - - - - 2.29 1.85 1.73 - - - - 1.7 5.5 - - -
RE-29 3.63 3.33 3.23 - - - - 2.20 1.74 1.79 - - - - 2.6 13.1 - - -
RE-10A 3.77 3.34 3.30 - - - - 2.34 1.80 1.82 - - - - 1.6 5.3 - - -
ST-03B 3.35 - - - - - - 2.02 - - - - - - - - - - -
ST-07 3.13 - - - - - - 1.93 - - - - - - - - - - -
ST-16B 3.46 - - - - - - 2.11 - - - - - - - - - - -
ST-13B 3.12 - - - - - - 1.94 - - - - - - - - - - -
ST-04B 3.76 - - - - - - 2.20 - - - - - - - - - - -

63
Figure 4.14: (a) Measured velocities at different stages of the experimental procedure as defined in Table 4.2. Filled markers represent compressional wave velocity and open markers indicate shear wave velocity. (b) Ratio between compressional and shear wave velocity. Experimental stages are indicated by colors in the legend.
Figure 4.15: Biot’s coefficient calculated from sonic velocity and bulk density at different stages of the experimental procedure as defined in Table 4.2. Experimental stages are indicated by colors in the legend.
0.15 0.25 0.35 0.45
Porosity
Bio
t's c
oe
ffici
en
t
SA-1, Ekofisk0.6
0.7
0.8
0.9
1
0.15 0.25 0.35 0.45
Porosity
Bio
t's c
oe
ffici
en
t
Rigs-1, Ekofisk
0.15 0.25 0.35 0.45
Porosity
Bio
t's c
oe
ffici
en
t
SA-1, Tor0.6
0.7
0.8
0.9
1
0.15 0.25 0.35 0.45
Porosity
Bio
t's c
oe
ffici
en
t
Rigs-1, Tor
Dry-I Sw-I Swir Sor Sco2 Dry-F Sw-FInitial dry, Initial S w , S wir , S or , S co 2 , Final S wFinal dry,
0.15 0.25 0.35 0.45
Porosity
v/v s
SA-1, Ekofisk1.2
1.4
1.6
1.8
2.0
2.2
0.15 0.25 0.35 0.45
Porosity
v p/v
s
Rigs-1, Ekofisk
0.15 0.25 0.35 0.45
Porosity
v p/v
s
SA-1, Tor1.2
1.4
1.6
1.8
2.0
2.2
0.15 0.25 0.35 0.45
Porosity
v p/v
s
Rigs-1, Tor
0.15 0.25 0.35 0.45
Porosity
Vel
ocity
(km
/s) SA-1, Ekofisk
1.52.0
2.53.03.5
4.04.5
0.15 0.25 0.35 0.45
Porosity
Vel
ocity
(km
/s) Rigs-1, Ekofisk
0.15 0.25 0.35 0.45
Porosity
Vel
ocity
(km
/s) SA-1, Tor
1.52.0
2.53.03.5
4.04.5
0.15 0.25 0.35 0.45
Porosity
Vel
ocity
(km
/s) Rigs-1, Tor
Dry-I Sw-I Swir Sor Sco2 Dry-F Sw-FInitial dry, Initial S w , S wir, S or, S co2, Final S wFinal dry,
(a) (b)
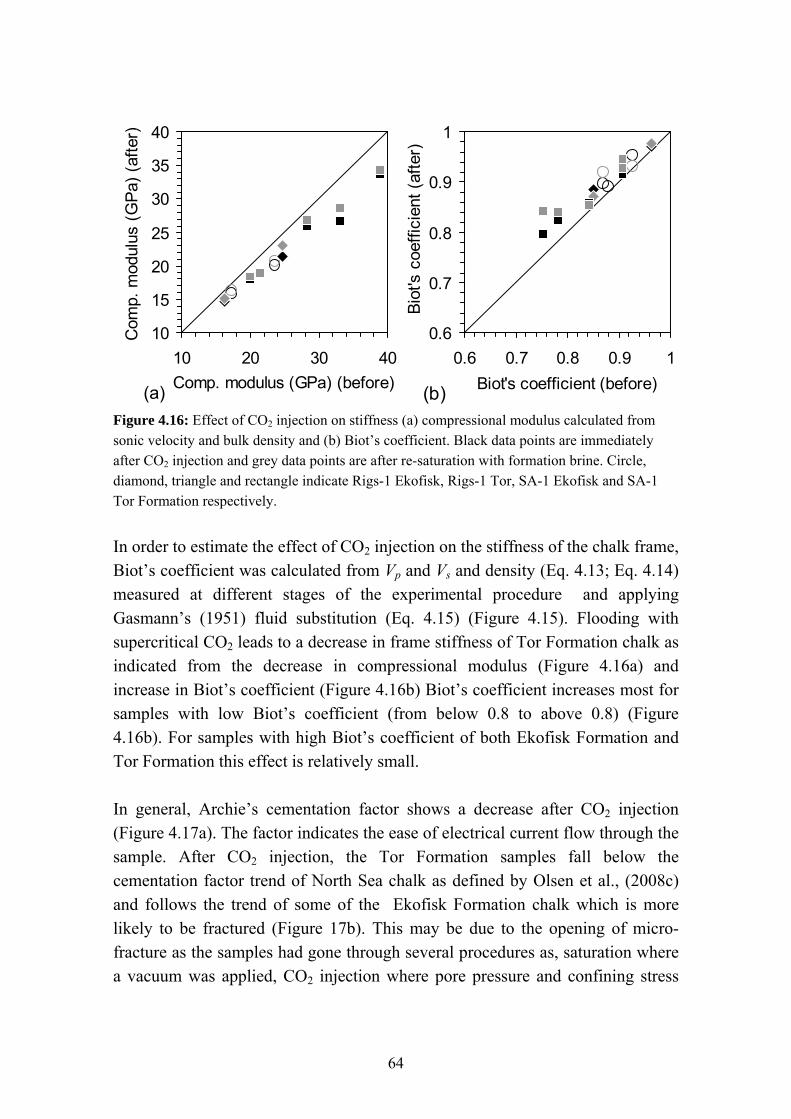
64
Figure 4.16: Effect of CO2 injection on stiffness (a) compressional modulus calculated from sonic velocity and bulk density and (b) Biot’s coefficient. Black data points are immediately after CO2 injection and grey data points are after re-saturation with formation brine. Circle, diamond, triangle and rectangle indicate Rigs-1 Ekofisk, Rigs-1 Tor, SA-1 Ekofisk and SA-1 Tor Formation respectively.
In order to estimate the effect of CO2 injection on the stiffness of the chalk frame, Biot’s coefficient was calculated from Vp and Vs and density (Eq. 4.13; Eq. 4.14) measured at different stages of the experimental procedure and applying Gasmann’s (1951) fluid substitution (Eq. 4.15) (Figure 4.15). Flooding with supercritical CO2 leads to a decrease in frame stiffness of Tor Formation chalk as indicated from the decrease in compressional modulus (Figure 4.16a) and increase in Biot’s coefficient (Figure 4.16b) Biot’s coefficient increases most for samples with low Biot’s coefficient (from below 0.8 to above 0.8) (Figure 4.16b). For samples with high Biot’s coefficient of both Ekofisk Formation and Tor Formation this effect is relatively small. In general, Archie’s cementation factor shows a decrease after CO2 injection (Figure 4.17a). The factor indicates the ease of electrical current flow through the sample. After CO2 injection, the Tor Formation samples fall below the cementation factor trend of North Sea chalk as defined by Olsen et al., (2008c) and follows the trend of some of the Ekofisk Formation chalk which is more likely to be fractured (Figure 17b). This may be due to the opening of micro-fracture as the samples had gone through several procedures as, saturation where a vacuum was applied, CO2 injection where pore pressure and confining stress
0.6
0.7
0.8
0.9
1
0.6 0.7 0.8 0.9 1
Biot's coefficient (before)
Bio
t's c
oeff
icie
nt (
afte
r)(b)
10
15
20
25
30
35
40
10 20 30 40
Comp. modulus (GPa) (before)
Com
p. m
odul
us (
GP
a) (
afte
r).
(a)
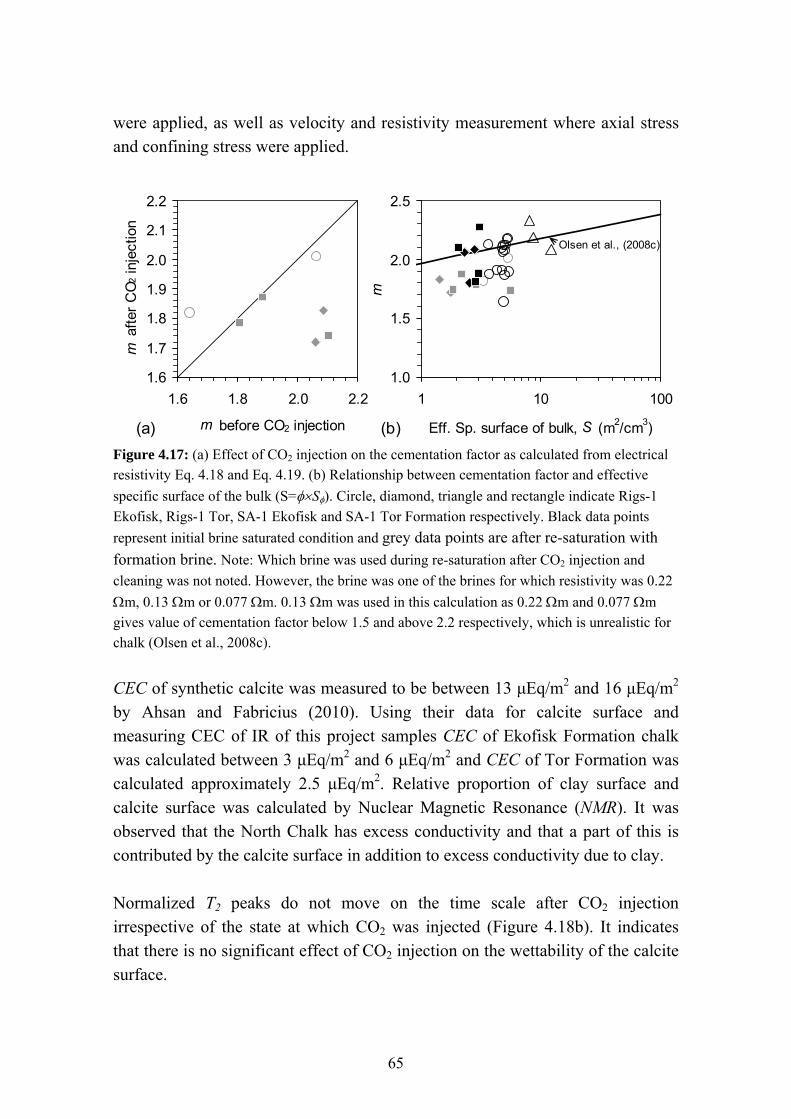
65
were applied, as well as velocity and resistivity measurement where axial stress and confining stress were applied.
Figure 4.17: (a) Effect of CO2 injection on the cementation factor as calculated from electrical resistivity Eq. 4.18 and Eq. 4.19. (b) Relationship between cementation factor and effective
specific surface of the bulk (S=S). Circle, diamond, triangle and rectangle indicate Rigs-1
Ekofisk, Rigs-1 Tor, SA-1 Ekofisk and SA-1 Tor Formation respectively. Black data points
represent initial brine saturated condition and grey data points are after re-saturation with formation brine. Note: Which brine was used during re-saturation after CO2 injection and
cleaning was not noted. However, the brine was one of the brines for which resistivity was 0.22
m, 0.13 m or 0.077 m. 0.13 m was used in this calculation as 0.22 m and 0.077 m
gives value of cementation factor below 1.5 and above 2.2 respectively, which is unrealistic for chalk (Olsen et al., 2008c).
CEC of synthetic calcite was measured to be between 13 μEq/m2 and 16 μEq/m2 by Ahsan and Fabricius (2010). Using their data for calcite surface and measuring CEC of IR of this project samples CEC of Ekofisk Formation chalk was calculated between 3 μEq/m2 and 6 μEq/m2 and CEC of Tor Formation was calculated approximately 2.5 μEq/m2. Relative proportion of clay surface and calcite surface was calculated by Nuclear Magnetic Resonance (NMR). It was observed that the North Chalk has excess conductivity and that a part of this is contributed by the calcite surface in addition to excess conductivity due to clay. Normalized T2 peaks do not move on the time scale after CO2 injection irrespective of the state at which CO2 was injected (Figure 4.18b). It indicates that there is no significant effect of CO2 injection on the wettability of the calcite surface.
1.0
1.5
2.0
2.5
1 10 100
Eff. Sp. surface of bulk, S (m2/cm3)
m
(b)
Olsen et al., (2008c)
1.6
1.7
1.8
1.9
2.0
2.1
2.2
1.6 1.8 2.0 2.2
m before CO2 injection
m a
fter
CO
2 in
ject
ion
(a)

66
Figure 4.18: NMR transverse relaxation time (T2) distribution normalized to helium porosity at (a) initial brine saturated condition with larger scanning interval, (b) initial brine saturated condition along with after CO2 injection at irreducible water saturated condition and residual water saturated condition with smaller scanning interval. Left peaks in the figures (a) represent clay bound and right peak is for calcite bound water. In figures (b) clay bound peaks were not recorded due the use of different scanning parameters in two different laboratories. For reference, same initial brine saturated (Sw-I) samples were used in both sets of experiments. The peaks in (b) does not show any significant movement along the time scale which indicates that the calcite surface does not change wettability due to CO2 injection.
SA-1, Ekofisk
0.1 1 10 100 1000
Time(ms)
No
rma
lise
d a
mp
litu
de
0
1
2
3
4
5
0.1 1 10 100 1000
Time(ms)
No
rma
lize
d a
mp
litu
de
SA-1, Ekofisk
SA-1, Tor
0.1 1 10 100 1000
Time(ms)
No
rma
lise
d a
mp
litu
de
Rigs-1, Ekofisk
0.1 1 10 100 1000
Time(ms)
No
rma
lise
d a
mp
litu
de
0
1
2
3
4
5
0.1 1 10 100 1000
Time(ms)
No
rma
lize
d a
mp
litu
de SA-1, Tor
0
1
2
3
4
5
0.1 1 10 100 1000
Time(ms)
No
rma
lize
d a
mp
litu
de Rigs-1, Ekofisk
Brine saturated condition
CO2 injected at irriducible water saturated condition
CO2 injected at residual oil saturated condition
Rigs-1, Tor
0.1 1 10 100 1000
Time(ms)
No
rma
lise
d a
mp
litu
de
0
1
2
3
4
5
0.1 1 10 100 1000
Time(ms)
No
rma
lize
d a
mp
litu
de Rigs-1, Tor
(a) (b)
No Data
No Data
No Data

67
5 Conclusions Diagenesis of chalk involves recrystallization, grain contact cementation and pore filling cementation. During the diagenetic process large pores (intra-particle) remain preserved while matrix porosity (inter-particle) decreases slowly due the increase in overburden stress as new sediments deposits. At first few hundred meters compaction dominates in reducing porosity. However, most of the porosity reduction is caused by the time (in geological scale) dependent creep stress. At deeper burial depth pore filling cementation also causes a large porosity reduction. From the rate of decrease in Biot’s coefficient it is possible to predict the diagenesis process involved in the natural porosity reduction. Biot’s coefficient decreases with the decrease of porosity. The rate of decrease is low for recrystallization and compaction and high when contact cementation is involved. Porosity reduction due to the depletion of pore fluid pressure in hydrocarbon reservoir is a fast process. Porosity reduces mainly due to the increase of effective stress in this case. Therefore, results from compaction tests rather than creep tests should be used to predict compaction in a hydrocarbon reservoir. Permeability in chalk is highly influenced by its specific surface which is mostly controlled by content of non-carbonates as clay and silica. Permeability prediction from sonic velocity can be improved by establishing and applying velocity-permeability relationship in stratigraphic units as defined by specific surface. As Tor Formation chalk is less affected by mineralogical variation, its permeability was predicted very closely to the core permeability by considering
its Sg between 2 and 7 m-1 and FZI value between 0.08 and 0.2 m. However in
the low permeable Ekofisk Formation, permeability could only be predicted within one order of magnitude of the core measured permeability. Due to the high specific surface area of the calcite particles in chalk, CEC resulting from the surface charge of calcite may influence the flow of electric current. This may lead to wrong fluid saturation calculation by using Archie’s equation. For predicting effective stress in producing hydrocarbon reservoirs, the static effective stress coefficient estimated from rock-mechanics tests is highly relevant, as it is directly related to mechanical strain in the elastic stress regime.
68
The dynamic effective stress coefficient is easy to estimate from density and velocity of acoustic (elastic) waves and cheap, however, its relationship with static value must be established based on rock-mechanics testing. It was observed that Ekofisk Formation chalk is generally less affected by the CO2 injection process compared to Tor Formation chalk. It may be due to the high content of silicates and clay which inhibit calcite dissolution. Another reason may be less exposure to CO2 during the experiment. Distribution of non-calcite particles inside the pore space of calcite matrix contribute to the high specific surface and small pore size of Ekofisk Formation. NMR transverse relaxation time, T2 is smaller in Ekofisk Formation, which indicates smaller pore size. Smaller pore size is being the primary cause for low permeability, which restricts the flow of CO2 inside pore space. Therefore less CO2 per unit surface area is available in Ekofisk Formation and the chalk may for this reason experience less calcite dissolution. Injection of supercritical CO2 leads to an increase in porosity. A decrease in specific surface area of the particles indicates that a reaction between CO2 enriched water and particles takes place which smoothens the particle surface. Accordingly, a partial effect on permeability was also seen. A decrease in stiffness, as indicated by Biot’s coefficient was observed. No significant effect on wettability as indicated by NMR T2 relaxation time was observed. Rock-mechanics testing indicates that in 30% porosity chalk from the South Arne field injection of supercritical CO2 has no significant effect on shear strength and compaction properties, while there is probably a slight decrease in stiffness properties. The time dependent properties for both Tor and Ekofisk formation does not seem to be affected by CO2 flooding in the relevant stress regime. Decrease in stiffness due to the increase of Biot’s coefficient could raise a concern on the stability of the reservoir. However effective stress on a reservoir would decrease if there is no change in pore pressure. It means that, although the rock becomes less stiff after CO2 injection it also becomes subjected to a smaller effective stress. This phenomenon might have been involved in rock-mechanics testing, as only a minor change in failure strength was observed. It suggests that a combined rock-physical and rock-mechanical model is required for failure prediction and reservoir monitoring when CO2 is involved in enhanced oil recovery and geological sequestration.

69
6 Recommendation for future work Following recommendation are made for future work
Upscaling lab data to reservoir scale
Modelling long term effects based on short term laboratory data achieved in this project.
Experimental study for long term effect of CO2 injection.
Experimental study of changes due to WAG process as brine will get more time to react with CO2 during the alternation process.
Experimental study on the dependency of injection rate.
Attenuation of sonic waves and its relation to fluid and electrical conductivity.
Both geophysical and rock-mechanics tests using higher pore pressure and temperature (up to reservoir level).

70

71
7 List of references Ahsan, R. and Fabricius, I. L., 2010, Sorption of Magnesium and Sulfate Ions on Calcite in A new spring
for geosciences: 72nd EAGE conference and exhibition, Barcelona 14-17 June 2010.
Alam, M., 2007, Effective stress coefficient and Biot's factor of chalk from Valhall: Master thesis submitted to the Department of Environment and Resources, Technical University of Denmark.
Alam, M., Christensen, H., and Fabricius, I., 2009, Effective stress coefficient and Biot's coefficient of chalk from the Valhall field, North Sea in SPE EUROPEC 2009 conference, Amsterdam, The Netherlands, 8-11 June 2009. Paper no. SPE-121795.
Alam, M. M., Borre, M. K., Fabricius, I. L., Hedegaard, K., Røgen, B., Hossain, Z., and Krogsbøll, A. S., 2010, Biot's coefficient as an indicator of strength and porosity reduction: Calcareous sediments from Kerguelen Plateau: Journal of Petroleum Science and Engineering, 70(3-4), 282-297.
Amaefule, J. O., Altunbay, M., Tiab, D., Kersey, D. G., and Keelan, D. K., 1993, Enhanced reservoir description: using core and log data to identify hydraulic (flow) units and predict permeability in uncored intervals/wells: paper SPE, 26436, 205-220.
Andersen, M. A., 1995, Petroleum research in North Sea chalk: RF-Rogaland Research, Stavanger, Norway, 174 p.
Andreassen, K. A. and Fabricius, I. L., 2010, Biot critical frequency applied to description of failure and yield of highly porous chalk with different pore fluids: Geophysics, 75(6), E205-E213.
Archie, G. E., 1942, The electrical resistivity log as an aid in determining some reservoir characteristics: Petroleum Transactions, AIME, 146(8), 54-52.
Austad, T., Matre, B., Milter, J., Saevareid, A., and Øyno, L., 1998, Chemical flooding of oil reservoirs and spontaneous oil expulsion from oil-and water-wet low permeable chalk material by imbibition of aqueous surfactant solutions: Colloids and Surfaces: A Physicochemical and Engineering Aspects, 137(1-3), 117-129.
Banthia, B. S., King, M. S., and Fatt, I., 1965, Ultrasonic shear wave velocities in rocks subjected to simulated overburden pressure and internal pore pressure: Geophysics, 30(1), 117-121.
Barkved, O. I. and Kristiansen, T., 2005, Seismic time-lapse effects and stress changes: Examples from a compacting reservoir: The Leading Edge, 24(12), 1244-1248.
Bassinot, F. C., Marsters, J. C., Mayer, L. A. and Wilkens, R. H, 1993, Variations of porosity in calcareous sediments from the Ontong Java Plateau in Berger et al., 1993, Proc. ODP, Sci. Results 130 (39), 653-661.
Batzle, M. and Wang, Z., 1992, Seismic properties of pore fluids: Geophysics, 57(11), 1396-1408.
Berner, R. A., 1975, The role of magnesium in the crystal growth of calcite and aragonite from sea water: Geochimica et Cosmochimica Acta, 39(4), 489-494.
Berryman, J. G., 1992, Effective Stress for Transport Properties of Inhomogeneous Porous Rock: J. Geophys. Res., 97(B12), 17409-17424.
Biot, M. A., 1941, General theory of three-dimensional consolidation: Journal of applied physics, 12(2), 155-164.
Biot, M. A., 1956a, Theory of Propagation of Elastic Waves in a Fluid-Saturated Porous Solid. I. Low-Frequency Range: the Journal of the Acoustical Society of America, 28(2), 168-178.

72
Biot, M. A., 1956b, Theory of Propagation of Elastic Waves in a Fluid-Saturated Porous Solid. II. Higher Frequency Range: the Journal of the Acoustical Society of America, 28(2), 179-191.
Biot, M. A. and Willis, D. G., 1957, The elastic coefficients of the theory of consolidation: J. appl. Mech, 24(4), 594-601.
Blunt, M., Fayers, F. J., and Orr Jr, F. M., 1993, Carbon dioxide in enhanced oil recovery: Energy Conversion and Management, 34(9-11), 1197-1204.
Borre, M. and Fabricius, I. L., 1998, Chemical and mechanical processes during burial diagenesis of chalk: an interpretation based on specific surface data of deep-sea sediments: Sedimentology, 45(4), 755-769.
Borre, M. K. and Fabricius, I. L., 2001, Ultrasonic velocities of water saturated chalk from the Gorm field, Danish North Sea: sensitivity to stress and applicability of Gassmann's equation: Nordic Petroleum Series V: Research in Petroleum Technology, 1-18.
Bramwell, N. P., G. Caillet, L. Meciani, N. Judge, M. Green, and P. Adam, 1999, Chalk exploration, the search for a subtle trap: Petroleum Geology of Northwest Europe: Proceedings of the 5th Conference of Geological Society, London, 911-937.
Brown, R. and Fatt, I., 1956, Measurements of fractional wettability of oil fields' rocks by the nuclear magnetic relaxation method in Fall Meeting of the Petroleum Branch of AIME, 14-17 October 1956, Los Angeles, California, Paper Number 743-G.
Brunauer, S., Emmett, P. H., and Teller, E., 1938, Adsorption of gases in multimolecular layers: Journal of the American Chemical Society, 60(2), 309-319.
Carman, P. C., 1937, Fluid flow through granular beds: Chemical Engineering Research and Design, 15(a), 150-166.
Carroll, M. M. and Katsube, N., 1983, The role of Terzaghi effective stress in linearly elastic deformation: Journal of Energy Resources Technology, 105(4), 509-511.
Chen, J., Hirasaki, G. J., and Flaum, M., 2006, NMR wettability indices: Effect of OBM on wettability and NMR responses: Journal of Petroleum Science and Engineering, 52(1-4), 161-171.
Cheng, C. H. and Johnston, D. H., 1981, Dynamic and static moduli: Geophysical Research Letters, 8(1), 39-42.
Christensen, N. I. and Wang, H. F., 1985, The influence of pore pressure and confining pressure on dynamic elastic properties of Berea sandstone: Geophysics, 50(2), 207-213.
Ciz, R., Siggins, A. F., Gurevich, B., and Dvorkin, J., 2008, Influence of microheterogeneity on effective stress law for elastic properties of rocks: Geophysics, 73(1), E7-E14.
Clavier, C., Coates, G., and Dumanoir, J., 1984, Theoretical and experimental bases for the dual-water model for interpretation of shaly sands: Old SPE Journal, 24(2), 153-168.
Coates, G. R., Xiao, L., and Prammer, M. G., 2000, NMR logging: principles and applications: Halliburton Energy Services Publication H02308.
D'Heur, M., 1984, Porosity and hydrocarbon distribution in the North Sea chalk reservoirs: Marine and Petroleum Geology, 1, 211-238.
Darcy, H., 1856, Les fontaines publiques de la ville de Dijon: Dalmont, Paris, 647 p.
Darvish, G. R., Lindeberg, E., Holt, T., and Utne, S. A., 2006, Laboratory Experiments of Tertiary CO2 injection into a Fractured Core: Paper SPE, 99649, 22-26.

73
Dunham, R.J., 1962. Classification of carbonate rocks according to depositional texture in Ham (ed) Classification of Carbonate Rocks. Memoir 1, AAPG, 108-121.
Dvorkin, J. and Nur, A., 1993, Dynamic poroelasticity: A unified model with the squirt and the Biot mechanisms: Geophysics, 58(4), 524-533.
Egermann, P., Bekri, S., and Vizika, O., 2005, An integrated approach to assess the petrophysical properties of rocks altered by rock/fluid interactions (CO2 injection) in International Symposium of the Society of Core Analysts, Toronto, Canada. Paper SCA2005-03.
Engstrøm, F., 1992, Rock mechanical properties of Danish North Sea chalk in Fourth North Sea Chalk Symposium, Deauville, France, 21-23 September.
Fabricius, I. L., 2003, How burial diagenesis of chalk sediments controls sonic velocity and porosity: AAPG Bulletin, 87(11), 1755-1778.
Fabricius, I. L., 2010, A mechanism for water weakening of elastic moduli and mechanical strength of chalk in SEG International Exposition and 80th Annual Meeting, Denver, Colorado 2010, 17-22 October 2010.
Fabricius, I. L. and Borre, M. K., 2007, Stylolites, porosity, depositional texture, and silicates in chalk facies sediments. Ontong Java Plateau-Gorm and Tyra fields, North Sea: Sedimentology, 54(1), 183-205.
Fabricius, I. L., Baechle, G., Eberli, G. P., and Weger, R., 2007a, Estimating permeability of carbonate rocks from porosity and v(p)/v(s): Geophysics, 72(5), E185-E191.
Fabricius, I. L., Hoier, C., Japsen, P., and Korsbech, U., 2007b, Modelling elastic properties of impure chalk from South Arne Field, North Sea: Geophysical Prospecting, 55(4), 487-506.
Fabricius, I. L., Bächle, G. T., and Eberli, G. P., 2010, Elastic moduli of dry and water-saturated carbonates: Effect of depositional texture, porosity and permeability: Geophysics, 75(3), N65-N78.
Fabricius, I. L., Gommesen, L., Krogsbøll, A., and Olsen, D., 2008, Chalk porosity and sonic velocity versus burial depth: Influence of fluid pressure, hydrocarbons, and mineralogy: AAPG Bulletin, 92(2), 201-223.
Ferguson, R. C., Nichols, C., Leeuwen, T. V., and Kuuskraa, V. A., 2009, Storing CO2 with enhanced oil recovery: Energy Procedia, 1(1), 1989-1996.
Fjær, E., 2009, Static and dynamic moduli of a weak sandstone: Geophysics, 74(2), WA103-WA112.
Frempong, P., Donald, A., and Butt, S. D., 2007, The effect of pore pressure depletion and injection cycles on ultrasonic velocity and quality factor in a quartz sandstone: Geophysics, 72(2), E43-E51.
Frykman, P., 2001, Spatial variability in petrophysical properties in Upper Maastrichtian chalk outcrops at Stevns Klint, Denmark: Marine and Petroleum Geology, 18(10), 1041-1062.
Gassmann, F., 1951, Elastic waves through a packing of spheres: Geophysics, 16(4), 673-685.
Geertsma, J., 1957, The effect of fluid pressure decline on volumetric changes of porous rocks: Petroleum Transactions, AIME, 210, 331-340.
Gozalpour, F., Ren, S. R., and Tohidi, B., 2005, CO2 EOR and storage in oil reservoir: Oil & Gas Science and Technology, 60(3), 537-546.
Grützner, J. and Mienert, J., 1999, Physical property changes as a monitor of pelagic carbonate diagenesis: an empirically derived diagenetic model for Atlantic Ocean basins: AAPG Bulletin, 83(9), 1485-1501.
74
Gurevich, B., 2004, A simple derivation of the effective stress coefficient for seismic velocities in porous rocks: Geophysics, 69(2), 393-397.
Hamilton, E. L., 1976, Variations of density and porosity with depth in deep-sea sediments: Journal of Sedimentary Research, 46(2), 280-300.
Han, D., Nur, A., and Morgan, D., 1986, Effects of porosity and clay content on wave velocities in sandstones: Geophysics, 51(11), 2093-2107.
Hashin, Z. and Shtrikman, S., 1963, A variational approach to the theory of the elastic behaviour of multiphase materials: Journal of the Mechanics and Physics of Solids, 11(2), 127-140.
Hawkes, C., McLellan, P., Zimmer, U., and Bachu, S., 2005, Geomechanical Factors Affecting Geological Storage of CO2 in Depleted Oil and Gas Reservoirs: Journal of Canadian Petroleum Technology, 44(10), 52-61.
Hermansson, L. and Gudmundsson, J. S., 1990, Influence of production on chalk failure in the Valhall Field in European Petroleum Conference , 21-24 October 1990, The Hague, Netherlands.
Hjuler, M. L., Christensen, H. F., and Ditlevsen, F. P., 2010, EOR through CO2 utilization: WP 1.2 Measurements of rock mechanics effects of CO2 - Rock mechanics measurements Technical report by Danish Geotechnical Institute, GEO project no 29745, 61p.
Hoefner, M. L. and Fogler, H. S., 1989, Fluid-velocity and reaction-rate effects during carbonate acidizing: application of network model: SPE Production Engineering, 4(1), 56-62.
Hornby, B. E., 2005, An experimental investigation of effective stress principles for sedimentary rocks in 6th SEG meeting, Denver, Colorado, USA.
Hsu, W. F., Li, X., and Flumerfelt, R. W., 1992, Wettability of porous media by NMR relaxation methods in 67th Annual Technical Conference and Exhibition of the Society of Petroleum Engineers, paper 24761.
Hürlimann, M. D., 1998, Effective gradients in porous media due to susceptibility differences: Journal of Magnetic Resonance, 131(2), 232-240.
Jizba, D. and Nur, A., 1990, Static and dynamic moduli of tight gas sandstones and their relation to formation properties in SPWLA 31st Annual Logging Symposium.
Kenyon, W. E., 1997, Petrophysical principles of applications of NMR logging: The Log Analyst, 38(2), 21-43.
King, M. S., 1969, Static and dynamic elastic moduli of rocks under pressure in proceedings of The 11th US Symposium on Rock Mechanics (USRMS)
Kleinberg, R. L., 1994, Pore size distributions, pore coupling, and transverse relaxation spectra of porous rocks: Magnetic resonance imaging, 12(2), 271-274.
Klimentos, T. and McCann, C., 1990, Relationships among compressional wave attenuation, porosity, clay content, and permeability in sandstones: Geophysics, 55(8), 998-1014.
Klinkenberg, L. J., 1941, The permeability of porous media to liquids and gases: Drilling and production practice, 2, 200-213.
Korsnes, R. I., Madland, M. V., Austad, T., Haver, S., and sland, R., 2008, The effects of temperature on the water weakening of chalk by seawater: Journal of Petroleum Science and Engineering, 60(3-4), 183-193.

75
Kozeny, J., 1927, Ueber kapillare Leitung des Wassers im Boden: Sitzungsberichte der Akademie der Wissenschaften in Wien, 136, 271-306.
Kristiansen, T., 1998, Geomechanical characterization of the overburden above the compacting chalk reservoir at Valhall in SPE/ISRM Rock Mechanics in Petroleum Engineering, 8-10 July 1998, Trondheim, Norway.
Kristiansen, T., Barkved, O., Buer, K., and Bakke, R., 2005, Production-induced deformations outside the reservoir and their impact on 4D seisimic in International Petroleum Technology Conference, 21-23 November 2005, Doha, Qatar.
Larsen, I., 1998, Oil and gas production in Denmark, 1998: published by Danish environment and energy ministry.
Larsen, J. K. and Fabricius, I. L., 2004, Interpretation of water saturation above the transitional zone in chalk reservoirs: SPE Reservoir Evaluation & Engineering, 7(2), 155-163.
Lind, I.L., 1993. Loading experiments on carbonate ooze and chalk from leg 130, Ontong Java plateau in Berger et al., Proc. ODP, Sci. Results 130 (41), 673-686.
Lombard, J. M., Azaroual, M., Pironon, J., Broseta, D., Egermann, P., Munier, G., and Mouronval, G., 2010, CO2 Injectivity in Geological Storages: an Overview of Program and Results of the GeoCarbone-Injectivity Project: Oil & Gas Science and Technology Review, Institut Français du Pétrole, 65(4), 533-539.
Madland, M. V., Finsnes, A., Alkafadgi, A., Risnes, R., and Austad, T., 2006, The influence of CO2 gas and carbonate water on the mechanical stability of chalk: Journal of Petroleum Science and Engineering, 51(3-4), 149-168.
Mavko, G. and Jizba, D., 1991, Estimating grain scale fluid effects on velocity dispersion in rocks: Geophysics, 56(12), 1940-1949.
Mavko G., Mukerji T., Dvorkin J., 1998. The Rock Physics Handbook: Tools for Seismic Analysis of Porous Media. The Press Syndicate of the University of Cambridge, first edition, 329 p.
Mavko G., Mukerji T., Dvorkin J., 2009. The Rock Physics Handbook: Tools for Seismic Analysis of Porous Media. The Press Syndicate of the University of Cambridge, 2nd edition, 512 p.
Mavko, G. and Vanorio, T., 2010, The influence of pore fluids and frequency on apparent effective stress behavior of seismic velocities: Geophysics, 75(1), N1-N7.
Mazzullo, J. M., Meyer, A., and Kidd, R. B., 1988, New sediment classification scheme for the Ocean Drilling Program: Handbook for shipboard sedimentologists. ODP Tech. Note, 8, 45-67.
Montmayeur, H. and Graves, R. M., 1985, Prediction of static elastic/mechanical properties of consolidated and unconsolidated sands from acoustic measurements: Basic measurements in SPE Annual Technical Conference and Exhibition, 22-26 September 1985, Las Vegas, Nevada.
Mortensen, J., Engstrom, F., and Lind, I., 1998, The relation among porosity, permeability, and specific surface of chalk from the Gorm field, Danish North Sea: SPE Reservoir Evaluation & Engineering, 1(3), 245-251.
Munns, J. W., 1985, The Valhall field: a geological overview: Marine and Petroleum Geology, 2(1), 23-43.
Nur, A. and Byerlee, J. D., 1971, An exact effective stress law for elastic deformation of rock with fluids: J. geophys. Res, 76(26), 6414-6419.

76
Nur, A., Mavko, G., Dvorkin, J., and Galmudi, D., 1998, Critical porosity; a key to relating physical properties to porosity in rocks: The Leading Edge, 17(3), 357-362.
Olsen, C., Hedegaard, K., Fabricius, I. L., and Prasad, M., 2008a, Prediction of Biot's coefficient from rock-physical modeling of North Sea chalk: Geophysics, 73(2), E89-E96.
Olsen, C., Christensen, H. F., and Fabricius, I. L., 2008b, Static and dynamic Young's moduli of chalk from the North Sea: Geophysics, 73(2), E41-E50.
Olsen, C., Hongdul, T., and Fabricius, I. L., 2008c, Prediction of Archie's cementation factor from porosity and permeability through specific surface: Geophysics, 73(2), E81-E87.
Olsen, D., 2010, CO2 IOR on North Sea Chalk: Laboratory Experiments at Reservoir Conditions in SPE EUROPEC/EAGE Annual Conference and Exhibition, 14-17 June 2010, Barcelona, Spain.
Olsen, D., 2011, CO2 EOR Production Properties of Chalk: prepared for presentation at the SPE EUROPEC/EAGE Annual Conference and Exhibition held in Vienna, Austria, 23–26 May 2011.
Omdal, E., Breivik, H., Næss, K. E., Ramos, G. G., Kristiansen, T. G., Korsnes, R. I., Hiort, A., and Madland, M. V., 2009, Experimental investigation of the effective stress coefficient for various high porosity outcrop chalks in 43rd U.S. Rock Mechanics Symposium & 4th U.S. - Canada Rock Mechanics Symposium, June 28 - July 1, 2009 , Asheville, North Carolina.
Pattillo, P. D., Kristiansen, T. G., Sund, G. V., and Kjelstadli, R. M., 1998, Reservoir compaction and seafloor subsidence at Valhall in SPE/ISRM Rock Mechanics in Petroleum Engineering, 8-10 July 1998, Trondheim, Norway.
Pierre, A., Lamarche, J. M., Mercier, R., Foissy, A., and Persello, J., 1990, Calcium as potential determining ion in aqueous calcite suspensions: Journal of dispersion science and technology, 11(6), 611-635.
Polna, T. J. and Cook, J. M., 1995, Effects of stress cycles on static and dynamic Young's moduli in Castlegate sandstone in The 35th U.S. Symposium on Rock Mechanics (USRMS), June 5 - 7, 1995, Reno, NV: Taylor & Francis.
Plummer, L. N. and Busenberg, E., 1982, The solubilities of calcite, aragonite and vaterite in CO2-H2O solutions between 0 and 90 C, and an evaluation of the aqueous model for the system CaCO3-CO2-H2O: Geochimica et Cosmochimica Acta, 46(6), 1011-1040.
Pourmohammadi, S., Hetland, S. Spildo, K., and Skauge, A., 2007, Fluid flow properties of different carbonate pore classes in SPE/EAGE Reservoir Characterization and Simulation Conference, 28-31 October 2007, Abu Dhabi, UAE, SPE 111433-MS.
Prammer, M. G., Drack, E. D., Bouton, J. C., and Gardner, J. S., 1996, Measurements of clay-bound water and total porosity by magnetic resonance logging: The Log Analyst, 37(6), 61-69
Prasad, M., 2003, Velocity-permeability relations within hydraulic units: Geophysics, 68(1), 108-117.
Prasad, M. and Dvorkin, J., 2001, Velocity to porosity transform in marine sediments: Petrophysics-Houston, 42(5), 429-437.
Prasad, M. and Manghnani, M. H., 1997, Effects of pore and differential pressure on compressional wave velocity and quality factor in Berea and Michigan sandstones: Geophysics, 62(4), 1163-1176.
Raymer, L. L., Hunt, E. R., and Gardner, J. S., 1980, An improved sonic transit time-to-porosity transform: Trans. Soc. Prof. Well Log analysts, 21st Annual Logging Synposium.

77
Reuss, A., 1929, Berechnung der Fliessgrenze von mischkristallen auf grund der plastizitätsbedingungen für Einkristalle: Zeitschrift für Angewandte Mathematik und Mechanik, 9 (1), 49-58.
Risnes, R., Madland, M. V., Hole, M., and Kwabiah, N. K., 2005, Water weakening of chalk--Mechanical effects of water-glycol mixtures: Journal of Petroleum Science and Engineering, 48(1-2), 21-36.
Røgen, B. and Fabricius, I. L., 2002, Influence of clay and silica on permeability and capillary entry pressure of chalk reservoirs in the North Sea: Petroleum Geoscience, 8(3), 287-293.
Røgen, B., Fabricius, I. L., Japsen, P., Hoier, C., Mavko, G., and Pedersen, J. M., 2005, Ultrasonic velocities of North Sea chalk samples: influence of porosity, fluid content and texture: Geophysical Prospecting, 53(4), 481-496.
Røgen, B., Gommesen, L., and Fabricius, I. L., 2001, Grain size distributions of chalk from image analysis of electron micrographs: Computers & Geosciences, 27(9), 1071-1080.
Ruddy, I., Andersen, M., Pattillo, P. D., Bishlawi, M., and Foged, N., 1989, Rock compressibility, compaction, and subsidence in a high-porosity chalk reservoir: A case study of Valhall field: Journal of Petroleum Technology, 41(7), 741-746.
Schlanger, S. O., and R. G. Douglas, 1974, The pelagic ooze-chalk-limestone transition and its implications for marine stratigraphy: in Hsu, K. J. and H. C. Jenkyns, eds., Pelagic sediments: on land and under the sea: Int. Assoc. Sedimentologists Spec. Pub. 1 , 117-148.
Scholle, P. A., 1977, Chalk diagenesis and its relation to petroleum exploration: oil from chalks, a modern miracle?: AAPG Bulletin, 61(7), 982-1009.
Shaffer, G., 2010, Long-term effectiveness and consequences of carbon dioxide sequestration: Nature Geoscience, 3, 464 - 467.
Simmons, G. and Brace, W. F., 1965, Comparison of static and dynamic measurements of compressibility of rocks: Journal of Geophysical Research, 70(22), 5649-5656.
Springer, N., Korsbech, U., and Aage, H. K., 2003, Resistivity index measurement without the porous plate: a desaturation technique based on evaporation produces uniform water saturation profiles and more reliable results for tight North Sea chalk in International Symposium of the Society of Core Analysts held in Pau, France, 21-24 September 2003.
Strand, S., Høgnesen, E. J., and Austad, T., 2006, Wettability alteration of carbonates--Effects of potential determining ions (Ca2+ and SO4
2-) and temperature: Colloids and Surfaces A: Physicochemical and Engineering Aspects, 275(1-3), 1-10.
Teeuw, D., 1971, Prediction of formation compaction from laboratory compressibility data: Old SPE Journal, 11(3), 263-271.
Terzaghi, K., 1923, Die Beziehungen zwischen Elastizitat und Innendruck: Sitzungsberichte, Akademie der Wissenschaften, K I. IIa 132(3-4), 105-121.
Teufel, L. W. and Warpinski, N. R., 1990, Laboratory determination of effective stress laws for deformation and permeability of chalk in 3rd North Sea chalk symposium, Copenhagen (Denmark), 11-12 Jun 1990: Sandia National Labs., Albuquerque, NM (USA).
Thompson, D. W. and Pownall, P. G., 1989, Surface electrical properties of calcite: Journal of colloid and interface science, 131(1), 74-82.

78
Tjetland, G., Kristiansen, T., and Buer, K., 2007, Reservoir management aspects of early waterflood response after 25 years of depletion in the Valhall Field in International Petroleum Technology Conference, Dubai, U.A.E., 4-6 December 2007.
Todd, T. and Simmons, G., 1972, Effect of pore pressure on the velocity of compressional waves in low-porosity rocks: Journal of Geophysical Research, 77(20), 3731-3743.
Tutuncu, A. N., Podio, A. L., and Sharma, M. M., 1994, Strain amplitude and stress dependence of static moduli in sandstones and limestones: Rock mechanics: Models and measurements challenges from industry, Nelson P. P. and Laubach S. E. (eds.), 489-496.
Tutuncu, A. N. and Sharma, M. M., 1992, Relating static and ultrasonic laboratory measurements to acoustic log measurements in tight gas sands in SPE Annual Technical Conference and Exhibition, 4-7 October 1992, Washington, D.C..
Valent, P.J., Altschaeffl, A.G., and Lee, H.J., 1982. Geotechnical properties of two calcareous oozes. In Demars, K.R., and Chaney, R.C. (Eds.), Geotechnical Properties, Behavior, and Performance of Calcareous Soils (ASTM Special Technical Publication), Philadelphia, PA, 79-96.
Voigt, W., 1910, Lehrbuch der kristallphysik: B.G.Terebner, Leipzig, 964p.
Wang, Z., 2000, Dynamic versus static elastic properties of reservoir rocks in Wang, Z.and Nur, A. (eds.), Seismic and acoustic velocities in reservoir rocks volume 3 Recent developments, Geophysics reprint series 19, 531-539..
Wellman, T., Grigg, R., McPherson, B., Svec, R., and Peter, C., 2003, Evaluation of CO2-Brine-Reservoir Rock Interaction with Laboratory Flow Tests and Reactive Transport Modeling in International Symposium on Oilfield Chemistry, 5-7 February 2003, Houston, Texas
Wetzel, A., 1989, Influence of heat flow on ooze/chalk cementation; quantification from consolidation parameters in DSDP sites 504 and 505 sediments: Journal of Sedimentary Research, 59(4), 539-547.
Williams, C. E. and Fling, B. M., 1982, The determination of wettability by hydrocarbons of small particles by Deuteron T1 measurement: Journal of Magnetic Resonance (1969), 50(1), 71-80.
Wolcott, J. M., Monger, T. G., Sassen, R., and Chinn, E. W., 1989, The effects of CO2 flooding on reservoir mineral properties in SPE International Symposium on Oilfield Chemistry, 8-10 February 1989, Houston, Texas.
Wyllie, M. R. J., 1960, Log interpretation in sandstone reservoirs: Geophysics, 25(4), 748-778.
Wyllie, M. R. J., Gregory, A. R., and Gardner, L. W., 1956, Elastic wave velocities in heterogeneous and porous media: Geophysics, 21(1), 41-70.
Xu, T., Apps, J. A., Pruess, K., and Yamamoto, H., 2007, Numerical modeling of injection and mineral trapping of CO2 with H2S and SO2 in a sandstone formation: Chemical Geology, 242(3-4), 319-346.
Yan, W. and Stenby, E. H. PVT Study of the South Arne 2 Reservoir Fluid: Experimental Report, Department of Chemical Engineering, Technical University of Denmark, 2010.
Yale, D. R., Nieto, J. A., and Austin, S. P., 1995, The effect of cementation on the static and dynamic mechanical properties of the Rotliegendes sandstone in The 35th U.S. Symposium on Rock Mechanics (USRMS), June 5 - 7, 1995 , Reno, NV: Taylor & Francis.

79
Yarar, B., Kitchener, J.A., 1970. Selective flocculation of minerals: 1-basic principles; 2-experimental investigation of quartz, calcite and galena: Inst. Min. Metall. Trans. Sect. C 79, 23-33.
Zhang, X. and Spiers, C. J., 2005, Compaction of granular calcite by pressure solution at room temperature and effects of pore fluid chemistry: International Journal of Rock Mechanics and Mining Sciences, 42(7-8), 950-960.
Zuta, J. and Fjelde, I., 2008, Wettability alteration due to retention of CO2-foaming agents onto chalk rock in International Symposium of the Society of Core Analysts held in Abu Dhabi, UAE 29 October -2 November, 2008.

80

81
8 Papers
I Alam, M.M., Borre, M.K., Fabricius I.L, Hedegaard, K., Røgen, B, Hossain, Z and Krogsbøll, A.S., 2010, Biot’s coefficient as an indicator of strength and porosity reduction: Calcareous sediments from Kerguelen Plateau. Journal of Petroleum Science and Engineering 70 (2010) 282-297.
II Alam, M.M., Prasad, M and Fabricius, I.L., Permeability prediction in Chalks. Accepted manuscript in AAPG Bulletin.
III Alam, M.M., Fabricius, I.L. and Christensen H.F., Static and dynamic effective stress coefficient of chalk. Submitted to Geophysics.
IV Alam, M.M., Hjuler, M.L., Christensen H.F. and Fabricius, I.L., Petrophysical and rock-mechanics effects of CO2 injection for enhanced oil recovery: chalk from South Arne field, North Sea. Submitted to Geophysical Prospecting.
V Alam, M.M., Ahsan, R., Shaik, A. K. and Fabricius, I. L., 2010, Surface charge of calcite and its influence on the electrical conductivity in chalk. Presented in the SEG International Exposition and 80th Annual Meeting, 17–22 October 2010, Denver, Colorado, USA.
VI Alam, M.M. and Fabricius, I.L., 2010, NMR as a Tool for Estimation of Excess Conductivity in Chalk. Poster presented in 72nd EAGE Conference and Exhibition, Barcelona, Spain 14-17 June 2010.
The papers are not included in this www-version, but can be obtained from the library at DTU Environment. Contact [email protected] or Department of Environmental Engineering, Technical University of Denmark, Miljoevej, Building 113, DK-2000 Kgs. Lyngby, Denmark.


Technical University of Denmark
DTU Environment
Department of Environmental Engineering
Miljoevej, building 113
DK-2800 Kgs. Lyngby
Denmark
Phone: +45 4525 1600
Fax: +45 4593 2850
e-mail: [email protected]
www.env.dtu.dk
The Department of Environmental Engineering (DTU Environment) conducts
science-based engineering research within four themes:
Water Resource Engineering, Urban Water Engineering,
Residual Resource Engineering and Environmental Chemistry & Microbiology.
Each theme hosts two to five research groups.
The department dates back to 1865, when Ludvig August Colding, the
founder of the , gave the first lecture on sanitary engineering as
response to the cholera epidemics in Copenhagen in the late 1800s.
department
ISBN 978-87-92654-32-8