rod machado's private pilot ehandbook - lacapnm.org · cdi sensitivity mode status pull turn...
TRANSCRIPT

Not everyone remembers theirfirst date, but just about every pilotremembers his or her first look insidethe trainer plane. Eyes riveted on theinstrument panel, prospective pilotstend to respond with one- or two-word expletives, followed by aswelling tide of self doubt.
That was my experience. Openingthe door of an early model Cessna150, I peeked inside the cozy, two-place trainer. I uttered the two-wordinitial response. My instructor,standing patiently nearby, was eagerto offer encouragement on this demoflight. He said, “Well, what do youthink?”
"Man, you sure can tell what timeit is with all these clocks in here!,” Isaid. “Clocks? Those aren’t clocks,those are flight instruments,” he
barked, while rapidly recalculatingthe wisdom of trying to teach me tofly. “In a very short time, they’llbecome your best friend."
Uh huh. Those instruments andthe IRS.
Well, it turned out to be true(about the instruments). If there issuch a thing as pilot–instrumentbonding, I experienced it. I learned toappreciate, respect and enjoy allthose dials on the panel, except forone—the Hobbs meter (the meterthat keeps track of how long theengine is running, and from whichthe flight school calculates how muchyou owe). Flight instruments provide you with valuable, essential informa-tion. Extracting and interpretingthat information through our fivesensory organs (OK, six, if you’re
into that theory) is the challengewe’re about to address.
Figure 1 shows the basic instru-ments found on many traditional air-plane panels. From the top left handcorner clockwise these instrumentsare: airspeed indicator, attitude indi-cator, altimeter, vertical speed indica-tor, heading indicator and turn coor-dinator Above the panel, near the topof the windscreen, you’ll also find themagnetic compass (although notalways part of the six basic instru-ment group, it’s still as important asany other instrument). Figure 2shows the basic fight instruments asthey appear on a primary flight dis-play (PFD). A PFD contains the samebasic flight instruments but presentsthem using “glass panel” technology.You can learn more about PFDs inPostflight Briefing #5-2.
SIX FLIGHT INSTRUMENTS ADVANCED GLASS COCKPIT INSTRUMENTATION
Flaps
10o
20o
30o
0
15 2025
30
35
RPMHUNDREDS
5
10 10 10
Carb TempC
20 2030 3040 40
50 50
0
0
60
0
60
AMPERES
4"5"
6"
Suctioninches of Hg
25 F / DIVOEGT
DCELEC
TURN COORDINATOR
2 MIN
NO PITCH INFORMATION
L R
.
10
100 FEET
PER MIN
100 FEET
PER MIN
VSI
DN
UP
5
0
5
15
20
1510
.
330
3
69
12
12
1518
2124
27
30
FROM
.
330
3
69
12
12
1518
21
24
27
30
FROM
OFF
TO
115.7
FREQ
MicronNav Radios
FROM
OFF
STORE
125.75
SELECT
MicroComm Radios
RECALL
OFF
STORE
125.75
SELECT
MicroComm Radios
RECALL
OFF
TO
115.7
FREQ
MicronNav Radios
FROM
TERMAPCHENRT
CDI Sensitivity Mode Status
PullTurn
PullTurn
Direct
Enter
MSG FPL OBS
DTK0
XTK
TRK0
BRG0
DISNM
Slave HSITo VOR
KLGB000
227
227
227
19.5
OBS Mode
KLGB
Menu
50
OFFSBY
WXGMAPFP
TST
MIN
GAIN
MAX
TILT+
- BRT
OFF
LXCLRSBYTST
20
10
LX
RCT
WXT
1 2 3 4 T
GCR
RCT
TCT
TRB
AZ
SCT
40
30
Lightning Detection
TIME -25-50-100-200
ACTV
ARM
APR
GPS
NAV
LEG
OBS
FD
HDG
NAV
APPR
ARM
CPLD
ALT
GS
AP
GA
FD A O M TRM
DN
UP
HDG
NAV APPR
TEST
ALT APON
FD
BC
60
90
70
80
100
110
120130140
150
160
170
180
190
200
210
220 50
40
KNOTS
230
20
20
20
20
10
10
10
10
DH
Attitude Inc.
.
1
2
3
09
8
5
7
6 4
ALT.
30.15
Murray, you cando it. There are four
pedals, two wheels &you've got six legs!Do I have to do the
math for you?
.
33N 3
6E
12
15S21
24
W30
2
2
1
1
INSETPFD CDI OBS
OAT 0 C
XPDR IDENT TMR/REF NRST ALERTS
XPDRUTCR1200 ALT 07:28:51
NAV1
NAV2
COM1
COM2
VCV
WPT ________ DIS ________NM DTK ________O TRK 346O
117.20114.00 132.575
132.250
112.70109.40 112.70
109.40
.
33 N
3
6E
12
15S21
24
W
30
NAV1
Slip-Skid indicatorAltimeter
Heading indicator
Airspeedindicator Attitude
indicatorVerticalspeed
indicator
Turn rateindicator
N 33 3036
350o
150
140
130
120
110
100
TAS KT125
125
4
4
4
4
700
600
400
300
4500
29.92 IN
20
4500
80
10 10
20 20
10 10
Attitudeindicator
Turncoordinator
Airspeedindicator
Altimeter
Vertical speedindicator
Heading Indicator
Magneticcompass
Fig. 1
Fig. 2
Page E1
Clocks, Tops & Toys
Flight Instruments:
Chapter Five
Licensed exclusively for DeWayne Britton ([email protected]) Transaction: #0002858938
You’re probably thinking, “Do youneed all these instruments to pilot aplane safely?” It’s certainly possiblefor a more experienced pilot to flyvisually and by feel while looking outthe window. This, of course, is donein visual meteorological conditions(VMC), when weather permits visibil-ity above certain minimums specifiedin the rules. These instruments, how-ever, make it much easier for you tomaneuver the airplane precisely.
Where the flight instruments real-ly earn their keep, though, is ininstrument meteorological conditions(IMC), otherwise known as clouds.While you shouldn’t be in the cloudswithout an instrument rating (anadvanced license), these six instru-ments can help save your baconshould you accidentally fly into acloud (all student pilots learn how toextricate themselves from this situa-tion during their private pilot flighttraining).
All six flight instruments, each inits own way, provides you with infor-mation on three things: airspeed,height and attitude.
Airspeed is a measurement of theairplane’s velocity through the air.The altimeter and vertical speed indi-cator provide information about yourheight above sea level as well as howfast your height is changing. Theheading indicator, turn coordinatorand attitude indicator provide infor-mation on the airplane’s attitude(i.e., the degree of nose-up or downpitch, as well as the amount the air-plane is banked).
Flight instruments will talk to you,if you let them. They speak a distinc-tive language, and the ability to hearand interpret it quickly and correctlyis an important pilot skill. To flywithout understanding your flightinstruments is very uncomfortable,and potentially dangerous. It’s likethe proverb that says, “One day thelion and the lamb shall lie downtogether.” Maybe, but you can besure the lamb won’t get much sleep.
It’s time to learn to speak the lan-guage of the panel. Let’s start ourexamination with the non-gyroscopicinstruments.
Non-Gyro Instruments
Airspeed IndicatorThe airspeed indicator is a wind
indicator. It tells you the amount ofwind blowing over the wings of yourairplane as a result of the airplane’smovement. Such information is use-ful for several reasons. First, withsufficient airspeed, the airplane willfly. The airspeed indicator, then, letsyou know when it’s safe to point thenose upward during the takeoff.Second, the airspeed indicator letsyou know when you’re above orbelow any of the airplane’s criticalspeeds (i.e., the stall speed, maximumflap speed, maximum gear speed,never exceed speed, etc.).
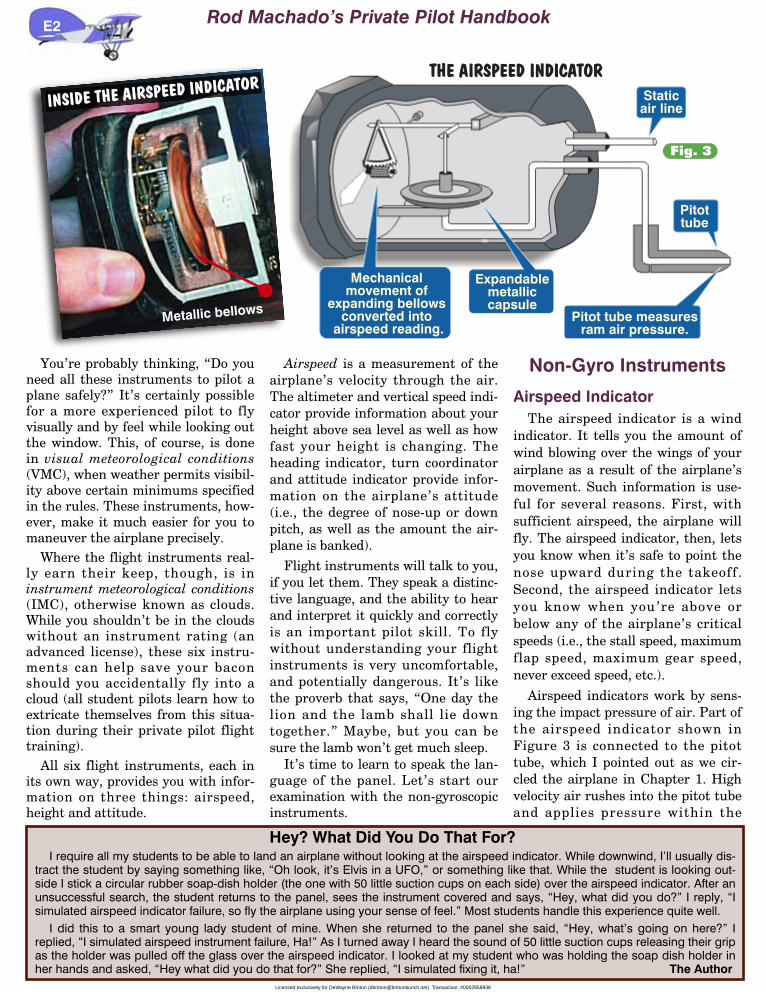
Airspeed indicators work by sens-ing the impact pressure of air. Part ofthe airspeed indicator shown inFigure 3 is connected to the pitottube, which I pointed out as we cir-cled the airplane in Chapter 1. Highvelocity air rushes into the pitot tubeand applies pressure within the
E2
Pitottube
Staticair line
Expandablemetalliccapsule
Pitot tube measuresram air pressure.
Mechanicalmovement of
expanding bellowsconverted into
airspeed reading.
THE AIRSPEED INDICATOR
Fig. 3
Metallic bellows
Hey? What Did You Do That For?I require all my students to be able to land an airplane without looking at the airspeed indicator. While downwind, I’ll usually dis-
tract the student by saying something like, “Oh look, it’s Elvis in a UFO,” or something like that. While the student is looking out-side I stick a circular rubber soap-dish holder (the one with 50 little suction cups on each side) over the airspeed indicator. After anunsuccessful search, the student returns to the panel, sees the instrument covered and says, “Hey, what did you do?” I reply, “Isimulated airspeed indicator failure, so fly the airplane using your sense of feel.” Most students handle this experience quite well.
I did this to a smart young lady student of mine. When she returned to the panel she said, “Hey, what’s going on here?” Ireplied, “I simulated airspeed instrument failure, Ha!” As I turned away I heard the sound of 50 little suction cups releasing their gripas the holder was pulled off the glass over the airspeed indicator. I looked at my student who was holding the soap dish holder inher hands and asked, “Hey what did you do that for?” She replied, “I simulated fixing it, ha!” The Author
INSIDE THE AIRSPEED INDICATOR
Rod Machado’s Private Pilot Handbook
Licensed exclusively for DeWayne Britton ([email protected]) Transaction: #0002858938
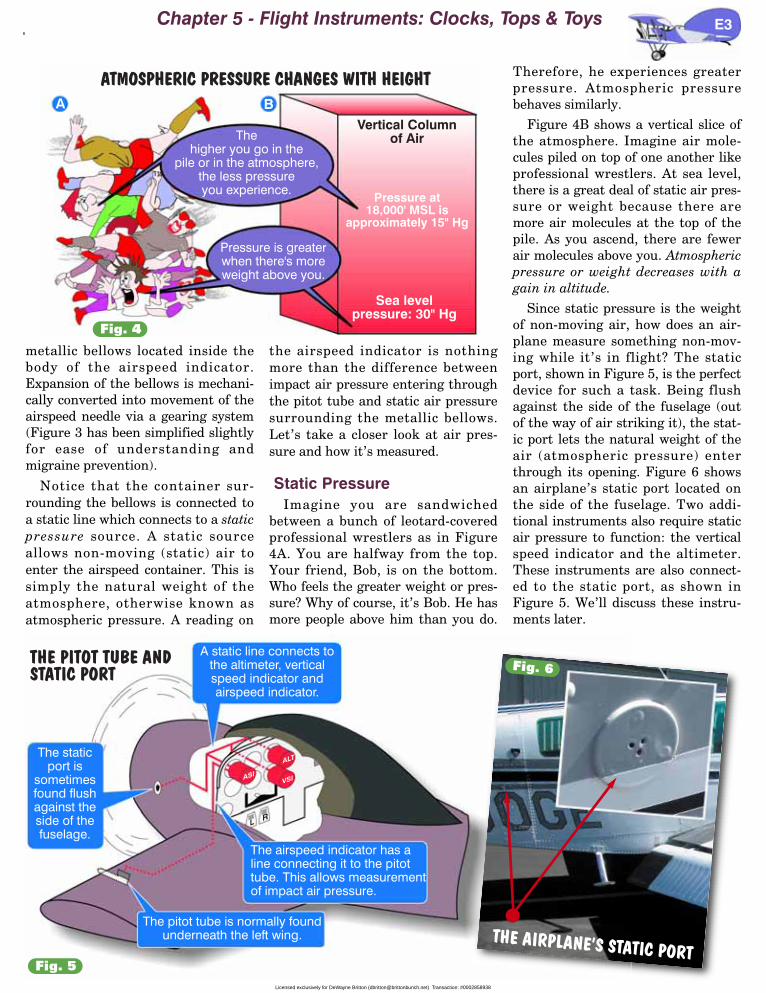
metallic bellows located inside thebody of the airspeed indicator.Expansion of the bellows is mechani-cally converted into movement of theairspeed needle via a gearing system(Figure 3 has been simplified slightlyfor ease of understanding andmigraine prevention).
Notice that the container sur-rounding the bellows is connected toa static line which connects to a staticpressure source. A static sourceallows non-moving (static) air toenter the airspeed container. This issimply the natural weight of theatmosphere, otherwise known asatmospheric pressure. A reading on
the airspeed indicator is nothingmore than the difference betweenimpact air pressure entering throughthe pitot tube and static air pressuresurrounding the metallic bellows.Let’s take a closer look at air pres-sure and how it’s measured.
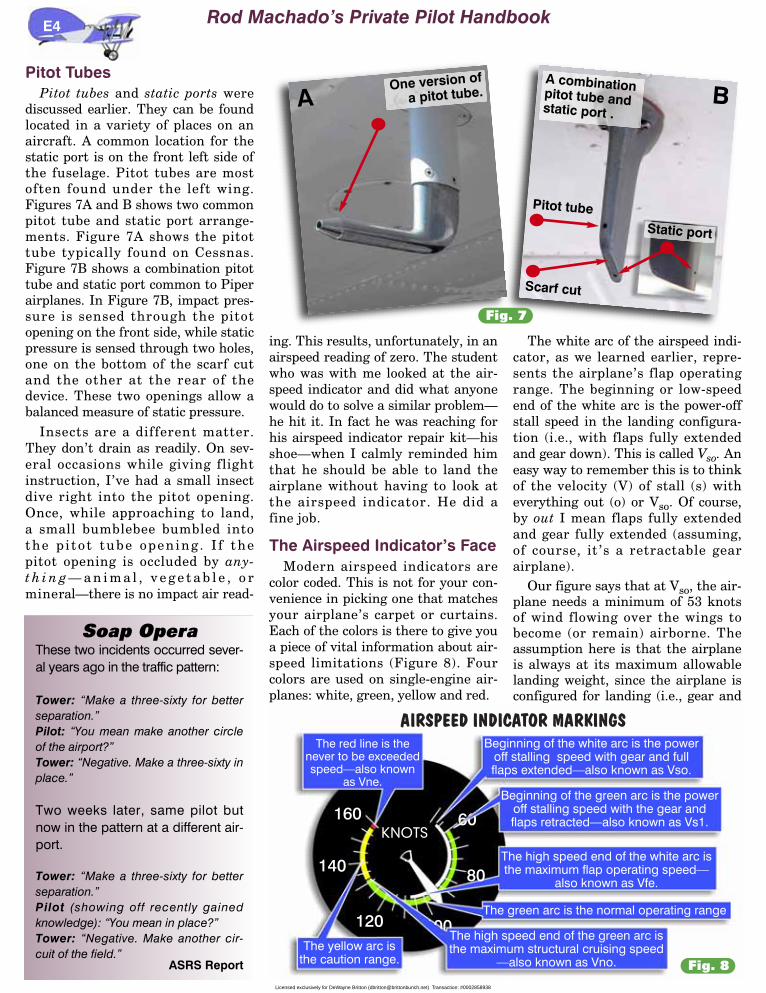
Static PressureImagine you are sandwiched
between a bunch of leotard-coveredprofessional wrestlers as in Figure4A. You are halfway from the top.Your friend, Bob, is on the bottom.Who feels the greater weight or pres-sure? Why of course, it’s Bob. He hasmore people above him than you do.
Therefore, he experiences greaterpressure. Atmospheric pressurebehaves similarly.
Figure 4B shows a vertical slice ofthe atmosphere. Imagine air mole-cules piled on top of one another likeprofessional wrestlers. At sea level,there is a great deal of static air pres-sure or weight because there aremore air molecules at the top of thepile. As you ascend, there are fewerair molecules above you. Atmosphericpressure or weight decreases with again in altitude.
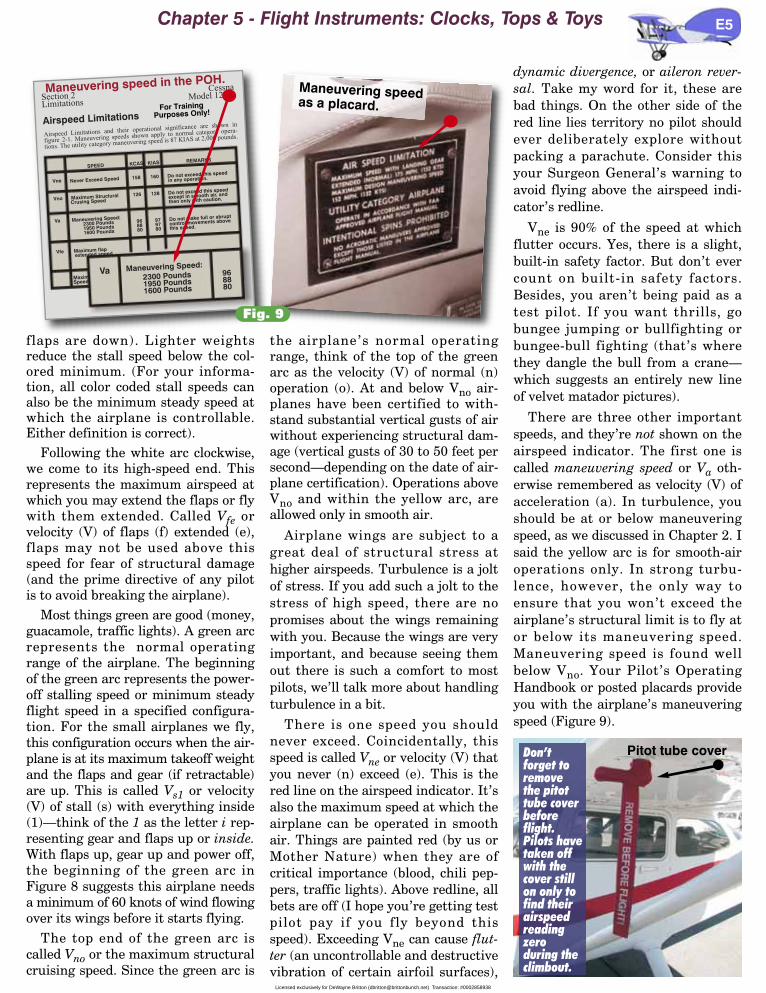
Since static pressure is the weightof non-moving air, how does an air-plane measure something non-mov-ing while it’s in flight? The staticport, shown in Figure 5, is the perfectdevice for such a task. Being flushagainst the side of the fuselage (outof the way of air striking it), the stat-ic port lets the natural weight of theair (atmospheric pressure) enterthrough its opening. Figure 6 showsan airplane’s static port located onthe side of the fuselage. Two addi-tional instruments also require staticair pressure to function: the verticalspeed indicator and the altimeter.These instruments are also connect-ed to the static port, as shown inFigure 5. We’ll discuss these instru-ments later.
Chapter 5 - Flight Instruments: Clocks, Tops & Toys
Sea levelpressure: 30" Hg
Pressure at18,000' MSL is
approximately 15" Hg
Vertical Columnof AirThe
higher you go in thepile or in the atmosphere,
the less pressureyou experience.
Pressure is greaterwhen there's moreweight above you.
ATMOSPHERIC PRESSURE CHANGES WITH HEIGHTA B
Fig. 4
L R
ALT
VSIASI
THE PITOT TUBE ANDSTATIC PORT
A static line connects tothe altimeter, verticalspeed indicator andairspeed indicator.
The airspeed indicator has aline connecting it to the pitottube. This allows measurementof impact air pressure.
The pitot tube is normally foundunderneath the left wing.
The staticport is
sometimesfound flushagainst theside of thefuselage.
Fig. 5
THE AIRPLANE’S STATIC PORT
E3
Fig. 6
Licensed exclusively for DeWayne Britton ([email protected]) Transaction: #0002858938
Pitot TubesPitot tubes and static ports were
discussed earlier. They can be foundlocated in a variety of places on anaircraft. A common location for thestatic port is on the front left side ofthe fuselage. Pitot tubes are mostoften found under the left wing.Figures 7A and B shows two commonpitot tube and static port arrange-ments. Figure 7A shows the pitottube typically found on Cessnas.Figure 7B shows a combination pitottube and static port common to Piperairplanes. In Figure 7B, impact pres-sure is sensed through the pitotopening on the front side, while staticpressure is sensed through two holes,one on the bottom of the scarf cutand the other at the rear of thedevice. These two openings allow abalanced measure of static pressure.
Insects are a different matter.They don’t drain as readily. On sev-eral occasions while giving flightinstruction, I’ve had a small insectdive right into the pitot opening.Once, while approaching to land,a small bumblebee bumbled intothe p i to t tube open ing . I f thepitot opening is occluded by any-t h i n g — a n i m a l , v e g e t a b l e , o rmineral—there is no impact air read-
ing. This results, unfortunately, in anairspeed reading of zero. The studentwho was with me looked at the air-speed indicator and did what anyonewould do to solve a similar problem—he hit it. In fact he was reaching forhis airspeed indicator repair kit—hisshoe—when I calmly reminded himthat he should be able to land theairplane without having to look atthe airspeed indicator. He did afine job.
The Airspeed Indicator’s FaceModern airspeed indicators are
color coded. This is not for your con-venience in picking one that matchesyour airplane’s carpet or curtains.Each of the colors is there to give youa piece of vital information about air-speed limitations (Figure 8). Fourcolors are used on single-engine air-planes: white, green, yellow and red.
The white arc of the airspeed indi-cator, as we learned earlier, repre-sents the airplane’s flap operatingrange. The beginning or low-speedend of the white arc is the power-offstall speed in the landing configura-tion (i.e., with flaps fully extendedand gear down). This is called Vso. Aneasy way to remember this is to thinkof the velocity (V) of stall (s) witheverything out (o) or Vso. Of course,by out I mean flaps fully extendedand gear fully extended (assuming,of course, it’s a retractable gearairplane).
Our figure says that at Vso, the air-plane needs a minimum of 53 knotsof wind flowing over the wings tobecome (or remain) airborne. Theassumption here is that the airplaneis always at its maximum allowablelanding weight, since the airplane isconfigured for landing (i.e., gear and
E4
Pitot tube
Scarf cut
Fig. 7
A B
.
120
140
160
80
KNOTS
Beginning of the white arc is the poweroff stalling speed with gear and fullflaps extended also known as Vso.—
Beginning of the green arc is the poweroff stalling speed with the gear andflaps retracted also known as Vs1.—
The high speed end of the white arc isthe maximum flap operating speed
also known as Vfe.—
The high speed end of the green arc isthe maximum structural cruising speed
also known as Vno.—
The green arc is the normal operating range
The yellow arc isthe caution range.
The red line is thenever to be exceededspeed—also known
as Vne.
AIRSPEED INDICATOR MARKINGS
Fig. 8
Soap OperaThese two incidents occurred sever-al years ago in the traffic pattern:
Tower: “Make a three-sixty for betterseparation.”Pilot: “You mean make another circleof the airport?”Tower: “Negative. Make a three-sixty inplace.”
Two weeks later, same pilot butnow in the pattern at a different air-port.
Tower: “Make a three-sixty for betterseparation.”Pilot (showing off recently gainedknowledge): “You mean in place?”Tower: “Negative. Make another cir-cuit of the field.”
ASRS Report
Static port
One version of
a pitot tube.A combinationpitot tube andstatic port .
Rod Machado’s Private Pilot Handbook
Licensed exclusively for DeWayne Britton ([email protected]) Transaction: #0002858938
flaps are down). Lighter weightsreduce the stall speed below the col-ored minimum. (For your informa-tion, all color coded stall speeds canalso be the minimum steady speed atwhich the airplane is controllable.Either definition is correct).
Following the white arc clockwise,we come to its high-speed end. Thisrepresents the maximum airspeed atwhich you may extend the flaps or flywith them extended. Called Vfe orvelocity (V) of flaps (f) extended (e),flaps may not be used above thisspeed for fear of structural damage(and the prime directive of any pilotis to avoid breaking the airplane).
Most things green are good (money,guacamole, traffic lights). A green arcrepresents the normal operatingrange of the airplane. The beginningof the green arc represents the power-off stalling speed or minimum steadyflight speed in a specified configura-tion. For the small airplanes we fly,this configuration occurs when the air-plane is at its maximum takeoff weightand the flaps and gear (if retractable)are up. This is called Vs1 or velocity(V) of stall (s) with everything inside(1)—think of the 1 as the letter i rep-resenting gear and flaps up or inside.With flaps up, gear up and power off,the beginning of the green arc inFigure 8 suggests this airplane needsa minimum of 60 knots of wind flowingover its wings before it starts flying.
The top end of the green arc iscalled Vno or the maximum structuralcruising speed. Since the green arc is
the airplane’s normal operatingrange, think of the top of the greenarc as the velocity (V) of normal (n)operation (o). At and below Vno air-planes have been certified to with-stand substantial vertical gusts of airwithout experiencing structural dam-age (vertical gusts of 30 to 50 feet persecond—depending on the date of air-plane certification). Operations aboveVno and within the yellow arc, areallowed only in smooth air.
Airplane wings are subject to agreat deal of structural stress athigher airspeeds. Turbulence is a joltof stress. If you add such a jolt to thestress of high speed, there are nopromises about the wings remainingwith you. Because the wings are veryimportant, and because seeing themout there is such a comfort to mostpilots, we’ll talk more about handlingturbulence in a bit.
There is one speed you shouldnever exceed. Coincidentally, thisspeed is called Vne or velocity (V) thatyou never (n) exceed (e). This is thered line on the airspeed indicator. It’salso the maximum speed at which theairplane can be operated in smoothair. Things are painted red (by us orMother Nature) when they are ofcritical importance (blood, chili pep-pers, traffic lights). Above redline, allbets are off (I hope you’re getting testpilot pay if you fly beyond thisspeed). Exceeding Vne can cause flut-ter (an uncontrollable and destructivevibration of certain airfoil surfaces),
dynamic divergence, or aileron rever-sal. Take my word for it, these arebad things. On the other side of thered line lies territory no pilot shouldever deliberately explore withoutpacking a parachute. Consider thisyour Surgeon General’s warning toavoid flying above the airspeed indi-cator’s redline.
Vne is 90% of the speed at whichflutter occurs. Yes, there is a slight,built-in safety factor. But don’t evercount on built-in safety factors.Besides, you aren’t being paid as atest pilot. If you want thrills, gobungee jumping or bullfighting orbungee-bull fighting (that’s wherethey dangle the bull from a crane—which suggests an entirely new lineof velvet matador pictures).
There are three other importantspeeds, and they’re not shown on theairspeed indicator. The first one iscalled maneuvering speed or Va oth-erwise remembered as velocity (V) ofacceleration (a). In turbulence, youshould be at or below maneuveringspeed, as we discussed in Chapter 2. Isaid the yellow arc is for smooth-airoperations only. In strong turbu-lence, however, the only way toensure that you won’t exceed theairplane’s structural limit is to fly ator below its maneuvering speed.Maneuvering speed is found wellbelow Vno. Your Pilot’s OperatingHandbook or posted placards provideyou with the airplane’s maneuveringspeed (Figure 9).
Chapter 5 - Flight Instruments: Clocks, Tops & Toys E5
Section 2Limitations
Airspeed Limitations and their operational significance are shown in
figure 2-1. Maneuvering speeds shown apply to normal category opera-
tions. The utility category maneuvering speed is 87 KIAS at 2,000 pounds.
CessnaModel 127N
Airspeed Limitations
SPEED KCAS KIAS REMARKS
Vne
Vno Maximum Structural 126 128 Do not exceed this speed
Crusing Speedexcept in smooth air, and
then only with caution.
Va Maneuvering Speed:
2300 Pounds 96 97 Do not make full or abrupt
1950 Pounds 88 97 control movements above
1600 Pounds 80 80 this speed.
Vfe Maximum flap
extended speed
Never Exceed Speed 158 160 Do not exceed this speed
in any operation.
Maxim
Speed
Va Maneuvering Speed:
2300 Pounds 96
1950 Pounds 88
1600 Pounds 80
Fig. 9
Maneuvering speed in the POH.
For TrainingPurposes Only!
Don’tforget toremovethe pitottube coverbeforeflight.Pilots havetaken offwith thecover stillon only tofind theirairspeedreadingzeroduring theclimbout.
Pitot tube cover
Maneuvering speedas a placard.
Licensed exclusively for DeWayne Britton ([email protected]) Transaction: #0002858938
E6
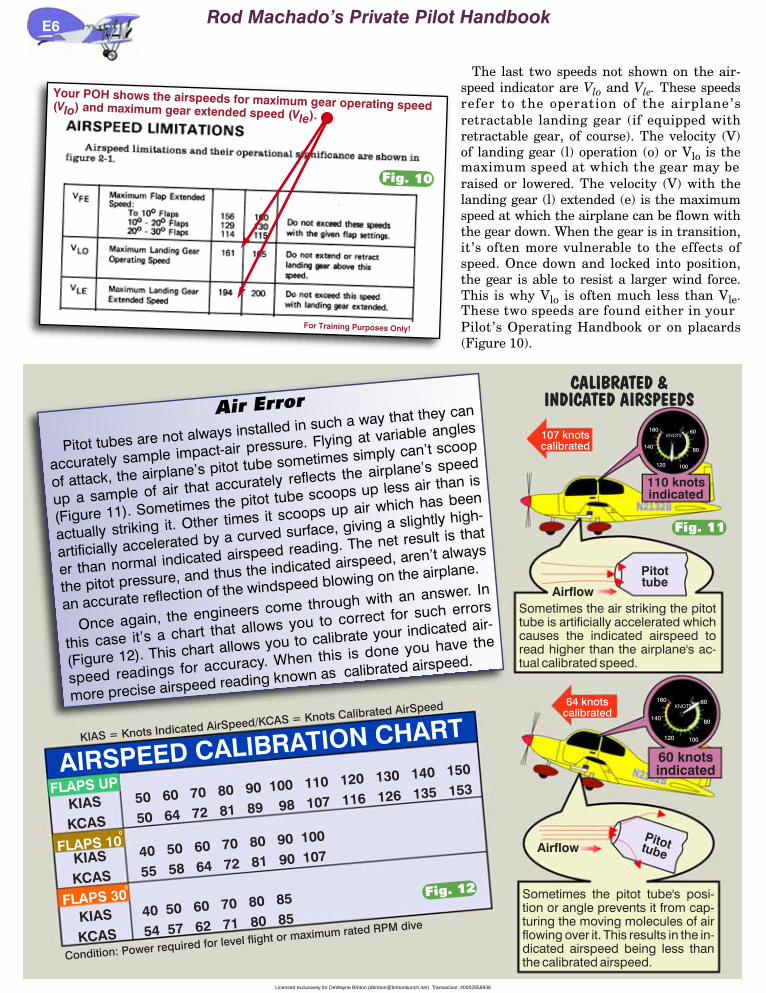
The last two speeds not shown on the air-speed indicator are Vlo and Vle. These speedsrefer to the operation of the airplane’s retractable landing gear (if equipped withretractable gear, of course). The velocity (V)of landing gear (l) operation (o) or Vlo is the maximum speed at which the gear may be raised or lowered. The velocity (V) with thelanding gear (l) extended (e) is the maximumspeed at which the airplane can be flown withthe gear down. When the gear is in transition,it’s often more vulnerable to the effects ofspeed. Once down and locked into position,the gear is able to resist a larger wind force.This is why Vlo is often much less than Vle.These two speeds are found either in yourPilot’s Operating Handbook or on placards(Figure 10).
Your POH shows the airspeeds for maximum gear operating speed(Vlo) and maximum gear extended speed (Vle).
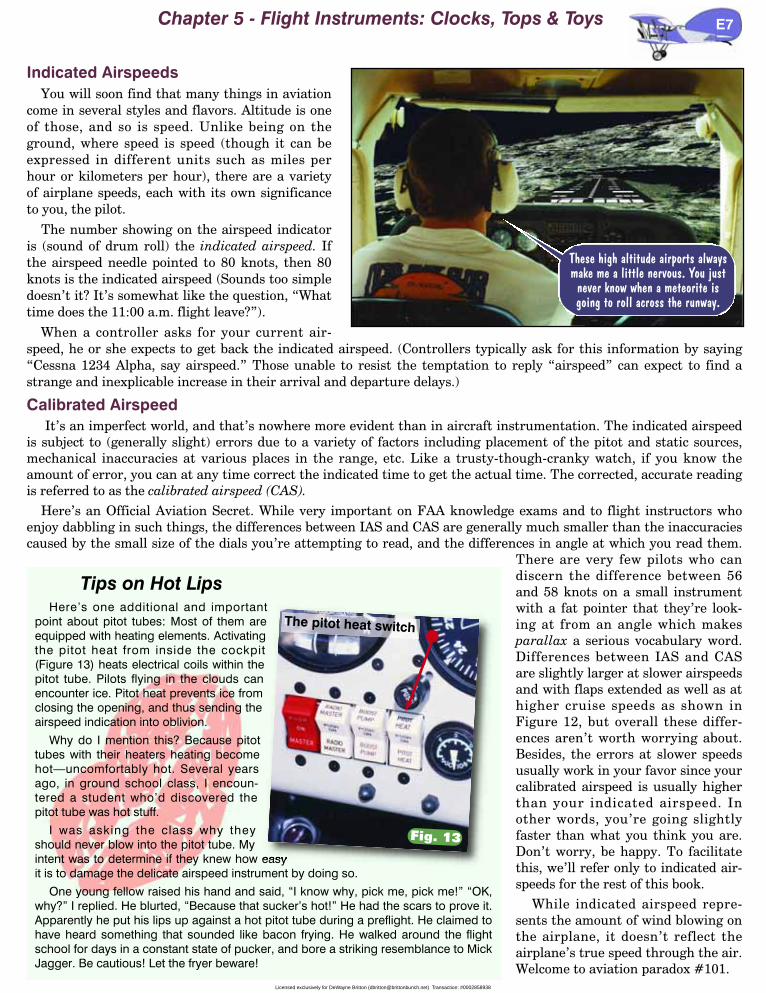
AIRSPEED CALIBRATION CHART
FLAPS UP
KIAS
KCAS
KIAS = Knots Indicated AirSpeed/KCAS = Knots Calibrated AirSpeed
KIAS
KCAS
KIAS
KCAS
FLAPS 10
FLAPS 30
0
0
50 60 70 80 90 100 110 120 130 140 150
50 64 72 81 89 98 107 116 126 135 153
40 50 60 70 80 90 100
55 58 64 72 81 90 107
40 50 60 70 80 85
54 57 62 71 80 85
Condition: Power required for level flight or maximum rated RPM dive
CALIBRATED &INDICATED AIRSPEEDS
Airflow
AirflowSometimes the air striking the pitottube is artificially accelerated whichcauses the indicated airspeed toread higher than the airplane's ac-tual calibrated speed.
Sometimes the pitot tube's posi-tion or angle prevents it from cap-turing the moving molecules of airflowing over it. This results in the in-dicated airspeed being less thanthe calibrated airspeed.
Pitottube
Pitottube
107 knots
calibrated
64 knots
calibrated
110 knotsindicated
.
60
100120
140
160
80
KNOTS
60 knotsindicated
.
60
100120
140
160
80
KNOTS
Fig. 11
Fig. 12
Air Error
Pitot tubes are not always installed in such a way that they can
accurately sample impact-air pressure. Flying at variable angles
of attack, the airplane’s pitot tube sometimes simply can’t scoop
up a sample of air that accurately reflects the airplane’s speed
(Figure 11). Sometimes the pitot tube scoops up less air than is
actually striking it. Other times it scoops up air which has been
artificially accelerated by a curved surface, giving a slightly high-
er than normal indicated airspeed reading. The net result is that
the pitot pressure, and thus the indicated airspeed, aren’t always
an accurate reflection of the windspeed blowing on the airplane.
Once again, the engineers come through with an answer. In
this case it’s a chart that allows you to correct for such errors
(Figure 12). This chart allows you to calibrate your indicated air-
speed readings for accuracy. When this is done you have the
more precise airspeed reading known as calibrated airspeed.
Fig. 10
For Training Purposes Only!
Rod Machado’s Private Pilot Handbook
Licensed exclusively for DeWayne Britton ([email protected]) Transaction: #0002858938
Indicated AirspeedsYou will soon find that many things in aviation
come in several styles and flavors. Altitude is oneof those, and so is speed. Unlike being on theground, where speed is speed (though it can beexpressed in different units such as miles perhour or kilometers per hour), there are a varietyof airplane speeds, each with its own significanceto you, the pilot.
The number showing on the airspeed indicatoris (sound of drum roll) the indicated airspeed. Ifthe airspeed needle pointed to 80 knots, then 80knots is the indicated airspeed (Sounds too simpledoesn’t it? It’s somewhat like the question, “Whattime does the 11:00 a.m. flight leave?”).
When a controller asks for your current air-speed, he or she expects to get back the indicated airspeed. (Controllers typically ask for this information by saying“Cessna 1234 Alpha, say airspeed.” Those unable to resist the temptation to reply “airspeed” can expect to find astrange and inexplicable increase in their arrival and departure delays.)
Calibrated AirspeedIt’s an imperfect world, and that’s nowhere more evident than in aircraft instrumentation. The indicated airspeed
is subject to (generally slight) errors due to a variety of factors including placement of the pitot and static sources,mechanical inaccuracies at various places in the range, etc. Like a trusty-though-cranky watch, if you know theamount of error, you can at any time correct the indicated time to get the actual time. The corrected, accurate readingis referred to as the calibrated airspeed (CAS).
Here’s an Official Aviation Secret. While very important on FAA knowledge exams and to flight instructors whoenjoy dabbling in such things, the differences between IAS and CAS are generally much smaller than the inaccuraciescaused by the small size of the dials you’re attempting to read, and the differences in angle at which you read them.
There are very few pilots who candiscern the difference between 56and 58 knots on a small instrumentwith a fat pointer that they’re look-ing at from an angle which makesparallax a serious vocabulary word.Differences between IAS and CASare slightly larger at slower airspeedsand with flaps extended as well as athigher cruise speeds as shown inFigure 12, but overall these differ-ences aren’t worth worrying about.Besides, the errors at slower speedsusually work in your favor since yourcalibrated airspeed is usually higherthan your indicated airspeed. Inother words, you’re going slightlyfaster than what you think you are.Don’t worry, be happy. To facilitatethis, we’ll refer only to indicated air-speeds for the rest of this book.
While indicated airspeed repre-sents the amount of wind blowing onthe airplane, it doesn’t reflect theairplane’s true speed through the air.Welcome to aviation paradox #101.
Chapter 5 - Flight Instruments: Clocks, Tops & Toys E7
These high altitude airports alwaysmake me a little nervous. You justnever know when a meteorite isgoing to roll across the runway.
Tips on Hot LipsHere’s one additional and important
point about pitot tubes: Most of them areequipped with heating elements. Activatingthe pitot heat from inside the cockpit(Figure 13) heats electrical coils within thepitot tube. Pilots flying in the clouds canencounter ice. Pitot heat prevents ice fromclosing the opening, and thus sending theairspeed indication into oblivion.
Why do I mention this? Because pitottubes with their heaters heating becomehot—uncomfortably hot. Several yearsago, in ground school class, I encoun-tered a student who’d discovered thepitot tube was hot stuff.
I was asking the class why theyshould never blow into the pitot tube. Myintent was to determine if they knew how easyit is to damage the delicate airspeed instrument by doing so.
One young fellow raised his hand and said, “I know why, pick me, pick me!” “OK,why?” I replied. He blurted, “Because that sucker’s hot!” He had the scars to prove it.Apparently he put his lips up against a hot pitot tube during a preflight. He claimed tohave heard something that sounded like bacon frying. He walked around the flightschool for days in a constant state of pucker, and bore a striking resemblance to MickJagger. Be cautious! Let the fryer beware!
Fig. 13
The pitot heat switch
Licensed exclusively for DeWayne Britton ([email protected]) Transaction: #0002858938
True AirspeedIndicated airspeed isn’t the true
airspeed (TAS).While I promise to always tell you
the truth, the airspeed indicator isincapable of such a promise. It’s alsoincapable of such a performance,through no fault of its own.
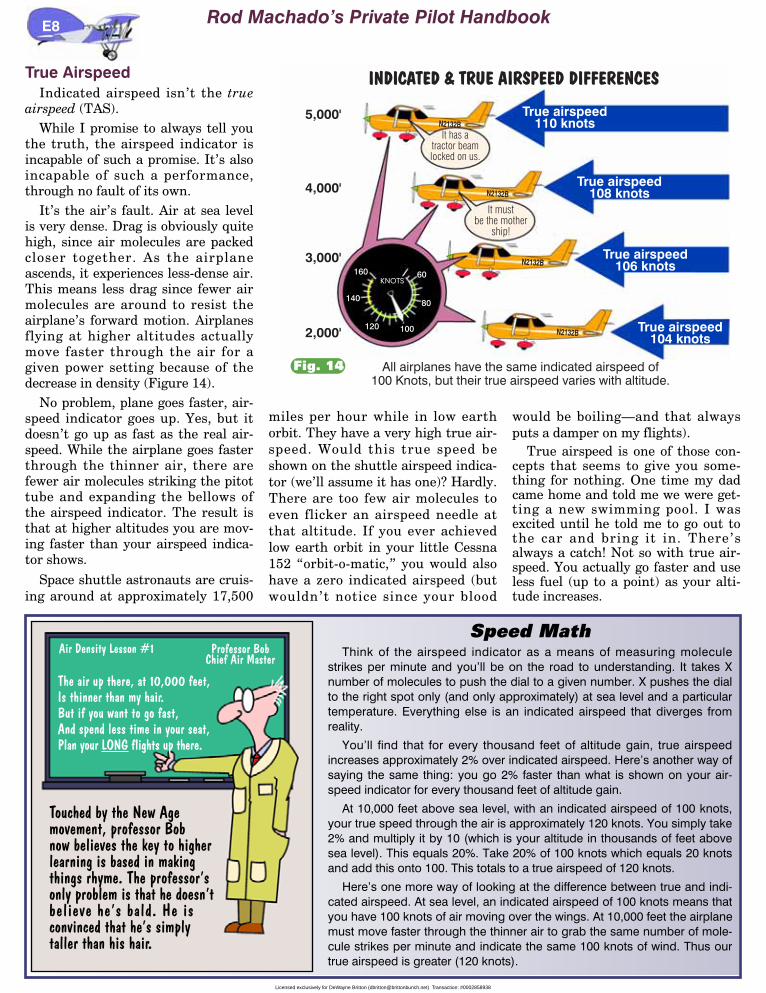
It’s the air’s fault. Air at sea levelis very dense. Drag is obviously quitehigh, since air molecules are packedcloser together. As the airplaneascends, it experiences less-dense air.This means less drag since fewer airmolecules are around to resist theairplane’s forward motion. Airplanesflying at higher altitudes actuallymove faster through the air for agiven power setting because of thedecrease in density (Figure 14).
No problem, plane goes faster, air-speed indicator goes up. Yes, but itdoesn’t go up as fast as the real air-speed. While the airplane goes fasterthrough the thinner air, there arefewer air molecules striking the pitottube and expanding the bellows ofthe airspeed indicator. The result isthat at higher altitudes you are mov-ing faster than your airspeed indica-tor shows.
Space shuttle astronauts are cruis-ing around at approximately 17,500
miles per hour while in low earthorbit. They have a very high true air-speed. Would this true speed beshown on the shuttle airspeed indica-tor (we’ll assume it has one)? Hardly.There are too few air molecules toeven flicker an airspeed needle atthat altitude. If you ever achievedlow earth orbit in your little Cessna152 “orbit-o-matic,” you would alsohave a zero indicated airspeed (butwouldn’t notice since your blood
would be boiling—and that alwaysputs a damper on my flights).
True airspeed is one of those con-cepts that seems to give you some-thing for nothing. One time my dadcame home and told me we were get-ting a new swimming pool. I wasexcited until he told me to go out tothe car and bring it in. There’salways a catch! Not so with true air-speed. You actually go faster and useless fuel (up to a point) as your alti-tude increases.
E8
N2132B
N2132B
N2132B
N2132B
True airspeed110 knots
True airspeed108 knots
True airspeed106 knots
True airspeed104 knots
5,000'
4,000'
3,000'
2,000'
All airplanes have the same indicated airspeed of100 Knots, but their true airspeed varies with altitude.
INDICATED & TRUE AIRSPEED DIFFERENCES
.
60
100120
140
160
80
KNOTS
It has atractor beamlocked on us.
It mustbe the mother
ship!
Fig. 14
Speed MathThink of the airspeed indicator as a means of measuring molecule
strikes per minute and you’ll be on the road to understanding. It takes Xnumber of molecules to push the dial to a given number. X pushes the dialto the right spot only (and only approximately) at sea level and a particulartemperature. Everything else is an indicated airspeed that diverges fromreality.
You’ll find that for every thousand feet of altitude gain, true airspeedincreases approximately 2% over indicated airspeed. Here’s another way ofsaying the same thing: you go 2% faster than what is shown on your air-speed indicator for every thousand feet of altitude gain.
At 10,000 feet above sea level, with an indicated airspeed of 100 knots,your true speed through the air is approximately 120 knots. You simply take2% and multiply it by 10 (which is your altitude in thousands of feet abovesea level). This equals 20%. Take 20% of 100 knots which equals 20 knotsand add this onto 100. This totals to a true airspeed of 120 knots.
Here’s one more way of looking at the difference between true and indi-cated airspeed. At sea level, an indicated airspeed of 100 knots means thatyou have 100 knots of air moving over the wings. At 10,000 feet the airplanemust move faster through the thinner air to grab the same number of mole-cule strikes per minute and indicate the same 100 knots of wind. Thus ourtrue airspeed is greater (120 knots).
Professor BobChief Air Master
Air Density Lesson #1
The air up there, at 10,000 feet,Is thinner than my hair.But if you want to go fast,And spend less time in your seat,Plan your LONG flights up there.
Touched by the New Agemovement, professor Bobnow believes the key to higherlearning is based in makingthings rhyme. The professor’sonly problem is that he doesn’tbelieve he’s bald. He isconvinced that he’s simplytaller than his hair.
Rod Machado’s Private Pilot Handbook
Licensed exclusively for DeWayne Britton ([email protected]) Transaction: #0002858938

Dense DoingsYou must be thinking, “Hey, if I go faster by flying
higher, why not fly real high?” Nice try, but it won’t fly!This logic doesn’t hold water (or air), due to the perversi-ty of nature and aviation. A little while ago I said TASincreases with altitude for a given power setting. Noticethe for a given power setting part. It’s the equivalent ofthe fine print in a contract from an aluminum sidingsales rep.
As you climb, the ability of the engine to producepower decreases due to the reduced air density. So, thevery thing that allows you to fly faster for a given amountof power (thinner air), limits the power you can produce!That’s what I mean about the perversity of aviation.Turbocharging, as we discussed earlier, helps but it tooeventually runs out of steam. Your Pilot’s OperatingHandbook identifies altitudes where you’ll obtain thegreatest gain in true airspeed for a given decrease inengine power.
Two factors affect air density: pressure and tempera-ture. Is there some way to precisely predict your true air-speed? Yes, and you don’t have to be psychic to do so (theother day I called the Psychic Hotline and they told methey saw a big phone bill in my future). Fortunately, trueairspeed prediction is a little more precise.
Some airspeed indicators have a moveable ring on theirouter scale to make determination of true airspeed easier(Figure 16). Just set the outside air temperature (OAT)on the outer ring directly over the pressure altitude (avalue we’ll discuss shortly) on the inner ring. The num-ber to which your airspeed needle points on the outerring is your true airspeed. Soon, I’ll show you how to usea flight computer to determine your true airspeed basedon the altitude and temperature conditions.
Chapter 5 - Flight Instruments: Clocks, Tops & Toys E9
True airspeedis 96 knots at10,000' MSL
True airspeed is80 knots
at sea level
Touchdownhere
Touchdownhere
Stophere
Stophere
LANDING DISTANCE AND TRUE AIRSPEED
At sea level wherethe air is quite dense
At 10,000' abovesea level where
the air is less dense
Landing distances at sea level are shorter for a given indicated airspeed.
Landing distances at 10,000' MSL are longer for a given indicated airspeed.
.
60
100120
140
160
80
KNOTS
.
60
100120
140
160
80
KNOTS
TAS and IAS While ApproachingHigh Altitude Airports
The difference between true and indicated air-speed is very important for pilots makingapproaches to high altitude airports. Supposeyou’re on approach to an airport at 10,000 feetabove sea level. Your indicated airspeed onapproach is 80 knots. This means your true air-speed is 20% greater (or 96 knots). In otherwords, your wheels are going to touch downat 96 knots despite showing only 80 knots onthe airspeed indicator (Figure 15). That run-way is going to seem a lot shorter than it nor-mally would. This is especially disconcerting ifyour mind was set for an 80 knot touchdownspeed.
To lift off and accelerate for an 80 knot climbrequires a longer-than-normal takeoff distance athigh altitude airports. Your airplane must movealong that runway a lot faster than 80 knots togenerate an 80 knot indicated airspeed. In fact,at 10,000 feet, it must speed up to 96 knots toshow only 80 knots on the airspeed indica-tor’s face. What does that mean to you? Itmeans high-altitude airports require longertakeoff runs and landing distances.
Does this mean, while on approach to a high altitude airport, you should slow the airplane down? No! That wouldn’t be good atall. Approach at the same airspeed you always use. Think about it for a second. The wings need a certain number of moleculesper minute flowing over them to maintain lift. Your job is supplying those molecules. In thinner air, you will be moving faster (higherTAS) to achieve the same indicated airspeed, but indicated airspeed (total number of air molecules arriving at the leading edge) isall the wing (and the pilot) really cares about. The airplane stalls at the same indicated airspeed whether you’re at 1,000 feet or10,000 feet. If the airplane requires 60 knots of wind blowing over its wing to keep from stalling, you need to keep the indicated air-speed above 60 knots. (Remember, for most approaches, you want to be at least 30% above the stall speed.)
Fig. 15
Fig. 16
The move-able ringon someairspeedindicatorsallows youto quicklycalibrateyour TASif you knowthe outsideair temper-ature andpressurealtitude.
...pressurealtitude onthis scale.
Read TASon thisscale.
Set outsideair temp on
this scaleopposite...
Licensed exclusively for DeWayne Britton ([email protected]) Transaction: #0002858938
The AltimeterWelcome to the third dimension. One of
the things that makes aviation unique isyour ability to operate in 3D. No, you won’tneed any of those funny-colored glasses, but youwill need some assistance figuring out where youare in the third dimension. This is why I wouldnow like to introduce you to your altimeter.
Airplanes move left or right with great preci-sion, flying specific headings and airways. This istwo-dimensional navigation. Altimeters allow air-planes to fly at specific altitudes—a third dimen-sion—with equal precision.
There are lots of ways to get high in aviation(all perfectly legal and honest, honest!). Inthe next few minutes, you will discoverthat there’s altitude and then there’s alti-tude. Knowing one from the other is cru-cial to your success as a pilot, not to men-tion your longevity as a person.
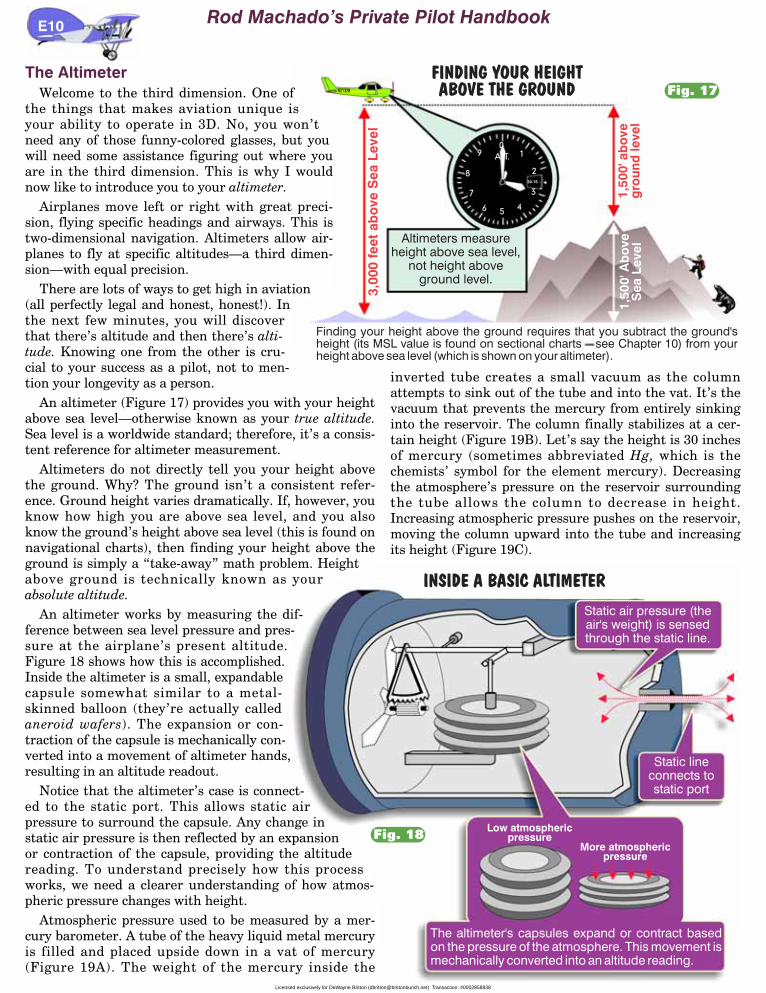
An altimeter (Figure 17) provides you with your heightabove sea level—otherwise known as your true altitude.Sea level is a worldwide standard; therefore, it’s a consis-tent reference for altimeter measurement.
Altimeters do not directly tell you your height abovethe ground. Why? The ground isn’t a consistent refer-ence. Ground height varies dramatically. If, however, youknow how high you are above sea level, and you alsoknow the ground’s height above sea level (this is found onnavigational charts), then finding your height above theground is simply a “take-away” math problem. Heightabove ground is technically known as yourabsolute altitude.
An altimeter works by measuring the dif-ference between sea level pressure and pres-sure at the airplane’s present altitude.Figure 18 shows how this is accomplished.Inside the altimeter is a small, expandablecapsule somewhat similar to a metal-skinned balloon (they’re actually calledaneroid wafers). The expansion or con-traction of the capsule is mechanically con-verted into a movement of altimeter hands,resulting in an altitude readout.
Notice that the altimeter’s case is connect-ed to the static port. This allows static airpressure to surround the capsule. Any change instatic air pressure is then reflected by an expansionor contraction of the capsule, providing the altitudereading. To understand precisely how this processworks, we need a clearer understanding of how atmos-pheric pressure changes with height.
Atmospheric pressure used to be measured by a mer-cury barometer. A tube of the heavy liquid metal mercuryis filled and placed upside down in a vat of mercury(Figure 19A). The weight of the mercury inside the
inverted tube creates a small vacuum as the columnattempts to sink out of the tube and into the vat. It’s thevacuum that prevents the mercury from entirely sinkinginto the reservoir. The column finally stabilizes at a cer-tain height (Figure 19B). Let’s say the height is 30 inchesof mercury (sometimes abbreviated Hg, which is thechemists’ symbol for the element mercury). Decreasingthe atmosphere’s pressure on the reservoir surroundingthe tube allows the column to decrease in height.Increasing atmospheric pressure pushes on the reservoir,moving the column upward into the tube and increasingits height (Figure 19C).
E10
N2132B
3,00
0 fe
et a
bo
ve S
ea L
evel
1,50
0' a
bo
veg
roun
d le
vel
1,50
0' A
bo
veS
ea L
evel
Altimeters measureheight above sea level,
not height aboveground level.
Finding your height above the ground requires that you subtract the ground'sheight (its MSL value is found on sectional charts see Chapter 10) from yourheight above sea level (which is shown on your altimeter).
.
1
2
3
09
8
5
7
6 4
ALT.
30.15
FINDING YOUR HEIGHTABOVE THE GROUND Fig. 17
Static lineconnects tostatic port
Static air pressure (theair's weight) is sensedthrough the static line.
Low atmosphericpressure
More atmosphericpressure
The altimeter's capsules expand or contract basedon the pressure of the atmosphere. This movement ismechanically converted into an altitude reading.
INSIDE A BASIC ALTIMETER
Rod Machado’s Private Pilot Handbook
Fig. 18
Licensed exclusively for DeWayne Britton ([email protected]) Transaction: #0002858938
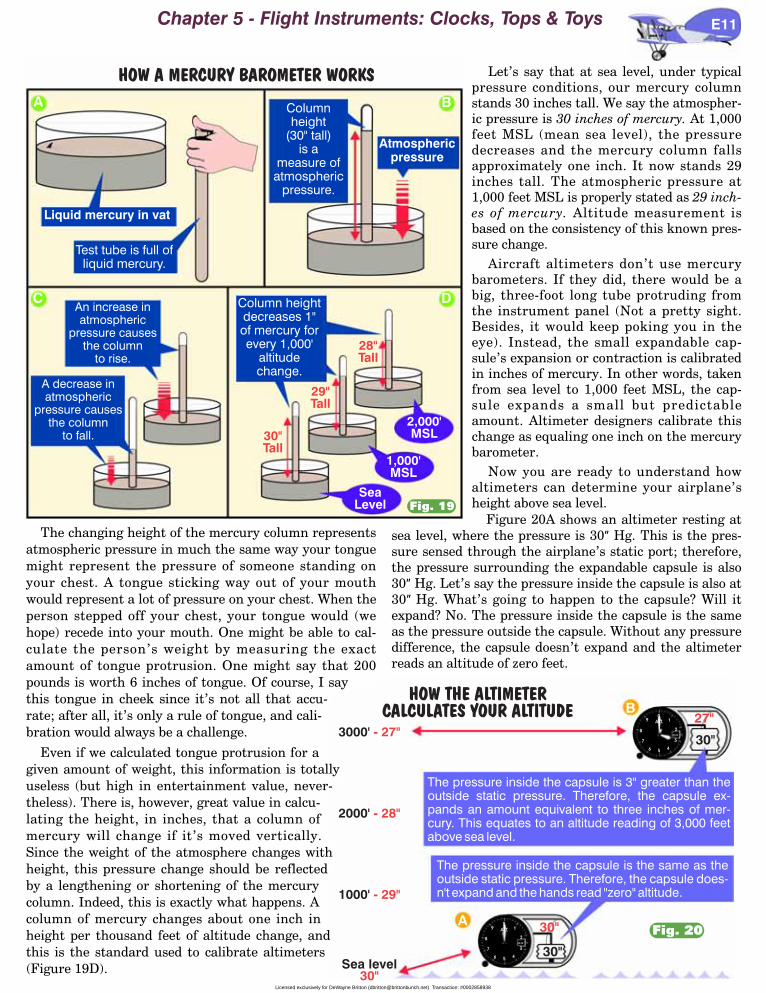
The changing height of the mercury column representsatmospheric pressure in much the same way your tonguemight represent the pressure of someone standing onyour chest. A tongue sticking way out of your mouthwould represent a lot of pressure on your chest. When theperson stepped off your chest, your tongue would (wehope) recede into your mouth. One might be able to cal-culate the person’s weight by measuring the exactamount of tongue protrusion. One might say that 200pounds is worth 6 inches of tongue. Of course, I saythis tongue in cheek since it’s not all that accu-rate; after all, it’s only a rule of tongue, and cali-bration would always be a challenge.
Even if we calculated tongue protrusion for agiven amount of weight, this information is totallyuseless (but high in entertainment value, never-theless). There is, however, great value in calcu-lating the height, in inches, that a column ofmercury will change if it’s moved vertically.Since the weight of the atmosphere changes withheight, this pressure change should be reflectedby a lengthening or shortening of the mercurycolumn. Indeed, this is exactly what happens. Acolumn of mercury changes about one inch inheight per thousand feet of altitude change, andthis is the standard used to calibrate altimeters(Figure 19D).
Let’s say that at sea level, under typicalpressure conditions, our mercury columnstands 30 inches tall. We say the atmospher-ic pressure is 30 inches of mercury. At 1,000feet MSL (mean sea level), the pressuredecreases and the mercury column fallsapproximately one inch. It now stands 29inches tall. The atmospheric pressure at1,000 feet MSL is properly stated as 29 inch-es of mercury. Altitude measurement isbased on the consistency of this known pres-sure change.
Aircraft altimeters don’t use mercurybarometers. If they did, there would be abig, three-foot long tube protruding fromthe instrument panel (Not a pretty sight.Besides, it would keep poking you in theeye). Instead, the small expandable cap-sule’s expansion or contraction is calibratedin inches of mercury. In other words, takenfrom sea level to 1,000 feet MSL, the cap-sule expands a small but predictableamount. Altimeter designers calibrate thischange as equaling one inch on the mercurybarometer.
Now you are ready to understand howaltimeters can determine your airplane’sheight above sea level.
Figure 20A shows an altimeter resting atsea level, where the pressure is 30” Hg. This is the pres-sure sensed through the airplane’s static port; therefore,the pressure surrounding the expandable capsule is also30” Hg. Let’s say the pressure inside the capsule is also at30” Hg. What’s going to happen to the capsule? Will itexpand? No. The pressure inside the capsule is the sameas the pressure outside the capsule. Without any pressuredifference, the capsule doesn’t expand and the altimeterreads an altitude of zero feet.
Chapter 5 - Flight Instruments: Clocks, Tops & Toys E11
An increase inatmospheric
pressure causesthe column
to rise.
A decrease inatmospheric
pressure causesthe column
to fall. 30"Tall
29"Tall
28"Tall
1,000'MSL
SeaLevel
2,000'MSL
Column heightdecreases 1"of mercury forevery 1,000'
altitudechange.
Columnheight
(30" tall)is a
measure ofatmospheric
pressure.
Atmosphericpressure
HOW A MERCURY BAROMETER WORKS
Liquid mercury in vat
Test tube is full ofliquid mercury.
A B
C D
.
1
2
3
09
8
5
7
6 4
ALT.
30.00
.
1
2
3
09
8
5
7
6 4
ALT.
30.003000'
2000'
1000'
Sea level
- 27"
- 28"
- 29"
30"
30"
30"
30"
27"
The pressure inside the capsule is the same as theoutside static pressure. Therefore, the capsule does-n't expand and the hands read "zero" altitude.
The pressure inside the capsule is 3" greater than theoutside static pressure. Therefore, the capsule ex-pands an amount equivalent to three inches of mer-cury. This equates to an altitude reading of 3,000 feetabove sea level.
HOW THE ALTIMETERCALCULATES YOUR ALTITUDE B
AFig. 20
Fig. 19
Licensed exclusively for DeWayne Britton ([email protected]) Transaction: #0002858938

Figure 20B shows an altimeter at3,000 feet MSL. The static pressureat 3,000 MSL is 27” Hg. If the pres-sure inside the capsule is still 30” Hg,what will the capsule do? Yes, it willexpand an amount equal to this dif-ference in pressure. It will expand byan amount of pressure equal to threeinches of mercury. This expansionequates to a 3,000 foot reading on thealtimeter’s face. (Remember, the cap-sule expands because its internalpressure is greater than the outsidestatic pressure.)
Pressure Variations AndThe AltimeterIf the pressure at sea level
always stayed at 30” Hg, this wouldbe the end of our altimeter story.Unfortunately, the pressure at sealevel varies daily, hourly, and some-times even minute-by-minute. Theatmosphere actually changes weightslightly, causing air to push downharder on some parts of the earththan others. In the weather sectionyou will have a chance to study thesepressure differences more thorough-ly. For now, let’s agree that the pres-sure at sea level changes often.The altimeter’s job is to measure
the difference between sea level pres-sure and the outside static pressureof the altitude at which you are fly-ing. As we’ve already learned, the dif-ference between these two pressuresallows the altimeter to calculate yourheight above sea level. Since we’vealready agreed that sea level pressurechanges at a fixed location, thinkabout how quickly it can changewhen moving across the country inyour airplane. You obviously needsome way to keep your altimeterinformed about the changing pres-sure at sea level. A small knob at thefront of the altimeter (Figure 21)allows you to do just that.
Twisting this knob rotates the littlenumbers in the Kollsman window, asshown on the face of the altimeter inFigure 22A. This is the pilot’s way oftelling the altimeter what the pres-sure is at sea level. Changing thenumbers in the Kollsman windowrecalibrates the pressure inside thealtimeter’s expandable capsule. Thisis done mechanically by repositioningan internal linkage, which gives thecapsule a new starting point fromwhich to begin measuring. Whateverpressure value you set in theKollsman window, the altimeterassumes this is the new sea levelpressure. Now the altimeter mea-sures the difference between thepressure value set in the Kollsmanwindow and the outside static pres-sure to obtain your height above sealevel.For instance, when 30.10” Hg is set
in the Kollsman window, the pres-sure inside the expandable capsule isrecalibrated to 30.10” Hg as shown inFigure 22A. Now the altimeter thinksthe pressure at sea level is 30.10” Hg.Setting 29.95” Hg in the Kollsmanwindow tells the altimeter the pres-sure at sea level is 29.95” Hg (Figure22B). Figure 23 shows how this process
works. Airplane A is over San Fran-cisco (SFO) where the sea level pres-sure is 30.25” Hg. This value is set inthe Kollsman window. The differencebetween 30.25” Hg and 27.25” Hg isthree inches of pressure or 3000 feet.The altimeter reads three thousandfeet—the airplane’s true altitude.*Airplane B is over Santa Barbara(SBA) where the sea level pressurehas lowered to 29.25” Hg. The staticpressure at Airplane B’s altitude of3,000 feet is 26.25” Hg. The differ-ence between these two is three inch-es. Therefore, the altimeter reads3000 feet.
*As you’ll soon see, to obtain truealtitude, you also need to correct thealtimeter for non-standard tempera-ture variations. For now, we’ll justassume that true altitude is obtainedby correcting the altimeter for pres-sure changes.
E12
Fig. 21
Turning the altimeter’s knob allowsyou to tell the instrument what thepressure at sea level is.
Fig. 22
Did you feel something?
I did!
Rod Machado’s Private Pilot Handbook
Licensed exclusively for DeWayne Britton ([email protected]) Transaction: #0002858938

The point is that we should always set the sealevel pressure in the Kollsman window so ouraltimeter can read true altitude. “OK,”you wonder, “how do we get the sealevel pressure to set in the Kollsmanwindow in the first place?” This sealevel pressure is called the altime-ter setting. It’s easily obtainedfrom several sources, includingair traffic control towers, flightservice stations and automaticweather observation stations. Abit later in this chapter, I’ll tellyou about one more way you canget the right altimeter setting,even when nobody’s home at thetower.
What happens if you don’t contin-ue to update the altimeter setting dur-ing every 100 miles or so of flight?There’s a good chance your altimeter willnot be providing the correct information—you’re not going to be at the altitude you think you’re at.This can be a problem.
Think of the problem as being similar to driving acrossthe country while listening to your car radio. If you’re lis-tening to a lecture about Jung and yang on that philo-sophical radio station KYMI, after a short distance you’llneed to re-tune to another station carrying the same pro-gram. You’ll be out of range of the first station. If youfly more than 100 miles from the source of your lastaltimeter setting, you’re technically out of rangefrom this source. An error in the altimeter’sreading is possible unless you reset theKollsman window to a closer source.
Figure 24 depicts this process. Notice thatat 1,000 feet MSL above SFO, the pressureis 29.25” Hg (position A). This is the sameas the sea level pressure at SBA (positionB). Do you see how the 29.25” pressurelevel gradually sloped from 1,000 feet MSLdown to the surface, between SFO andSBA? It can be said that pressure levelsdrop when flying towards an area of lowerpressure.
At 3,000 feet above SFO, the static pres-sure is 27.25” Hg (position C). ApproachingSBA, the 27.25” pressure level slopes down-ward to 2,000 feet above the surface (positionD). With the SFO sea level pressure of 30.25” Hgset in the Kollsman window, the altimeter indi-cates 3,000 feet as long as you stay at the levelwhere the outside pressure is 27.25” Hg as shownby position C. Can you see what’s happening?The l e v e l w h e r e the pressure is 27.25” Hg
actually slopes downward closer to the surface yet thealtimeter is still reading 3,000 feet position D. If we don’tcontinue to update the altimeter setting, the indicated alti-tude (what’s shown on the altimeter's face) becomes differentfrom our true altitude (our actual height above sea level).
Chapter 5 - Flight Instruments: Clocks, Tops & Toys E13
.
1
2
3
09
8
5
7
6 4
ALT.
29.25.
1
2
3
09
8
5
7
6 4
ALT.
30.253000' MSL
27.25"
2000' MSL28.25"
1000' MSL29.25"
Sea levelat SFO
30.25" Hg
3000' MSL26.25"
2000' MSL27.25"
1000' MSL28.25"
Sea levelat SBA
29.25" Hg
30.25
26.2527.25
29.25
Kollsmanwindow
Each altimeter measures the differ-ence between the pressure at sealevel (as set in the Kollsman win-dow) and the static pressure at itsaltitude. The difference betweenthese two is mechanically con-verted into an altitude reading.
30.25
Kollsmanwindow
29.25
HOW THE ALTIMETERCALCULATES YOUR ALTITUDE
A B
Fig. 23
.
1
2
3
09
8
5
7
6 4
30.25
.
1
2
3
09
8
5
7
6 4
30.253000' MSL
27.25"
2000' MSL28.25"
1000' MSL29.25"
30.25"Sea levelat SFO
3000' MSL26.25"
2000' MSL27.25"
1000' MSL28.25"
29.25"Sea levelat SBA
30.25
27.25
27.25
30.25
HOW SLOPING PRESSURELEVELS AFFECT YOUR ALTIMETER
Pressure level slopes from SFO to SBA
Pressure level slopes from SFO to SBA
30.25
30.25
Altimeter C reads the correct altitude of3,000' MSL. Altimeter D reads 3,000' MSLeven though it's only 2,000' MSL. This oc-curs because its altimeter setting hasn'tbeen updated to the current sea level
pressure at SBA of 29.25".
A
B
C
D
Fig. 24Licensed exclusively for DeWayne Britton ([email protected]) Transaction: #0002858938
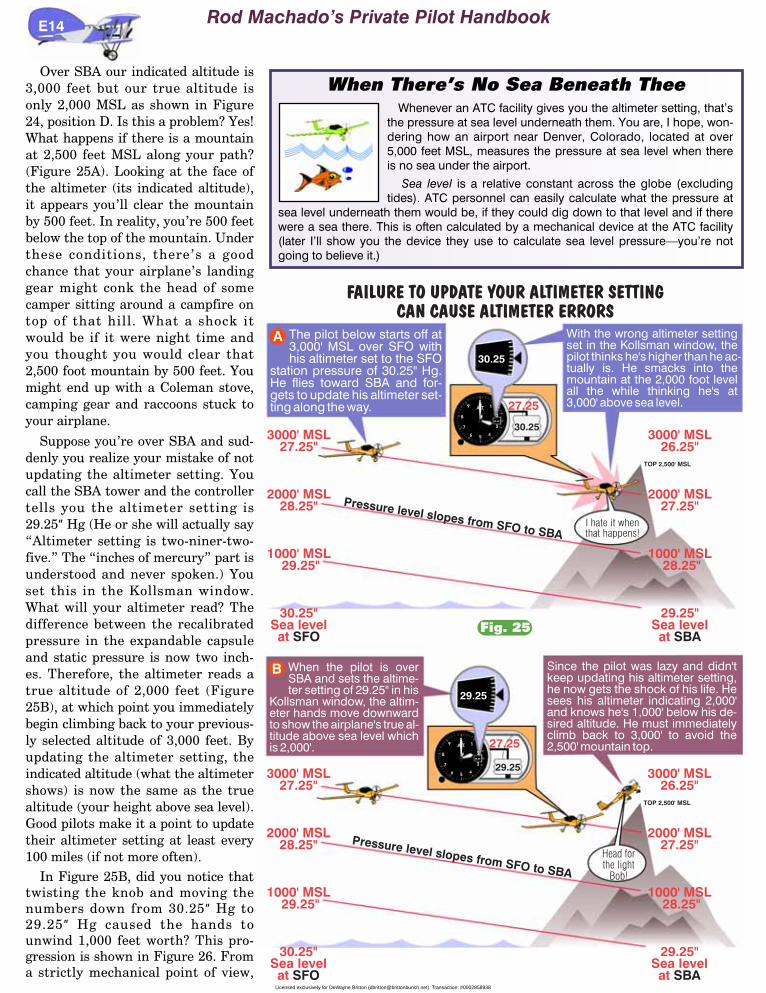
Over SBA our indicated altitude is3,000 feet but our true altitude isonly 2,000 MSL as shown in Figure24, position D. Is this a problem? Yes!What happens if there is a mountainat 2,500 feet MSL along your path?(Figure 25A). Looking at the face ofthe altimeter (its indicated altitude),it appears you’ll clear the mountainby 500 feet. In reality, you’re 500 feetbelow the top of the mountain. Underthese conditions, there’s a goodchance that your airplane’s landinggear might conk the head of somecamper sitting around a campfire ontop of that hill. What a shock itwould be if it were night time andyou thought you would clear that2,500 foot mountain by 500 feet. Youmight end up with a Coleman stove,camping gear and raccoons stuck toyour airplane.
Suppose you’re over SBA and sud-denly you realize your mistake of notupdating the altimeter setting. Youcall the SBA tower and the controllertells you the altimeter setting is29.25” Hg (He or she will actually say“Altimeter setting is two-niner-two-five.” The “inches of mercury” part isunderstood and never spoken.) Youset this in the Kollsman window.What will your altimeter read? Thedifference between the recalibratedpressure in the expandable capsuleand static pressure is now two inch-es. Therefore, the altimeter reads atrue altitude of 2,000 feet (Figure25B), at which point you immediatelybegin climbing back to your previous-ly selected altitude of 3,000 feet. Byupdating the altimeter setting, theindicated altitude (what the altimetershows) is now the same as the truealtitude (your height above sea level).Good pilots make it a point to updatetheir altimeter setting at least every100 miles (if not more often).
In Figure 25B, did you notice thattwisting the knob and moving thenumbers down from 30.25” Hg to29.25” Hg caused the hands tounwind 1,000 feet worth? This pro-gression is shown in Figure 26. Froma strictly mechanical point of view,
E14
When There’s No Sea Beneath TheeWhenever an ATC facility gives you the altimeter setting, that’s
the pressure at sea level underneath them. You are, I hope, won-dering how an airport near Denver, Colorado, located at over5,000 feet MSL, measures the pressure at sea level when thereis no sea under the airport.
Sea level is a relative constant across the globe (excludingtides). ATC personnel can easily calculate what the pressure at
sea level underneath them would be, if they could dig down to that level and if therewere a sea there. This is often calculated by a mechanical device at the ATC facility(later I’ll show you the device they use to calculate sea level pressure—you’re notgoing to believe it.)
The pilot below starts off at3,000' MSL over SFO withhis altimeter set to the SFO
station pressure of 30.25" Hg.He flies toward SBA and for-gets to update his altimeter set-ting along the way.
Pressure level slopes from SFO to SBA
3000' MSL26.25"
2000' MSL27.25"
1000' MSL28.25"
29.25"Sea levelat SBA
Since the pilot was lazy and didn'tkeep updating his altimeter setting,he now gets the shock of his life. Hesees his altimeter indicating 2,000'and knows he's 1,000' below his de-sired altitude. He must immediatelyclimb back to 3,000' to avoid the2,500' mountain top.
TOP 2,500' MSL
FAILURE TO UPDATE YOUR ALTIMETER SETTINGCAN CAUSE ALTIMETER ERRORS
Pressure level slopes from SFO to SBA
3000' MSL26.25"
2000' MSL27.25"
1000' MSL28.25"
29.25"Sea levelat SBA
.
1
2
3
09
8
5
7
6 4
ALT.
30.25
27.25
30.25
30.25
TOP 2,500' MSL
A
.
1
2
3
09
8
5
7
6 4
ALT.
30.25
27.25
29.25
29.25
When the pilot is overSBA and sets the altime-ter setting of 29.25" in his
Kollsman window, the altim-eter hands move downwardto show the airplane's true al-titude above sea level whichis 2,000'.
B
With the wrong altimeter settingset in the Kollsman window, thepilot thinks he's higher than he ac-tually is. He smacks into themountain at the 2,000 foot levelall the while thinking he's at3,000' above sea level.
3000' MSL27.25"
2000' MSL28.25"
1000' MSL29.25"
30.25"Sea levelat SFO
3000' MSL27.25"
2000' MSL28.25"
1000' MSL29.25"
30.25"Sea levelat SFO
I hate it whenthat happens!
Head forthe light
Bob!
Fig. 25
Rod Machado’s Private Pilot Handbook
Licensed exclusively for DeWayne Britton ([email protected]) Transaction: #0002858938
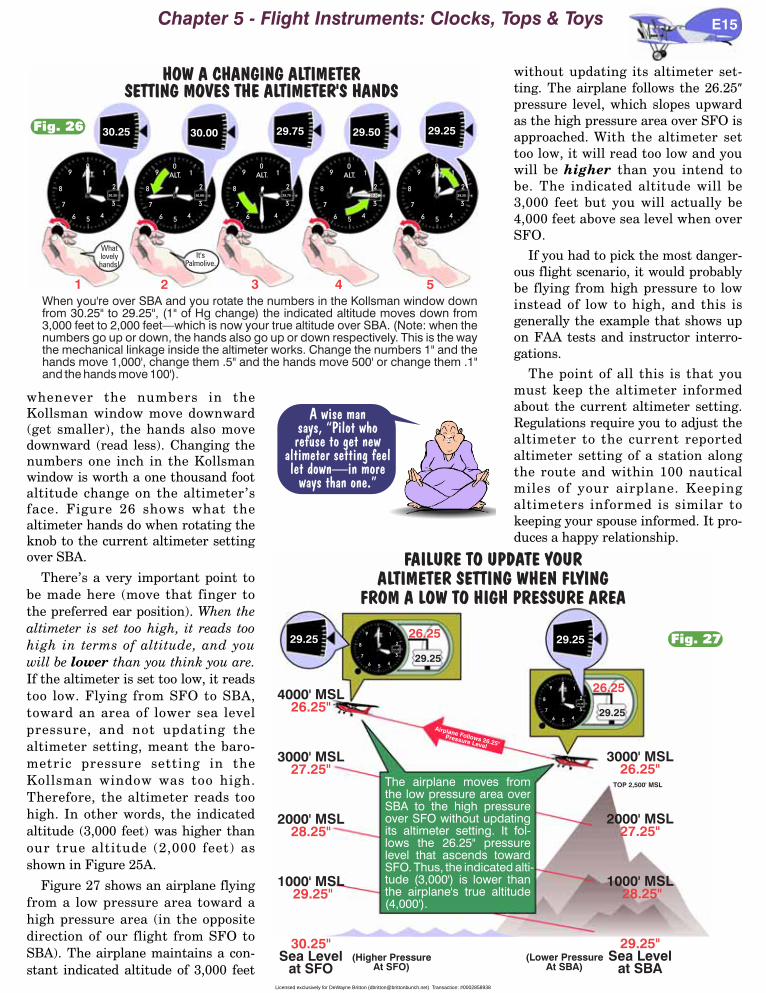
whenever the numbers in theKollsman window move downward(get smaller), the hands also movedownward (read less). Changing thenumbers one inch in the Kollsmanwindow is worth a one thousand footaltitude change on the altimeter’sface. Figure 26 shows what thealtimeter hands do when rotating theknob to the current altimeter settingover SBA.
There’s a very important point tobe made here (move that finger tothe preferred ear position). When thealtimeter is set too high, it reads toohigh in terms of altitude, and youwill be lower than you think you are.If the altimeter is set too low, it readstoo low. Flying from SFO to SBA,toward an area of lower sea levelpressure, and not updating thealtimeter setting, meant the baro-metric pressure setting in theKollsman window was too high.Therefore, the altimeter reads toohigh. In other words, the indicatedaltitude (3,000 feet) was higher thanour true altitude (2,000 feet) asshown in Figure 25A.
Figure 27 shows an airplane flyingfrom a low pressure area toward ahigh pressure area (in the oppositedirection of our flight from SFO toSBA). The airplane maintains a con-stant indicated altitude of 3,000 feet
without updating its altimeter set-ting. The airplane follows the 26.25”
pressure level, which slopes upwardas the high pressure area over SFO isapproached. With the altimeter settoo low, it will read too low and youwill be higher than you intend tobe. The indicated altitude will be3,000 feet but you will actually be4,000 feet above sea level when overSFO.
If you had to pick the most danger-ous flight scenario, it would probablybe flying from high pressure to lowinstead of low to high, and this isgenerally the example that shows upon FAA tests and instructor interro-gations.
The point of all this is that youmust keep the altimeter informedabout the current altimeter setting.Regulations require you to adjust thealtimeter to the current reportedaltimeter setting of a station alongthe route and within 100 nauticalmiles of your airplane. Keepingaltimeters informed is similar tokeeping your spouse informed. It pro-duces a happy relationship.
Chapter 5 - Flight Instruments: Clocks, Tops & Toys E15
5
HOW A CHANGING ALTIMETERSETTING MOVES THE ALTIMETER'S HANDS
.
1
2
3
09
8
5
7
6 4
ALT.
30.00 .
1
2
3
09
8
5
7
6 4
ALT.
29.50 .
1
2
3
09
8
5
7
6 4
29.25.
1
2
3
09
8
5
7
6 4
30.25 .
1
2
3
09
8
5
7
6 4
ALT.
29.75
When you're over SBA and you rotate the numbers in the Kollsman window downfrom 30.25" to 29.25", (1" of Hg change) the indicated altitude moves down from3,000 feet to 2,000 feet—which is now your true altitude over SBA. (Note: when thenumbers go up or down, the hands also go up or down respectively. This is the waythe mechanical linkage inside the altimeter works. Change the numbers 1" and thehands move 1,000', change them .5" and the hands move 500' or change them .1"and the hands move 100').
1 2 3 4
30.25 30.00 29.75 29.2529.50
Whatlovelyhands!
It'sPalmolive.
Fig. 26
4000' MSL
3000' MSL
2000' MSL
1000' MSL
Sea Levelat SFO
26.25"
27.25"
28.25"
29.25"
30.25"
3000' MSL
2000' MSL
1000' MSL
Sea Levelat SBA
26.25"
27.25"
28.25"
29.25"
.
.
1
1
2
2
3
3
0
0
9
9
8
8
5
5
7
7
6
6
4
4
29.25
29.25
26.25
26.25
29.25
29.25
29.25
TOP 2,500' MSL
FAILURE TO UPDATE YOURALTIMETER SETTING WHEN FLYING
FROM A LOW TO HIGH PRESSURE AREA
(Higher PressureAt SFO)
(Lower PressureAt SBA)
29.25
The airplane moves fromthe low pressure area overSBA to the high pressureover SFO without updatingits altimeter setting. It fol-lows the 26.25" pressurelevel that ascends towardSFO. Thus, the indicated alti-tude (3,000') is lower thanthe airplane's true altitude(4,000').
Airplane Follows 26.25"Pressure Level
Fig. 27
A wise mansays, “Pilot whorefuse to get new
altimeter setting feellet down—in more
ways than one.”
Licensed exclusively for DeWayne Britton ([email protected]) Transaction: #0002858938

Temperature Variations and the AltimeterJust when you think you’ve got all the exceptions
down pat, another gem in need of consideration popsup. You just can’t seem to win. It’s like going to theone hour photo shop, only to find they have 30 minuteparking. Don’t fret. The altimeter’s temperatureerrors are easy to understand.
Normal changes in temperature produce relativelysmall and negligible errors in altimeter readings. If,however, you’re taking the family’s Boeing 747 outfor a little cross country flight, you could travel toexotic places having extreme temperatures (in par-ticular, extreme cold). Under these conditions, it’spossible to have altimeter errors of 500 feet ormore. Practically speaking, most pilots never cor-rect their altimeters for temperature variations.Nevertheless, it’s important to know when theseerrors can affect you and how to correct for them.
Most of the time, pilots fly with plenty of terrainclearance and are not affected by small, tempera-ture-induced altimeter errors. On the other hand,if you’re planning a night flight over mountainsand don’t plan on crossing them by at least 2,000feet or more, you should check and see if tempera-ture errors will significantly affect your altimeter’sreading. (You should also have a CAT scan to checkfor reduced blood flow to the judgment section of yourcortex if you’re crossing mountains at less than 2,000 feetabove ground level at night.)
Figure 28 depicts the effect of temperature on columnsof air. When air is at standard or normal temperature(59° F/15° C at sea level), the altimeter experiences notemperature error. Airplane B, sitting on top of a columnof normal temperature air, has an indicated altitude(4,000 feet) which is equal to its true altitude (4,000 feet).
When temperatures are warmer, however, air expands.Airplane A rests atop an expanded layer of air. The airbeneath Airplane A weighs the same as the air beneathAirplane B. The difference is that the warmer, expandedcolumn of air is taller. This is similar to two guys bothweighing 370 pounds, with one standing 6 feet tall andthe other standing 4 feet tall. They both produce thesame indication on a scale but their weight is distributeddifferently in the vertical direction. In a similar manner,
a mass of air having temperatures that are different fromstandard distributes its weight differently in the verticaldirection.
Because the pressure levels are taller or expanded inwarmer air, Airplane A’s indicated altitude is 4,000 feetand its true altitude is 4,250 feet. Colder air producesshorter or more closely spaced pressure levels. AirplaneC’s indicated altitude is 4,000 feet and its true altitude is3,750 feet.
Think about it in the following way. Without correct-ing the altimeter for temperature variations, if the tem-perature is going down, then the airplane is going down;if the temperature is going up, then the airplane is goingup.
On a flight from a warmer area to a colder area, with-out correcting for temperature, the indicated altitude isgreater than the true altitude. In other words, the altime-ter will indicate 4,000 feet but the true altitude will be3,750 feet. The temperature went down, so the airplanewent down. It went down 250 feet and you still thinkyou’re at 4,000 feet above sea level.
On a flight from a colder area to a warmer area, with-out correcting for temperature, the indicated altitude islower than the true altitude. Imagine the airplane inFigure 28 flying from right to left. In the warmer area,the indicated altitude is 4,000 feet but the true altitude is4,250 feet. Therefore, if the temperature is going up, theairplane is going up. It went up 250 feet and you stillthink you’re at 4,000 feet above sea level.
E16
Changes in temperature raise or lower thepressure levels of air. This causes slight
differences betweenindicated altitudeAnd true altitude.
Truealtitude
4,250 feet Truealtitude
4,000 feet Truealtitude
3,750 feet
Warmer airat 100 Fexpandssightly
Normal tempair at 59 F(standard
conditions)
Cooler air at32 F
shrinksslightly
Indicatedaltitude - 4,000'
Indicatedaltitude - 4,000'
Indicatedaltitude - 4,000'
4000' Pressure level
o o o
.
1
2
3
09
8
5
7
6 4
30.15
.
1
2
3
09
8
5
7
6 4
30.15
.
1
2
3
09
8
5
7
6 4
30.15
A
B
C
HOW TEMPERATUREAFFECTS THE ALTIMETER
Fig. 28
YOU KNOW YOU’VE BEEN FLYING TOO MUCH WHEN...1. You use the emergency brake to drop the flaps.2. You yell “clear” before starting your car.3. You get out of your car and look for tiedown ropes.4. You brake on left turns and speed-up on right turns. 5. You tell the police officer that you’re allowed to go 250
below 10,000 feet MSL.6. You drive into a fog bank and immediately go on instruments.7. You are entering the highway and hit rotate speed for the
Cessna 150. You pull back on the wheel and don’t become airborne. In a panic, you abort the takeoff and hit the brakes. (This drives the guy behind you crazy.)
Rod Machado’s Private Pilot Handbook
Licensed exclusively for DeWayne Britton ([email protected]) Transaction: #0002858938
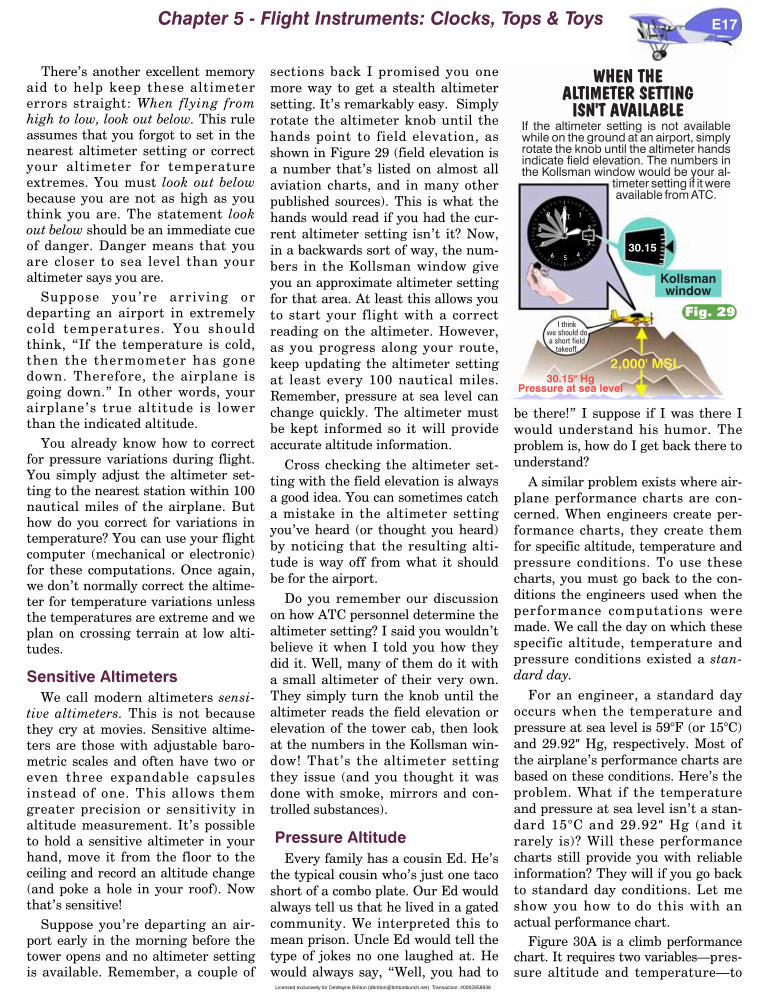
There’s another excellent memoryaid to help keep these altimetererrors straight: When flying fromhigh to low, look out below. This ruleassumes that you forgot to set in thenearest altimeter setting or correctyour altimeter for temperatureextremes. You must look out belowbecause you are not as high as youthink you are. The statement lookout below should be an immediate cueof danger. Danger means that youare closer to sea level than youraltimeter says you are.
Suppose you’re arriving ordeparting an airport in extremelycold temperatures. You shouldthink, “If the temperature is cold,then the thermometer has gonedown. Therefore, the airplane isgoing down.” In other words, yourairplane’s true altitude is lowerthan the indicated altitude.
You already know how to correctfor pressure variations during flight.You simply adjust the altimeter set-ting to the nearest station within 100nautical miles of the airplane. Buthow do you correct for variations intemperature? You can use your flightcomputer (mechanical or electronic)for these computations. Once again,we don’t normally correct the altime-ter for temperature variations unlessthe temperatures are extreme and weplan on crossing terrain at low alti-tudes.
Sensitive AltimetersWe call modern altimeters sensi-
tive altimeters. This is not becausethey cry at movies. Sensitive altime-ters are those with adjustable baro-metric scales and often have two oreven three expandable capsulesinstead of one. This allows themgreater precision or sensitivity inaltitude measurement. It’s possibleto hold a sensitive altimeter in yourhand, move it from the floor to theceiling and record an altitude change(and poke a hole in your roof). Nowthat’s sensitive!
Suppose you’re departing an air-port early in the morning before thetower opens and no altimeter settingis available. Remember, a couple of
sections back I promised you onemore way to get a stealth altimetersetting. It’s remarkably easy. Simplyrotate the altimeter knob until thehands point to field elevation, asshown in Figure 29 (field elevation isa number that’s listed on almost allaviation charts, and in many otherpublished sources). This is what thehands would read if you had the cur-rent altimeter setting isn’t it? Now,in a backwards sort of way, the num-bers in the Kollsman window giveyou an approximate altimeter settingfor that area. At least this allows youto start your flight with a correctreading on the altimeter. However,as you progress along your route,keep updating the altimeter settingat least every 100 nautical miles.Remember, pressure at sea level canchange quickly. The altimeter mustbe kept informed so it will provideaccurate altitude information.
Cross checking the altimeter set-ting with the field elevation is alwaysa good idea. You can sometimes catcha mistake in the altimeter settingyou’ve heard (or thought you heard)by noticing that the resulting alti-tude is way off from what it shouldbe for the airport.
Do you remember our discussionon how ATC personnel determine thealtimeter setting? I said you wouldn’tbelieve it when I told you how theydid it. Well, many of them do it witha small altimeter of their very own.They simply turn the knob until thealtimeter reads the field elevation orelevation of the tower cab, then lookat the numbers in the Kollsman win-dow! That’s the altimeter settingthey issue (and you thought it wasdone with smoke, mirrors and con-trolled substances).
Pressure AltitudeEvery family has a cousin Ed. He’s
the typical cousin who’s just one tacoshort of a combo plate. Our Ed wouldalways tell us that he lived in a gatedcommunity. We interpreted this tomean prison. Uncle Ed would tell thetype of jokes no one laughed at. Hewould always say, “Well, you had to
be there!” I suppose if I was there Iwould understand his humor. Theproblem is, how do I get back there tounderstand?
A similar problem exists where air-plane performance charts are con-cerned. When engineers create per-formance charts, they create themfor specific altitude, temperature andpressure conditions. To use thesecharts, you must go back to the con-ditions the engineers used when theperformance computations weremade. We call the day on which thesespecific altitude, temperature andpressure conditions existed a stan-dard day.
For an engineer, a standard dayoccurs when the temperature andpressure at sea level is 59°F (or 15°C)and 29.92” Hg, respectively. Most ofthe airplane’s performance charts arebased on these conditions. Here’s theproblem. What if the temperatureand pressure at sea level isn’t a stan-dard 15°C and 29.92” Hg (and itrarely is)? Will these performancecharts still provide you with reliableinformation? They will if you go backto standard day conditions. Let meshow you how to do this with anactual performance chart.
Figure 30A is a climb performancechart. It requires two variables—pres-sure altitude and temperature—to
Chapter 5 - Flight Instruments: Clocks, Tops & Toys E17
WHEN THEALTIMETER SETTING
ISN'T AVAILABLE
2,000' MSL30.15" Hg
Pressure at sea level
.
1
2
3
09
8
5
7
6 4
ALT.
30.15
30.15
Kollsmanwindow
If the altimeter setting is not availablewhile on the ground at an airport, simplyrotate the knob until the altimeter handsindicate field elevation. The numbers inthe Kollsman window would be your al-
timeter setting if it wereavailable from ATC.
I thinkwe should doa short field
takeoff.
Fig. 29
Licensed exclusively for DeWayne Britton ([email protected]) Transaction: #0002858938

determine climb rate. This thingcalled pressure altitude is the pres-sure condition the engineers experi-enced when they determined the air-plane’s performance. Since the pres-sure at sea level was 29.92” Hg whenthey tested the airplane, all you needto do in determining pressure alti-tude is set the altimeter’s Kollsmanwindow to 29.92” Hg and read the
indicated altitude. This reading isyour pressure altitude, as shown inFigure 30B. In this example, ourpressure altitude is 2,000 feet. Usingthat value and the outside air tem-perature, we can determine our air-plane’s performance on the rate ofclimb chart provided.
Of course, once you’ve determinedyour pressure altitude you should
immediately reset the altimeter backto the altimeter setting provided byAir Traffic Control (ATC). This keepsthe altimeter reading the correctheight above sea level (true altitude).
Remember, pressure altitude isused for performance computations.It’s the height above a standarddatum plane, which is nothing morethan a fancy phrase for an imaginaryreference point. This reference pointis what the engineer’s altimeterwould have read if temperature andpressure at sea level was 59°F and29.92” Hg.
Reading the AltimeterReading the altimeter is very simi-
lar to reading a watch. I say this withcaution, knowing that some readershave been raised on digital watchesand no longer know what it meanswhen Mickey’s little hand is on the 3and his big hand is on the 12. Somemay not even know which wayMickey’s hands used to turn. I knowthis is a problem because the towerpointed out traffic for one of my stu-dents by saying, “32 Bravo, you havetraffic at 2 o’clock.” My studentreplied, “Well, it’s only 1:30, so we’vegot a half hour before it gets here!"
Figure 31A shows a typical altime-ter found in most airplanes. It hasthree hands, which is how manyyou’ll wish you had sometimes when
E18
WEIGHTLBS
PRESSALTFT
CLIMBSPEEDKIAS -20 C 0 C 20 C 40 C
600
525
450
370
295
665
585
510
430
350
275
730
645
565
485
405
325
250
795
705
625
540
460
380
300
73
73
73
72
72
72
72
S.L.
2000
4000
6000
8000
10,000
12,000
2550
Think of pressure altitude as the altitude the engineers were at when theycreated the airplane's performance charts. This is the altitude your altim-eter reads when 29.92" of Hg is set in your Kollsman window.
How to obtain pressure altitude for the chart above
.
1
2
3
09
8
5
7
6 4
ALT.
30.17.
1
2
3
09
8
5
7
6 4
ALT.
30.42 .
1
2
3
09
8
5
7
6 4
29.92
1 2 3
30.42 30.17 29.92
To find your pressure altitude, sim-ply set 29.92" in your Kollsman win-dow. The altitude the hands point tois your pressure altitude. Onceyou know this, reset thenumbers in the Kollsmanwindow to the previous al-timeter setting. Note thatrotating the numbers from30.42" down to 29.92" (achange of .5") moves thehands down 500'. There-fore, the hands move from2,500' down to 2,000'.
HOW TO FIND AND USE PRESSURE ALTITUDEA
B
Ouch! Ihave tennis
elbow.
I wishI had anelbow!
RATE OF CLIMB - FPM
Fig. 30
Know the CodeMany airplanes now have automatic pressure altitude reporting equipment
(either an encoding altimeter or a blind encoder [most common]). Also referred toas Mode C capability, this equipment is similar to an altimeter. It sends encodedpressure information to ATC radar via the airplane’s onboard transponder. Thetransponder is a device that makes the airplane appear as an electronic blip onradar. Airplanes with altitude encoding equipment have their altitude informationshown as well as their horizontal position depicted next to the radar blip.
Altitude encoding devices have their Kollsman windows permanently set to29.92” Hg. They send pressure altitude pulses to ATC radar, where the computerautomatically corrects this reading for local barometric pressure. This correctionallows controllers to read the pilot’s true altitude on the radar screen.
Some misinformed pilots, finding themselves several hundred feet off anassigned altitude while being radar tracked, reach up and turn the Kollsmanwindow knob on their airplane’s altimeter so that the altimeter hands read theproper height. They’re hoping that ATC is seeing what the altimeter on theinstrument panel is showing. Nice try, but no banana. ATC is getting its infoelsewhere. The airplane’s altitude encoder, which is typically hidden behind theinstrument panel and totally invisible to the pilot, is telling tales on him. The visi-ble altimeter talks only to you; the encoding altimeter device talks only to ATC.
THE ALTITUDE ENCODING UNIT
Rod Machado’s Private Pilot Handbook
Photo courtesy of Bob Crystal
Licensed exclusively for DeWayne Britton ([email protected]) Transaction: #0002858938
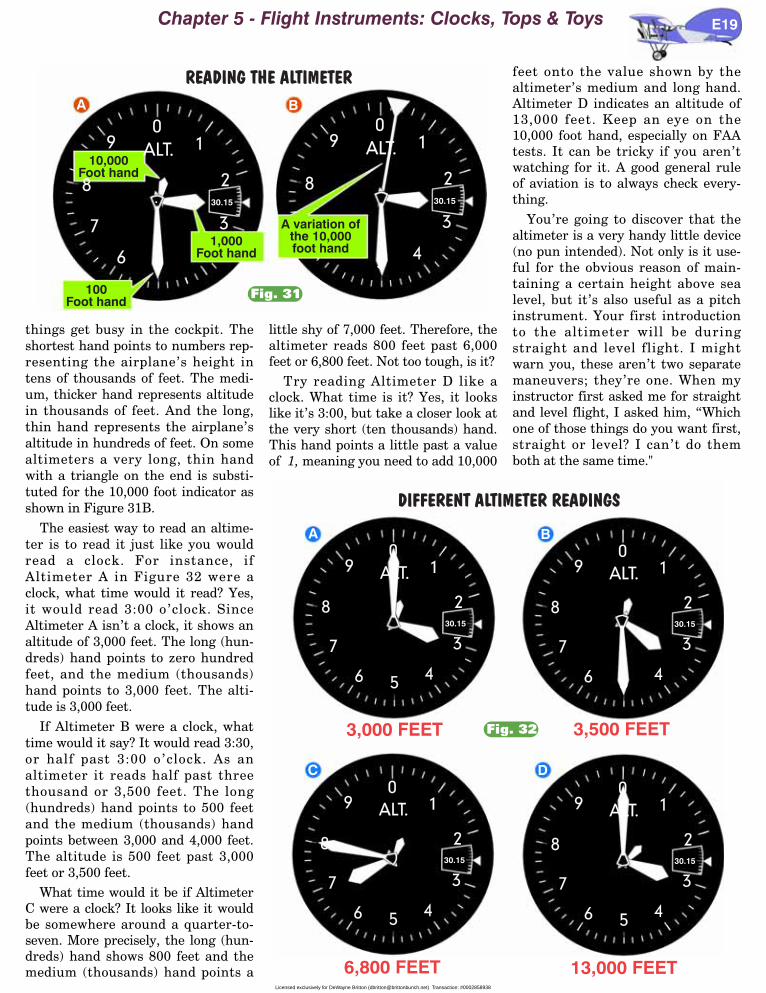
things get busy in the cockpit. Theshortest hand points to numbers rep-resenting the airplane’s height intens of thousands of feet. The medi-um, thicker hand represents altitudein thousands of feet. And the long,thin hand represents the airplane’saltitude in hundreds of feet. On somealtimeters a very long, thin handwith a triangle on the end is substi-tuted for the 10,000 foot indicator asshown in Figure 31B.
The easiest way to read an altime-ter is to read it just like you wouldread a clock. For instance, ifAltimeter A in Figure 32 were aclock, what time would it read? Yes,it would read 3:00 o’clock. SinceAltimeter A isn’t a clock, it shows analtitude of 3,000 feet. The long (hun-dreds) hand points to zero hundredfeet, and the medium (thousands)hand points to 3,000 feet. The alti-tude is 3,000 feet.
If Altimeter B were a clock, whattime would it say? It would read 3:30,or half past 3:00 o’clock. As analtimeter it reads half past threethousand or 3,500 feet. The long(hundreds) hand points to 500 feetand the medium (thousands) handpoints between 3,000 and 4,000 feet.The altitude is 500 feet past 3,000feet or 3,500 feet.
What time would it be if AltimeterC were a clock? It looks like it wouldbe somewhere around a quarter-to-seven. More precisely, the long (hun-dreds) hand shows 800 feet and themedium (thousands) hand points a
little shy of 7,000 feet. Therefore, thealtimeter reads 800 feet past 6,000feet or 6,800 feet. Not too tough, is it?
Try reading Altimeter D like aclock. What time is it? Yes, it lookslike it’s 3:00, but take a closer look atthe very short (ten thousands) hand.This hand points a little past a valueof 1, meaning you need to add 10,000
feet onto the value shown by thealtimeter’s medium and long hand.Altimeter D indicates an altitude of13,000 feet. Keep an eye on the10,000 foot hand, especially on FAAtests. It can be tricky if you aren’twatching for it. A good general ruleof aviation is to always check every-thing.
You’re going to discover that thealtimeter is a very handy little device(no pun intended). Not only is it use-ful for the obvious reason of main-taining a certain height above sealevel, but it’s also useful as a pitchinstrument. Your first introductionto the altimeter will be duringstraight and level flight. I mightwarn you, these aren’t two separatemaneuvers; they’re one. When myinstructor first asked me for straightand level flight, I asked him, “Whichone of those things do you want first,straight or level? I can’t do themboth at the same time."
Chapter 5 - Flight Instruments: Clocks, Tops & Toys E19
1
2
3
09
8
54
ALT.
30.15.
1
2
3
09
8
5
7
6
ALT.
30.15
READING THE ALTIMETERA
1,000Foot hand
10,000Foot hand
100Foot hand
B
A variation ofthe 10,000foot hand
Fig. 31
1
2
3
09
8
5
7
6 4
ALT.
30.15
1
2
3
09
8
5
7
6 4
ALT.
30.15
1
2
3
09
8
5
7
6 4
ALT.
30.15
1
2
3
09
8
5
7
6 4
ALT.
30.15
DIFFERENT ALTIMETER READINGS
3,000 FEET
A
3,500 FEET
B
6,800 FEET
C
13,000 FEET
D
Fig. 32
Licensed exclusively for DeWayne Britton ([email protected]) Transaction: #0002858938
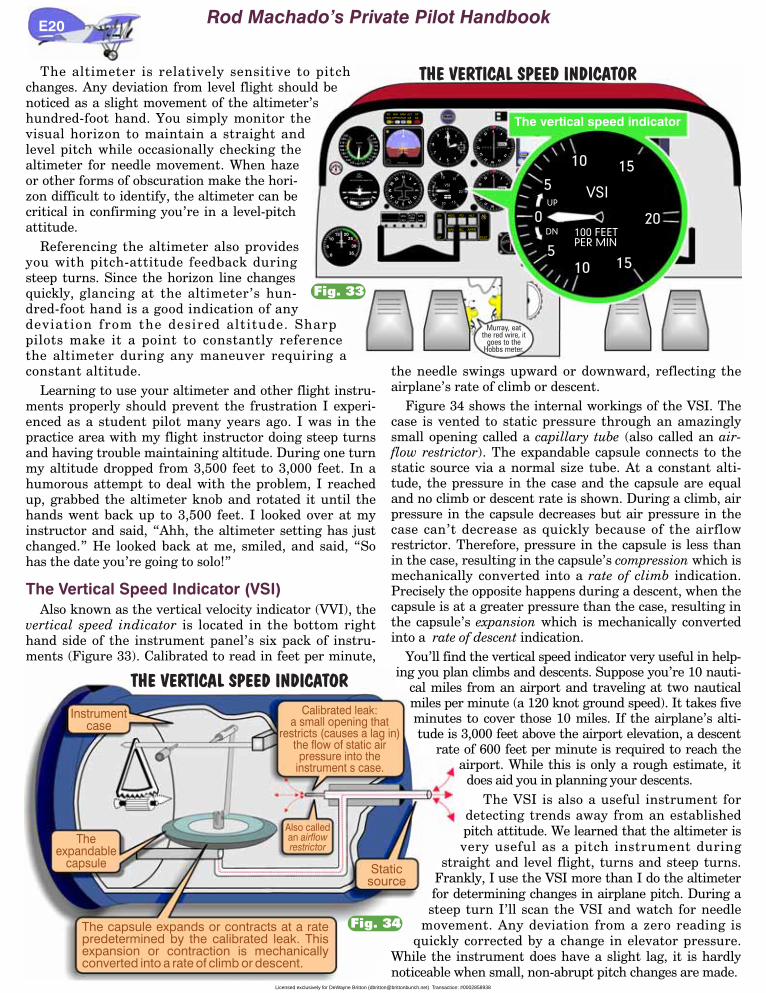
The altimeter is relatively sensitive to pitchchanges. Any deviation from level flight should benoticed as a slight movement of the altimeter’shundred-foot hand. You simply monitor thevisual horizon to maintain a straight andlevel pitch while occasionally checking thealtimeter for needle movement. When hazeor other forms of obscuration make the hori-zon difficult to identify, the altimeter can becritical in confirming you’re in a level-pitchattitude.
Referencing the altimeter also providesyou with pitch-attitude feedback duringsteep turns. Since the horizon line changesquickly, glancing at the altimeter’s hun-dred-foot hand is a good indication of anydeviation from the desired altitude. Sharppilots make it a point to constantly referencethe altimeter during any maneuver requiring aconstant altitude.
Learning to use your altimeter and other flight instru-ments properly should prevent the frustration I experi-enced as a student pilot many years ago. I was in thepractice area with my flight instructor doing steep turnsand having trouble maintaining altitude. During one turnmy altitude dropped from 3,500 feet to 3,000 feet. In ahumorous attempt to deal with the problem, I reachedup, grabbed the altimeter knob and rotated it until thehands went back up to 3,500 feet. I looked over at myinstructor and said, “Ahh, the altimeter setting has justchanged.” He looked back at me, smiled, and said, “Sohas the date you’re going to solo!”
The Vertical Speed Indicator (VSI)Also known as the vertical velocity indicator (VVI), the
vertical speed indicator is located in the bottom righthand side of the instrument panel’s six pack of instru-ments (Figure 33). Calibrated to read in feet per minute,
the needle swings upward or downward, reflecting theairplane’s rate of climb or descent.
Figure 34 shows the internal workings of the VSI. Thecase is vented to static pressure through an amazinglysmall opening called a capillary tube (also called an air-flow restrictor). The expandable capsule connects to thestatic source via a normal size tube. At a constant alti-tude, the pressure in the case and the capsule are equaland no climb or descent rate is shown. During a climb, airpressure in the capsule decreases but air pressure in thecase can’t decrease as quickly because of the airflowrestrictor. Therefore, pressure in the capsule is less thanin the case, resulting in the capsule’s compression which ismechanically converted into a rate of climb indication.Precisely the opposite happens during a descent, when thecapsule is at a greater pressure than the case, resulting inthe capsule’s expansion which is mechanically convertedinto a rate of descent indication.
You’ll find the vertical speed indicator very useful in help-ing you plan climbs and descents. Suppose you’re 10 nauti-
cal miles from an airport and traveling at two nauticalmiles per minute (a 120 knot ground speed). It takes fiveminutes to cover those 10 miles. If the airplane’s alti-tude is 3,000 feet above the airport elevation, a descent
rate of 600 feet per minute is required to reach theairport. While this is only a rough estimate, it
does aid you in planning your descents.The VSI is also a useful instrument for
detecting trends away from an establishedpitch attitude. We learned that the altimeter isvery useful as a pitch instrument during
straight and level flight, turns and steep turns.Frankly, I use the VSI more than I do the altimeterfor determining changes in airplane pitch. During asteep turn I’ll scan the VSI and watch for needle
movement. Any deviation from a zero reading isquickly corrected by a change in elevator pressure.
While the instrument does have a slight lag, it is hardlynoticeable when small, non-abrupt pitch changes are made.
E20
THE VERTICAL SPEED INDICATOR
0
15 2025
30
35
RPMHUNDREDS
5
10 10 10
Carb TempC
20 20304050 50
0
0
4"5"
6"
Suctioninches of Hg
DCELEC
TURN COORDINATOR
2 MIN
NO PITCH INFORMATION
L R
.
10
100 FEET
PER MIN
100 FEET
PER MIN
VSI
DN
UP
5
0
5
15
20
1510
.
330
3
69
12
1518
21
24
27
30
FROM
.
330
3
6
1821
24
30
FROM
STORE TO FREQ
FROM
TERMAPCHENRT
CDI Sensitivity
PullTurn
KLGB
ACTV
ARM
APR
GPS
NAV
LEG
OBS
FD
HDG
NAV
APPR
ARM
CPLD
ALT
GS
AP
GA
FD A O M TRM
DN
UP
HDG
NAV APPR
TEST
ALT APON
FD
BC
60
90
70
80
100
110
120130140
150
160
170
180
190
200
210
220 50
40
KNOTS
230
20
20
20
20
10
10
10
10
DH
Attitude Inc.
.
1
2
3
09
8
5
7
6 4
ALT.
30.15
N 33 3036
Murray, eatthe red wire, it
goes to theHobbs meter.
.
10
VSI
DN
UP
5
0
5
15
20
1510
100 FEETPER MIN
The vertical speed indicator
.
33N 3
6E
12
15S21
24
W30
Fig. 33
THE VERTICAL SPEED INDICATORCalibrated leak:
a small opening thatrestricts (causes a lag in)
the flow of static airpressure into the
instrument s case.
Staticsource
Instrumentcase
Also calledan airflowrestrictor
Theexpandable
capsule
The capsule expands or contracts at a ratepredetermined by the calibrated leak. Thisexpansion or contraction is mechanicallyconverted into a rate of climb or descent.
Fig. 34
Rod Machado’s Private Pilot Handbook
Licensed exclusively for DeWayne Britton ([email protected]) Transaction: #0002858938
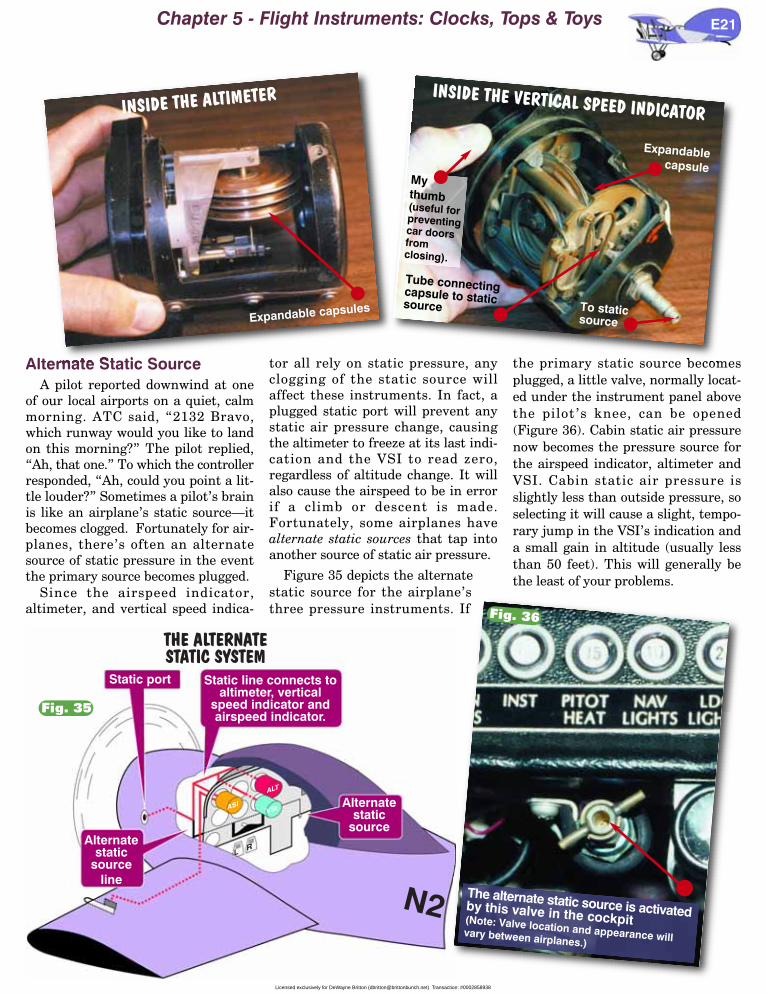
Alternate Static SourceA pilot reported downwind at one
of our local airports on a quiet, calmmorning. ATC said, “2132 Bravo,which runway would you like to landon this morning?” The pilot replied,“Ah, that one.” To which the controllerresponded, “Ah, could you point a lit-tle louder?” Sometimes a pilot’s brainis like an airplane’s static source—itbecomes clogged. Fortunately for air-planes, there’s often an alternatesource of static pressure in the eventthe primary source becomes plugged.
Since the airspeed indicator,altimeter, and vertical speed indica-
tor all rely on static pressure, anyclogging of the static source willaffect these instruments. In fact, aplugged static port will prevent anystatic air pressure change, causingthe altimeter to freeze at its last indi-cation and the VSI to read zero,regardless of altitude change. It willalso cause the airspeed to be in errorif a climb or descent is made.Fortunately, some airplanes havealternate static sources that tap intoanother source of static air pressure.
Figure 35 depicts the alternatestatic source for the airplane’sthree pressure instruments. If
the primary static source becomesplugged, a little valve, normally locat-ed under the instrument panel abovethe pilot’s knee, can be opened(Figure 36). Cabin static air pressurenow becomes the pressure source forthe airspeed indicator, altimeter andVSI. Cabin static air pressure isslightly less than outside pressure, soselecting it will cause a slight, tempo-rary jump in the VSI’s indication anda small gain in altitude (usually lessthan 50 feet). This will generally bethe least of your problems.
Chapter 5 - Flight Instruments: Clocks, Tops & Toys E21
N2
L R
ALT
VSI
THE ALTERNATESTATIC SYSTEM
ASI
Static line connects toaltimeter, vertical
speed indicator andairspeed indicator.
Static port
Alternatestatic
sourceline
Alternatestatic
source
Fig. 35
INSIDE THE ALTIMETER INSIDE THE VERTICAL SPEED INDICATOR
Tube connectingcapsule to staticsource
Expandablecapsule
To staticsource
Fig. 36
Expandable capsules
The alternate static source is activatedby this valve in the cockpit (Note: Valve location and appearance willvary between airplanes.)
Mythumb(useful forpreventingcar doorsfromclosing).
Licensed exclusively for DeWayne Britton ([email protected]) Transaction: #0002858938
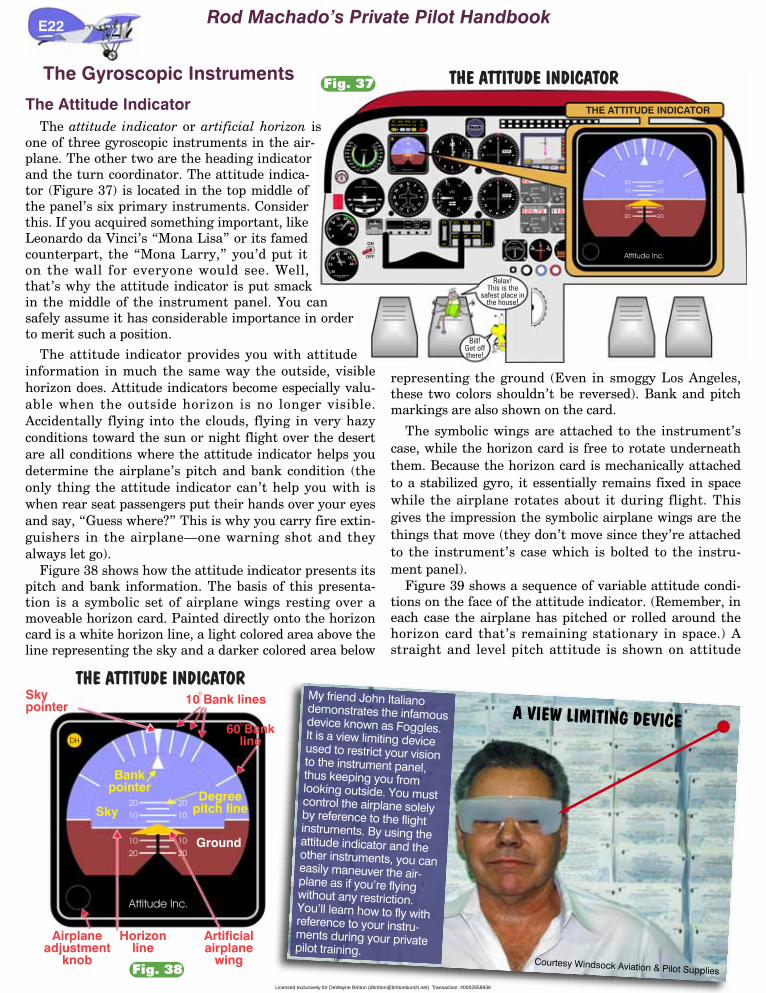
The Gyroscopic Instruments
The Attitude IndicatorThe attitude indicator or artificial horizon is
one of three gyroscopic instruments in the air-plane. The other two are the heading indicatorand the turn coordinator. The attitude indica-tor (Figure 37) is located in the top middle ofthe panel’s six primary instruments. Considerthis. If you acquired something important, likeLeonardo da Vinci’s “Mona Lisa” or its famedcounterpart, the “Mona Larry,” you’d put iton the wall for everyone would see. Well,that’s why the attitude indicator is put smackin the middle of the instrument panel. You cansafely assume it has considerable importance in orderto merit such a position.
The attitude indicator provides you with attitudeinformation in much the same way the outside, visiblehorizon does. Attitude indicators become especially valu-able when the outside horizon is no longer visible.Accidentally flying into the clouds, flying in very hazyconditions toward the sun or night flight over the desertare all conditions where the attitude indicator helps youdetermine the airplane’s pitch and bank condition (theonly thing the attitude indicator can’t help you with iswhen rear seat passengers put their hands over your eyesand say, “Guess where?” This is why you carry fire extin-guishers in the airplane—one warning shot and theyalways let go).
Figure 38 shows how the attitude indicator presents itspitch and bank information. The basis of this presenta-tion is a symbolic set of airplane wings resting over amoveable horizon card. Painted directly onto the horizoncard is a white horizon line, a light colored area above theline representing the sky and a darker colored area below
representing the ground (Even in smoggy Los Angeles,these two colors shouldn’t be reversed). Bank and pitchmarkings are also shown on the card.
The symbolic wings are attached to the instrument’scase, while the horizon card is free to rotate underneaththem. Because the horizon card is mechanically attachedto a stabilized gyro, it essentially remains fixed in spacewhile the airplane rotates about it during flight. Thisgives the impression the symbolic airplane wings are thethings that move (they don’t move since they’re attachedto the instrument’s case which is bolted to the instru-ment panel).
Figure 39 shows a sequence of variable attitude condi-tions on the face of the attitude indicator. (Remember, ineach case the airplane has pitched or rolled around thehorizon card that’s remaining stationary in space.) Astraight and level pitch attitude is shown on attitude
E22
THE ATTITUDE INDICATOR
0
15 2025
30
35
RPMHUNDREDS
5
10
10 10
Carb TempC
20 2030 3040 40
50 50
0
0
60
0
60
AMPERES
DCELEC
TURN COORDINATOR
2 MIN
NO PITCH INFORMATION
L R
.
10
100 FEET
PER MIN
100 FEET
PER MIN
VSI
DN
UP
5
0
5
15
20
1510
.
330
3
69
12
27
30
FROM
.
330
3
69
12
1518
21
24
27
30
FROM
OFF
TO FREQ
FR
OFF
STORE
12
SELECT
RECALL
OFF
STORE
125.75
SELECT
MicroComm Radios
RECALL
OFF
TO
115
FREQ
TERMAPCHENRT
CDI Sensitivity Mode Status
PullTurn
MSG FPL OBS
DTK
XTK
TRK
BRG
DIS
KLGB000
227
227
227
19.5
OBS Mode
KLGB
-
RCT
ACTV
ARM
APR
GPS
NAV
LEG
OBS
FD
HDG
NAV
APPR
ARM
CPLD
ALT
GS
AP
GA
FD A O M TRM
DN
UP
HDG
NAV APPR
TEST
ALT APON
FD
BC
60
90
70
80
100
110
120130140
150
160
170
180
190
200
210
220 50
40
KNOTS
230
20
20
20
20
10
10
10
10
DH
Attitude Inc.
- +0
SLAVEIN
10
15
20
25 30
35
40
MANIFOLD
PRESSURE
INCHES OF MERCURY
ABSOLUTE
R
N 33 3036
.
1
2
09
8
5
7
6 4
ALT.
30.15
OFF
ON
1 2 3
EGT
*
Relax!This is the
safest place inthe house!
Bill!Get offthere!
20
20
20
20
10
10
10
10
Attitude Inc.
THE ATTITUDE INDICATOR
4"5"
6"
Suctioninches of Hg
.
33N 3
6E
12
15S21
24
W30
THE ATTITUDE INDICATOR
20
20
20
20
10
10
10
10
DH
Attitude Inc.
Degreepitch line
Horizonline
Sky
Bankpointer
Ground
10 Bank lineso
60 Bankline
o
Skypointer
Airplaneadjustment
knob
Artificialairplane
wing
Fig. 37
Fig. 38
A VIEW LIMITING DEVICE
Courtesy Windsock Aviation & Pilot Supplies
My friend John Italianodemonstrates the infamousdevice known as Foggles.It is a view limiting deviceused to restrict your visionto the instrument panel,thus keeping you from
looking outside. You mustcontrol the airplane solelyby reference to the flightinstruments. By using theattitude indicator and theother instruments, you caneasily maneuver the air-plane as if you’re flyingwithout any restriction.You’ll learn how to fly withreference to your instru-ments during your privatepilot training.
Rod Machado’s Private Pilot Handbook
Licensed exclusively for DeWayne Britton ([email protected]) Transaction: #0002858938
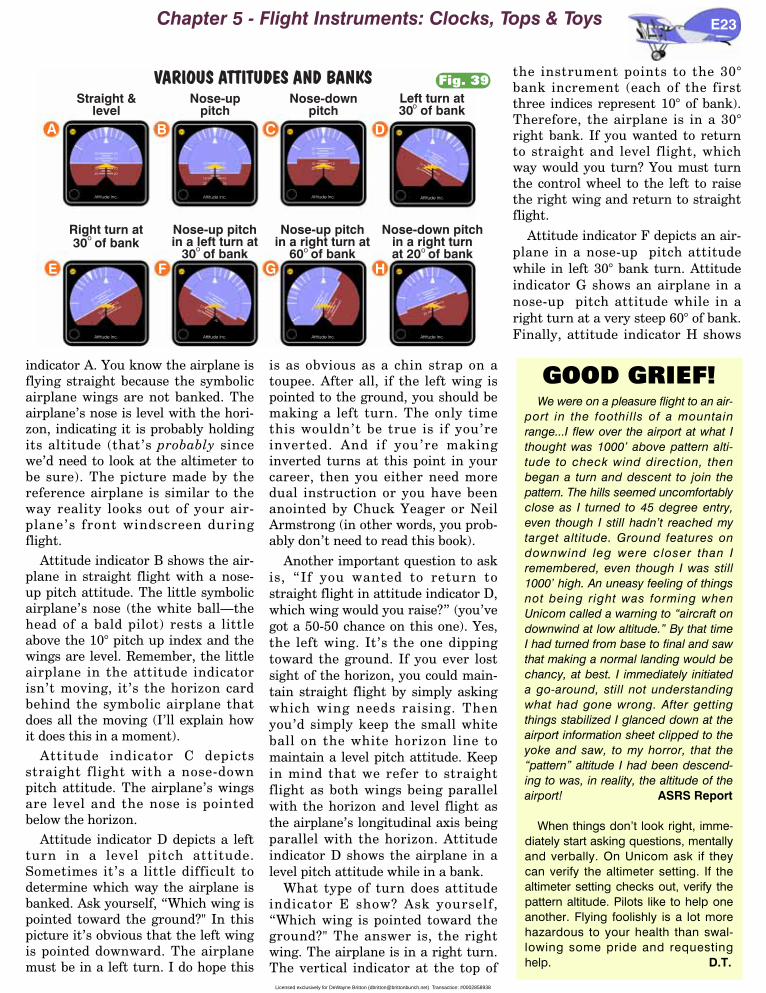
indicator A. You know the airplane isflying straight because the symbolicairplane wings are not banked. Theairplane’s nose is level with the hori-zon, indicating it is probably holdingits altitude (that’s probably sincewe’d need to look at the altimeter tobe sure). The picture made by thereference airplane is similar to theway reality looks out of your air-plane’s front windscreen duringflight.
Attitude indicator B shows the air-plane in straight flight with a nose-up pitch attitude. The little symbolicairplane’s nose (the white ball—thehead of a bald pilot) rests a littleabove the 10° pitch up index and thewings are level. Remember, the littleairplane in the attitude indicatorisn’t moving, it’s the horizon cardbehind the symbolic airplane thatdoes all the moving (I’ll explain howit does this in a moment).
Attitude indicator C depictsstraight flight with a nose-downpitch attitude. The airplane’s wingsare level and the nose is pointedbelow the horizon.
Attitude indicator D depicts a leftturn in a level pitch attitude.Sometimes it’s a little difficult todetermine which way the airplane isbanked. Ask yourself, “Which wing ispointed toward the ground?" In thispicture it’s obvious that the left wingis pointed downward. The airplanemust be in a left turn. I do hope this
is as obvious as a chin strap on atoupee. After all, if the left wing ispointed to the ground, you should bemaking a left turn. The only timethis wouldn’t be true is if you’reinverted. And if you’re makinginverted turns at this point in yourcareer, then you either need moredual instruction or you have beenanointed by Chuck Yeager or NeilArmstrong (in other words, you prob-ably don’t need to read this book).
Another important question to askis, “If you wanted to return tostraight flight in attitude indicator D,which wing would you raise?” (you’vegot a 50-50 chance on this one). Yes,the left wing. It’s the one dippingtoward the ground. If you ever lostsight of the horizon, you could main-tain straight flight by simply askingwhich wing needs raising. Thenyou’d simply keep the small whiteball on the white horizon line tomaintain a level pitch attitude. Keepin mind that we refer to straightflight as both wings being parallelwith the horizon and level flight asthe airplane’s longitudinal axis beingparallel with the horizon. Attitudeindicator D shows the airplane in alevel pitch attitude while in a bank.
What type of turn does attitudeindicator E show? Ask yourself,“Which wing is pointed toward theground?" The answer is, the rightwing. The airplane is in a right turn.The vertical indicator at the top of
the instrument points to the 30°bank increment (each of the firstthree indices represent 10° of bank).Therefore, the airplane is in a 30°right bank. If you wanted to returnto straight and level flight, whichway would you turn? You must turnthe control wheel to the left to raisethe right wing and return to straightflight.
Attitude indicator F depicts an air-plane in a nose-up pitch attitudewhile in left 30° bank turn. Attitudeindicator G shows an airplane in anose-up pitch attitude while in aright turn at a very steep 60° of bank.Finally, attitude indicator H shows
Chapter 5 - Flight Instruments: Clocks, Tops & Toys E23
VARIOUS ATTITUDES AND BANKSStraight &
levelNose-up
pitchNose-down
pitch
Nose-up pitchin a left turn at
30 of bank
A
E
B
F
C
G
D
H
Left turn at30 of banko
Nose-down pitchin a right turnat 20 of banko
Nose-up pitchin a right turn at
60 of bankoo
Right turn at30 of banko
20
20
20
20
10
10
10
10
DH
Attitude Inc.
20
20
20
20
10
10
10
10
DH
Attitude Inc.
20
20
20
20
10
10
10
10
DH
Attitude Inc.
20
20
20
20
10
10 10
10
DH
Attitude Inc.
20
20
20
2010
10
10
10
DH
Attitude Inc.
20
20
20
20
10
10 10
10
DH
Attitude Inc.
20
20
20
20
10
1010
10
DH
Attitude Inc.
20
20
20
20
10
10
10
10
DH
Attitude Inc.
Fig. 39
GOOD GRIEF!We were on a pleasure flight to an air-
port in the foothills of a mountainrange...I flew over the airport at what Ithought was 1000’ above pattern alti-tude to check wind direction, thenbegan a turn and descent to join thepattern. The hills seemed uncomfortablyclose as I turned to 45 degree entry,even though I still hadn’t reached mytarget altitude. Ground features ondownwind leg were closer than Iremembered, even though I was still1000’ high. An uneasy feeling of thingsnot being right was forming whenUnicom called a warning to “aircraft ondownwind at low altitude.” By that timeI had turned from base to final and sawthat making a normal landing would bechancy, at best. I immediately initiateda go-around, still not understandingwhat had gone wrong. After gettingthings stabilized I glanced down at theairport information sheet clipped to theyoke and saw, to my horror, that the“pattern” altitude I had been descend-ing to was, in reality, the altitude of theairport! ASRS Report
When things don’t look right, imme-diately start asking questions, mentallyand verbally. On Unicom ask if theycan verify the altimeter setting. If thealtimeter setting checks out, verify thepattern altitude. Pilots like to help oneanother. Flying foolishly is a lot morehazardous to your health than swal-lowing some pride and requestinghelp. D.T.
Licensed exclusively for DeWayne Britton ([email protected]) Transaction: #0002858938
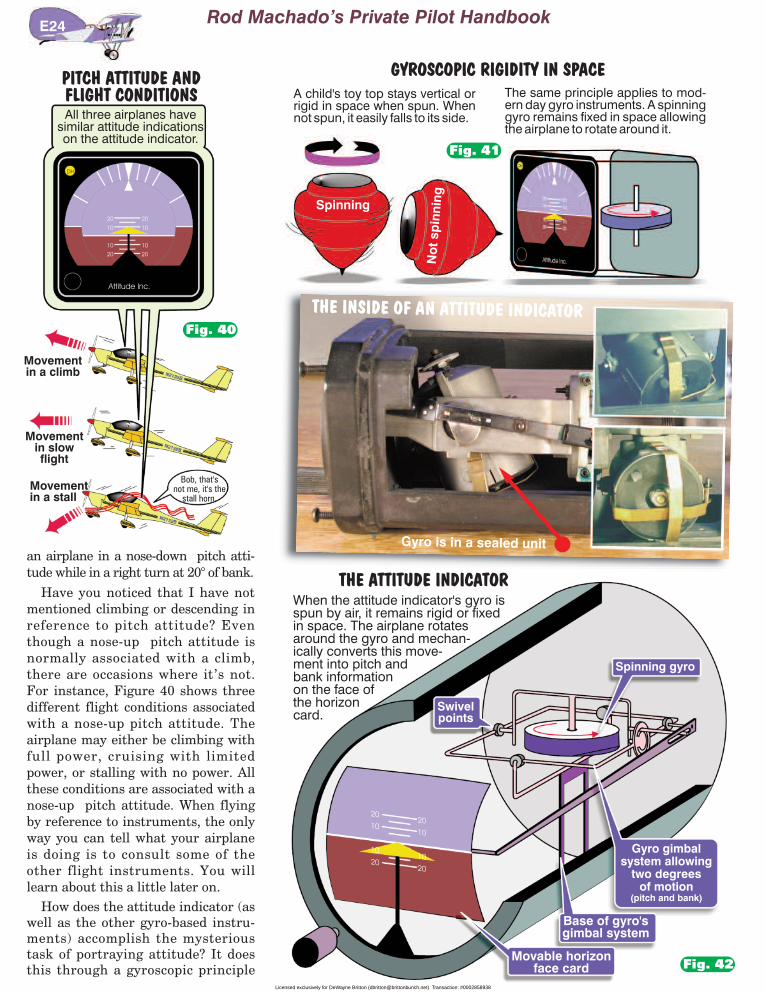
an airplane in a nose-down pitch atti-tude while in a right turn at 20° of bank.
Have you noticed that I have notmentioned climbing or descending inreference to pitch attitude? Eventhough a nose-up pitch attitude isnormally associated with a climb,there are occasions where it’s not.For instance, Figure 40 shows threedifferent flight conditions associatedwith a nose-up pitch attitude. Theairplane may either be climbing withfull power, cruising with limitedpower, or stalling with no power. Allthese conditions are associated with anose-up pitch attitude. When flyingby reference to instruments, the onlyway you can tell what your airplaneis doing is to consult some of theother flight instruments. You willlearn about this a little later on.
How does the attitude indicator (aswell as the other gyro-based instru-ments) accomplish the mysterioustask of portraying attitude? It doesthis through a gyroscopic principle
E24
Bob, that'snot me, it's the
stall horn.
Movementin a climb
Movementin slowflight
Movementin a stall
PITCH ATTITUDE ANDFLIGHT CONDITIONSAll three airplanes have
similar attitude indicationson the attitude indicator.
20
20
20
20
10
10
10
10
DH
Attitude Inc.
A child's toy top stays vertical orrigid in space when spun. Whennot spun, it easily falls to its side.
The same principle applies to mod-ern day gyro instruments. A spinninggyro remains fixed in space allowingthe airplane to rotate around it.
Spinning
No
t sp
inni
ng
GYROSCOPIC RIGIDITY IN SPACE
Fig. 41
Fig. 40
When the attitude indicator's gyro isspun by air, it remains rigid or fixedin space. The airplane rotatesaround the gyro and mechan-ically converts this move-ment into pitch andbank informationon the face ofthe horizoncard.
20
20
20
20
10
10
10
10
Swivelpoints
Spinning gyro
Gyro gimbalsystem allowing
two degreesof motion
(pitch and bank)
Base of gyro'sgimbal system
Movable horizonface card
THE ATTITUDE INDICATOR
Fig. 42
THE INSIDE OF AN ATTITUDE INDICATOR
Gyro is in a sealed unit
Rod Machado’s Private Pilot Handbook
Licensed exclusively for DeWayne Britton ([email protected]) Transaction: #0002858938
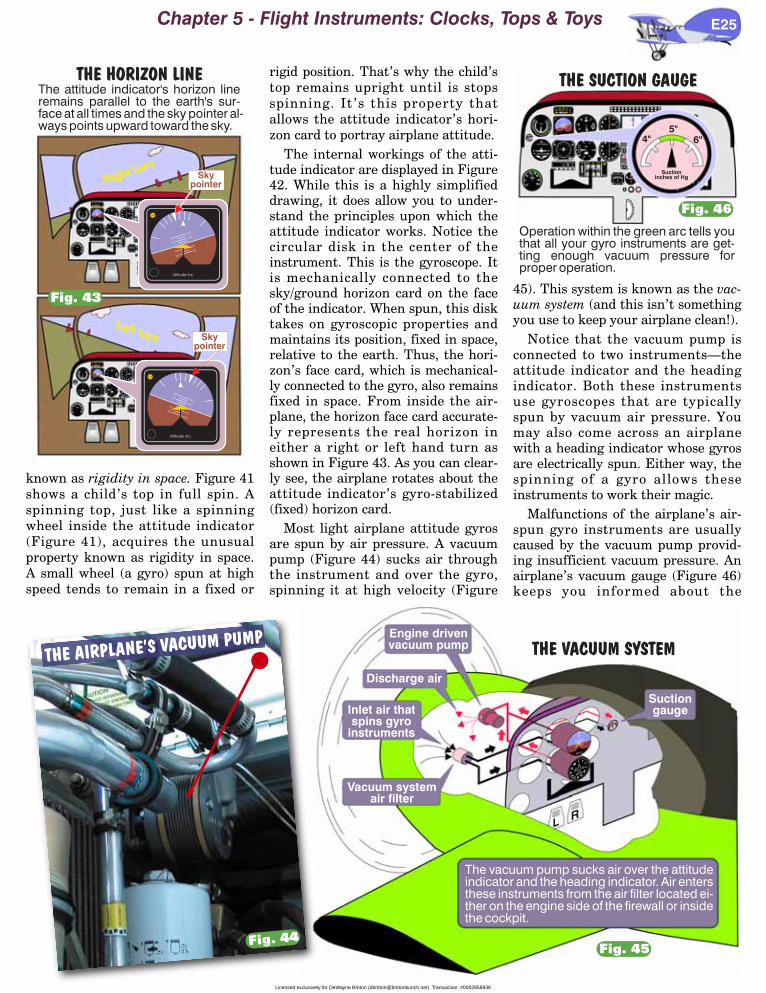
known as rigidity in space. Figure 41shows a child’s top in full spin. Aspinning top, just like a spinningwheel inside the attitude indicator(Figure 41), acquires the unusualproperty known as rigidity in space.A small wheel (a gyro) spun at highspeed tends to remain in a fixed or
rigid position. That’s why the child’stop remains upright until is stopsspinning. It’s this property thatallows the attitude indicator’s hori-zon card to portray airplane attitude.
The internal workings of the atti-tude indicator are displayed in Figure42. While this is a highly simplifieddrawing, it does allow you to under-stand the principles upon which theattitude indicator works. Notice thecircular disk in the center of theinstrument. This is the gyroscope. Itis mechanically connected to thesky/ground horizon card on the faceof the indicator. When spun, this disktakes on gyroscopic properties andmaintains its position, fixed in space,relative to the earth. Thus, the hori-zon’s face card, which is mechanical-ly connected to the gyro, also remainsfixed in space. From inside the air-plane, the horizon face card accurate-ly represents the real horizon ineither a right or left hand turn asshown in Figure 43. As you can clear-ly see, the airplane rotates about theattitude indicator’s gyro-stabilized(fixed) horizon card.
Most light airplane attitude gyrosare spun by air pressure. A vacuumpump (Figure 44) sucks air throughthe instrument and over the gyro,spinning it at high velocity (Figure
45). This system is known as the vac-uum system (and this isn’t somethingyou use to keep your airplane clean!).
Notice that the vacuum pump isconnected to two instruments—theattitude indicator and the headingindicator. Both these instrumentsuse gyroscopes that are typicallyspun by vacuum air pressure. Youmay also come across an airplanewith a heading indicator whose gyrosare electrically spun. Either way, thespinning of a gyro allows theseinstruments to work their magic.
Malfunctions of the airplane’s air-spun gyro instruments are usuallycaused by the vacuum pump provid-ing insufficient vacuum pressure. Anairplane’s vacuum gauge (Figure 46)keeps you informed about the
Chapter 5 - Flight Instruments: Clocks, Tops & Toys E25
Right turn
Left turn
Flaps
10o
20o
30o
0
15 2025
30
35
RPMHUNDREDS
5
10 10 10
Carb TempC
20 2030 3040 40
50 50
0
0
60
0
60
AMPERES
4"5"
6"
Suctioninches of Hg
25 F / DIVOEGT
DCELEC
TURN COORDINATOR
2 MIN
NO PITCH INFORMATION
L R
.
10
100 FEET
PER MIN
100 FEET
PER MIN
VSI
DN
UP
5
0
5
15
20
1510
.
33330
3
69
12
12
151518
2121
24
24
27
27
30
FROM
.
33330
3
69
12
12
15151818
2121
24
24
27
27
30
FROM
OF
F
TO
115.7
FREQ
MicronNav Radios
FROM
OF
F
STORE
125.75
SELECT
MicroComm Radios
RECALL
OF
F
STORE
125.75
SELECT
MicroComm Radios
RECALL
OF
F
TO
115.7
FREQ
MicronNav Radios
FROM
TERMAPCHENRT
CDI Sensitivity Mode Status
PullTurn
PullTurn
Direct
Enter
MSG FPL OBS
DTK0
XTK
TRK0
BRG0
DISNM
Slave HSITo VOR
KLGB000
227
227
227
19.5
OBS Mode
KLGB
Menu
GS GS
CRSCRS HDGHDG
.
33N
3
6E
12
15S21
24
W30
50
OFFSBY
WXGMAPFP
TST
MIN
GAIN
MAX
TILT+
- BRT
OFF
LXCLRSBYTST
20
10
LX
RCT
WXT
1 2 3 4 T
GCR
RCT
TCT
TRB
AZ
SCT
40
30
Lightning Detection
TIME -25-50-100-200
ACTV
ARM
APR
GPS
NAV
LEG
OBS
FD
HDG
NAV
APPR
ARM
CPLD
ALT
GS
AP
GA
FD A O M TRM
DN
UP
HDG
NAV APPR
TEST
ALT APON
FD
BC
60
90
70
80
100
110
120130140
150
160
170
180
190
200
210
220 50
40
KNOTS
230
.
1
2
3
09
8
5
7
6 4
ALT.
30.15Flaps
10o
20o
30o
50
OFFSBY TST
MIN MAX
TILT+
- BRT
OFF
LX CLRSBYTST
20
10
AZ
SCT
40
30
Lightning Detection
TIME -25-50-100-200
20
20
20
20
10
10
10
10
DH
Attitude Inc.
Flaps
10o
20o
30o
0
15 2025
30
35
RPMHUNDREDS
5
10 10 10
Carb TempC
20 2030 3040 40
50 50
0
0
60
0
60
AMPERES
4"5"
6"
Suctioninches of Hg
25 F / DIVOEGT
DCELEC
TURN COORDINATOR
2 MIN
NO PITCH INFORMATION
L R
.
10
100 FEET
PER MIN
100 FEET
PER MIN
VSI
DN
UP
5
0
5
15
20
1510
.
33330
3
69
12
12
151518
2121
24
24
27
27
30
FROM
.
33330
3
69
12
12
151518
2121
24
24
27
27
30
FROM
OF
F
TO
115.7
FREQ
MicronNav Radios
FROM
OF
F
STORE
125.75
SELECT
MicroComm Radios
RECALL
OF
F
STORE
125.75
SELECT
MicroComm Radios
RECALL
OF
F
TO
115.7
FREQ
MicronNav Radios
FROM
TERMAPCHENRT
CDI Sensitivity Mode Status
PullTurn
PullTurn
Direct
Enter
MSG FPL OBS
DTK0
XTK
TRK0
BRG0
DISNM
Slave HSITo VOR
KLGB000
227
227
227
19.5
OBS Mode
KLGB
Menu
GS GS
CRSCRS HDGHDG
.
33N
3
6E
12
15S21
24
W30
50
OFFSBY
WXGMAPFP
TST
MIN
GAIN
MAX
TILT+
- BRT
OFF
LXCLRSBYTST
20
10
LX
RCT
WXT
1 2 3 4 T
GCR
RCT
TCT
TRB
AZ
SCT
40
30
Lightning Detection
TIME -25-50-100-200
ACTV
ARM
APR
GPS
NAV
LEG
OBS
FD
HDG
NAV
APPR
ARM
CPLD
ALT
GS
AP
GA
FD A O M TRM
DN
UP
HDG
NAV APPR
TEST
ALT APON
FD
BC
60
90
70
80
100
110
120130140
150
160
170
180
190
200
210
220 50
40
KNOTS
230
.
1
2
3
09
8
5
7
6 4
ALT.
30.15Flaps
10o
20o
30o
25 F / DIVOEGT
50
OFFSBYWXGMAPFPTST
MIN
GAIN
MAX
TILT+
- BRT
OFF
LX CLRSBY TST
20
10
LX
RCT
WXT
1 2 3 4 T
GCR
RCT
TCT
TRB
AZ
SCT
40
30
Lightning Detection
TIME -25-50-100-200 20
20
20
20
10
1010
10
DH
Attitude Inc.
THE HORIZON LINEThe attitude indicator's horizon lineremains parallel to the earth's sur-face at all times and the sky pointer al-ways points upward toward the sky.
Flaps
10o
20o
30o
25 F / DIVOEGT
50
OFFSBY
WXGMAPFP
TST
MIN
GAIN
MAX
TILT+
- BRT
OFF
LXCLRSBYTST
20
10
LX
RCT
WXT
1 2 3 4 T
GCR
RCT
TCT
TRB
AZ
SCT
40
30
Lightning Detection
TIME -25-50-100-200 20
20
20
20
10
1010
10
DH
Attitude Inc.
Skypointer
Flaps
10o
20o
30o
25 F / DIVOEGT
TO
115.7
FREQ
MicronNav Radios
FROM
TO
115.7
FREQ
MicronNav Radios
FROM
Mode Status
PullTurn
Direct
Enter
FPL OBS
DTK0
XTK
TRK0
BRG0
DISNM
Slave HSITo VOR
000
227
227
227
19.5
OBS Mode
Menu
50
OFFSBY
WXGMAPFP
TST
MIN
GAIN
MAX
TILT+
- BRT
OFF
LXCLRSBYTST
20
10
LX
RCT
WXT
1 2 3 4 T
GCR
RCT
TCT
TRB
AZ
SCT
40
30
Lightning Detection
TIME -25-50-100-200
20
20
20
20
10
10
10
10
DH
Attitude Inc.
Skypointer
L R
.
33
33
03
6
912
12
15
18212427
30
4"
5" 6"
Suction
inches of Hg
Engine drivenvacuum pump
Discharge air
Inlet air thatspins gyro
instruments
Vacuum systemair filter
Suctiongauge
The vacuum pump sucks air over the attitudeindicator and the heading indicator. Air entersthese instruments from the air filter located ei-ther on the engine side of the firewall or insidethe cockpit.
THE VACUUM SYSTEM
Fig. 44Fig. 45
Fig. 43
THE SUCTION GAUGE
Operation within the green arc tells youthat all your gyro instruments are get-ting enough vacuum pressure forproper operation.
4"5"
6"
Suctioninches of Hg
Fig. 46
THE AIRPLANE’S VACUUM PUMP
Licensed exclusively for DeWayne Britton ([email protected]) Transaction: #0002858938
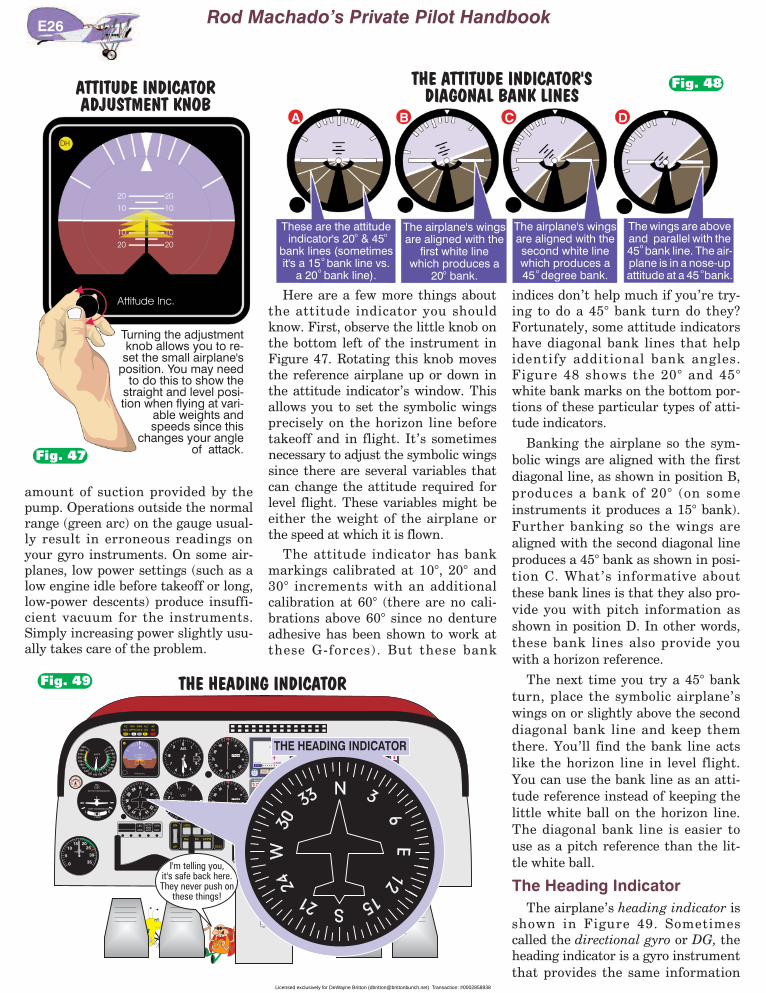
amount of suction provided by thepump. Operations outside the normalrange (green arc) on the gauge usual-ly result in erroneous readings onyour gyro instruments. On some air-planes, low power settings (such as alow engine idle before takeoff or long,low-power descents) produce insuffi-cient vacuum for the instruments.Simply increasing power slightly usu-ally takes care of the problem.
Here are a few more things aboutthe attitude indicator you shouldknow. First, observe the little knob onthe bottom left of the instrument inFigure 47. Rotating this knob movesthe reference airplane up or down inthe attitude indicator’s window. Thisallows you to set the symbolic wingsprecisely on the horizon line beforetakeoff and in flight. It’s sometimesnecessary to adjust the symbolic wingssince there are several variables thatcan change the attitude required forlevel flight. These variables might beeither the weight of the airplane orthe speed at which it is flown.
The attitude indicator has bankmarkings calibrated at 10°, 20° and30° increments with an additionalcalibration at 60° (there are no cali-brations above 60° since no dentureadhesive has been shown to work atthese G-forces). But these bank
indices don’t help much if you’re try-ing to do a 45° bank turn do they?Fortunately, some attitude indicatorshave diagonal bank lines that helpidentify additional bank angles.Figure 48 shows the 20° and 45°white bank marks on the bottom por-tions of these particular types of atti-tude indicators.
Banking the airplane so the sym-bolic wings are aligned with the firstdiagonal line, as shown in position B,produces a bank of 20° (on someinstruments it produces a 15° bank).Further banking so the wings arealigned with the second diagonal lineproduces a 45° bank as shown in posi-tion C. What’s informative aboutthese bank lines is that they also pro-vide you with pitch information asshown in position D. In other words,these bank lines also provide youwith a horizon reference.
The next time you try a 45° bankturn, place the symbolic airplane’swings on or slightly above the seconddiagonal bank line and keep themthere. You’ll find the bank line actslike the horizon line in level flight.You can use the bank line as an atti-tude reference instead of keeping thelittle white ball on the horizon line.The diagonal bank line is easier touse as a pitch reference than the lit-tle white ball.
The Heading IndicatorThe airplane’s heading indicator is
shown in Figure 49. Sometimescalled the directional gyro or DG, theheading indicator is a gyro instrumentthat provides the same information
E26
ATTITUDE INDICATORADJUSTMENT KNOB
20
20
20
20
10
10
10
10
DH
Attitude Inc.
Turning the adjustmentknob allows you to re-set the small airplane's
position. You may needto do this to show the
straight and level posi-tion when flying at vari-
able weights andspeeds since this
changes your angleof attack.Fig. 47
These are the attitudeindicator's 20 & 45
bank lines (sometimesit's a 15 bank line vs.
a 20 bank line).
00
0
0
The airplane's wingsare aligned with the
first white linewhich produces a
20 bank.
The airplane's wingsare aligned with thesecond white linewhich produces a45 degree bank.
The wings are aboveand parallel with the45 bank line. The air-plane is in a nose-upattitude at a 45 bank.0 0
0
0
THE ATTITUDE INDICATOR'SDIAGONAL BANK LINES
A DCB
Fig. 48
Fig. 49
Rod Machado’s Private Pilot Handbook
Licensed exclusively for DeWayne Britton ([email protected]) Transaction: #0002858938
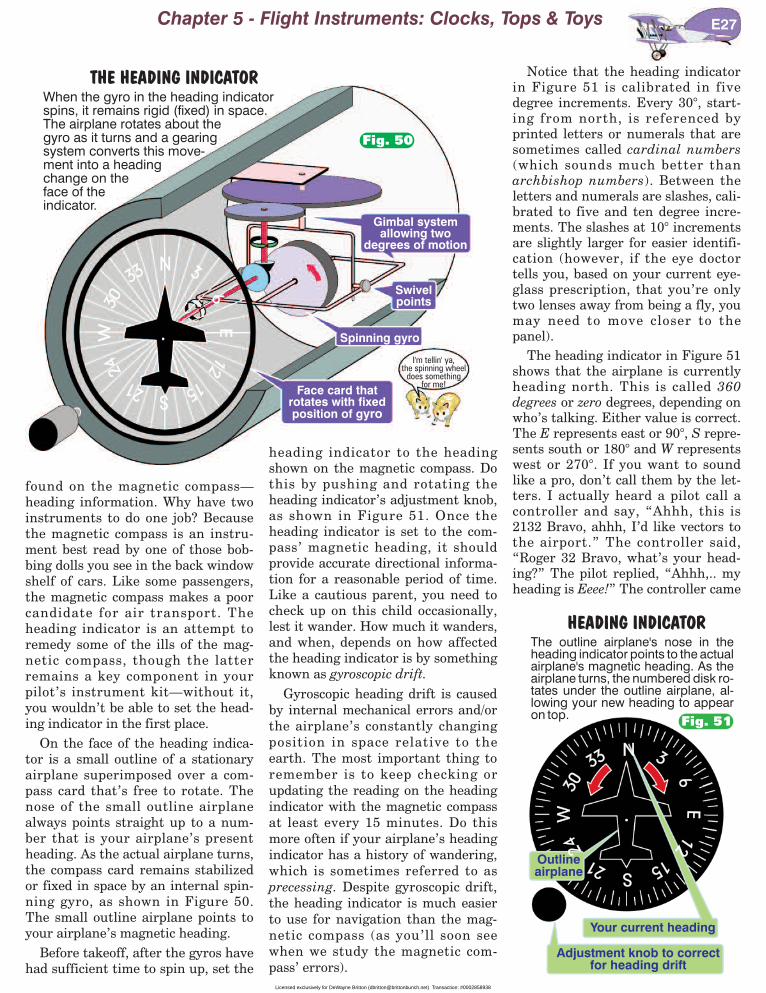
found on the magnetic compass—heading information. Why have twoinstruments to do one job? Becausethe magnetic compass is an instru-ment best read by one of those bob-bing dolls you see in the back windowshelf of cars. Like some passengers,the magnetic compass makes a poorcandidate for air transport. Theheading indicator is an attempt toremedy some of the ills of the mag-netic compass, though the latterremains a key component in yourpilot’s instrument kit—without it,you wouldn’t be able to set the head-ing indicator in the first place.
On the face of the heading indica-tor is a small outline of a stationaryairplane superimposed over a com-pass card that’s free to rotate. Thenose of the small outline airplanealways points straight up to a num-ber that is your airplane’s presentheading. As the actual airplane turns,the compass card remains stabilizedor fixed in space by an internal spin-ning gyro, as shown in Figure 50.The small outline airplane points toyour airplane’s magnetic heading.
Before takeoff, after the gyros havehad sufficient time to spin up, set the
heading indicator to the headingshown on the magnetic compass. Dothis by pushing and rotating theheading indicator’s adjustment knob,as shown in Figure 51. Once theheading indicator is set to the com-pass’ magnetic heading, it shouldprovide accurate directional informa-tion for a reasonable period of time.Like a cautious parent, you need tocheck up on this child occasionally,lest it wander. How much it wanders,and when, depends on how affectedthe heading indicator is by somethingknown as gyroscopic drift.
Gyroscopic heading drift is causedby internal mechanical errors and/orthe airplane’s constantly changingposition in space relative to theearth. The most important thing toremember is to keep checking orupdating the reading on the headingindicator with the magnetic compassat least every 15 minutes. Do thismore often if your airplane’s headingindicator has a history of wandering,which is sometimes referred to asprecessing. Despite gyroscopic drift,the heading indicator is much easierto use for navigation than the mag-netic compass (as you’ll soon seewhen we study the magnetic com-pass’ errors).
Notice that the heading indicatorin Figure 51 is calibrated in fivedegree increments. Every 30°, start-ing from north, is referenced byprinted letters or numerals that aresometimes called cardinal numbers(which sounds much better thanarchbishop numbers). Between theletters and numerals are slashes, cali-brated to five and ten degree incre-ments. The slashes at 10° incrementsare slightly larger for easier identifi-cation (however, if the eye doctortells you, based on your current eye-glass prescription, that you’re onlytwo lenses away from being a fly, youmay need to move closer to thepanel).
The heading indicator in Figure 51shows that the airplane is currentlyheading north. This is called 360degrees or zero degrees, depending onwho’s talking. Either value is correct.The E represents east or 90°, S repre-sents south or 180° and W representswest or 270°. If you want to soundlike a pro, don’t call them by the let-ters. I actually heard a pilot call acontroller and say, “Ahhh, this is2132 Bravo, ahhh, I’d like vectors tothe airport.” The controller said,“Roger 32 Bravo, what’s your head-ing?” The pilot replied, “Ahhh,.. myheading is Eeee!” The controller came
Chapter 5 - Flight Instruments: Clocks, Tops & Toys E27
HEADING INDICATORThe outline airplane's nose in theheading indicator points to the actualairplane's magnetic heading. As theairplane turns, the numbered disk ro-tates under the outline airplane, al-lowing your new heading to appearon top.
..
3333NN 33
66EE
12
12
1515SS2121
24
24
WW30
30
Adjustment knob to correctfor heading drift
Your current heading
Outlineairplane
Fig. 51
THE HEADING INDICATORWhen the gyro in the heading indicatorspins, it remains rigid (fixed) in space.The airplane rotates about thegyro as it turns and a gearingsystem converts this move-ment into a headingchange on theface of theindicator.
I'm tellin' ya,the spinning wheel
does somethingfor me!
..
3333NN 33
EE12
12
1515SS2121
24
24
WW30
30 66
Gimbal systemallowing two
degrees of motion
Swivelpoints
Spinning gyro
Face card thatrotates with fixedposition of gyro
Fig. 50
Licensed exclusively for DeWayne Britton ([email protected]) Transaction: #0002858938

back with, “Well, 32 Bravo, your heading is aiming you atanother airplane, I suggest you do a W before you bumpinto it."
Heading indicator A in Figure 52 shows the airplaneheading 30°. This is pronounced, “zero-three-zerodegrees.” Indicator B shows a heading of 140°. This ispronounced “one-four-zero degrees.” Indicator C shows aheading of 300° or “three-zero-zero degrees.”Indicator D depicts a heading of 305° or “three-zero-five degrees.”
If you’re instructed to turn to a particularheading, simply look for the number on theinstrument and turn in the shortest directiontoward it, unless instructed to “turn the longway” or “go the long way around.” (This issimilar to how we flight instructors find theexquisite dining facilities we’re known to fre-quent. We simply turn in the direction of thenearest drive-through speaker).
Referring to Indicator B, which way wouldyou turn to fly a heading of 60°? Yes, a leftturn would be the shortest direction to getto a heading of 60°. If you were instructed to
fly a heading of 240° in the same figure,which way would you turn? Of course, aturn to the right would be the shortestdirection to the new heading.
One last word on heading indicators. Ifyou accidentally fly into a cloud, you canfly back out by making a 180° turn(something General Custer should havedone shortly after leaving the fort). Oneof the biggest mistakes pilots make when
starting a 180° turn is in forgetting tolook at the heading representing 180degrees of turn. Simply look at thetail (the bottom) of the outline-air-plane and turn to the number itpoints to. This is similar to looking forthe nearest exit in a hotel. You need toknow exactly where to go (what head-ing to turn to for 180° of turn) if youneed a quick exit (especially true if thehotel has a name like “La Casa deFlash Fire”).
For instance, if you accidentally flewinto the clouds while on a heading of030° as shown by heading indicator A,what heading would you turn to? Thetail points to a heading of 210°. Simplyestablish a 15 or 20° bank on the atti-tude indicator while keeping the air-plane’s attitude level with the horizon.When 210° appears at the top of theheading indicator, you’ve completedthe turn. Roll the wings level and
wait for blue sky to appear.
The Turn CoordinatorThe turn coordinator sounds like the guy who calls
those commands at a square dance (square dance is the
E28
10 10
Carb TempC
20 2030 3040 40
50 50
0
0
THE TURN COORDINATOR
DCELEC
TURN COORDINATOR
2 MIN
NO PITCH INFORMATION
L R
THE TURN COORDINATOR
0
15 2025
30
35
RPMHUNDREDS
5
10
4"5"
6"
Suctioninches of Hg
DCELEC
TURN COORDINATOR
2 MIN
NO PITCH INFORMATION
L R
.
10
100 FEET
PER MIN
100 FEET
PER MIN
VSI
DN
UP
5
0
15
20
.
33330
3
69
12
12
1518
21
24
27
30
FROM
.
33330
3
69
27
30
FROM
OFF
STORE
125.75
SELECT
MicroComm Radios
RECALL
TERMAPCHENRT
CDI Sensitivity Mode Status
PullTurn
PullTurn
MSG FPL OBS
DTK
XTK
TRK
BRG
DIS
KLGB000
227
227
227
19.5
OBS Mode
KLGB
ACTV
ARM
APR
GPS
NAV
LEG
OBS
FD
HDG
NAV
APPR
ARM
CPLD
ALT
GS
AP
GA
FD A O M TRM
UP
NAV BC
60
90
70
80
100
110
120130140
150
160
170
180
190
200
210
220 50
40
KNOTS
230
20
20
20
20
10
10
10
10
DH
Attitude Inc.
.
1
2
3
09
8
5
7
6 4
ALT.
30.15
.
33N 3
6E
W30
I heard himsay the radio
has a fewbugs in it;
maybe somebabes, eh?
Heading"zero-three-zero"
Heading"one-four-zero"
Heading"three-zero-zero"
Heading"three-zero-five"
DIFFERENT HEADINGS
.
33
N3 6
E12
15
S2124
W30 .
33N
36
E
12 15S
21
24
W
30
.
33
N3
6
E1215
S21
24
W30
.
33
N3
6
E1215
S21
24
W30
A B C D
THE INSIDE OF A HEADING INDICATOR
Courtesy of Bob Crystal
The Gyro
Fig. 52
Fig. 53
Rod Machado’s Private Pilot Handbook
Licensed exclusively for DeWayne Britton ([email protected]) Transaction: #0002858938
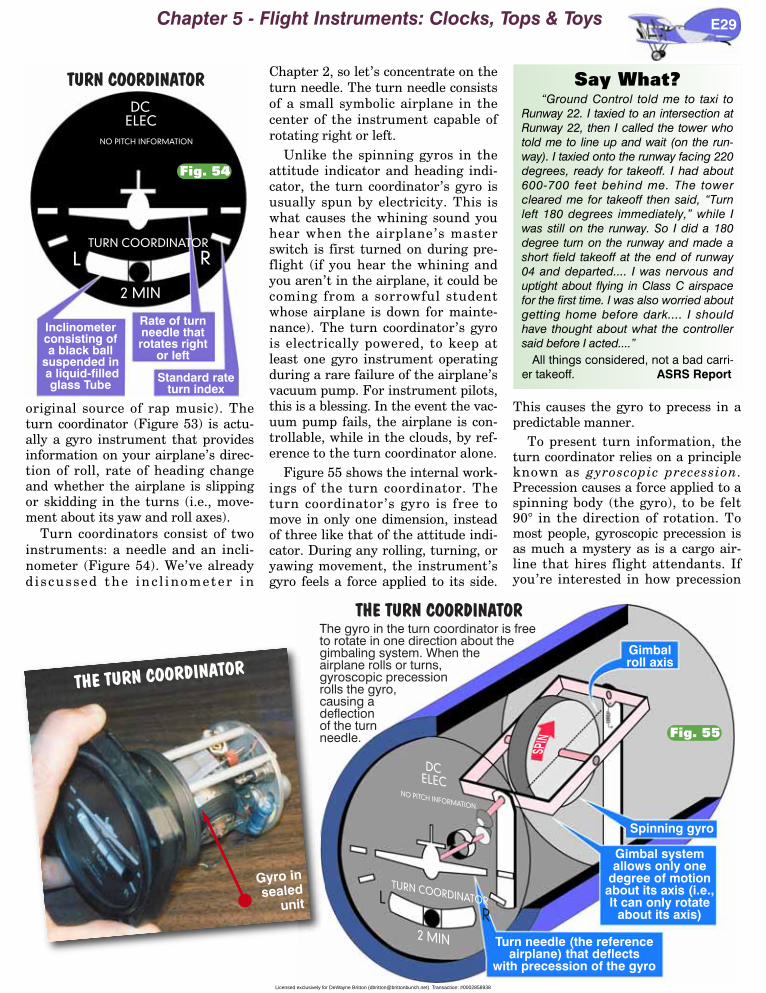
original source of rap music). Theturn coordinator (Figure 53) is actu-ally a gyro instrument that providesinformation on your airplane’s direc-tion of roll, rate of heading changeand whether the airplane is slippingor skidding in the turns (i.e., move-ment about its yaw and roll axes).
Turn coordinators consist of twoinstruments: a needle and an incli-nometer (Figure 54). We’ve alreadyd i s cussed the inc l inometer in
Chapter 2, so let’s concentrate on theturn needle. The turn needle consistsof a small symbolic airplane in thecenter of the instrument capable ofrotating right or left.
Unlike the spinning gyros in theattitude indicator and heading indi-cator, the turn coordinator’s gyro isusually spun by electricity. This iswhat causes the whining sound youhear when the airplane’s masterswitch is first turned on during pre-flight (if you hear the whining andyou aren’t in the airplane, it could becoming from a sorrowful studentwhose airplane is down for mainte-nance). The turn coordinator’s gyrois electrically powered, to keep atleast one gyro instrument operatingduring a rare failure of the airplane’svacuum pump. For instrument pilots,this is a blessing. In the event the vac-uum pump fails, the airplane is con-trollable, while in the clouds, by ref-erence to the turn coordinator alone.
Figure 55 shows the internal work-ings of the turn coordinator. Theturn coordinator’s gyro is free tomove in only one dimension, insteadof three like that of the attitude indi-cator. During any rolling, turning, oryawing movement, the instrument’sgyro feels a force applied to its side.
This causes the gyro to precess in apredictable manner.
To present turn information, theturn coordinator relies on a principleknown as gyroscopic precession.Precession causes a force applied to aspinning body (the gyro), to be felt90° in the direction of rotation. Tomost people, gyroscopic precession isas much a mystery as is a cargo air-line that hires flight attendants. Ifyou’re interested in how precession
Chapter 5 - Flight Instruments: Clocks, Tops & Toys E29
DC
ELEC
TURN COORDINATOR
2 MIN
NO PITCH INFORMATION
L R
TURN COORDINATOR
Rate of turnneedle thatrotates right
or left
Inclinometerconsisting ofa black ball
suspended ina liquid-filledglass Tube
Standard rateturn index
Fig. 54
The gyro in the turn coordinator is freeto rotate in one direction about thegimbaling system. When theairplane rolls or turns,gyroscopic precessionrolls the gyro,causing adeflectionof the turnneedle.
THE TURN COORDINATOR
DCELEC
TURN COORDINATOR
2 MIN
NO PITCH INFORMATION
L
R
Turn needle (the referenceairplane) that deflects
with precession of the gyro
Gimbal systemallows only one
degree of motionabout its axis (i.e.,It can only rotate
about its axis)
Spinning gyro
SPIN
Gimbalroll axis
Fig. 55
THE TURN COORDINATOR
Gyro insealed
unit
Say What?“Ground Control told me to taxi to
Runway 22. I taxied to an intersection atRunway 22, then I called the tower whotold me to line up and wait (on the run-way). I taxied onto the runway facing 220degrees, ready for takeoff. I had about600-700 feet behind me. The towercleared me for takeoff then said, “Turnleft 180 degrees immediately,” while Iwas still on the runway. So I did a 180degree turn on the runway and made ashort field takeoff at the end of runway04 and departed.... I was nervous anduptight about flying in Class C airspacefor the first time. I was also worried aboutgetting home before dark.... I shouldhave thought about what the controllersaid before I acted....”
All things considered, not a bad carri-er takeoff. ASRS Report
Licensed exclusively for DeWayne Britton ([email protected]) Transaction: #0002858938
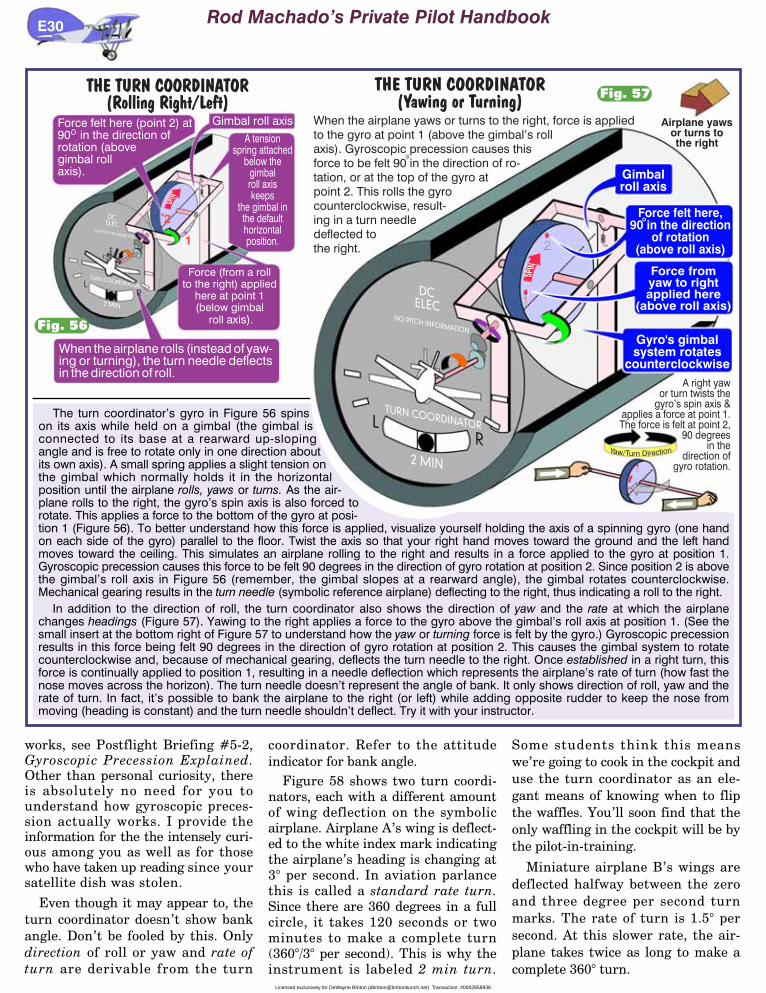
works, see Postflight Briefing #5-2,Gyroscopic Precession Explained.Other than personal curiosity, thereis absolutely no need for you tounderstand how gyroscopic preces-sion actually works. I provide theinformation for the the intensely curi-ous among you as well as for thosewho have taken up reading since yoursatellite dish was stolen.
Even though it may appear to, theturn coordinator doesn’t show bankangle. Don’t be fooled by this. Onlydirection of roll or yaw and rate ofturn are derivable from the turn
coordinator. Refer to the attitudeindicator for bank angle.
Figure 58 shows two turn coordi-nators, each with a different amountof wing deflection on the symbolicairplane. Airplane A’s wing is deflect-ed to the white index mark indicatingthe airplane’s heading is changing at3° per second. In aviation parlancethis is called a standard rate turn.Since there are 360 degrees in a fullcircle, it takes 120 seconds or twominutes to make a complete turn(360°/3° per second). This is why theinstrument is labeled 2 min turn.
Some students think this meanswe’re going to cook in the cockpit anduse the turn coordinator as an ele-gant means of knowing when to flipthe waffles. You’ll soon find that theonly waffling in the cockpit will be bythe pilot-in-training.
Miniature airplane B’s wings aredeflected halfway between the zeroand three degree per second turnmarks. The rate of turn is 1.5° persecond. At this slower rate, the air-plane takes twice as long to make acomplete 360° turn.
E30
THE TURN COORDINATOR(Rolling Right/Left)
DCELEC
TURN COORDINATOR
2 MIN
NO PITCH INFORMATION
L
R
1
2
SPIN
Gimbal roll axisForce felt here (point 2) at90 in the direction ofrotation (abovegimbal rollaxis).
Force (from a rollto the right) applied
here at point 1(below gimbal
roll axis).
A tensionspring attached
below thegimbalroll axiskeeps
the gimbal inthe defaulthorizontalposition.
When the airplane rolls (instead of yaw-ing or turning), the turn needle deflectsin the direction of roll.
Fig. 56
The turn coordinator’s gyro in Figure 56 spinson its axis while held on a gimbal (the gimbal isconnected to its base at a rearward up-slopingangle and is free to rotate only in one direction aboutits own axis). A small spring applies a slight tension onthe gimbal which normally holds it in the horizontalposition until the airplane rolls, yaws or turns. As the air-plane rolls to the right, the gyro’s spin axis is also forced torotate. This applies a force to the bottom of the gyro at posi-tion 1 (Figure 56). To better understand how this force is applied, visualize yourself holding the axis of a spinning gyro (one handon each side of the gyro) parallel to the floor. Twist the axis so that your right hand moves toward the ground and the left handmoves toward the ceiling. This simulates an airplane rolling to the right and results in a force applied to the gyro at position 1.Gyroscopic precession causes this force to be felt 90 degrees in the direction of gyro rotation at position 2. Since position 2 is abovethe gimbal’s roll axis in Figure 56 (remember, the gimbal slopes at a rearward angle), the gimbal rotates counterclockwise.Mechanical gearing results in the turn needle (symbolic reference airplane) deflecting to the right, thus indicating a roll to the right.
In addition to the direction of roll, the turn coordinator also shows the direction of yaw and the rate at which the airplanechanges headings (Figure 57). Yawing to the right applies a force to the gyro above the gimbal’s roll axis at position 1. (See thesmall insert at the bottom right of Figure 57 to understand how the yaw or turning force is felt by the gyro.) Gyroscopic precessionresults in this force being felt 90 degrees in the direction of gyro rotation at position 2. This causes the gimbal system to rotatecounterclockwise and, because of mechanical gearing, deflects the turn needle to the right. Once established in a right turn, thisforce is continually applied to position 1, resulting in a needle deflection which represents the airplane’s rate of turn (how fast thenose moves across the horizon). The turn needle doesn’t represent the angle of bank. It only shows direction of roll, yaw and therate of turn. In fact, it’s possible to bank the airplane to the right (or left) while adding opposite rudder to keep the nose frommoving (heading is constant) and the turn needle shouldn’t deflect. Try it with your instructor.
THE TURN COORDINATOR(Yawing or Turning)
When the airplane yaws or turns to the right, force is appliedto the gyro at point 1 (above the gimbal’s rollaxis). Gyroscopic precession causes thisforce to be felt 90 in the direction of ro-tation, or at the top of the gyro atpoint 2. This rolls the gyrocounterclockwise, result-ing in a turn needledeflected tothe right.
DCELEC
TURN COORDINATOR
2 MIN
NO PITCH INFORMATION
L
R
Airplane yawsor turns tothe right
1
2
A right yawor turn twists the
gyro’s spin axis &applies a force at point 1.The force is felt at point 2,
90 degreesin the
direction ofgyro rotation.
O
1
2
Yaw/Turn Direction
SPIN Force from
yaw to rightapplied here
(above roll axis)
Force felt here,90 in the direction
of rotation(above roll axis)
Gyro's gimbalsystem rotates
counterclockwise
Gimbalroll axis
Fig. 57
Rod Machado’s Private Pilot Handbook
Licensed exclusively for DeWayne Britton ([email protected]) Transaction: #0002858938

Why would you want to know therate at which your airplane changesheadings? Assume your heading indi-cator has failed and you accidentallyfly into a cloud (it’s obvious you’rehaving an exceptionally bad dayhere). You could make a precise 180°exit from the cloud by making a stan-dard rate turn for one minute (that’s3°/sec for 60 seconds=180° ). This isone of several reasons why the
turn coordinator is a very usefulinstrument. Instrument rated pilotsfind it useful for helping them antici-pate the time it takes to make head-ing changes. When you venture forthand obtain an instrument rating (alicense that allows you to fly inclouds), you’ll find the turn coordina-tor a worthy and welcome ally in theevent of attitude gyro failure.
The Magnetic CompassA friend of mine purchased a
very nervous little puppy. Everytime the phone rang, the puppywould wet the floor. My friendcontemplated using radiator stopleak to solve the problem butdecided on a better plan. Hegave the puppy to his supermean mother-in-law. Everyafternoon he would call her andask, “Hey, ...how’s your rug?”We call this controlling anaction at a distance. The mag-netic compass is similarly con-trolled (affected) by somethinga long distance away.
A magnetic compass(Figure 59) responds to thenatural phenomena of theearth’s magnetic pole, other-wise known as its magneticfield. This field is constantly
pulling one end of the compass’
needle, keeping it pointing north.Despite some peculiar errors in thecompass, it is one of the oldest andmost reliable navigational instru-ments known to man (next to moss,which supposedly grows on the northside of trees). In Chapter 11 we’ll talkabout navigational techniques. Fornow, let’s discuss how the compass
Chapter 5 - Flight Instruments: Clocks, Tops & Toys E31
DC
ELEC
TURN COORDINATOR
2 MIN
NO PITCH INFORMATION
L R
DC
ELEC
TURN COORDINATOR
2 MIN
NO PITCH INFORMATION
L R
300 300298.5297
After one second, Airplane Awill be on a heading of 297
Both airplanes were previously established in aturn passing through a heading of 300 degrees.
Standard rate turn of3 degrees per second
Half standard rate turn of1.5 degrees per second
0 0 00
RATE OF TURN ON THETURN COORDINATOR
A B
3/secindex
1.5/secpoint
o o
0 After one second, Airplane Bwill be on a heading of 298.50
Fig. 58
S
N 33 3036
N
The north-seeking end of the com-pass needle always points towardthe magnetic north pole.
Compasscard
The compass needle is a small mag-netized element. It’s connected tothe compass card and rests on apivot. This allows it to rotate withinthe compass housing.
THE MAGNETICCOMPASS NEEDLE
Fig. 59
Fig. 60
THE MAGNETIC COMPASS
CHECKING THAT LIST...ANDCHECKING IT TWICE
I did my runup but failed to set myheading indicator to coincide with mymagnetic compass...was cleared for animmediate departure due to traffic on ashort base (ready to turn final). I spottedthat traffic, then proceeded on my takeoffroll without hesitation. I usually makeanother takeoff check of all my systemsbefore starting my roll. I was handed offby the tower to Departure which instruct-ed me to climb to 2,500 MSL on a head-ing of 320°. I had just settled on thatheading when I was instructed to turn to280°. My heading indicator was about100° off so instead of 280° I was really fly-ing 180° and climbing....
ASRS Report
Rushing to take the runway before you’rereally ready is taking a dangerous risk. Justsay no and don’t go until you’re ready.
Licensed exclusively for DeWayne Britton ([email protected]) Transaction: #0002858938
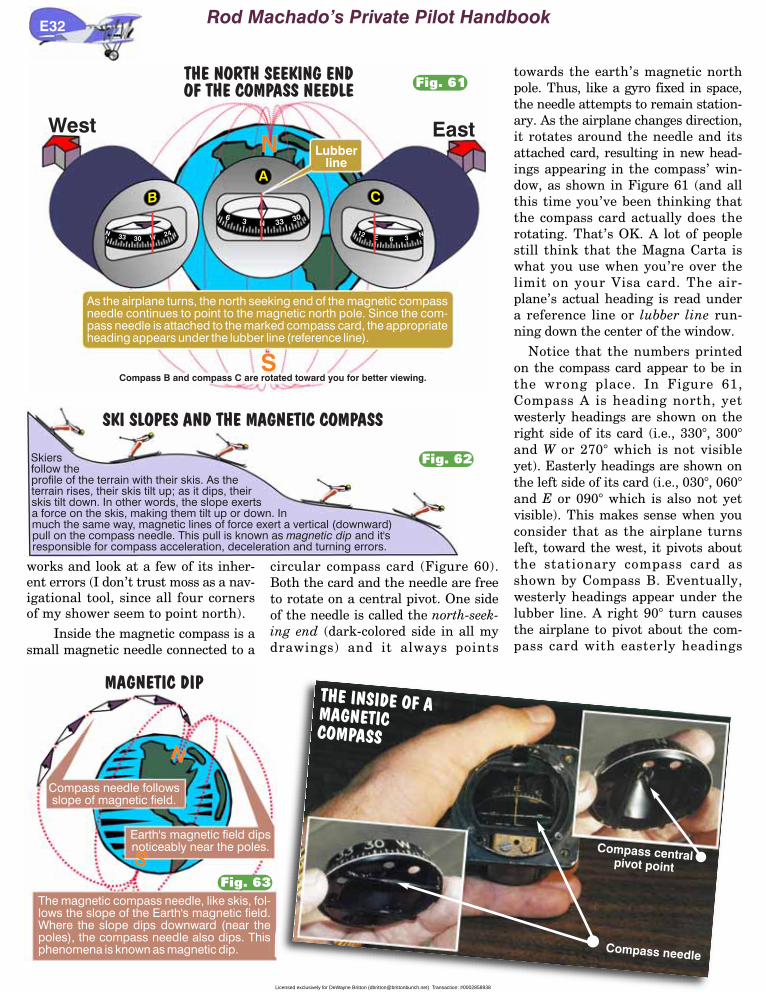
works and look at a few of its inher-ent errors (I don’t trust moss as a nav-igational tool, since all four cornersof my shower seem to point north).
Inside the magnetic compass is asmall magnetic needle connected to a
circular compass card (Figure 60).Both the card and the needle are freeto rotate on a central pivot. One sideof the needle is called the north-seek-ing end (dark-colored side in all mydrawings) and it always points
towards the earth’s magnetic northpole. Thus, like a gyro fixed in space,the needle attempts to remain station-ary. As the airplane changes direction,it rotates around the needle and itsattached card, resulting in new head-ings appearing in the compass’ win-dow, as shown in Figure 61 (and allthis time you’ve been thinking thatthe compass card actually does therotating. That’s OK. A lot of peoplestill think that the Magna Carta iswhat you use when you’re over thelimit on your Visa card. The air-plane’s actual heading is read undera reference line or lubber line run-ning down the center of the window.
Notice that the numbers printedon the compass card appear to be inthe wrong place. In Figure 61,Compass A is heading north, yetwesterly headings are shown on theright side of its card (i.e., 330°, 300°and W or 270° which is not visibleyet). Easterly headings are shown onthe left side of its card (i.e., 030°, 060°and E or 090° which is also not yetvisible). This makes sense when youconsider that as the airplane turnsleft, toward the west, it pivots aboutthe stationary compass card asshown by Compass B. Eventually,westerly headings appear under thelubber line. A right 90° turn causesthe airplane to pivot about the com-pass card with easterly headings
Skiersfollow theprofile of the terrain with their skis. As theterrain rises, their skis tilt up; as it dips, theirskis tilt down. In other words, the slope exertsa force on the skis, making them tilt up or down. Inmuch the same way, magnetic lines of force exert a vertical (downward)pull on the compass needle. This pull is known as and it'sresponsible for compass acceleration, deceleration and turning errors.
magnetic dip
SKI SLOPES AND THE MAGNETIC COMPASS
Fig. 62
THE NORTH SEEKING ENDOF THE COMPASS NEEDLE
6 3 NE12
30 W 2433N
N 33 3036
NWest East
A
B C
Compass B and compass C are rotated toward you for better viewing.
Lubberline
As the airplane turns, the north seeking end of the magnetic compassneedle continues to point to the magnetic north pole. Since the com-pass needle is attached to the marked compass card, the appropriateheading appears under the lubber line (reference line).
S
Fig. 61
N
S
Compass needle followsslope of magnetic field.
Earth's magnetic field dipsnoticeably near the poles.
The magnetic compass needle, like skis, fol-lows the slope of the Earth's magnetic field.Where the slope dips downward (near thepoles), the compass needle also dips. Thisphenomena is known as magnetic dip.
MAGNETIC DIP
Fig. 63
THE INSIDE OF AMAGNETICCOMPASS
Compass needle
E32
Compass centralpivot point
Rod Machado’s Private Pilot Handbook
Licensed exclusively for DeWayne Britton ([email protected]) Transaction: #0002858938

appearing under the lubber line, asshown by Compass C.
To fly any heading visible on thecompass card, you must turn in theopposite direction to center it underthe lubber line. For instance, if theheading you want to fly is visible tothe right of the lubber line, turn tothe left to center its value (now youknow why the heading indicator iseasier to use!).
To better understand how thecompass works, we can compare itsmagnetic needle with skis. Skis aresimilar to compass needles in howthey respond to changing terrain. InFigure 62, notice that as the terraindips, so do the skis. If the terrainslopes upward, the skis, likewiseslope upward. If the terrain dipsdownward, the skis dip downward.The point is, the magnetic compassneedle is like a ski and the earth’smagnetic field is like the terrain. Thecompass needle will always try to dipin the direction of the magnetic field.
Figure 63 depicts the earth’s mag-netic field. Notice that the field dipsdownward at nearly a 90° angle atthe poles while there is very little dipin the equatorial regions. For most ofthe United States, the downward dip
angle is around 70°. Just like skis fol-lowing dipping terrain, the magneticcompass needle wants to tilt down-ward with the magnetic field. This iscalled magnetic dip, and is the onlykind of dip pilots serve at parties.
It’s also a serious problem for themagnetic compass. Unrestrained,this dip could render the compassunusable as a navigational device,since the card could get hung up onits pivot or in its container.Fortunately, the compass has beencleverly designed in such a way thatthe compass card’s pendulous mount-ing counteracts this dip (Figure 64).As long as the compass card isallowed to hang parallel to the earth,it’s not restricted by the dippingmagnetic field. Therein lies theproblem.
When the airplane accelerates ordecelerates, the free-swinging com-pass card has inertia and tends toresist the speed change. This causesthe compass card to tilt within itscase. This results in what are knownas acceleration-deceleration errorswhich are present on easterly andwesterly headings only.
Whenever a turn is made, the com-pass card no longer hangs parallel to
Chapter 5 - Flight Instruments: Clocks, Tops & Toys
MAGNETIC DIPCORRECTION
Instead of the simplified compass-needle drawing shown above, thecompass actually has two needles,side-by-side with their north-seekingends aligned. These needles are lo-cated on the bottom portion of thecompass card and the entire card issuspended by a pivot. This gives thecard a pendulous-type mounting (di-agram below is also highly simplifiedfor easy understanding).
If the compass card is tilted asshown above, the card naturallytends to return to a near levelposition because of the "pendulum"effect. With the mass of the needlesand additional items, the cardremains nearly level despite mag-netic dip, as shown below.
The earth's magnetic field tries to pullor "dip" the compass needles and thecard downward as shown below. Thiswould render the compass useless if
it remained thisway.
W 24 2133 30
W 24 213033
Earth N
Dipping
magnetic
field
Earth N
Pendulum
effect pulls
card down
Fig. 64
E33
HANG THAT HEADSETON YOUR HEAD
When making position reports Ialways used my headset, and uponcompletion I laid the headset onwhat seemed a very convenientplace since the cockpit wascrowded—the top of the instru-ment panel! During the few min-utes it took to make the report Iobviously never noticed that thecompass read differently (I steeredby the liquid compass because Ihad not found the operation of theslaved gyro satisfactory, and, ofcourse I had swung the liquidcompass)... Depending on howclose to the compass I had laid theheadset, the compass would showan erroneous reading of about 15degrees to the left...
ASRS Report
What’s our head-ing Bob?
Ahh, we’re heading“W.”
The magnetic field from the miccan cause compass errors.
The magneticfield from the
headset can alsocause compass
errors.
BeforeAfter
BeforeAfter
Licensed exclusively for DeWayne Britton ([email protected]) Transaction: #0002858938
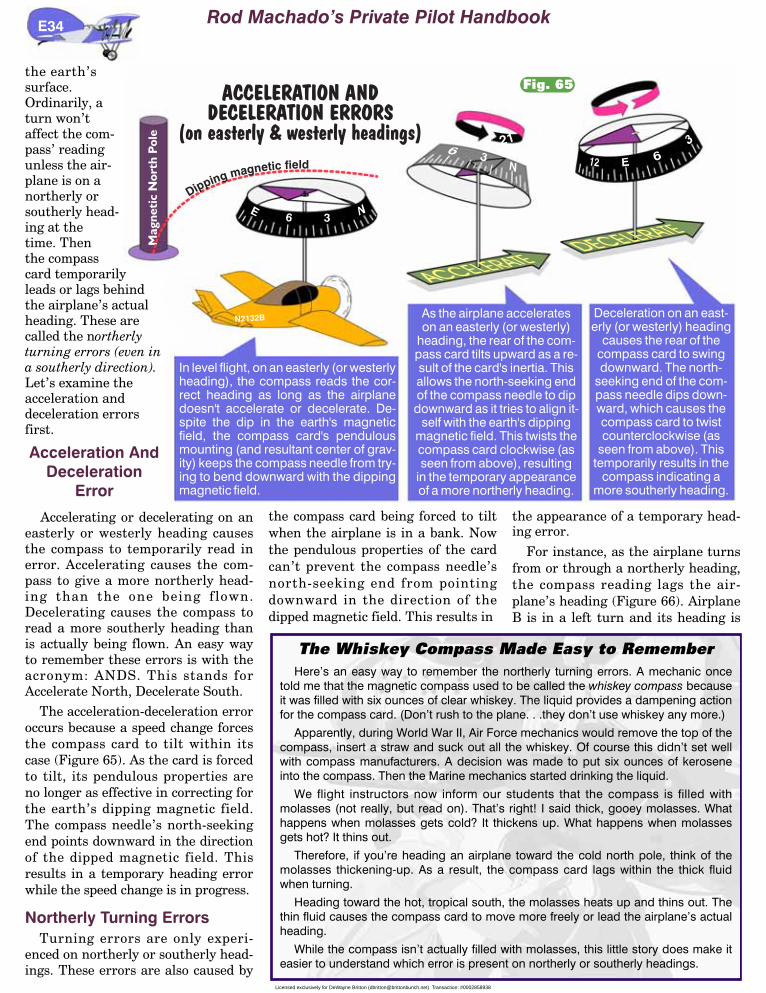
the earth’ssurface.Ordinarily, aturn won’taffect the com-pass’ readingunless the air-plane is on anortherly orsoutherly head-ing at thetime. Thenthe compasscard temporarilyleads or lags behindthe airplane’s actualheading. These arecalled the northerlyturning errors (even ina southerly direction).Let’s examine theacceleration anddeceleration errorsfirst.
Acceleration AndDeceleration
Error
Accelerating or decelerating on aneasterly or westerly heading causesthe compass to temporarily read inerror. Accelerating causes the com-pass to give a more northerly head-ing than the one being flown.Decelerating causes the compass toread a more southerly heading thanis actually being flown. An easy wayto remember these errors is with theacronym: ANDS. This stands forAccelerate North, Decelerate South.
The acceleration-deceleration erroroccurs because a speed change forcesthe compass card to tilt within itscase (Figure 65). As the card is forcedto tilt, its pendulous properties areno longer as effective in correcting forthe earth’s dipping magnetic field.The compass needle’s north-seekingend points downward in the directionof the dipped magnetic field. Thisresults in a temporary heading errorwhile the speed change is in progress.
Northerly Turning ErrorsTurning errors are only experi-
enced on northerly or southerly head-ings. These errors are also caused by
the compass card being forced to tiltwhen the airplane is in a bank. Nowthe pendulous properties of the cardcan’t prevent the compass needle’snorth-seeking end from pointingdownward in the direction of thedipped magnetic field. This results in
the appearance of a temporary head-ing error.
For instance, as the airplane turnsfrom or through a northerly heading,the compass reading lags the air-plane’s heading (Figure 66). AirplaneB is in a left turn and its heading is
E34
21
ACCELERATION ANDDECELERATION ERRORS
(on easterly & westerly headings)
N2132B
3
21
6
Magn
eti
cN
ort
hP
ole
Dipping magnetic field
In level flight, on an easterly (or westerlyheading), the compass reads the cor-rect heading as long as the airplanedoesn't accelerate or decelerate. De-spite the dip in the earth's magneticfield, the compass card's pendulousmounting (and resultant center of grav-ity) keeps the compass needle from try-ing to bend downward with the dippingmagnetic field.
As the airplane accelerateson an easterly (or westerly)
heading, the rear of the com-pass card tilts upward as a re-sult of the card's inertia. Thisallows the north-seeking endof the compass needle to dipdownward as it tries to align it-
self with the earth's dippingmagnetic field. This twists thecompass card clockwise (asseen from above), resulting
in the temporary appearanceof a more northerly heading.
Deceleration on an east-erly (or westerly) heading
causes the rear of thecompass card to swingdownward. The north-
seeking end of the com-pass needle dips down-ward, which causes thecompass card to twistcounterclockwise (as
seen from above). Thistemporarily results in the
compass indicating amore southerly heading.
Fig. 65
The Whiskey Compass Made Easy to RememberHere’s an easy way to remember the northerly turning errors. A mechanic once
told me that the magnetic compass used to be called the whiskey compass becauseit was filled with six ounces of clear whiskey. The liquid provides a dampening actionfor the compass card. (Don’t rush to the plane. . .they don’t use whiskey any more.)
Apparently, during World War II, Air Force mechanics would remove the top of thecompass, insert a straw and suck out all the whiskey. Of course this didn’t set wellwith compass manufacturers. A decision was made to put six ounces of keroseneinto the compass. Then the Marine mechanics started drinking the liquid.
We flight instructors now inform our students that the compass is filled withmolasses (not really, but read on). That’s right! I said thick, gooey molasses. Whathappens when molasses gets cold? It thickens up. What happens when molassesgets hot? It thins out.
Therefore, if you’re heading an airplane toward the cold north pole, think of themolasses thickening-up. As a result, the compass card lags within the thick fluidwhen turning.
Heading toward the hot, tropical south, the molasses heats up and thins out. Thethin fluid causes the compass card to move more freely or lead the airplane’s actualheading.
While the compass isn’t actually filled with molasses, this little story does make iteasier to understand which error is present on northerly or southerly headings.
Rod Machado’s Private Pilot Handbook
Licensed exclusively for DeWayne Britton ([email protected]) Transaction: #0002858938
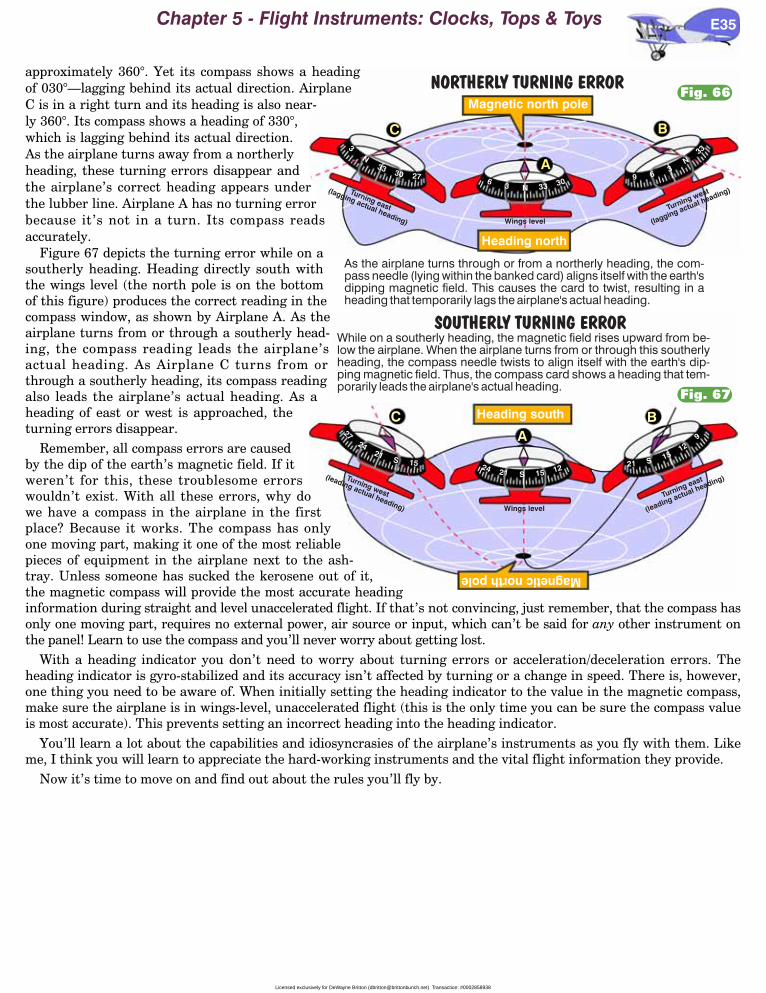
approximately 360°. Yet its compass shows a headingof 030°—lagging behind its actual direction. AirplaneC is in a right turn and its heading is also near-ly 360°. Its compass shows a heading of 330°,which is lagging behind its actual direction.As the airplane turns away from a northerlyheading, these turning errors disappear andthe airplane’s correct heading appears underthe lubber line. Airplane A has no turning errorbecause it’s not in a turn. Its compass readsaccurately.
Figure 67 depicts the turning error while on asoutherly heading. Heading directly south withthe wings level (the north pole is on the bottomof this figure) produces the correct reading in thecompass window, as shown by Airplane A. As theairplane turns from or through a southerly head-ing, the compass reading leads the airplane’sactual heading. As Airplane C turns from orthrough a southerly heading, its compass readingalso leads the airplane’s actual heading. As aheading of east or west is approached, theturning errors disappear.
Remember, all compass errors are causedby the dip of the earth’s magnetic field. If itweren’t for this, these troublesome errorswouldn’t exist. With all these errors, why dowe have a compass in the airplane in the firstplace? Because it works. The compass has onlyone moving part, making it one of the most reliablepieces of equipment in the airplane next to the ash-tray. Unless someone has sucked the kerosene out of it,the magnetic compass will provide the most accurate headinginformation during straight and level unaccelerated flight. If that’s not convincing, just remember, that the compass hasonly one moving part, requires no external power, air source or input, which can’t be said for any other instrument onthe panel! Learn to use the compass and you’ll never worry about getting lost.
With a heading indicator you don’t need to worry about turning errors or acceleration/deceleration errors. Theheading indicator is gyro-stabilized and its accuracy isn’t affected by turning or a change in speed. There is, however,one thing you need to be aware of. When initially setting the heading indicator to the value in the magnetic compass,make sure the airplane is in wings-level, unaccelerated flight (this is the only time you can be sure the compass valueis most accurate). This prevents setting an incorrect heading into the heading indicator.
You’ll learn a lot about the capabilities and idiosyncrasies of the airplane’s instruments as you fly with them. Likeme, I think you will learn to appreciate the hard-working instruments and the vital flight information they provide.
Now it’s time to move on and find out about the rules you’ll fly by.
Chapter 5 - Flight Instruments: Clocks, Tops & Toys E35
N 33 3036
33 30 27
N3
3N
33
69
NORTHERLY TURNING ERROR
As the airplane turns through or from a northerly heading, the com-pass needle (lying within the banked card) aligns itself with the earth'sdipping magnetic field. This causes the card to twist, resulting in aheading that temporarily lags the airplane's actual heading.
Magnetic north pole
Heading north
Turning east
(lagging actual heading)
Turning west
(lagging actual heading)
A
BC
Wings level
21S 15
24
27
S 15 122124
SOUTHERLY TURNING ERROR
1512
9
S21
While on a southerly heading, the magnetic field rises upward from be-low the airplane. When the airplane turns from or through this southerlyheading, the compass needle twists to align itself with the earth's dip-ping magnetic field. Thus, the compass card shows a heading that tem-porarily leads the airplane's actual heading.
Magnetic north poleHeading south
ABC
Turning west
(leading actual heading)
Turning east
(leading actual heading)
Wings level
Fig. 66
Fig. 67
Licensed exclusively for DeWayne Britton ([email protected]) Transaction: #0002858938
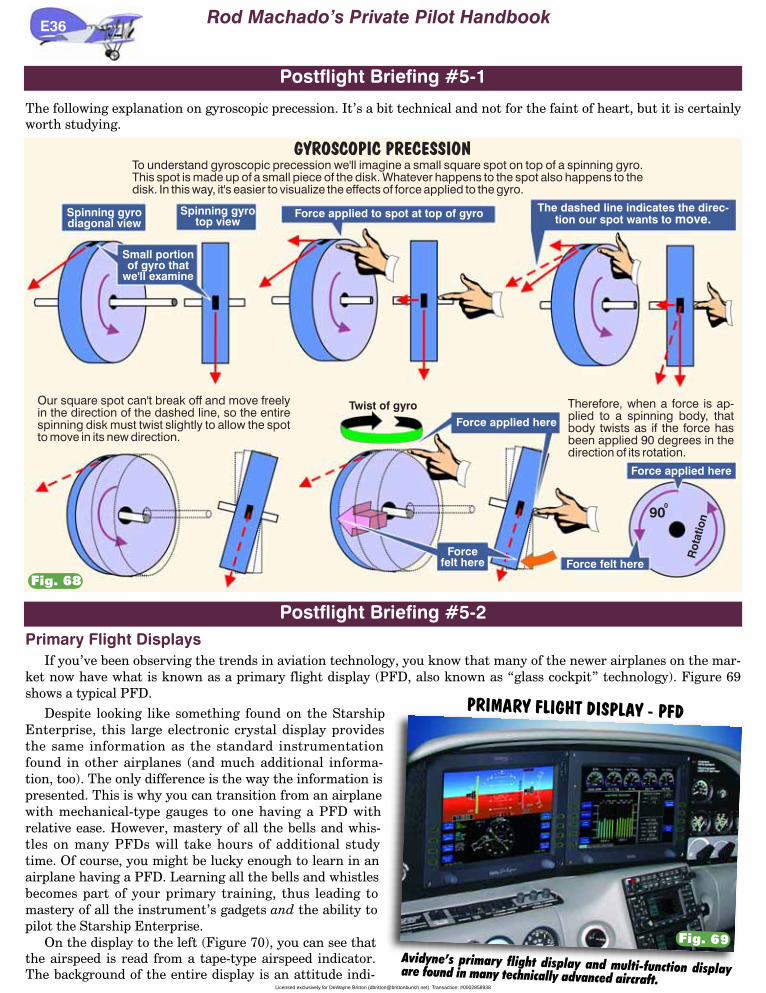
The following explanation on gyroscopic precession. It’s a bit technical and not for the faint of heart, but it is certainlyworth studying.
E36
Postflight Briefing #5-1
Force applied here
To understand gyroscopic precession we'll imagine a small square spot on top of a spinning gyro.This spot is made up of a small piece of the disk. Whatever happens to the spot also happens to thedisk. In this way, it's easier to visualize the effects of force applied to the gyro.
GYROSCOPIC PRECESSION
Spinning gyrodiagonal view
Spinning gyrotop view
Force applied to spot at top of gyro
Small portionof gyro that
we'll examine
Our square spot can't break off and move freelyin the direction of the dashed line, so the entirespinning disk must twist slightly to allow the spotto move in its new direction.
Therefore, when a force is ap-plied to a spinning body, thatbody twists as if the force hasbeen applied 90 degrees in thedirection of its rotation.
Force applied hereTwist of gyro
Forcefelt here
Rot
atio
n900
Force felt here
The dashed line indicates the direc-tion our spot wants to move.
Postflight Briefing #5-2Primary Flight Displays
If you’ve been observing the trends in aviation technology, you know that many of the newer airplanes on the mar-ket now have what is known as a primary flight display (PFD, also known as “glass cockpit” technology). Figure 69shows a typical PFD.
Despite looking like something found on the StarshipEnterprise, this large electronic crystal display providesthe same information as the standard instrumentationfound in other airplanes (and much additional informa-tion, too). The only difference is the way the information ispresented. This is why you can transition from an airplanewith mechanical-type gauges to one having a PFD withrelative ease. However, mastery of all the bells and whis-tles on many PFDs will take hours of additional studytime. Of course, you might be lucky enough to learn in anairplane having a PFD. Learning all the bells and whistlesbecomes part of your primary training, thus leading tomastery of all the instrument’s gadgets and the ability topilot the Starship Enterprise.
On the display to the left (Figure 70), you can see thatthe airspeed is read from a tape-type airspeed indicator.The background of the entire display is an attitude indi-
PRIMARY FLIGHT DISPLAY - PFD
Fig. 68
Fig. 69Avidyne’s primary flight display and multi-function displayare found in many technically advanced aircraft.
Rod Machado’s Private Pilot Handbook
Licensed exclusively for DeWayne Britton ([email protected]) Transaction: #0002858938
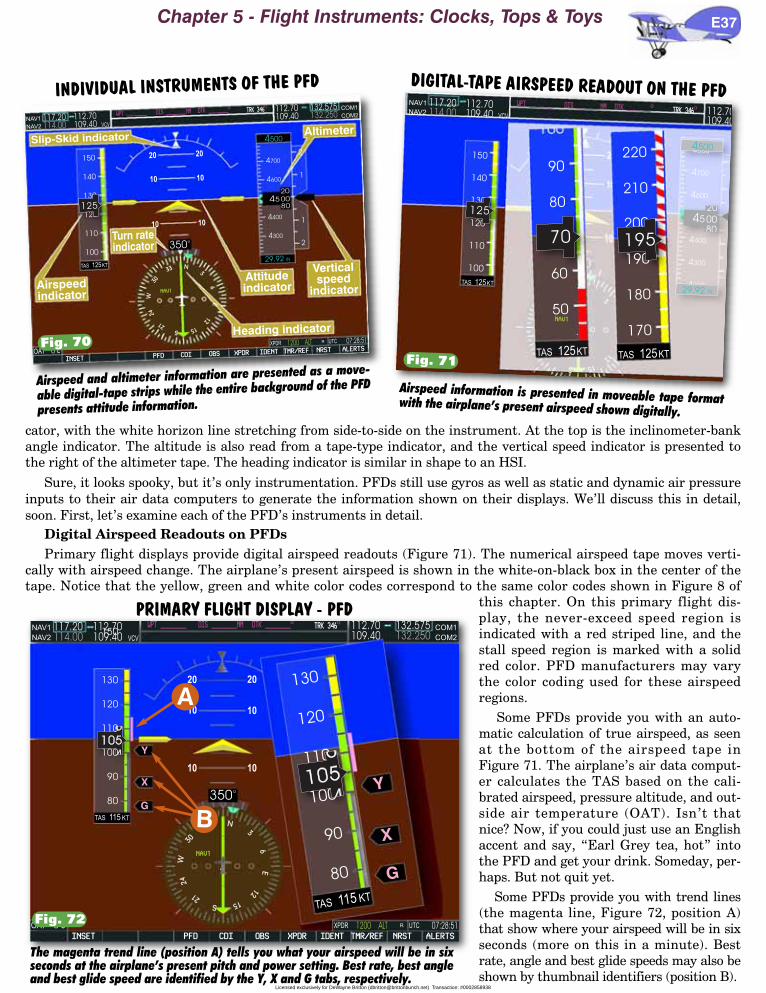
cator, with the white horizon line stretching from side-to-side on the instrument. At the top is the inclinometer-bankangle indicator. The altitude is also read from a tape-type indicator, and the vertical speed indicator is presented tothe right of the altimeter tape. The heading indicator is similar in shape to an HSI.
Sure, it looks spooky, but it’s only instrumentation. PFDs still use gyros as well as static and dynamic air pressureinputs to their air data computers to generate the information shown on their displays. We’ll discuss this in detail,soon. First, let’s examine each of the PFD’s instruments in detail.
Digital Airspeed Readouts on PFDsPrimary flight displays provide digital airspeed readouts (Figure 71). The numerical airspeed tape moves verti-
cally with airspeed change. The airplane’s present airspeed is shown in the white-on-black box in the center of thetape. Notice that the yellow, green and white color codes correspond to the same color codes shown in Figure 8 of
this chapter. On this primary flight dis-play, the never-exceed speed region isindicated with a red striped line, and thestall speed region is marked with a solidred color. PFD manufacturers may varythe color coding used for these airspeedregions.
Some PFDs provide you with an auto-matic calculation of true airspeed, as seenat the bottom of the airspeed tape inFigure 71. The airplane’s air data comput-er calculates the TAS based on the cali-brated airspeed, pressure altitude, and out-side air temperature (OAT). Isn’t thatnice? Now, if you could just use an Englishaccent and say, “Earl Grey tea, hot” intothe PFD and get your drink. Someday, per-haps. But not quit yet.
Some PFDs provide you with trend lines(the magenta line, Figure 72, position A)that show where your airspeed will be in sixseconds (more on this in a minute). Bestrate, angle and best glide speeds may also beshown by thumbnail identifiers (position B).
Chapter 5 - Flight Instruments: Clocks, Tops & Toys E37
150
130
120
110
100
90
80
TAS KT115
INSET PFD CDI OBS
OAT 0 C
NAV1
NAV2 VCV
WPT ________ DIS ________NM DTK ________117.20114.00
112.70109.40
.
33 N
3
12
15S21
24
W30
350o
NAV1
G
X
Y
10 10
20 20
10 10
XPDR IDENT TMR/REF NRST ALERTS
XPDR UTCR1200 ALT 07:28:51
COM1
COM2
OTRK 346
O132.575132.250
112.70109.40
6E
130
120
110
100
90
80
TASKT115
G
X
Y
150
140
130
120
110
100
TAS KT125
125
200
190
180
170
220
210
TAS KT125
195
OAT 0 C
NAV1
NAV2VCV
WPT ________ DIS ________NM DTK ________O TRK 346O
117.20114.00
112.70109.40 112.70
109.40
.
3
12
15S
TAS KT125
NAV1
90
80
60
50
70
4
4
4
4
4
4
800
700
600
400
300
200
2
2
1
4500
29.92 IN
350o
ADVANCED GLASS C
2
2
1
1
INSETPFD CDI OBS XPDR IDENT TMR/REF NRST ALERTSOAT 0 C
XPDR UTCR1200 ALT 07:28:51
NAV1
NAV2
COM1
COM2
VCV
WPT ________ DIS ________NM DTK ________O
TRK 346O
117.20
114.00
132.575
132.250112.70
109.40
112.70
109.40
.
33 N3
6E
12
15S
21
24
W30
NAV1
Slip-Skid indicator Altimeter
Heading indicator
Airspeedindicator
Attitudeindicator
Verticalspeed
indicator
Turn rateindicator
10 10
20 20
10 10
4
4
4
4
700
600
400
300
4500
29.92 IN
150
140
130
120
110
100
TAS KT125
20
4500
80125
INDIVIDUAL INSTRUMENTS OF THE PFD
Fig. 70
The magenta trend line (position A) tells you what your airspeed will be in sixseconds at the airplane’s present pitch and power setting. Best rate, best angleand best glide speed are identified by the Y, X and G tabs, respectively.
Airspeed information is presented in moveable tape formatwith the airplane’s present airspeed shown digitally.
Airspeed and altimeter information are presented as a move-
able digital-tape strips while the entire background of the PFD
presents attitude information.
DIGITAL-TAPE AIRSPEED READOUT ON THE PFD
Fig. 71
PRIMARY FLIGHT DISPLAY - PFD
Fig. 72
A
B
Licensed exclusively for DeWayne Britton ([email protected]) Transaction: #0002858938

Trend LinesTrend lines aren’t proof that the
PFD is reading your mind. The pro-jection is based on the airplane’s pre-sent pitch and power condition. Forinstance, the nose up attitude on theleft PFD (Figure 73) shows a decreas-ing airspeed and increasing altitude.The airspeed trend line in position Ashows that the airspeed and altitudewill be at 107 knots and 4,630 feet insix seconds. The pitch-down attitudeshown on the PFD to the right hastrend lines showing that the airspeedand vertical speed will be 182 knots(Figure 74, position C) and 3,710 feet(position D) in six seconds. The won-derful thing about trend lines is thatthey help you anticipate airspeed andaltitude targets. Anticipating trendswith traditional analog flight instru-ments is more a matter of feel and ittakes some time to develop this skill.
Digital Altitude ReadoutsPrimary flight displays use a tape
display of altitudes (Figure 75). Asaltitude changes, the numerical dis-play tape of altitude moves up anddown in the display window, whilethe number values in the white-on-black window in the center of the dis-
play (Figure 75, position A) change toreflect the airplane’s current alti-tude. Figure 75, position B repre-sents the target altitude you may (or
may not) have previously selected inthe PFD. Figure 75, position C repre-sents the latest barometer settingyou’ve dialed into the altimeter.
E38 Rod Machado’s Private Pilot Handbook
NAV1
350o
4
4
4
4
700
600
400
300
4500
29.92 IN
20
4500
80
150
140
130
120
110
100
TAS KT125
C
B
A
10 10
20 20
10 10
125
PRIMARY FLIGHT DISPLAY - PFD
On the PFD, altitude is read on a similar moving tape. The airplane’s present altitudeis shown digitally (position A), the target altitude (selected previously by the pilot) isread at position B and the current altimeter setting is read at position C.
130
120
110
100
90
TAS KT125
110
2
2
1
1
INSET PFD CDI OBS XPDR IDENT TMR/REF NRST ALERTS
OAT 0 C XPDR UTCR1200 ALT 07:28:51
NAV1
NAV2
COM1
COM2VCV
WPT ________ DIS ________NM DTK ________O TRK 346O
117.20114.00
132.575132.250
112.70109.40
112.70109.40
.
33 N
3
6E
12
15S21
24
W30
350o
NAV1
1200
.
33 N
3
6E
12
15S21
24
W30
A
B 4
4
4
4
700
600
400
300
4500
29.92 IN
20
4500
80
10 10
20 20
10 10
One of the very unique features of the primary flight display is the trend line. This is the magenta line in positions A, B, C and D thatshow where a particular airspeed and altitude value will be in the next six seconds based on the airplane’s present pitch and powercondition. For instance, the nose up attitude on the left PFD shows a decreasing airspeed and increasing altitude. The airspeed trendline in position A indicates that the airspeed and altitude will be at 107 knots and 4,630 feet in six seconds. The pitch down attitudeshown on the PFD to the right has trend lines indicating that the airspeed and vertical speed will be 182 knots (position C) and 3,710feet (position D) in six seconds. The wonderful thing about trend lines is that they help you anticipate airspeed and altitude targets.Anticipating trends with round-dial instruments was more a matter of feel and it took some time to develop this skill.
THE PRIMARY FLIGHT DISPLAY’S TREND LINES
.
33 N
3
6E
12
15S21
24
W30
200
190
180
170
160
150
TAS KT113
175
4
2
2
1
1
PFD CDI OBS XPDR IDENT TMR/REF NRST ALERTS
OAT 0 C XPDR UTCR1200 ALT 07:28:51
NAV1
NAV2 VCV
WPT ________ DIS ________NM DTK ________O117.20114.00
112.70109.40
COM1
COM2
TRK 346O
132.575132.250
112.70109.40
.
33 N
3
6E
12
15S21
24
W30
350o
NAV1
-850
C
D
40
9
7
6
00
00
00
00
3
3
3
0
29.92 IN
20
3800
80
10 10
20 20
10 10
Fig. 73 Fig. 74
Fig. 75
Licensed exclusively for DeWayne Britton ([email protected]) Transaction: #0002858938
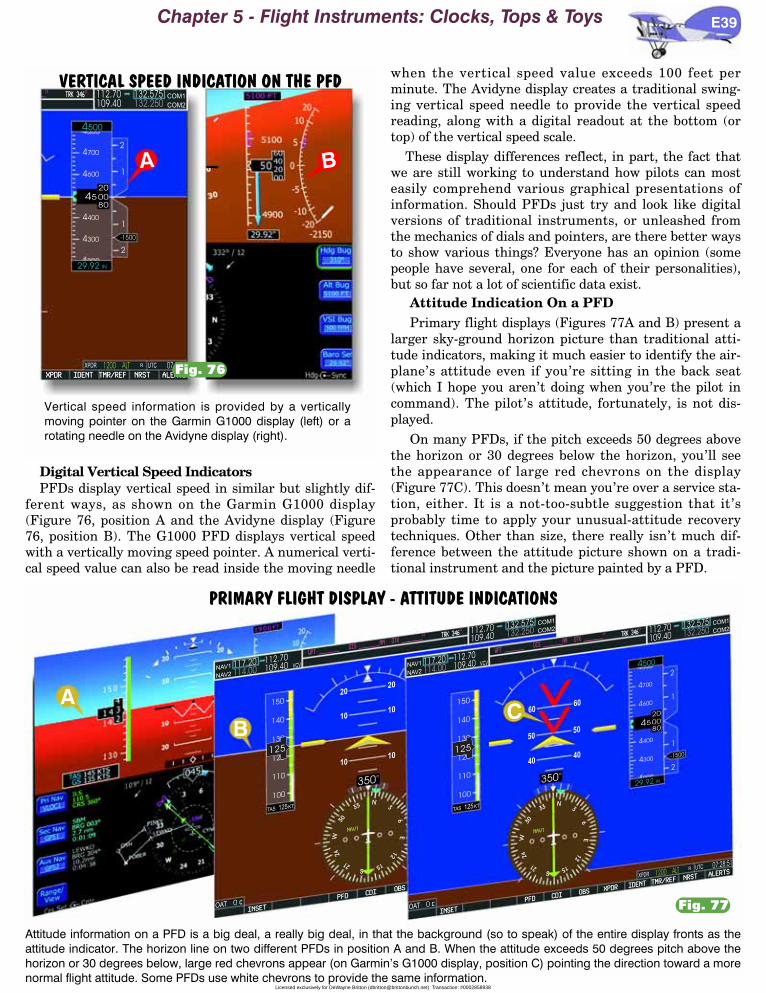
Digital Vertical Speed IndicatorsPFDs display vertical speed in similar but slightly dif-
ferent ways, as shown on the Garmin G1000 display(Figure 76, position A and the Avidyne display (Figure76, position B). The G1000 PFD displays vertical speedwith a vertically moving speed pointer. A numerical verti-cal speed value can also be read inside the moving needle
when the vertical speed value exceeds 100 feet perminute. The Avidyne display creates a traditional swing-ing vertical speed needle to provide the vertical speedreading, along with a digital readout at the bottom (ortop) of the vertical speed scale.
These display differences reflect, in part, the fact thatwe are still working to understand how pilots can mosteasily comprehend various graphical presentations ofinformation. Should PFDs just try and look like digitalversions of traditional instruments, or unleashed fromthe mechanics of dials and pointers, are there better waysto show various things? Everyone has an opinion (somepeople have several, one for each of their personalities),but so far not a lot of scientific data exist.
Attitude Indication On a PFDPrimary flight displays (Figures 77A and B) present a
larger sky-ground horizon picture than traditional atti-tude indicators, making it much easier to identify the air-plane’s attitude even if you’re sitting in the back seat(which I hope you aren’t doing when you’re the pilot incommand). The pilot’s attitude, fortunately, is not dis-played.
On many PFDs, if the pitch exceeds 50 degrees abovethe horizon or 30 degrees below the horizon, you’ll seethe appearance of large red chevrons on the display(Figure 77C). This doesn’t mean you’re over a service sta-tion, either. It is a not-too-subtle suggestion that it’sprobably time to apply your unusual-attitude recoverytechniques. Other than size, there really isn’t much dif-ference between the attitude picture shown on a tradi-tional instrument and the picture painted by a PFD.
Chapter 5 - Flight Instruments: Clocks, Tops & Toys E39
2
2
1
1
-1500
A4
4
4
4
700
600
400
300
4500
29.92 IN
20
4500
80
XPDR IDENT TMR/REF NRST ALERTS
XPDR UTCR1200 ALT 07:28:51
O
COM1
COM2
TRK 346O
132.575132.250
112.70109.40
B
INSET
PFDCDI
OBS
OAT 0 C
NAV1
NAV2
VCV
WPT ________
117.20
114.00
112.70
109.40
109.40
DIS ________NM DTK ________
COM1
COM2O TRK 346
O132.575
132.250112.70
.
33N
3
6E
12
15S
21
24
W30
350o
NAV1
2
2
1
1
INSET
PFDCDI
OBSXPDR
IDENTTMR/REF
NRSTALERTS
OAT 0 C
XPDR
UTCR
1200 ALT07:28:51
NAV1
NAV2
VCV
WPT ________DIS ________NM
DTK ________
117.20
114.00
112.70
109.40
COM1
COM2O TRK 346
O132.575
132.250112.70
109.40
.
33N
3
6E
12
15S
21
24
W30
NAV1
-1500
A
BC
1010
2020
1010
50
60
50
60
4040
350o
150
140
130
120
110
100
TASKT125
4
4
4
4
700
600
400
300
4500
29.92 IN
20
4500
80
150
140
130
120
110
100
TASKT125
125 125
VERTICAL SPEED INDICATION ON THE PFD
Vertical speed information is provided by a verticallymoving pointer on the Garmin G1000 display (left) or arotating needle on the Avidyne display (right).
Fig. 76
PRIMARY FLIGHT DISPLAY - ATTITUDE INDICATIONS
Attitude information on a PFD is a big deal, a really big deal, in that the background (so to speak) of the entire display fronts as theattitude indicator. The horizon line on two different PFDs in position A and B. When the attitude exceeds 50 degrees pitch above thehorizon or 30 degrees below, large red chevrons appear (on Garmin’s G1000 display, position C) pointing the direction toward a morenormal flight attitude. Some PFDs use white chevrons to provide the same information.
Fig. 77
Licensed exclusively for DeWayne Britton ([email protected]) Transaction: #0002858938
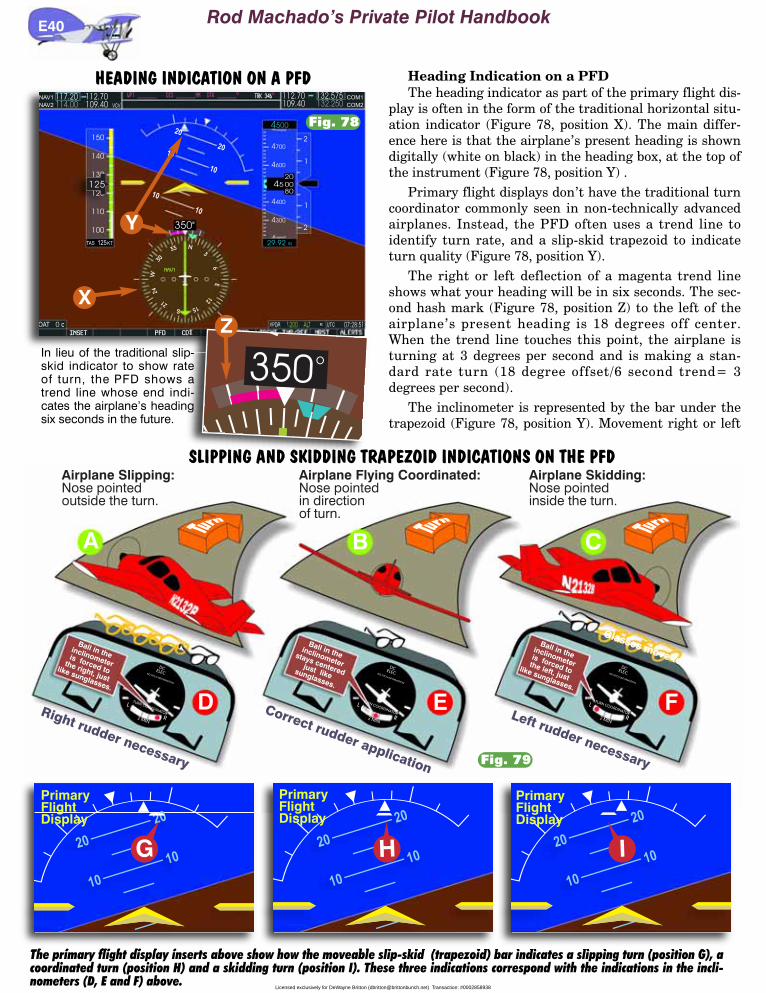
Heading Indication on a PFDThe heading indicator as part of the primary flight dis-
play is often in the form of the traditional horizontal situ-ation indicator (Figure 78, position X). The main differ-ence here is that the airplane’s present heading is showndigitally (white on black) in the heading box, at the top ofthe instrument (Figure 78, position Y) .
Primary flight displays don’t have the traditional turncoordinator commonly seen in non-technically advancedairplanes. Instead, the PFD often uses a trend line toidentify turn rate, and a slip-skid trapezoid to indicateturn quality (Figure 78, position Y).
The right or left deflection of a magenta trend lineshows what your heading will be in six seconds. The sec-ond hash mark (Figure 78, position Z) to the left of theairplane’s present heading is 18 degrees off center.When the trend line touches this point, the airplane isturning at 3 degrees per second and is making a stan-dard rate turn (18 degree offset/6 second trend= 3degrees per second).
The inclinometer is represented by the bar under thetrapezoid (Figure 78, position Y). Movement right or left
E40 Rod Machado’s Private Pilot Handbook
2
2
1
1
INSET PFD CDI OBS XPDR IDENT TMR/REF NRST ALERTS
OAT 0 C XPDR UTCR1200 ALT 07:28:51
NAV1
NAV2 VCV
WPT ________ DIS ________NM DTK ________117.20114.00
112.70109.40
COM1
COM2
OTRK 346
O132.575132.250
112.70109.40
.
33 N
3
6E
12
15S21
24
W30
350o
NAV1
o
150
140
130
120
110
100
TAS KT125
4
4
4
4
700
600
400
300
4500
29.92 IN
20
4500
8010
10
20
2010
10
125
HEADING INDICATION ON A PFD
In lieu of the traditional slip-skid indicator to show rateof turn, the PFD shows atrend line whose end indi-cates the airplane’s headingsix seconds in the future.
XZ
Y
A B C
Glasses move to left
Airplane Slipping:Nose pointedoutside the turn.
Airplane Skidding:Nose pointedinside the turn.
Airplane Flying Coordinated:Nose pointedin directionof turn.
DCELEC
TURN COORDINATOR
2 MIN
NO PITCH INFORMATION
L
R
Ball in theinclinometeris forced to
the right, justlike sunglasses.
Right rudder necessary
DCELEC
TURN COORDINATOR
2 MIN
NO PITCH INFORMATION
L
R
Ball in theinclinometeris forced to
the left, justlike sunglasses.
Left rudder necessary
DCELEC
TURN COORDINATOR
2 MIN
NO PITCH INFORMATION
L
R
Ball in theinclinometer
stays centeredjust likesunglasses.
Correct rudder application
D E F
The primary flight display inserts above show how the moveable slip-skid (trapezoid) bar indicates a slipping turn (position G), acoordinated turn (position H) and a skidding turn (position I). These three indications correspond with the indications in the incli-nometers (D, E and F) above.
20
20
10
10
20
20
10
10
20
20
10
10G H I
PrimaryFlightDisplay
PrimaryFlightDisplay
PrimaryFlightDisplay
SLIPPING AND SKIDDING TRAPEZOID INDICATIONS ON THE PFD
Fig. 78
Fig. 79
Licensed exclusively for DeWayne Britton ([email protected]) Transaction: #0002858938
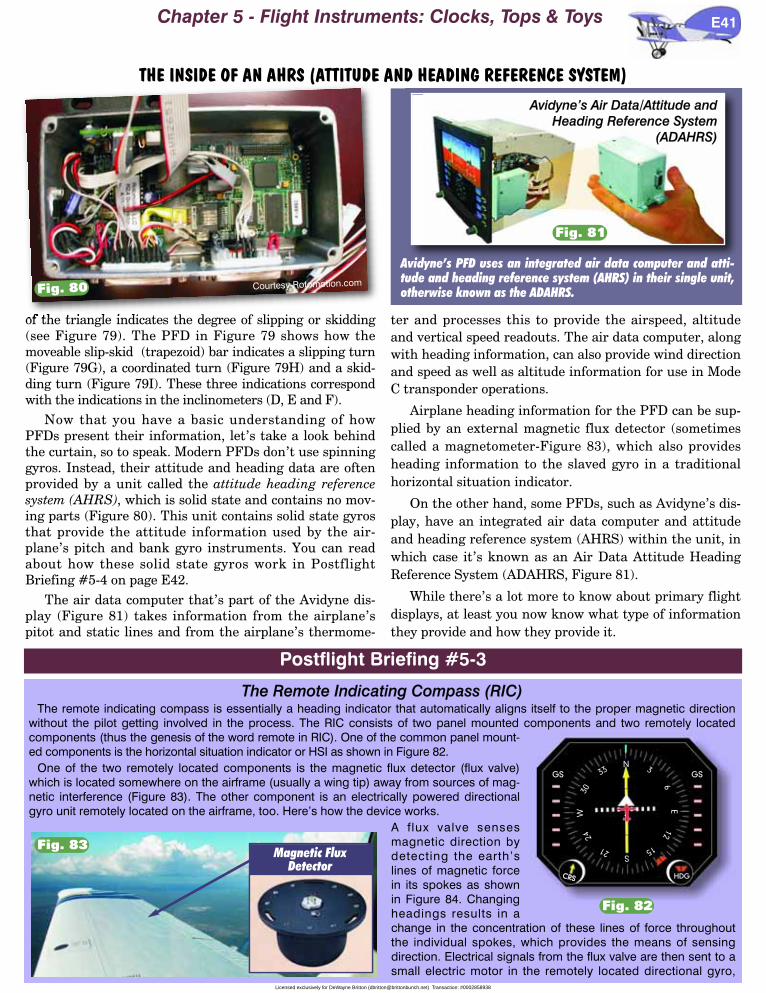
of the triangle indicates the degree of slipping or skidding(see Figure 79). The PFD in Figure 79 shows how themoveable slip-skid (trapezoid) bar indicates a slipping turn(Figure 79G), a coordinated turn (Figure 79H) and a skid-ding turn (Figure 79I). These three indications correspondwith the indications in the inclinometers (D, E and F).
Now that you have a basic understanding of howPFDs present their information, let’s take a look behindthe curtain, so to speak. Modern PFDs don’t use spinninggyros. Instead, their attitude and heading data are oftenprovided by a unit called the attitude heading referencesystem (AHRS), which is solid state and contains no mov-ing parts (Figure 80). This unit contains solid state gyrosthat provide the attitude information used by the air-plane’s pitch and bank gyro instruments. You can readabout how these solid state gyros work in PostflightBriefing #5-4 on page E42.
The air data computer that’s part of the Avidyne dis-play (Figure 81) takes information from the airplane’spitot and static lines and from the airplane’s thermome-
ter and processes this to provide the airspeed, altitudeand vertical speed readouts. The air data computer, alongwith heading information, can also provide wind directionand speed as well as altitude information for use in ModeC transponder operations.
Airplane heading information for the PFD can be sup-plied by an external magnetic flux detector (sometimescalled a magnetometer-Figure 83), which also providesheading information to the slaved gyro in a traditionalhorizontal situation indicator.
On the other hand, some PFDs, such as Avidyne’s dis-play, have an integrated air data computer and attitudeand heading reference system (AHRS) within the unit, inwhich case it’s known as an Air Data Attitude HeadingReference System (ADAHRS, Figure 81).
While there’s a lot more to know about primary flightdisplays, at least you now know what type of informationthey provide and how they provide it.
Chapter 5 - Flight Instruments: Clocks, Tops & Toys E41
THE INSIDE OF AN AHRS (ATTITUDE AND HEADING REFERENCE SYSTEM)
Avidyne’s Air Data/Attitude andHeading Reference System
(ADAHRS)
Avidyne’s PFD uses an integrated air data computer and atti-tude and heading reference system (AHRS) in their single unit,otherwise known as the ADAHRS.Courtesy Rotomotion.comFig. 80
Fig. 81
Postflight Briefing #5-3
GS GS
CRSCRS HDG
.
33N
3
6E
12
15S21
24
W30
The Remote Indicating Compass (RIC)The remote indicating compass is essentially a heading indicator that automatically aligns itself to the proper magnetic direction
without the pilot getting involved in the process. The RIC consists of two panel mounted components and two remotely locatedcomponents (thus the genesis of the word remote in RIC). One of the common panel mount-ed components is the horizontal situation indicator or HSI as shown in Figure 82.
One of the two remotely located components is the magnetic flux detector (flux valve)which is located somewhere on the airframe (usually a wing tip) away from sources of mag-netic interference (Figure 83). The other component is an electrically powered directionalgyro unit remotely located on the airframe, too. Here’s how the device works.
A flux valve sensesmagnetic direction bydetecting the earth’slines of magnetic forcein its spokes as shownin Figure 84. Changingheadings results in achange in the concentration of these lines of force throughoutthe individual spokes, which provides the means of sensingdirection. Electrical signals from the flux valve are then sent to asmall electric motor in the remotely located directional gyro,
Magnetic FluxDetector
Fig. 83
Fig. 82
Licensed exclusively for DeWayne Britton ([email protected]) Transaction: #0002858938
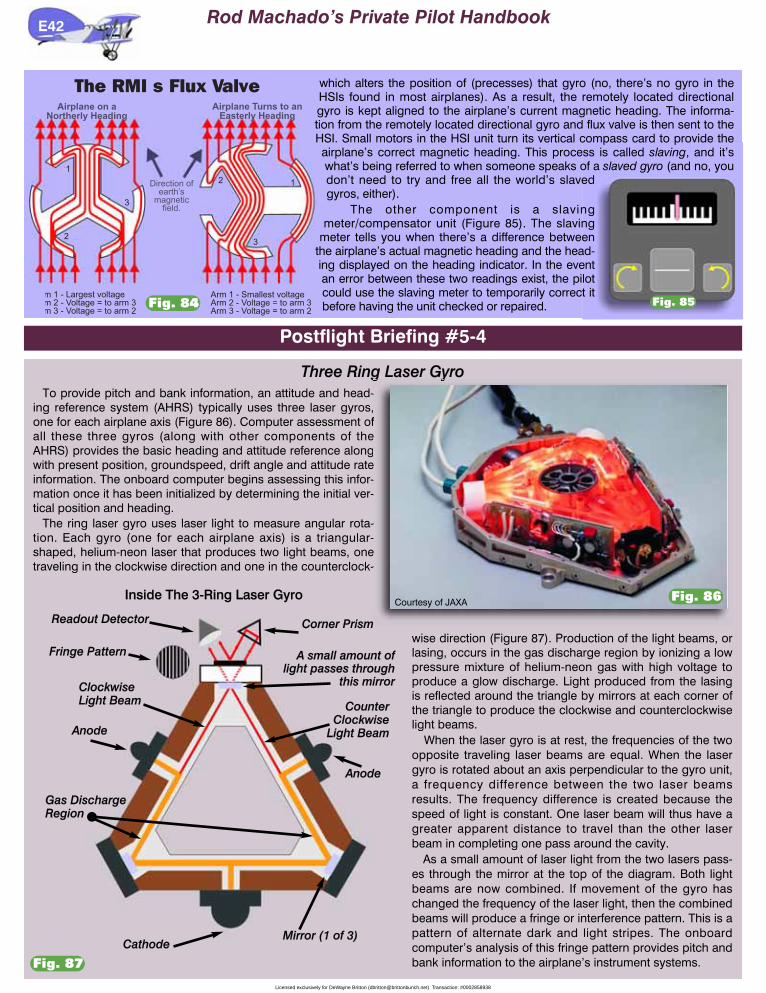
E42 Rod Machado’s Private Pilot Handbook
Three Ring Laser GyroTo provide pitch and bank information, an attitude and head-
ing reference system (AHRS) typically uses three laser gyros,one for each airplane axis (Figure 86). Computer assessment ofall these three gyros (along with other components of theAHRS) provides the basic heading and attitude reference alongwith present position, groundspeed, drift angle and attitude rateinformation. The onboard computer begins assessing this infor-mation once it has been initialized by determining the initial ver-tical position and heading.
The ring laser gyro uses laser light to measure angular rota-tion. Each gyro (one for each airplane axis) is a triangular-shaped, helium-neon laser that produces two light beams, onetraveling in the clockwise direction and one in the counterclock-
wise direction (Figure 87). Production of the light beams, orlasing, occurs in the gas discharge region by ionizing a lowpressure mixture of helium-neon gas with high voltage toproduce a glow discharge. Light produced from the lasingis reflected around the triangle by mirrors at each corner ofthe triangle to produce the clockwise and counterclockwiselight beams.
When the laser gyro is at rest, the frequencies of the twoopposite traveling laser beams are equal. When the lasergyro is rotated about an axis perpendicular to the gyro unit,a frequency difference between the two laser beamsresults. The frequency difference is created because thespeed of light is constant. One laser beam will thus have agreater apparent distance to travel than the other laserbeam in completing one pass around the cavity.
As a small amount of laser light from the two lasers pass-es through the mirror at the top of the diagram. Both lightbeams are now combined. If movement of the gyro haschanged the frequency of the laser light, then the combinedbeams will produce a fringe or interference pattern. This is apattern of alternate dark and light stripes. The onboardcomputer’s analysis of this fringe pattern provides pitch andbank information to the airplane’s instrument systems.
Corner Prism
A small amount oflight passes through
this mirror
Cathode
Gas DischargeRegion
ClockwiseLight Beam Counter
ClockwiseLight Beam
Readout Detector
Fringe Pattern
Anode
Anode
Mirror (1 of 3)
Inside The 3-Ring Laser GyroCourtesy of JAXA
Postflight Briefing #5-4
which alters the position of (precesses) that gyro (no, there’s no gyro in theHSIs found in most airplanes). As a result, the remotely located directionalgyro is kept aligned to the airplane’s current magnetic heading. The informa-tion from the remotely located directional gyro and flux valve is then sent to theHSI. Small motors in the HSI unit turn its vertical compass card to provide theairplane’s correct magnetic heading. This process is called slaving, and it’swhat’s being referred to when someone speaks of a slaved gyro (and no, youdon’t need to try and free all the world’s slavedgyros, either).
The other component is a slavingmeter/compensator unit (Figure 85). The slaving
meter tells you when there’s a difference betweenthe airplane’s actual magnetic heading and the head-ing displayed on the heading indicator. In the eventan error between these two readings exist, the pilotcould use the slaving meter to temporarily correct itbefore having the unit checked or repaired.
The RMI s Flux ValveAirplane on a
Northerly Heading
Direction of
earth’s
magnetic
field.
m 1 - Largest voltage
m 2 - Voltage = to arm 3
m 3 - Voltage = to arm 2
Arm 1 - Smallest voltage
Arm 2 - Voltage = to arm 3
Arm 3 - Voltage = to arm 2
1
1
Airplane Turns to an
Easterly Heading
2
2
3
3
Fig. 84
Fig. 86
Fig. 87
Fig. 85
Licensed exclusively for DeWayne Britton ([email protected]) Transaction: #0002858938