rogers park juvenile justice snapshot - chicago youth
TRANSCRIPT

Project NIA (www.projectnia.org) Page 1
ROGERS PARK JUVENILE JUSTICE SNAPSHOT (2010 Edition)
January 2012
By Mariame Kaba, Project NIA (with contributions by Chez Rumpf, Center for Urban Research & Learning)
This is the third neighborhood-specific juvenile justice snapshot report produced by Project NIA. The first was released in November 2010 and included juvenile justice data from 2009 for the Rogers Park community. The second report released in June 2011 presented juvenile justice data for the North Lawndale community. The current report revisits Rogers Park and draws on 2010 juvenile justice data.
Community members need timely and accessible information about how youth are faring in order to mobilize for social change. Project NIA publishes our community-specific juvenile justice snapshots with the hope that our neighbors will join with us to dramatically decrease the numbers of our young people who are arrested, detained, and/or incarcerated.
Rogers Park is the northern-most community area in Chicago and one of the most ethnically and racially di-verse communities in the city. In 2009, the total population of the neighborhood was 34 percent Hispanic, 28 percent African-American, and 27 percent white. Rogers Park is served by the 24th police district.
Over 6,000 young people ages 6 to 17 live in Rogers Park. 35.6% of youth ages 6 to 17 years old in Rogers Park live under the poverty line. Below is a chart that breaks down this number by age and compares it to city, county, and state numbers.
Total Population* Age 6–11 Age 12–14 Age 15 Age 16–17 % Poor
Rogers Park 6,008 2,813 1,526 702 967 35.6%
Chicago 432,991 213,530 108,865 37,637 72,923 31.2%
Cook County 827,667 412,348 202,867 69,873 142,579 22.6%
Illinois 2,104,123 1,041,404 522,072 178,403 362,244 18.6%
Source: U.S. Census, American Community Survey: 2009
* The total population number represents children and youth ages 6-17.
The next few pages provide an overview of some data about how youth in Rogers Park interact with the juve-nile legal system. The report relies on data obtained through freedom of information act (FOIA) requests as well as data procured directly from stakeholders within the juvenile justice system.

Rogers Park Juvenile Justice Snapshot
Project NIA (www.projectnia.org) Page 2
ACKNOWLEDGEMENTS
Thanks to John Bentley (Cook County Juvenile Probation Department) and Caitlin Patterson (First Defense Legal Aid) for their assistance with data collection for this report. Thanks also to Andrew Fernandez, director of youth services in the City of Chicago’s Department of Family and Support Services for his help in accessing needed information. I am also grateful to the Center for Urban Research and Learning (CURL) and Chez Rumpf for their help with data and design. Special thanks to the Steans Family Foundation and the Chicago Commu-nity Trust for their financial support of this work.

Rogers Park Juvenile Justice Snapshot
Project NIA (www.projectnia.org) Page 3
INTRODUCTION: A SHORT AND INCOMPLETE TOUR OF THE JUVENILE JUSTICE SYSTEM IN ILLINOIS
Once a minor is arrested and processed for an alleged criminal offense, a youth officer from the Area Detec-tives Special Victims Unit is assigned to the case. If the juvenile was arrested for a misdemeanor or other minor crime, the youth officer has the discretion to release the juvenile with no charges or a warning, to release the minor with a formal or informal station adjustment (subject to statutory limitations), or to refer the case for prosecution.
If the juvenile is investigated for a felony, the youth officer must be present during questioning unless the juvenile is accompanied by a parent, defense lawyer, or other concerned adult. It is not the youth officer’s responsibility to defend the juvenile, e.g., it is not the youth officer’s responsibility to encourage the juvenile to exercise his right to remain silent. The detectives investigating the felony case may decide to release the juvenile without charges or refer the case to the State’s Attorney’s Office, which determines whether there is enough evidence to prosecute.
If the juvenile is charged with a crime (referred to the State’s Attorney’s Office for prosecution), he may be re-leased to his parent or guardian with an order to appear in court on a specified date, or the police may call the probation department to authorize detention of the juvenile. The probation department uses a screening tool, which considers such factors as the nature of the offense and the juvenile’s history of delinquency, to deter-mine whether the juvenile will be detained pending his appearance before a judge. If the minor is detained, he is entitled to a detention hearing within 40 hours, at which a juvenile court judge determines whether there is “urgent and immediate necessity” to continue to hold the juvenile in custody prior to their adjudication.
Once a young person is referred from law enforcement, the State’s Attorney has discretion to decide whether a petition1 will be filed to the court. Some cases are diverted by State’s Attorney’s Office, usually meaning that the SAO exercises its discretion to refrain from prosecuting the juvenile as long as he successfully completes a diversion program. Unfortunately, data about those cases were not provided by the Office of the State’s At-torney despite repeated requests. The most recent case screening data available from the Cook County State’s Attorney is from 2008: 43% of referrals were petitioned into court; 35% were not filed due to insufficient evidence to support the charge; and 22% were referred to a diversion2 program (Juvenile Justice in Cook County: Report of the Cook County Juvenile Court, Juvenile Justice Division, 2009).
1 “A delinquency petition is a document filed in delinquency cases with the juvenile court through the state’s attorney alleging that a juvenile is a delinquent. The petition sets forth the supporting facts regarding the alleged offense, information about the minor, and, if the minor is detained, the start date of the detention. The petition requests that the minor be adjudged a ward of the court and asks for relief under the Juvenile Court Act. Supplemental petitions may be filed alleging new offenses or alleging new violations of orders entered by the court in the delinquency proceeding” (Illinois Criminal Justice Information Authority, Glossary, 2007).
2 “Diversion programs avoid bringing youth deeper into the juvenile justice system when this can be safely avoided. Whenever possible, these programs follow the principles of Balanced and Restorative Justice – balancing the needs of the victims, the youthful offender and the community. These diversion programs seek to hold youth accountable for their behavior while involving youth in restoring, as much as possible, both the victim and the community (p.2, in Juvenile Justice in Cook County: Report of the Cook County Juvenile Court, Juvenile Justice Division, 2009).”

Rogers Park Juvenile Justice Snapshot
Project NIA (www.projectnia.org) Page 4
If a case makes it to court, it is heard by a juvenile court judge. The judge has several options after the adjudi-catory hearing (known as a trial in adult system). He or she can find the young person not delinquent (known as not-guilty in the adult system), delinquent, sentence a youth to a community-based alternative, sentence a youth to supervision/probation, or sentence the youth to prison.
The Illinois Criminal Justice Information Authority (ICJIA) has produced a comprehensive primer about the Il-linois Juvenile Justice system titled “Policies and Procedures of the Illinois Juvenile Justice System.” We strongly recommend the publication which can be downloaded here: http://icjia.org/public/pdf/ResearchReports/IL_Juvenile_Justice_System_Walkthrough_0810.pdf

Rogers Park Juvenile Justice Snapshot
Project NIA (www.projectnia.org) Page 5
SECTION 1 — TOTAL JUVENILE ARRESTS3 IN CHICAGO
As you read through this report, please be aware of a few important things. Arrest statistics report the number of arrests that the police made in a given year. They do not describe the number of individuals arrested or the number of crimes committed. As Puzzzanchera and Adams point out:
“The number of arrests is not the same as the number of people arrested because an unknown num-ber of individuals are arrested more than once during the year. Nor do arrest statistics represent the number of crimes that arrested individuals commit because a series of crimes that one person com-mits may culminate in a single arrest, and a single crime may result in the arrest of more than one per-son. This latter situation, where many arrests result from one crime, is relatively common in juvenile law-violating behavior because juveniles are more likely than adults to commit crimes in groups.4”
The Chicago Police Department (CPD) made 27,563 juvenile arrests in 2010.
Arrests by District (Persons 17 and Under) – City of Chicago, 2009-2010
District 2009 2010 TOTAL
01 676 685 1,361
02 873 731 1,604
03 1,942 1,660 3,602
04 2,001 1,914 3,915
05 1,627 1,464 3,091
06 2,040 1,674 3,714
07 1,665 1,447 3,112
08 2,565 2,247 4,812
09 1,671 1,334 3,005
10 1,349 1,348 2,697
11 2,478 2,141 4,619
12 957 880 1,837
13 551 417 968
14 815 588 1,403
15 2,021 1,975 3,996
16 685 494 1,179
3 Includes felonies AND misdemeanors. In this report, juvenile means youth ages 17 and under.
4 Puzzanchera, Charles and Adams, Benjamin (2011, Dec). “Juvenile Arrests 2009”. U.S. Department of Justice, Office of Juvenile Justice and Delinquency Prevention. http://www.ojjdp.gov/pubs/236477.pdf

Rogers Park Juvenile Justice Snapshot
Project NIA (www.projectnia.org) Page 6
17 1,031 959 1,990
18 662 770 1,432
19 317 318 635
20 559 590 1,149
21 443 472 915
22 1,266 1,129 2,395
23 248 212 460
24 920 708 1,628
25 1,862 1,406 3,268
TOTAL 31,224 27,563 58,787
Source: CLEARDW query 8 March 2011 – obtained through FOIA request
According to census data, in Chicago, 33.7 percent of youth ages 5 to 17 were black, 32.8% were Hispanic, 11.7 percent were White, and 2.8 percent were Asian (Census 2010).
Total Youth 5-17 Years of Age By Race/Ethnicity in Chicago: 2010 Census
White 66,525 11.7%
Black 191,461 33.7%
Native American 845 0.1%
Asian 16,059 2.8%
Hawaiian 88 0.0%
Some Other Race Alone 95,388 16.8%
Two or More Races 11,785 2.1%
Hispanic 185,676 32.8%
Total 567,827 100.0%

Rogers Park Juvenile Justice Snapshot
Project NIA (www.projectnia.org) Page 7
Yet, Black youth in Chicago accounted for 76 percent of juvenile arrests while 19.6 percent were of Latino/Hispanic youth. African American youth are disproportionately targeted for arrest in Chicago as are young men who represented 85% of juvenile arrests.
Total Juvenile Arrests by Sex and Race (Persons 17 and Under) – City of Chicago, 2010
2010 Race Female Male Unknown Total
Chicago – Total Arrests
Asian/Pacific Islander 19 83 0 102
African American 3,284 17,644 2 20,930 (76%)
Other 2 10 0 12
Unknown 1 12 0 13
Black Hispanic 22 133 0 155
Caucasian 150 786 0 936 (3.3%)
White Hispanic 690 4,728 0 5,418 (19.6%)
Total 4,168 (15%)
23,396 (85%)
2 27,566*
Source: CLEARDW query 12 June 2011 – obtained through FOIA
Rogers Park Juvenile Justice Snapshot
Project NIA (www.projectnia.org) Page 8
SECTION 2 – JUVENILE ARRESTS IN 24TH DISTRICT IN 2009 AND 2010
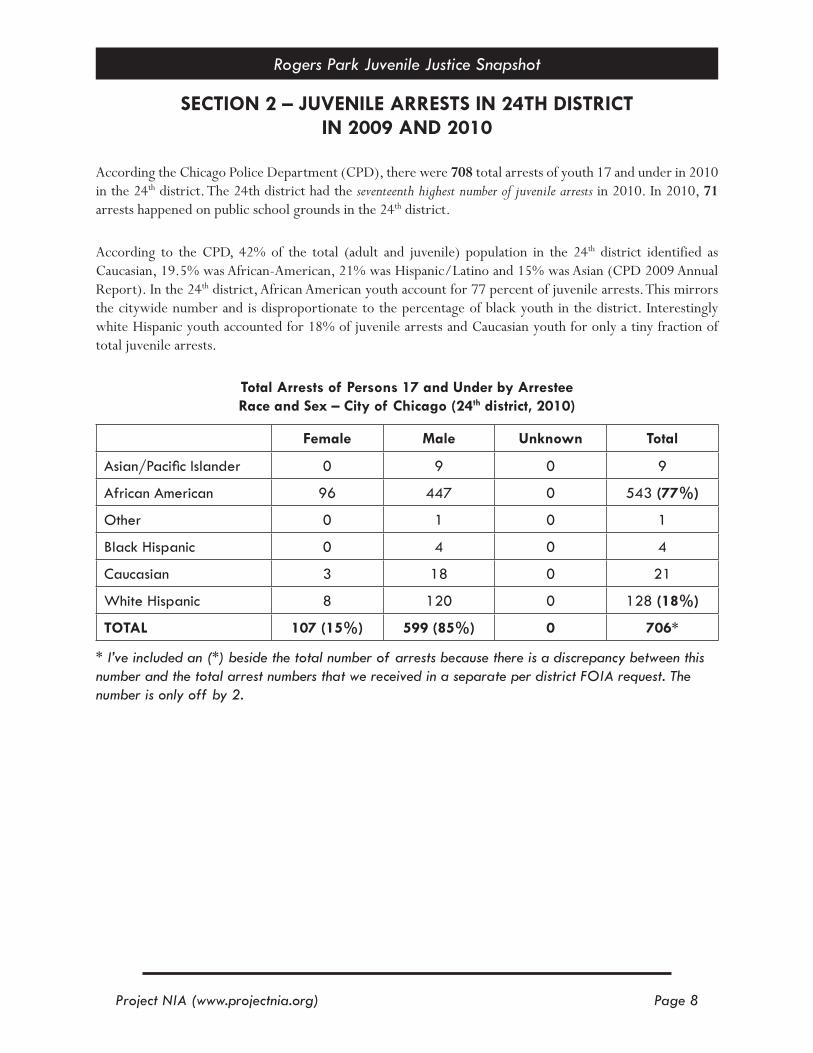
According the Chicago Police Department (CPD), there were 708 total arrests of youth 17 and under in 2010 in the 24th district. The 24th district had the seventeenth highest number of juvenile arrests in 2010. In 2010, 71 arrests happened on public school grounds in the 24th district.
According to the CPD, 42% of the total (adult and juvenile) population in the 24th district identified as Caucasian, 19.5% was African-American, 21% was Hispanic/Latino and 15% was Asian (CPD 2009 Annual Report). In the 24th district, African American youth account for 77 percent of juvenile arrests. This mirrors the citywide number and is disproportionate to the percentage of black youth in the district. Interestingly white Hispanic youth accounted for 18% of juvenile arrests and Caucasian youth for only a tiny fraction of total juvenile arrests.
Total Arrests of Persons 17 and Under by Arrestee Race and Sex – City of Chicago (24th district, 2010)
Female Male Unknown Total
Asian/Pacific Islander 0 9 0 9
African American 96 447 0 543 (77%)
Other 0 1 0 1
Black Hispanic 0 4 0 4
Caucasian 3 18 0 21
White Hispanic 8 120 0 128 (18%)
TOTAL 107 (15%) 599 (85%) 0 706*
* I’ve included an (*) beside the total number of arrests because there is a discrepancy between this number and the total arrest numbers that we received in a separate per district FOIA request. The number is only off by 2.

Rogers Park Juvenile Justice Snapshot
Project NIA (www.projectnia.org) Page 9
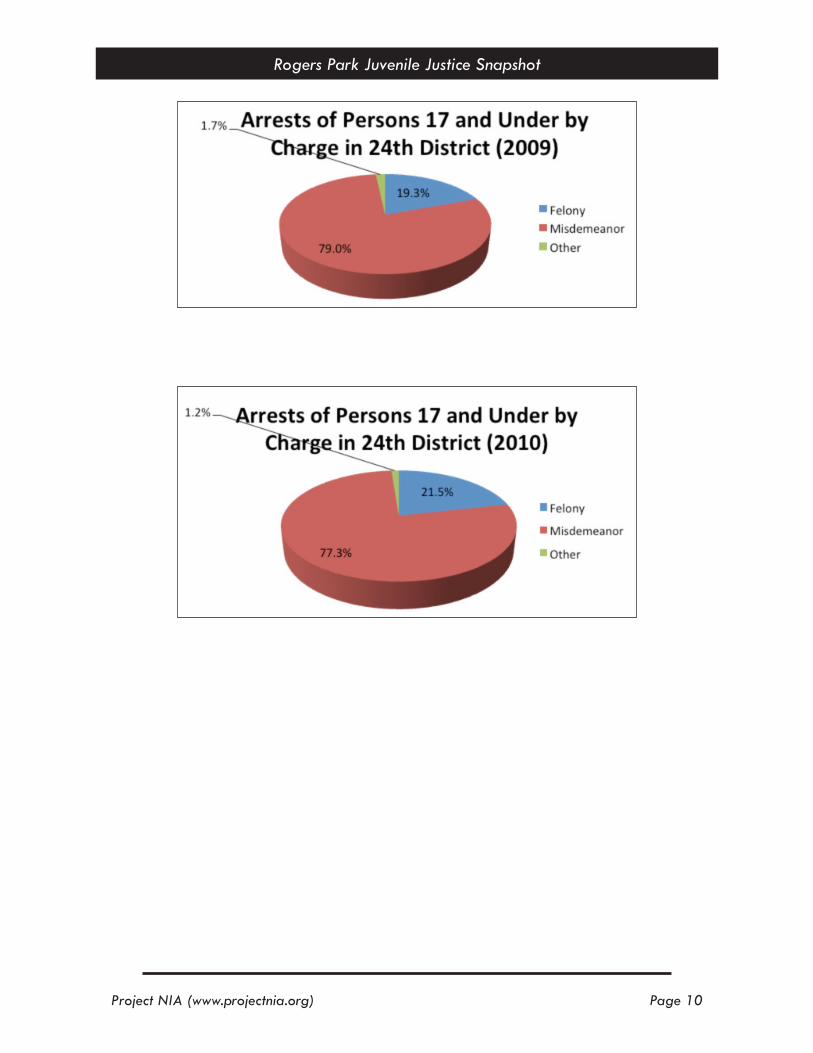
Total Number of Arrests of Persons 17 and Under by Charge5 (24th district, 2009 & 2010)
There is a difference between the total number of arrests provided by CPD and the detailed numbers by charge. The charge type is provided for informational purposes to provide context for the number of total arrests.
24th District
CHARGE TYPE 2009 2010
Felony 151 138
Misdemeanor 618 497
Other* 13 8
Total (based on charges) 782 643
Total (based on CPD district arrest totals)
920 708
*Municipal Ordinance Arrests
5 Please note that a juvenile can be arrested once and have several charges.
Rogers Park Juvenile Justice Snapshot
Project NIA (www.projectnia.org) Page 10

Rogers Park Juvenile Justice Snapshot
Project NIA (www.projectnia.org) Page 11
SECTION 3 – JUVENILE ARRESTS BY OFFENSES
In Chicago, more youth are arrested for misdemeanors than felony crimes. The same is true in the 24th district where the top three misdemeanor offenses in 2010 were: miscellaneous non-index offenses, drug abuse violations, and simple battery.
Arrests by Offense Classification (Misdemeanor) – Persons 17 and Under (24th District)
Description 24th District
2009 2010
Aggravated Assault 22 18
Larceny – Theft 74 70
Motor Vehicle Theft 15 15
Simple Assault 25 27
Simple Battery 115 72
Forgery and Counterfeiting 0 0
Fraud 0 0
Vandalism 30 47
Weapons 6 6
Prostitution 0 0
Sex Offense – Criminal Sexual Abuse
0 1
Drug Abuse Violations 124 75
Gambling 9 3
Offenses against Family and Children/ Involving Children
1 0
Driving Under the Influence 0 0
Liquor Laws 7 3
Disorderly Conduct 70 69
Miscellaneous Non-Index Offenses
119 90
Miscellaneous Municipal Code Violations
0 0
Traffic Violations 1 1
TOTAL 618 497

Rogers Park Juvenile Justice Snapshot
Project NIA (www.projectnia.org) Page 12
Arrests by Offense Classification (Felony) – Persons 17 and Under (24th District)
24th District
Description 2009 2010
Murder 0 0
Involuntary Manslaughter/Reckless Homicide w/vehicle
0 0
Criminal Sexual Assault 4 1
Robbery 47 63
Aggravated Assault 1 1
Aggravated Battery 19 11
Burglary 26 21
Larceny – Theft 8 7
Motor Vehicle Theft 11 9
Simple Assault 0 0
Simple Battery 1 0
Arson 1 0
Forgery and Counterfeiting 0 0
Fraud 1 0
Vandalism 2 5
Weapons 8 10
Prostitution 0 0
Sex Offense - Criminal Sexual Abuse
0 0
Drug Abuse Violations 18 9
Offenses against Family and Children/ Involving Children
0
Driving Under the Influence 1 0
Disorderly Conduct 1 0
Miscellaneous Non-Index Offenses
2 1
Traffic Violations 0 0
TOTAL 151 138

Rogers Park Juvenile Justice Snapshot
Project NIA (www.projectnia.org) Page 13
In 2010, the top three felony offenses for which youth were arrested in 24th district was:
24th District
Robbery 63
Burglary 21
Aggravated Battery 11

Rogers Park Juvenile Justice Snapshot
Project NIA (www.projectnia.org) Page 14
SECTION 4 – SCHOOL-BASED JUVENILE ARRESTS (CHICAGO PUBLIC SCHOOLS)
In 2010, there were 5,574 juvenile (17 and under) school-based arrests in Chicago. In the 24th district, there were 71 juvenile school-based arrests which represented only 1.27% of all juvenile school based arrests in the city of Chicago. Of the 71 juvenile school-based arrests in Rogers Park, 13 (18%) were young women and 58 (82%) were young men. The vast majority were African American youth (82%) and Latino youth represented 18% of those arrested. The vast majority of offenses that young people are arrested for on CPS property in the 24th district are non-index offenses. This mirrors the citywide pattern.
Arrests at Public School Locations by Districts (City of Chicago & 24th District - 2009 & 2010) **
Location 2009 2010
Chicago 5,651 5,574
24th District 93 1.65% 71 1.27%
Source: CLEAR DW queried 3/8/11
**Includes location codes that reflect public schools buildings and public school grounds

Rogers Park Juvenile Justice Snapshot
Project NIA (www.projectnia.org) Page 15
SECTION 5– STATION ADJUSTMENTS6
In 2010, detectives in the 24th district issued 21 formal station adjustments and 171 informal station adjust-ments for a total of 192 station adjustments.
Station Adjustments – by District (2009 and 2010)
2009 2010
District Formal Adjustments
Informal Adjustments
Formal Adjustments
Informal Adjustments
24 19 97 21 171
All Chicago (total)
1,381 6,090 1,733 7,040
6 Station adjustment is the informal or formal handling of a minor by a juvenile police officer as a diversionary intervention proce-dure as defined by the Illinois Juvenile Court Act (ICJIA, Glossary, 2007).

Rogers Park Juvenile Justice Snapshot
Project NIA (www.projectnia.org) Page 16
SECTION 6 - JUVENILE COURT REFERRALS
Data provided by the Juvenile Probation and Court Services Department of the Circuit Court of Cook Coun-ty offer a profile of the number of juvenile arrests that law enforcement referred to the Office of the State’s Attorney (SAO) in 2010. Other information that will be shared in this section includes the gender, race, and age for each juvenile referred to the Office of the State’s Attorney in 2010.
Based on data from the Juvenile Probation and Court Services Department, in 2010, there were 19,726 court referrals in Cook County. In the 24th district, 449 juveniles were referred by law enforcement to the Office of the State’s Attorney in 2010.
Gender and Race/Ethnicity for Juveniles Referred to the Office of the State’s Attorney in 2010 – 24th district
AsianBlack Hisp/
LatinoBlack/ Af-Am
White Hisp/ Latino
White/ Caucasian Total
Male 10 (2.5%) 1 (0.3%) 299 (75.1%)
76 (19.1%) 11 (2.8%) 398* (88.6%)
Female 0 0 47(92.2%) 4 (7.8%) 0 51 (11.4%)
TOTAL 10 (2.2%) 1 (0.2%) 346 (77.1%)
80 (17.8%)
11 (2.4%) 449 (100%)
Source: Juvenile Enterprise Management System, Cook County Juvenile Probation Dept – run on 9/26/11
* total includes 1 young man who identified as American Indian.

Rogers Park Juvenile Justice Snapshot
Project NIA (www.projectnia.org) Page 17
Age for Juveniles Referred to the Office of the State’s Attorney in 2010 – 24th district
The clear majority of juveniles (61%) referred to the State’s Attorney from detectives in the 24th district were 16 and 17 years old.
Age Number of Juveniles Percent of Total
10 1 0.22%
11 1 0.22%
12 6 1.33%
13 19 4.23%
14 51 11.35%
15 94 20.93%
16 156 34.74%
17 119 26.50%
18 2 0.44%
TOTAL 449 100%

Rogers Park Juvenile Justice Snapshot
Project NIA (www.projectnia.org) Page 18
Referrals by Offense Classification – Persons 18 and Under (24th District)
Mis
dem
eano
rsOffense Number of Referrals
Percent of 24th District Misdemeanor Referrals
Aggravated Assault 7 3.7%
Larceny – Theft 27 14.4%
Trespassing 27 14.4%
Vandalism 8 4.3%
Simple Battery 56 29.8%
Disorderly Conduct 5 2.7%
Sex Offense – Criminal Sexual Abuse
2 1.1%
Drug Abuse violations 13 6.9%
Simple Assault 4 2.1%
Violation of Probation/Parole
35 18.6%
Resisting Peace Officer/Correctional Employee
4 2.1%
Total 188 100%
Felo
nies
Offense Number of ReferralsPercent of 24th District
Felony Referrals
Attempted Murder 4 1.7%
Larceny – Theft 26 11.3%
Robbery 56 24.3%
Burglary 19 8.3%
Weapons 33 14.3%
Motor Vehicle Theft 2 0.9%
Aggravated Battery 73 31.7%
Drug Abuse Violations 5 2.2%
Attempted Class X Felony 8 3.5%
Aggravated Assault 4 1.7%
Total 230 100%

Rogers Park Juvenile Justice Snapshot
Project NIA (www.projectnia.org) Page 19
SECTION 7 – JUVENILE PETITIONS FILED BY THE OFFICE OF THE STATE’S ATTORNEY (24TH DISTRICT)
Based on data from the Juvenile Probation and Court Services Department, in 2010, 7,375 juvenile petitions filed in the Circuit Court of Cook County. In the 24th district, the Office of the State’s Attorney filed 165 delinquency petitions7 with the court in 2010.
Gender and Race/Ethnicity for Juveniles With Filed Petitions in 2010 – 24th district
Asian Black/Af-AmWhite Hisp/
LatinoWhite/
Caucasian Total
Male 1 (0.7%) 118 (83.7%) 17 (12.1%) 5 (3.5%) 141 (85.5%)
Female 0 22 (91.7%) 2 (8.3%) 0 24 (14.5%)
TOTALS 1 (0.6%) 140 (84.8%) 19 (11.5%) 5 (3.0%) 165 (100%)
7 “A delinquency petition is a document filed in delinquency cases with the juvenile court through the state’s attorney alleging that a juvenile is a delinquent. The petition sets forth the supporting facts regarding the alleged offense, information about the minor, and, if the minor is detained, the start date of the detention. The petition requests that the minor be adjudged a ward of the court and asks for relief under the Juvenile Court Act. Supplemental petitions may be filed alleging new offenses or alleging new viola-tions of orders entered by the court in the delinquency proceeding” (Illinois Criminal Justice Information Authority, Glossary, 2007).

Rogers Park Juvenile Justice Snapshot
Project NIA (www.projectnia.org) Page 20
Age for Juveniles With Filed Petitions in 2010 – 24th district
The vast majority of juveniles (83%) with filed petitions to the court in the 24th district were 15, 16, and 17 years old.
Age Number of Juveniles Percent of Total
13 7 4.24%
14 21 12.72%
15 36 21.81%
16 72 43.63%
17 29 17.57%
TOTAL 165 100%
Rogers Park Juvenile Justice Snapshot
Project NIA (www.projectnia.org) Page 21
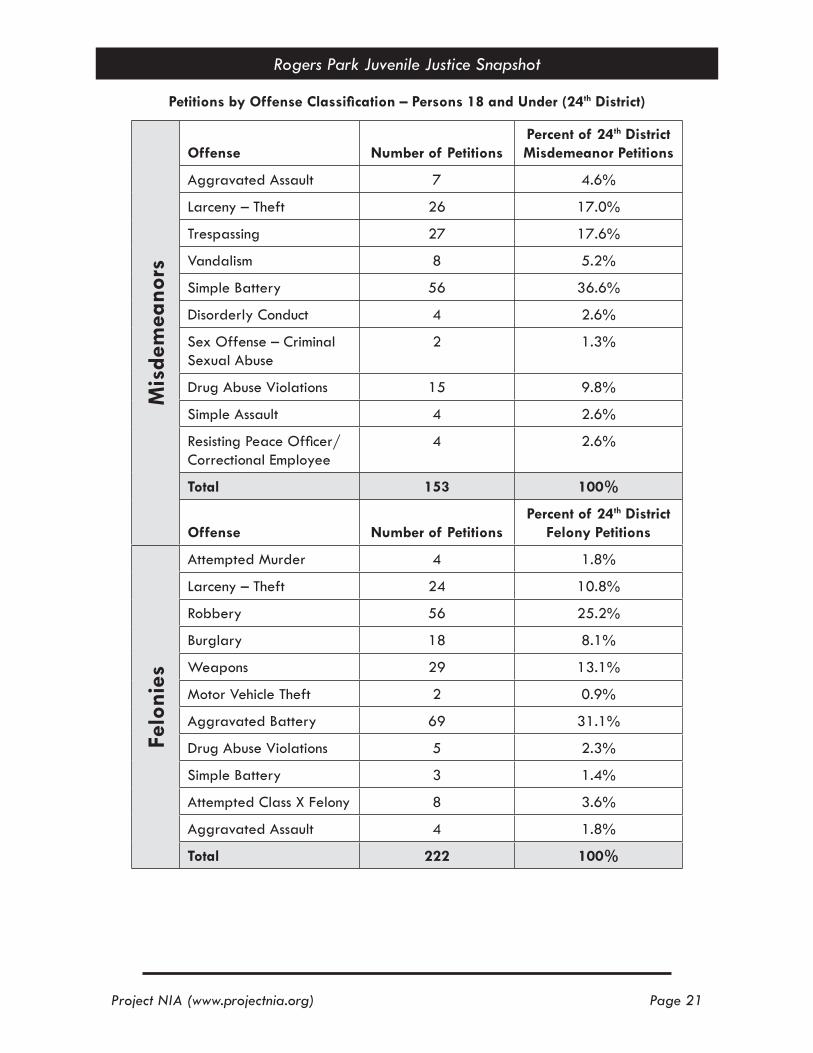
Petitions by Offense Classification – Persons 18 and Under (24th District)
Mis
dem
eano
rsOffense Number of Petitions
Percent of 24th District Misdemeanor Petitions
Aggravated Assault 7 4.6%
Larceny – Theft 26 17.0%
Trespassing 27 17.6%
Vandalism 8 5.2%
Simple Battery 56 36.6%
Disorderly Conduct 4 2.6%
Sex Offense – Criminal Sexual Abuse
2 1.3%
Drug Abuse Violations 15 9.8%
Simple Assault 4 2.6%
Resisting Peace Officer/Correctional Employee
4 2.6%
Total 153 100%
Offense Number of PetitionsPercent of 24th District
Felony Petitions
Felo
nies
Attempted Murder 4 1.8%
Larceny – Theft 24 10.8%
Robbery 56 25.2%
Burglary 18 8.1%
Weapons 29 13.1%
Motor Vehicle Theft 2 0.9%
Aggravated Battery 69 31.1%
Drug Abuse Violations 5 2.3%
Simple Battery 3 1.4%
Attempted Class X Felony 8 3.6%
Aggravated Assault 4 1.8%
Total 222 100%

Rogers Park Juvenile Justice Snapshot
Project NIA (www.projectnia.org) Page 22
SECTION 8 – PROBATION/SUPERVISION8
Once the Office of the State’s Attorney files a petition, then the case is heard by a judge. The judge has several options which include finding the youth not-delinquent (not guilty), finding the youth guilty, recommend-ing probation or supervision (formal or informal9), or committing the youth to the Department of Juvenile Justice (youth prison).
The judge can only sentence the juvenile to supervision or probation upon an adjudication of delinquency (the juvenile either pleads guilty or is found delinquent after trial). The judge has the option of ordering the juvenile to participate in pre-trial services such as evening reporting or electronic monitoring while the case is pending, which are run by the probation department, but those are not sentences of supervision or probation.
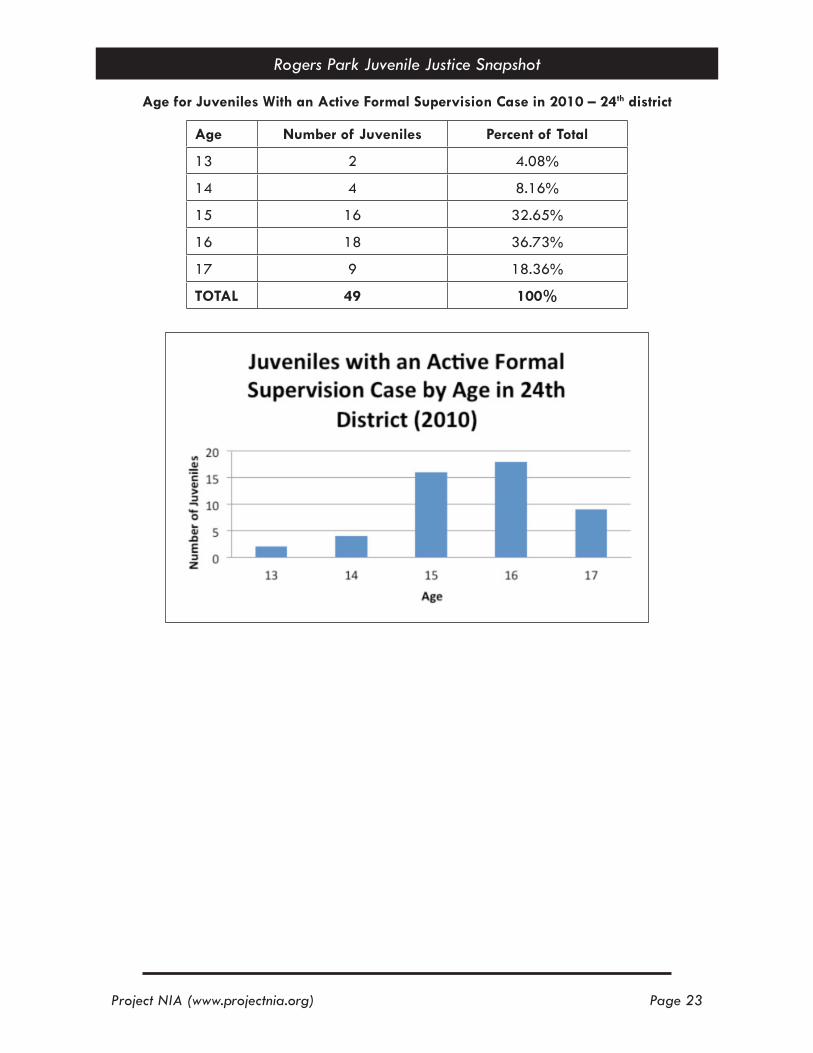
There were 49 juveniles with active formal supervision/probation cases in 2010 and 52 juveniles with infor-mal supervision/probation cases in the 24th district. 78% of those with active formal supervision/probation cases were African-American and 86% were male. The majority of these youth (70) were 15 and 16 years old.
Juveniles with an Active Formal Supervision Case in 2010 (race/ethnicity, gender – 24th district)
White/Caucasian Black/Af-AmWhite Hisp/
Latino Total
Male 2 (4.8%) 33 (78.6%) 7 (16.7%) 42 (85.7%)
Female 0 5 (71.4%) 2 (28.6%) 7 (14.3%)
TOTALS 2 (4.1%) 38 (77.6%) 9 (18.4%) 49 (100%)
8 Supervision (or supervised probation) is the guidance, treatment, or regulation of a youth by a probation agent on behalf of the court. Supervision may be imposed upon a youth adjudicated delinquent or upon certain non-delinquent youths such as Minors Requiring Authoritative Intervention (MRAI). (ICJIA, Glossary, 2007).
9 The data on the “informal supervision” cases represent cases that were diverted from the formal court process (no petition was filed in court). These decisions are made by the Office of the State’s Attorney and Juvenile Probation and Court Services without judicial involvement.
Rogers Park Juvenile Justice Snapshot
Project NIA (www.projectnia.org) Page 23
Age for Juveniles With an Active Formal Supervision Case in 2010 – 24th district
Age Number of Juveniles Percent of Total
13 2 4.08%
14 4 8.16%
15 16 32.65%
16 18 36.73%
17 9 18.36%
TOTAL 49 100%

Rogers Park Juvenile Justice Snapshot
Project NIA (www.projectnia.org) Page 24
Juveniles with an Active Informal Supervision Case in 2010 (race/ethnicity, gender – 24th district)
AsianBlack/ Af-Am
White Hisp/ Latino
White/ Caucasian
American Indian/Alaska Total
Male 5 (10.2%) 23 (46.9%) 16 (32.7%) 4 (8.2%) 1 (2%) 49 (94.2%)
Female 0 2 (66.7%) 1 (33.3%) 0 0 3 (5.8%)
TOTALS 5 (9.6%) 25 (48.1%) 17 (32.7%) 4 (7.7%) 1 (1.9%) 52 (100%)

Rogers Park Juvenile Justice Snapshot
Project NIA (www.projectnia.org) Page 25
Age for Juveniles With an Active Informal Supervision Case in 2010 – 24th district
Age Number of Juveniles Percent of Total
12 3 5.76%
13 6 11.53%
14 5 9.61%
15 13 25%
16 18 34.61%
17 7 13.46%
TOTAL 52 100%

Rogers Park Juvenile Justice Snapshot
Project NIA (www.projectnia.org) Page 26
SECTION 9 – DETENTION AND INCARCERATION
A. YOUTH IN DETENTION/JAIL
The Cook County Juvenile Temporary Detention Center (JTDC) serves mostly as a pre-trial detention facility. This facility holds the juvenile in custody while his/her case is pending, but before an adjudication of delinquency.
According to data obtained from Cook County Juvenile Probation Department, in 2010, 5271 youth were admitted to the Cook County Juvenile Temporary Detention Center10 (JTDC). 4800 (91%) of the incarcer-ated youth were male and 468 (9%) were female. 83% of the jailed youth were Black. Youth were detained for an average of 23 days. The following table based on data obtained from the JTDC presents information about the top 10 admissions zip codes from January through August 2011.
Zip Codes Total Admissions Percent of Total
60620 190 5.36%
60636 184 5.19%
60628 178 5.03%
60644 175 4.94%
60624 170 4.80%
60623 168 4.74%
60621 164 4.63%
60637 149 4.21%
60619 131 3.70%
60609 123 3.47%
Grand Total of All Zip Codes
3542 100%
Source: Cook County Juvenile Temporary Detention Center Intakes by Zip Code Report – Print Date 9/20/11
10 The Cook County Juvenile Temporary Detention Center is the juvenile jail for the county. Following allegations of abuse, violence, and unsanitary conditions, control of JTDC was handed over to a temporary administrator, Earl Dunlap, through an order from a U.S. Federal Judge.

Rogers Park Juvenile Justice Snapshot
Project NIA (www.projectnia.org) Page 27
Based on the JTDC data, there were 44 admissions from the 60626 zip code and 21 admissions from the 60645 zip code from January through August 2011. This means that Rogers Park youth accounted for an insig-nificant percentage of total admissions to the detention center over that time period.
Zip Codes Total Admissions Percent of Total
60626 44 0.12%
60645 21 0.06%
B. YOUTH IN PRISON
The Department of Juvenile Justice11 (DJJ) operates Illinois’s youth prisons. If a juvenile is adjudicated delin-quent or found to have violated probation, they can be sentenced to the DJJ. Data from the DJJ suggests that 2,198 youth across Illinois were admitted to a youth prison during FY2011 (June 1, 2010 to June 30, 2011). 64% of youth committed to a DJJ facility were Black, 24% were White and 11% were Hispanic/Latino. Half of the youth admitted were 16 years old (25%) and 17 years old (24%). The incarcerated youth were over-whelmingly male (93%). 41% of youth admitted to a DJJ facility were from Cook County (the vast majority of these youth were from Chicago). Data was not specifically available for youth committed from the 24th district. We were however able to secure data from the Illinois Criminal Justice Information Authority (ICJIA) about Rogers Park youth who were admitted to parole in FY11. An ICJIA analysis shows that 11 Rogers Park youth were admitted to parole in FY11.
Zip Code
Type of admission on which youth are paroled
Total Parole Admissions
New sentence admissions from court Technical violators
60626 4 5 9
60645 1 1 2
TOTAL 5 6 11
Source: Admissions to parole by zip code, all ages (13-20), FY11 - ICJIA analysis of IDJJ data (analyzed on 12/20/2011)
11 The Department of Juvenile Justice (DJJ) was created in 2006 as a stand-alone agency to serve juveniles separate from the Illinois Department of Corrections (IDOC).

Rogers Park Juvenile Justice Snapshot
Project NIA (www.projectnia.org) Page 28
REFERENCES
Chicago Police Department. 2009 Annual Report: A Year In Review. Available at: https://portal.chicagopolice.org/portal/page/portal/ClearPath/News/Statistical%20Reports/Annual%20Reports/09AR.pdf
Juvenile Justice in Cook County: Report of the Cook County Juvenile Court, Juvenile Justice Division, 2009
National Forum on Youth Violence Prevention: Chicago Initiative for Thriving Youth Report, 2011