roghayeh parsaee these approaches assume that the study sample arises from a homogeneous population...
TRANSCRIPT

بسم الله الرحمن الرحیم

MIXTURE MODEL
Roghayeh parsaee

VARIABLE-CENTERED VS. PERSON-CENTERED ANALYSES
VARIABLE-CENTERED
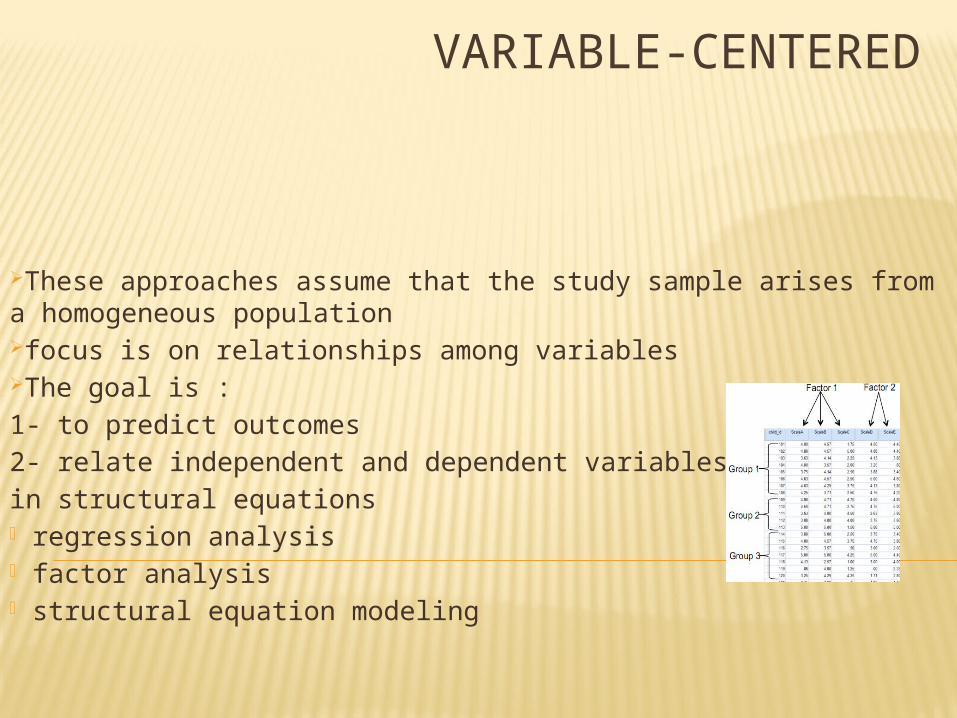
These approaches assume that the study sample arises from a homogeneous populationfocus is on relationships among variablesThe goal is :
1- to predict outcomes
2- relate independent and dependent variables
in structural equations- regression analysis- factor analysis- structural equation modeling
PERSON-CENTERED
focus is on relationships among individuals. The goal is to group individuals into categories, each one of which contains individuals who are similar to each other and different from individuals in other categories.
- cluster analysis
- finite mixture analysis
- latent class analysis
- latent transition analysis
FINITE MIXTURE DISTRIBUTIONS IN GENERAL
- DEFINITION
- As a simple definition, a mixture distribution is a combination of multiple distributions in a single functional form.
- In other words, a mixture distribution is a weighted combination of other known distributional forms. This allows for a great flexibility in statistical modeling to accommodate different multimodal shapes and allows finite mixtures applied to very different frameworks.
Most statistical methods assume that you have a sample of observations, all of which come from the same distribution, and that you are interested in modeling that one distribution.
If you actually have data from more than one distribution with no information to identify which observation goes with which distribution, standard models won’t help you. However, finite mixture models might come to the rescue.
They use a mixture of parametric distributions to model data, estimating
both the parameters for the separate distributions and the probabilities of component membership for each observation.
finite mixture models provide a mechanism that can account for unobserved heterogeneity in the data.
Certain important classifications of the data (such as region, age group, or gender) are not always measured. These latent classification variables can introduce underdispersion, overdispersion, or heteroscedasticity in a traditional model.
Finite mixture models overcome these problems through their more flexible form.
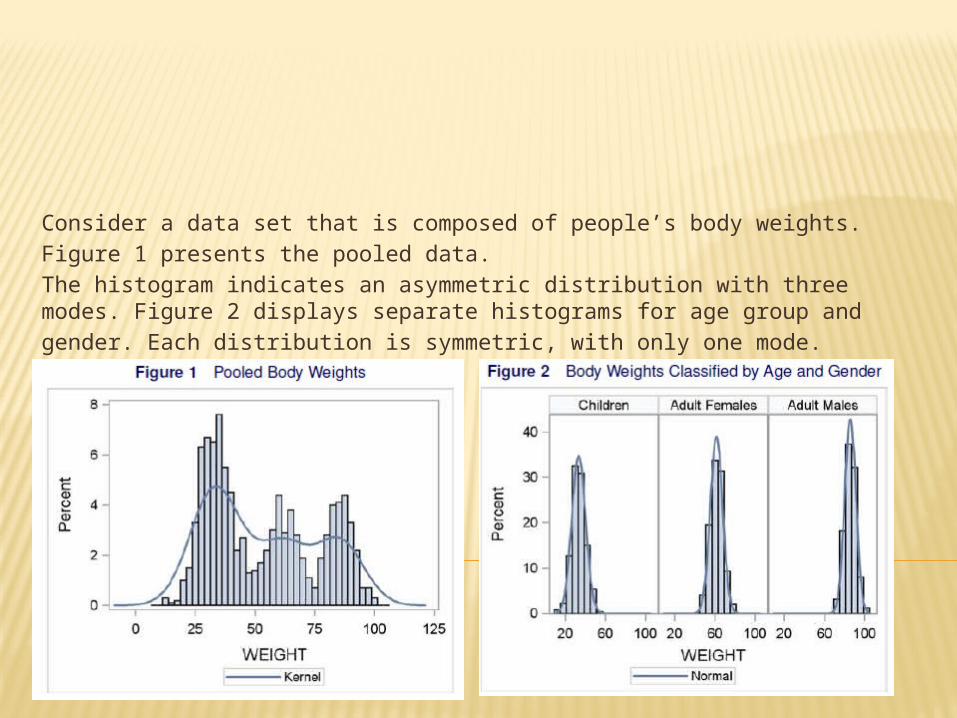
Consider a data set that is composed of people’s body weights.
Figure 1 presents the pooled data.
The histogram indicates an asymmetric distribution with three modes. Figure 2 displays separate histograms for age group and
gender. Each distribution is symmetric, with only one mode.
mixture modeling aims to identify a finite number of subpopulations, called latent classes, that are unknown a priori within the population under study. Individuals within a latent class share characteristics thus are more similar than those between latent classes. Mixture modeling can be readily applied to both cross-sectional and longitudinal studies.
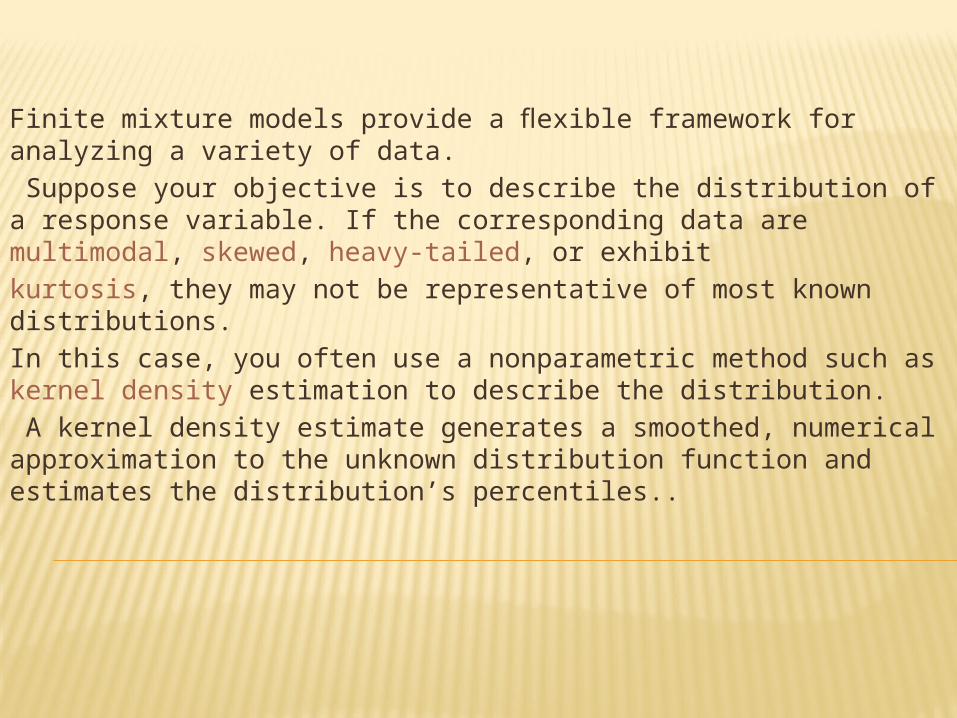
Finite mixture models provide a flexible framework for analyzing a variety of data.
Suppose your objective is to describe the distribution of a response variable. If the corresponding data are multimodal, skewed, heavy-tailed, or exhibit
kurtosis, they may not be representative of most known distributions.
In this case, you often use a nonparametric method such as kernel density estimation to describe the distribution.
A kernel density estimate generates a smoothed, numerical approximation to the unknown distribution function and estimates the distribution’s percentiles..
Although this approach is useful, it might not be the most concise way to describe an unknown distribution.
A finite mixture model provides a parametric alternative that describes the unknown distribution in terms of mixtures of known distributions.
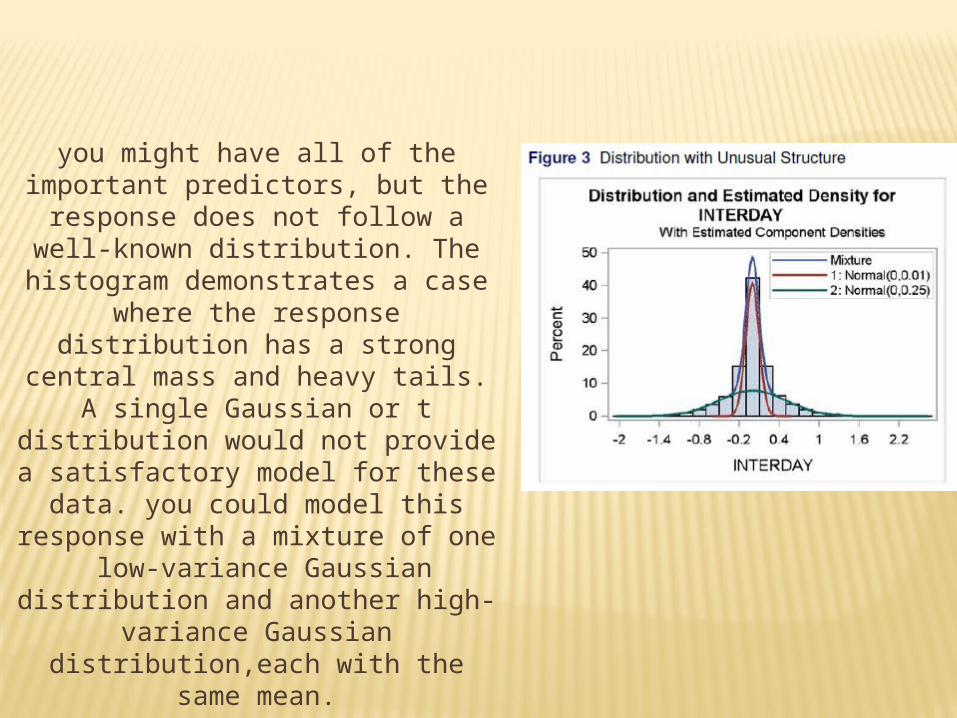
you might have all of the important predictors, but the response does not follow a well-known distribution. The
histogram demonstrates a case where the response distribution has a strong central mass and heavy tails. A single Gaussian or t distribution would not
provide a satisfactory model for these data. you could model this response with a mixture of one low-variance Gaussian distribution and another high-variance
Gaussian distribution,each with the same mean.
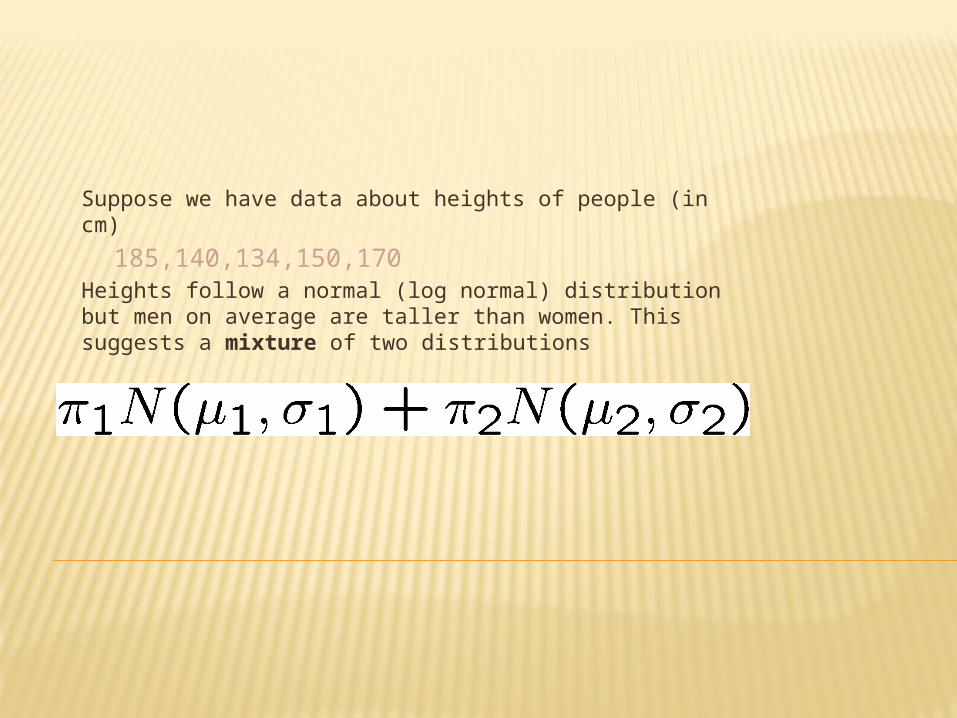
Suppose we have data about heights of people (in cm)
185,140,134,150,170Heights follow a normal (log normal) distribution but men on average are taller than women. This suggests a mixture of two distributions
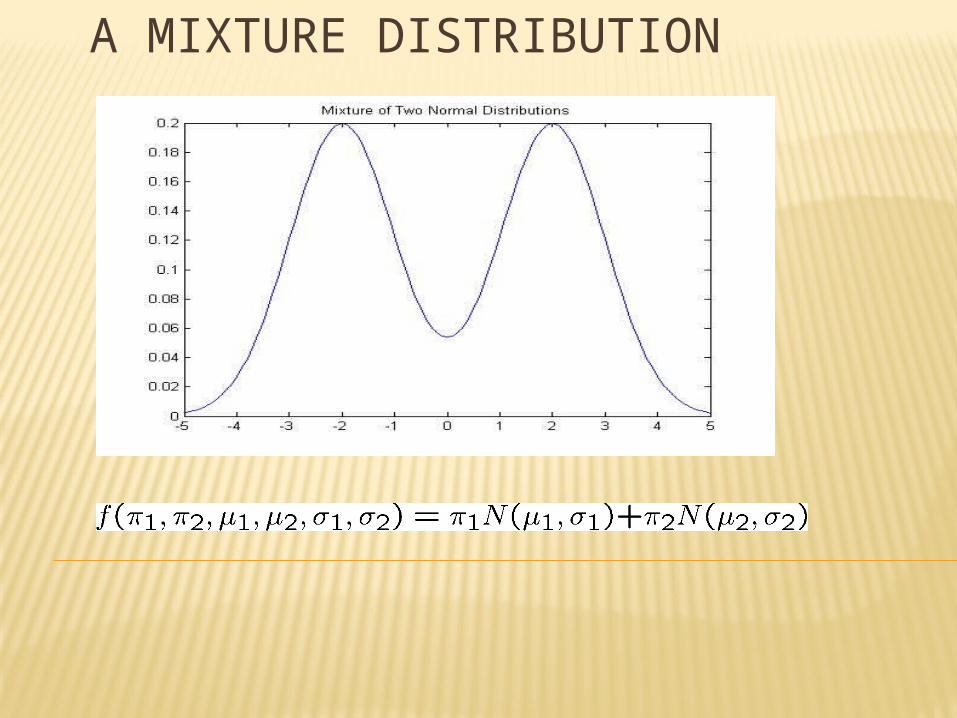
A MIXTURE DISTRIBUTION
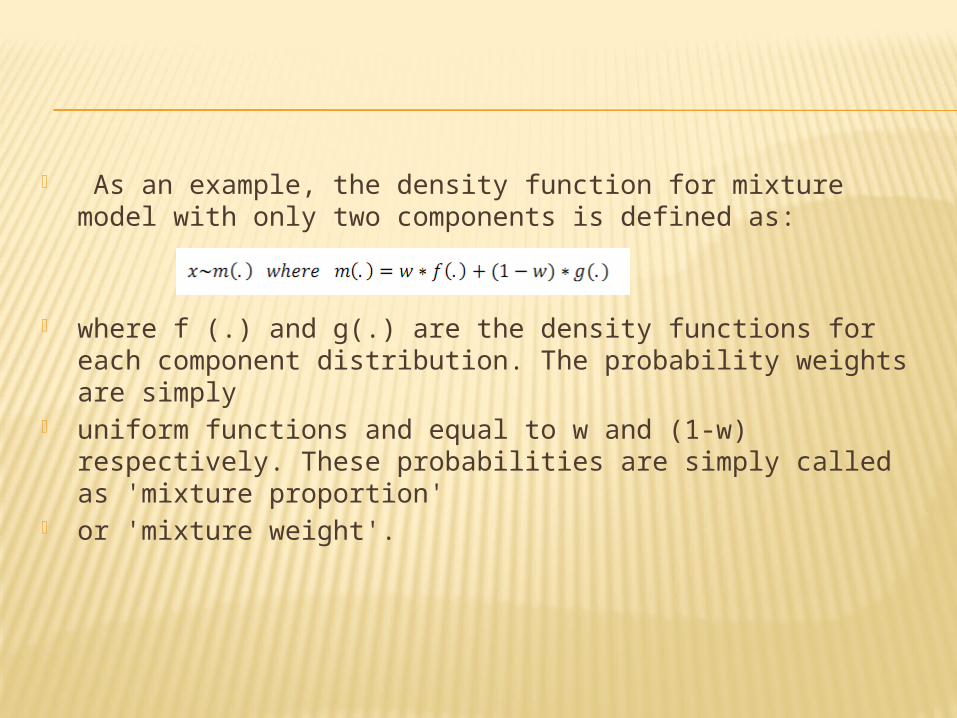
- As an example, the density function for mixture model with only two components is defined as:
- where f (.) and g(.) are the density functions for each component distribution. The probability weights are simply
- uniform functions and equal to w and (1-w) respectively. These probabilities are simply called as 'mixture proportion'
- or 'mixture weight'.
MIXTURE MODELS
- The mixture is considered semi-parametric since each component of the mixture is a parametric model but the distribution of mixing weights is model free.
- The component distributions can be from the same or different distributional families.
- If the component distributions are from the same family, the mixture is called homogeneous. In most applications, the components are assumed to take same form and homogeneous mixtures are more commonly used .
ESTIMATING PARAMETRIC MIXTURE MODELS
To estimate the model parameters in a mixture, a common approach is to apply the expectation maximization (EM) algorithm, which is an iterative method for numerically approximating the maximum likelihood (ML) estimates of the parameters in a mixture model. Alternatively, it can be viewed as an estimation problem involving incomplete data in which each unlabeled observation is regarded as missing a label of its origin .
ASSESSING THE NUMBER OF COMPONENTS IN MIXTURE MODELS
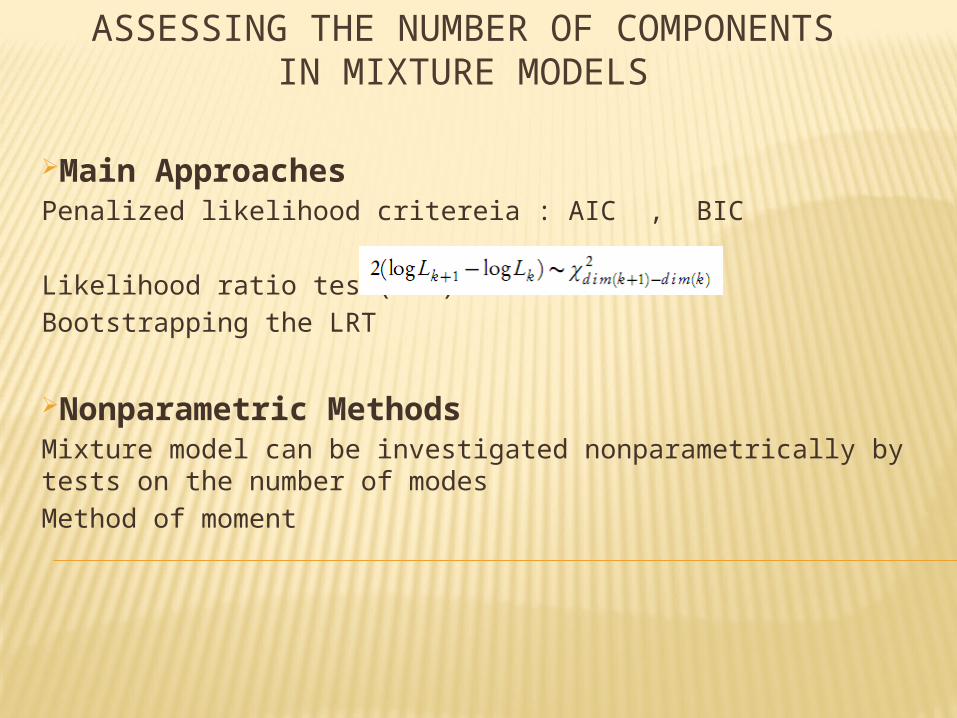
Main ApproachesPenalized likelihood critereia : AIC , BIC
Likelihood ratio test(LRT)
Bootstrapping the LRT
Nonparametric MethodsMixture model can be investigated nonparametrically by tests on the number of modes
Method of moment
NON-PARAMETRIC MIXTURE MODELING
We could replace theMstep of EM by some other way of estimating the distribution of each mixture component.
This could be a fast-but-crude estimate of parameters (say a method-of-moments estimator if that’s simpler than theMLE), or it could even
be a non-parametric density estimator.
- Mixture modeling can be distinguished from other analyses used to group individuals, such as cluster analysis, in that the classification of individuals into groups is done using a latent variable based on unobserved heterogeneity in the data (i.e., individual differences that are not directly measurable).
- Latent variables are those that are not observed directly but are inferred from measured or directly observed variables
In contrast to mixed effects models, where it is assumed that the distribution of the parameters over the observations is known, finite mixture models do not require to specify this distribution a-priori but allow to approximate it in a data-driven way.
estimating multi-modal or heavy-tailed densities
fitting zero-inflated or hurdle models to count data with excess zeros
modeling overdispersed data
fitting regression models with complex error distributions
classifying observations based on predicted component probabilities
accounting for unobservable, omitted variables
estimating switching regressions
FINITE MIXTURE MODELS ARE USEFUL FOR THE FOLLOWING APPLICATIONS
Mixture modeling can also be extended to longitudinal data analysis, in which classes of participants are created based on their trajectories of
responses over time.
Standard growth curve modeling analysis estimates a common trajectory applied to all individuals (although there may be variability in the
trajectory).
Mixture modeling is useful in situations where the trajectory patterns are not the same for every individual and may be used to capture both
normative and non-normative growth patterns .For example, some individuals may demonstrate increased behavior over time, whereas
others show decreased behavior; others may not change at all.
GROWTH CURVE MIXTURE MODELS (GCMMS)
Growth curve mixture models (GCMMs) are a type of latent variable model that extend the latent class model to the longitudinal setting where subjects are grouped based on the observed longitudinal trend over time.
Growth curve mixture modeling can be a useful analysis tool when it is desirable to identify subgroups of patients who differ with respect to the trajectory of a longitudinal measurement.
GCMMs extend commonly used mixed effects methods to allow for multiple classes, each with its own mixed effects model.
These models are useful in observational and experimental studies,
and they provide a method for identifying subgroups of patients who respond differently to interventions in randomized trials.
Mixture modeling of longitudinal data may be done using
latent class growth analysis (LCGA) or
growth mixture modeling (GMM)
In both cases, heterogeneity in the trajectory of an outcome over time is captured using a latent variable; the distinction is that no variation across individuals is allowed within classes in LCGA, whereas GMM allows within-class variation across individuals.
Latent transition analysis (LTA) represents another mixture modeling technique for analyzing longitudinal data, whereby latent class indicators are measured over time, but individuals may transition from one latent class to another across time points.

کاربردی مثال