role of banks in housing finance - iefpedia.com · role of banks in housing finance ... in the...
TRANSCRIPT

ROLE OF BANKS IN HOUSING FINANCE Housing Finance is considered as a safest mode of investment for financial institutions. This avenue of investment provides greater flexibility in making financial agreements and contracts, easily adjustable with the Islamic principles, widely applicable in pure capitalistic societies; meet the requirements of strictly controlled economies, and also feasible for the non-traditional immigrants-based societies. In highly industrialized economies, the workers’ immigration form one city (or country) to another city (or country) is a common phenomenon. In those societies, people prefer to lease a house instead by its acquisition on ownership basis. In pure capitalistic societies, housing finance is used as a mode of long-term investment. In centrally controlled and planned economies, the housing finance is used for planning and development purposes. In the interest-free Islamic economies the housing finance gives an opportunity to the investors and financial institutions to participate in the rental income and capital gains from the properties. It is noteworthy that housing finance is not simply a matter of funds transfer form lender to borrower; it has multi dimensional aspects. There are several related parties including investors, tenants, town planners and development authorities, local statesmen and politicians, construction and related industries, providers of utility and civic cervices, local administration and many other relevant parties. No doubt, it has financial importance and the housing finance institutions test the profitability and feasibility of every agreement for housing finance. Housing has also some socio-economic aspects. Those aspects have great importance in the context of Pakistan, USA, Canada and Israel. The importance of housing finance in Canada and USA is because of the heavy inflow of immigrants. Pakistan and Israel are considered as ideological states and the housing requirements in those countries are directly concerned with the structural changes in the historical population in their geographical locations. The structure and size of population and housing requirements in those countries were affected when they came into existence. Those structural changes belong to the heavy inflow of migrants from the other parts of the world. Because of this obvious reason, the governments in those countries have been involving in the planning and development of housing finance strategies. In Pakistan this issue was initially tackled with the formation of the House Building Finance Corporation (HBFC) through Housing Finance Act 1952.

Housing Finance Companies: Some Experiences Before the emergence of new housing companies, HBFC has been enjoying monopoly power in housing finance in Pakistan, as commercial banks were not allowed to enter the activities. Since its inception in 1952, to November 2002 (50 years) the HBFC has provided finance of over Rs.29 billion for the construction and purchase of over 400,000 housing units. At the end of 1990s, it was observed that Housing Finance Companies (HFCs) in Pakistan were on losing front, as their share in total assets of Non-Banking Financial Institutions (NBFIs) had declined from 12 percent in 1989-90 to 6 percent in 199-2000. Although, total assets of HFCs increased from Rs.16 billion to 22 billion, the growth was lower as compared to other NBFIs. Asset shares of these companies indicate that new entrant remained unable to provide any major change in housing finance. Growth rates in capital remained higher than the growth rate of assets. (SBP: 2003) Non-performing loans to total assets ratio showed a significant increase in 1990s. The earning assets to total assets ratio has also declined from 91 percent in 1989-90 to 78 percent in 1999-2000. Continuously increasing non-performing loans to gross advances ratio indicates the squeezed earning base of HFCs. The composition of earning assets has drastically increased, as the shares of investment in total earning assets has increased from 3 percent in 1989-90 to 34 percent in 1999-2000. This also implies that HFCs were not extending loans to housing. An interesting indicator is borrowing to advances ratio, which consistently remained over the mark of hundred percent. According to the Stat Bank of Pakistan, the HFCs are borrowing not only to finance their loans and advances but also to make other assets. It means that the HFCs do not have their own resource base to finance higher demand of housing sector. Borrowing to liability ratio of over 90 percent also strengthens this point. (Appendix I to VI). The entire above-mentioned scenario justifies the entry of commercial banks in housing finance. In order to allow banks to have an active role in lending for mortgage purposes as envisaged in the National Housing Policy approved by the Federal Government, it was decided to activate a Housing Refinance Window at the Stat Bank of Pakistan, which would be operative through Housing Finance Corporations (HFCs) registered and functional in the private and public sectors. According to the guidelines issued by the State Bank of Pakistan banks are free to extend mortgage loans for construction of houses, up to a maximum period of fifteen years. The commercial banks would ensure matching of asset and liability. For this purpose, the commercial banks are encouraged to float long-term housing bonds not less than 10 years maturity. While extending financing facilities their customers, the banks would ensure that the installment of the loan extended by them is
commensurate with the cash flow and payment capacity of the borrower. This measure would be in addition to banks’ usual evaluation of each proposal concerning credit worthiness of the borrowers as also the fact that the banks’ portfolio under housing finance fulfill the prudential norms and instructions issued by the State Bank and do not impair the soundness and safety of the bank itself. According to the new policy, banks are encouraged to develop floating rate products for extending housing loans, thereby managing interest rate risk to avoid its adverse effects. Commercial banks shall ensure that at no time their total exposure under house financing exceeds 5 percent oaf their net advances. The housing finance facility would attract a minimum debt equity ratio of 70:30. However, the profitability from investment in housing sector is a nexus of the rate of growth in the properties’ values, returns on bank deposits, demand for housing for residential purposes, increase in the households incomes, magnitude of investment in housing sector, rental income from properties and many other financial, social and economic variables. Any change in social, political or economic front can disturb the flow of payments in this long-term mode of financing. The present structure of interest rates and rental incomes are not the only decisions factors, expected changes in the stream of rental incomes and interest rates in future are important relevant factors. A mismatch of rental incomes and interest rates can disturb the socio-political and economic structure of the society. The State Bank should draw upon the US experience where lenders exploited the applicants. Borrowers are trapped in debt because of the complicated structure of lending rates and expensive fees. Despite a strong economy and falling interest rates during 1990s, the rate for homes foreclosure rose fourfold. Now, the parliamentarians in the United States are looking to provide legal remedy to curb such predatory lending. Four Dimensions of the Role of Banks in Housing Finance: 1) Bridging the Gap of Demand and Supply: The house building and real estate sector is an area, which has tremendous scope for generating economic activity, as according to an estimate over 120 allied industries are directly or indirectly affiliated to the sector; the main ones being cement, stone crushing, bags, printing, trucking, wooding, doors and windows making, shuttering, glass, ceramics, pipe, paints and so on. It will provide employment for million of the peoples. The share of housing sector in investment has increased from 4 percent to 6 percent in the decade ending 2000. However, the magnitude of housing finance at present is hardly Rs.3 to 4 billion per annum, which is less than 0.5 percent of the GDP. In the industrialized countries the housing and

construction sectors contribute more than 30 percent share in the GDP. In Malaysia and Thailand, about 60 percent of housing finance is provided by commercial banks and the rest by the specialized financial institutions. According to a report prepared for the World Bank in 2001, total current housing stock in Pakistan is valued at Rs.1,700 billion and comprised 21 million units. The acquisition of a house requires a large outlay of money, which is out of the reach of a common people in Pakistan. It is estimated that more than 800,000 of urban houses are rented and fetched a rental of Rs.15 billion per annum (Rizvi: 2003) The federal ministry of finance has estimated an annual demand of Rs.68 billion credits from construction industry. While, the annual demand for new housing units is estimated at over 700,000. However, due to financial constraints the annual construction of maximum number of housing units never exceeded 400,0000. As a result of this carried out backlog now, the country needs at least 6 million new houses to meet the shortfall. The House Building Finance Corporation (HBFC) could disburse loans of one billion rupees last year. The historical evidences show that HBFC is not in a position to fulfill the entire requirements of housing finance. Housing loans, mainly through the HBFC rarely exceeded 1.5 percent of the total investments in a single year. Two housing finance companies have closed down and the alone survivor is to be merged with a commercial bank. The housing finance is a retail business for foreign banks. Only the top corporate executives and upper incomes groups are served for this purpose. Moreover, the criteria, ceilings and other limitations to approve a loan application reflect the justification of housing finance through regular banking channels. 2) Utilization of Surplus Funds available with the Banks: In last three years, the banks underwent great changes. For long, banks and particularly the nationalized commercial banks and the financial institutions have been focusing entirely on project financing or working capital (including trade financing). Those traditional modes of financing gave a huge portfolio of bad loans. In the present situation, the commercial banks have excess liquidity and looking for the borrowers, and there is a general trend of gradual decline in the lending rats in the country. The lower lending rates, large liquidity with the banking system, growing competition among the banks and lower return on government securities were pushing the financial institutions towards new avenues such as consumer financing, personal loans, lending for SMEs, agriculture financing and targeting new customers. With lowering the interest rates and excess liquidity the banks now look housing finance as an avenue for profitable utilization of their money.
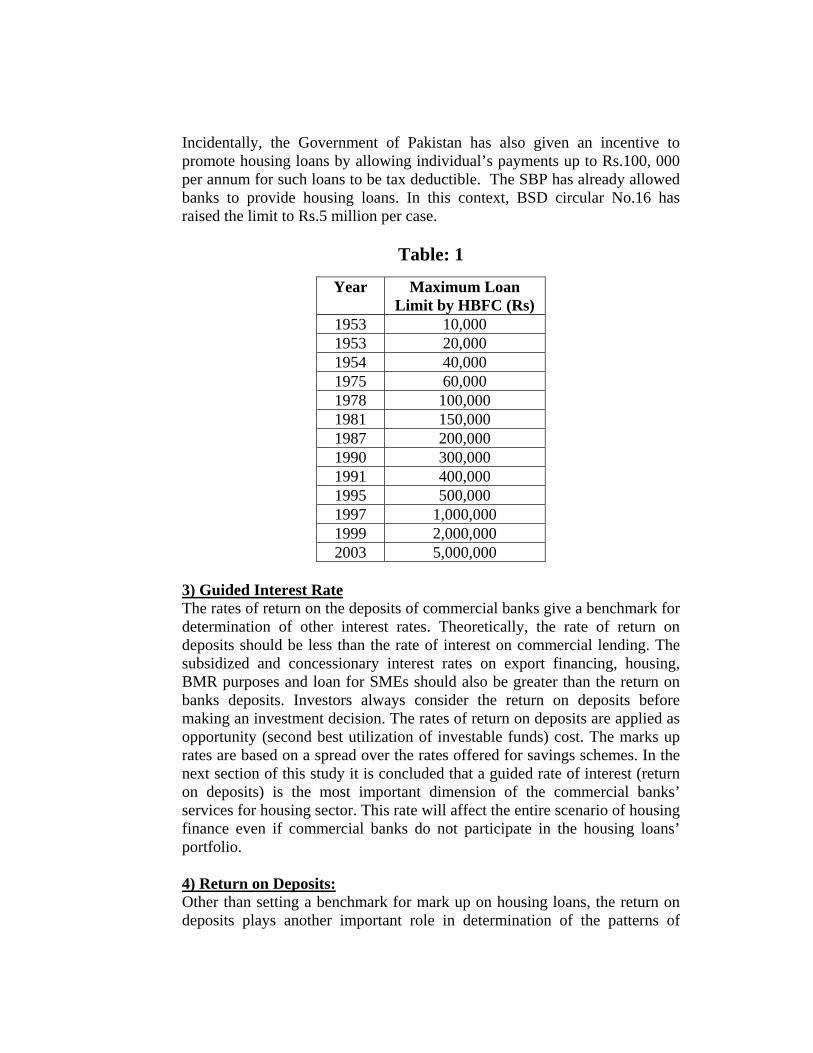
Incidentally, the Government of Pakistan has also given an incentive to promote housing loans by allowing individual’s payments up to Rs.100, 000 per annum for such loans to be tax deductible. The SBP has already allowed banks to provide housing loans. In this context, BSD circular No.16 has raised the limit to Rs.5 million per case.
Table: 1
Year Maximum Loan Limit by HBFC (Rs)
1953 10,000 1953 20,000 1954 40,000 1975 60,000 1978 100,000 1981 150,000 1987 200,000 1990 300,000 1991 400,000 1995 500,000 1997 1,000,000 1999 2,000,000 2003 5,000,000
3) Guided Interest Rate The rates of return on the deposits of commercial banks give a benchmark for determination of other interest rates. Theoretically, the rate of return on deposits should be less than the rate of interest on commercial lending. The subsidized and concessionary interest rates on export financing, housing, BMR purposes and loan for SMEs should also be greater than the return on banks deposits. Investors always consider the return on deposits before making an investment decision. The rates of return on deposits are applied as opportunity (second best utilization of investable funds) cost. The marks up rates are based on a spread over the rates offered for savings schemes. In the next section of this study it is concluded that a guided rate of interest (return on deposits) is the most important dimension of the commercial banks’ services for housing sector. This rate will affect the entire scenario of housing finance even if commercial banks do not participate in the housing loans’ portfolio. 4) Return on Deposits: Other than setting a benchmark for mark up on housing loans, the return on deposits plays another important role in determination of the patterns of
investment in housing sector. It is observed that rate of return on deposits has a U-shaped relation with the utilization of housing loans and the private investment in construction sector. This dimension of the banking functions will be discussed with details in next sections. Econometric Modeling for the Strategy of Housing Finance: It is assumed in this study that ownership of dwellings is an indicator of the demand for housing in monetary terms. For simplification purpose, we divided the sources of housing demand into two components namely,
1) Residential Demand 2) Speculative Demand
It is obvious that residential demand is directly related with the population (POP). So far as speculative demand is concerned it depends on the profitability in housing industry. An investor in housing sector will acquire a house only if return on property is greater than the return from other sources. To test this hypothesis we included population (POP) and the ratio of return on properties to average return on banks’ deposits (CGDEP). Many research studies on the supply of housing units consistently underline the role - at the macroeconomic level - of liquidity constraints. W hypothesized that housing loan facility (UTFND) is a catalysts for private investment in construction sector. In this study, we assumed that private investment in construction industry as a proxy of the monetary value of the supply of new housing units. To incorporate the effects of housing loan facility (UTFND) we incorporated this variable in the model. Rental income form housing properties (RENT) is a major cause of the induced investment in housing sector. In the estimation of private investment in construction industry, we applied rental income from residential houses (RENT) as an explanatory variable. The rental income is captured through a country-based index of housing rents. It can be concluded that any thing that can change the magnitude of utilization of housing loans (UTFND) will also change the overall investment in the construction industry. Rental income form housing units (RENT) always plays an important role in the determination of investment patterns in the construction industry. It is a factor of induced investment in the construction industry and it also plays an important role in the determination of the utilization of housing loan facility. Rental income (RENT) is considered as an element of the value of property. It is usual postulate in accounting and taxation practices that value of properties are assessed on the basis of 20 years rental income from the property. So, we can use the change in rental income as a reflector of the change in property value. We considered the change in property value as capital gain or return
from properties. The capital gain from properties in comparison of return from bank deposits (CGDEP) is an important determinant for the ownership of dwellings and the utilization of housing loan facility. However, it has not linear relation with the utilization of housing loans facility. Return of Bank Deposits (RTDEP) is also included as a factor of the utilization of funds for housing. We have tested and found that Gross National Product (GNP), interest on housing loans (INTHS) and the cost of construction (BLDG) are insignificant variables for the investment in construction and ownership of dwellings. Data and Estimations: To test the hypotheses we developed an econometric model. The simultaneity in the model has been shown in figure: I. The list of variables has been presented in figure: II. The complete model has been shown by figure: III. We adopted a time series approach in the analysis and the annual data is used. The data have been extracted from a variety of sources, covers the period of 1991-2000. The data on the majority of variables was extracted from the annual Report of the State Bank of Pakistan (SBP: 2003) and Pakistan Economic Survey (Government of Pakistan: 2001). We simulated the data to measure the prediction power of the model. Ex-anti simulations have also been made for the fiscal years from 2000-01 to 2004-05. To estimate the utilization of housing loan facility a non-linear model was estimated. After a trial and error approach and several testing applications, we concluded that return on deposits and the ratio of capital gain from housing properties to return on deposits have non-linear (quadratic) relations with the housing funds utilization. So, the estimated results show a non-linear equation for this variable. The statistical results and simulation analysis are presented in table: 6 and table: 7 respectively. The results and conclusions mentioned in the next section are based on the assumption of normal economic conditions in the financial markets. Any big political or socio-economic change can disturb the parametric approach and model will not be useful in those abnormal conditions. Results and Conclusions: It was concluded that rental income from housing properties and housing loan facility are two important determinants of the private investment in construction. With some qualifications, the results indicate that housing policy affect the investment in construction sector. Results reveal some interesting and important findings. It was observed that increase in population by one million would generate the demand for Rs.1.4 billion for ownership of dwellings. Another important finding is that an increase in the ratio of Rental

Income from Housing Property to Return on Banks’ Deposits (CGDP) by one point will generate the demand for Rs.2 billion for ownership of dwellings. Private Investment in construction will increase by Rs.530 million by an upward change of 10 percent in the housing rents. If utilization of housing loans increases by Rs.1 million, the private investment in construction will increase by Rs.1 billion. The simulation analysis provides some interesting results. The return on banks deposits is classified as a key policy variable for investment in housing. It is the important finding of this study that ‘Return on Bank Deposits’ play the most important role in determination of the patterns of housing industry in Pakistan. However, the returns on bank deposits have a non-linear (quadratic) relation with the investment in housing and the utilization of housing loans. The results show that utilization of housing loan facility and the investment in construction will be lower at moderate (6 to 8 percent) rate of interest on bank deposits. The investment in housing and the utilization of housing loan will be higher at the extreme levels of the rate of interest on bank deposits. Investment in housing sector in Pakistan would increase if banks reduce return on deposits from 7 percent to 5 percent. It is quite consist with the common phenomena. At the lower interest rates people will not deposit their savings into commercial banks; they will prefer to invest this money in real estates and other profitable projects. So, investment in housing sector will increase. It is surprising that at an extreme higher return from banks’ deposits will boost the investment in construction and the utilization of housing loans. Perhaps, it is because of the utilization of income from banks’ deposits in other alternative projects to diversify the risk of fluctuations in returns. If rental income from housing properties increases the investment in construction and the utilization of housing loan facility will also increase. However, at a higher rate of return on bank deposits the increase in investment will be lower. If rental income from properties increase from 5 percent to 10 percent, the investment in housing construction will increase by 23 percent and utilization of housing loan facility will increase by 7 percent, at a level of 5 percent return on bank deposits. However, situation wills be different if commercial banks are offering a 10 percent return on deposits. In this situation, if rental income increases from 5 percent to 10 percent, the investment in construction will increase by 7 percent only and the utilization of housing loan facility will increase by 4 percent only. Return on bank deposits has a U-shaped relation with the utilization housing loans. At the initial stage of increase in the rate of return on banks deposits, the utilization of housing funds starts to increase, after a certain (optimal or

peak) level it start to decline. It means at both the extremes of interest rates (extremely low interest rates and extremely high interest rates), the public will utilize low financing for housing projects. However, at a moderate level (which may vary from economy to economy) people will demand more funds for housing finance. It is also envisaged that the ratio of capital gain on properties to return on banks deposits has an inverted U-shape relation with the utilization of funds from housing. It is implied that the Housing Finance companies and banking sector can find an equilibrium rate of return on deposits by simultaneous determination of the utilization of housing loans and supply of the funds. The results are also useful in determination of equilibrium ratio of the rental income to return on deposits. An optimal rate of return on bank deposits can be found in response of a return on housing property.
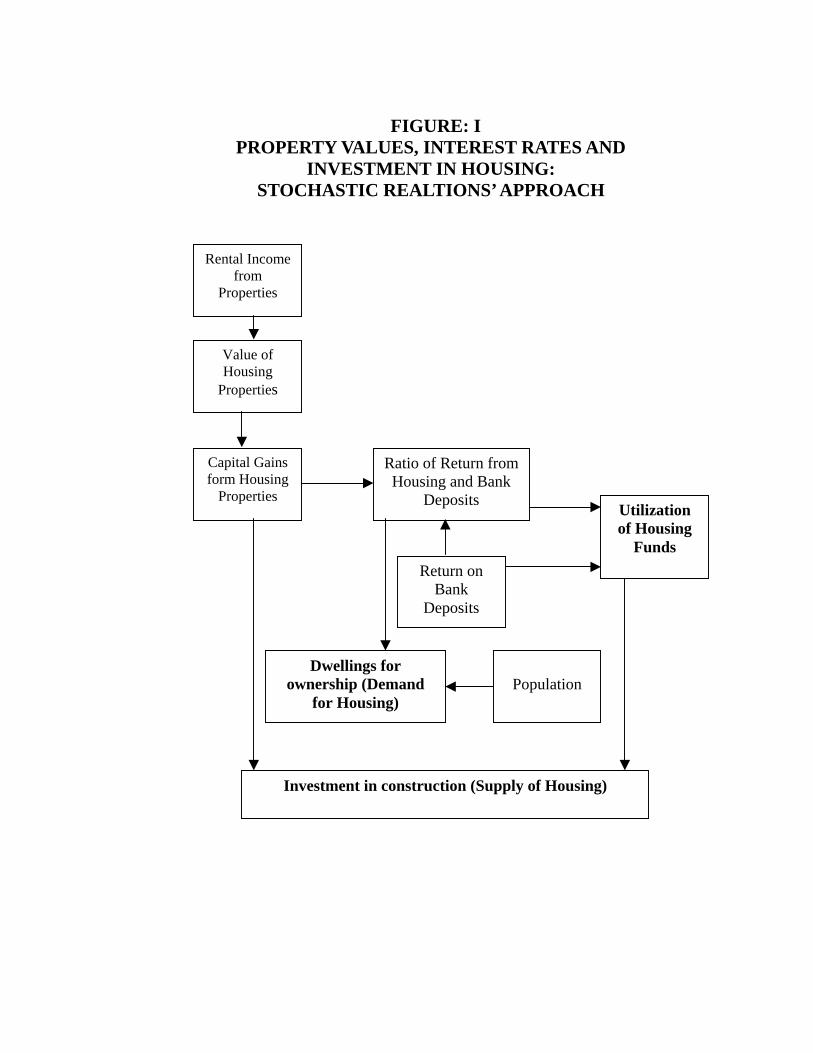
FIGURE: I PROPERTY VALUES, INTEREST RATES AND
INVESTMENT IN HOUSING: STOCHASTIC REALTIONS’ APPROACH
Rental Income from
Properties
Value of Housing
Properties
Capital Gains form Housing
Properties
Ratio of Return from Housing and Bank
Deposits
Population
Return on Bank
Deposits
Utilization of Housing
Funds
Dwellings for ownership (Demand
for Housing)
Investment in construction (Supply of Housing)
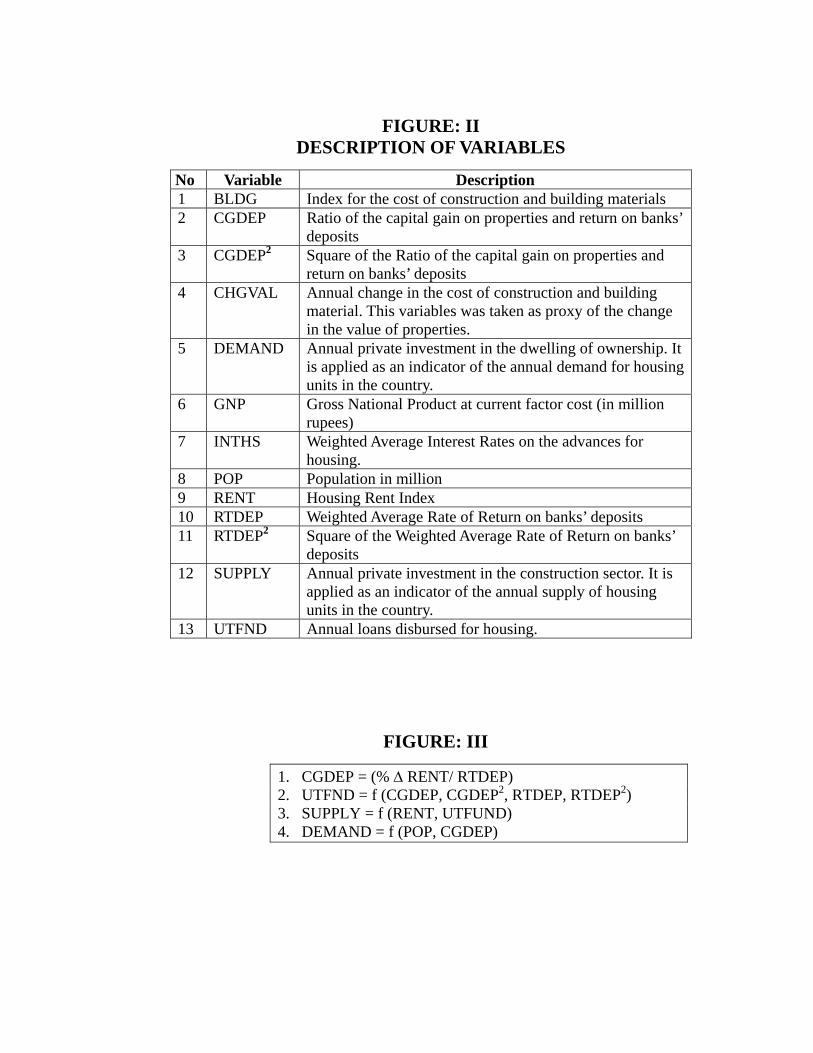
FIGURE: II DESCRIPTION OF VARIABLES
No Variable Description 1 BLDG Index for the cost of construction and building materials 2 CGDEP Ratio of the capital gain on properties and return on banks’
deposits 3 CGDEP2 Square of the Ratio of the capital gain on properties and
return on banks’ deposits 4 CHGVAL Annual change in the cost of construction and building
material. This variables was taken as proxy of the change in the value of properties.
5 DEMAND Annual private investment in the dwelling of ownership. It is applied as an indicator of the annual demand for housing units in the country.
6 GNP Gross National Product at current factor cost (in million rupees)
7 INTHS Weighted Average Interest Rates on the advances for housing.
8 POP Population in million 9 RENT Housing Rent Index 10 RTDEP Weighted Average Rate of Return on banks’ deposits 11 RTDEP2 Square of the Weighted Average Rate of Return on banks’
deposits 12 SUPPLY Annual private investment in the construction sector. It is
applied as an indicator of the annual supply of housing units in the country.
13 UTFND Annual loans disbursed for housing.
FIGURE: III
1. CGDEP = (% ∆ RENT/ RTDEP) 2. UTFND = f (CGDEP, CGDEP2, RTDEP, RTDEP2) 3. SUPPLY = f (RENT, UTFUND) 4. DEMAND = f (POP, CGDEP)

Table: 2 Socio Economic Indicators
Private Investment at current market Prices (Million Rupees)
Fiscal Year Construction
Ownership of Dwellings
Services: Real Estates Population
GNP at Current Factor (Million rupees)
1990-91 1,959 20,747 23 111 932,2821991-92 4,306 23,759 26 114 1,090,4801992-93 6,800 27,372 30 116 1,210,0891993-94 8,225 30,470 37 119 1,416,8461994-95 9,455 34,024 47 122 1,702,1691995-96 10,697 38,730 54 125 1,944,4241996-97 10,722 44,927 66 128 2,236,2991997-98 12,073 49,182 70 132 2,456,5201998-99 9,588 53,200 74 135 2,685,5311999-00 11,271 56,093 78 138 2,869,138
Table: 3 Changes in Property Value and Return on Deposits
Fiscal Year
Weighted AverageReturn
on Deposits
HousingRents’ Index
Cost of building and
Construction’s Index
1990-91 6.00 100 100 1991-92 6.15 111 105 1992-93 6.10 122 107 1993-94 6.00 134 123 1994-95 6.10 148 150 1995-96 6.60 162 161 1996-97 6.80 178 182 1997-98 6.81 195 182 1998-99 6.49 209 184 1999-00 5.47 218 179

Table: 4
Housing Finance: Cost of Funds
Fiscal Year
Total Assets
(Billion/Rs)
Earning Assets to
Total Assets
Interest Income to
Total Assets
Interest Income (Billion
Rs)
Interest Income to Total Income
Total Income (Billion
Rs)
Utilization of Funds (Billion
Rs)
Weighted Average
Interest on Advances for
Housings 1989-90 16.5 90.8 0.9 0.15 22.1 0.67 14.98 4.49 1990-91 16.7 91.8 0.6 0.10 20.7 0.48 15.33 3.16 1991-92 17.9 89.5 1.5 0.27 25.6 1.05 16.02 6.55 1992-93 18.6 89.7 2.0 0.37 28.6 1.30 16.68 7.80 1993-94 18.9 90.0 2.8 0.53 35.0 1.51 17.01 8.89 1994-95 19.4 88.4 3.6 0.70 41.5 1.68 17.15 9.81 1995-96 20.2 89.4 4.2 0.85 49.8 1.70 18.06 9.43 1996-97 20.4 89.8 4.8 0.98 52.6 1.86 18.32 10.16 1997-98 21.3 90.6 5.0 1.07 51.0 2.09 19.30 10.82 1998-99 21.5 70.1 5.1 1.10 67.4 1.63 15.07 10.79 1999-00 22.3 78.2 3.9 0.87 47.5 1.83 17.44 10.50
Table: 5 Return on Real Estates
Fiscal Year
% Change in
Housing Rent
Capital gain on Real Estates to
Interest on deposits Ratio
Cap gain on Real Estates to Interest on
Housing loans Ratio
1990-91 13.64 2.27 4.32 1991-92 11.00 1.79 1.68 1992-93 9.91 1.62 1.27 1993-94 9.84 1.64 1.11 1994-95 10.45 1.71 1.06 1995-96 9.46 1.43 1.00 1996-97 9.88 1.45 0.97 1997-98 9.55 1.40 0.88 1998-99 7.18 1.11 0.67 1999-00 4.31 0.79 0.41
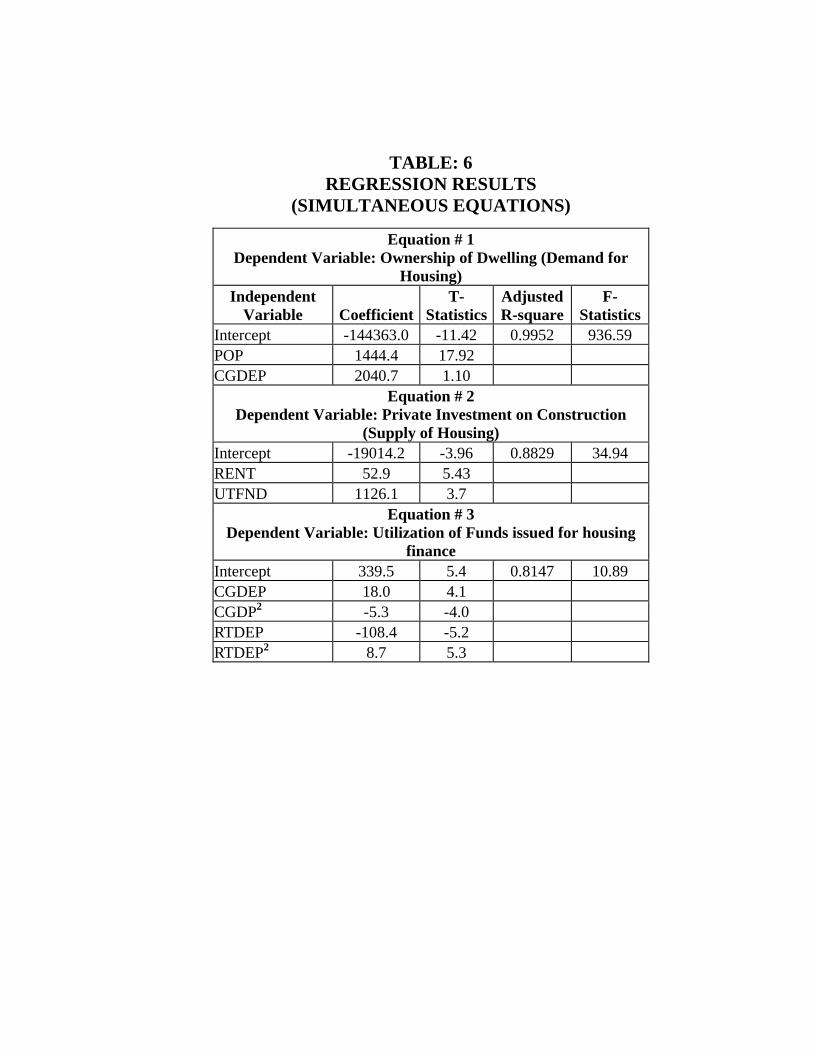
TABLE: 6 REGRESSION RESULTS
(SIMULTANEOUS EQUATIONS)
Equation # 1 Dependent Variable: Ownership of Dwelling (Demand for
Housing) Independent
Variable CoefficientT-
StatisticsAdjusted R-square
F-Statistics
Intercept -144363.0 -11.42 0.9952 936.59 POP 1444.4 17.92 CGDEP 2040.7 1.10
Equation # 2 Dependent Variable: Private Investment on Construction
(Supply of Housing) Intercept -19014.2 -3.96 0.8829 34.94 RENT 52.9 5.43 UTFND 1126.1 3.7
Equation # 3 Dependent Variable: Utilization of Funds issued for housing
finance Intercept 339.5 5.4 0.8147 10.89 CGDEP 18.0 4.1 CGDP2 -5.3 -4.0 RTDEP -108.4 -5.2 RTDEP2 8.7 5.3

TABLE: 7 Sensitivity Analysis
Fiscal Year
Ownership of Dwellings
(DEMAND) Population
(POP)
Capital Gain to Return
on Deposit
(CGDEP)
Private Investment in Construction
(SUPPLY)
Index of Housing
Rents (RENT)
Loans for Housing
(UTFUND)
Return on Bank
Deposits (%)
(RTDEP) 1990-91 20,747 111 2.00 1,959 100 15.33 6.00 1991-92 23,759 114 1.79 4,306 111 16.02 6.15 1992-93 27,372 116 1.62 6,800 122 16.68 6.10 1993-94 30,470 119 1.64 8,225 134 17.01 6.00 1994-95 34,024 122 1.71 9,455 148 17.15 6.10 1995-96 38,730 125 1.43 10,697 162 18.06 6.60 1996-97 44,927 128 1.45 10,722 178 18.32 6.80 1997-98 49,182 132 1.40 12,073 195 19.30 6.81 1998-99 53,200 135 1.11 9,588 209 15.07 6.49 1999-00 56,093 138 0.79 11,271 218 17.44 5.47 1990-91 20,047 111 2.00 4,924 100 16.56 6.00 1991-92 23,949 114 1.79 5,549 111 16.60 6.15 1992-93 26,503 116 1.62 6,285 122 16.74 6.10 1993-94 30,866 119 1.64 7,304 134 17.08 6.00 1994-95 35,349 122 1.71 7,679 148 16.75 6.10 1995-96 39,112 125 1.43 9,101 162 17.36 6.60 1996-97 43,484 128 1.45 11,797 178 19.00 6.80 1997-98 49,160 132 1.40 12,650 195 18.96 6.81 1998-99 52,889 135 1.11 9,294 209 15.32 6.49 1999-00 56,571 138 0.79 12,140 218 17.43 5.47 Projections: Population growth rate= 2.8 %; Increase in housing Rents= 10 %; Return
on Bank Deposits= 5 % 2000-01 62,586 142 1.00 23,995 229 27.44 5.00 2001-02 68,324 146 1.00 24,600 240 27.44 5.00 2002-03 74,222 150 1.00 25,236 252 27.44 5.00 2003-04 80,285 154 1.00 25,903 265 27.44 5.00 2004-05 86,518 158 1.00 26,604 278 27.44 5.00 Projections: Population growth rate= 2.8 %; Increase in housing Rents= 10 %; Return
on Bank Deposits= 7 % 2000-01 62,003 142 0.71 11,705 229 16.53 7.00 2001-02 67,740 146 0.71 12,310 240 16.53 7.00 2002-03 73,639 150 0.71 12,946 252 16.53 7.00 2003-04 79,702 154 0.71 13,613 265 16.53 7.00 2004-05 85,935 158 0.71 14,314 278 16.53 7.00

Projections: Population growth rate= 2.8 %; Increase in housing Rents= 10 %; Return on Bank Deposits= 10 %
2000-01 61,566 142 0.50 141,382 229 131.68 10.00 2001-02 67,303 146 0.50 141,988 240 131.68 10.00 2002-03 73,201 150 0.50 142,623 252 131.68 10.00 2003-04 79,264 154 0.50 143,291 265 131.68 10.00 2004-05 85,497 158 0.50 143,992 278 131.68 10.00 Projections: Population growth rate= 2.8 %; Increase in housing Rents= 5 %; Return on
Bank Deposits= 5 % 2000-01 64,627 142 2.00 26,812 240 29.43 5.00 2001-02 70,364 146 2.00 28,081 264 29.43 5.00 2002-03 76,262 150 2.00 29,476 290 29.43 5.00 2003-04 82,326 154 2.00 31,011 319 29.43 5.00 2004-05 88,559 158 2.00 32,700 351 29.43 5.00 Projections: Population growth rate= 2.8 %; Increase in housing Rents= 5 %; Return on
Bank Deposits= 7 % 2000-01 63,461 142 1.43 17,571 240 21.22 7.00 2001-02 69,198 146 1.43 18,839 264 21.22 7.00 2002-03 75,096 150 1.43 20,234 290 21.22 7.00 2003-04 81,159 154 1.43 21,769 319 21.22 7.00 2004-05 87,392 158 1.43 23,458 351 21.22 7.00 Projections: Population growth rate= 2.8 %; Increase in housing Rents= 5 %; Return on
Bank Deposits= 10 % 2000-01 62,586 142 1.00 147,598 240 136.69 10.00 2001-02 68,324 146 1.00 148,866 264 136.69 10.00 2002-03 74,222 150 1.00 150,262 290 136.69 10.00 2003-04 80,285 154 1.00 151,797 319 136.69 10.00 2004-05 86,518 158 1.00 153,485 351 136.69 10.00

FIGURE: IV
Impacts of the Change in Banks Rate of Return
0
20000
40000
60000
80000
100000
120000
140000
160000
1 2 3
Return on Deposits (%)
Mill
ion
Rup
ees
0
20
40
60
80
100
120
140(No change in House Rents)
Dwellings
Construction
Disbursements ofHousing Loans
FIGURE: V
Impacts of Change in Housing Rents
0
10000
20000
30000
40000
50000
60000
70000
80000
90000
100000
1 2Increase in House Rents
Mill
ion
Rup
ees
26
27
27
28
28
29
29
30
30
(No change in interest rates)
Dw ellings
Construction
Disbursements of HousingLoans

Table: 8 Impact of Chang in Return on Bank Deposits
% Change in: Increase in the Return on ‘Bank
Deposits’ Ownership of
Dwellings Private
Investment in Construction
Utilization of Housing Loans
From 5 % to 7 % 1 % (-46 %) (-40 %) From 7 % to 10 % 1 % 906 % 697 %
Table: 9 Impact of Chang in Housing Rents
% Change, if Rent increases from 5 % to 10 %: Rate of Return on Bank Deposits Ownership of
Dwellings Private
Investment in Construction
Utilization of Housing Loans
5 % 2.4 % 23 % 7 % 10 % 1.2 % 7 % 4 %
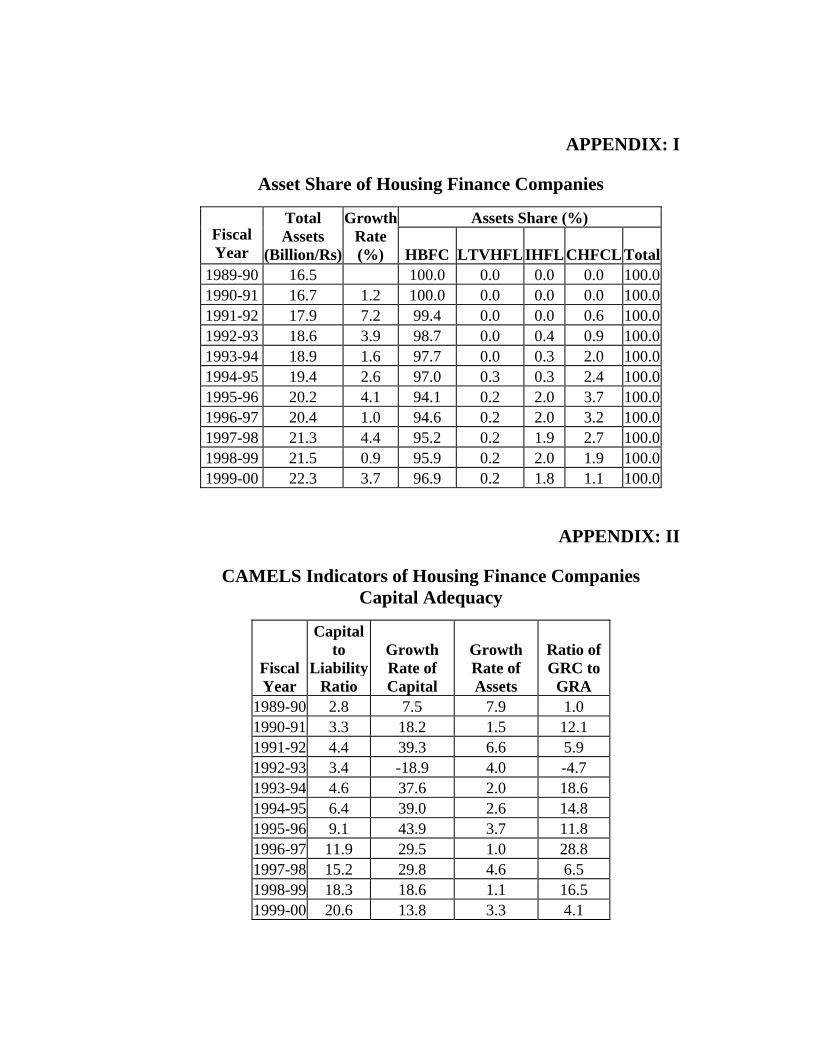
APPENDIX: I
Asset Share of Housing Finance Companies
Assets Share (%) Fiscal Year
Total Assets
(Billion/Rs)
GrowthRate (%) HBFC LTVHFL IHFLCHFCL Total
1989-90 16.5 100.0 0.0 0.0 0.0 100.01990-91 16.7 1.2 100.0 0.0 0.0 0.0 100.01991-92 17.9 7.2 99.4 0.0 0.0 0.6 100.01992-93 18.6 3.9 98.7 0.0 0.4 0.9 100.01993-94 18.9 1.6 97.7 0.0 0.3 2.0 100.01994-95 19.4 2.6 97.0 0.3 0.3 2.4 100.01995-96 20.2 4.1 94.1 0.2 2.0 3.7 100.01996-97 20.4 1.0 94.6 0.2 2.0 3.2 100.01997-98 21.3 4.4 95.2 0.2 1.9 2.7 100.01998-99 21.5 0.9 95.9 0.2 2.0 1.9 100.01999-00 22.3 3.7 96.9 0.2 1.8 1.1 100.0
APPENDIX: II
CAMELS Indicators of Housing Finance Companies Capital Adequacy
Fiscal Year
Capital to
Liability Ratio
Growth Rate of Capital
Growth Rate of Assets
Ratio of GRC to
GRA 1989-90 2.8 7.5 7.9 1.0 1990-91 3.3 18.2 1.5 12.1 1991-92 4.4 39.3 6.6 5.9 1992-93 3.4 -18.9 4.0 -4.7 1993-94 4.6 37.6 2.0 18.6 1994-95 6.4 39.0 2.6 14.8 1995-96 9.1 43.9 3.7 11.8 1996-97 11.9 29.5 1.0 28.8 1997-98 15.2 29.8 4.6 6.5 1998-99 18.3 18.6 1.1 16.5 1999-00 20.6 13.8 3.3 4.1

APPENDIX: III
Assets Quality
Fiscal Year
Earning Assts to Total
Assets
NPLs to Gross
Advances
NPLs to Total Assets
Advances to Earning Assets
Investment toEarning Assets
1989-90 90.8 4.3 3.8 97.0 3.0 1990-91 91.8 9.2 8.2 95.5 4.5 1991-92 89.5 13.2 11.1 90.7 9.3 1992-93 89.7 17.7 14.6 87.6 12.4 1993-94 90.0 22.6 18.1 84.0 16.0 1994-95 88.4 29.2 22.1 80.0 20.0 1995-96 89.4 35.8 26.4 75.5 24.5 1996-97 89.8 41.8 30.9 74.1 25.9 1997-98 90.6 50.4 35.8 69.3 30.7 1998-99 70.1 62.9 40.0 77.6 22.4 1999-00 78.2 69.3 41.7 65.5 34.5
APPENDIX: IV
Management Soundness
Fiscal Year
Total Expenses to
Total Income
Earning per
Employee
Operating Exp per
Employee
Total Expenses per
Employee 1989-90 41.3 0.4 0.2 0.2 1990-91 63.4 0.3 0.2 0.2 1991-92 19.7 0.7 0.1 0.1 1992-93 19.3 0.8 0.2 0.2 1993-94 21.4 1 0.2 0.2 1994-95 22.1 1 0.2 0.2 1995-96 27.9 1 0.2 0.3 1996-97 29.5 1.1 0.2 0.3 1997-98 30.3 1.3 0.3 0.4 1998-99 43.2 1.1 0.4 0.5 1999-00 31.8 1.3 0.4 0.4

APPENDIX: V
Earnings and Profitability
Fiscal Year
Return on Total Assets
Net InterestMargin
Interest Income
to Total Assets
Net Income
to Assets
Interest Expenses
to Earning Assets
Interest Income
to Total
Income
Interest Expenses to Total
Expenses
Provision for loanLosses to
Total Assets
1989-90 0.1 0.9 0.9 3.9 0.1 22.1 4.0 1.0 1990-91 0.3 0.6 0.6 2.7 0.0 20.7 2.3 4.8 1991-92 0.5 1.6 1.5 5.4 0.1 25.6 5.4 5.8 1992-93 0.9 2.2 2.0 6.5 0.1 28.6 5.1 6.4 1993-94 1.5 2.9 2.8 7.1 0.2 35.0 11.0 7.0 1994-95 1.8 3.7 3.6 7.8 0.3 41.5 15.9 7.6 1995-96 2.2 4.1 4.2 7.3 0.6 49.8 21.6 8.6 1996-97 2.5 4.4 4.8 7.8 0.9 52.6 29.7 9.7 1997-98 3.1 4.9 5.0 8.4 0.7 51.0 20.3 10.5 1998-99 2.5 6.5 5.1 6.4 0.8 67.4 16.7 11.6 1999-00 2.2 4.5 3.9 7.1 0.5 47.5 13.9 11.3
APPENDIX: VI
Liquidity and Sensitivity to Market Risk
Fiscal Year
Liquid Assets to Total Assets
Borrowing to
Advances
Borrowing to
Liabilities RSA to
RSL
Gap to Capital Ratio
Gap to Total Assets
1989-90 4.7 105.6 95.7 97.6 -80.5 -2.2 1990-91 2.9 106.6 96.6 98.2 -51.8 -1.7 1991-92 5.3 111.4 94.4 99.0 -22.2 -0.9 1992-93 5.1 113.1 91.9 100.9 25.0 0.8 1993-94 15.2 118.0 93.3 100.9 17.3 0.8 1994-95 23.4 123.5 92.8 101.0 14.0 0.8 1995-96 22.9 127.5 93.9 102.9 30.8 2.6 1996-97 24.6 127.2 94.8 105.3 42.5 4.5 1997-98 20.5 128.4 92.9 111.8 72.3 9.6 1998-99 29.0 144.0 92.7 88.3 -59.9 -9.3 1999-00 30.8 148.0 91.4 102.3 10.2 1.7

References
• Arshad Khan, Muhammad (2003): Role of Banks in Housing in Finance. Published in: Journal of The Institute of Bankers Pakistan 1 71 (2004): pp. 43-73.
• Buckley, Robert M. (1994); Housing Finance in Developing Countries: The Role of Credible Contracts; Economic Development and Cultural Change; Vol 42; No.3
• Government of Pakistan (Various Issues); Economic Survey; Islamabad: Ministry of Finance
• Li, Xiaowei (2001); Mortgage Market Development, Saving and Growth; IMF Working Paper; Washington: International Monetary Fund, Working paper 01-36
• Mehar, Ayub (1992); Income Elasticity of Demand for Social Services; Karachi: Applied Economics Research Centre, Discussion Paper
• Mehar, Ayub (1995); Socioeconomic Characteristics and Living Standards of Ethnic Groups in Karachi; Karachi Applied Economics Research Cntre; Discussion Paper
• Rizvi, Shamim Ahmed (2001); National Housing Policy 2001; Pakistan and Gulf Economist, Vol XX, No. 51 & 52
• State Bank of Pakistan (2002); Performance of the Financial Sector; Karachi SBP
• State Bank of Pakistan (2003); Annual Report”, Karachi, SBP