role of grassy strips on the biodiversity and movement of ... · institute for ecosystem research...
TRANSCRIPT
Institute for Ecosystem Research
of the Christian Albrechts-Universität Kiel
Role of grassy strips on the biodiversity and movement of
ground beetles (Carabidae: Coleoptera) in organic arable
ecosystems
Dissertation
submitted for the Doctoral Degree
awarded by Faculty of Agriculture and Nutrional Sciences
of the
Christian-Albrechts-Universität Kiel
submitted
M.Sc. Mazhar Hussain Ranjha
Kiel
Printed with the approval oft he Faculty for Agriculture and Nutritional Sciences
Dean: Prof. Dr. Dr. h.c. Rainer Horn
1. Examiner: Prof. Dr. Ulrich Irmler
2. Examiner: PD. Dr. Heinrich Reck
Day of Oral Examination: 11 July, 2013

i
Contents
Abstract ...................................................................................................... 1
Zusammenfassung .................................................................................... 3
Chapter 1: Introduction ........................................................................... 6
1.1 Motivation of studies ............................................................................................ 6
1.1.1 Agricultural intensification and food security for future .......................................... 6
1.1.2 Restoration of natural habitats in agroecosystems ................................................... 8
1.2 The model organism ........................................................................................... 10
1.3 Hypotheses and aims .......................................................................................... 12
1.3.1 Beneficial carabid species in organic farming systems .......................................... 12
1.3.2 Importance of age of the grassy strips in organic agriculture ................................. 13
1.3.3 Movement of carabids between natural habitats and crop areas ............................ 14
Chapter 2: Methodology ....................................................................... 15
2.1 Description of Experimental area and fields ...................................................... 15
2.1.1 Experimental site .................................................................................................... 15
2.1.2 Description of the fields ......................................................................................... 16
2.1.3 Terminology for natural habitats and arable crops areas ........................................ 16
2.1.4 Plant composition of grassy strips .......................................................................... 17
2.2 Layout of the pitfall traps and mark-recapture method ...................................... 17
2.3 Analysis of the data ............................................................................................ 20
2.4 Brief introduction to thesis chapters................................................................... 22
Chapter 3: Results .................................................................................. 23
3.1 Which carabid species benefit from grassy strips in organic agriculture? ......... 23
Abstract .................................................................................................................... 23
3.1.1 Introduction ..................................................................................................... 24
3.1.2 Sites and methods ............................................................................................ 25
3.1.2 Results ............................................................................................................. 26
3.1.2.1 Species composition ............................................................................................ 26
3.1.2.2 Distances covered from field margins into arable fields and grassy strips .......... 27
3.1.2.3 Effect of strips on endangered and differently sized species ............................... 28
3.1.3 Discussion ....................................................................................................... 28
3.1.4 Acknowledgement ........................................................................................... 30
ii
3.1.5 References ....................................................................................................... 30
3.2 Age of grassy strips influences biodiversity of ground beetles in organic agro-
ecosystems ................................................................................................................ 41
Abstract .................................................................................................................... 41
3.2.1 Introduction ..................................................................................................... 42
3.2.2 Material and Methods...................................................................................... 43
3.2.2.1 Experimental area and sampling design .............................................................. 43
3.2.2.2 Data Analysis....................................................................................................... 44
3.2.3 Results ............................................................................................................. 45
3.2.3.1 Faunal composition and assemblages .................................................................. 45
3.2.3.2 Effect of distance and age of grassy strips on adjacent fields ............................. 48
3.2.4 Discussion ....................................................................................................... 52
3.2.5 Acknowledgement ........................................................................................... 54
3.2.6 References ....................................................................................................... 54
3.3 Movement of carabids from grassy strips to crop land in organic agriculture ... 59
Abstract .................................................................................................................... 59
3.3.1 Introduction ..................................................................................................... 61
3.3.2 Material and Methods...................................................................................... 62
3.3.2.1 Study area, and period of experiment .................................................................. 62
3.3.2.2 Sampling of carabids ........................................................................................... 62
3.3.2.3Experimental layout .............................................................................................. 63
3.3.2.4 Marking of carabids ............................................................................................. 64
3.3.2.5 Experimental species ........................................................................................... 64
3.2.2.6 Analysis of data ................................................................................................... 65
3.3.3 Results ............................................................................................................. 66
3.3.3.1 Marked and recaptured specimens ...................................................................... 66
3.3.3.2Comparison for distance and speed in habitats..................................................... 66
3.3.3.3 Direction of dispersal .......................................................................................... 72
3.3.4 Discussion ....................................................................................................... 74
3.3.5 Acknowledgements ......................................................................................... 77
3.3.6 References ....................................................................................................... 77
Chapter 4: General Conclusions ................................................................... 81
References for Chapter 1, 2 and 4 ................................................................. 85
Résumé ....................................................................................................... 97
iii
List of Figures
Chapter 2
Fig. 2.1: Map of the investigated strips (black lines) in Schleswig-Holstein, northern
Germany; p2 and p4 represent 2- and 4-year-old strip fields; R9 is for 9-year-old strip field;
Cont (control field); F-2 (field used for mark recapture in 2011). ....................................... 15
Fig. 2.2: Experiment layout in Ritzerau fields (field-1 and field-3; left) and Panten (field-2;
right); filled circles in Panten field were close to the grassy strip (1.5m distance); traps in
rows were at ~ 5m distance; point of release at S (“source”) .............................................. 19
Chapter 3
Fig. 3.1.1: Map of the investigated strips (black lines) in Schleswig-Holstein, northern
Germany ....................................................................................................................... 38
Fig. 3.1.2: Dominance pattern of Poecilus cupreus (A), Poecilus versicolor (B), Carabus
nemoralis (C), Pterostichus melanarius (D), Anchomenus dorsalis (E), and Nebria brevicollis
(F) in the crop area ( ) and adjacent grassy strips ( ) ........................................ 39
Fig. 3.1.3: Dominance pattern of Amara similata (A), Carabus coriaceous (B), Harpalus
affinis (C), Pterostichus strenuus (D) in the crop area ( ) and adjacent grassy strip ( )
...................................................................................................................................... 40
Fig. 3.1.4: Mean number of differently-sized species in the three habitats with standard error.
Different exponents indicate significant difference according to nested ANOVA ................ 40
Fig. 3.2.1: The first two axes of the Detrended Correspondence Analysis show four habitats
(control, grassy strips, cropping areas, and field edges). Suffix 2, 4 and 9 with strip, field edge
and crop refers to the habitats related to the 2-, 4-, and 9-year-old grassy strips ................... 47
Fig. 3.2.2: Number of species needed for 90 % of total specimens in strips in relation to strip
age and distance from the field edge ................................................................................ 50
Fig. 3.2.3: Number of species that account for at least 90 % dominance (A) and species
richness of sample rarefaction on crop areas near grassy strips of different ages (B) ............ 50
Fig. 3.3.1: Experiment layout in Ritzerau fields (field-1 and field-3; left) and Panten (field-2;
right); filled circles in Panten field were close to the grassy strip (1.5m distance); traps in
rows were at ~ 5m distance; point of release at S (“source”) ............................................. 63
iv
Fig. 3.3.2: Medians of distances covered and speed in grassy strips and cropping areas; error
bars show upper and lower quartiles; different characters between the grassy strips or the crop
fields show significant differences with p < 0.001 according to Kruskal-Wallis ANOVA and
multiple comparison test. ................................................................................................ 71
Fig. 3.3.3: Median of distances covered and speeds for P. melanarius in three cropping areas;
errors bars show upper and lower quartiles; different characters between distances or between
speeds indicate significant differences according to the Kruskal-Wallis ANOVA and multiple
comparison test.. ............................................................................................................. 71
Fig. 3.3.4: Medians of distances covered and speeds of Pterostichus melanarius in clover and
wheat during the two seasons; error bars show upper and lower quartiles; different characters
between autumn or spring values indicate significant differences according to the U-test... .. 72
Fig. 3.3.5: Ratios between the direction movement of P. melanarius (open triangle), Carabus
auratus (cross), C. nemoralis (open circle) and Poecilus spp. (black triangle) at field-1 (left)
and field-3 (right) of Ritzerauhof in 2011... ...................................................................... 73
v
List of Tables
Table 3.1.1: Dominance and activity density of carabids in field margins, grassy
strips and arable fields; +: < 0.2 %; RL SH: Status according to Red List Schleswig-
Holstein; different exponents indicate significant differences according to ANOVA (p
< 0.05); v: rare species... .............................................................................................. 34
Table 3.1.2: Affinity of carabid species to canopy cover and soil pH; different
exponents indicate significant difference according to ANOVA (p < 0.05); +: positive
reaction, -: negative reaction... ..................................................................................... 36
Table 3.1.3: Comparison between crop area and strip in the trap rows from edge to a
distance of 180 m, with results of Wilcoxon test and Sign test; F: field, S: strip; Z: Z-
value of Wilcoxon test, p: error of probability... .......................................................... 37
Table 3.2.1: Number of pitfall traps in the four age groups (zero, two, four, nine) and
the four habitats (Edge = 0 m, G = grassy strip, C = cropping area, F = control area)...44
Table 3.2.2: Total activity density of the carabids in the four habitats and the age
classes of the grassy strips (0 indicates the control field, 2, 4 and 9 the age (years) of
the strips); feedings habits (Feed. habit): C = carnivorous, O = omnivorous, P =
Phytophagous... ............................................................................................................ 46
Table 3.2.3: Mean activity density (ind. 100 trap days-1
), species richness, Shannon
(H), and evenness in the different habitats for all species and three feeding groups;
different exponents show significant differences found by LSD test at p < 0.001; 1
median instead of mean, NS: not significant; F DF, Gradient... ......................................... 48
Table 3.2.4: Results of the multiple linear regressions using age and distance
parameters; Const.: Constant, Dist.: distance; r: correlation coefficient; * significantly
(< 0.05) affected by parameter(s); p: refers to model with both parameters... ............. 49
Table 3.2.5: Mean activity density (ind. 100 trap days-1
), species richness, Shannon
(H), and evenness for all species and the three feeding groups in the central cropping
areas; different exponents show significant differences found by LSD test; NS: not
significant; F DF, Gradient; NS: not significant... ............................................................... 51
vi
Table 3.3.1: Total number of carabids released in the fields, total recaptured in
different crops (W = wheat, C = clover, P = pumpkin) and in adjacent strips (S =
grassy strip, and H = strip with hedge); T.rec.: Total of recaptured... ......................... 67
Table 3.3.2: Distances covered (m/total period) in strips and crops; Med. = median,
Min = minimum, Max = maximum; comparison by U- test for two habitats (U) or two
crops (U); non-parametric ANOVAs for three crops (H); only one specimen
recaptured is given in brackets... .................................................................................. 68
Table 3.3.3: Speed (m day-1
) in grassy strips and crops; Med. = median, Min =
minimum, Max = maximum; comparison by U- test for two habitats (U) or two crops
(U); non-parametric ANOVAs for three crops (H); only one specimen recaptured is
given in brackets... ....................................................................................................... 69
Appendix 1. Appendix 1: Sixty nice species not included in table 3.2.2 with their abundance in crop areas,
grassy strips and field edges; Fields 2,4, and 8 stand for the fields with 2-, 4-, and 9- year old
grassy strips; Cont. Stands for the control field -------------- ------------------------------------- 95

vii
Acknowledgements
This Ph.D. thesis has been prepared and completed after a period of three and a half
year doing research and studying at the Institute for Ecosystem Research, Christian
Albrecht University of Kiel, Germany. I would like to take this opportunity to thank
those people and organisations that helped me to complete this work.
First of all, I am deeply grateful to my advisor Prof. Dr. Ulrich Irmler for his
supervision and advice to solve many problems related to taxonomy and behaviour of
carabids in arable fields, and encouraging me to publish papers out of this PhD thesis.
Prof. Irmler was also generous to provide me funds for attending conferences and
short courses related to my projects. Further, I would like to thanks Dr Mario Hasler
who advised during the analysis of movement experiment. Thanks to my colleages
like Dr Lars Schröter who helped me both in the labortary and in the fields on many
issues related to insect ecology and ground beeltes.
Among organizations, the first and the most appreciatble one is the Higher
Education Commsiion of Pakistan which bestowed upon me a complete PhD
scholarship and funded my stay in Germany. I acknowledge all the memebers of the
Gesellschaft für Angewandte Carabidologie for their compay during the annual
meetings which were very fruitful for me in terms of learning various aspects of
research on ground beetles. Special thank to Günter Fielman (Ritzerauhof), and
Detlef Hack and Ute Thode (Lämmerhof) for their support and kindness for
providing their fields for the research. In addition, I would like to say thanks to my
close friends with whom I spent a good time in Kiel, especially Dr Sajid Masood and
Dr Sajid Ali, Syed Asad Abbas Zaidi and Rana Mahmood. Similarly, salute to Dr
Malte and Ms Karina Pena for their company during the office hours.
Last but not least I pay thank to my parents and siblings for their love and
encouragement to complete my studies.
1
Abstract
The aim of this study was to investigate the role of grassy strips in organic farming
using carabids as model organisms. Overall, the invasion of carabids from field
margins to field centres was studied along grassy strips compared to adjacent field
areas away from grassy strips, the effect of age of grassy strips on biodiversity, and
the movement behaviour of selected species.
Carabid assemblages showed no differences between grassy strips of different age,
crop fields near the grassy strips, and the field margins. Open field carabids that avoid
tree shade mostly took the advantage of the grassy structures. In addition, only a small
number of carabid species that like tree cover also used the grassy strips. In contrast,
arable crop lands were only exploited by species that elude vegetation cover. All 89
species demanded a soil pH ranging from 4.6 to 5.6. Species that prefer a soil pH
lower than 4.6 were not found in the habitats. Poecilus cupreus, Poecilus versicolor,
and Carabus nemoralis used the grassy strips to invade into the arable fields, whereas
Pterostichus melanarius, Anchomenus dorsalis, Nebria brevicollis, and Trechus
quadristriatus entered directly into the arable fields from the field margins without
using the grassy strips. Endangered carabids did not benefit from grassy strips. On
average, medium sized ground beetles (5 - 15 mm) profit from grassy strips. Small
sized carabids (<5 mm) were in comparatively higher abundance in the fields and
grassy strips than in the field margins.
Age of the grassy strips was the major factor that influenced the biodiversity of the
carabids in the grassy strips and in the adjacent arable crop land. Generally, a higher
species richness and lower activity density characterised the grassy strips and field
margins compared to the cropping areas. The older grassy strips contributed more to
higher species richness and biodiversity (Shannon H) in the adjacent crops than
younger strips. Increase in distance from the field edges resulted in a decrease of
evenness and an increase of the activity density in the grassy strips and the cropping
areas. Effect of age was also eminent in different feeding groups of carabids. The
major influence was found for carnivorous and phytophagous ground beetles as
compared to omnivorous. A positive relationship was found between the age of the
grassy strips and the species richness of the most dominant species in the grassy

2
strips. Age of grassy strips influenced the species richness of the dominant species in
the crop centre up to a distance of more than 150 m from the field margins. Like total
species richness, the species richness of the most dominant species also declined with
the increase in distance from the field margins. Moreover, the older grassy strips
influenced the richness of dominant species on the field margins connected to them.
Grassy strips acted as a corridor for the invasion of single dominant ground beetles
into the crop centres. Mark and recapture studies revealed a higher displacement and
speed in the arable crops than in grassy structures for P. melanarius, Carabus auratus
and Poecilus spp. A comparison among the species showed that the displacement and
speed of C. auratus was significantly higher than of P. melanarius, Pterostichus
niger, and Poecilus spp. The behaviour of P. melanarius differed for the distance
covered and the speed between the crops. The species covered longer distances with
higher speed in wheat (Triticum aestivum) than in red-clover (Trifolium pratense) or
pumpkin (Cucurbita maxima). In addition, the displacement and speed of P.
melanarius differed between spring and autumn generation in wheat and clover crops.
The carabids behaved differently for their invasion into the crops from the field
margins. Carabus auratus showed no preference to the grassy structures and arable
crops for its invasion into the fields. However, P. melanarius preferred to enter into
the crop centres from the grassy margins. In contrast, Poecilus spp. showed a different
behaviour of its invasion into the crops based on the locations of the arable fields. In a
marginal field close to a forest, Poecilus spp. used the grassy strips to enter into the
crop areas and avoided a grassy strip with adjacent hedge. However in a field located
in the centre of the huge crop land, Poecilus spp. used both crop areas and grassy
strips equally. C. nemoralis preferred only grassy margins adjacent to a hedge and
avoided to enter the crop land directly or the grassy strip without any hedge structure.
Unlike Poecilus spp. and C. nemoralis, Nebria brevicollis avoided the grassy strips
and preferred to disperse into the cropping areas directly. P. niger preferred the grassy
strips and their border areas for dispersal.
The investigations support the establishment of grassy structures in the organic arable
ecosystems, although some effects are weak and only a few species benefit from the
grassy structures. In addition, the grassy structures assist the dispersal of certain
species which could not invade without these corridors. If the grassy strips are
established for 9 years, they have a higher ecological value than young strips.
Furthermore, a positive influence of old grassy strips on the species richness was not
only found in the arable field area but also in the adjacent ecosystems.
3
Zusammenfassung
Es war das Ziel dieser Studie, die Rolle von Grasstreifen im Ökologischen Landbau
mit Hilfe von Carabidae als Modellorganismen zu untersuchen. Folgende einzelnen
Probleme sollten studiert werden: Das Eindringen von Carabidae von den Feldrändern
in die Feldmitte, in dem die Verteilung der Käfer entlang von Grasstreifen und
benachbarten Feldbereichen untersucht wurde, der Effekt des Alters von Grasstreifen
auf die Biodiversität und das Bewegungsverhalten ausgewählter Arten entlang
verschiedener Grasstreifen.
Die Carabidengemeinschaften zeigten keine deutlichen Unterschiede zwischen
Grasstreifen unterschiedlichen Alters, benachbarten Feldbereichen und Feldrändern.
Die Grasstreifen wurden von Laufkäferarten dominiert, die offene Flächen
präferieren. Schattenliebende Arten waren ausschließlich in den Grasstreifen zu
finden, aber nur in geringer Anzahl vorhanden. In den Feldern waren ausschließlich
Arten zu finden, die keinen Schatten ertragen. Alle 89 Arten haben bei pH-Werten des
Bodens zwischen 4,6 und 5,6 ihr Präferenzoptimum. Arten, die niedrigere pH-Werte
bevorzugen, traten nicht auf.
Poecilus cupreus, Poecilus versicolor und Carabus nemoralis nutzten die
Grasstreifen, um in die Felder einzudringen, während Pterostichus melanarius,
Anchomenus dorsalis, Nebria brevicollis und Trechus quadristriatus direkt in die
Felder wanderten, ohne die Grasstreifen zu nutzen. Es konnte nicht nachgewiesen
werden, dass gefährdete Arten proportional mehr von den Grasstreifen profitierten als
ungefährdete. Im Mittel wurden die Grasstreifen von Arten mittlerer Größe (5-15
mm) bevorzugt genutzt. Kleine Arten (< 5) waren vergleichsweise häufiger in den
Feldern und den Grasstreifen als in den Feldrändern.
Das Alter der Grasstreifen beeinflußte als wichtigster Faktor die Biodiversität von
Carabidae in den Grasstreifen und in den benachbarten Feldbereichen. Im
Allgemeinen waren die Grasstreifen und die Feldränder durch eine höhere
Artenvielfalt und niedrigere Aktivitätsdichte charakterisiert als die Felder. Alte
Grasstreifen trugen mehr zu einer Erhöhung der Artenzahl und der Artendiversität
(Shannon H) in den benachbarten Feldbereichen bei als junge Grasstreifen. Mit

4
zunehmender Entfernung vom Feldrand sank die Eveness, während die
Aktivitätsdichte anstieg. Das Alter von Grasstreifen war auch von großer Bedeutung
für die verschiedenen Ernährungstypen der Carabidae. Der größte Einfluß wurde auf
die carnivoren und phytophagen Laufkäfern gefunden, während er bei den omnivoren
gering war. Für die dominanten Arten zeigte die multiple Regression, dass sowohl die
Entfernung vom Feldrand als auch das Alter der Grasstreifen die Artenzahl in den
Grasstreifen beeinflußt. Die Entfernung vom Feldrand wirkte negativ, das Alter der
Grasstreifen positiv auf die Artenzahl in den Grasstreifen. Auch in den benachbarten
Feldbereichen und in den Feldrändern wirkte sich das Alter der Grasstreifen positiv
auf die Artenzahl der dominanten Arten aus.
Die Grasstreifen wirken als Korridore bei der Einwanderung einzelner dominanter
Laufkäferarten in die Felder. Für Pterostichus melanarius, Carabus auratus und
Poecilus ssp. ergab die Markierungs- und Wiederfangmethode eine höhere Mobilität
und Geschwindigkeit in den Feldern als in den Grasstreifen. Der Vergleich zwischen
den Arten zeigte, dass die Mobilität und Geschwingikeit von C. auratus signifikant
höher war als von P. melanarius, P. niger und Poecilus ssp. Die Mobilität und
Geschwindigkeit von P. melanarius war zwischen verschiedenen Anbaufrüchten
unterschiedlich. Im Weizen (Triticum aestivum) wurden weitere Entfernungen und
höhere Geschwindigkeiten erreicht als im Rotklee (Trifolium pratense) oder im
Kürbisanbau (Cucurbita maxima). Außerdem wurden zwischen der Frühjahrs- und
Herbstgeneration von P. melanarius sowohl im Weizen als auch im Rotklee
signifikante Unterschiede gefunden. Die Carabiden verhielten sich unterschiedlich
während ihrer Einwanderung vom Feldrand in die Felder. C. auratus zeigte keine
bevorzugte Nutzung von Grasstreifen während seiner Einwanderung in die Felder,
vermied sie aber auch nicht. Dagegen wanderte P. melanarius direkt in die Felder ein
und vermied die Grasstreifen. Im Gegensatz zu diesen beiden Arten konnte bei
Poecilus ssp. ein unterschiedliches Verhalten in Abhängigkeit von der Lage der
Grasstreifen festgestellt werden. In einem Feld mit einem benachbarten Wald nutzte
Poecilus ssp. signifikant häufiger den Grasstreifen und vermied den Streifen neben
einem Knick, in einem Feld in der Mitte der Agrarflächen wanderte er sowohl entlang
der Grasstreifen als auch direkt in das Feld ein. C. nemoralis bewegte sich nur entlang
des Grasstreifens mit einem benachbarten Knick in die Felder. Eine Einwanderung
entlang der Grasstreifen ohne benachbarte Hecke oder eine direkte Einwanderung
konnte nicht festgestellt werden. Anders als Poecilus ssp. und C. nemoralis mied N.
brevicollis Grasstreifen und wanderte direkt in die Felder ein, während P. niger nur
die Randbereiche der Grasstreifen für seine Ausbreitung nutzte.
5
Die Untersuchungsergebnisse unterstützen die positive Wirkung von Grasstrukturen
im Ökologischen Landbau, obwohl einige Effekte sehr schwach sind und nur einige
wenige Arten davon profitieren. Grasstreifen unterstützen die Ausbreitung einiger
Arten in die Felder, die sich ohne diese Korridore nicht in die Agrarflächen ausbreiten
könnten. Wenn Grasstreifen ein Alter von 10 Jahren erreichen haben sie einen
stärkeren positiven Wert als junge Grasstreifen. Außerdem scheinen alte Grasstreifen
nicht nur die Artenvielfalt in den Agrarflächen, sondern auch in den umgebenden
Ökosystemen positiv zu beeinflussen.
6
Chapter 1
Introduction
1.1 Motivation of studies
1.1.1 Agricultural intensification and food security for future
Throughout human history, the gaps between the dietary demands and the increasing
human population have changed many natural sites like forests and grasslands into
agricultural areas. Thus, agricultural intensification has a very old history and it began
on the advent of agriculture in South-West Asia about 10,500 to 10,100 years ago
when the first crop domestication adopted (Zohary et al., 2012). In only last 280 years
(from 1700 to 1980) the total area of cultivation increased by 466 % (Meyer &
Turner, 1992). The intensification increased with the passage of time and culminates
during the first “green revolution” (GR) from the beginning of 1950 to 1960s by a
number of measures such as new crop variety and farming practices. It brought many
socio-economic, political, environmental, and scientific changes (Reaping the
Benefits, 2009; Pingali, 2012).
After a period of 50 years, the positive effects of the green revolution could be seen in
gross world production. For example, cereals, coarse grains, roots and tubers, pulses
and oil crops increased from 1.84 billion tonnes (in year 1961) to 4.38 billion tonnes
(in 2007) which accounts for an increase of 138 % (FAOSTAT, 2009). If the growth
is seen continent wise, Africa received only a rise by 140 %, while Latin America by
approximately 200 %, and Asia by 280 % (FAOSTAT, 2009). This growth is an
integration of many parts of the first green revolution such as crop germplasm
improvement; establishment of many scientific institutes like International maize and
Wheat Improvement Centre (CIMMYT) in Mexico and International Rice Research
Institute (IRRI), and the Consultative Group on International Agricultural Research
(CGIAR); new ways for crop production and crop protection; and mechanised
farming (Reaping the Benefits, 2009).
7
The negative impacts of green revolution on the future of agriculture were determined
soon, and some works like “Silent spring” (Carson et al., 1962) attracted the attention
of farmers, governments, scientists and intelligentsia to adopt some alternative
measures to save the environment. An account of the malpractices during the arable
intensification is given by Stoate et al. (2001), who found that the destruction of
natural habitats, soil and environmental pollution, simplification of crop and animal
production on farm disrupted food web and food chains, and declined many species.
According to Pingali (2012) the environmental problems were not created by the GR
technology, and it was the policies that promoted overuse of inputs and intensified the
areas for crop productions which could not sustain them, e.g. sloping lands. Now a
new green revolution (GR 2.0) has been started to mitigate the mistakes committed in
the GR (Krebs et al., 1999; Pingali, 2012).
As the world population in 2050 is expected to grow to approximately 9 billion, the
demand of food will increase two to threefold (Tilman et al., 2002). This process will
require the reduction of food system intensification on the environment for future
food security (Godfray et al., 2010). To fulfil the expected demand of food (70 to 100
%) by 2050 (Baulcombe et al., 2009), a more sustainable farming system is required.
So, some changes such as the increase in food production, change in diet, decreasing
yield gaps across the globe, and reducing food wastes should be adopted by reducing
the biodiversity costs (Godfray et al., 2010). For this, a wild-life friendly farming is
recommended, which support the retention of natural and semi-natural habitats in the
countryside and in the arable fields and reduces the threats to beneficial organisms
(Green et al., 2005).
In order to counteract the negative impacts of agriculture on biodiversity, many
governments and non-governmental organisations support the Agricultural
Environmental Schemes (AES). These schemes give financial support to farmers for
using environment friendly land and are considered the realistic tool to save
environment and biodiversity across European and North American agricultural
landscapes (Donald and Evans, 2006; Tscharntke et al., 2007). These schemes
encourage the preservation of natural habitats on farm scale and support the habitat
heterogeneity in the agricultural landscape to increase biodiversity (Benton et al.,
2003; Mercks et al., 2009). However, the effectiveness of these schemes is questioned
and the results critically evaluated (Kleijn et al., 2001; Kleijn and Sutherland, 2003).
However, some positive results by Evans and Green, 2007 show that the schemes
8
have advantages if the management and efficinent and objectives are clearly defined
(Reaping the Benefits, 2009).
A number of nature friendly farming systems are adopted among which organic
farming exerts a diversified impact on the environment. This impact varies among
different taxa and depends on the heterogeneity of landscapes (Clough et al., 2007;
Crowder et al., 2010; Fuller et al., 2005; Östman et al., 2001; Purtauf et al., 2005).
The independence of organic farming from external inputs (fertilizers, pesticides etc)
causes a higher biodiversity and saves soil fertility (Maeder et al., 2002). The
reduction of the inputs decreases the danger of pest outbreaks and insect resistance in
organic agriculture (Macfadyen et al., 2009; Norton et al., 2009). Moreover, the
monoculture in conventional ecosystems causes a higher abundance of specialist
herbivores compared to the polycultures (Risch et al., 1983). Maeder et al (2002)
found in organic farming systems a more efficient source utilisation and a higher
biodiversity than in conventional farming systems. A meta-analysis by Bengtsson et
al. (2005) showed that organic farming enhances species richness. A possible reason,
combined with many others, might be the conservation of natural or semi-natural
habitats in the surroundings of organic fields, e.g., in south-west England (Gibson et
al., 2007).
1.1.2 Restoration of natural habitats in agroecosystems
The presence of natural or semi-natural habitats in the agricultural landscape is
necessary because the annual crop fields become defaunated islands after the harvest
every year (Kruess and Tscharntke, 1994). The natural enemies suffer more than their
phytophagous prey, which causes simpler food chains in these “islands” (Kruess and
Tscharntke, 1994). The recovery time of the disturbed population is generally longer
than the time for its destruction and it becomes longer for those which prey only on
few species (Kareiva, 1987). In addition, during some stages of their life many
organisms depend on specific resources that annual crops could not provide.
Therefore, they become rare or extinct, if their dispersal power is not high enough to
access distant resources (Tscharntke and Brandl, 2004).
The restoration or establishment of natural habitats in arable ecosystems has a high
social, aesthetic, and cultural significance (Burel and Baudry, 1995; Marshall, 2002).
Natural habitats provide food, foraging source, breeding sites, physical shelter, shelter
from predation, and dispersal corridors for a number of animals (Hobbs, 1992).

9
Mostly, these habitats are linear structures such as grassy field margins and
hedgerows. They increase the overall habitat diversity in agricultural landscapes and
help to suppress pests in annual arable cropping systems (Bianchi et al., 2006;
Tscharntke et al., 2007). The decline of these habitats dilutes landscape heterogeneity,
which ultimately threatens the animal diversity (Manhoudt and De Snoo, 2003).
Among the natural habitats, grassy field margins represent very old and traditional
habitats in the agricultural fields. They were already in use in the Bronze Age (Pollard
et al., 1974). The types of field margins are discussed in detail along with their role
and definitions by Greaves and Marshall (1987). The AES also include the
establishment and conservation of field margins. The field margins support many
weed plant species (Burel and Baudry, 1995), birds (Canada and Service, 2001;
Maeda, 2005; Neumann et al., 2001; Vickery et al., 2009; Vickery et al., 2002),
spiders (Drapela et al., 2008; Maudsley et al., 2002; Schmidt and Tscharntke, 2005;
Schmidt-Entling and Döbeli, 2009), and pollinating insects (Gabriel and Tscharntke,
2007; Lagerlöf et al., 1992; Steffan-Dewenter and Tscharntke, 1999).
Based on the composition of plants in the field margins and in various other semi-
natural habitats in arable ecosystems, the abundance and biodiversity of beneficial
insects is supported (Landis et al., 2000). Flower strips with a mixture of wildflowers
(Marshall and Moonen, 2002), ‘beetle banks’ in the crop centres (Thomas et al.,
1991), and weed strips in cereals (Lys et al., 1994) are playing a major role for the
biodiversity and abundance of many insects. The insects in agroecosystems provide a
number of services such as pest control (Nicholls and Altieri, 2004), pollination
(Kremen, 2008), weed seed predation (O’Rourke et al., 2006), and decomposition
(Irmler, 2000; Scheu, 2001).
If the ratio between total crop area and natural habitats around the crop fields is very
small, some additional grassy structures are needed to provide refuge and
overwintering sites in order to support polyphagous predators. Thomas et al. (2001)
used specific grassy structures called “beetle banks”. Their establishment is also
justified by the fact that the effectiveness of the natural habitats decreases with
increasing distance from the natural habitats (Saska et al., 2007).
The effect of semi-natural habitats depends on their age as an important factor. If
grassy margins or semi-natural habitats become older, they provide a more suitable
vegetation cover (Günter, 2000), more nutrients (Frank et al., 2007), more plant
species, and more effective predation and parasitism than younger habitats (Thies and

10
Tscharntke, 1999; Deny and Tscharntke, 2002). So, it is necessary to retain the natural
habitats for a longer time in the fields than usually today.
The destruction of natural habitats in intensive farming is usually combined with
habitat fragmentation. Habitat fragmentation has been found to be a great threat for
the survival of many animals (Fahrig, 2003). Fragmentation directly affects the
abundance small sized insect populations with low dispersal capabilities (Niemelä,
2001; Tscharntke et al., 2002). Species with low dispersal capability are restricted to
stable habitats (Hedin et al., 2008), while the species with higher dispersal capacity
have easier access to disturbed habitats (Denno et al., 1996). Low dispersal potentials
are often related to species with specific habitat demands or preferences of specific
habitat conditions (Ranius and Hedin, 2001). Brouwers and Newton (2009) reported
in a study on woodland carabids that generalist species have a higher rate of
movement (11 m day1) than carabids with strong relation to woodlands (2.1 m day
1).
Thus, habitat loss mainly affects animals which are relative immobile or have low
dispersal rates such as the flightless wood cricket (Nemobius sylvestris) (Brouwers
and Newton, 2009).
In addition to the dispersal and rate of dispersal, the orientation of animals towards
their habitats (Schtickzelle et al., 2007; Zollner and Lima, 1997) and their potentials
to cross barriers (Dover and Settele, 2008; Strong et al., 2002) are considered as major
factors to evaluate the dispersal potential of a species.
1.2 The model organism Ground beetles (Coleoptera: Carabidae) were used as model organisms, since they
respond either positive or negative to anthropogenic changes especially in agro-
ecosystems (Kotze et al., 2011; Kromp, 1990). The ecology and biology of carabids is
well investigated (Lindroth, 1945; Thiele, 1977; Lövei and Sunderland, 1996; Rainio
and Niemelä, 2003). Especially in the last 40 years in Europe, many detailed
investigations were performed on feeding behaviour, dispersal, and taxonomy (Kotze
et al., 2011).
The major reasons to use ground beetles as modal organisms were: their function as
bio-indicators, their different feeding habits, their interactions with the surrounding
habitats, and the easy investigation of their dispersal into crop lands. Apart from these
morphological and ecological aspects, the easy sampling of carabids is also an
advantage to use them for ecological investigations.
11
In a detailed review, Koivula (2011) found that carabids have a great potential as
model organisms and as bio-indicator organism. Ground beetle fit as model
organisms, because they have well investigated taxonomy with a relatively stable
systematic. Their role in ecology, their response to biotic and a biotic factors by their
morphological flexibility and their life-history strategies, their wide distribution, and
their spatio-temporal response to disturbance is well understood (Koivula, 2011).
According to Koivula (2011) the indicator function of carabids based on seven
characters by Lindenmayer (2000): (a) abundance and species richness, (b) role as
keystone organisms, (c) response to anthropogenic changes like pollution, (d)
response to environmental changes, (e) signalling problems at early stages, and (f)
response to disturbance and management practices. The use of carabids as indicator
organisms does not imply that all species can be used as indicators in a landscape on a
regional or local scale. For practical reasons, however, single species could be studied
to indicate the biodiversity situation on a spatio-temporal scale (Billeter et al., 2008).
A further reason to select carabids for this investigation was their different feeding
habits. Most of the carabids are polyphagous predators, carrion feeders, and seed
feeders especially of weeds (Luff, 1987; Thiele, 1977). Larochelle (1990) documented
the food choice of carabids from a world-wide database and found that 73.5 % of
carabid species were carnivorous, 19.5 % omnivourous and only 8.1 % phytophagous.
Ground beetles prey aphids (Bilde and Toft, 1997; Hajek et al 2007), earthworms
(Symondson et al., 2006), snails (Symondson et al., 2001; Oberholzer et al., 2003),
slugs (Bohan et al., 2000), weed seeds (Menalled et al., 2001), carrions (von Berg et
al., 2012), and amphibians (Wizen and Gasith, 2011).
A third aspect to take carabids was their response to the surrounding habitats. They
mostly find their suitable habitats by walking using two patterns. According to Baars
(1979) they use “random walk” for their short distance movement and “directed walk”
for their long distance movement. If carabids are in unfavourable conditions, they
show the “direct walk” behaviour to leave the unfavourable habitat (Baars, 1979).
Furthermore, their size was considered, because it plays an important role to
understand ecological functions. Large predators move quickly, detect prey at longer
distances, and have higher chances for successful preying (Cohen et al., 1993a,b). The
relationship between activity density and specific size could be useful to determine
the response to different scales in the agricultural landscape. In addition, the large-
sized carabids could be easily used to investigate their dispersal from one habitat to
another.
12
Finally, carabids are sampled by pitfall traps, which are cheap, easy to install, and
provide a good number of beetles for statistical analysis (Greenslade, 1964).
1.3 Hypotheses and aims In the light of the above mentioned problems, the present study has the following
aims: (1) which effect on biodiversity have the natural and semi-natural habitats in
organic agriculture, (2) which species benefit from grassy strips and what are the
selecting environmental factors, and (3) how grassy strips control the dispersal
behaviour of ground beetles.
1.3.1 Beneficial carabid species in organic farming systems
The role of organic farming on many animals including carabids has been intensively
studied. Only a few investigations contribute to the species level of the effectiveness
of grassy strips in organic agriculture, whereas most investigations referred to
conventional practices.
Therefore, hypothesis 1 was:
(1) Carabids benefit from grassy strips also in organic farming
The majority of studies compared the role of farming systems (conventional and
organic) on carabids and showed that the organic farming support higher abundance
and species richness (Booij and Noorlander, 1992; Armstrong, 1995; Pearsall and
Walde, 1995; Östman et al., 2001; Maeder et al., 2002; Shah et al., 2003; Purtauf et
al., 2005; Clough et al., 2007; Menalled et al., 2007; Legrand et al., 2011; Kromp,
1989, 1999). According to Varchola and Dunn (2001) hedgerows and grassy margins
support abundant and diverse populations of ground beetles in conventionally
managed corn fields. Hawthorne et al. (1998) investigated to role of margins and
strips on different carabid species. They found that the wildlife strips did not create a
signicant barrier to the movement of Anchemenus dorsale and Bembidion lampros.
On the contrary it was such a favourable habitat that it acted as an additional source of
colonising individuals.
Döring and Kromp (2003) used the data from different studies conducted in Germany
and Switzerland to find the carabid species that benefit from the organic farming.
They evaluated the carabids by using their own indices for activity density and
species richness. For ecological and biological traits they included humidity
preference, wing dimorphism, seasonal reproduction type, habitat preference, and

13
body length. But, they did not include the feeding habits and had no data on the
effects of grassy strips.
In a recent study, Legrand et al. (2011) used numerical models to investigate one
species, i.e. Pterostichus melanarius in organic farming. They found that the presence
of 20 % of grassy strips caused an asymptotic increase of 25 % of the predator.
However, the present study shows that abiotic and biotic factors such as soil pH and
tree cover could not be neglected to explain the invasion of carabids into the crop
fields.
The size of carabids in urban and in rural habitats is well documented, because the
size of carabids indicates habitat disturbance, e.g. disturbed habitats contain a carabid
fauna with smaller size, on average (Fujita et al., 2008; Grandchamp et al., 2000;
Magura et al., 2004) Only a few studies describe the role of the size of carabids in
arable fields in relation to grassy strips (Woodcock et al., 2006). Therefore,
(Tscharntke et al., 2002) postulate a need of detailed investigations on the role of the
size of carabids concerning habitat fragmentation.
1.3.2 Importance of age of the grassy strips in organic agriculture
During increasing age of grassy strips the stability increases and supports better
suitable environmental conditions to polyphagous predators such as carabids.
Thus, hypothesis 2 was:
(2) Old grassy strips support higher species richness and biodiversity of carabids
than younger grassy strips.
In conventional farming, the age of grassy strips adjacent to the arable crops
contributed to biological control (Denys and Tscharntke, 2002). According to Denys
and Tscharntke (2002) 6-year-old grassy strips showed higher predator-prey ratios
than 1-year-old strips in conventional agricultural farming. In another study with
unclear farming management, Frank and Reichhart (2007) reported higher species
richness in 3-year-old flower strips than in 1-year-old strips. Further investigations on
the role of age in chemically untreated flower strips (2-6 years old) were performed
by Anjum-Zubair et al. (2010) in May, 2005, and by Pfiffner and Luka (2000) in 2-16
years old grassy margins to find the overwintering role of the field margins for
carabid larvae. However, all three studies show strong disadvanteges to interprete the
results concerning the role of age of grassy strips. In the study of Frank and Reichhart
(2007) the range of the study strips was too narrow, only 1-3 years old; the study of
14
Anjum-Zubair et al. (2010) was too short, only in May, to reflect representative
results; Pfiffner and Luka (2000) had not identified their carabid larvae to species
level and, therefore, could not relate their results to the effect of age on biodiversity.
According to Hassall et al. (1992) 10-year old uncropped headlands had 80 % greater
diversity than 4-year-old one, which had 35 % greater diversity than 1-year old sites.
1.3.3 Movement of carabids between natural habitats and crop areas
In order to know more about the time scale effect of the invasion of carabids, studies
on movement and dispersal of carabids are needed. Overall, movement studies on
carabids are rare due to the high experimental effort and still less knowledge is
available to the effect of grassy strips or margins on the displacement behaviour.
The third hypothesis was:
(3) Grassy strips control the movement of carabids into the cropping areas
Few mark-recapture studies have been conducted on carabids in agricultural
ecosystems with different kinds of field margins and different crops around them.
Frampton et al. (1995) found that untreated grassy strips had a lower permeability
than the adjacent barley. In intensive farming, movement of Pterostichus melanarius
from hedges close to arable crops was investigate by Fournier and Loreau (1999) with
the aim to investigated the effect of crop field centres on the food availability. They
found that for starved beetles the field centres provide the most favourable habitat to
find food rapidly. Lys and Nentwig (1992) investigate beside the speed the direction
of three carabid species according to the wheat rows before and after tillage. All three
species showed different behaviour according to their parallel or perpendicular walk
to rows. Kajak and Oleszczuk (2004) found that large beetles with restricted habitat
requirements colonised preferably old shelter belts.
No studies are available that concern the direction of carabid species for their
colonisation from the field margins to the crop centre. Similarly, there are only few
investigations on the dispersal and rate of dispersal of carabids, especially in organic
farming systems, in different crops, and in different seasons.
15
Chapter 2
Methodology
2.1 Description of Experimental area and fields
2.1.1 Experimental site
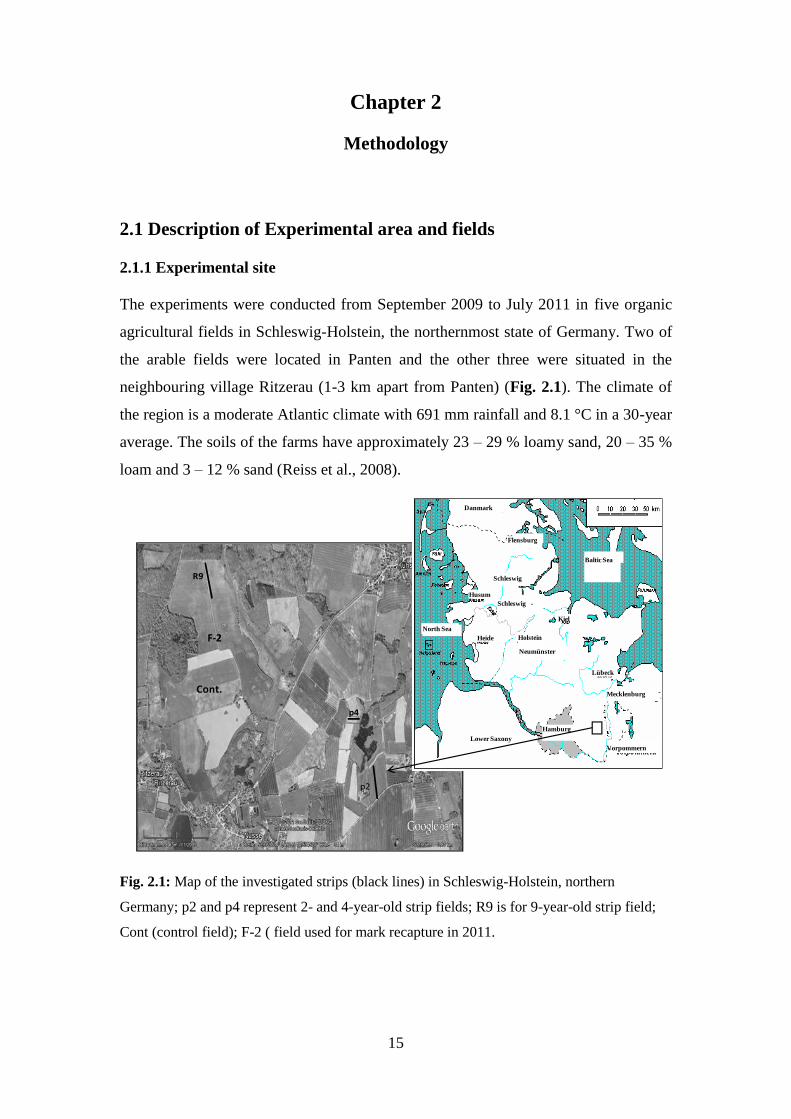
The experiments were conducted from September 2009 to July 2011 in five organic
agricultural fields in Schleswig-Holstein, the northernmost state of Germany. Two of
the arable fields were located in Panten and the other three were situated in the
neighbouring village Ritzerau (1-3 km apart from Panten) (Fig. 2.1). The climate of
the region is a moderate Atlantic climate with 691 mm rainfall and 8.1 °C in a 30-year
average. The soils of the farms have approximately 23 – 29 % loamy sand, 20 – 35 %
loam and 3 – 12 % sand (Reiss et al., 2008).
Fig. 2.1: Map of the investigated strips (black lines) in Schleswig-Holstein, northern
Germany; p2 and p4 represent 2- and 4-year-old strip fields; R9 is for 9-year-old strip field;
Cont (control field); F-2 ( field used for mark recapture in 2011.
p2
p4
Cont.
R9
F-2
Danmark
Lower Saxony
Schleswig -
Holstein
Mecklenburg -
Vorpommern
Baltic Sea
North Sea
Flensburg
Schleswig
Kiel
Neumünster
Lübeck
Hamburg
Husum
Heide

16
The farm in Ritzerau (Hof Ritzerau) consisted of 180 ha of arable fields and changed
to organic farming in 2001 and the farm in Panten (Lämmerhof) has been managed
according to organic rules for decades and accounted for 410 ha arable fields.
2.1.2 Description of the fields
For the experiments on the role of age of the grassy strips four fields were selected.
Three of the fields had grassy strips and one field has no grassy strip (control field).
The two fields in Panten had 2- and 4-year-old grassy strips, and a field in Ritzerau
had a 9-year-old grassy strip. The control field was selected in Ritzerau, too. The
grassy strips bordered either to one or two field margins.
At the 2-year-old grassy strip, one field margin was a hedge along a road and the
other field margin was a grassy margin without hedge. The strip was approximately
340 m long and it divided the crop land into two parts.
At the 4-year-old grassy strip, one field margin was a hedge and the other was also a
grassy margin with few bushes. The total length of the grassy strip was 150 m.
The field with the 9-year-old grassy strip was at the northernmost arable field of
Ritzerauhof adjacent to a forest. The grassy strip was running perpendicular to the
forest boundary, starting from the forest. The field margin was a grassy margin
adjacent to a hedge separating the forest from the arable crops. The grassy strip was
investigated up to 180 m from the forest.
The control field had no grassy strip. One field margin of the control field was a
grassy margin with few bushes along the high banks of a small water channel and the
other field margin was a grassy margin again. The total length of the control field
from one field margin to the other was approximately 900 m.
2.1.3 Terminology for natural habitats and arable crops areas
The control field was used as the initial stage for the age investigation (“0-year-old
field”), because grassy strips are usually ploughed after tow to three years due the
increasing growth of thistles. In order to define the different investigations in the crop
land of the control field without grassy strip and the investigations in the crop land
adjacent to the grassy strips, the terms “arable land” and “cropping area” were used

17
for the crop land of the control field and the crop land adjacent to the grassy strips,
respectively.
2.1.4 Plant composition of grassy strips
All grassy strips crossing the arable fields and the grassy strips of the field margins
were approximately 3 m wide. A seed mixture having ten herb species and few grass
species, e.g., Hordeum vulgare L. was used to establish the grassy strips. However,
after a period of 2 years all grassy strips were dominated by the main grass species,
i.e., Lolium perenne L., Poa trivialis L., and Elymus repens (L.) Gould. Both grass
coverage and species richness ranged between 60 % - 70 % and 50 - 60 species,
respectively, and represented the typical grassy vegetation in moderately moist sites
of northern Germany (Roweck, 2008)
All field edges were characterised by woods or hedges and a grassy strip in front of
them adjacent to the field with the same vegetation as in the established grassy strips.
2.2 Layout of the pitfall traps and mark-recapture method The effect of age of grassy strips and distance from field margins along the grassy
strips on the distribution of species and on the biodiversity was investigated on the
four sites described above from September 2009 to October 2010. The carabids were
sampled using pitfall traps. Glass jars were used as pitfall traps that had an opening of
5.6 cm diameter and were covered by a transparent shield to protect against direct
rainfall. The jars were half filled with 90 % glycol and a surface tension reducing
agent. Two parallel rows of pitfall traps were installed: one in the arable field and one
in the grassy the strip. The interval between the rows of pitfall traps was 30 m,
beginning at a distance of 30 m from the field margins. Distance between the field
rows and the strip rows were also 30 m. Since the strips were narrow, only 2 replicate
pitfall traps could be installed in each row per 30 m interval in approximately 1.5 m
distance from each other. At one field with the 2-year-old grassy strip of the
Lämmerhof (Panten), two parallel rows were installed in the arable fields on both
sides of the strip. In the control field 50 m intervals were used due to the long distance
between the field edges. The fields with two field edges, 2- and 4-year-old grassy strip
fields, received two sets of traps for each distance, because the distances used for
further calculations referred to the nearest field edge.
Three pitfall traps were set up in each field margin. Pitfall traps were changed at
monthly intervals, but intervals changed sometimes due to agronomic practices or the

18
weather conditions in winter. Since the control field was omitted, a total of 115 traps
were used for the analysis of ecological groups and distribution of species along the
grassy strips. A total of 150 traps were used to analyse the role of age of the grassy
strips on the biodiversity of carabids.
For the movement experiment conducted in 2010 and 2011, three fields were selected:
two fields were located on Ritzerauhof (field-1, field-3) and a third on Lämmerhof
(field-2). Both field-1 and field-2 of this experiment were identical with the 9-year-
old grassy strip field and 2-year-old grassy strip field of the former investigation,
respectively. The third field (field-3) was situated in the centre of the agrarian fields
of Ritzerauhof, at a distance of approximately 500 m from field-1. Field-1 and field-2
were investigated in 2010 and field-1 and field-3 in 2011.
Pitfall traps without killing agent were used to capture the beetles alive in the
movement experiment. For the safety of the living beetles, a transparent plate raised
by two iron rods over the traps was used to protect them against birds and rain. In
order to provide more shelter within the traps, a piece of cork, some leaves of plants,
and few stones were put in the traps. A total of both 250 and 230 pitfall traps were
established in 2010 and 2011, respectively.
The pitfall traps were established in rows parallel to the grassy structures at a distance
of approximately 5 m from apart each other (Fig. 2.2). On field-1 of Ritzerauhof,
winter wheat (Triticum aestivum) was sown 2010, and red-clover (Trifolium pratense)
in 2011. In both years, a total 110 traps were installed in a 10 x 11 trap grid.
The field-2 of the Lämmerhof had a grassy strip diving two crop fields planted with
red- clover and pumpkin (Cucurbita maxima). The grassy strip had of 22 traps in two
parallel rows (4 m apart) in distance of 5 m from each other. In the pumpkin crop, 18
traps were installed in three parallel rows at a distance of 5 m apart. In the red-clover
crop, 59 pitfall traps were established in 7 rows in different distances. In the red-
clover side, the distances from the grassy margin from the first to seventh row were 2,
5.8, 13.3, 20, 26.9, 32.5, and 44.3 m, respectively. Moreover, 2 traps were installed at
a distance of 1.5 m from the grassy strip on the pumpkin side and 3 traps on the red
clover side, in order to investigate the dispersal of carabid species in the area close to
the grassy strip.
Field-3 only investigated in 2011 and provided a similar layout as field-1. In contrast
to field-1, field-3 had two grassy strips without hedge. Wheat crop was sown on the
arable field and 120 pitfall traps were established in an 11 x 11 minus 1 grid.

19
Fig. 2.2: Experiment layout in Ritzerau fields (field-1 and field-3; left) and Panten
(field-2; right); filled circles in Panten field were close to the grassy strip (1.5m
distance); traps in rows were at ~ 5m distance; point of release at S (“source”)
All beetles captured were marked and released at the intersection of the two crops and
the grassy strip. Mutilation method was used to mark the beetles by a marking-drill
machine. This method is easy and fast to mark a high number of beetles. Small but
visible scratches were made on the elytra of the beetles according to Southwood and
Henerson (2001) which allows the marking of maximum 1023 specimens. The
number of Pterostichus melanarius exceeded the number 1023, which made it
necessary to use the pronotum for further numbering. The marked and recaptured
beetles released on the same evening of capture one after another, in the way that the
first beetle disappeared before the second beetle was released.
Since the mark-recapture investigations are tedious to conduct, only the following
species were selected: Pterostichus melanarius (13-17 mm), P. niger (16-21 mm),
Carabus auratus (17-30 mm), C. nemoralis (22-25 mm), Poecilus spp. (11-13 mm),
and Nebria brevicollis (11-14 mm). The major reasons for their selection are the large
size (e.g. Carabus spp., and Pterostichus spp.), which helped to identify the
specimens in the field with the naked eye and made the marking and reading
procedure easy. In addition, they are good indicators of organic farming (e.g. C.

20
auratus), associated with grassy strips (e.g. Poecilus spp., and P. niger) and are the
most abundant species in these fields (e.g. P. melanarius and Poecilus spp.). Only
Poecilus spp. could not be identified to species level, since the two very similar
species, i.e. Poecilus cupreus and P. versicolor, were found in these fields. According
to former investigations P. cupreus was the more frequent one (Ranjha and Irmler,
2013).
2.3 Analysis of the data The influence of organic farming on the carabid species was found by transforming
the activity density into the dominance values, as the capture efficiency of the traps in
the three habitats (grassy margins, grassy strips and cropping areas) was distinctly
different (e.g. Wallin and Ekbom, 1988). The activity density was taken as individuals
(ind.) 100 trap days-1
, because the trapping intervals were not equal and uniformity
was needed between the sampling periods. The indication values of each species were
derived from the information given by Irmler and Gürlich (2004), who used the
relationship between the species and their specific environment conditions at more
than 250 sites in Schleswig-Holstein. Only tree cover and soil pH showed significant
effects. So, these parameters were taken for each species and the indication value of
each group was calculated as the average of the specific indication values per group.
Additionally, the correlation coefficient for tree cover was used. For the analysis of
the distance effect on the distribution of carabid species the Wilcoxon and Sign-test
were used. The Red List classification was derived using the information given by
Gülrich et al. (2010). The classification of carabids based on the size data according to
Müller-Motzfeld (2004). The carabids were classified into 4 groups: small: - 5 mm,
medium > 5 – 10 mm, large: > 10 – 15 mm, and very large: > 15 mm. The groups
were statistically compared using the nested ANOVA.
In order to determine the role of the age of the grassy strips, activity density, species
richness, and biodiversity indices Shannon’ H and evenness were used. The activity
density of carabids was calculated in individuals (ind.) 100 trap days-1
. For species
richness the following methods were used: (1) total number of species per trap, (2)
sample-rarefaction method and (3) species number needed for 90 % of dominance.
For the last parameter, the species were ordered in decreasing order of dominance and
the number of species needed to get 90 % of the total specimens was taken. This
parameter was selected, because the capture efficiency of traps in arable fields is
higher than in grassland or forests (Wallin and Ekbom, 1988) and to avoid effects by
accidental species. The biodiversity was determined by Shannon’s H and evenness.

21
The effects of habitats (field edges, grassy strips, cropping areas, and control field) on
the assemblages of the carabids were analysed using the Detrended Correspondence
Analysis (DCA). In the DCA, the traps of the cropping areas, strips, and field edges of
each of the three fields and of the control field were combined into one sample. In
addition, in order to see whether the activity density, species richness, Shannon’s H,
and evenness of carabids differ between the four habitats, a nested ANOVA was
performed, where all the individual traps were nested within the habitats. In the nested
ANOVAs, each grid of two traps was combined to one sample to make a distance
gradient. Therefore, the grids at the same distance from the two field edges were
considered to be two samples. Similarly, the three traps of each field edge were used
as one sample. The nested ANOVAs were performed to overcome the problem of
pseudo-replications (Hurlbert, 1984).
The effects of age of grassy strips and the distance from the field edges were analysed
by using multiple linear regressions after testing the data on normal distribution. For
the analysis of feeding groups, carabids were classified, according to their feeding
habits, into three groups, i.e. carnivorous, omnivorous and phytophagous. To find the
effect of strips on the cropping areas, only the values of the cropping area traps in at
least 60 m distance from the field edges were used in order to omit the edge effect.
To analyse the movement of carabids from natural habitats to crop fields, the
distances covered in the grassy strips and cropping areas were measured. The distance
from the point of release to the trap where it was captured was defined as the distance
covered per time interval. For speed (m day-1
), the distance covered was divided by
the number of days. Distance and speed was compared between grassy strips and
cropping areas by U-test. In addition, distance and speed were compared between the
crops by the U-test or Kruskal-Wallis test. The significant differences in Kruskal-
Wallis tests were determined using the Bonferroni correction.
In order to determine the direction of movement from the point of release, the traps
were divided into two sectors: grassy sector and crop sector. The grassy sector
included the traps in the grassy strip plus the traps in the cropping area close to the
grassy strip up to at least 15 m away from the releasing point. This method was
selected to give the beetles enough time for orientation and space to decide their
destination. The numbers of specimens captured in the grassy sector and the crop
sector were compared using the Chi-square test to find whether the observed number
differs from the expected number. To find the behavioural differences of the carabids
in deciding for a certain sector, a Bonferroni adjusted pair-wise Chi-squared tests for
22
homogeneity were applied to compare the potentially different preference of the
species.
2.4 Brief introduction to thesis chapters The Chapter 1 give motivation and introduction of the study. The Chapter 2
contains the methods adopted during the study. The Chapter 3 of the thesis shows the
results of the project. The results in Chapter 3.1 analyses the carabids which have
higher advantages from grassy margins on the basis of their ecological response to
abiotic parameters. The findings about the role of the age of field margins on
biodiversity of carabids in general and on the basis of their body sizes, their feeding
habits, and the endangered species in the study area is presented in Chapter 3.2. The
dispersal and rate of dispersal of most abundant carabids in the grassy strips and in
adjacent crops as well as the direction of their colonisation is documented in Chapter
3.3. For the comprehensive summary of results of the whole thesis, Chapter 4 is
added.
23
Chapter 3 Results
Chapter 3 is subdivided into 3 parts according to 3 manuscripts which are published,
accepted or submitted.
3.1 Which carabid species benefit from grassy strips in organic
agriculture?a
Mazhar Ranjha and Ulrich Irmler
Institute for Ecosystem Research, Dept. Applied Ecology, University of Kiel
Olshausenstrasse 40, 24098 Kiel, Germany
Email: [email protected]; [email protected]
Abstract The carabid fauna of three organic arable fields, their grassy strips, and field margins
were investigated by pitfall traps in 2009/2010 at Ritzerau and Panten (Schleswig-
Holstein, northern Germany). Bembidion lampros was mainly found on the organic
arable fields, Amara similata in grassy strips, and Carabus nemoralis and C.
coriaceus in the field margins. Strips were mainly used by species which prefer open
areas without tree cover and also by few species demanding tree cover. In contrast,
arable fields were characterised by species avoiding vegetation cover. All species
analysed were demand on soil pH ranging from 4.6 to 5.6. Species that occurred on
lower soil pH were absent from the investigated habitats. It can be derived from the
results that Poecilus cupreus, Poecilus versicolor, and Carabus nemoralis used the
grassy strips to invade or cross arable fields, while Pterostichus melanarius,
Anchomenus dorsalis, Nebria brevicollis, and Trechus quadristriatus passed directly
arable fields from field margins. Grassy strips did not affect the species richness of
endangered species. Strips and arable fields were characterised by a high species
richness of intermediately sized carabids, while field edges had low amounts of small
sized species.
Keywords: Carabidae, organic agriculture, grassy strip, mobility, invasion into arable
fields
a Accepted in Angwandte Carabidologie
24
3.1.1 Introduction The loss of biodiversity in Central Europe is closely related to the intensification of
agriculture and the combined effect of changes in the agricultural landscape by the
removal of natural habitats (KREBS et al. 1999, FLYNN et al. 2009). The size of the
area and the pattern of natural and semi-natural habitats in the agricultural landscape
are important for the retreat and source potentials of the fauna (SMITH et al. 2008).
The colonization of arthropods after ploughing or insecticide application depends
mainly on the potential of the adjacent non-arable habitats (TSCHARNTKE & KRUESS
1999). Thus, sustainable land use, expected to solve the contradictory challenges of
environmental protection and food production, must also integrate the total landscape,
including agricultural and non-agricultural areas.
Natural and semi-natural habitats such as grassy strips, hedges and hedgerows prevent
the loss of biodiversity in agricultural landscapes (BENTON et al. 2003). Grassy strips
are corridors for dispersal, sources of food, sites for refuge and sites for overwintering
(THOMAS et al. 1991; BOMMARCO 1998; ASTERAKI et al. 1995; FRANK & REICHHART
2004; DENYS & TSCHARNTKE 2002). The benefit of grassy or floral strips for
biodiversity has mainly been found for conventional agriculture (LYS et al. 1994,
VARCHOLA & DUNN 2001). In a review study, BENGTSSON et al. (2005) found positive
effects of organic farming on predatory carabids. In addition, the species that benefit
from organic agriculture were reviewed by DÖRING (2003). Recent investigations
found that after six years of organic agriculture the diversity in the field centres equals
that at field margins, which implies that grassy strips are less effective in organic
agriculture than in conventional agriculture (SCHRÖTER & IRMLER in press).
Ground beetles are one of the most numerous groups of insects that can be found in
agroecosystems in the northern hemisphere (KROMP 1999). Because of their feeding
behaviour, they played an important role in pre-industrial farming as natural pest and
weed control agents, and may be of further interest for sustainable agriculture. The
low dispersal ability of many carabids hampers the rapid recuperation of losses in
arable fields within a farming year (THOMAS et al. 1991). Carabids are therefore
regarded as useful model organisms and indicators of the diversity processes in
agricultural landscapes (KOIVULA 2011).
Using carabids as indicator organisms, this investigation studies the effect of grassy
strips in organic fields with the main questions: (1) Which species benefit from grassy
strips? (2) Which ecological demands support the use of strips? (3) What effects do
the strips have on endangered and differently-sized species?
25
3.1.2 Sites and methods The investigation was performed from September 2009 to October 2010 in three
organic arable fields at Panten and Ritzerau (Schleswig-Holstein, northern Germany)
(Fig. 3.1.1). The region is characterised by moderate continental climate with 691 mm
rainfall and 8.1 °C in a 30-year average. The two farms are adjacent areas and have
soils with approximately 23 – 29 % loamy sand, 20 – 35 % loam and 3 – 12 % sand
(REISS et al. 2008). The farm in Ritzerau (Hof Ritzerau) consisted of 180 ha of arable
fields and changed to organic farming in 2001. The farm in Panten (Lämmerhof) has
been managed according to organic rules for decades accounted for 410 ha arable
fields. A 180 m long grassy strip was investigated in Ritzerau and two grassy strips
(150 m and 330 m) were selected in Panten. The two grassy strips in Panten
connected field margins on both sides, whereas only one end of the strip in Ritzerau
connected to a field margin. All field margins were characterised by woods or hedges
and a grassy strip in front of them adjacent to the field. All grassy strips crossing the
arable fields and the grassy strips of the field margins were approximately 3 m wide.
The strips and field margins were dominated by the main grass species, i.e. Lolium
perenne L., Poa trivialis L., and Elymus repens (L.) Gould. Both grass coverage and
species richness ranged between 60 % - 70 % and 50 - 60 species, respectively, and
represented the typical grassy vegetation in moderately moist sites of northern
Germany (ROWECK 2008). The crop on the arable fields was wheat.
Ground beetles were sampled by using pitfall traps. The glass jars used as pitfall traps
had an opening of 5.6 cm diameter and were covered by a transparent shield to protect
from direct rainfall. They were half filled with 90 % glycol and a surface tension
reducing agent. Two rows of pitfall traps were installed: one in the arable field and
one in the grassy the strip. The traps of the rows were in 30 m intervals, beginning at a
distance of 30 m from the field margins and a maximum distance of 180 m. Distance
between the field row and the strip row was also 30 m. Due to the narrow width of
strips, only 2 replicate pitfall traps were installed in each row per 30 m interval in
approximately 1.5 m distance from each other. At one field on the Lämmerhof, two
parallel rows were installed in the arable fields on both sides of the strip. Three pitfall
traps were set up in each field margin. Thus, a total of 118 pitfall traps were available
for the analysis. Pitfall traps were changed at monthly intervals, but intervals changed
sometimes due to weather conditions in winter.
For the analysis, activity density was transformed into dominance values, as the
capture efficiency of the traps in the three habitats was distinctly different (e.g.
WALLIN & EKBOM 1988). The indication values according to IRMLER & GÜRLICH

26
(2004) for the analysis of the species – environment relationship were used. As only
tree cover and soil pH had significant results, these parameters were taken for each
species and the indication value of each group was calculated as the average of the
specific indication values per group. Additionally, the sign of correlation coefficient
for tree cover was used. The values of the intervals in strips or arable fields were
analysed using the Wilcoxon and Sign test. The Red List species were selected
according to GÜRLICH et al. (2010). For the size analysis, the mean value of the size
range of the species was taken (MÜLLER-MOTZFELD 2004). The carabids were
classified into 4 groups: small: - 5 mm, medium > 5 – 10 mm, large: > 10 – 15 mm,
and very large: > 15 mm. The groups were statistically compared by the nested
ANOVA. The program STATISTICA 6.1 (STATSOFT 2004) was used for the
statistical analyses.
3.1.2 Results
3.1.2.1 Species composition
A total of 14,527 specimens were captured during the investigation. Arable fields
provided the highest number with 10,159 specimens; grassy strips and field margins
contributed to 3675 and 693 specimens, respectively (Table 3.1.1). Concerning
species richness, the arable fields, grassy strips and field margins accounted for 61, 60
and 46 species, respectively. Only six species were found to have a significantly
higher dominance in one of the three habitats. Among these species, only a single
species, i.e. Bembidion lampros, showed the highest dominance in arable fields; three
species were more dominant in arable fields and grassy strips; two species were more
dominant in field margins. The majority of species was found in all three habitats with
no significant preference for one of the habitats. The remaining species were rarely
captured and could not be analysed statistically. Nevertheless, their distribution was
specific in arable fields, strips or field margins.
The species showing no significantly higher dominance in one of the three habitats
were characterised by similar indication values as the species found only in arable
fields or in arable fields and strips concerning tree cover or soil pH (Table 3.1.2). The
field and strip species were generally characterised by their preference of open
habitats. In contrast, species found in strips and margins or found only in margins
exhibited a higher affinity to tree cover. Both groups were significantly separated
according to ANOVA (DF: 4, 43; F: 6.3; p < 0.001). The same trend was found when
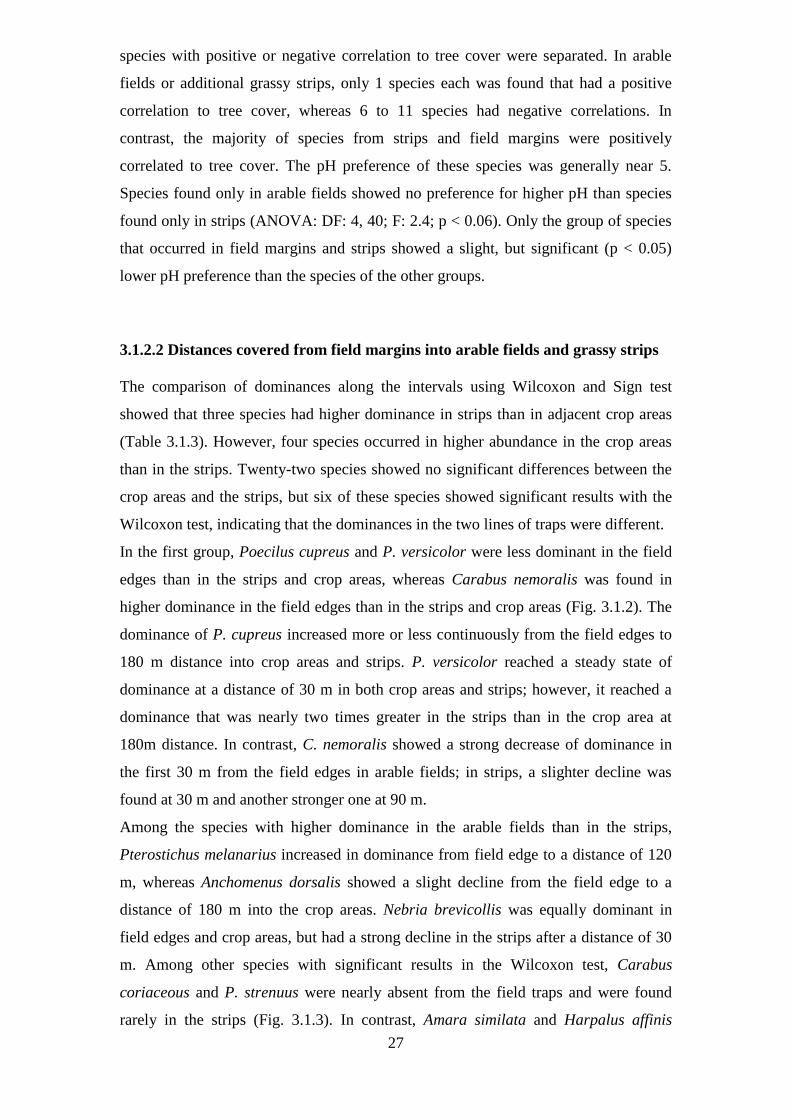
27
species with positive or negative correlation to tree cover were separated. In arable
fields or additional grassy strips, only 1 species each was found that had a positive
correlation to tree cover, whereas 6 to 11 species had negative correlations. In
contrast, the majority of species from strips and field margins were positively
correlated to tree cover. The pH preference of these species was generally near 5.
Species found only in arable fields showed no preference for higher pH than species
found only in strips (ANOVA: DF: 4, 40; F: 2.4; p < 0.06). Only the group of species
that occurred in field margins and strips showed a slight, but significant (p < 0.05)
lower pH preference than the species of the other groups.
3.1.2.2 Distances covered from field margins into arable fields and grassy strips
The comparison of dominances along the intervals using Wilcoxon and Sign test
showed that three species had higher dominance in strips than in adjacent crop areas
(Table 3.1.3). However, four species occurred in higher abundance in the crop areas
than in the strips. Twenty-two species showed no significant differences between the
crop areas and the strips, but six of these species showed significant results with the
Wilcoxon test, indicating that the dominances in the two lines of traps were different.
In the first group, Poecilus cupreus and P. versicolor were less dominant in the field
edges than in the strips and crop areas, whereas Carabus nemoralis was found in
higher dominance in the field edges than in the strips and crop areas (Fig. 3.1.2). The
dominance of P. cupreus increased more or less continuously from the field edges to
180 m distance into crop areas and strips. P. versicolor reached a steady state of
dominance at a distance of 30 m in both crop areas and strips; however, it reached a
dominance that was nearly two times greater in the strips than in the crop area at
180m distance. In contrast, C. nemoralis showed a strong decrease of dominance in
the first 30 m from the field edges in arable fields; in strips, a slighter decline was
found at 30 m and another stronger one at 90 m.
Among the species with higher dominance in the arable fields than in the strips,
Pterostichus melanarius increased in dominance from field edge to a distance of 120
m, whereas Anchomenus dorsalis showed a slight decline from the field edge to a
distance of 180 m into the crop areas. Nebria brevicollis was equally dominant in
field edges and crop areas, but had a strong decline in the strips after a distance of 30
m. Among other species with significant results in the Wilcoxon test, Carabus
coriaceous and P. strenuus were nearly absent from the field traps and were found
rarely in the strips (Fig. 3.1.3). In contrast, Amara similata and Harpalus affinis

28
occurred in low dominance in the field edges and the crop areas, but had a distinctly
higher dominance in the strips.
3.1.2.3 Effect of strips on endangered and differently sized species
In total, 15 species were listed as endangered in the Red List of Schleswig-Holstein.
Average numbers of species per trap were: 0.9 ± 0.5 (n = 18) in the field margins, 1.4
± 0.5 (n = 26) in the strips and 1.4 ± 0.8 (n = 44) in the arable fields (DF: 2,115). The
differences between the habitats were not significant (F = 6.37, p = 0.2).
The results of the nested ANOVA reflected an effect of carabid size and habitat type
on the number of species (F = 78.1, p < 0.001). Size had a higher effect (DF: 3, 382;
F: 169.1; p < 0.001) than the habitats (DF: 8, 382; F: 18.1; p < 0.001). The different
size groups showed that the very large species were found in equal numbers in all
three habitats (Fig. 3.1.4). Small species were not found as often in the field margins
as in the two other habitats, whereas medium and large sized species were more
frequent in grassy strips and arable fields. No difference in the size classes of carabids
was found between grassy strips and arable fields.
3.1.3 Discussion Concerning the species composition, the investigated arable fields represented the
most common carabid assemblage of arable fields on loamy soils in Schleswig-
Holstein (SCHRÖTER 2010; IRMLER & GÜRLICH 2004). Compared to that assemblage,
the dominance of Pterostichus melanarius was low with 12 %, which can be
explained by the seven year period of organic farming (SCHRÖTER & IRMLER in
press). According to IRMLER & GÜRLICH (2004), the high dominance of Bembidion
lampros on the fields investigated indicated a higher affinity to smaller-sized arable
fields and to organic farming than the typical assemblage with dominance of P.
melanarius. The positive relationship of B. lampros to organic farming was also found
by SCHRÖTER (2010), although the correlation was still weak after 2 years of organic
farming. Its preference to arable fields showed that the species is not dependent on the
field margins or strips. Its dependence on the management of the arable fields makes
it a valuable indicator for organic farming. It was astonishing to find that P.
melanarius, which is generally an indicator of arable fields, also showed high
dominances in strips and field margins. In contrast to B. lampros, this species also
often used habitats adjacent to arable fields. Their nocturnal activity, which is
supported by the darker grassy strips, could be an explanation for this behaviour
(CHAPMAN et al. 1999). According to WALLIN (1988), P. melanarius reproduced and

29
developed larvae in arable field, but adults also used field margins. Similar results
were found for Poecilus cupreus as well; reproduction and larval development was
reported to occur in arable field areas, while adults used field margins for predation
(WALLIN 1988).
The effects of grassy strips in agricultural landscapes were investigated in the last
decades in both grassland and arable fields. In grasslands, NENTWIG (1988) found a
higher diversity of carabids under strip-managed areas than in mown areas or mown
strips. Perennial grass strips also enhanced abundance and species richness of
leafhoppers in comparison to cereal fields (HUUSELA-VEISTOLA & VAARAINEN 2000).
Our investigation does not support this positive effect of strips and margins on the
species richness in organically farmed fields. Under organic farming, species of the
field margin invaded the field centres that resembled the field margins after 6 years of
organic farming (SCHRÖTER & IRMLER 2013). Nevertheless, seasonal changes based
on the invasion process were found even in small organic fields (JUEN & TRAUGOTT
2004).
Invasion in our studies should be understood as a process of one or more years,
because strips can also function as overwintering habitats. However, grassy strips
only persist usually two to three years and are developed at another site after that time
due to the increasing thistle abundance. In our investigation, strips supported the
invasion of species preferring no vegetation cover and species preferring vegetation
cover, whereas only species avoiding vegetation cover were supported by fields. In
particular, species that were found mainly in field margins preferred vegetation cover.
In contrast to typical species of forests, all species of arable fields, strips and field
margins require a soil pH ranging between 4.6 and 5.6. As described by IRMLER &
GÜRLICH (2004), species of forests that prefer lower soil pH ranging between 3.4 and
4.4 avoided the strips and field margins. Typical species mainly occurring in field
margins and using the strips as corridors into arable fields are Carabus nemoralis, C.
coriaceous, and P. strenuus. All three species can be described as euryecious species
having a weak preference for forests (IRMLER & GÜRLICH 2004). Our data showed
that they invaded from the field margins using the grassy strips and rarely crossed into
arable fields. Among these three species, C. nemoralis revealed the highest mobility,
as it was found in high dominance at a distance of up to 90 m into the grassy strips.
Dominance of C. coriaceus drastically declined at a distance of 30 to 60 m from the
field margin; the dominance of P. strenuus was generally low in strips and arable
fields.
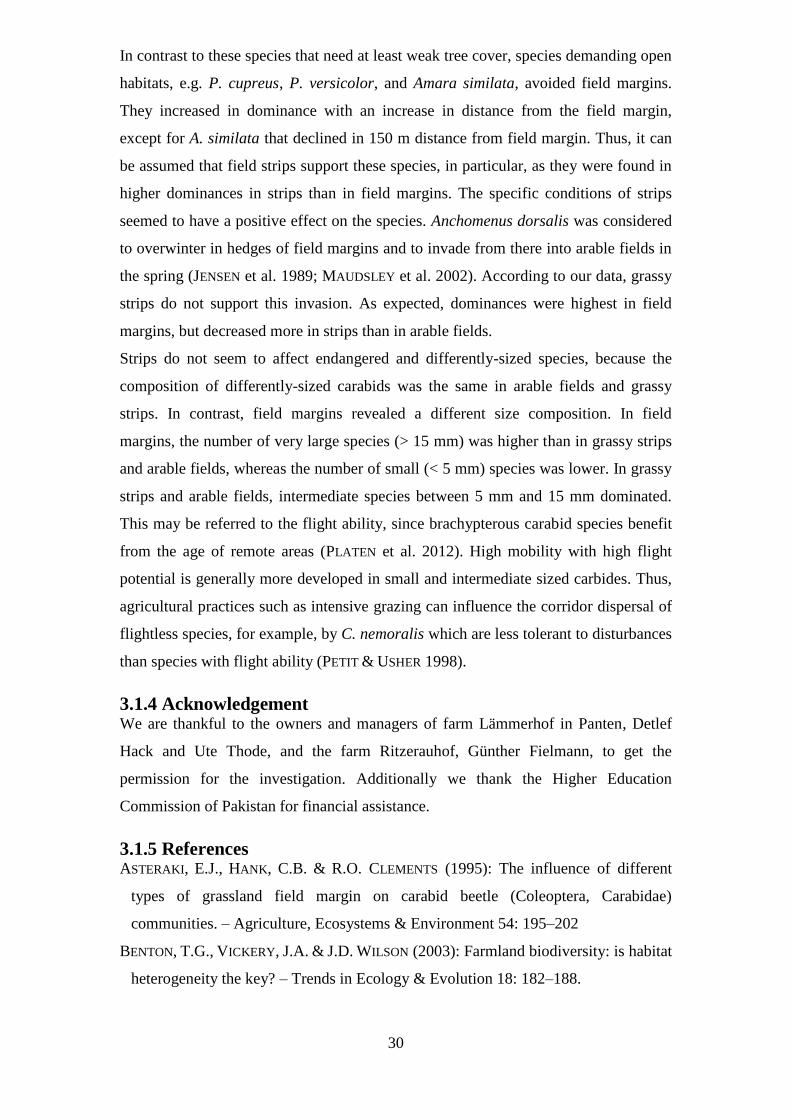
30
In contrast to these species that need at least weak tree cover, species demanding open
habitats, e.g. P. cupreus, P. versicolor, and Amara similata, avoided field margins.
They increased in dominance with an increase in distance from the field margin,
except for A. similata that declined in 150 m distance from field margin. Thus, it can
be assumed that field strips support these species, in particular, as they were found in
higher dominances in strips than in field margins. The specific conditions of strips
seemed to have a positive effect on the species. Anchomenus dorsalis was considered
to overwinter in hedges of field margins and to invade from there into arable fields in
the spring (JENSEN et al. 1989; MAUDSLEY et al. 2002). According to our data, grassy
strips do not support this invasion. As expected, dominances were highest in field
margins, but decreased more in strips than in arable fields.
Strips do not seem to affect endangered and differently-sized species, because the
composition of differently-sized carabids was the same in arable fields and grassy
strips. In contrast, field margins revealed a different size composition. In field
margins, the number of very large species (> 15 mm) was higher than in grassy strips
and arable fields, whereas the number of small (< 5 mm) species was lower. In grassy
strips and arable fields, intermediate species between 5 mm and 15 mm dominated.
This may be referred to the flight ability, since brachypterous carabid species benefit
from the age of remote areas (PLATEN et al. 2012). High mobility with high flight
potential is generally more developed in small and intermediate sized carbides. Thus,
agricultural practices such as intensive grazing can influence the corridor dispersal of
flightless species, for example, by C. nemoralis which are less tolerant to disturbances
than species with flight ability (PETIT & USHER 1998).
3.1.4 Acknowledgement We are thankful to the owners and managers of farm Lämmerhof in Panten, Detlef
Hack and Ute Thode, and the farm Ritzerauhof, Günther Fielmann, to get the
permission for the investigation. Additionally we thank the Higher Education
Commission of Pakistan for financial assistance.
3.1.5 References ASTERAKI, E.J., HANK, C.B. & R.O. CLEMENTS (1995): The influence of different
types of grassland field margin on carabid beetle (Coleoptera, Carabidae)
communities. – Agriculture, Ecosystems & Environment 54: 195–202
BENTON, T.G., VICKERY, J.A. & J.D. WILSON (2003): Farmland biodiversity: is habitat
heterogeneity the key? – Trends in Ecology & Evolution 18: 182–188.

31
BENGTSSON, J., AHNSTRÖM, J. & A. WEIBULL (2005): The effects of organic
agriculture on biodiversity and abundance: a meta-analysis. – Journal of Applied
Ecology 42: 261–269.
BOMMARCO, R. (1998): Reproduction and Energy Reserves of a Predatory Carabid
Beetle Relative to Agroecosystem Complexity. – Ecol. Appl. 8: 846–853.
CHAPMAN, P.A., ARMSTROG, G. & R.G. MCKINLAY (1999): Daily movements of
Pterostichus melanarius between areas of contrasting vegetation density within
crops. – Entomologia Experimentalis et Applicata 91: 479–482.
DENYS, C. & T. TSCHARNTKE (2002): Plant-insect communities and predator-prey
ratios in field margin strips, adjacent crop fields, and fallows. – Oecologia 130:
315–324.
DÖRING, T.F. & B. KROMP (2003): Which carabid species benefit from organic
agriculture? — a review of comparative studies in winter cereals from Germany and
Switzerland. – Agriculture Ecosystems & Environment 98: 153–161.
FLYNN, D.F.B., GOGOL-PROKURAT, M., NOGEIRE, T., MOLINARI, N., TRAUTMAN
RICHERS, B., LIN, B.B., SIMPSON, N., MAYFIELD, M.M. & F. DECLERCK (2009): Loss
of functional diversity under land use intensification across multiple taxa. Ecology
Letters 12: 22–33.
FRANK, T. & B. REICHHART (2004): Staphylinidae and Carabidae overwintering in
wheat and sown wildflower areas of different age. – Bulletin of Entomological
Research 94: 209–217.
GÜRLICH, S., SUIKAT, R. & W. ZIEGLER (2010): Die Käfer Schleswig-Holsteins – Rote
Liste. Vol. 2. – 110 S.; Ministerium für Landwirtschaft, Umwelt und ländliche
Räume des Landes Schleswig-Holstein.
HUUSELA-VEISTOLA, E. & A. VASARINEN (2000): Plant succession in perennial grass
strips and effects on the diversity of leafhoppers (Homoptera, Auchenorrhyncha). –
Agriculture, Ecosystems & Environment 80: 101–112.
IRMLER, U. & S. GÜRLICH (2004): Die ökologische Einodnung der Laufkäfer
(Coleoptera: Carabidae) in Schleswig-Holstein. – Faunistisch-Ökologische
Mitteilungen, Supplement 32, 1–117.
JENSEN, T.S., DRYING, L., KRISTENSEN, B., NIELSEN, B.O. & E.R. RASMUSSEN (1989):
Spring dispersal and summer habitat distribution of Agonum dorsale (Coleoptera:
Carabidae). – Pedobiologia 33: 155–165.
JUEN, A. & M. TRAUGOTT (2004): Spatial distribution of epigaeic predators in a small
field in relation to season and surrounding crops. – Agriculture Ecosystems &
Environment 103: 613–620.
32
KOIVULA M. (2011): Useful model organisms, indicators, or both? Ground beetles
(Coleoptera, Carabidae) reflecting environmental conditions. – ZooKeys 100:
287–317.
KREBS, J.R, WILSON, J.D., BRADBURY, R.B. & G.M. SIRIWARDENA (1999): The
second silent spring? – Nature 400: 611–612.
KROMP, B. (1999): Carabid beetles in sustainable agriculture: a review on pest control
efficacy, cultivation impacts and enhancement. – Agriculture Ecosystems &
Environment 74: 187–228.
LYS, J.-A., ZIMMERMANN, M. & W. NENTWIG (1994): Increase in activity and species
number of carabid beetles in cereals as a result of strip-management. – Entomologia
Experimentalis et Applicata 73: 1–9.
MAUDSLEY, M., SEELEY, B. & O. LEWIS (2002): Spatial distribution of predatory
arthropods within an English hedgerow in early winter in relation to habitat
variables. – Agriculture, Ecosystems & Environment 89: 77–89.
MÜLLER-MOTZFELD, G. (2004): Adephaga I Carabidae (Laufkäfer). – In: FREUDE, H.,
HARDE, K.W., LOHSE, G.A. & B. KLAUSNITZER (Hrsg.): Die Käfer Mitteleuropas.
Elsevier; München.
NENTWIG, W. (1988): Augmentation of beneficial arthropods by strip-management. 1.
succession of predacious arthropods and long-term change in the ratio of
phytophagous and predacious arthropods in a meadow. – Oecologia 76: 597–606.
PETIT, S. & M.B. USHER (1998): Biodiversity in agricultural landscapes: the ground
beetle communities of woody uncultivated habitats. – Biodiversity and Conservation
7: 1549–1561.
PLATEN, R., BERGER, G. & S. MALT (2012): The impact of habitat characters at set-
asides in the agrarian landscape on ecological and functional groups of ground
beetles (Coleoptera: Carabidae). – Mitt. dtsch. Ges. allg. angew. Ent. 18: 181–186.
REISS, S., BORK, H.-R., HOERNES, U., RINKER, A. & A. MITUSOV (2008): Die
Verbreitung der Böden auf den Ackerflächen von Hof Ritzerau. – Faunistisch-
Ökologische Mitteilungen Suppl. 35: 59–73.
ROWECK, H. (2008): Die aktuelle und potenzielle floristische Diversität der Feldfluren
auf Hof Ritzerau. Faunistisch-Ökologische Mitteilungen Suppl. 35: 103-122.
SCHRÖTER, L. (2010): Lauf- und Kurzflügelkäfer (Coleoptera: Carabidae,
Staphylinidae) auf Ackerflächen während der Umstellung vom konventionellen zum
ökologischen Anbau. – Faunistisch-Ökologische Mitteilungen, Supplement 36: 1–
144.

33
SCHRÖTER, L. & U. IRMLER (2013). Organic cultivation reduces barrier effect of
arable fields on species diversity. – Agriculture, Ecosystems & Environment 164:
176-180
SMITH, J., POTTS, S., & P., EGGLETON (2008): The value of sown grass margins for
enhancing soil macrofaunal biodiversity in arable systems. – Agriculture,
Ecosystems & Environment 127: 119–125.
STATSOFT, Inc. (2004): STATISTICA for Windows [Software-System for Data
analysis] Version 6. Tulsa, Oklahoma.
THOMAS, M.B., WRATTEN, S.D. & N.W. SOTHERTON (1991): Creation of 'Island'
Habitats in Farmland to Manipulate Populations of Beneficial Arthropods: Predator
Densities and Emigration. – Journal of Applied Ecology 28: 906–917.
TSCHARNKE, T. & A. KRUESS (1999): Habitat fragmentation and biological control. –
In: HAWKINS, B.A. & CORNELL, H.V. (eds.): Theoretical approaches to biological
control: 190–205; Cambridge University Press; Cambridge.
WALLIN, H. (1988): The effects of spatial distribution on the development and
reproduction of Pterostichus cupreus L., P. melanarius Ill., P. niger Schall. and
Harpalus rufipes DeGeer (Col. Carabidae) on arable land. – Journal of Applied
Entomology 106: 483–487.
WALLIN, H. & B.S. EKBOM (1988): Movements of carabid beetles (Coleoptera:
Carabidae) inhabiting cereal fields: a field tracing study. – Ecologia 77: 39–43.
VARCHOLA, J.M. & J.P. DUNN (2001): Influence of hedgerow and grassy field borders
on ground beetle (Coleoptera: Carabidae) activity in fields of corn. – Agriculture,
Ecosystems & Environment 83: 153–163.

34
Table 3.1.1: Dominance and activity density of carabids in field margins, grassy
strips and arable fields; +: < 0.2 %; RL SH: Status according to Red List Schleswig-
Holstein; different exponents indicate significant differences according to ANOVA
(p < 0.05); v: rare species.
RL Dominance (%) Ind 100 days-1
SH Field Strip Margin Field Strip Margin
Bembidion lampros a
9.9 b 5.4
b 3.1 35.82 12.59 0.23
Poecilus cupreus a
14.2 a 16.8
b 0.8 64.18 37.32 0.08
Pterostichus melanarius a
12.6 ab
7.9 b 7.2 67.74 19.29 0.75
Amara similata ab
1.3 a 4.2
b 0.8 3.28 10.83 0.10
Carabus nemoralis b
0.5 ab
4.5 a 11.5 1.93 5.42 0.73
Carabus coriaceus b
0.1 b 0.5
a 2.9 0.23 0.59 0.27
Anchomenus dorsalis 10.3 3.9 11.9 35.59 8.47 1.33
Nebria brevicollis 8.2 3.8 6.6 36.00 5.87 0.73
Harpalus rufipes 9.0 6.9 11.2 36.34 9.38 0.96
Bembidion tetracolum 2.6 3.2 1.8 9.22 4.45 0.21
Calathus fuscipes 0.8 0.3 0.6 3.79 0.80 0.06
Trechus quadristriatus 6.6 3.3 5.9 17.61 4.08 0.64
Carabus auratus 3 6.9 14.4 9.0 29.71 13.60 0.55
Harpalus affinis 6.3 8.0 6.1 21.07 17.16 0.43
Poecilus versicolor 3.0 6.2 1.9 13.73 13.07 0.16
Agonum muelleri 1.5 0.7 0.5 5.21 1.20 0.10
Carabus granulatus 0.6 0.5 0.9 2.46 0.89 0.08
Clivina fossor 1.1 1.9 0.9 2.40 1.80 0.06
Amara aenea 0.7 1.0 0.6 2.31 2.31 0.06
Amara familiaris 0.7 1.1 1.6 1.77 3.00 0.11
Loricera pilicornis 0.3 + 0.3 0.66 0.19 0.02
Pterostichus niger + 0.7 0.2 0.60 0.47 0.02
Synuchus vivalis + 0.2 1.9 0.61 0.43 0.25
Pterostichus strenuus + 0.5 1.5 0.21 0.47 0.11
Harpalus latus + 0.1 0.2 0.45 0.75 0.04
Amara consularis v + 0.2 0.2 0.89 0.25 0.02
Pterostichus diligens + 0.2 0.3 0.42 0.25 0.02
Harpalus rubripes + + 0.3 0.10 0.14 0.02
Amara plebeja + + 0.5 0.21 0.05 0.04
Stomis pumicatus + + 0.8 0.03 0.05 0.10
Oxypselaphus obscurus + + 0.9 0.08 0.15 0.04
Anisodactylus binotatus + + 0.2 0.04 0.15 0.02
Trichocellus placidus + . 0.2 0.04 . 0.02
Bembidion obtusum v 0.3 . . 0.39 . .
Microlestes minutulus + . . 0.39 . .
Limodromus assimilis + . . 0.16 . .
Amara communis + . . 0.13 . .
Philorizus melanocephalus + . . 0.19 . .
Poecilus lepidus 3 + . . 0.09 . .
Harpalus neglectus 2 + . . 0.04 . .
Pterostichus nigrita + . . 0.04 . .
Chlaenius nigricornis 3 + . . 0.04 . .
Zabrus tenebriodes 1 + . . 0.04 . .
Calathus erratus + . . 0.04 . .
Ophonus rufibarbis + . . 0.04 . .

35
Acupalpus exiguus + . . 0.03 . .
Demetrias atricapillus + . . 0.03 . .
Bembidion properans 0.5 0.5 . 1.61 1.12 .
Harpalus tardus 0.3 0.3 . 0.87 0.48 .
Notiophilus biguttatus 0.2 + . 0.41 + .
Amara aulica + + . 0.33 0.09 .
Calathus melanocephalus + 0.2 . 0.23 0.30 .
Harpalus signaticornis v + + . 0.15 0.19 .
Harpalus distinguendus 3 + + . 0.14 0.05 .
Acupalpus meridianus v + + . 0.22 0.10 .
Pterostichus vernalis + + . 0.18 0.05 .
Amara anthobia 3 + + . 0.12 0.05 .
Amara lunicollis + + . 0.03 0.20 .
Harpalus rufipalpis + 0.2 . 0.04 0.11 .
Trechoblemus micros + + . 0.09 0.05 .
Bradycellus harpalinus + + . 0.04 0.05 .
Leistus terminatus . + . . 0.05 .
Syntomus truncatellus . + . . 0.05 .
Syntomus foveatus . + . . 0.05 .
Badister sodalis . + . . 0.05 .
Amara tibialis . + . . 0.10 .
Calathus cinctus v . + . . 0.05 .
Calosoma auropunctatum 2 . + . . 0.05 .
Abax parallelepipedus . 0.8 0.7 . 0.38 0.10
Carabus violaceus . + 0.2 . 0.05 0.02
Cychrus caraboides . + 0.2 . 0.05 0.02
Bembidion guttula . + 0.3 . 0.05 0.02
Pterostichus oblongopunctatus . 1.0 0.9 . 0.12 0.11
Panagaeus bipustulatus 3 . + 0.3 . 0.05 0.02
Bembidion lunulatum 2 . . 0.3 . . 0.02
Bembidion biguttatum . . 0.6 . . 0.02
Leistus rufomarginatus . . 0.2 . . 0.02
Calathus rotundicollis . . 0.2 . . 0.02
Badister bullatus . . 0.4 . . 0.04
Carabus hortensis . . 2.1 . . 0.12
Notiophilus palustris . . 0.3 . . 0.04

36
Table 3.1.2: Affinity of carabid species to canopy cover and soil pH; different
exponents indicate significant difference according to ANOVA (p < 0.05); +: positive
reaction, -: negative reaction
Preference type
of species groups
No. of
species
Mean tree
cover (%)
Species with correlation
coefficient to tree cover (n)
pH
+ -
Without preference 27 7.4 ± 9.8 1 15 5.5 ± 0.6
Rare carabids
Only in fields 14 a 4.7 ± 13.1 1 6
a 5.6 ± 0.4
In fields and strips 15 a 6.8 ± 23.9 1 11
a 5.5 ± 0.9
Only in strips 7 a 13.9 ± 25.1 2 2
a 5.5 ± 0.6
In strips and margins 6 b 63.4 ± 47.4 4 1
b 4.6 ± 0.7
Only in margins 7 b 51.4 ± 50.1 5 0
ab 5.0 ± 1.3

37
Table 3.1.3: Comparison between crop area and strip in the trap rows from edge to a
distance of 180 m, with results of Wilcoxon test and Sign test; F: field, S: strip; Z: Z-
value of Wilcoxon test, p: error of probability.
Species Wilcoxon F : S ratio Sign test
Z p Z p
Poecilus cupreus 2.2 0.03 F < S 2.0 0.04
Carabus nemoralis 2.2 0.03 F < S 2.0 0.04
Poecilus versicolor 2.2 0.03 F < S 2.0 0.04
Pterostichus melanarius 2.2 0.03 F > S 2.0 0.04
Anchomenus dorsalis 2.2 0.03 F > S 2.0 0.04
Nebria brevicollis 2.2 0.03 F > S 2.0 0.04
Trechus quadristriatus 2.2 0.03 F > S 2.0 0.04
Bembidion lampros 2.0 0.04 - 1.2 n.s.
Amara similata 2.0 0.04 - 1.8 n.s.
Carabus coriaceus 2.0 0.04 - 1.8 n.s.
Harpalus affinis 2.0 0.04 - 1.2 n.s.
Amara aenea 2.0 0.04 - 1.2 n.s.
Pterostichus strenuus 2.0 0.04 - 1.2 n.s.
Pseudoophonus rufipes 1.8 n.s. - 1.2 n.s.
Pterostichus diligens 1.8 n.s. - 1.5 n.s.
Harpalus rubripes 1.8 n.s. - 1.5 n.s.
Amara familiaris 1.6 n.s. - 1.2 n.s.
Harpalus latus 1.6 n.s. - 0.4 n.s.
Amara consularis 1.5 n.s. - 0.5 n.s.
Calathus fuscipes 1.4 n.s. - 1.2 n.s.
Agonum muelleri 1.4 n.s. - 1.2 n.s.
Bembidion tetracolum 1.2 n.s. - 1.2 n.s.
Synuchus vivalis 0.9 n.s. - 0.9 n.s.
Amara plebeja 0.9 n.s. - 0.9 n.s.
Loricera pilicornis 0.7 n.s. - 0.5 n.s.
Pterostichus niger 0.4 n.s. - 0.0 n.s.
Carabus granulatus 0.3 n.s. - 0.4 n.s.
Clivina fossor 0.3 n.s. - 0.4 n.s.
Carabus auratus 0.1 n.s. - 0.4 n.s.

38
Fig. 3.1.1: Map of the investigated strips (black lines) in Schleswig-Holstein, northern
Germany.
300 m
Danmark
Lower
Saxony
Schleswig -
Holstein
Mecklenburg -
Vorpommern
Baltic
Sea
North Sea
Flensburg
Schleswig
Kie
l
Neumünster
Lübeck
Hamburg
Husum
Heide
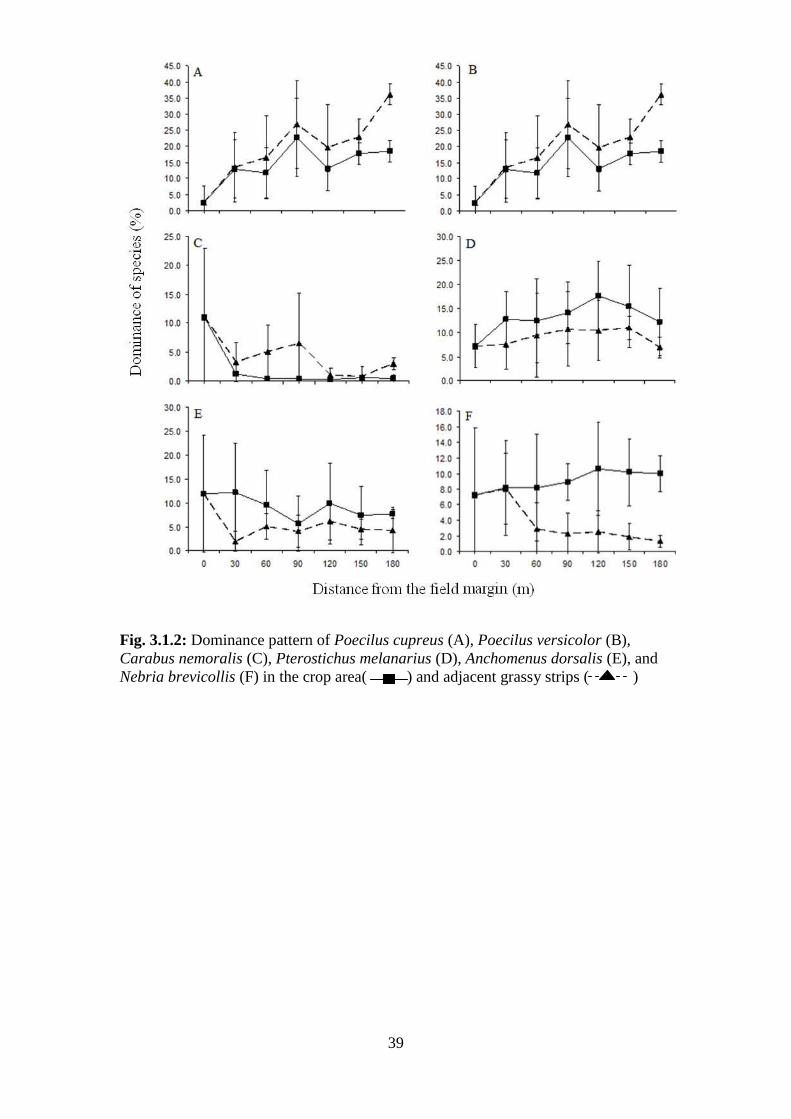
39
Fig. 3.1.2: Dominance pattern of Poecilus cupreus (A), Poecilus versicolor (B),
Carabus nemoralis (C), Pterostichus melanarius (D), Anchomenus dorsalis (E), and
Nebria brevicollis (F) in the crop area( ) and adjacent grassy strips ( )

40
Fig. 3.1.3: Dominance pattern of Amara similata (A), Carabus coriaceous (B),
Harpalus affinis (C), Pterostichus strenuus (D) in the crop area ( ) and adjacent
grassy strip ( )
Fig. 3.1.4: Mean number of differently-sized species in the three habitats with
standard error. Different exponents indicate significant difference according to nested
ANOVA.
small mean large very large
Size
0
1
2
3
4
5
6
7
8
9
10
Num
ber o
f spe
cies
Effect: F(8, 371) = 181, p < 0.001
Field Strip Margin
bca bcb
bc
ccc
dd
ee
-5 > 5 -10 > 10 -15 > 15
Size (mm)
small mean large very large
Size
0
1
2
3
4
5
6
7
8
9
10
Num
ber o
f spe
cies
Effect: F(8, 371) = 181, p < 0.001
Field Strip Margin
bca bcb
bc
ccc
dd
ee
small mean large very large
Size
0
1
2
3
4
5
6
7
8
9
10
Num
ber o
f spe
cies
Effect: F(8, 371) = 181, p < 0.001
Field Strip Margin
bca bcb
bc
ccc
dd
ee
-5 > 5 -10 > 10 -15 > 15
Size (mm)
41
Chapter 3 Results
3.2 Age of grassy strips influences biodiversity of ground beetles in
organic agro-ecosystemsb
Mazhar Ranjha1, Ulrich Irmler
2
1 Institute for Ecosystem Research, Dept. Applied Ecology, University of Kiel,
Olshausenstrasse 40, 24098 Kiel, Germany, email: [email protected], Tel.: +49
431 880 1101
2 Institute for Ecosystem Research, Dept. Applied Ecology, University of Kiel,
Olshausenstrasse 40, 24098 Kiel, Germany, email: [email protected], Tel.: +49
431 880 4311
Abstract The following investigations were conducted to evaluate grassy strips of different age
for organic arable fields. From September 2009 to October 2010, adult ground beetles
were sampled by pitfall traps in three grassy strips (2, 4, and 9 years old), their
adjacent cropping areas, their field edges, and a control field (age 0) in Schleswig-
Holstein, northern Germany. Carabid assemblages were similar among the fields,
strips and edges. Grassy strips and edges had higher species richness and lower
activity density than the control field. Activity density increased with increasing
distance from the field edge in grassy strips and in the adjacent fields. In cropping
areas, species richness and Shannon’s H increased with increasing age of strips,
whereas evenness and activity density decreased with increasing distance from the
field edges. Compared to carnivorous and phytophagous carbides, omnivorous species
were affected less by age of strips and distance from field margins. In the strips,
species richness of the dominant species increased with age and decreased with
distance, but the effect of strip age on species richness was still found in more than
150 m from the margin. A positive effect of the age of grassy strips on species
richness was found for cropping fields, grassy strips and field edges. Old grassy strips
also exerted greater influence on the species richness and biodiversity of the adjacent
arable fields than the younger strips.
b Published in Agricutural Sciences
42
3.2.1 Introduction The loss of biodiversity in Europe is mainly linked to the after-effects of the
intensification of agriculture and the removal of natural habitats [1]. In order to reduce
its drastic effects in the future, sustainable intensification of agriculture and the
conservation of the biodiversity are recommended for food security [2]. The natural
and semi-natural habitats adjacent to the arable fields are important sources of a
diverse fauna and support the colonization of arthropods when the fields are empty
after the harvest [3]. Among these habitats, grassy strips are considered to function as
corridors for dispersal [4], source of food [5], refuge during field work phases [6], and
overwinter sites for beneficial insects [7]. Their vegetation diversity supports the
insect diversity and density in the adjacent arable fields [8]. After destruction of these
habitats, large field areas demand their reconstruction for the invasion of predators
into the fields [4, 9].
Among the soil-dwelling predators, the ground beetles (Carabidae) are used as
biological indicators because of their diversity, well-known ecology and taxonomy,
sensitivity to biotic and abiotic factors, relevance at multiple spatial scales and their
ample collection without difficulty for analysis [10]. They consume weed seeds [11],
prey on pests [12], and have an integral position in the food web [13].
It has been found in many investigations that organic farming supports beneficial
insects [14]. For the conservational strategies and the biological control in organic
agriculture, the establishment or augmentation of semi-natural habitats are
recommended [15]. Several reports have shown the effect of distance from the natural
habitats on ground beetles [16, 17]. Most of the investigations on the positive effects
of grassy strips on carabids were executed under conventional agriculture. Recent
studies show that the carabid fauna under organic farming in arable field centres
resemble that of field margins [18]. Few investigations have been executed
concerning influence of age of grassy strips on biodiversity [35]. Therefore, this study
focuses on the combined effects of age and length of grassy strips as determining
factors on biodiversity of arable fields. Thus, the following questions should be
answered: (1) have grassy strips beneficial effects on carabids in organic farming? (2)
Does biodiversity change with the distance from field edges? (3) Do older grassy
strips support biodiversity better than the younger ones and (4) can we predict the
combined effects of age and distance on the species richness in grassy strips and
adjacent fields?

43
3.2.2 Material and Methods
3.2.2.1 Experimental area and sampling design
The following investigation was performed from September 2009 to October 2010 in
four organic arable fields: two in ‘Panten’ and two on the adjacent ‘Hof Ritzerau’,
Schleswig-Holstein, Northern Germany. The distance between the two locations was
approximately 1-3 km. The climate of the area is moderate with 685.5 mm rainfall
and 8.1 °C mean yearly temperature over a 30 year period. The soil type is sandy
loam [19].
Three of the selected fields had grassy strips and one was chosen to be the control
field. Two grassy strips, 2- and 4-years old, were in ‘Panten’ and the 9-year-old
grassy strip was in ‘Hof Ritzerau’. All the grassy strips were approximately 3 m wide
and established and managed in the same way during their development. The grassy
strips were established as “beetle banks” [4, 9], but grass vegetation dominated
already in the second year. Original seed mixture contained ten herb species and few
grass species, e.g., Hordeum vulgare L. However, already in the second year all strips
were dominated by the main grass species, i.e., Lolium perenne L., Poa trivialis L.,
and Elymus repens (L.) Gould. Both grass coverage and species richness ranged
between 60% - 70% and 50 - 60 species, respectively, and represented the typical
grassy vegetation in moderately moist sites of northern Germany [20]. All field edges
were characterized by woods or hedges and a grassy strip in front of them adjacent to
the field with the same vegetation as in the established grassy strips. Wheat crop was
sown in the fields.
Adjacent to each grassy strip, one cropping area (4- and 9-years old) or two cropping
areas (2-years old) were investigated. The definition “cropping area” was selected for
the arable field adjacent to the grassy strips to distinguish it from the control field
(without grassy strip). Adult ground beetles were collected by using pitfall traps: glass
jars, half filled with 90 % glycol and a surface tension reducing agent. The traps were
covered with transparent plastic plates elevated by two iron strips fixed into the soil to
protect the traps from rain and birds.
Three traps were installed on each field edge. Furthermore, two lines of pitfall traps
were installed: one in the arable field and one in the grassy strip. The traps of the two
lines were in 30 m distance intervals beginning from the field edges. In the control
field 50 m intervals were chosen due to the long distance between the field edges
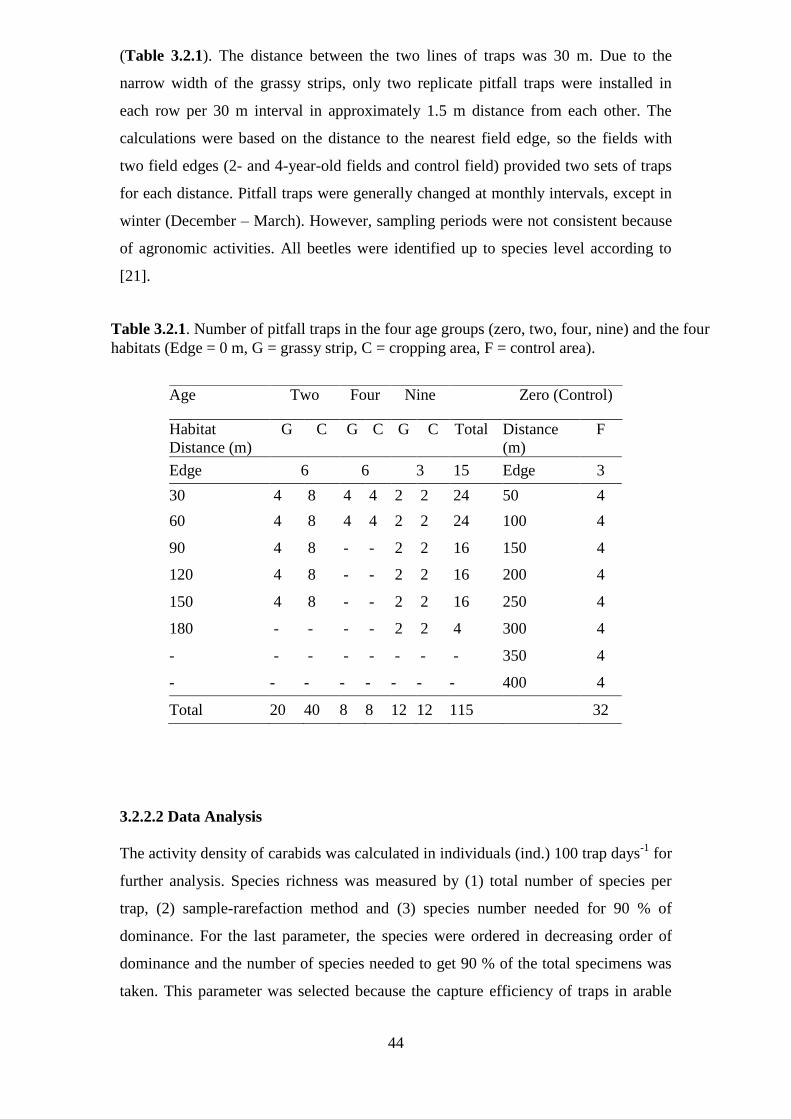
44
Table 3.2.1. Number of pitfall traps in the four age groups (zero, two, four, nine) and the four
habitats (Edge = 0 m, G = grassy strip, C = cropping area, F = control area).
(Table 3.2.1). The distance between the two lines of traps was 30 m. Due to the
narrow width of the grassy strips, only two replicate pitfall traps were installed in
each row per 30 m interval in approximately 1.5 m distance from each other. The
calculations were based on the distance to the nearest field edge, so the fields with
two field edges (2- and 4-year-old fields and control field) provided two sets of traps
for each distance. Pitfall traps were generally changed at monthly intervals, except in
winter (December – March). However, sampling periods were not consistent because
of agronomic activities. All beetles were identified up to species level according to
[21].
3.2.2.2 Data Analysis
The activity density of carabids was calculated in individuals (ind.) 100 trap days-1
for
further analysis. Species richness was measured by (1) total number of species per
trap, (2) sample-rarefaction method and (3) species number needed for 90 % of
dominance. For the last parameter, the species were ordered in decreasing order of
dominance and the number of species needed to get 90 % of the total specimens was
taken. This parameter was selected because the capture efficiency of traps in arable
Age Two Four Nine Zero (Control)
Habitat
Distance (m)
G C G C G C Total Distance
(m)
F
Edge 6 6 3 15 Edge 3
30 4 8 4 4 2 2 24 50 4
60 4 8 4 4 2 2 24 100 4
90 4 8 - - 2 2 16 150 4
120 4 8 - - 2 2 16 200 4
150 4 8 - - 2 2 16 250 4
180 - - - - 2 2 4 300 4
- - - - - - - - 350 4
- - - - - - - - 400 4
Total 20 40 8 8 12 12 115 32
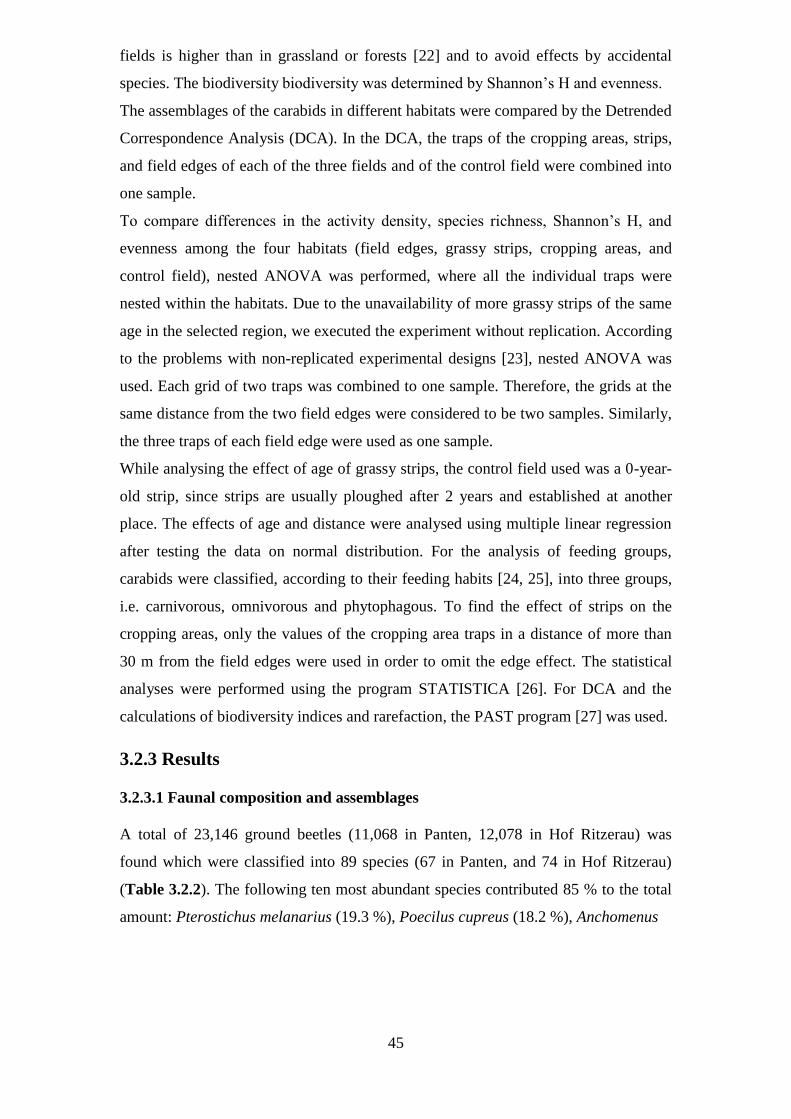
45
fields is higher than in grassland or forests [22] and to avoid effects by accidental
species. The biodiversity biodiversity was determined by Shannon’s H and evenness.
The assemblages of the carabids in different habitats were compared by the Detrended
Correspondence Analysis (DCA). In the DCA, the traps of the cropping areas, strips,
and field edges of each of the three fields and of the control field were combined into
one sample.
To compare differences in the activity density, species richness, Shannon’s H, and
evenness among the four habitats (field edges, grassy strips, cropping areas, and
control field), nested ANOVA was performed, where all the individual traps were
nested within the habitats. Due to the unavailability of more grassy strips of the same
age in the selected region, we executed the experiment without replication. According
to the problems with non-replicated experimental designs [23], nested ANOVA was
used. Each grid of two traps was combined to one sample. Therefore, the grids at the
same distance from the two field edges were considered to be two samples. Similarly,
the three traps of each field edge were used as one sample.
While analysing the effect of age of grassy strips, the control field used was a 0-year-
old strip, since strips are usually ploughed after 2 years and established at another
place. The effects of age and distance were analysed using multiple linear regression
after testing the data on normal distribution. For the analysis of feeding groups,
carabids were classified, according to their feeding habits [24, 25], into three groups,
i.e. carnivorous, omnivorous and phytophagous. To find the effect of strips on the
cropping areas, only the values of the cropping area traps in a distance of more than
30 m from the field edges were used in order to omit the edge effect. The statistical
analyses were performed using the program STATISTICA [26]. For DCA and the
calculations of biodiversity indices and rarefaction, the PAST program [27] was used.
3.2.3 Results
3.2.3.1 Faunal composition and assemblages
A total of 23,146 ground beetles (11,068 in Panten, 12,078 in Hof Ritzerau) was
found which were classified into 89 species (67 in Panten, and 74 in Hof Ritzerau)
(Table 3.2.2). The following ten most abundant species contributed 85 % to the total
amount: Pterostichus melanarius (19.3 %), Poecilus cupreus (18.2 %), Anchomenus

46
Table 3.2.2. Total activity density of the carabids in the four habitats and the age classes of the grassy strips (0
indicates the control field, 2, 4 and 9 the age (years) of the strips); feedings habits (Feed. habit): C =
carnivorous, O = omnivorous, P = Phytophagous; a given in Apendix 1
dorsalis (10.8 %), Bembidion lampros (6.4 %), Harpalus affinis (6.2 %),
Pseudoophonus rufipes (5.7 %), Nebria brevicollis (5.3 %), Carabus auratus (4.8 %),
Bembidion tetracolum (4.5 %), and Trechus quadristriatus (3.8 %). In the control
field, field edges, grassy strips, and adjacent cropping areas, 51, 57, 62, and 63
species, respectively, were found. Classification on feeding habits showed the
following order: carnivorous (45 species) > phytophagous (20 species) > omnivorous
(7 species).
The four habitats were weakly separated according to the Detrended Correspondence
Analysis with an eigenvalue of 0.33 on the first axis (Figure 3.2.1). The lowest
similarity was shown between the edge site of the 9-year-old strip and the control
field, although they both were located on Ritzerau farm. Strips and cropping areas
formed no separate clusters, but cropping sites exhibited a stronger similarity than
strip sites.
Habitat Feed.
habit
Field edges Grassy strips Cropping areas Total
Species / Age 0 2 4 9 2 4 9 0 2 4 9
Pterostichus melanarius C 39 38 8 11 320 6 96 2330 1362 38 215 4463
Poecilus cupreus O 16 2 9 4 349 9 490 1688 1111 52 482 4212
Anchomenus dorsalis C 16 82 2 16 104 6 76 1176 715 185 120 2498
Bembidion lampros C 6 11 7 . 212 8 55 242 662 164 120 1487
Harpalus affinis O 14 17 7 6 205 11 160 473 257 87 210 1447
Pseudoophonus rufipes O 14 47 24 2 139 40 17 74 814 129 21 1321
Nebria brevicollis C 32 46 9 . 69 19 35 58 703 32 223 1226
Carabus auratus C . 12 28 1 118 109 48 18 646 71 65 1116
Bembidion tetracolum C 14
2
14 . 7 29 14 55 561 110 10 103 1045
Trechus quadristriatus C 33 7 6 35 14 19 63 200 91 132 271 871
Poecilus versicolor C 4 2 4 5 58 2 227 5 270 7 75 659
Amara similata O 1 1 . 4 218 4 9 232 21 34 30 554
Agonum muelleri C 14 . 2 1 6 2 17 259 26 3 98 428
Carabus nemoralis O 7 5 38 16 4 25 83 10 33 3 16 240
Calathus fuscipes C . 5 . 0 15 . 3 51 89 5 3 171
Clivina fossor C . . 7 0 19 14 3 31 29 30 12 145
Amara aenea P . 5 1 1 18 . 32 10 14 6 37 124
Amara familiaris P . 3 2 1 60 . 5 3 21 22 5 122
Bembidion properans C 1 . . . . . 25 42 1 3 42 114
Carabus granulatus C 3 4 . . 7 2 10 9 56 7 2 100
Other species (69)a 22 33 17 72 49 31 69 251 126 46 81 803
Total (89) 36
4
340 171 182 201
3
321 1578 7723 7157 1066 2231 23146

47
Fig. 3.2.1: The first two axes of the Detrended Correspondence Analysis show four habitats (control,
grassy strips, cropping areas, and field edges). Suffix 2, 4 and 9 with strip, field edge and crop refers to
the habitats related to the 2-, 4-, and 9-year-old grassy strips.
Activity density was the highest in the control field for all carabids, carnivorous, and
omnivorous species, but it was the highest in the grassy strips for the phytophagous
species (Table 3.2.3). In general, the lowest activity density was found in field edges.
Species richness, determined as the number of species per trap, was also the lowest in
the field edges, whereas it was also lowest in grassy strips for carnivorous species.
However, phytophagous species showed the lowest species richness in the control
field. In contrast to species richness, diversity determined by Shannon’s H was the
highest in the field edges or the grassy strips. Evenness was the lowest in the control
area, except for phytophagous species.
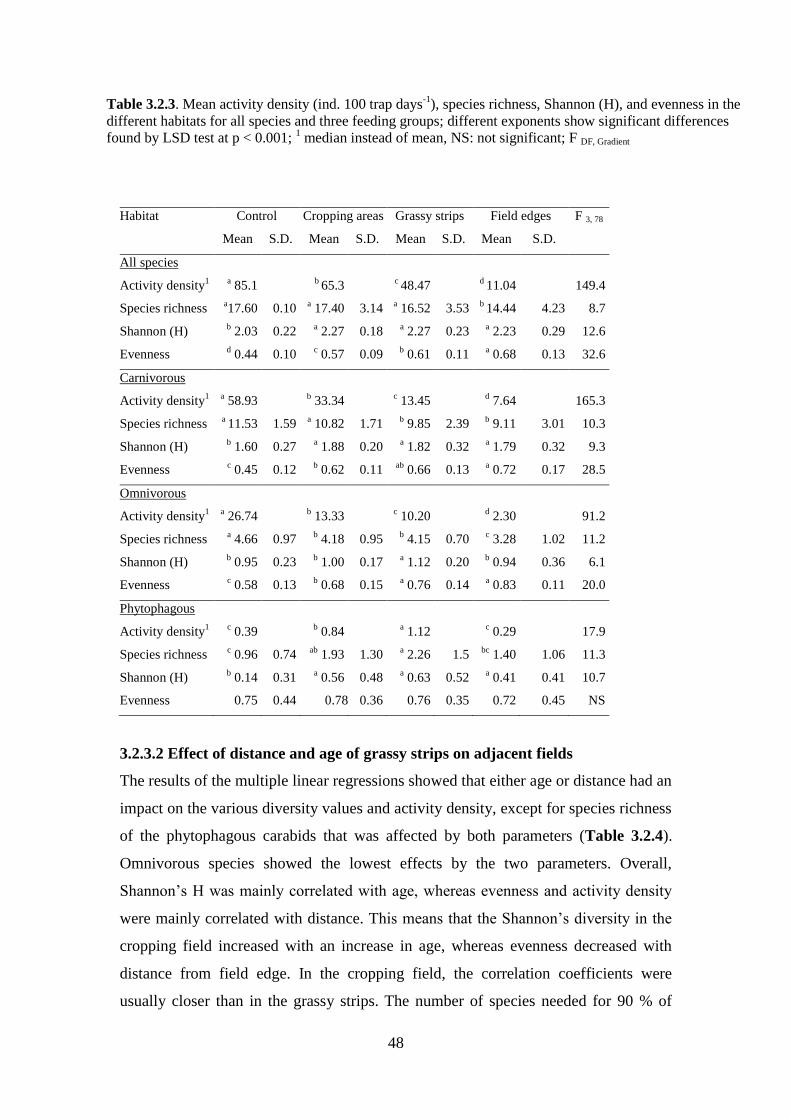
48
Table 3.2.3. Mean activity density (ind. 100 trap days-1
), species richness, Shannon (H), and evenness in the
different habitats for all species and three feeding groups; different exponents show significant differences
found by LSD test at p < 0.001; 1 median instead of mean, NS: not significant; F DF, Gradient
3.2.3.2 Effect of distance and age of grassy strips on adjacent fields
The results of the multiple linear regressions showed that either age or distance had an
impact on the various diversity values and activity density, except for species richness
of the phytophagous carabids that was affected by both parameters (Table 3.2.4).
Omnivorous species showed the lowest effects by the two parameters. Overall,
Shannon’s H was mainly correlated with age, whereas evenness and activity density
were mainly correlated with distance. This means that the Shannon’s diversity in the
cropping field increased with an increase in age, whereas evenness decreased with
distance from field edge. In the cropping field, the correlation coefficients were
usually closer than in the grassy strips. The number of species needed for 90 % of
Habitat Control Cropping areas Grassy strips Field edges F 3, 78
Mean S.D. Mean S.D. Mean S.D. Mean S.D.
All species
Activity density1 a
85.1 b 65.3
c 48.47
d 11.04 149.4
Species richness a17.60 0.10
a 17.40 3.14
a 16.52 3.53
b 14.44 4.23 8.7
Shannon (H) b 2.03 0.22
a 2.27 0.18
a 2.27 0.23
a 2.23 0.29 12.6
Evenness d 0.44 0.10
c 0.57 0.09
b 0.61 0.11
a 0.68 0.13 32.6
Carnivorous
Activity density1 a
58.93 b 33.34
c 13.45
d 7.64 165.3
Species richness a 11.53 1.59
a 10.82 1.71
b 9.85 2.39
b 9.11 3.01 10.3
Shannon (H) b 1.60 0.27
a 1.88 0.20
a 1.82 0.32
a 1.79 0.32 9.3
Evenness c 0.45 0.12
b 0.62 0.11
ab 0.66 0.13
a 0.72 0.17 28.5
Omnivorous
Activity density1 a
26.74 b 13.33
c 10.20
d 2.30 91.2
Species richness a 4.66 0.97
b 4.18 0.95
b 4.15 0.70
c 3.28 1.02 11.2
Shannon (H) b 0.95 0.23
b 1.00 0.17
a 1.12 0.20
b 0.94 0.36 6.1
Evenness c 0.58 0.13
b 0.68 0.15
a 0.76 0.14
a 0.83 0.11 20.0
Phytophagous
Activity density1 c
0.39 b 0.84
a 1.12
c 0.29 17.9
Species richness c 0.96 0.74
ab 1.93 1.30
a 2.26 1.5
bc 1.40 1.06 11.3
Shannon (H) b 0.14 0.31
a 0.56 0.48
a 0.63 0.52
a 0.41 0.41 10.7
Evenness 0.75 0.44 0.78 0.36 0.76 0.35 0.72 0.45 NS
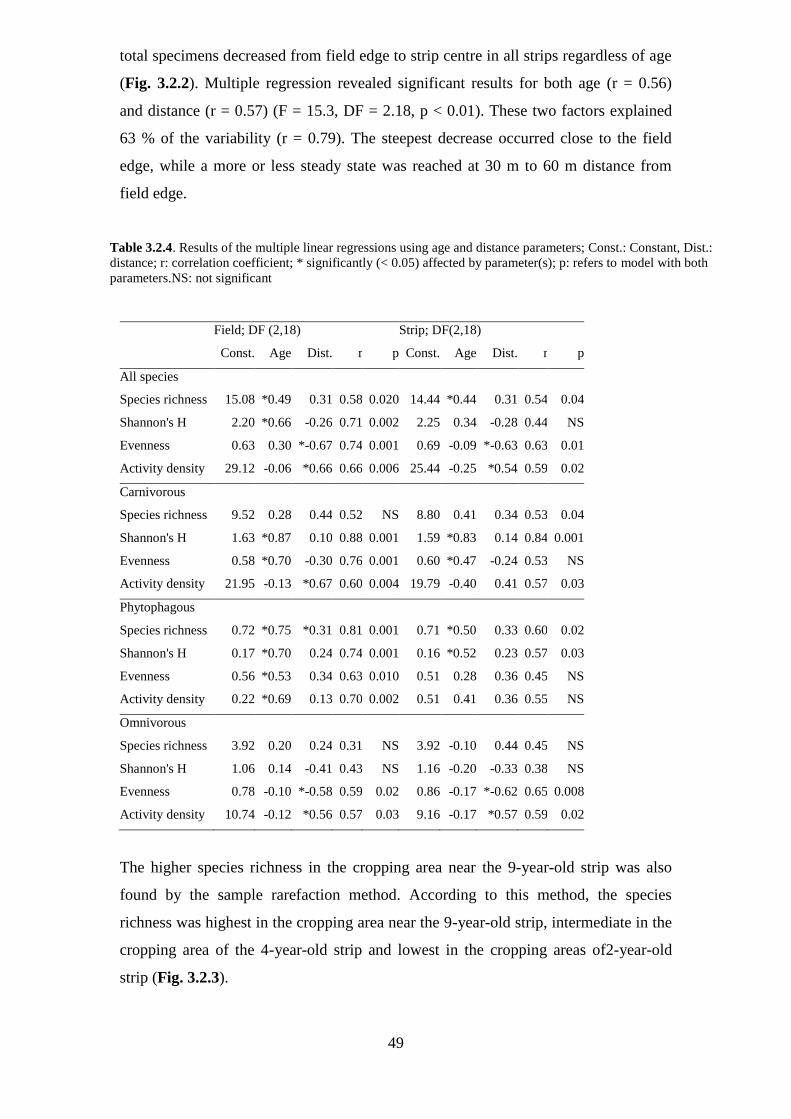
49
Table 3.2.4. Results of the multiple linear regressions using age and distance parameters; Const.: Constant, Dist.:
distance; r: correlation coefficient; * significantly (< 0.05) affected by parameter(s); p: refers to model with both
parameters.NS: not significant
total specimens decreased from field edge to strip centre in all strips regardless of age
(Fig. 3.2.2). Multiple regression revealed significant results for both age (r = 0.56)
and distance (r = 0.57) (F = 15.3, DF = 2.18, p < 0.01). These two factors explained
63 % of the variability (r = 0.79). The steepest decrease occurred close to the field
edge, while a more or less steady state was reached at 30 m to 60 m distance from
field edge.
Field; DF (2,18) Strip; DF(2,18)
Const. Age Dist. r p Const. Age Dist. r p
All species
Species richness 15.08 *0.49 0.31 0.58 0.020 14.44 *0.44 0.31 0.54 0.04
Shannon's H 2.20 *0.66 -0.26 0.71 0.002 2.25 0.34 -0.28 0.44 NS
Evenness 0.63 0.30 *-0.67 0.74 0.001 0.69 -0.09 *-0.63 0.63 0.01
Activity density 29.12 -0.06 *0.66 0.66 0.006 25.44 -0.25 *0.54 0.59 0.02
Carnivorous
Species richness 9.52 0.28 0.44 0.52 NS 8.80 0.41 0.34 0.53 0.04
Shannon's H 1.63 *0.87 0.10 0.88 0.001 1.59 *0.83 0.14 0.84 0.001
Evenness 0.58 *0.70 -0.30 0.76 0.001 0.60 *0.47 -0.24 0.53 NS
Activity density 21.95 -0.13 *0.67 0.60 0.004 19.79 -0.40 0.41 0.57 0.03
Phytophagous
Species richness 0.72 *0.75 *0.31 0.81 0.001 0.71 *0.50 0.33 0.60 0.02
Shannon's H 0.17 *0.70 0.24 0.74 0.001 0.16 *0.52 0.23 0.57 0.03
Evenness 0.56 *0.53 0.34 0.63 0.010 0.51 0.28 0.36 0.45 NS
Activity density 0.22 *0.69 0.13 0.70 0.002 0.51 0.41 0.36 0.55 NS
Omnivorous
Species richness 3.92 0.20 0.24 0.31 NS 3.92 -0.10 0.44 0.45 NS
Shannon's H 1.06 0.14 -0.41 0.43 NS 1.16 -0.20 -0.33 0.38 NS
Evenness 0.78 -0.10 *-0.58 0.59 0.02 0.86 -0.17 *-0.62 0.65 0.008
Activity density 10.74 -0.12 *0.56 0.57 0.03 9.16 -0.17 *0.57 0.59 0.02
The higher species richness in the cropping area near the 9-year-old strip was also
found by the sample rarefaction method. According to this method, the species
richness was highest in the cropping area near the 9-year-old strip, intermediate in the
cropping area of the 4-year-old strip and lowest in the cropping areas of2-year-old
strip (Fig. 3.2.3).

50
Fig. 3.2.2: Number of species needed for 90 % of total specimens in strips in relation to strip age and distance from the field edge.
Fig. 3.2.3: Number of species that account for at least 90 % dominance (A) and species
richness of sample rarefaction on crop areas near grassy strips of different ages (B).
0 2 4 6 8 10Age (years)
8
9
10
11
12
13
14
15
16
17
18
Spec
ies
for
90
% o
fto
tal
spec
imen
s(n
)
Edge (r = 0.99, p = 0.007)Strip (r = 0.96, p = 0.04)Crop area (r = 0.97, p = 0.03)
AB
51
Table 3.2.5. Mean activity density (ind. 100 trap days-1), species richness, Shannon (H), and evenness for all species and the three feeding groups in the central cropping areas; different exponents show significant differences found by LSD test; NS: not significant; * significant at p < 0.05, ** at p < 0.01,and *** at p < 0.001; F DF, Gradient
Using the 90 % level of species richness, significant correlations were also exhibited
for cropping areas (Figure 3.2.3).
The number of dominant species in the cropping areas increased with increasing age
of strips. Cropping areas adjacent to the 9-year-old strip had on average three species
more than the control field representing age 0 in the succession. In the control field,
the difference between field and edge was small, with 2 species on average, but
difference increased with increasing age. If the 30 m distance traps were omitted to
focus on the effect of the strips on the cropping areas, the activity density showed no
difference among the three cropping areas for all carabids, carnivorous, and
omnivorous species except the phytophagous carabids with higher activity density in
the cropping areas near the 4- and 9-year-old strips than in the 2-year-old strip (Table
5).
Age Two Four Nine
Mean S.D. Mean S.D. Mean S.D. F 2, 23
All species
Activity density1 51.7 39.8 69.3 NS
Species richness a 17.60 0.10 a 17.40 3.14 a 16.52 3.53 **8.06
Shannon (H) b 2.20 0.16 a 2.41 0.18 a 2.47 0.17 ***10.84
Evenness 0.55 0.10 0.59 0.05 0.09 0.11 NS
Carnivorous
Activity density1 36.00 26.25 47.23 NS
Species richness 10.94 1.62 12.00 0.82 11.20 0.95 NS
Shannon (H) b 1.83 0.17 ab 1.95 0.23 a 2.11 0.13 **10.39
Evenness b 0.59 0.10 ab 0.60 0.12 a 0.71 0.07 **6.76
Omnivorous
Activity density1 14.7 13.3 19.65 NS
Species richness b 3.9 0.82 ab 4.00 0.82 a 4.90 1.2 *4.40
Shannon (H) 0.96 0.16 1.08 0.23 0.99 0.16 NS
Evenness 0.70 0.16 0.75 0.10 0.59 0.14 NS
Phytophagous
Activity density1 b 0.67 a 1.40 a 1.71 ***20.82
Species richness b 1.69 1.33 ab 2.50 1.29 a 3.20 0.92 **6.97
Shannon (H) b 0.48 0.51 ab 0.66 0.51 a 0.96 0.35 *4.68
Evenness 0.76 0.41 0.88 0.12 0.85 0.11 NS

52
For omnivorous and phytophagous carabid species, species richness exhibited
significantly higher values in the cropping area near the 9-year-old strip than in the
two other areas. A similar pattern was found when the diversity was determined by
Shannon’s H. The cropping area near the 9- or 4-year-old strip revealed higher values
than the cropping area near the 2-year-old strip. This was true for all carabids,
carnivorous, and phytophagous species, whereas Shannon’s H for the omnivorous
species was equal in all three cropping areas. The results for evenness were mostly
insignificant. Only carnivorous species had lower evenness in the cropping area near
the 2-year-old strip than that near the 9-year-old strip.
3.2.4 Discussion In the Detrended Correspondence Analysis, very low eigenvalues depict a close
similarity in the species composition of the different habitats. The close relationships
among carabid assemblages of arable fields were already stressed [28, 29]. In our
study, even the similarity between field edges and arable fields was high. The highest
differences along the first canonical axis were found between the control field and the
field edges. The organic practices are an explanation for this high similarity. After a
six year period of organic farming, [18] found that the species diversity of field
centres resembles that of field edges. They also emphasised that the number of species
occurring only in field edges under conventional farming increases in field centres of
organic arable fields.
We found higher activity densities in arable fields than in the grassy strips, as
documented in many studies [e.g., 30, 31]. However, higher activity densities were
also reported for grassy structures or flower strips in comparison to arable fields [11,
32]. The higher activity density of the control field and the cropping areas may be due
to the open ground surface. When compared to grassland or forests, a significantly
higher mobility of species is found in arable fields [22]. The higher activity density in
the arable fields in comparison to the field edges or grassy strips is, therefore,
contributed to the greater mobility of species and not to their higher population
density. Since the ratio between density and activity of species is undetermined for the
different habitats, it is assumed that activity density is not an efficient factor for
evaluating the ecological processes.
The lowest biodiversity was measured in the control field. Higher diversities were
found in the field edges and the grassy strips, which illustrate that carabids benefit
from undisturbed habitats even under organic practices. Their higher biodiversity can

53
be contributed to the stable and diverse environment and better food availability [5,
33, 34].
Our findings that species richness and diversity increased with the age of strips are
supported in some other investigations [7, 35, 36]. However, it must be taken into
account that local conditions and the number of accidental species can produce a high
variability. The significant increase of the dominant species with age of the grassy
strips points out the general importance of age for the biodiversity of the habitats
investigated. In particular, carnivorous species benefit from older grassy strips. The
importance of older field margins for the predatory fauna is shown by a better
predator-prey ratio and parasitism than in younger margins [37]; the younger habitats
have shorter food chains and simpler food-webs than the older habitats [16].
Field edges play an important role in the overall biodiversity of arable fields. In our
investigation, species richness of the most dominant species (accumulated 90% of
specimens) in grassy strips increased with an increase in age and decreased with
increasing distance from the field edge. In contrast, activity density increased in both
cropping areas and grassy strips with increasing distance from the field margin.
No significant decline was seen in the species richness of carabids with an increase in
distance from the boundary hedge [38]. However, in another study species richness
decreased with increasing distance from the field margin, whereas activity density
showed no change at the distances of 30 m and 250 m [39]. They [39] could not find
significant differences of species richness between the fields with and without strips at
different distances, whereas the results of [40] documented increasing arthropod
diversities from the cropping areas to the near hedge cropping area and strip in
intensively managed arable fields. According to [16], the population of the arthropods
decreases with increasing distance from grassy strips. The effect of distance can be
based on the size of the species; the activity density of small carabids decreased,
while that of large carabids increased from the field margins [41]. Although the
overall results are contradictory, the arthropod diversity decreases from the field edge
to the field centre in many investigations. The significant differences in the abundance
of the carabids at different distances were also related to the prey availability [42].
Our findings that older grassy strips promote species richness in adjacent arable fields
are supported by [43], who found a higher species richness in the cereals between the
weed strips than inside the arable field without weed strips. In contrast to [43], our
investigation revealed no significant influence of the grassy strips on the overall
activity density in the adjacent field. The grassy strips have no influence on the
population of the macro-fauna in the nearby fields [38], whereas [39] documented an
54
increase in the abundance of the carabids in the arable fields near grassy field
margins. The positive effect of grassy strips on the biodiversity in arable fields has
been documented in many studies [8, 17, 30]. The landscapes with large areas of
grassland increase diversity of carabids in soybean fields [44]. The close relationship
between landscape and the biodiversity of farmland was also stressed [45]. Our results
concerning the significant correlation between age of grassy strips and the species
richness in field edges indicate that not only the arable fields benefit from old grassy
strips, but also the adjacent semi-natural habitats.
3.2.5 Acknowledgement We are thankful to the owners and managers of farm Lämmerhof in Panten, Detlef
Hack and Ute Thode, and the farm Ritzerauhof, Günther Fielmann, to get the
permission for the investigation. Additionally we thank the Higher Education
Commission of Pakistan for financial assistance.
3.2.6 References [1] R. J. Krebs, J. D. Wilson, R. B. Bradbury and G. M. Siriwardena, “The Second
Silent Spring?,” Nature, Vol. 400, 1999, pp. 611–612. doi: 10.1038/23127
[2] R. E. Green, S. J. Cornell, J. P. W. Scharlemann and A. Balmford, “Farming and
the Fate of Wild Nature,” Science, Vol. 307, No. 5709, 2005, pp. 550-555. doi:
10.1126/science.1106049
[3] T. Tscharntke and A. Kruess, “Habitat Fragmentation and Biological Control,”
In: B. A. Hawkins and H. V. Cornell, Ed., Theoretical Approaches to Biological
Control, Cambridge University Press, Cambridge, 1999, pp. 190-205.
[4] M. B. Thomas, S. D. Wratten and N. W. Sotherton, “Creation of 'Island' Habitats
in Farmland to Manipulate Populations of Beneficial Arthropods: Predator
Densities and Emigration,” Journal of Applied Ecology, Vol. 28, No. 3, 1991, pp.
906–917.
[5] R. Bommarco, “Reproduction and Energy Reserves of a Predatory Carabid Beetle
Relative to Agroecosystem Complexity,” Ecological Applications, Vol. 8, No. 3,
1998, pp. 846–853.
[6] E. J. Asteraki, C. B. Hank and R. O. Clements, “The Influence of Different Types
of Grassland Field Margin on Carabid Beetle (Coleoptera, Carabidae)
Communities,” Agriculture, Ecosystems and Environment, Vol. 54, No. 3, 1995,
pp. 195–202. doi: 10.1016/0167-8809(95)00596-K

55
[7] T. Frank and B. Reichhart, “Staphylinidae and Carabidae Overwintering in Wheat
and Sown Wildflower Areas of Different Age,” Bulletin of Entomological
Research, Vol. 94, No. 3, 2004, pp. 209–217. doi: 10.1079/BER2004301
[8] J. M. Varchola and J.P. Dunn, “ Influence of Hedgerow and Grassy Field Borders
on Ground Beetle (Coleoptera: Carabidae) Activity in Fields of Corn,”
Agriculture, Ecosystems and Environment, Vol. 83, No. 1-2, 2001, pp. 153–163.
doi: 10.1016/S0167-8809(00)00249-8
[9] M. B. Thomas, S. D. Wratten and N. W. Sotherton, “Creation of `Island' Habitats
in Farmland to Manipulate Populations of Beneficial Arthropods: Predator
Densities and Species Composition,” Journal of Applied Ecology, Vol. 29, No. 2,
1992, pp. 524-531.
[10] M. Koivula, “Useful Model Organisms, Indicators, or Both? Ground Beetles
(Coleoptera, Carabidae) Reflecting Environmental Conditions,” ZooKeys, Vol.
100, 2011, pp. 287–317. doi: 10.3897/zookeys.100.1533
[11] H. R. Gaines and C. Gratton, “Seed Predation Increases With Ground Beetle
Diversity in a Wisconsin (USA) Potato Agroecosystem,” Agriculture, Ecosystems
and Environment, Vol. 137, No. 3-4, 2010, pp. 329-336. doi:
10.1016/j.agee.2010.03.003
[12] D. A. Bohan, A. C. Bohan, D. M. Glen, W. O. C. Symondson, C. W. Wiltshire
and L. Hughes, “Spatial Dynamics of Predation by Carabid Beetles on Slugs,”
Journal of Animal Ecology, Vol. 69, No. 3, 2000, pp. 367-379.
doi: 10.1046/j.1365-2656.2000.00399.x
[13] H. -U. Thiele, “Carabid Beetles in Their Environments: A Study on Habitat
Selection by Adaptations in Physiology and Behaviour,” Berlin-Heidelberg-
New York, Springer-Verlag, 1977.
[14] J. Bengtsson, J. Ahnström and A. Weibull, “The Effects of Organic Agriculture
on Biodiversity and Abundance: A Meta-analysis,” Journal of Applied Ecology,
Vol. 42, No. 2, 2005, pp. 261–269. doi: 0.1111/j.1365-2664.2005.01005.x
[15] G. Zehnder, G. M. Gurr, S. Kühne, M. R. Wade, S. D. Wratten and E. Wyss,
“Arthropod Pest Management in Organic Crops,” Annual Review of Entomology,
Vol. 52, 2007, pp. 57-80. doi: 10.1146/annurev.ento.52.110405.091337
[16] C. Denys and T. Tscharntke, “Plant-insect Communities and Predator-prey
Ratios in Field Margin Strips, Adjacent Crop Fields, and Fallows,” Oecologia,
Vol. 130, No. 2, 2002, pp. 315–324. doi:10.1007/s004420100796
[17] J. Kiss, F. Kádár, E. Kozma and I. Tóth, “Importance of Various Habitats in
Agricultural Landscape Related to Integrated Pest Management: A Preliminary
56
Study,” Landscape Urban Plan, Vol. 27, No. 2-4, 1993, pp. 191-198. doi:
10.1016/0169-2046(93)90049-J
[18] L. Schröter and U. Irmler (2013). Organic Cultivation Reduces Barrier Effect of
Arable Fields on Species Diversity,” Agriculture, Ecosystems and Environment,
Vol. 164, No. 1, 2013, pp. 176-180. doi: 10.1016/j.agee.2012.09.018
[19] S. Reiss, H. –R. Bork, U. Hoernes, A. Rinker and A. Mitusov, “Die Verbreitung
der Böden auf den Ackerflächen von Hof Ritzerau,” Fauistisch-Ökologische
Mitteilungen, Supplement 35, 2008, pp. 59-73.
[20] V. H. Roweck, “Die Aktuelle und potenzielle Floristische Diversität der
Feldfluren auf Hof Ritzerau,” Fauistisch-Ökologische Mitteilungen, Supplement
35, 2008, pp. 103-122.
[21] G. –M. Müller, “Adephaga I Carabidae (Laufkäfer),” In: H. Freude, K. W.
Harde, G. A. Lohse and B. Klausnitzer (Hrsg): Die Käfer Mitteleuropas. Elsevier,
München, 2004.
[22] H. Wallin and B. S. Ekbom, “Movements of Carabid Beetles (Coleoptera:
Carabidae) Inhabiting Cereal Fields: A Field Tracing Study,” Ecologia, Vol. 77,
No. 1, 1988, pp. 39–43.
[23] S. H. Hurlbert, “Pseudoreplication and the Design of Ecological Field
Experiments,” Ecolgical Monographs, Vol. 54, No. 2, 1984, 187-211.
[24] C. H. Lindroth, “The Ground-beetles (Carabidae) of Fennoscandia. A
zoogeographic Study. Part I. Specific Knowledge Regarding the Species,”
Amerind Publishing, New Delhi, 1992.
[25] D. J. Warner, L. J. Allen-Williams, S. Warrington, A. W. Ferguson and I. H.
Williams, “Implications for Conservation Biocontrol of Spatio-temporal
Relationships Between Carabid Beetles and Coleopterous Pests in Winter Oilseed
Rape,” Agricultural and forest Entomology, Vol. 10, No. 4, 2008, pp. 375-387.
doi: 10.1111/j.1461-9563.2008.00391.x
[26] StatSoft, Inc. STATISTICA for Windows [Software-System for Data analysis]
Version 6, 2004. http://www.statsoft.com
[27] Ø. Hammer, D. A. T. Harper and P. D. Ryan, “PAST: Paleontological Statistics
software Package for Education and Data Analysis. Palaeont Electronica, Vol. 4,
No. 1, 2001, pp. 1-9. http://folk.uio.no/ohammer/past/
[28] U. Irmler, “The Spatial and Temporal Pattern of Carabid beetles on Arable Fields
in Northern Germany (Schleswig-Holstein) and Their Value as Ecological
Indicators,” Agriculture, Ecosystem and Environment, Vol. 98, No. 1-3, 2003, pp.
141-151. doihttp://dx.doi/: 10.1016/S0167-8809(03)00076-8
57
[29] A. Weibull, Ö. Östman and Å. Granqvist, “Species Richness in Agroecosystems:
The Effect of Landscape, Habitat and Farm Management,” Biodiversity and
Conservation, Vol. 12, 2003, pp. 1335-1355.
[30] B. Kromp and K. Steinberger, “Grassy Field Margins and Arthropod Diversity:
A Case Study on Ground Beetles and Spiders in Eastern Austria (Coleoptera:
Carabidae; Arachnida: Aranei, Opiliones),” Agriculture, Ecosystem and
Environment, Vol. 40, No. 1-4, 1992, pp. 71-93. doi: 10.1016/0167-
8809(92)90085-P
[31] P. Saska, M. Vodde, T. Heijerman, P. Westerman and W. van der Werf, “The
Significance of a Grassy Field Boundary for the Spatial Distribution of Carabids
Within Two Cereal Fields,” Agriculture, Ecosystem and Environment, Vol. 122,
No. 4, 2007, pp. 427-434. doi: 10.1016/j.agee.2007.02.013
[32] J. -A. Lys, “The Positive Influence of Strip-management on Ground Beetles in a
Cereal Field: Increase, Migration and Overwintering,” In: K. Desender, M.
Dufrene, M. Loreau, M. L. Luff and J. P. Maelfait, Ed., Carabid Beetles: Ecology
and Evolution, Kluwer Academic Publishers, Dordrecht, Boston, London, 1994,
pp. 451-455.
[33] T. S. van Dijk, “On the Relationship Between Food, Reproduction and Survival
of Two Carabid Beetles: Calathus melanocephalus and Pterostichus versicolor,”
Ecoogical Entomology, Vol. 19, No. 3, 1994, pp. 263-270. doi: 10.1111/j.1365-
2311.1994.tb00418.x
[34] T. Frank, P. Kehrli and C. Germann, “Density and Nutritional Condition of
Carabid Beetles in Wildflower Areas of Different Age,” Agriculture, Ecosystem
and Environment, Vol. 120, 2007, pp. 377-383.
[35] D. M. Olson and F. L. Wäckers, “Management of Field Margins to Maximize
Multiple Ecological Services,” Journal of Applied Ecology, Vol. 44, No. 1, 2007,
pp. 13-21. doi: 10.1111/j.1365-2664.2006.01241.x
[36] J. Salamon, J. Wissuwa, S. Jagos, M. Koblmüller, O. Ozinger, C. Winkler and T.
Frank, “Plant Species Effects on Soil Macrofauna Density in Grassy Arable
Fallows of Different Age,” European Journal of Soil Biology, Vol. 47, 2011, pp.
129-137. doi:10.1016/j.ejsobi.2011.01.004
[37] C. Thies and T. Tscharntke, “Landscape Structure and Biological Control in
Agroecosystems,” Science, Vol. 285, No. 5429, 1999, pp. 893-895.
doi: 10.1126/science.285.5429.893
[38] J. Smith, S. Potts and P. Eggleton, “The Value of Sown Grass Margins for
Enhancing Soil Macrofaunal Biodiversity in Arable systems,” Agriculture,
58
Ecosystem and Environment, Vol. 27, No. 1-2, 2008, pp. 119-125. doi:
10.1016/j.agee.2008.03.008
[39] A. R. Hof and P. W. Bright, “The Impact of Grassy Field Margins on Macro-
invertebrate Abundance in Adjacent Arable Fields,” Agriculture, Ecosystem and
Environment, Vol. 139, 2010, pp. 280-283. doi:10.1016/j.agee.2010.08.014
[40] C. F. G. Thomas and E. J. P. Marshall, “Arthropod Abundance and Diversity in
Differently Vegetated Margins of Arable Fields,” Agriculture, Ecosystem and
Environment, Vol. 72, No. 2-4, 1999, pp. 131-144. doi: 10.1016/S0167-
8809(98)00169-8
[41] M. D. Eyre, D. Labanowska-Bury, R. White and C. Leifert, “Relationships
Between Beneficial Invertebrates, Field Margin Vegetation, and Thrip Damage in
Organic Leek Fields in Eastern England,” Organic Agriculture, Vol. 1, No. 1,
2011, pp. 45-54. doi: 10.1007/s13165-010-0004-x
[42] K. L. Collins, N. D. Boatman, A. Wilcox, J. M. Holland and K. Chaney,
“Influence of Beetle Banks on Cereal Aphid Predation in Winter Wheat,”
Agriculture, Ecosystem and Environment, Vol. 93, No. 1-3, 2002, pp. 337-350.
doi: 10.1016/S0167-8809(01)00340-1
[43] J. –A. Lys, M. Zimmermann and W. Nentwig, “Increase in Activity and Species
Number of Carabid Beetles in Cereals as a Result of Strip-management,”
Entomologia Experimentalis et Applicata, Vol. 73, No. 1, 1994, pp. 1–9. doi:
10.1111/j.1570-7458.1994.tb01833.x
[44] M. M. Gardiner, D. A. Landis, C. Gratton, N. Schmidt, M. O’Neal, E. Mueller, J.
Chacon and G. E. Heimpel, “Landscape Composition Influences the Activity
Density of Carabidae and Arachnida in Soybean Fields,” Biological Control, Vol.
55, No. 1, 2010, pp. 11-19. doi: 10.1016/j.biocontrol.2010.06.008
[45] T. Purtauf, I. Roschewitz, J. Dauber, C. Thies, T. Tscharntke and V. Wolters,
“Landscape Context of Organic and Conventional Farms: Influences on Carabid
Beetle Diversity,” Agriculture, Ecosystems and Environment, Vol. 108, No. 2,
2005, pp. 165–174. doi: 10.1016/j.agee.2005.01.005
59
submitted in the Journal of Insect Conservation
Chapter 3 Results
3.3 Movement of carabids from grassy strips to crop land in organic
agriculture
Mazhar Ranjha and Ulrich Irmler
Institute for Ecosystem Research, Dept. Applied Ecology, University of Kiel,
Olshausenstrasse 40, 24098 Kiel, Germany
Email: [email protected]
Email: [email protected]
Abstract 1.1. The colonization of carabid beetles from grassy strips to crop fields under organic
agricultural practices was investigated in 2010 and 2011 in northern Germany.
Displacement and speed of Pterostichus melanarius, Carabus auratus and Poecilus
spp. were higher in the crops than in the grassy strips, except for the speed of C.
auratus. Among the four species C. auratus, P. melanarius, P. niger, and Poecilus
spp., C. auratus revealed the highest displacement and speed, whereas no significant
differences were found between the other three species. P. melanarius showed higher
displacement and speed in wheat than in red-clover or pumpkin. Speed and
displacement of P. melanarius differed between spring and autumn generations in
wheat or clover. When they were released at a junction of arable crop and field strips,
the direction of dispersion to either arable field or field margins/strips was indifferent
for Carabus auratus, while P. melanarius moved directly to crop centers. The
direction of movement of Poecilus spp. differed between a marginal and a central site.
In the marginal site, it preferred to move along a grassy strip, while in the central site
it moved irrespective from the grassy strips. C. nemoralis moved along a grassy
margin near a hedge only and avoided direct entry into the arable field or along a
grassy strip without hedge. Nebria brevicollis mostly entered directly into the crop
field. In contrast, P. niger used grassy strips and their field-side border. It could be
shown that grassy strips do not affect the dispersal of typical species in arable fields,
i.e. P. melanarius and C. auratus: however, other species, e.g. Poecilus spp., Carabus
60
nemoralis and Pterostichus niger, can only overcome the barriers of arable fields
either by way of strips covered only by grass or even need grassy strips with an
adjacent hedge.
Keywords: organic agriculture, effect of grassy strips, movement, dispersal,
Carabidae
61
3.3.1 Introduction The decline of natural habitats in the agricultural ecosystems is correlated to a species
decline, especially in those species that have low dispersal power (den Boer 1970,
1990). For conservation strategies, better knowledge of the movement of arthropods
in linear structures such as grassy field margins and hedges is highly recommended.
In addition, the tracing of the predators is helpful for integrated pest management.
Among the soil-dwelling arthropods, insects – especially ground beetles (Carabidae) –
have been intensively studied in European agro-ecosystems. They are the natural
enemies of pest insects and key model organisms due to their rich diversity. They
form assemblages found at various spatio-temporal levels, and are amply collected for
analysis.
A better understanding of the dispersal of ground beetles from natural or semi-natural
habitats to arable fields is helpful in order to know whether these habitats support the
invasion of the beetles or not. In conventional arable ecosystems, intensive agro-
mechanization, landscape fragmentation and chemically managed mono-crop
ecosystems have caused the extinction or decline of many species. In this situation,
the ratio of the arable areas which remain as natural habitats becomes very small. To
mitigate these conditions, the development of some grassy strips can accommodate
the predatory fauna. In contrast, the organic practices in arable fields are
environmentally friendly. The fauna in the field centers of the crops is much like the
fauna at field margins after a period of six years. So it seems that, for the biodiversity
of the beetles, linear structures such as grassy strips are of less importance in organic
agriculture than in conventional agriculture. However, presently the role of grassy
strips for the dispersal of carabids is not well-studied in organic arable fields; for
example, it is not yet known how long the beetles need to walk in or along the strips.
Additionally, it is necessary to know the direction the beetles move from their natural
habitats to crop centres, both in the fields and near hedges or forests as well as in the
center of huge farms having only grassy margins.
Although many investigations were conducted to analyse the movement of carabids
in arable fields using different techniques (e.g. Wallin & Ekbom 1988, Riecken &
Raths1996, Tischendorf et al. 1998), few studies addressed the effect of grassy strips
on the movement and dispersal of carabids. Thus, the following questions were
investigated: Are (1) the grassy strips used directly by carabids to invade organic
arable fields, (2) species supported by grassy margins for dispersal depending on their

62
specific biology, and (3) grassy strips used as orientation structures to invade arable
fields?
3.3.2 Material and Methods
3.3.2.1 Study area, and period of experiment
The investigations were conducted on three arable sites of two organic farms located
in Schleswig-Holstein, northern Germany. One farm (Ritzerauhof; area 280 ha) had
been converted to organic farming in 2001, and the other (Lämmerhof; area 410 ha)
had already been organically managed for decades. The farms are adjacent to each
other and have similar soils with approximately 23 – 29 % loamy sand, 20 – 35 %
loam and 3 – 12 % sand (Reiss et al. 2008). The region has a moderate continental
climate with 691 mm rainfall and 8.1°C in a 30-year average.
A mosaic of grassy strips and margins existed along the three selected fields. The
grassy strips mainly consisted of ten herb species and few grass species, e.g.,
Hordeum vulgare L., Lolium perenne L., Poa trivialis L., and Elymus repens (L.).
Both grass coverage and total plant species richness ranged between 60 % - 70 % and
50 - 60 species, respectively, which represent the typical grassy vegetation of
moderately moist sites in northern Germany (Roweck, 2008).
The first field was located at Ritzerauhof and investigated from the last week of
August to the first week of October in 2010, and again from the first week of May to
mid July in 2011. This field was at the margin of the agrarian fields and had a grassy
margin along a hedge and a grassy strip. The second field was at the adjacent
Lämmerhof (Panten) at a distance of approximately 3 km from the first field. It was
only investigated in autumn 2010. The third field was situated in the center of the
agrarian fields of Ritzerauhof, at a distance of approximately 500 m from the first.
This field was only investigated during the spring and summer of 2011.
3.3.2.2 Sampling of carabids
Pitfall traps with no killing agent were used to capture the beetles. A typical trap
consisted of a honey-glass, a piece of plastic pipe, a plastic funnel, and a transparent
plastic plate. The pipes were inserted vertically into the soil, keeping one opening at
ground level. Each pipe was filled with a honey-glass. The plastic pipe protected the
honey-glass from the compaction of the soil and facilitated the sampling of the
captured beetles. The funnels were inserted with the narrow side into the honey-

63
glasses while the wider part remained on the upper surface of the plastic pipe. The
funnel acted as a slope and prevented beetles from escaping. A transparent plate
raised by two iron rods over the traps protected the beetles from birds and rain. In
addition, a piece of cork in the honey-glass rescued the beetles from drowning if
water got into the traps. A mixture of weed, soil and one or two stones in the honey-
glass provided food and shelter for the captured beetles. The mixture was kept away
from the narrow part of the funnel. A total of 250 and 230 pitfall traps were
established in 2010 and 2011, respectively.
3.3.2.3Experimental layout
The traps were established in rows parallel to the grassy structures at a distance of
approximately 5 m from each other (Fig. 3.3.1). The field-1 of Ritzerauhof had a
grassy strip that separated two arable fields and ran perpendicular to a forest
boundary. The second grassy margin was located along a hedge separating the forest
from the arable field. Winter wheat (Triticum aestivum) was sown in this field in 2010
and red-clover (Trifolium pratense) in 2011. The intersection of the two grassy
margins and the crop was selected as a “source”. In both years, a total 110 traps were
installed in a 10 x 11 grid. Distance between the traps was 5 m.
Fig. 3.3.1: Experiment layout in Ritzerau fields (field-1 and field-3; left) and Panten
(field-2; right); filled circles in Panten field were close to the grassy strip (1.5m
distance); traps in rows were at ~ 5m distance; point of release at S (“source”)
The experimental field-2 of the Lämmerhof had a grassy strip between two crop
fields, planted with red clover and pumpkin (Cucurbita maxima). All beetles were
64
marked and released at the junction (S = “source” in Fig. 3.3.1) of the two crops and
the grassy strip (Fig. 3.3.1). A total of 22 traps were installed in the grassy strip in two
parallel rows at a distance of 4 m apart. In the pumpkin crop, 18 traps were installed
in three parallel rows at a distance of 5m apart. Finally, 59 pitfall traps were set in 7
rows in the red-clover. The distance between rows varied. Distance from the grassy
strip was 2, 5.8, 13.3, 20, 26.9, 32.5, and 44.3 m. Additionally, 2 traps were installed
at a distance of 1.5 m from the grassy strip on the pumpkin side and 3 traps on the red
clover side, in order to investigate the dispersal of carabid species in the area close to
the grassy strip (dark spots in Fig 3.3.1).
Field-3 provided the same layout as was used for field-1 of Ritzerauhof. In contrast to
field-1, neither grassy strip at this site was adjacent to a hedge. This field was only
investigated in 2011. A total of 120 traps were used in an 11 x 11 grid. Distance
between the traps was again 5 m. Winter wheat crop was sown on this field.
3.3.2.4 Marking of carabids
The carabids were collected from the traps and marked by the mutilation method
using a marking-drill machine. The method is easy and fast when marking a large
number of carabids in a short period of time. By holding the beetles between the
fingers, small visible marks were made on their elytra. We assigned a specific number
to each beetle according to Southwood and Henerson (2001). In one field, the number
of Pterostichus melanarius exceeded the number 1023 i.e. after both elytra were
marked. Therefore, the pronotum was additionally marked.
The freshly marked and the recaptured beetles were carefully kept in baskets with a
mixture of soil and plant material to overcome the problem of cannibalism. In the
evenings, they were released one after another so that the first beetle disappeared
before the second beetle was released.
3.3.2.5 Experimental species
The species selected were Pterostichus melanarius (13-17 mm), P. niger (16-21 mm),
Carabus auratus (17-30 mm), C. nemoralis (22-25 mm), Poecilus spp. (11-13 mm),
and Nebria brevicollis (11-14 mm). These were chosen, because the majority of them
are large (e.g. Carabus spp., and Pterostichus spp.) which helped to identify the
specimens in the field with the naked eye and eased the marking and reading
procedure. In addition, they are good indicators of organic farming (e.g. C. auratus),
associated with grassy strips (e.g. Poecilus spp., and P. niger) and are the most
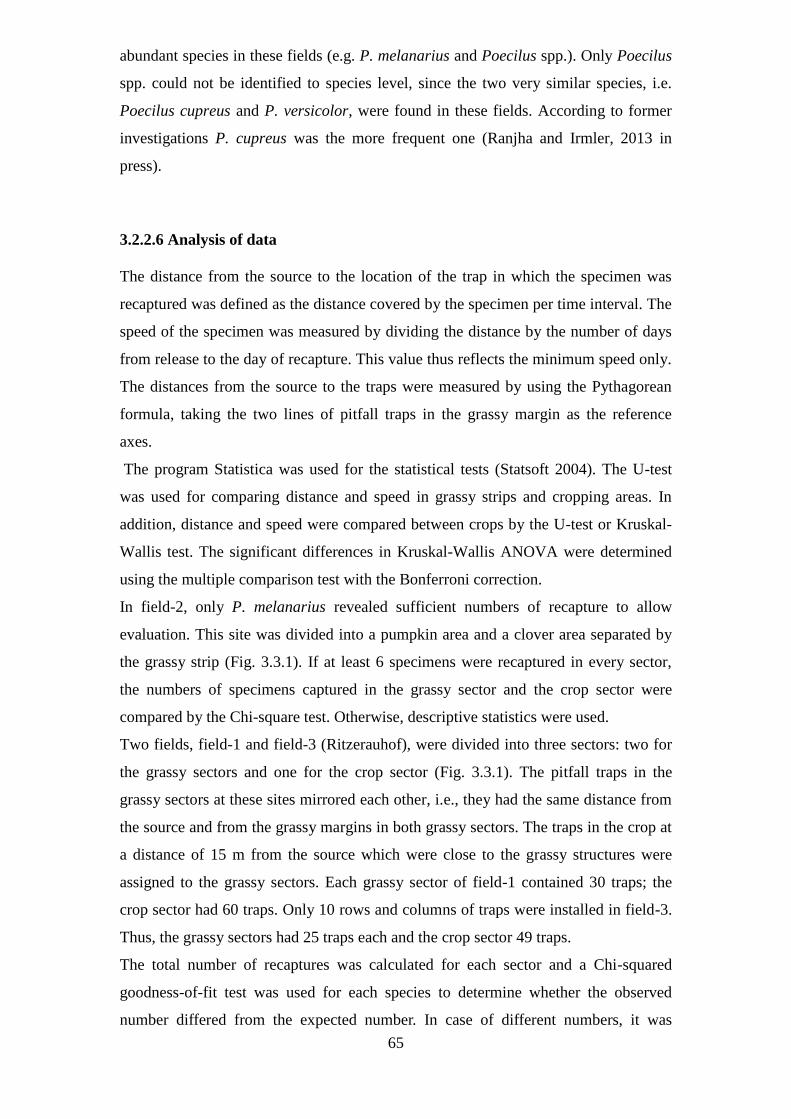
65
abundant species in these fields (e.g. P. melanarius and Poecilus spp.). Only Poecilus
spp. could not be identified to species level, since the two very similar species, i.e.
Poecilus cupreus and P. versicolor, were found in these fields. According to former
investigations P. cupreus was the more frequent one (Ranjha and Irmler, 2013 in
press).
3.2.2.6 Analysis of data
The distance from the source to the location of the trap in which the specimen was
recaptured was defined as the distance covered by the specimen per time interval. The
speed of the specimen was measured by dividing the distance by the number of days
from release to the day of recapture. This value thus reflects the minimum speed only.
The distances from the source to the traps were measured by using the Pythagorean
formula, taking the two lines of pitfall traps in the grassy margin as the reference
axes.
The program Statistica was used for the statistical tests (Statsoft 2004). The U-test
was used for comparing distance and speed in grassy strips and cropping areas. In
addition, distance and speed were compared between crops by the U-test or Kruskal-
Wallis test. The significant differences in Kruskal-Wallis ANOVA were determined
using the multiple comparison test with the Bonferroni correction.
In field-2, only P. melanarius revealed sufficient numbers of recapture to allow
evaluation. This site was divided into a pumpkin area and a clover area separated by
the grassy strip (Fig. 3.3.1). If at least 6 specimens were recaptured in every sector,
the numbers of specimens captured in the grassy sector and the crop sector were
compared by the Chi-square test. Otherwise, descriptive statistics were used.
Two fields, field-1 and field-3 (Ritzerauhof), were divided into three sectors: two for
the grassy sectors and one for the crop sector (Fig. 3.3.1). The pitfall traps in the
grassy sectors at these sites mirrored each other, i.e., they had the same distance from
the source and from the grassy margins in both grassy sectors. The traps in the crop at
a distance of 15 m from the source which were close to the grassy structures were
assigned to the grassy sectors. Each grassy sector of field-1 contained 30 traps; the
crop sector had 60 traps. Only 10 rows and columns of traps were installed in field-3.
Thus, the grassy sectors had 25 traps each and the crop sector 49 traps.
The total number of recaptures was calculated for each sector and a Chi-squared
goodness-of-fit test was used for each species to determine whether the observed
number differed from the expected number. In case of different numbers, it was
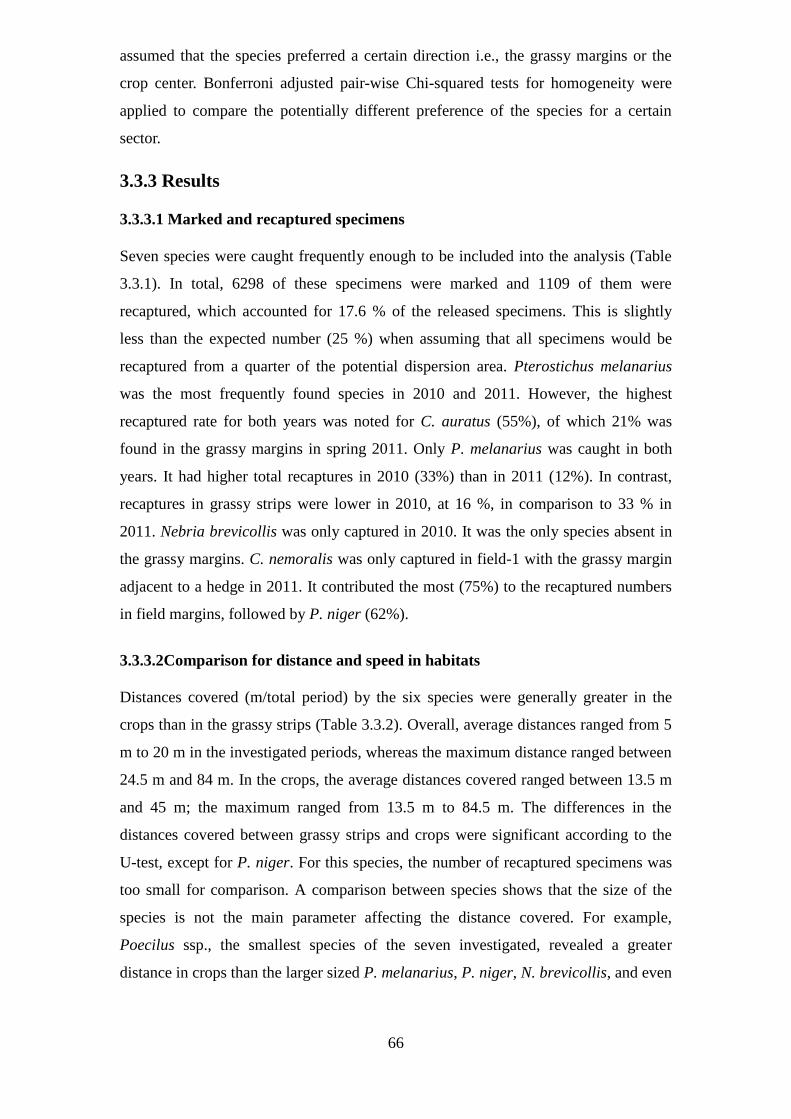
66
assumed that the species preferred a certain direction i.e., the grassy margins or the
crop center. Bonferroni adjusted pair-wise Chi-squared tests for homogeneity were
applied to compare the potentially different preference of the species for a certain
sector.
3.3.3 Results
3.3.3.1 Marked and recaptured specimens
Seven species were caught frequently enough to be included into the analysis (Table
3.3.1). In total, 6298 of these specimens were marked and 1109 of them were
recaptured, which accounted for 17.6 % of the released specimens. This is slightly
less than the expected number (25 %) when assuming that all specimens would be
recaptured from a quarter of the potential dispersion area. Pterostichus melanarius
was the most frequently found species in 2010 and 2011. However, the highest
recaptured rate for both years was noted for C. auratus (55%), of which 21% was
found in the grassy margins in spring 2011. Only P. melanarius was caught in both
years. It had higher total recaptures in 2010 (33%) than in 2011 (12%). In contrast,
recaptures in grassy strips were lower in 2010, at 16 %, in comparison to 33 % in
2011. Nebria brevicollis was only captured in 2010. It was the only species absent in
the grassy margins. C. nemoralis was only captured in field-1 with the grassy margin
adjacent to a hedge in 2011. It contributed the most (75%) to the recaptured numbers
in field margins, followed by P. niger (62%).
3.3.3.2Comparison for distance and speed in habitats
Distances covered (m/total period) by the six species were generally greater in the
crops than in the grassy strips (Table 3.3.2). Overall, average distances ranged from 5
m to 20 m in the investigated periods, whereas the maximum distance ranged between
24.5 m and 84 m. In the crops, the average distances covered ranged between 13.5 m
and 45 m; the maximum ranged from 13.5 m to 84.5 m. The differences in the
distances covered between grassy strips and crops were significant according to the
U-test, except for P. niger. For this species, the number of recaptured specimens was
too small for comparison. A comparison between species shows that the size of the
species is not the main parameter affecting the distance covered. For example,
Poecilus ssp., the smallest species of the seven investigated, revealed a greater
distance in crops than the larger sized P. melanarius, P. niger, N. brevicollis, and even

67
Table 3.3.1. Total number of carabids released in the fields, total recaptured in different crops (W = wheat,
C = clover, P = pumpkin) and in adjacent strips (S = grassy strip, and H = strip with hedge); T.rec.: Total
of recaptured.
Field 1 Field 2 Field 3 Total
strips
(%)
Species Relea
sed
Recaptured T rec.
(%)
Relea
sed
Recaptured T rec.
(%)
Relea
sed
Recaptured T rec.
(%)
Year 2010 (autumn) W S C P S
P. melanarius 488 147 26 36 382 83 15 18 30 P. niger 55 8 14 40 60 2 1 4 12
N. brevicollis 44 1 0 2 105 13 5 0 17
Year 2011 (spring) C H S W S
P. melanarius 2046 141 39 44 11 1826 179 75 14 33 C. auratus 53 21 6 3 57 190 85 20 55 21
C. nemoralis 45 3 8 1 27 5 0 0 0 75
Poecilus spp. 236 34 3 18 24 763 63 12 12 34
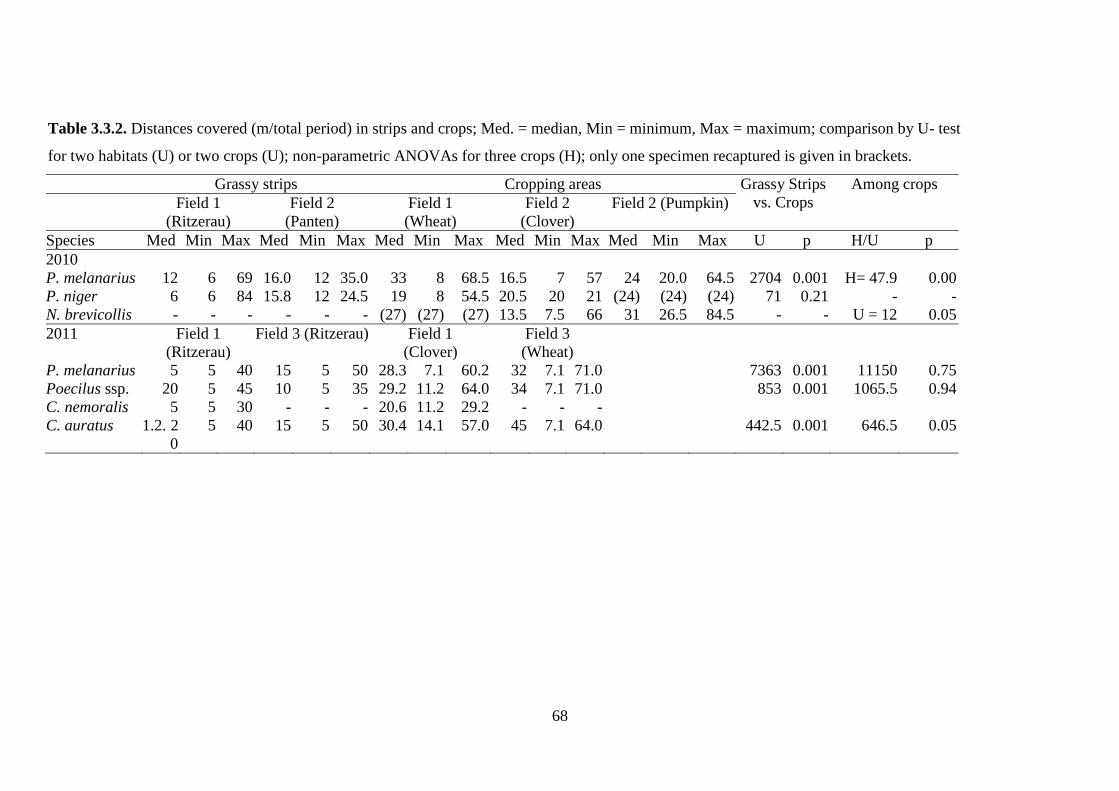
68
Table 3.3.2. Distances covered (m/total period) in strips and crops; Med. = median, Min = minimum, Max = maximum; comparison by U- test
for two habitats (U) or two crops (U); non-parametric ANOVAs for three crops (H); only one specimen recaptured is given in brackets.
Grassy strips Cropping areas Grassy Strips
vs. Crops
Among crops
Field 1
(Ritzerau)
Field 2
(Panten)
Field 1
(Wheat)
Field 2
(Clover)
Field 2 (Pumpkin)
Species Med Min Max Med Min Max Med Min Max Med Min Max Med Min Max U p H/U p
2010
P. melanarius 12 6 69 16.0 12 35.0 33 8 68.5 16.5 7 57 24 20.0 64.5 2704 0.001 H= 47.9 0.00
P. niger 6 6 84 15.8 12 24.5 19 8 54.5 20.5 20 21 (24) (24) (24) 71 0.21 - -
N. brevicollis - - - - - - (27) (27) (27) 13.5 7.5 66 31 26.5 84.5 - - U = 12 0.05
2011 Field 1
(Ritzerau)
Field 3 (Ritzerau) Field 1
(Clover)
Field 3
(Wheat)
P. melanarius 5 5 40 15 5 50 28.3 7.1 60.2 32 7.1 71.0 7363 0.001 11150 0.75
Poecilus ssp. 20 5 45 10 5 35 29.2 11.2 64.0 34 7.1 71.0 853 0.001 1065.5 0.94
C. nemoralis 5 5 30 - - - 20.6 11.2 29.2 - - -
C. auratus 1.2. 20
5 40 15 5 50 30.4 14.1 57.0 45 7.1 64.0 442.5 0.001 646.5 0.05

69
Table 3.3.3. Speed (m day-1
) in grassy strips and crops; Med. = median, Min = minimum, Max = maximum; comparison by U- test for two
habitats (U) or two crops (U); non-parametric ANOVAs for three crops (H); only one specimen recaptured is given in brackets.
Grassy strips Cropping areas Grassy Strips
vs. Crops
Among crops
Field 1
(Ritzerau)
Field 2
(Panten)
Field 1
(Wheat)
Field 2
(Clover)
Field 2 (Pumpkin)
Species Med Min Max Med Min Max Med Min Max Med Min Max Med Min Max U p H/U p
2010
P. melanarius 3.0 0.6 23.5 3.1 1.5 6.2 6.2 0.4 25.0 3.5 0.7 14.2 4.7 2.3 10.8 3596 0.001 H = 36.2 0.00
P. niger 2.0 0.9 21.0 4.5 4.1 6.0 4.0 0.5 30.0 2.5 1.6 3.3 (12.0) (12.0) (12.0) 84 0.5 - -
N. brevicollis - - - - - - (6.8) (6.8) (6.8) 1.9 0.6 8.3 4.4 2.1 12.1 U = 8 0.02
2011 Field 1
(Ritzerau)
Field 3 (Ritzerau) Field 1
(Clover)
Field 3
(Wheat)
P. melanarius 1.1 0.13 13.3 2.5 0.1 20.0 4.1 0.2 46.1 5.4 0.23 71 15040 0.001 11150 0.75
Poecilus ssp. 2.5 0.22 12.0 2.5 0.1 15.0 4.4 0.5 27.0 4.2 0.30 51 1468 0.001 1065.5 0.94
C. nemoralis 2.5 0.14 15.0 - - - 2.8 3 4.1 - - -
C. auratus 1.3. 4.0
0.20 20.0 5.0 0.9 20.0 5.7 0.4 40.3 10.2 0.71 64 1178 0.05 646.5 0.05

70
C. nemoralis. Only distances covered by C. auratus were slightly greater in crops than
Poecilus spp.The comparison between the different crops provided significant
differences for P. melanarius and C. auratus. This implies that P. melanarius covered
greater distances in wheat than in clover or pumpkin. A comparison between the 2010
and 2011 values for wheat crops supports these results for P. melanarius. In wheat,
distances covered were nearly identical in 2010 and in 2011 with 33 m and 32 m on
average, respectively, even though different wheat fields were investigated. Similar
results were found for clover, although the range was higher, between 16.5 m and
28.3 m. No differences in distances covered in different crops were revealed for N.
brevicollis and Poecilus spp. The two other species, C. nemoralis and P. niger,
avoided the crop areas, making a comparison between different crops
impossible.Speed (m day-1
) of the species in grassy strips ranged from an average of
1.1 m day-1
to 5 m day-1
; the maximum ranged from 6 m day-1
to 23 m day-1
(Table
3.3.3). In the crops, the respective average ranges were 1.9 m day-1 and 10.2 m day-1
,
and 3.3 m day-1
and 71 m day-1
for the maximum. The differences between the strip
values and the crop values were once more significant for P. melanarius and Poecilus
ssp., but not for P. niger and C. auratus. The later two species revealed high speed
values in grassy strips which ranged from 2 m day-1
to 5 m day-1
, whereas the speed
range of the two former species in grassy strips was 1.1 m day-1
and 3.1 m day-1
. As
for the distances covered, no relationship between speed and size of the species was
discovered. The lowest speed was found for P. melanarius in a grassy strip, but also
the highest in a crop. The smaller species Poecilus spp. exhibited a speed identical to
or higher than the larger species P. melanarius and C. neomoralis. Carabus nemoralis
and C. auratus, both nearly of the same size, showed distinctly different speed values.
In field-1, where they occurred together, C. auratus had an average speed of 4 m day-1
in grassy strips and 5.7 m day-1
in crops, whereas C. nemoralis reached an average
speed of 2.5 m day-1
in grassy strips and 4.1 m day-1
in crops. The comparison
between the different crops revealed significant differences only for P. melanarius
and N. brevicollis in 2010. For P. melanarius, speed was significantly higher in wheat
crops than in clover or pumpkin crops. Speed in wheat was also higher than in clover
in the 2011 experiment, but the difference was not significant. No values could be
calculated for wheat for N. brevicollis, but the difference between pumpkin and clover
was similar to that of P. melanarius.
If all crop areas are considered, Carabus auratus revealed the greatest distance
covered and the highest speed of the four species - in comparison to more than 35
m/total period and more than 8 m day-1
(Fig. 3.3.2). Using the Kruskal-Wallis test,

71
significant differences were found for distance covered (H = 41.5, p < 0.001 n = 779,
DF = 3) when compared to the other three species, according the multiple
comparison. However, for speed (H = 34.1, p < 0.001; n = 779, DF = 3), differences
were only significant when compared to Poecilus spp. and P. melanarius, but not in
comparison to P. niger. Using all margins and grassy strips for the comparison, speed
comparison showed the same differences as the crop comparison (H = 23.7, p <
0.001, n = 296, DF = 3), whereas distances covered were not different among the four
species (H = 7.9, p = 0.05, n = 296, DF = 3).
Fig. 3.3.2: Medians of distances covered and speed in grassy strips and cropping
areas; error bars show upper and lower quartiles; different characters between the
grassy strips or the crop fields show significant differences with p < 0.001 according
to Kruskal-Wallis ANOVA and multiple comparison test.
Fig. 3.3.3: Median of distances covered and speeds for P. melanarius in three
cropping areas; errors bars show upper and lower quartiles; different characters
between distances or between speeds indicate significant differences according to the
Kruskal-Wallis ANOVA and multiple comparison test.
Poecilus spp.Carabus
auratus
Pterostichus
melanarius
Pterostichus
niger
0
10
20
30
40
50
60
Dis
tance c
overe
d (
m/t
ota
l period)
Grass
CropMedian 25%-75%
a
b
b
b
0
2
4
6
8
10
12
14
16
18
Speed (
m/d
ay)
Poecilus spp.Carabus
auratus
Pterostichus
melanarius
Pterostichus
niger
bbab
a
a
a
a a a
b b ab
Clover Wheat Pumpkin10
15
20
25
30
35
40
45
50
Dis
tance (m
/tota
l period)
0
5
10
15
20
Speed (m
/day)
Distance Speed
b b
a a
b b

72
Since P. melanarius was captured in different crops, the movement behavior could
also be analyzed for crops. The species covered greater distances (H = 32.8, p <
0.001, n = 565, DF = 2) and showed faster speeds (H = 23.0, p < 0.001, n = 565, DF =
2) in wheat than in the pumpkin and clover areas (Fig. 3.3.3). The differences between
wheat and pumpkin/clover were significant using the multiple comparisons. If the
autumn and spring values are compared for the same crops (clover and wheat), no
differences for speed were shown in clover (U = 5494, p = 0.44), whereas distance
covered was greater in the spring than in autumn (U = 3286, p < 0.001) (Fig. 3.3.4). In
wheat, distances covered did not differ between the two seasons (U = 12950, p = 0.8),
however, speed revealed higher values in autumn than in spring (U = 11203, p =
0.02).
Fig. 3.3.4: Medians of distances covered and speeds of Pterostichus melanarius in
clover and wheat during the two seasons; error bars show upper and lower quartiles;
different characters between autumn or spring values indicate significant differences
according to the U-test.
3.3.3.3 Direction of dispersal
At field-2 in 2010, P. melanarius preferred to move in the grassy strip sector on the
pumpkin side (χ2= 7.8, P = 0.02). However, when comparing clover and grassy strips,
P. melanarius preferred to move directly to the clover (χ2
= 8.2, P = 0.01).
At field-1 of Ritzerauhof, P. melanarius moved directly to the arable field center in
2010 (χ2
= 11.33, P = 0.003) and 2011 (χ2 = 19, P < 0.001) instead of using the grassy
strip, similar to clover crop at field-2, irrespective of the different crops with wheat in
2010 and red clover in 2011. On field-1 at Ritzerauhof, the two species, Poecilus ssp.
Autumn Spring
Seasons
0
10
20
30
40
50
Dis
tan
ce
(m
/to
tal p
eri
od
)
0
5
10
15
20
Sp
ee
d (m
/da
y)
Distance Speed
Clover
Autumn Spring
Wheat
b
a
a
a
a
a
a
b
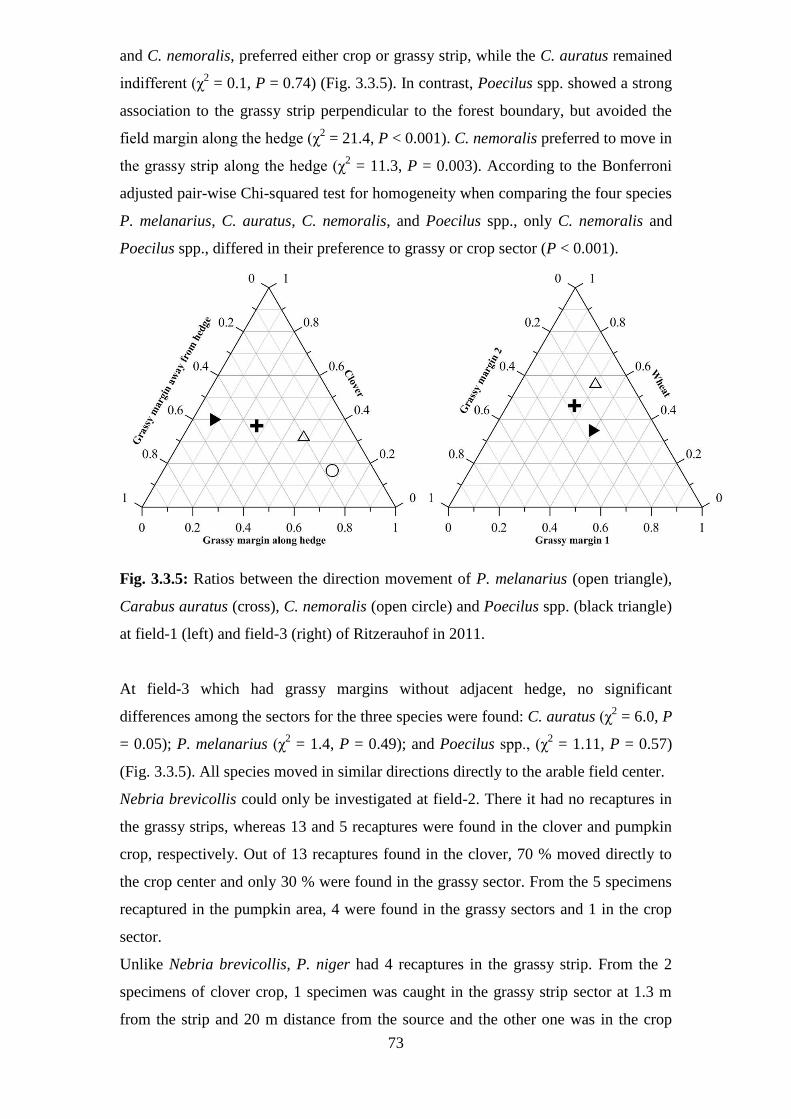
73
and C. nemoralis, preferred either crop or grassy strip, while the C. auratus remained
indifferent (χ2 = 0.1, P = 0.74) (Fig. 3.3.5). In contrast, Poecilus spp. showed a strong
association to the grassy strip perpendicular to the forest boundary, but avoided the
field margin along the hedge (χ2 = 21.4, P < 0.001). C. nemoralis preferred to move in
the grassy strip along the hedge (χ2 = 11.3, P = 0.003). According to the Bonferroni
adjusted pair-wise Chi-squared test for homogeneity when comparing the four species
P. melanarius, C. auratus, C. nemoralis, and Poecilus spp., only C. nemoralis and
Poecilus spp., differed in their preference to grassy or crop sector (P < 0.001).
Fig. 3.3.5: Ratios between the direction movement of P. melanarius (open triangle),
Carabus auratus (cross), C. nemoralis (open circle) and Poecilus spp. (black triangle)
at field-1 (left) and field-3 (right) of Ritzerauhof in 2011.
At field-3 which had grassy margins without adjacent hedge, no significant
differences among the sectors for the three species were found: C. auratus (χ2 = 6.0, P
= 0.05); P. melanarius (χ2 = 1.4, P = 0.49); and Poecilus spp., (χ
2 = 1.11, P = 0.57)
(Fig. 3.3.5). All species moved in similar directions directly to the arable field center.
Nebria brevicollis could only be investigated at field-2. There it had no recaptures in
the grassy strips, whereas 13 and 5 recaptures were found in the clover and pumpkin
crop, respectively. Out of 13 recaptures found in the clover, 70 % moved directly to
the crop center and only 30 % were found in the grassy sector. From the 5 specimens
recaptured in the pumpkin area, 4 were found in the grassy sectors and 1 in the crop
sector.
Unlike Nebria brevicollis, P. niger had 4 recaptures in the grassy strip. From the 2
specimens of clover crop, 1 specimen was caught in the grassy strip sector at 1.3 m
from the strip and 20 m distance from the source and the other one was in the crop
74
sector. Similarly, in pumpkin crop the 1 specimen was recaptured in the grassy
margin sector at 5 m distance from the margin and approximately 10 from the source.
3.3.4 Discussion The selected mark-and-recapture method used to investigate the movement of
carabids has advantages and disadvantages. A severe disadvantage is the low
recapture rate that is related to the increase in area and the stay of animals on way
after their release (Wolfenbarger 1946). The major advantage of this method is the
more or less natural conditions compared to e.g. telemetry methods (Riecken and
Raths, 1996). The mark-and-recapture method was chosen because it is easy to
conduct, cheap and provides carabids with natural conditions for movement. At 17.6
%, the recapture rate was high enough since a great number of specimens had been
marked.
Compared to other investigations that used different methods, the results found in this
study show that the mark-and-recapture method provides realistic values. Baars
(1979) found a daily speed of 4.0 m day-1
– 13.0 m day-1
for Poecilus versicolor. Our
values for Poecilus spp. were 2.5 to 4.4 m day-1 on average, with a range between 0.1
m day-1
and 51 m day-1
. Wallin and Ekbom (1988) published speed values between 24
and 29 m day-1
for Pterostichus melanarius, 41 and 78 m day-1
for P. niger, and 28 m
day-1
for Carabus nemoralis. The referring values in our study were 1.1 m day-1
– 6.2,
2 – 12 m day-1
, and 2.5 – 2.8 m day-1
, respectively, for the averages and 0.1 – 71 m
day-1
, 0.5 – 30 m day-1
, and 0.14 – 15 m day-1
, respectively, for the total range. The
wide range of values found here and published by other studies show the flexibility of
movement behaviour of species living in agricultural ecosystems. In contrast to
species from these open ecosystems, carabid species from woods seem to have lower
displacement values. Niehues et al. (1996) found values between 3.5 and 15.0 m day-1
for the large Carabus auronitens; Assmann (1995) found 4.2 m day-1
for the similarly
large Carabus glabratu, and Charrier et al. (1997) found 0.2 – 0.6 m day-1
for the
smaller Abax parallelepipedus living in woods. However, other species from open
grassy vegetation also revealed much lower movement values than found in our
studies. The two species Elaphrus cupreus and E. uliginosus only covered an average
of 0.5 m day-1
and 0.7 m day-1
, respectively (Schreiner and Irmler 2010). A daily
distance greater than 10 m was rare. Compared to these two species, the investigated
species of agricultural fields demonstrate the high speed and dispersal potentials of
species found in agricultural habitats.
75
Displacement behavior of carabids is affected by nutrition, the different vegetation
structures, e.g. hedges, grassy vegetation etc., and the stability of their ecosystems.
Species size, often noted as an important factor for speed and dispersal, is of minor
importance for the displacement behaviour according to our investigations.
Nevertheless, size does play a role in the movement and dispersal behaviour as can be
seen by C. auratus, which had the highest values compared to P. melanarius, P. niger,
and Poecilus spp. We found that the habitat characteristics, e.g. spatial resistance
(Jopp, 2006), exhibit stronger effects on the movement than the size of the species.
Only carnivorous species were investigated in the present study. In both years, P.
melanarius covered longer distances in cropping areas than in grassy margins.
Similarly, C. auratus and Poecilus spp. travelled greater distances in cropping areas
than in grassy strips. Only P. niger showed no difference for distances covered
between grassy strips and crops.
The speed in different habitats depends on physical conditions such as temperature
and satiation state of animals, not only for carabids but also for other animals living
on the soil surface (Berggren at al., 2002). The behavior of specialist species also
differs from the generalist species. Specialist species generally exhibit lower rates of
dispersal than generalist species (Hedin et al., 2008). For the two species P.
melanarius P. niger, Frampton et al. (1995) found that they moved slower in grassy
strips than in barley, because of denser vegetation in the grassy strip, better food
supply and physical structure in less intensively managed fields. We found that P.
melanarius moved faster in wheat crop than in pumpkin and clover. The reason may
lie in the greater openness of the ground surface and the lower food availability in the
wheat crop (Vermeulen, 1994). Most beetles moved more slowly in the clover crop
than in wheat or pumpkin, which might be related to the wetter microclimate
conditions, denser vegetation on the ground and better food supply in clover
(Carcamo and Spence, 1994). It also shows that the environmental conditions of
clover resemble those of grassy margins, because there was a greater similarity
between the speed on clover and grassy strips than between wheat and grassy strips.
The lower permeability in grassy structures can affect speed and preferred direction of
carabids. The interaction and exchange of carabids in arable fields, mosaic of crops
and grassy structures, depends on the quality of source and sink habitats and on the
species investigated for the studies. This is supported by our findings for C.
nemoralis, which exclusively preferred to move in the field margin along a hedge and
avoided the crop and the other grassy strip without hedge. In general, hedgerows led
to a decrease in the movements of insects and delayed dispersal of walking beetles

76
like carabids (Fry and Robenson, 1994). Hedgerows are important habitats for the
agricultural landscape, because they function as sites for overwintering and as retreat
habitats during unfavourable periods of farming activities (Fournier and Loreau,
2001). Therefore, the carabids moved from those natural habitats, such as hedgerows,
to the surrounding patches of agricultural sites. The most abundant species, P.
melanarius, made nocturnal foray from dense inter-crop field to mono-crop sites.
According to Bohlen and Barret (1990), Coleoptera moved parallel to crop edges
instead of crossing them. In our studies, a few specimens of Nebria brevicollis were
recaptured parallel to the grassy strip. In contrast, P. niger moved inside and along the
grassy strips. Frampton et al. (1995) found that some individuals of P. melanarius,
Harpalus rufipus and P. niger followed field edges and avoided barriers. In another
study, hedgerows became barriers for the movement of Nebria spp. into the adjacent
cereal fields, because temperature was lower in hedgerows than in arable fields. Like
arable fields, forest edges can have an impact on the orientation of dispersal, e.g. for
Carabus coriaceus (Riecken and Raths, 1996). In the present studies, the matrix of
grassy strips with and without hedge demonstrated that hedges affect the direction of
field species (P. melanarius), grass preferring species (Poecilus spp.), and species of
wood edges (C. nemoralis). However, in a matrix of grassy margins and crop in the
middle of the huge agricultural fields, the former two species showed no preference of
movement for any habitat. Beetles that can invade directly into arable fields, i.e. P.
melanarius, or run along grassy strips, i.e. Poecilus spp., used both grassy strips and
crop areas for dispersal into the field centre. The same was true for C. auratus in both
fields of Ritzerauhof. C. auratus is the species that benefits most from organic
practices in Germany and Switzerland. Furthermore, the difference in movement
behaviour explains why C. nemoralis was not found in the centre of the huge arable
field area. This species needs hedges to move along grassy strips. If there are no
hedges combined with grassy strips, the species is not able to overcome the field
barrier.
For other beetles such as the Darkling beetles, the movement was modified by the
presence of corridors; they spent more time in abandoned corridors than in mowed
grasslands. Collinge (2000) found that the movement in habitat patches depended
upon species, landscape, patch size and environment. In contrast to the findings of
Collinge (2000), the species specific movement was less important than the habitat
characteristics, e.g. vegetation structure between the different crops and between
crops and grassy strips, in our experiments. In conclusion, the movement of carabids
into agricultural areas depends on a large variety of factors: specific movement

77
behaviour of species, vegetation structure of field margins and strips, and crops
planted on arable fields. Organic farming with a variety of crops and a variety of
different field margins and strips provides the opportunity for most abundant carabids
to use crop areas and grassy strips for dispersal, which might support their species
richness and biodiversity in the organic agro-ecosystems.
3.3.5 Acknowledgements We are grateful to the owners of the two farms, Detlef Hack and Ute Thode, from
Lämmerhof at Panten, as well as Günther Fielmann from Ritzerauhof for giving us
their permission to do the investigations. We are also thankful to the Higher Education
Commission of Pakistan for financial support. We thank Jean Heitkamp for her help
with the 2010 experiments. Finally, we thank Dr. Mario Hasler (Dept.
Variationsstatistik, Faculty of Agricultural and Nutritional Sciences) for his kind
support in the statistic analyses.
3.3.6 References Assmann, T., 1995. Laufkäfer als Reliktarten alter Wälder in Nordwestdeutschland
(Col: Carabidae). Mitteilungen der deutschen Gesellschaft für allgemeine und
angewandte Entomologi 10, 305-308.
Baars, M. A., 1979. Patterns of movement of radioactive carabid beetles. Oecologia
44, 125-140.
Bach, C. E., 1988. Effects of Host Plant Patch Size on Herbivore Density: Underlying
Mechanisms. Ecology 69, 1103–1117.
Berggren, A., Birath, B., Kindvall, O., 2002. Effect of corridors and habitat edges on
dispersal behavior, movement rates, and movement angles in Roesel's Bush-Cricket
(Metrioptera roeseli). Conservation Biology 16, 1562-1569.
Bohlen, P. J., Barrett, G. W., 1990. Dispersal of the Japanese Beetle (Coleoptera:
Scarabaeidae) in Strip-Cropped Soybean Agroecosystems. Environ. Entomol. 19, 4.
955-960.
Burel, F., Baudry, J., 1995. Species biodiversity in changing agricultural landscapes:
A case study in the Pays d’Auge, France. Agriculture, Ecosystems & Environment
55, 193–200.
Carcamo H. A., Spence, J. R., 1994. Crop type effects on the activity and distribution
of ground beetles (Coleoptera, Carabidae). Environ. Entomol. 23 (3): 684-692.

78
Chapman, P. A., Armstrong, G., McKinlay, R.G., 1999. Daily movements of
Pterostichus melanarius between areas of contrasting vegetation density within
crops. Entomologia Experimentalis et Applicata 91, 479–482.
Charrier, S., Petit, S., Burel, F., 1992. Movements of Abax parallelepipedus
(Coleoptera: Carabidae) in woody habitats of a hedgerow network landscape: a
radio-tracing study. Agriculture, Ecosystems & Environment 61, 133-144.
Chiverton, P. A., 1988. Searching behaviour and cereal aphid consumption by
Bembidion lampros and Pterostichus cupreus, in relation to temperature and prey
density. Entomologia Experimentalis et Applicata 47, 173–182.
Collinge, S., 2000. Effects of grassland fragmentation on insect species loss,
colonization, and movement patterns. Ecology 81, 2211–2226.
Dent, D., 2000. Insect Pest Management. CAB International, London.
Döring, T. F., Kromp, B., 2003. Which carabid species benefit from organic
agriculture? - A review of comparative studies in winter cereals from Germany and
Switzerland. Agriculture, Ecosystems & Environment 98, 153–161.
Firle, S., Bommarco, R., Ekbom, B., Natiello, M., 1998. The influence of movement
and resting behavior on the range of three carabid beetles. Ecology 79, 2113-2122.
Fournier, E., Loreau, M., 2001. Respective roles of recent hedges and forest patch
remnants in the maintenance of ground-beetle (Coleoptera: Carabidae) diversity in
an agricultural landscape. Landscape Ecology 16, 17-32.
Fournier, E., Loreau, M., 2001. Respective roles of recent hedges and forest patch
remnants in the maintenance of ground-beetle (Coleoptera: Carabidae ) diversity in
an agricultural landscape. Landscape Ecology 16, 17–32.
Frampton, G. K., Çilgi, T., Fry, G. L. A., Wratten, S.D., 1995. Effects of grassy banks
on the dispersal of some carabid beetles (Coleoptera: Carabidae) on farmland.
Biological Conservation 71, 347–355.
Fry, G. L. A., Robson, W. G., 1994. Effect of field margins on butterfly movement.
In: Boatman, N. D. (ed.) Field margins: integrating agriculture and conservation.
British Crop Protection Council Monograph. No. 58, BCPC Publications, Thornton
Heath Surrey, pp. 111-16.
Garcia, A. F., Griffiths, G. J. K., Thomas, C.F.G., 2000. Density, distribution and
dispersal of the carabid beetle Nebria brevicollis in two adjacent cereal fields.
Annals of Applied Biology 137, 89–97.
Hedin, J., Ranius, T., Nilsson, S. G., Smith, H. G., 2008. Restricted dispersal in a
flying beetle assessed by telemetry. Biodiversity and Conservation 17, 675-684.
79
Irmler, U., 2000. Changes in the fauna and its contribution to mass loss and N release
during leaf litter decomposition in two deciduous forests. Pedobiologia 44, 105–
118.
Irmler, U., Hölker, F., Pfeiffer, H., Nellen, W., 2008. Biocoenotic Interactions
between Different Ecotopes. In: Fränzle, O., Kappen, L., Blume, H.-P., Dierssen, K.
(eds.) Ecosystem organization of a complex landscape. Long-term research in the
Bornhöved Lake District, Germany. Springer, Berlin, 147-167.
Jopp, F., 2006. The impact of local spatial resistance on the movement behaviour of
Tenebrio molitor L. Central European Journal of Biology 1, 412-429
Koivula, M.J., 2011. Useful model organisms, indicators, or both? Ground beetles
(Coleoptera, Carabidae) reflecting environmental conditions. ZooKeys 317, 287–
317.
Krebs, J.R., Wilson, J.D., Bradbury, R.B., Siriwardena, G.M., 1999. The second
Silent Spring? Nature 400, 611–612.
Kromp, B., 1999. Carabid beetles in sustainable agriculture: a review on pest control
efficacy, cultivation impacts and enhancement. Agriculture, Ecosystems &
Environment 74, 187–228.
Kromp, B., Steinberger, K. -H., 1992. Grassy field margins and arthropod diversity: a
case study on ground beetles and spiders in eastern Austria (Coleoptera: Carabidae;
Arachnida: Aranei, Opiliones). Agriculture, Ecosystems & Environment 40, 71–93.
Lys, J. -A., Zimermann, M., Nentwig, W., 1994. Increase in activity and species
number of carabid beetles in cereals as a result of strip-management. Entomologia
Experimentalis et Applicata 73, 1-9.
Maelfait, J. -P., De Keer, R., 1990. The border zone of an intensively grazed pasture
as a corridor for spiders araneae. Biological Conservation 54, 223–238.
Mauremooto, J. R., Wratten, S.D., Worner, S.P., Fry, G.L.A., 1995. Permeability of
hedgerows to predatory carabid beetles 52, 141–148.
Niehues, F. -J., Hockmann, P., Weber, F., 1996. Genetics and dynamics of a Carabus
auronitens metapopulation in the Westphalian Lowlands (Coleoptera, Carabidae).
Ann. Zool. Fennici 33, 85-96.
Riecken U., Raths U., 1996. Use of radio telemetry for studying dispersal and habitat
use of Carabus coraceus L. Ann. Zool. Fenn. 33: 109-116.
Roweck, V. H., 2008. Die Aktuelle und potenzielle Floristishe Diversität der
Feldfluren auf Hof Ritzerau. Fauistisch-Ökologische Mitteilungen, Supplement 35,
103-122.
80
Schreiner, R., Irmler, U., 2010. Mobility and spatial use of the ground beetle species
Elaphrus cupreus and Elaphrus ulginosus (Coleoptera: Carabidae). Entomologia
Generalis 32, 165-179.
Schröter, L., Irmler, U., 2013. Organic cultivation reduces barrier effect of arable
fields on species diversity. Agriculture, Ecosystems & Environment 164, 176–180.
Statsoft Inc., 2004. Statistica for Windows (Software-System für Datenanalyse)
Version 6. www.statsoft.com
Thomas, M.B., Wratten, S.D., Sotherton, N.W., Thomas, A.M.B., 1991. Creation of
“Island” Habitats in Farmland to Manipulate Populations of Beneficial Arthropods:
Predator Densities and Emigration. Journal of Applied Ecology 28, 906–917.
Tischendorf, L., Irmler, U., Hingst, R., 1998. A simulation experiment on the
potential of hedgerows as movement corridors for forest carabids. Ecologcal
Modelling 106, 107-118.
Vermeulen, R., 1994. The effect of different vegetation structures on the dispersal of
carabid beetles from poor sandy heaths and grasslands. In: K. Desender, M.
Dufrêne, M. Loreau, M.L. Luff and J.-P. Maelfait (eds.) Carabid Beetles: Ecology
and Evolution, Vol. 51, pp. 387–392. Kluwer Academic Publishers, Dordrecht, The
Netherlands.
Wallin, H., Ekbom, B., 1994. Influence of Hunger Level and Prey Densities on
Movement Patterns in Three Species of Pterostichus Beetles (Coleoptera :
Carabidae). Environmental Entomology 23 (11), 1171-1181.

81
Chapter 4
General Conclusions
The role of biodiversity for sustainable food production and biological control of
notorious pests is well understood. In ecological engineering, the habitat conservation
and habitat heterogeneity are considered key elements for biodiversity and future
sustainable food production. The present studies present an outlook of the role of
grassy field strips in organic agroecosystems to determine their effects on the most
common carabid species, on their groups based on the body size, and red-listed
species status. It also extends its range on the importance of the age of grassy strips
for abundance and biodiversity of arable fields’ carabids and on their dispersal and
movement for invasion from natural and semi-natural habitats to crop fields. The
results of invasion of carabids from grassy strips to arable crops are presented in two
ways. First, by interpreting transect data of one year using pitfall traps, and second, by
using the mark-recapture method in both spring and autumn season. Thus, the first
way uses the place for time method to analyse the invasion of carabids, whereas the
second way uses the direct investigation of the invasion process.
The first major findings of this work are related to the carabid species which benefit
from grassy strips in organic agriculture. For this the different ecological groups
(guilts) were used and only soil pH and tree cover explained the effects significantly.
The species composition in the investigations resembled the most common carabid
assemblage of arable fields on loamy soils in Schleswig-Holstein. Typical field
margin species that used the grassy strips as corridors into arable fields were Carabus
nemoralis, C. coriaceous, and P. strenuus. All three species can be described as
euryecious species having a weak preference for forests (Irmler & Gürlich 2004).
They invaded from the field margins to crop using the grassy strips and rarely crossed
into arable fields. Among these three species, C. nemoralis revealed the highest
mobility, as it was found in high dominance at a distance of up to 90 m in the grassy
strips. Dominance of C. coriaceus drastically declined at a distance of 30 to 60 m
from the field margin; the dominance of P. strenuus was generally low in strips and
arable fields.
82
The species that prefer open habitats, e.g. P. cupreus, P. versicolor, and Amara
similata, used field strips. They increased in dominance with an increase in distance
from the field margin, except for A. similata that declined in 150 m distance from
field margin. Thus, it can be assumed that field strips support these species, in
particular, as they were found in higher dominances in strips than in field margins. In
this study, grassy strips did not support the invasion of Anchomenus dorsalis which is
considered to overwinter in hedges of field margins and invades arable fields in the
spring from overwintering sites (Jensen et al., 1989; Maudsley et al., 2002).
The effects of grassy strips were not found on endangered and differently sized
species, because the composition of carabid sizes did not differ between arable fields
and grassy strips. However, field margins revealed a different size composition. In
field margins, the percentage of very large species (> 15 mm) was higher than in
grassy strips and arable fields, whereas the number of small (< 5 mm) species was
lower. This can be an effect of the higher stability of field margins compared to grassy
strips. Whereas grassy strips in our studies did not execeed an age of 10 years, field
margins were much older. In grassy strips and arable fields, intermediate species
between 5 mm and 15 mm dominated. Due to their high mobility, the medium sized
carabids benefited from the grassy strips and arable crops and they were not sensitive
to agricultural practices. In conclusion, the benefits of grassy strips in organic farming
could be well understood when the ecological needs of the species using these
habitats and their corresponding dispersal potential are considered. The classification
of carabids into different food preference type and size groups was necessary to
analyse the role of grassy strips and provided specific results, which might be masked
if the data are interpreted only for carabid species in total.
Overall, due to environment friendly practices, organic farming brings the arable
fields closer to the natural conditions as compared to conventional farming. Thus, the
grassy strips might have a minor value for biodiversity in organic agriculture. In
addition, mostly the grassy strips are established for two to three years. After this time
they are normally rotavated and developed at another site to combat the problem of
thistle abundance. As the comparison between grassy strips and field margins shows,
the age of semi-natural habitats in the agricultural landscape is of high importance.
The higher species richness in the field edges and grassy strips when compared to a
huge crop area without grassy strips (control field) and cropping areas close to grassy
strips revealed that the need of grassy structures in organic agriculture could not be
neglected. When the grassy strips have a promising role in organic agriculture, the
83
question arises how long the grassy strips should be kept to get higher advantages. In
this work, 9-10 years old grassy strips amplified higher species richness and
biodiversity than young strips of 1- 2 years. However, the overall farming
management causes the highest effects on carabid assemblages that covers the effects
of soil conditions, microclimate situations and minor varying pactices as already
found in studies with a large number of arable fields and different farming practices
(Irmler 2003). Therefore, strong similarities of carabid assemblages in the different
habitats (field edges, grassy strips, crops along grassy strips, crop in the crop fields
without grassy strip in neighborhood) were also found in the present study. Based on
this effect, the biodiversity and species richness in the arable landscape are low in
general and provide only small ranges of enhancement.
The effects of natural and semi-natural habitats on the adjacent crops were
investigated by using additional pitfall transects in the crop field area close to the
grassy strips. If only the field centres are selected in the anlyses, the masking effect of
field edges could be diminished. The results in grassy strips with an age of 9 years
supported our hypothesis that also in organic farming grassy strips can increase
species richness and biodiversity in the surrounding arable crops. Moreover, a
significant increase in the dominant species was found with the age of the grassy
strips. Most importantly, carnivorous species benefited from old grassy strips. So, the
old grassy strips seem to share a higher role in biological control as compared to the
younger grassy strips. When the distance from the natural habitats increases, the effect
on the biodiversity and species richness is decreaseing. On the other hand, activity
density increases by increasing distance from field margins, which can be referred to
the open ground conditions and food supply that causes a higher activity, speed, and
dispersion as found in the movement experiment.
Other findings of the present investigations concern the invasion of carabids from
semi-natural habitats to the arable crops and the direction used for the invasion.
Analysing the invasion process, the distances covered by the invasive species are very
important. This study presents a high range of values for distances and speeds as
found also in other studies. This variability was explained by the flexible behaviour of
field carabids and the different spatio-temporal conditions in the studies.
All major carabids investigated in the mark-recapture experiment (e.g. P. melanarius,
C. auratus, Poecilus spp) travelled longer distances in cropping areas than in grassy
strips. The rate of displacement was different in different crops for P. melanarius that
moved faster in wheat crop than in pumpkin and clover. Most of the beetles moved

84
more slowly in the clover crop than in wheat or pumpkin, which shows that in clover
the environmental conditions resemble those in grassy margins.
The importance of hedges in arable ecosystems was found by the results on C.
nemoralis, which preferred to move along the grassy strips with hedge and avoided to
enter into the crop centre, if only grassy strips without hedge are offered. The same
species was totally absent in the huge field centres. So, species which are restricted to
shadow habitat conditions during their lifetime, only the availability of hedges and
grassy strips with hedges could establish them successfully.
While moving from the grassy structures to the crop centres, the carabids reacted in
different ways. The species that are mainly found in arable fields, e.g., Pterostichus
melanarius, preferred to enter the crop directly. Poecilus spp. highly preferred a
grassy strip to enter into crop land and avoided a grassy strip along a hedge or to enter
directly the crop fields. The movement of Nebria brevicollis was mainly parallel to
the grassy strip. In contrast, P. niger moved both inside and along the grassy strips.
The diversity of preferences in carbids to use grassy strips for their dispersal shows
that the value of grassy strips depend on the specific demands of the species and
reflect very complex reactions of the fauna in the arable landscape.
In conclusion, the natural and semi-natural habitats support at least several carabid
species based on their ecological needs and support the biodiversity and species
richness in the agricultural landscape. With passing time, the benefits of the grassy
strips increase. If they are maintained for at least one decade, they provide higher
biodiversity both inside their area and in the surrounding arable crops. In general, the
grassy structures support at least several speficic carabids to move into the arable crop
land, which would be not found there if these structures are absent.
85
References for Chapter 1, 2 and 4
Alghali, A. M., 1993. Intercropping as a component in insect pest-management for
grain cowpea, Vigna unguiculata, production in Nigeria. Insect Science and its
Application 14, 49–54.
Anjum-Zubair, M., Schmidt-Entling, M. H., Querner, P., Frank, T., 2010. Influence of
within-field position and adjoining habitat on carabid beetle assemblages in winter
wheat. Agricultural and Forest Entomology 12, 301–306.
Armstrong, G., 1995. Carabid beetle (Coleoptera: Carabidae) diversity and abundance
in organic potatoes and conventionally grown seed potatoes in the north of Scotland.
Pedobiologia 39, 231–237.
Baulcombe, D., Crute, I., Davies, B., Dunwell, J., Gale, M., Jones, J., Pretty, J.,
Sutherland, W., Toulmin, C., 2009. Reaping the benefits: science and the sustainable
intensification of global agriculture. Journal of Applied Psychology 2, 86.
Bengtsson, J., Ahnström, J., Weibull, A. -C., 2005. The effects of organic agriculture
on biodiversity and abundance: a meta-analysis. Journal of Applied Ecology 42,
261–269.
Benton, T.G., Vickery, J. A., Wilson, J. D., 2003. Farmland biodiversity: is habitat
heterogeneity the key? Trends in Ecology & Evolution 18, 182–188.
Bianchi, F. J. J. A., Goedhart, P.W., Baveco, J.M., 2008. Enhanced pest control in
cabbage crops near forest in The Netherlands. Landscape Ecology 23, 595–602.
Bilde, T., Toft, S., 1997. Consumption by carabid beetles of three cereal aphid species
relative to other prey types. Entomophaga 42, 21–32.
Billeter, R., Liira, J., Bailey, D., Bugter, R., Arens, P., Augenstein, I., Aviron, S.,
Baudry, J., Bukacek, R., Burel, F., Cerny, M., De Blust, G., De Cock, R., Diekötter,
T., Dietz, H., Dirksen, J., Dormann, C., Durka, W., Frenzel, M., Hamersky, R.,
Hendrickx, F., Herzog, F., Klotz, S., Koolstra, B., Lausch, A., Le Coeur, D.,
Maelfait, J.P., Opdam, P., Roubalova, M., Schermann, A., Schermann, N., Schmidt,
T., Schweiger, O., Smulders, M. J. M., Speelmans, M., Simova, P., Verboom, J., Van
Wingerden, W. K. R. E., Zobel, M., Edwards, P. J., 2008. Indicators for biodiversity
in agricultural landscapes: a pan-European study. Journal of Applied Ecology 45,
141–150.
Bohan, D. A., Bohan, A.C., Glen, D. M., Symondson, W. O. C., Wiltshire, C. W.,
Hughes, L., 2000. Spatial dynamics of predation by carabid beetles on slugs. Journal
of Animal Ecology 69, 367–379.
86
Booij, C. J. H., Noorlander, J., 1992. Farming systems and insect predators.
Agriculture, Ecosystems & Environment 40, 125–135.
Brouwers, N. C., Newton, A. C., 2009. Movement rates of woodland invertebrates: a
systematic review of empirical evidence. Insect Conservation and Diversity 2, 10–
22.
Burel, F., Baudry, J., 1995. Species biodiversity in changing agricultural landscapes: A
case study in the Pays d’Auge, France. Agriculture, Ecosystems & Environment 55,
193–200.
Canada, E., Service, C.W., 2001. Bird use of three types of field margins in relation to
intensive agriculture in Québec, Canada 84, 131–143.
Carson, R, Darling L., Darling L., 1992. Silent spring. Boston, Houghton Mifflin,
Cambridge, MA, Riverside Press, 1962. 368.
Clough, Y., Holzschuh, A., Gabriel, D., Purtauf, T., Kleijn, D., Kruess, A., Steffan-
Dewenter, I., Tscharntke, T., 2007. Alpha and beta diversity of arthropods and plants
in organically and conventionally managed wheat fields. Journal of Applied Ecology
44, 804–812.
Cohen, J., Pimm, S., Yodzis, P., Saldaña, J., 1993a. Body sizes of animal predators
and animal prey in food webs. Journal of Animal Ecology. 62 (1) 67-78.
Cohen, J.E., Beaver, R. A., Cousins, S. H., DeAngelis, D. L., Goldwasser, L., Heong,
K. L., Holt, R. D., Kohn, a. J., Lawton, J.H., Martinez, N., O’Malley, R., Page, L.
M., Patten, B. C., Pimm, S.L., Polis, G. a., Rejmanek, M., Schoener, T. W.,
Schoenly, K., Sprules, W. G., Teal, J. M., Ulanowicz, R. E., Warren, P. H., Wilbur,
H. M., Yodzis, P., 1993b. Improving Food Webs. Ecology. 74:252–258.
Crowder, D.W., Northfield, T.D., Strand, M.R., Snyder, W.E., 2010. Organic
agriculture promotes evenness and natural pest control. Nature 466, 109–12.
Denno, R.E., Roderick, G.K., Peterson, M.A., Huberty, A.F., Dobel, H.G., Eubanks,
M.D., Losey, J.E., Langellotto, G.A., 1996. Habitat persistence underlies
intraspecific variation in the dispersal strategies of planthoppers. Ecological
Monographs 66, 389–408.
Denys, C., Tscharntke, T., 2002. Plant-insect communities and predator-prey ratios in
field margin strips, adjacent crop fields, and fallows 315–324.
Donald, P.F., Evans, A.D., 2006. Habitat connectivity and matrix restoration: the
wider implications of agri-environment schemes. Journal of Applied Ecology 43,
209–218.
Döring, T.F., Kromp, B., 2003. Which carabid species benefit from organic
agriculture?—a review of comparative studies in winter cereals from Germany and

87
Switzerland. Agriculture, Ecosystems & Environment 98, 153–161.
Dover, J., Settele, J., 2008. The influences of landscape structure on butterfly
distribution and movement: a review. Journal of Insect Conservation 13, 3–27.
Drapela, T., Moser, D., G. Zaller, J., Frank, T., 2008. Spider assemblages in winter
oilseed rape affected by landscape and site factors. Ecography. 31 (2) 254–262.
Evans, A.D., Green, R.E., 2007. An example of a two-tiered agri-environment scheme
designed to deliver effectively the ecological requirements of both localised and
widespread bird species in England. Journal of Ornithology 148, 279–286.
Fahrig, L., 2003. Effects of Habitat Fragmentation on Biodiversity. Annual Review of
Ecology Evolution and Systematics 34, 487–515.
FAOSTAT (2009). Food and agricultural commodities production. Available online at:
http://faostat.fao.org/ site/339/default.aspx.
Fournier, E., Loreau, M., 1999. Effects of newly planted hedges on ground-beetle
diversity (Coleoptera, Carabidae) in an agricultural landscape 1, 87–97.
Frampton, G.K., Çilgi, T., Fry, G.L. a., Wratten, S.D., 1995. Effects of grassy banks
on the dispersal of some carabid beetles (Coleoptera: Carabidae) on farmland.
Biological Conservation 71, 347–355.
Frank, T., Aeschbacher, S., Barone, M., Künzle, I., Lethmayer, C., Mosimann, C.,
2009. Beneficial arthropods respond differentially to wildflower areas of different
age 2450, 465–480.
Frank, T., Reichhart, B., 2007. Staphylinidae and Carabidae overwintering in wheat
and sown wildflower areas of different age. Bulletin of Entomological Research 94,
209–217.
Fujita, A., Maeto, K., Kagawa, Y., Ito, N., 2008. Effects of forest fragmentation on
species richness and composition of ground beetles (Coleoptera: Carabidae and
Brachinidae) in urban landscapes. Entomological Science 11, 39–48.
Fuller, R.J., Norton, L.R., Feber, R.E., Johnson, P.J., Chamberlain, D.E., Joys, A. C.,
Mathews, F., Stuart, R.C., Townsend, M.C., Manley, W.J., Wolfe, M.S., Macdonald,
D.W., Firbank, L.G., 2005. Benefits of organic farming to biodiversity vary among
taxa. Biology letters 1, 431–4.
Gabriel, D., Tscharntke, T., 2007. Insect pollinated plants benefit from organic
farming. Agriculture, Ecosystems & Environment 118, 43–48.
Gibson, R.H., Pearce, S., Morris, R.J., Symondson, W.O.C., Memmott, J., 2007. Plant
diversity and land use under organic and conventional agriculture: a whole-farm
approach. Journal of Applied Ecology 44, 792–803.
Godfray, H.C.J., Beddington, J.R., Crute, I.R., Haddad, L., Lawrence, D., Muir, J.F.,

88
Pretty, J., Robinson, S., Thomas, S.M., Toulmin, C., 2010. Food security: the
challenge of feeding 9 billion people. Science 327, 812–818.
Grandchamp, A., Niemelä, J., Kotze, J., 2000. The effects of trampling on
assemblages of ground beetles (Coleoptera, Carabidae) in urban forests in Helsinki,
Finland. Urban Ecosystems 358, 321–332.
Greenwood, J. J., 1995. A second silent spring? Trends in Ecological Evolution 10 (7),
264–6.
Green, R. E., Cornell, S.J., Scharlemann, J. P. W., Balmford, A., 2005. Farming and
the fate of wild nature. Science (New York) 307, 550–5.
Greenslade, P. J. M., 1964. Pitfall trapping as a method for studying populations of
Carabidae (Coleoptera). The Journal of Animal Ecology 33, 301–310.
Greaves, M. P. and Marshall, E. J. P., 1987. Field margins: Definations and statictics.
In: Field Margins. Way, J. M., and Greig-Smith, P. W. (Eds.). Monograph No. 35.
British Crop Protection Council,Thornton Heath, Surrey, pp. 3-10.
Günter, M. (2000) Anlage und Pflege von mehrjährigen Buntbrachen unter den
Rahmenbedingungen des schweiz- erischen Ackerbaugebietes. Agrarökologie 37, 1–
154.
Hajek, A.E., Hannam, J. J., Nielsen, C., Bell, A. J., Liebherr, J. K., 2007. Distribution
and Abundance of Carabidae (Coleoptera) Associated with Soybean Aphid
(Hemiptera: Aphididae) Populations in Central New York. Annals of the
Entomological Society of America 100, 876–886.
Hassall, M., Hawthorne, A., Maudsley, M., 1992. Effects of headland management on
invertebrate communities in cereal fields. Agriculture, Ecosystems 40, 155–178.
Hawthorne, A., Hassall, M., Sotherton, N., 1998. Effects of cereal headland
treatments on the abundance and movements of three species of carabid beetles.
Applied Soil Ecology 9, 417–422.
Hedin, J., Ranius, T., Nilsson, S. G., Smith, H. G., 2008. Restricted dispersal in a
flying beetle assessed by telemetry. Biodiversity & Conservation 17, 675–684.
Hobbs, R.J., 1992. The role of corridors in conservation: Solution or bandwagon?
Trends in Ecology & Evolution 7, 389–392.
Irmler, U., 2000. Changes in the fauna and its contribution to mass loss and N release
during leaf litter decomposition in two deciduous forests. Pedobiologia 44, 105–
118.
Irmler, U., 2003. The Spatial and Temporal Pattern of Carabid beetles on Arable
Fields in Northern Germany (Schleswig-Holstein) and Their Value as Ecological
Indicators, Agriculture, Ecosystem and Environment, 98 (1-3), 141-151.

89
Irmler, U., Gülrich, S., 2004. Die ökologische Einodnung der Laufkäfer (Coleoptera:
Carabidae) in Schleswig-Holstein. – Faunistisch-Ökologische Mitteilungen,
Supplement 32, 1–117.
Jensen, T. S., Drying, L., Kristensen, B., Nielsen, B.O. Rasmussen, E. R., 1989. Spring
dispersal and summer habitat distribution of Agonum dorsale (Coleoptera:
Carabidae). Pedobiologia 33, 155–165.
Kajak, A., Oleszczuk, M., 2004. Effect of shelterbelts on adjoining cultivated fields:
patrolling intensity of carabid beetles (Carabidae) and spiders (Araneae). Polish
journal of ecology. 52 (2). 155-172.
Kareiva, P.M., 1987. Habitat fragmentation and the stability of predator–prey
interactions. Nature 321, 388–391.
Kleijn, D., Berendse, F., Smit, R., Gilissen, N., 2001. Agri-environment schemes do
not effectively protect biodiversity in Dutch agricultural landscapes. Nature 413,
723–5.
Kleijn, D., Sutherland, W.J., 2003. How effective are European agri-environment
schemes in conserving and promoting biodiversity? Journal of Applied Ecology 40,
947–969.
Kotze, D.J., Brandmayr, P., Casale, A., Dauffy-Richard, E., Dekoninck, W., Koivula,
M.J., Lövei, G.L., Mossakowski, D., Noordijk, J., Paarmann, W., Pizzolotto, R.,
Saska, P., Schwerk, A., Serrano, J., Szyszko, J., Taboada, A., Turin, H., Venn, S.,
Vermeulen, R., Zetto, T., 2011. Forty years of carabid beetle research in Europe -
from taxonomy, biology, ecology and population studies to bioindication, habitat
assessment and conservation. ZooKeys 148, 55–148.
Krebs, J.R., Wilson, J.D., Bradbury, R.B., Siriwardena, G.M., 1999. The second Silent
Spring? Nature 400, 611–612.
Kremen, C., 2008. Crop pollination services from wild bees, in: Bee Pollination in
Agricultural Ecosystems. Oxford University Press, pp. 10–27.
Kromp, B., 1989. Carabid beetle communities (Carabidae, coleoptera) in biologically
and conventionally farmed agroecosystems. Agriculture, Ecosystems and
Environment 27, 241–251.
Kromp, B., 1990. Carabid beetles (Coleoptera, Carabidae) as bioindicators in
biological and conventional farming in Austrian potato fields. Biology and Fertility
of Soils. 9, 182–187.
Kromp, B., 1999. Carabid beetles in sustainable agriculture: a review on pest control
efficacy, cultivation impacts and enhancement. Agriculture, Ecosystems and
Environment 74, 187–228.

90
Kruess, a, Tscharntke, T., 1994. Habitat fragmentation, species loss, and biological
control. Science (New York, N.Y.) 264, 1581–4.
Lagerlöf, J., Stark, J., Svensson, B., 1992. Margins of agricultural fields as habitats
for pollinating insects. Agriculture, Ecosystems & Environment 40, 117–124.
Landis, D., Wratten, S., Gurr, G., 2000. Habitat management to conserve natural
enemies of arthropod pests in agriculture. Annual Review of Entomology. 45, 175–
201.
Larochelle, A. 1990. The food of carabid beetles (Coleoptera: Carabidae, including
Cicindelinae). Fabreries, Supplément 5: 1-132.
Legrand, A., Gaucherel, C., Baudry, J., Meynard, J.-M., 2011. Long-term effects of
organic, conventional, and integrated crop systems on Carabids. Agronomy for
Sustainable Development 31, 515–524.
Lindenmayer, D. B., Margules, C. R., Botkin D. B., 2000. Indicators of biodiversity
for ecologically sustainable forest management. Conservation Biology 14: 941–950.
Lövei, G. L., Sunderland, K. D., 1996. Ecology and behavior of ground beetles
(Coleoptera: Carabidae). Annual Review of Entomology 41, 231–256.
Luff, M. L., 1987. Biology of polyphagous ground beetles in agriculture. Agriculture
and Zoology Reviews 2: 237–278.
Lys, J., Nentwig, W., 1992. Augmentation of beneficial arthropods by strip-
management. Oecologia 373–382.
Lys, J.-A., Zimmermann, M., Nentwig, W., 1994. Increase in activity density and
species number of carabid beetles in cereals as a result of strip-management.
Entomologia Experimentalis et Applicata 73, 1–9.
Macfadyen, S., Gibson, R., Polaszek, A., Morris, R.J., Craze, P.G., Planqué, R.,
Symondson, W.O.C., Memmott, J., 2009. Do differences in food web structure
between organic and conventional farms affect the ecosystem service of pest
control? Ecology letters 12, 229–38.
Maeda, T., 2005. Bird use of rice field strips of varying width in the Kanto Plain of
central Japan. Agriculture, Ecosystems & Environment 105, 347–351.
Maeder, P., Fliessbach, A., Dubois, D., Gunst, L., Fried, P., Niggli, U., 2002. Soil
fertility and biodiversity in organic farming. Science 296, 1694–1697.
Magura, T., Tóthmérész, B., Molnár, T., 2004. Changes in carabid beetle assemblages
along an urbanisation gradient in the city of Debrecen, Hungary. Landscape Ecology
19, 747–759.
Manhoudt, A.G., De Snoo, G., 2003. A quantitative survey of semi-natural habitats on
Dutch arable farms. Agriculture, Ecosystems and Environment 97, 235–240.

91
Marshall, E.J., Moonen, a. ., 2002. Field margins in northern Europe: their functions
and interactions with agriculture. Agriculture, Ecosystems and Environment 89, 5–
21.
Marshall, E.J.P., 2002. Introducing field margin ecology in Europe. Agriculture,
Ecosystems and Environment 89, 1–4.
Maudsley, M., Seeley, B., Lewis, O., 2002. Spatial distribution patterns of predatory
arthropods within an English hedgerow in early winter in relation to habitat
variables. Agriculture, Ecosystems and Environment 89, 77–89.
Menalled, F. D., Lee, J.C., Landis, D.A., 2001. Herbaceous filter strips in
agroecosystems: Implications for ground beetle (Coleoptera : Carabidae)
conservation and invertebrate weed seed predation. Great Lakes Entomologist 34,
77–91.
Menalled, F. D., Smith, R.G., Dauer, J.T., Fox, T.B., 2007. Impact of agricultural
management on carabid communities and weed seed predation. Agriculture,
Ecosystems and Environment 118, 49–54.
Merckx, T., Feber, R.E., Riordan, P., Townsend, M.C., Bourn, N. A. D., Parsons,
M.S., Macdonald, D.W., 2009. Optimizing the biodiversity gain from agri-
environment schemes. Agriculture, Ecosystems and Environment 130, 177–182.
Maudsley, M., Seeley, B., Lewis, O. 2002. Spatial distribution of predatory arthropods
within an English hedgerow in early winter in relation to habitat variables. –
Agriculture, Ecosystems and Environment 89, 77–89.
Meyer, W., Turner, B., 1992. Human population growth and global land-use/cover
change. Annual review of ecology and systematics 23, 39–61.
Neumann, H., Loges, R., Taube, F., Bunting, R., 2001. Impact of organic agriculture
on diversity and abundance of farmland birds in an arable landscape with hedges.
Paper at: Joint Organic Congress, Odense, Denmark, May 30-31, 2006.
Nicholls, C., Altieri, M., 2004. Agroecological bases of ecological engineering for
pest management, in: Gurr, G., Wratten, S.D., Altieri, M. (Ed.), Ecological
Engineer-ing for Pest Management: Advances in Habitat Manipulation for
Arthropods. Comstock Publishing Associates, New York, pp. 33–54.
Niemelä, J., 2001. Carabid beetles (Coleoptera: Carabidae) and habitat fragmentation:
a review. European Journal of Entomology 98, 127–132.
Norton, L., Johnson, P., Joys, A., Stuart, R., Chamberlain, D., Feber, R., Firbank, L.,
Manley, W., Wolfe, M., Hart, B., Mathews, F., Macdonald, D., Fuller, R.J., 2009.
Consequences of organic and non-organic farming practices for field, farm and
landscape complexity. Agriculture, Ecosystems and Environment 129, 221–227.
92
O’Rourke, M.E., Heggenstaller, A.H., Liebman, M., Rice, M.E., 2006. Post-dispersal
weed seed predation by invertebrates in conventional and low-external-input crop
rotation systems. Agriculture, Ecosystems and Environment 116, 280–288.
Oberholzer, F., Escher, N., Frank, T., 2003. The potential of carabid beetles
(Coleoptera) to reduce slug damage to oilseed rape in the laboratory. European
Journal of Entomology 100, 81–86.
Östman, Ö., Ekbom, B., Bengtsson, J., Weibull, A. C., 2001. Landscape complexity
and farming practice influence the condition of polyphagous carabid beetles.
Ecological Applications 11, 480–488.
Pearsall, I.A., Walde, S.J., 1995. A comparison of epigaeic coleoptera assemblages in
organic, conventional, and abandoned orchards in Nova Scotia, Canada. Canadian
Entomologist 127, 641–658.
Pfiffner, L., Luka, H., 2000. Overwintering of arthropods in soils of arable fields and
adjacent semi-natural habitats. Agriculture, Ecosystems and Environment 78, 215–
222.
Pimentel, D., 1961. The influence of plant spatial patterns on insect populations.
Annals of the Entomological Society of America 54, 61–69.
Pingali, P.L., 2012. Green revolution: impacts, limits, and the path ahead. Proceedings
of the National Academy of Sciences of the United States of America 109, 12302–8.
Pollard, E., Hooper, M. D., Moore, N. W., 1974. Hedges. Collins, London.
Purtauf, T., Roschewitz, I., Dauber, J., Thies, C., Tscharntke, T., Wolters, V., 2005.
Landscape context of organic and conventional farms: Influences on carabid beetle
diversity. Agriculture, Ecosystems and Environment 108, 165–174.
Rainio, J., Niemela, J., 2003. Ground beetles (Coleoptera: Carabidae) as bioindicators.
Biodiversity and Conservation 12, 487–506.
Ranius, T., Hedin, J., 2001. The Dispersal Rate of a Beetle, Osmoderma eremita,
Living in Tree Hollows. Oecologia 126, 363–370.
Ranjha, M., Irmler, U., 2013. Age of grassy strips influences biodiversity of ground
beetles in organic agro-ecosystems, Agricultual Sciences (in press).
Reaping the benefits: Science and the sustainable intensification of global agriculture.
2009. The Royal Society, London.
Risch, S.J., Andow, D., Altierf, M.A., 1983. Agroecosystem diversity and pest
control : Data, tentative conclusions, and new research directions. Environmental
Entomology 12, 625–629.
Root, R.B., 1973. Organization of a plant-arthropod association in simple and diverse
habitats: the fauna of collards (Brassica oleracea). Ecological Monographs 43, 95–
93
124.
Russell, E.P., 1989. Enemies hypothesis- A review of the effect of vegetational
diversity on predatory insects and parastoids. Environmental Entomology 18, 590–
599.
Sandhu, H., Porter, J., Wratten, S., 2013. Experimental Assessment of Ecosystem
Services in Agriculture, in: Ecosystem Services in Agricultural and Urban
Landscapes. A John Wiley and Sons, pp. 122–135.
Saska, P., Vodde, M., Heijerman, T., Westerman, P., Van der Werf, W., 2007. The
significance of a grassy field boundary for the spatial distribution of carabids within
two cereal fields. Agriculture, Ecosystems and Environment 122, 427–434.
Scheu, S., 2001. Basic and Applied Ecology Plants and generalist predators as links
between the below-ground and above-ground system 13, 3–13.
Schmidt, M.H., Tscharntke, T., 2005. The role of perennial habitats for Central
European farmland spiders. Agriculture, Ecosystems and Environment 105, 235–
242.
Schmidt-Entling, M.H., Döbeli, J., 2009. Sown wildflower areas to enhance spiders in
arable fields. Agriculture, Ecosystems and Environment 133, 19–22.
Schtickzelle, N., Joiris, A., Van Dyck, H., Baguette, M., 2007. Quantitative analysis of
changes in movement behaviour within and outside habitat in a specialist butterfly.
BMC Evolutionary Biology 7, 4.
Shah, P. A., Brooks, D.R., Ashby, J.E., Perry, J.N., Woiwod, I. P., 2003. Diversity and
abundance of the coleopteran fauna from organic and conventional management
systems in southern England. Agricultural and Forest Entomology 5, 51–60.
Steffan-Dewenter, I., Tscharntke, T., 2000. Resource overlap and possible competition
between honey bees and wild bees in central Europe. Oecologia 122, 288–296.
Strong, A.M., Dickert, C.A., Bell, R.T., 2002. Ski trail effects on a beetle (Coleoptera:
Carabidae, Elateridae) community in Vermont. Journal of Insect Conservation 6,
149–159.
Symondson, W.O.C., Cesarini, S., Dodd, P.W., Harper, G.L., Bruford, M.W., Glen,
D.M., Wiltshire, C.W., Harwood, J.D., 2006. Biodiversity vs. biocontrol: positive
and negative effects of alternative prey on control of slugs by carabid beetles.
Bulletin of Entomological Research 96, 637–645.
Symondson, W.O.C., McKemey, A.R., Glen, D.M., Brain, P., 2001. Effects of Slug
Size on Predation by Pterostichus melanarius ( Coleoptera : Carabidae ). Biocontrol
Science and Technology 11, 81–91.
Thies, C., Tscharntke, T., 1999. Landscape structure and biological control in

94
agroecosystems. Science (New York, N.Y.) 285, 893–5.
Thomas, M.B., Wratten, S.D., Sotherton, N.W., Thomas, A.M.B., 1991. Creation of
“Island” Habitats in Farmland to Manipulate Populations of Beneficial Arthropods:
Predator Densities and Emigration. Journal of Applied Ecology 28, 906–917.
Tilman, D., Cassman, K.G., Matson, P.A., Naylor, R., Polasky, S., 2002. Agricultural
sustainability and intensive production practices. Nature 418, 671–677.
Tscharntke, T., Bommarco, R., Clough, Y., Crist, T., Kleijn, D., Rand, T., Tylianakis,
J., Nouhuys, S., Vidal, S., 2007. Conservation biological control and enemy
diversity on a landscape scale. Biological Control 43, 294–309.
Tscharntke, T., Brandl, R., 2004. Plant-insect interactions in fragmented landscapes.
Annual Review of Entomology 49, 405–430.
Tscharntke, T., Kruess, A. 1999. Habitat Fragmentation and Biological Control. In:
Hawkins, B. A., and Cornell, H. V., Ed., Theoretical Approaches to Biological
Control, Cambridge University Press, Cambridge, 1999, pp. 190-205.
Tscharntke, T., Steffan-Dewenter, I., Kruess, A., Thies, C., 2002. Characteristics of
insect populations on habitat fragments: A mini review. Ecological Research 17,
229–239.
Varchola, J. M., Dunn, J. P., 2001. Influence of hedgerow and grassy field borders on
ground beetle (Coleoptera: Carabidae) activity in fields of corn. Agriculture,
Ecosystems and Environment 83, 153–163.
Vickery, J. a., Feber, R.E., Fuller, R.J., 2009. Arable field margins managed for
biodiversity conservation: A review of food resource provision for farmland birds.
Agriculture, Ecosystems and Environment 133, 1–13.
Vickery, J., Carter, N., Fuller, R.J., 2002. The potential value of managed cereal field
margins as foraging habitats for farmland birds in the UK. Agriculture, Ecosystems
and Environment 89, 41–52.
von Berg, K., Traugott, M., Scheu, S., 2012. Scavenging and active predation in
generalist predators: A mesocosm study employing DNA-based gut content analysis.
Pedobiologia 55, 1–5.
Wizen, G., Gasith, A., 2011. Predation of amphibians by carabid beetles of the genus
Epomis found in the central coastal plain of Israel. In: Kotze, D. J., Assmann, T.,
Noordijk, J., Turin, H., Vermeulen R., (Eds) Carabid Beetles as Bioindicators:
Biogeographical, Ecological and Environmental Studies. ZooKeys 100: 181–191.
Woodcock, B. A., Potts, S. G., Pilgrim, E., Ramsay, A. J., Tscheulin, T., Parkinson, A.,
Smith, R. E. N., Gundrey, A. L., Brown, V. K., Tallowin, J. R., 2006. The potential
of grass field margin management for enhancing beetle diversity in intensive

95
livestock farms. Journal of Applied Ecology 44, 60–69.
Zohary, D., Hopf, M., Weiss, E., 2012. Domestication of plants in the old world.
Fouth Edition. Oxford University Press.
Zehnder, G., Gurr, G. M., Kühne, S., Wade, M. R., Wratten, S. D., Wyss, E., 2007.
Arthropod pest management in organic crops. Annual review of entomology 52, 57–
80.
Zollner, P.A., Lima, S.L., 1997. Landscape-level perceptual abilities in white-footed
mice: perceptual range and the detection of forested habitat. Oikos 80, 51–60.

96
Crop areas Grassy strips Field Edges
Species/ Fields Cont. 2 4 9 2 4 9 Cont. 2 4 9
Acupalpus meridianus 15 2 4 0 1 1 0 0 0 0 0
Amara anthobia 0 3 0 0 1 0 0 0 0 0 0
Amara bifrons 2 0 0 0 0 0 0 0 0 0 0
Amara consularis 0 11 0 1 1 0 4 0 1 0 0
Amara plebeja 6 1 0 4 0 0 1 0 1 0 1
Anisodactylus binotatus 1 0 0 1 0 0 3 0 0 0 1
Bembidion guttula 0 0 0 0 0 1 0 0 0 1 0
Bembidion lunulatum 0 0 0 0 0 0 1 1 0 1 0
Bembidion
quadrimaculatum 70 2 1 19 0 0 1 0 0 0 1
Bradycellus harpalinus 0 0 1 0 0 1 0 0 0 0 0
Calathus erratus 0 1 0 0 0 0 0 0 0 0 0
Calathus melanocephalus 0 6 0 2 0 0 6 0 1 0 0
Carabus coriaceus 1 5 0 1 8 3 1 0 2 3 15
Carabus hortensis 0 0 0 0 0 0 1 0 0 0 12
Cychrus caraboides 0 0 0 0 0 1 0 0 1 0 0
Harpalus latus 1 2 2 8 3 0 16 1 1 0 2
Harpalus neglectus 0 0 0 1 0 0 0 0 0 0 0
Harpalus rufipalpis 1 0 1 1 0 2 1 0 0 0 0
Harpalus tardus 5 12 4 9 8 1 2 2 2 0 1
Leistus terminatus 0 0 0 0 0 1 0 0 0 0 0
Loricera pilicornis 33 4 12 2 2 0 2 1 1 0 0
Notiophilus biguttatus 3 0 3 7 0 1 1 0 0 0 1
Notiophilus palustris 0 0 0 0 0 0 0 1 0 0 3
Patrobus atrorufus 0 0 0 0 0 0 0 1 0 0 0
Pterostichus diligens 5 9 0 1 1 1 3 2 0 1 0
Pterostichus niger 4 15 1 0 3 6 0 0 3 0 0
Pterostichus nigrita 1 0 0 1 0 0 0 0 0 0 0
Pterostichus strenuus 2 5 0 0 0 3 7 0 0 2 6
Pterostichus vernalis 2 3 2 0 0 0 1 0 0 0 0
Trechoblemus micros 1 0 0 2 0 1 0 0 0 1 0
Trichocellus cognatus 0 1 0 0 0 0 0 0 1 0 0
Bembidion biguttatum 0 0 0 0 0 0 0 0 0 1 0
Leistus rufomarginatus 0 0 0 0 0 0 0 0 1 0 0
Harpalus signaticornis 2 4 0 0 4 0 0 1 0 0 0
Pterostichus
oblongopunctatus 0 0 0 0 0 0 0 0 0 0 8
Appendix 1: Sixty nice species not included in table 3.2.2 with their abundance in crop areas,
grassy strips and field edges; Fields 2,4, and 8 stand for the fields with 2-, 4-, and 9- year old
grassy strips; Cont. Stands for the control field
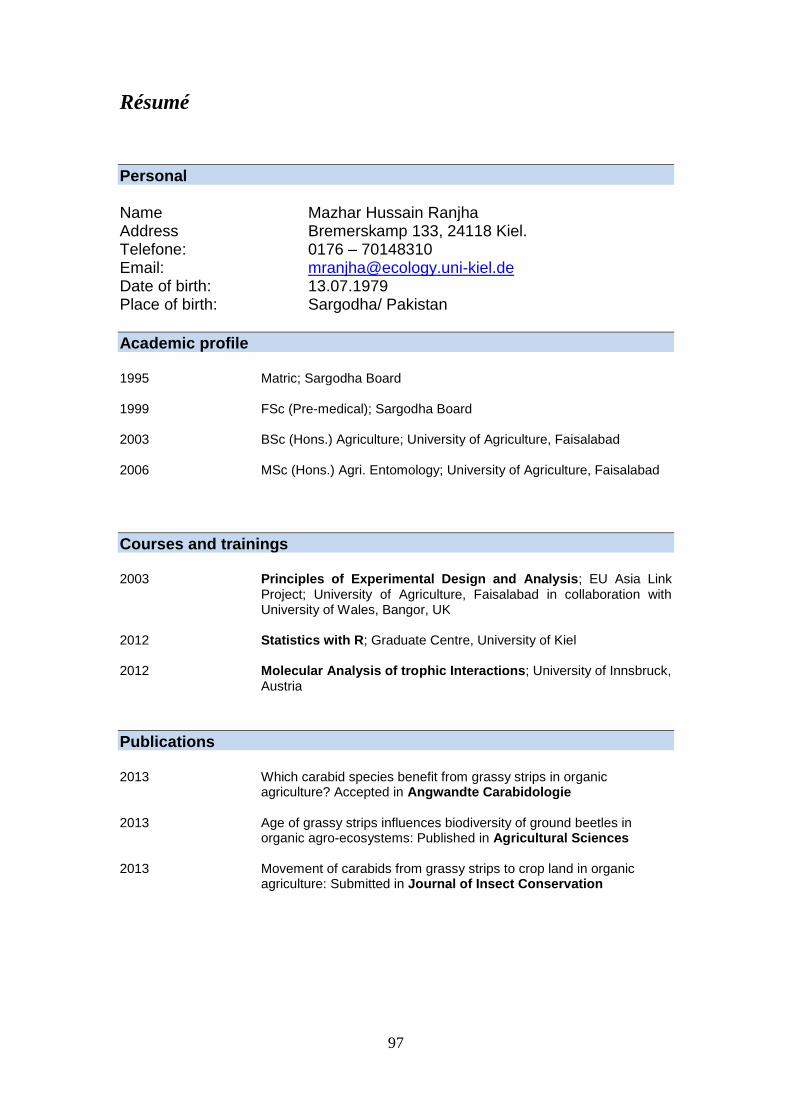
97
Résumé
Personal Name Mazhar Hussain Ranjha Address Bremerskamp 133, 24118 Kiel. Telefone: 0176 – 70148310 Email: [email protected] Date of birth: 13.07.1979 Place of birth: Sargodha/ Pakistan
Academic profile 1995 Matric; Sargodha Board 1999 FSc (Pre-medical); Sargodha Board 2003 BSc (Hons.) Agriculture; University of Agriculture, Faisalabad 2006 MSc (Hons.) Agri. Entomology; University of Agriculture, Faisalabad
Courses and trainings 2003 Principles of Experimental Design and Analysis; EU Asia Link
Project; University of Agriculture, Faisalabad in collaboration with University of Wales, Bangor, UK
2012 Statistics with R; Graduate Centre, University of Kiel 2012 Molecular Analysis of trophic Interactions; University of Innsbruck,
Austria
Publications 2013 Which carabid species benefit from grassy strips in organic
agriculture? Accepted in Angwandte Carabidologie 2013 Age of grassy strips influences biodiversity of ground beetles in
organic agro-ecosystems: Published in Agricultural Sciences 2013 Movement of carabids from grassy strips to crop land in organic
agriculture: Submitted in Journal of Insect Conservation