role of land use planning policies - united nations …archive.ias.unu.edu/resource_centre/working...
TRANSCRIPT

UNU-IAS Working Paper No. 162
Role of Land Use Planning Policies
For Urban Environmental Management:
Lessons from the City of Yokohama, Japan
Noriko Kono
March 2010

Role of Land Use Planning Policies
For Urban Environmental Management:
Lessons from the City of Yokohama, Japan
Abstract
Reducing transport sector emissions through changes in land use planning and modal shifts is one of the most important trends in environmental policy making in the present world. Numerous research projects have articulated the close relationship between gaseous emissions and land use planning, and many researchers have shown that land use and modal split variables can accurately predict gaseous emissions from the transport sector. Moreover, land use transportation models begun in 1960s are now thriving because of new needs for predicting the impact of global environmental challenges. This research aims to contribute to the mitigation of greenhouse gases (GHG) in urban areas by providing a model that can test the impacts of land use planning and modal shift policies. The research uses a modified version of a land use transportation model developed in Japan. The model uses microeconomic ideas and determines the trip and location changes for three main actors (households, service industry, and other industries). This paper explains the following parts of this study: 1) Land Use/Transportation Planning and Environmental Concerns; 2) Gaseous Emissions in the Cities of the Asia-Pacific; 3) Impact of Urban Gaseous Emissions on Biodiversity; 4) Case Study: the City of Yokohama; 5) Methods and Results; and 6) Conclusions. In particular, this paper analyzes the case study in terms of the qualitative information providing a base for modelling. The city of Yokohama, Japan, is used for the modelling because of its positive attitude towards urban planning, extensive spatial and transportation data, and competitive edge in the Tokyo Metropolitan Area (TMA). The data used include the most recent version of a TMA person trip survey and the corresponding socio-economic and demographic data from the same period of time. The research tested two policies selected from the qualitative data: public transit promotion, as Yokohama owns its subways and has cooperated with private railway companies; and car restraining policies, which were already introduced through the annual event, Car Free Day, a largely grass-roots initiative. The study illustrated that these policies can reduce GHGs by encouraging people to adopt more environmentally sustainable modes and relocating the actors to high dense neighbourhoods. The model results showed 1.3% and 13.0% reduction respectively in emissions resulting from the policy changes. The results of this study can be useful for cities of the Non-Annex I countries
1 in the
Asia-Pacific region, which are not required to address GHG mitigation presently. The study promotes local-level policy making in the developing world to establish a framework for GHG mitigation.
1 Non-Annex I countries: Countries which are not required to reduce emissions for the first Kyoto Protocol
period.
Table of Contents
1. Land Use/Transportation Planning and Environmental Concerns ............................. 1
2. Gaseous Emissions in the Cities of the Asia-Pacific ................................................. 3
3. Impact of Gaseous Emissions over Biodiversity ....................................................... 4
4. Case Study: the City of Yokohama ............................................................................ 5
4.1 Introduction ............................................................................................................. 5
4.2 Quantitative Data Collection ................................................................................... 6
4.3 Qualitative Data Collections ................................................................................... 8
4.4 Outline of Yokohama ............................................................................................... 8
4.4.1 Demographics and History ............................................................................... 8
4.4.2 Planning Department ...................................................................................... 12
4.4.3 Peoples’ Movement and Transportation .......................................................... 13
4.4.4 Environmental Condition ................................................................................ 14
4.4.5 Eco Model City for the Low Carbon Society ................................................. 18
4.4.6 Yokohama Climate Change Action Policy Co-Do 30 ..................................... 19
4.4.7 Graying of Population and Environmental Burden ........................................ 21
4.4.8 Two Policies Highlighted ................................................................................ 22
5. Methods and Results ................................................................................................ 22
5.1 Overview of the Model .......................................................................................... 22
5.2 Transportation Model ............................................................................................ 23
5.3 Economic Model ................................................................................................... 28
5.4 GHG Emissions Calibrations ................................................................................ 29
5.5 Change of GHG Emissions ................................................................................... 30
6. Conclusions .............................................................................................................. 31
1
1. Land Use/Transportation Planning and Environmental Concerns
Environmental concerns have played a central role in the history of urban planning. The roots
of modern urban planning began in the middle of the Industrial Revolution (Wolfe, 1981). It
was mainly a social movement to improve living standards of working class people, from
unhygienic and overcrowded conditions to livable and humanized ones. Therefore, academics
and practitioners in urban planning were destined to consider environmental and health issues
from the very beginning of modern planning history and it is natural that environmental
issues remain a current urban planning concern.
There have been a number of attempts in which environmental concerns have been integrated
in the field of urban planning in recent decades. For example, sustainable development has
become a key issue in urban planning after the release of the report Our Common Futures by
the United Nations World Commission on Environment and Development (WCED) in 1987.
Many urban planners discuss sustainability in relation to cities, regarding what form it should
take, what structures it requires, and what kind of institutions are appropriate for
implementation. The “three Es” of sustainable development, economic, ecology and equity,
are now often taken for granted in contemporary developments (Berke, Godshalk, and Kaiser,
2006).
Social scientists currently pursuing studies relevant to the future of society cannot avoid
accounting for climate change issues. In the field of urban planning, climate change is one of
the most important issues to consider when planning for and discussing cities. For example,
the United States Environmental Protection Agency (USEPA) has promoted the smart growth
concept for combating climate change since the 1990s. The European Environmental Agency
(EEA) proposed the compact city idea to address global environmental challenges in the
2000s.
Most of these policies from developed countries highlight the negative impacts of past
planning practices on the environment, such as reckless greenfield2 development and auto
dependency. They further reinforce the importance of planning more compact and
human-scaled developments, promoting public transit, and introducing urban designs
oriented towards pedestrian friendliness and non-motorized transport.
Simultaneously, climate change specialists realized the importance of urban planning and city
efforts to address climate change issues. For example, Cities and Climate Change by
Bulkeley and Betsill (2003) highlights the responsibility of cities to address climate change
2 Greenfield development: A type of development which expands to untouched or underdeveloped lands.
Antonym: brownfield development.

2
issues and fill the gaps the national or supra-national levels of discourse on climate change
discussions. Bulkeley and Betsill (2003) provide good examples of how city governance
advocates help cities solve global environmental problems. One of the most notable examples
is the Cities for Climate Protection (CCP) program started by the International Council for
Local Environmental Initiatives (ICLEI) in 1993. The CCP is based on Agenda 21, a set of
proposals for sustainable development for the furtherance of world-wide proposed at UN
Conference on Environment and Development in 1992, and it has been a useful tool for
assisting local governments to deal with climate change issues.
In CCP, a city develops a Local Action Plan through a multi-stakeholder process that
describes the policies and measures the local government will take to reduce greenhouse gas
emissions and achieve its emissions reduction target. Therefore, it is easy to include urban
planning policy measures in each local action plan. Typical policies implemented include
energy efficiency improvements to municipal buildings and water treatment facilities,
streetlight retrofits, and public transit improvements.
Similar to climate change caused by anthropogenic activities, biodiversity has been lost
tremendously all over the world after industrial revolution due to the mass and rapid invasion
of human activities to natural habitats. Urgent efforts to protect the species richness should be
planned through many different aspects. Here also, urban planning should play a central role
to preserve the habitats for flora and fauna. For example, instead of planning dispersed,
automobile dependent, suburban type development, planners can propose some brownfield
infill developments3 in the Central Business District (CBD)
4 areas which are dense, compact
and independent from automobile reach. By doing so, the variety of habitats in the greenfield
surrounding the urban area is preserved and human beings can avoid further assault to the
precious ecosystem.
To summarize, urban planning is a discipline that highlights relevant approaches to
environmental issues, and for which there is currently a large demand to solve global
environmental challenges such as climate change. Therefore, the work of urban planners and
urban specialists should reflect provisions for climate change issues. Local governance and
climate change specialists sense that cities are essential players in tackling climate change
issues to develop solutions for these problems. This research responds to cities' pressing need
for implementing effective local-level climate change policies.
3 Brownfield development: A type of infill development which is in abandoned or underused industrial and
commercial facilities. Antonym: greenfield development
4 CBD: Abbreviation of Central Business District. An activity centre of a city which contains retail and
commercial buildings as well as a business centre.

3
2. Gaseous Emissions in the Cities of the Asia-Pacific
This section discusses the present rapid and intense urbanization in the Asia-Pacific region
and the resultant serious environmental degradation. This condition provides the basis for the
relevancy of Yokohama’s case to the present world.
Asian urban population occupies a large portion of the entire world’s urban population. In the
1960s, the urban population of Asia accounted for 35% - about 350 million people - of the
estimated 1 billion world total (Figure 2.1). In 2020, the total global urban population is
estimated to reach 4.1 billion, accounting for 56% of the total world population. It is
predicted that 2.1 billion of that total will be composed of the Asian urban population, which
will make up 52% of the world’s urban population (UN Population Division, 2005).
0
500
1,000
1,500
2,000
2,500
3,000
3,500
4,000
4,500
1960 1980 2000 2020
Rest of the worldurban population
Asian urbanpopulation
65.2
59.6
52.5
48.1
34.8 40.447.5
51.9
(Million)
Figure 2. 1 Asian urban population trend
Source: United Nations DESA Population Divisions (UNPD), 2005
Urbanization enabled regions to increase economic living standards by offering people
alternative income earning activities apart from agricultural ones (World Bank, 2009), and
this in itself is a favourable phenomenon from both a social and economic point of view.
However, presently the cities in these countries are not only the places that contain a vast
amount of utility, provide higher wages, and produce goods and services, but also that emit
massive quantities of waste and pollutants which affect both the cities themselves and their
adjacent areas.
Dealing with GHG emissions from urban areas is one of the most controversial issues facing
present society, as the impact from this issue is at the global level. Figure 2.2 shows the world
GHG emissions by country in 2004. Four Asian countries, China, Japan, India, and South
Korea, ranked among the top 13 countries, accounting for more than 70% of total emissions
of the Asia-Pacific countries, and four countries produce more than 30% of the world’s total
emissions (The Energy Data and Modeling Center, 2007). With the rapid economic and urban
growth in China and India, the region will most likely continue to be the largest contributor to
the world’s GHG emissions.

4
Canada
2%
Others
29%
US
22%
Germany
3%
UK
2%
India
4%
China
18%
Russia
6%Japan
5%South Korea
2%
Italy
2%
Mexico
2%
France
2%
Australia
1%
Figure 2. 2 World CO2 emissions by country in 2004
Source: The Energy Data and Modeling Center, 2007
Researchers have pointed out that climate change affects Asia in many ways. Sari (2008)
asserts that climate change is strongly correlated with poverty and will severely affect poor
people in Asia. He points out that the series of events caused by climate change may delay the
attainment of the Millennium Development Goals (MDGs).
A publication by International Energy Agency (IEA), titled The Road from Kyoto - Current
CO2 and Transport Policies in the IEA, indicates that the carbon dioxide emissions from the
movement of people and goods grow at a faster pace than for other sectors (IEA, 2006). Data
on global CO2 emissions from fuel combustion shows that transport sector emissions have
increased in almost all countries since 1971 (IEA, 2006). Heywood (2006) argues that the
IEA estimate is an underestimate and that transport sector emissions could total one-fourth of
all GHG emissions.
3. Impact of Gaseous Emissions over Biodiversity
This section highlights the relationships between the gaseous pollutants and the loss of
biodiversity. Presently, increased attention to the interactions among atmospheric pollutions
and biodiversity has been witnessed in research. In particular, the effects that these pollutants
have on the loss of plant biodiversity are enormous, and air quality control as a co-benefit of
GHG mitigation is important to maintain richness in the earth’s species. For example, a team
of biologists investigated the impacts of SO2 on vascular plants in Finland (Zvereva, et al.,
2008). They proved the conventional wisdom that the pollutants decrease the species’
richness of vascular plants. They also found that there are some different trends depending on
Total: 26.5 billion
tons

5
the differences between the warmer climates and types of pollutants.
Italian researchers focused on the damage to epiphytic lichens caused by geothermal air
pollution to the country’s mountainous areas (Loppi, et al., 2006). The mercury
concentrations in lichen samples are often measured to monitor the release of airborne
pollutants from the industrial exploitation of geothermal resources in the Mt. Amiata area. By
measuring the accumulated mercury (Hg) in lichen thalli, the researchers can estimate mean
Hg and HgS concentrations in the air. They found that from the level of the growth of
epiphytic lichens, and concluded that HgS is responsible for the worsening biodiversity of
epiphytic lichens.
Phoenix et al. (2006) revealed the impact of atmospheric nitrogen deposition in the world on
biodiversity hotspots. They found that the average deposition rate across these areas was
50 % greater than the global terrestrial average in the mid-1990s. They also assert that by
2050, the average deposition rate could be doubled, with 33 out of 34 hot spots receiving
greater nitrogen deposition.
Having seen the obvious connections between the rampant air pollutants and loss of
biodiversity, urgent policies are needed to solve these issues world-wide. Researchers found
that controlling air pollutants has co-benefit effects for GHG mitigation (Castillo et al., 2007).
Eventually, it helps the preservation of richness of species.
In addition, it is also important to note that land use planning can protect the areas where a
variety of species live. Instead of planning communities that destroy greenfields, urban
planners need to consider the brownfield development, dense land use, and more
environmentally sustainable transport (EST) accommodating urban designs. In this context,
this research has a huge demand in the present world, when people are becoming extremely
conscious about protecting the species’ richness that has been lost as a result of the
industrialization and the motorization of the world.
4. Case Study: the City of Yokohama
4.1 Introduction
Yokohama is a popular place to live in Japan with its proximity to Tokyo, its cosmopolitan
image, and its abundance of nature. For example, Yokohama was ranked first in the “Most
Popular City for Living in Japan” Contest in 2007 by nearly 220,000 people (Seikatsu Guide,
2008). Furthermore, it has successfully revitalised its waterfront, the Minato Mirai 21 district,
which contains the nation’s most popular commercial facilities, parks and tourist spots.
The case study area was selected for three reasons:
6
1. History of urban planning and a positive approach
Yokohama is considered to have some of the most advanced urban planning in Japan. Its
long-term plans since 1965 have made steady progress and the city has attained some of its
major goals, such as establishing a new CBD for the local work force, creating an attractive
waterfront area, establishing easy access to the industrial areas, providing high quality
residential areas, and so on. The planning processes will be explained in more details in
section 4.4.1.
2. Ample data in transportation, economics, spaces and demography
Yokohama boasts of its extensive data collection derived from its continuous efforts to pursue
advanced-level city planning. The city is the first municipality in Japan which tried to
standardise all spatial data (land use, roads, buildings, open space, sewage, water provision,
waste management facilities etc.) into ArcGIS software by Environmental Systems Research
Institute, Inc. (ESRI). Additionally, the transportation data is rich because the national
government always has maintained an interest in planning for the Tokyo Metropolitan Area,
of which Yokohama is a part. The person trip (PT) data of Yokohama is detailed in zones,
modes, and trip types. The city level data is rich enough in detail to carry out complex
research on transportation analysis for the purposes of this dissertation.
Having outlined the reasons for selection of the city in this case study, this section provides
an overview and describes particular aspects of the city. Moreover, it leads to the effective
and reasonable modelling that is useful to policy making.
3. Competitive edge in the TMA area
The Tokyo Metropolitan Area (TMA) is the world’s largest urban agglomeration and the
municipality of Tokyo itself is one of the world’s five largest cities. To learn from the
experience of Tsukuba model, an ideal area should not only be a large city, but it should also
be adjacent to Tokyo. Yokohama is thus selected, as it is the second biggest municipality in
Japan.
4.2 Quantitative Data Collection
The quantitative data employed are all obtained from the following secondary sources: the
Ministry of Land, Infrastructure and Transportation (MLIT), the Ministry of Internal Affairs
and Communications (MIAC), the National Institute for Environmental Studies (NIES) and
the city of Yokohama (COY). The two pieces of major data are:
MLIT Person trip (PT) data and origin destination (OD) survey data for the Tokyo
Metropolitan Area (TMA) in 1998 (the latest version as of 2009); and

7
Block-level economic data from the MIAC, the NIES and the COY
The Tokyo Metropolitan Area (TMA) person trip survey has been performed every 10 years
since 1968. The purpose of the PT survey is to understand people’s daily activities and the
data provide fundamental information for revising transportation planning and urban planning.
Although the 2008 survey was recently completed, the data will be released to the public later
in 2010. Therefore, as of 2009, the 1998 survey provides the most recent data.
This survey is administered in the 80 km radius of the centre of Tokyo (Table 4.1). It includes
the prefectures of Tokyo, Kanagawa, Saitama, Chiba, and the south of Ibaraki prefecture,
which together sum to a night time population of 34 million people. The collection rate of the
written survey distributed to each household in the census tract for this region is 71.5 percent.
Of the possible sample of 1,235,883 people in 1998, there are 883,044 respondents aged 5
years and older in this region. Thus, the sample rate for the region is 2.68 percent.
Table 4. 1 Results of the Person Trip Survey (Most recent version available as of 2009.10)
Population 5 year old
or older
Surveys
Sent
Respondent
s
Ibaraki Prefecture 1,544,760 1,469,103 51,933 42,828
Saitama Prefecture 6,893,102 6,548,796 242,340 189,487
Chiba Prefecture 5,006,952 4,774,137 168,853 140,533
Tokyo 11,850,311 11,369,346 388,518 258,873
Kanagawa (excluding
Yokohama/Kawasaki) 3,764,503 3,585,558 152,610 102,432
Yokohama 3,346,785 3,187,158 148,242 91,585
Kawasaki 1,207,985 1,146,832 52,037 33,292
Chiba Prefecture 856,977 815,775 31,251 24,014
All areas 34,471,375 32,896,705 1,235,769 883,044
Source: Committee for Transportation in Tokyo Metropolitan Area, 1998
The neighbourhood’s economic data is the finest level of data available in Japan. These data
include demographic information, such as population by gender, age and household types,
and socio-economic information, such as labour force size by industrial sector, average
income, and price of land.

8
4.3 Qualitative Data Collections
The qualitative data employed in this analysis is obtained via interviews with relevant
specialists, including government officials of the City of Yokohama, private consultants,
academics, members of research institutes and NGOs. Between 2008 and 2009, 14 individuals
were interviewed (Table 4.2). The results of these interviews are important, as they
determined the designated zones for the model, concrete geographical target areas for
development and conservation over the next 50 years, the land use policies relevant to the
model, and the policies towards adjacent municipalities.
Table 4. 2 List of interviewees
Date Organization Interviewee
June 11th
, 2008
October 15th
, 2008
Urban Management Office (Toshikeiei-
senryaku-shitu), COY
Urban Administrating Office, COY
(Toshi-seibikyoku)
Mr. Masato Nobutoki
Mr. Tomoyuki Suzuki
October 27th
, 2008
Urban Design Office, COY
(Toshi-design shitsu)
Mr. Yasuyuki Akimoto
Mr. Yu Katsura
October 29th
, 2008 Urban Administrating Office, COY
(Toshi seibikyoku)
Mr. Keisuke Matsui
Mr. Takashi Sasai
October 29th
, 2008 Institute for Behavioral Science (IBS) Mr. Jun Morio
November 12th
, 2008 Climate Mitigation Office, COY Ms. Miyuki Kuroda
December 6th
, 2008 Integrated Research and Development Co.,
LTD
Mr. Hirotake Takata
December 18th
, 2008 Tokyo University Professor Jun Hato
February 16th
, 2009 Global Carbon Project Dr. Shobhakar Dhakal
May 1st, 2009 ICLEI Japan Ms. Michie Kishigami
July 28th
, 2009 Minato Mirai 21 Corporation Mr. Hiroshi Kishida
Occasional meetings National Institute of Environmental Studies
(NIES)
Dr. Yoshiki Yamagata
Occasional meetings GOGA, Inc. Dr. Jinya Nakamura
4.4 Outline of Yokohama
4.4.1 Demographics and History
Yokohama became a bedroom community5 for Tokyo after World War II (WWII). In 1978,
the city surpassed Osaka to become the second largest in Japan after Tokyo. The population
during the economic boom (beginning in the 1960s) increased notably (Figure 4.1). Recently,
5 A bedroom community is a community where many commuters live. A suburb.

9
however, the population has been levelling off. According to the National Population Census,
in 2009, Yokohama had a population of 3.66 million.
Figure 4.1: Population of Yokohama (1965-2008)
Source: City of Yokohama 2009
Yokohama’s aging population is a concern, but it is not as serious of an issue as it is for other
areas of Japan. Figure 4.2 shows the trend in the greying of the population. The population of
65-year-olds and above has risen enormously in 35 years, while the population of
15-year-olds and under has remained almost constant. Compared to the “All Japan” figure,
overall, Yokohama has a younger population.
Figure 4.2 Percent of population of Yokohama by age (1965-2005)
Source: City of Yokohama 2009
10
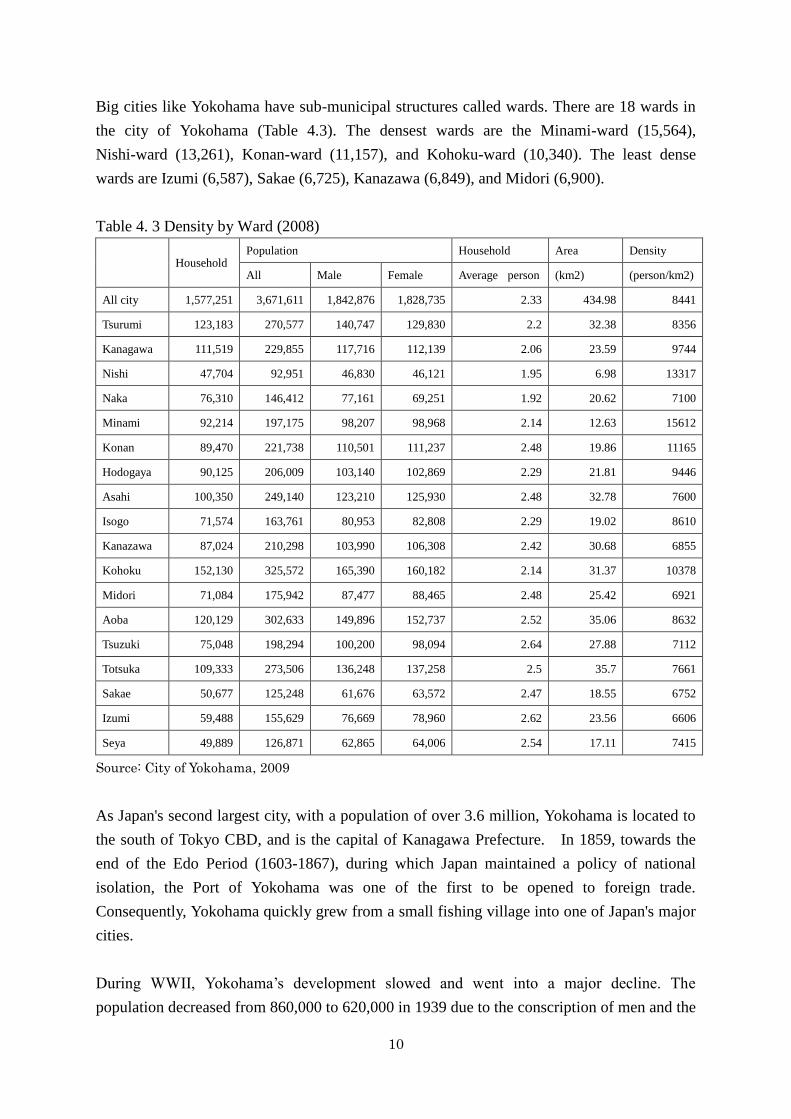
Big cities like Yokohama have sub-municipal structures called wards. There are 18 wards in
the city of Yokohama (Table 4.3). The densest wards are the Minami-ward (15,564),
Nishi-ward (13,261), Konan-ward (11,157), and Kohoku-ward (10,340). The least dense
wards are Izumi (6,587), Sakae (6,725), Kanazawa (6,849), and Midori (6,900).
Table 4. 3 Density by Ward (2008)
Household Population Household Area Density
All Male Female Average person (km2) (person/km2)
All city 1,577,251 3,671,611 1,842,876 1,828,735 2.33 434.98 8441
Tsurumi 123,183 270,577 140,747 129,830 2.2 32.38 8356
Kanagawa 111,519 229,855 117,716 112,139 2.06 23.59 9744
Nishi 47,704 92,951 46,830 46,121 1.95 6.98 13317
Naka 76,310 146,412 77,161 69,251 1.92 20.62 7100
Minami 92,214 197,175 98,207 98,968 2.14 12.63 15612
Konan 89,470 221,738 110,501 111,237 2.48 19.86 11165
Hodogaya 90,125 206,009 103,140 102,869 2.29 21.81 9446
Asahi 100,350 249,140 123,210 125,930 2.48 32.78 7600
Isogo 71,574 163,761 80,953 82,808 2.29 19.02 8610
Kanazawa 87,024 210,298 103,990 106,308 2.42 30.68 6855
Kohoku 152,130 325,572 165,390 160,182 2.14 31.37 10378
Midori 71,084 175,942 87,477 88,465 2.48 25.42 6921
Aoba 120,129 302,633 149,896 152,737 2.52 35.06 8632
Tsuzuki 75,048 198,294 100,200 98,094 2.64 27.88 7112
Totsuka 109,333 273,506 136,248 137,258 2.5 35.7 7661
Sakae 50,677 125,248 61,676 63,572 2.47 18.55 6752
Izumi 59,488 155,629 76,669 78,960 2.62 23.56 6606
Seya 49,889 126,871 62,865 64,006 2.54 17.11 7415
Source: City of Yokohama, 2009
As Japan's second largest city, with a population of over 3.6 million, Yokohama is located to
the south of Tokyo CBD, and is the capital of Kanagawa Prefecture. In 1859, towards the
end of the Edo Period (1603-1867), during which Japan maintained a policy of national
isolation, the Port of Yokohama was one of the first to be opened to foreign trade.
Consequently, Yokohama quickly grew from a small fishing village into one of Japan's major
cities.
During WWII, Yokohama’s development slowed and went into a major decline. The
population decreased from 860,000 to 620,000 in 1939 due to the conscription of men and the

11
evacuation of women and children. Because Tokyo was severely damaged by the air raids at
the end of the war, the capital was the priority in the redevelopment process. Although
Yokohama was also severely damaged by the bombs, the old downtown looked as if it had
been recently bombed 10 years after the war (Tamura, 1983).
With the booming economy in the mid-1950s, developers constructed numerous residential
buildings for various social classes in the inner city. The city had only a small business centre
in the 1960s. Most professionals commuted to Tokyo since there were few job opportunities
in Yokohama except for manual labour work at waterfront industrial sites (Tamura, 1983).
Lacking an attractive business core and further hampered by a surge of unplanned residential
developments, Yokohama announced a redevelopment plan, composed of six major projects,
in 1965. This declaration included: 1). Revitalization of the CBD; 2). Reclamation of the
Kanazawa District; 3). Creation of Kohoku New Town; 4). Establishment of municipal
subways; 5). Establishment of the Urban Expressway system; and 6). Construction of
Yokohama Bay Bridge. This was the first attempt by a Japanese municipality to make a
concrete, long-term master plan for its own city. The planning of Minato Mirai 21, in order to
have a CBD independent of Tokyo, was announced at this time. The goal was to have a
working population of 190,000 in the area by 2010 (Table 4.4).
Table 4. 4 Basic Goal for MM21 Plan
・ Projected Population
Work force: 190,000
Residents: 10,000
・ Land Usage
Buildings
(offices, commercial, and residential sites) 87 ha
Roads and railways: 42 ha
Parks and greenery: 46 ha
Port facilities: 11 ha
Total: 186 ha
・ Development period
Fiscal 1983 to 2010
(Land Readjustment <including a 5-year reimbursement period>)
Source: Minato Mirai 21 Corporation, 2009
To summarize, urban conditions in Yokohama are characterized by densely populated
residential neighbourhoods. In particular, the old neighbourhood area has a density of more
than 8,000 people per square km. The residential neighbourhoods have been developed to
accommodate commuters to the Tokyo area, which were the majority in the past, and the city
is famous for having a larger night-time population than daytime one. Recently the city’s
efforts to revitalise the centre are slowly making progress, as seen by the industrial relocation

12
and Minato Mirai 21 projects.
4.4.2 Planning Department
Yokohama is famous for its innovative Planning Bureau which tries to avoid the vertical
decision making process of the Japanese urban planning framework (Tamura, 1983). The
planning Bureau was created in 1968 when other municipalities in Japan had no idea how to
integrate each city’s bureau. The bureau succeeded in creating the 1965 plan that announced
the 6 big projects aimed at revitalizing Yokohama. Adapted from Yokohama’s successful case,
presently, a Planning Bureau exists in almost every municipality in Japan. The Planning
Bureau is in charge of many of the integrated and urgent issues in the city. For example,
currently the bureau in Yokohama is not only dealing with the issue of urban planning, but
also with informatization, internationalization etc.
In 1968, engineers handled urban planning responsibilities and dealt with developing the
physical shape of the city while implementing policy. Presently, planning a city requires
addressing a wide range of issues including social welfare, crime prevention, and
environmental protection. Moreover, public participation in urban planning has become more
common among Yokohama citizens. In this context, the scope of the field of urban policy and
urban planning has changed dramatically over the years.
Table 4.5 shows the current bureaus that deal with urban planning in Yokohama. The
integration of urban policy making, including social policies, is handled by the Urban
Management Bureau. Coordination and implementation concerning urban improvements,
such as creating a master plan, is dealt with by the Urban Improvement Bureau. The
procedures for urban planning are covered by the Community Planning Coordination Bureau.
Table 4.5: Present bureaus in charge of urban planning policies
Name of the Bureau / Division Description
Urban Management Bureau
(Toshi keiei kyoku)
Integrative coordination of other bureaus and
major policy making
Community Planning
Coordination Bureau
(Machizukuri chousei kyoku)
Urban planning, building, construction and
housing policies
Planning Division
(Machizukuri chousei kyoku
Kikakuka)
Planning and coordination for core policies of
urban planning, building construction, and housing
policies
Urban Improvement Bureau
(Toshiseibi-kyoku)
Integrative planning, coordination, and
implementation concerning urban improvement

13
Planning Division
(Toshiseibi-kyoku Kikakuka)
Investigation, planning, and implementation of
urban improvement project
Basic principles for land use planning
Enforcement and amendment for Yokohama Urban
Master Plan
Source: Personal communications with Yokohama City officials, 2006
4.4.3 Peoples’ Movement and Transportation
Looking at the overall number of commuting trips that take place within the Tokyo
Metropolitan Area (TMA), the number of trips to the area of Tokyo’s 23 wards is still the
largest, making up 68.0% of the total TMA commuters’ destinations (Figure 4.3). However,
among the destinations for Yokohama residents, Tokyo accounts for less than half (47.9%),
while intra-city commuters account for 34.6% of the total. These travel patterns clearly show
that the urban planning goal for the past 50 years to develop business cores compatible and
with proximity to Tokyo has been partially achieved.
Figure 4.3 Destinations of Commuters in Yokohama and Tokyo Metropolitan Area
Source: Committee for Transportation in Tokyo Metropolitan Area (CTTMA) 2004
Although Tokyo is still the most likely destination for commuters in the TMA, the growth
rate in 1998 has increased the most in suburb to suburb trips with approximately 130 %
increase in trips to Tokyo and 150 % increase in travel between suburbs. This means that the
traditional radiated movement of Tokyo-surrounding areas has shifted to a circular movement
between Yokohama, Saitama, and Chiba as they have become important as business hubs.
These diagonal and circular trips are not only confined to business trips, but include private
trips as well (MLIT, 1998).

14
Figure 4.4 shows the change in the annual number of passengers for each public
transportation mode in the city. The private railways exceed other public transportation
throughout the period indicated with around 600 million passengers annually. The number of
JR and subway passengers has increased steadily, and in 2004, JR was the second largest
transportation mode, behind private railways. The subway, surpassing the city bus for the first
time, was the third largest transportation mode in Yokohama in 2004. In fact, the city buses
dropped to the fourth in 2004. The new transportation system, Kanazawa seaside line started
its operation in July 1989. It is an Automated Guideway Transit (AGT) which runs along the
seaside, and carries around 16 million people annually in 2004.
0
100,000
200,000
300,000
400,000
500,000
600,000
700,000
1979
1980
1981
1982
1983
1984
1985
1986
1987
1988
1989
1990
1991
1992
1993
1994
1995
1996
1997
1998
1999
2000
2001
2002
2003
2004
Num
ber
of
pass
enge
rs (
thousa
nd)
subway
city bus
taxi (corporateand private)
JR
Private railway
Newtransportationsystem
Figure 4.4: The annual passengers of each transportation mode
Source: City of Yokohama
4.4.4 Environmental Condition
Figure 4.5 shows the SO2 concentration of ambient air in Yokohama. Similar to other cities in
Japan, the concentration peaked in 1967 (Kono, et al., 2004). The concentration decreased to
less than the annual average of 0.01 ppm in the 1980s, far less than the US Environmental
Protection Agency’s (USEPA) health based national air quality annual standard average of
0.03 ppm.
The sudden decrease in the late 1960s is explained by the increased interest in environmental
pollution from politicians and practitioners. It resulted in the enactment of the “Air Pollution
Control Law” in 1968. At the same time, the National Diet also engaged in discussion on
combating the industrial pollution (Kono, 2005).

15
USEPA standard
0
0.01
0.02
0.03
0.04
0.05
0.06
1966
1967
1968
1969
1970
1971
1972
1973
1974
1975
1976
1977
1978
1979
1980
1981
1982
1983
1984
1985
1986
1987
1988
1989
1990
1991
1992
1993
1994
1995
1996
1997
1998
1999
2000
2001
2002
2003
2004
ppm
Figure 4.5: Annual average of SO2 concentration in Yokohama (Ambient air)
Source: City of Yokohama
Figure 4.6 and 4.7 show the representative air pollutants from the transport sector, NOx and
NO2 concentrations, both in roadside and in ambient air. NO2 concentrations were stagnant
during the 1980s and 1990s both in terms of ambient air and roadside air. In the 2000s,
however, emissions decreased to an annual average of less than 0.04 ppm, which is also
below the USEPA’s health based national air quality standard of 0.053 ppm.
0.000
0.050
0.100
0.150
0.200
0.250
1973
197
4
197
5
197
6
1977
1978
1979
1980
198
1
1982
1983
1984
1985
1986
1987
1988
1989
1990
1991
1992
1993
1994
199
5
199
6
1997
1998
1999
200
0
200
1
200
2
2003
2004
ppm
ambient
roadside
Figure 4.6: Annual average of NOx concentration in Yokohama
Source: City of Yokohama
USEPA standard
0.000
0.010
0.020
0.030
0.040
0.050
0.060
1973
1974
1975
1976
1977
1978
1979
1980
1981
1982
1983
1984
1985
1986
1987
1988
1989
1990
1991
1992
1993
1994
1995
1996
1997
1998
1999
2000
2001
2002
2003
2004
ppm
ambient
roadside
Figure 4.7: Annual average of NO2 concentration in Yokohama
Source: City of Yokohama

16
Dust fall shown in Figure 4.8 peaked in 1966, and the accumulation has been steadily
decreasing. Presently, Ministry of Environment (MOE) does not set the standards for dust fall.
In the health science field, more than 10t / km2 /month is considered to be unfavourable for
human health. The level in Yokohama has decreased to less than 10 t /km2
/ month in
1973-1974 and the present level is around 4t / km2 / month. The SPM concentration shown in
Figure 4.9 has been decreasing gradually from the early 1980s, and in the 2000s, it is at the
level of approximately 0.05 mg/m3.
0.0
2.0
4.0
6.0
8.0
10.0
12.0
14.0
16.0
18.0
20.0
1965
1966
1967
1968
1969
1970
1971
1972
1973
1974
1975
1976
1977
1978
1979
1980
1981
1982
1983
1984
1985
1986
1987
1988
1989
1990
1991
1992
1993
t/km
2/m
onth
Figure 4.8: Annual average of dust falls in Yokohama
Source: City of Yokohama
0
0.01
0.02
0.03
0.04
0.05
0.06
0.07
0.08
0.09
1976
1977
1978
1979
1980
1981
1982
1983
1984
1985
1986
1987
1988
1989
1990
1991
1992
1993
1994
1995
1996
1997
1998
1999
2000
2001
2002
2003
2004
mg/
m3
ambient
roadside
Figure 4.9: Annual average of SPM concentration in Yokohama
Source: City of Yokohama
The GHG emissions trend in the city is shown in Table 4.6 and Figure 4.10. The total GHG
emissions in Yokohama was 21.5 million t CO2-equivalent in 2003, which was equivalent to
1.6% of that of the national level and the CO2 emissions were 18.8 million t CO2-equivalent
(Table 4.6). The sectoral emission rates show that the transport sector has the highest
emission with 24.7% of the total, followed by energy production sector (22.5%), households
(19.8%), and business sector (14.4%).

17
Table 4.6: CO2 emissions in amounts and rates in Yokohama
Unit 1,000 t
CO2-equivalent
Energy Industry Household Business Transport Waste Total
1990 3,310 3,440 3,110 1,880 4,190 610 16,530
2000 3,850 2,790 3,800 2,790 4,840 1,020 19,080
2001 3,760 2,560 3,780 2,740 4,860 950 18,660
2002 3,900 2,540 3,850 2,800 4,830 860 18,780
2003 4,220 2,560 3,710 2,710 4,640 940 18,770
Percentage %
Energy Industry Household Business Transport Waste Total
1990 20.0 20.8 18.8 11.4 25.3 3.7 100.0
2000 20.2 14.6 19.9 14.6 25.4 5.3 100.0
2001 20.2 13.7 20.3 14.7 26.0 5.1 100.0
2002 20.8 13.5 20.5 14.9 25.7 4.6 100.0
2003 22.5 13.6 19.8 14.4 24.7 5.0 100.0
Source: City of Yokohama
20.0 20.2 20.2 20.8 22.5
20.814.6 13.7 13.5 13.6
18.8
19.9 20.3 20.5 19.8
11.414.6 14.7 14.9 14.4
25.3 25.4 26.0 25.7 24.7
3.7 5.3 5.1 4.6 5.0
0%
10%
20%
30%
40%
50%
60%
70%
80%
90%
100%
1990 2000 2001 2002 2003
Waste
Transport
Business
Household
Industry
Energy
Figure 4.10: CO2 emission rate from each sector in Yokohama
Source: City of Yokohama
The proportions of CO2 emissions from energy, household, and waste sectors (22.5%, 19.8%
and 5.0%, respectively) were higher than those of the national levels (6.8%, 13.5% and 1.9%),
and those from the business and transport sectors were almost at the same level in 2003. On
(%)

18
the other hand, the emissions from the industrial sector were much lower (13.6 %) than the
national level (37.9%) due to the relatively small distribution of industrial areas in Yokohama.
GHG emissions per capita were 6.09 t CO2-equivalent, which was about 58% of that of the
national level (10.49 t CO2-equivalent). The reason for this lower per capita emission rate is
due to smaller industrial areas, lower vehicle ownership, less vehicle travel per capita, and the
relatively warmer climate in Yokohama compared to the national average (Kono and Hoshiko
2007).
4.4.5 Eco Model City for the Low Carbon Society
Eco Model City is a certification system that was developed by the central government in 2008
for establishing a low carbon society at the city government levels. Central government selects
cities which have targeted the ambitious goals of GHG emissions reduction and encourages
them to achieve their goals. As shown in Table 4.7, the city of Yokohama was successfully
chosen along with 12 other municipalities out of total 89 applicants through a rigorous
selection process based on five criteria: 1) the city’s ambitious reduction target; 2) innovative
ideas; 3) uniqueness and specialty; 4) feasibility; and 5) sustainability (Kuroda, personal
communication, 2008).
Table 4.7: The 13 Eco Model Cities and Eco Model Candidate Cities in Japan
・Eco Model Cities: six cities that fully satisfy the 5 selection criteria
Large cities: Yokohama, Kitakyushu
Regional central cities: Obihiro, Toyama
Small cities/towns: Shimokawa (Hokkaido), Minamata
・Eco Model Candidate Cities: seven cities that will resolve areas that do not
yet fulfil the criteria during the process of drawing up an action plan
Large cities: Kyoto, Sakai
Regional central cities: Iida, Toyota
Small cities/towns: Yusuhara (Kochi Prefecture), Miyakojima
Tokyo: Chiyoda Ward
Source: Ministry of Land, Infrastructure, and Transport (MLIT), 2008
In this proposal, the City of Yokohama has set a target for a 30 % reduction of GHG emissions
per capita by 2025 and a 60% reduction by 2050. The city’s aggressive goals are bolstered by
its past achievements. For example, their waste management shows a 30% reduction from
2004-2006, which was achieved through strict waste separation and recycling. Moreover, the
proposal details feasible plans as to how the goals can be attained specifically in Yokohama. It
accounts for the city’s impressive number of intellectuals and technically skilled workers and
the city’s positive externalities. Also, the proposal points out the strong history of citizen

19
volunteerism in Yokohama, particularly in environmental areas. The proposal suggests that
this past involvement represents an attitude of Yokohama’s citizens and can thus be counted on
in current and future efforts towards creating a low carbon city (Kuroda, personal
communications, 2008).
In terms of land use and transportation, several proposals have been made, and all of which are
based on the Co-Do 30 announced in 2008 (the action codes geared towards 30% reduction in
GHG emissions by 2025). The main policies for transportation are to promote mobility by
walking, bicycling, and public transit, and to create new generation vehicles and promote city
planning that are suitable for a low carbon city (City of Yokohama, 2009).
Specifically, the transportation Co-Do emphasizes: 1) zero carbon emissions for municipal
buses and subways; 2) introduction of low polluting and energy efficient cars; 3) efficient
allocation for large logistics facilities; 4) the creation of bicycle networks; 5) installation of low
carbon transportation modes in urban areas attractive to the next generation; 6) mobility
management in existing residential areas and support for local transportation; 7) promotion of
congestion management for the suburban mega-marts; and 8) idling stops for inland vessels
(City of Yokohama, 2009).
The transportation Co-Do explains the importance of policies in dealing with GHG reduction,
and also articulates them in relation to geographic context. For example, in the CBD, where
traffic is congested and parking space limited, it states the need for creating bicycle route
networks and a bike-share system, with social experiments that include park-and-ride, and new
attractive forms of transit like Electric Vehicles (EVs), segways, and Intelligent Transportation
System (ITS). On the other hand, in suburban areas, where commuting distances are often
longer, it aims to promote mobility management by a voluntary shift from private vehicles to
public transit, regional transportation support, and car sharing (Kuroda, personal
communications, 2008).
4.4.6 Yokohama Climate Change Action Policy Co-Do 30
The Co-Do 30, the action codes geared towards a 30% reduction of GHG emissions by 2025,
was established in 2008. Co-Do is short for Carbon-Off and Do, and the sound of it means
“action” in Japanese (kodo). It puts forth the goals of drastic GHG reduction and articulates
the required actions to reach those goals. By setting up this Co-Do 30, the city government
expects to have bottom up implementation leadership from the community and private sectors,
rather than top-down from City Hall. Fig 4.11 shows the basic idea of the Co-Do 30 with the
mascot character.

20
Figure 4.11: The Mascot Character for Co-Do 30
Source: City of Yokohama
The code emphasizes seven main areas with various areas to be targeted for achieving a low
carbon city: life, business, building, transportation, energy, urban planning and open spaces,
and city hall (Table 4.8). The Co-Do that address transportation include: 1) developing
advanced transportation measures in the city center area; and 2) transportation and land use
planning that is good for public transit and can accommodate pedestrians and bikers.
Table 4.8: Seven Core Co-Dos in the City of Yokohama
1 Living Co-Do Enlightenment for Anti climate change actions
Supporting anti climate change activities
3R (reduce, reuse, recycle) at home
2 Business Co-Do GHG reduction actions at office
Subsidizing green business ideas
3R at office
3 Building Co-Do Enforcement of assessment and grading system
Subsidy for green buildings
4 Transportation
Co-Do
Advanced transportation modes and systems at CBDs
Promotion for walking, Non-Motorized Transport
(NMT)6, and public transit
5 Energy Co-Do Promotion for renewable
Carbon offset introduction
6 City and Green
Co-Do
Conservation of open spaces
Biomass promotion
Compact city idea promotion
6 NMT: Abbreviation for non motorized transport. Walking and Bicycling, and variants such as Small-Wheeled
Transport (skates, skateboards, push scooters and hand carts)

21
7 City Hall Co-Do Introduction of energy efficient facilities, and usage of
renewable
Leading the other offices
Note: Made from City of Yokohama
In the transportation and land use planning sectors, the code aims to establish car restraining
policies and road pricing in CBD areas. Moreover, one of its goals is the creation of an
eco-point system where transportation and commercial sectors can work together. Co-Do also
articulates plans to have designated bus lines, carpooling, and High-Occupancy Vehicle
(HOV) lanes7. These measures correspond to reducing travel activities (A) and changing
modal structure (S) of the ASIF framework proposed by International Energy Agency (2006).
Therefore, the policies can be evaluated from both long-term and summative standpoints.
4.4.7 Greying of Population and Environmental Burden
Currently, the trend of declining birthrates and graying of society prevails throughout Japan,
and Yokohama is no exception. Although Yokohama has been experiencing an increase in
population and a trend toward a young demographic, the city needs to continue to attract a new
population in order to secure future tax revenues. Therefore, some city officials argue that the
city needs policies that can attract populations from adjacent municipalities by increasing the
appeal of living in the city.
Along with the issue of the graying population, reconstructing the old municipal housing
dispersed in rural areas in Yokohama is also a matter of importance. This housing was
originally constructed for low-income people who faced difficulties obtaining housing in
Yokohama. The housing system has functioned since 1951 in accordance with the Public
Housing Act implemented by the national government, and the buildings were constructed all
over the city. Presently, the buildings have become obsolete in terms of their environmental,
security, and safety standards. The population residing in these buildings is getting older as
well. Because the provision of basic infrastructure and service to these areas is costly and not
environment-friendly, the city needs to renovate these buildings in accordance with more
modern and consolidated models, and relocate them to more convenient locations (Akimoto,
personal communications, 2008).
7 A high-occupancy vehicle lane (HOV lane) is a lane reserved for vehicles with a driver and one or more
passengers. It is also known as carpool lanes, commuter lanes, diamond lanes, express lanes, and transit lanes

22
4.4.8 Two Policies Highlighted
Yokohama, being a part of the greater Tokyo metropolitan area, possesses highly developed
urban areas and maintains fairly good environmental standards. The interviews revealed some
relevant urban planning policies related to the analysis.
For example, there was the emphasis on pedestrians and para-transit oriented cities, promotion
of the city owned public transit (city buses, city subways, and Light Rail Transit) and invitation
extended to the neighboring municipalities in anticipation of the trend of depopulation of the
country as a whole. In the context of these important pieces of information, policy levers need
to be carefully chosen for the analysis.
Concretely, there are two policies to be highlighted. These are:
Policies on public transit promotion;
Policies on pedestrian and NMT friendly urban designs to promote car restraining (car
free day);
The model considers applying these two policies and calibrates the changes in GHG emissions.
5. Methods and Results
5.1 Overview of the Model
The model employed in this study is a land use transportation model derived from Tsutsumi,
et al (2006) that can calculate the equilibrium of locations for the three main actors:
households, the service industry, and “other” industries. These actors perform in accordance
with an economic concept, Cobb-Douglas Production Function. Households make
commuting trips to the other industries and free trips to the service industry. Production in the
service industry is restricted to these household trips. The other industries make business trips
to the service sector. The two industrial sectors pay salaries to households, and each actor
pays land rent to the landowners. Households act to maximize their utility, and each industry
sector acts to maximize its profit. The price of land is determined by both the supply of and
demand for land.
The model divides two prefectures (Tokyo and Kanagawa) into 35 zones: Tokyo into six
zones and Kanagawa into 29 zones. Zone categorization was determined through interviews
with the urban and transportation planners of the City of Yokohama, Mr. Yasuyuki Akimoto
and Mr. Keita Matsui, and a person-trip survey specialist from a think tank, Mr. Jun Morio
(Table 4.2).
The study used a transportation model to calculate the necessary figures needed for the land
use transportation model to calculate utility of each zone. These figures include the

23
commuting time input for households and the business trip input for industries. The
transportation model can demonstrate the cost and time of travel for each of the types of trips
in each mode. It can also predict the probability of mode choice for each type of trip by
responding to changes in time and cost. The selections of the locations are determined by the
utility in each zone.
5.2 Transportation Model
The transportation model estimates the choice of four modes (trains, cars, buses and
walking/biking) through the logit model. The logit model can predict the probability of choice
among multiple choices stochastically using the Gumbel distribution for prediction. The logit
model imposes the restriction that the distribution of the random error terms is independent
and identical across the alternatives. It causes cross-elasticity between all pairs of alternatives
to be identical. The model used a multinomial logit model instead of a nested logit model,
which could be used to predict the multiple choices of modes, because this study puts more
emphasis on the emission calculations. The logit model for mode choice is expressed by
Figure 5.1.
Logit Model can be expressed as:
Pin: Probability of selecting i,
Vin: Utility of mode i (inverse of the travel costs of mode i)
n: Number of modes
Figure 5.1 Logit Model for the mode choices
The model demonstrates the present situation based on the most recent available transportation
data. The model indicates the mode choices of free trip makers, business trip makers, and
commuters in the designated zones in high accuracy rates. As Tsutsumi’s, et al (2006)
Computable Urban Economic Model of Tsukuba (CUET) and other similar models do,
indication of strong prediction is determined by a ±15% range in accuracy. Table 5.1 and 5.2
Choice of Destination
Choice of Mode
Cars Trains Buses Walking/Biking

24
illustrates individual’s choices in terms of different modes for each kind of each trip in
percentage.
Looking at each type of trip, the free trip estimation attained 90.06% accuracy and the
commuting trip attained 81.39%. On the other hand, the estimation of business trip accuracy is
relatively low (69.00%). This is mainly because the trips used in this calculation are limited to
occurring between two areas and each trend is person-specific. Considering more than 84% of
within-±15% accuracy has been attained in total, it was determined that it was viable for this
study to proceed to the subsequent step.
Table 5. 1 Accuracy (±15%) of the model in each trip mode in each trip type
(%)
Trip type
Trip mode Free trips
Business trips Commuting trips
Train 74.01% 51.49% 80.52%
Vehicle and
Motorcycle 85.30% 66.34% 85.33%
Bus 98.16% 94.93% 96.68%
Walking and Biking 94.61% 88.61% 71.04%
Total 90.06% 69.00% 81.39%
Table 5. 2 Total Number of people in each trip mode in each trip type
Trip
type
Trip mode
Free trips Business trips Commuting trips
Real Predicted Real Predicted Real Predicted
Train 804,545 595,456 266,398 137,165 3,765,905 3,032,463
Vehicle and
Motorcycle 1,927,530 1,644,147 590,948 392,041 3,737,742 3,189,571
Bus 324,693 318,717 23,227 22050 230,884 223,227
Walking and
Biking 4,266,898 4,037,124 287,052 254,356 1,446,489 1,027,577
Total 7,323,666 6,595,444 1,167,625 783,562 9,181,020 7,472,838
Real Value
total 17,672,311 Predicted total 14,873,894 Percentage 84.16%
Source: CTTMA 2004
Figures 5.2, 5.3, and 5.4 on the following page display the calibrated patterns of each trip in
each mode in colour variations. The columns list the 35 places of origins and the rows list the

25
35 places of destinations. There are 1,225 (35 X 35) patterns of travel for each trip in each
mode. The left side of the figure represents the model’s estimations. The right side shows the
actual values derived from the trip survey completed by potential travellers. If the colour
tones match right to left in each mode in each trip, the model was presumed to be successful
in demonstrating actual “real-world” occurrences.
Figure 5.2 shows both estimated and the actual values for free trips in trains, cars, buses, and
walking/biking. The free trips’ travel patterns are relatively site-specific compared to the
commuting trips. Therefore both estimated and the actual values contain a number of white
cells and hard to compare them.

26
Figure 5.2: Results of logit model for free trips taken by trains, cars/motorcycles, buses, and
walking/biking in 35 zones
Key:
Left: estimated; Right: actual value
Top: Trains; Second: cars; Second from the bottom: buses; Bottom: walking and biking.
Colour: Blue 0% of the mode; Yellow 50% of the mode; Red 100% of the mode
Figure 5.3 shows the business trip estimation and the actual choices in trains, cars, buses, and
walking/biking. Again, similar to the free trips, the business trips’ actual travel patterns are
also site-specific. Nonetheless the colour tones between the two diagrams of cars are
relatively matching.

27
Figure 5.3: Results of logit model for business trips taken by trains, cars/motorcycles, buses,
and walking/biking in 35 zones.
Key:
Left: estimated; Right: actual value
Top: Trains; Second: cars; Second from the bottom: buses; Bottom: walking and biking.
Colour: Blue 0% of the mode; Yellow 50% of the mode; Red 100% of the mode
Figure 5.4 represents commuting trip taken by trains, cars, buses, and walking/biking in both
estimated and actual values. Compared to the previous two trips, the colour tones of right and
left match well. For example, in the case of trains, both actual and estimated diagrams show
the yellowish tones surrounding blue diagonal lines. Moreover, the results of the estimated
car travel patterns are illustrated by yellow cells along with a yellow/orange diagonal line,

28
similar to the actual travel patterns.
Figure 5.4: Results of logit model for commuting trips taken by trains, cars/motorcycles,
buses, and walking/biking in 35 zones.
Key:
Left: estimated; Right: actual value
Top: Trains; Second: cars; Second from the bottom: buses; Bottom: walking and biking.
Colour: Blue 0% of the mode; Yellow 50% of the mode; Red 100% of the mode
5.3 Economic Model
The economic model was designed employing the concepts of microeconomics similar to the
Cobb-Douglas Production Function. In economics, the relationship between quantity of inputs
(workers) and quantity of outputs (products) is termed the production function. Charles Cobb,
a mathematician, and Paul Douglas, an economist, developed the following Cobb-Douglas

29
Production Function developed this Cobb-Douglas Production Function and it is widely used
to represent this relationship of this production-labour.
Q = ALαK
β (1)
where Q is output, A, α, and β are constants, and L and K are labour and capital.
When α+β=1, the production function exhibits constant returns to scale and it is linearly
homogeneous. In other words, doubling each input would result in a doubling of output.
Constant returns to scale are assumed for the activities of industries in this model. This
production function was used to express the activities of the three actors used in this model.
The changes in equilibrium take place in several steps. First, modal shifts occur in each
Origin-Destination pair as the cost of trips changes with each policy change. Second, the
utility of each zone changes as the new modal split is determined. Third, each sector selects a
new location and that results in a new equilibrium in the locations of the three sectors. In an
actual “real world” scenario, the cycle repeats; however, in this study, one cycle is selected to
calibrate the emissions.
5.4 GHG Emissions Calibrations
As discussed earlier, the GHG emissions calculation was attained accounting for two factors:
Modal split change and housing location change due to changes in the equilibrium. Modal
shifts would modify the emissions drastically if each person shifts to a lower emission mode,
such as from private vehicles to trains or buses; or from buses to trains. Moreover, switching
to a zero-emission mode such as walking and biking would similarly result in a substantial
reduction.
The annual emissions from a person using trains, cars, buses, or walking/biking are measured
respectively. The amount of GHG emissions, equivalent to CO2 emissions, necessary to move
a person is 18 grams by train and 173 grams by car (Mie prefecture 2009). Considering that
most workers are commuting to Tokyo’s CBD district, the average commuting radius of 30
km is used here. The average number of working days per year is set as 240 days, as used by
Tsutsumi, et al (2006) in their Computable Urban Economic Model of Tsukuba. Table 5.3
displays the total emissions issued from a person using each mode for each trip in t/CO2
equivalent.
30
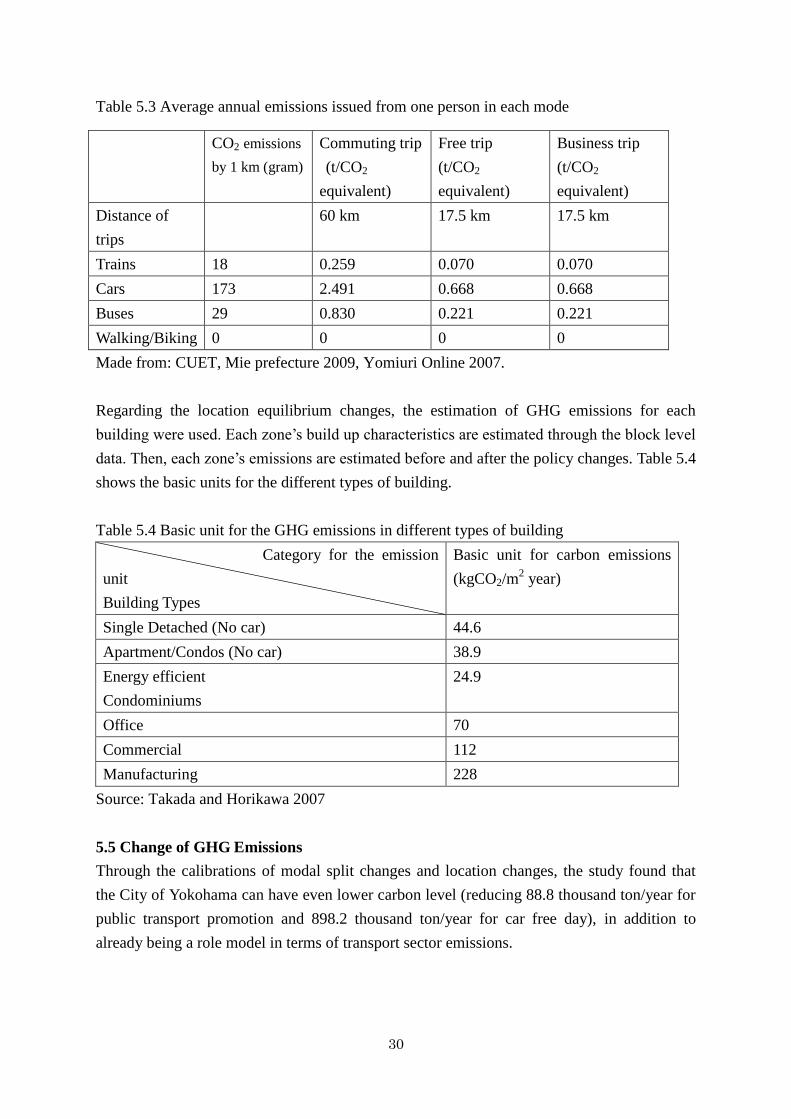
Table 5.3 Average annual emissions issued from one person in each mode
CO2 emissions
by 1 km (gram)
Commuting trip
(t/CO2
equivalent)
Free trip
(t/CO2
equivalent)
Business trip
(t/CO2
equivalent)
Distance of
trips
60 km 17.5 km 17.5 km
Trains 18 0.259 0.070 0.070
Cars 173 2.491 0.668 0.668
Buses 29 0.830 0.221 0.221
Walking/Biking 0 0 0 0
Made from: CUET, Mie prefecture 2009, Yomiuri Online 2007.
Regarding the location equilibrium changes, the estimation of GHG emissions for each
building were used. Each zone’s build up characteristics are estimated through the block level
data. Then, each zone’s emissions are estimated before and after the policy changes. Table 5.4
shows the basic units for the different types of building.
Table 5.4 Basic unit for the GHG emissions in different types of building
Category for the emission
unit
Building Types
Basic unit for carbon emissions
(kgCO2/m2 year)
Single Detached (No car) 44.6
Apartment/Condos (No car) 38.9
Energy efficient
Condominiums
24.9
Office 70
Commercial 112
Manufacturing 228
Source: Takada and Horikawa 2007
5.5 Change of GHG Emissions
Through the calibrations of modal split changes and location changes, the study found that
the City of Yokohama can have even lower carbon level (reducing 88.8 thousand ton/year for
public transport promotion and 898.2 thousand ton/year for car free day), in addition to
already being a role model in terms of transport sector emissions.

31
6. Conclusions
Through a discussion of a case study, this paper demonstrates how the two important
elements of urban planning, land use and transportation planning play essential roles in
present environmental issues such as climate change and biodiversity. It examined the
proportional relationship between Asia’s rapid urbanization and rising GHG emissions and
interrelation between the loss of biodiversity and air pollutants.
The study used the city of Yokohama as a case study for analysis because of its recent
development and policy changes aimed at creating an environmentally friendly city. The
paper provided an overview of the background information, policies, and activities of the city.
Cognizant of the specialists’ interviews, the study selected two feasible policies on land use
and transportation planning. Representing the policy changes in transportation and economic
models, the study illustrated GHG emissions changes as they correlate to modal shift changes
and housing locations changes.
There are two major contributions of this study to research fields. First, this research provides
a new and innovative example of regional carbon management focused on reducing travel
demand and modal shifts, which are usually neglected in the existing literature. Regional
carbon management, the equivalent of GHG mitigation at the regional level, is an international
and aggressive concept. This research corresponds with the aims of similar projects, such as
Cities for Climate Protection by Local Governments for Sustainability (ICLEI) and Urban and
Regional Carbon Management (URCM) by Global Carbon Project (GCP).
Second, the study confirms that land use and modal shift policies significantly influence GHG
emissions from the transport sector. The model’s results indicate that through its policy
changes and corresponding changes in human behaviours, Yokohama will achieve lower
carbon emissions. Moreover, the qualitative data demonstrated the city’s struggle to tackle the
top-down decision-making system common in urban planning. As most fast growing
Asia-Pacific cities have a similar decision-making framework, they can surely relate to
Yokohama’s efforts to create a built-up environment directed at sustaining a low carbon
society. Therefore, other areas in developing Asia-Pacific countries can look to Yokohama as
a model and consider adopting its Yokohama’s land use and modal shift policies.
In conclusion, fast growing Asian megacities cannot follow the same path as those in the rest
of the world, which the normal Environmental Kuznets Curve (EKC)8 represents. Given the
8 EKC = Environmental Kuznets Curve: It hypothesizes that the relationship between per capita income and the
use of natural resources; the emission of the wastes or pollutions has an inverted U-shape.

32
size and intensity of their urbanization, they must leapfrog to become low carbon cities where
public transit, non-motorized transport (NMT), and pedestrians are ideally accommodated as
those in affluent Asia are. Presently, anthropogenic GHG emissions are so severe on this
planet that the conventional paths of EKC should be avoided in the future. We should look to
new models, as used in Yokohama, for ways to achieve the goals of attaining low-carbon
cities.

33
References:
Charlotte Kendra Castillo, Deejay Cromwell Sanqui, May Ajero and Cornie Huizenga. (2007).
The Co-Benefits of Responding to Climate Change: Status in Asia Consultation Draft.
USEPA, Manila Observatory - MO, CAI-Asia.
City of Yokohama Statistics. (n.d.). Retrieved on July 22, 2009. From City of Yokohama
Homepage. Web site: http://www.city.yokohama.jp/front/welcome.html
City of Yokohama. (2006) Yokohamashi Seikatsu Guide (The guide for living in Yokohama).
Yokohama: City of Yokohama. (In Japanese).
City of Yokohama. (2008). Yokohama Toshi Kotsu Keikaku (Urban Transportation Planning
of the City of Yokohama). Yokohama: City of Yokohama. (In Japanese).
Committee for Transportation in Tokyo Metropolitan Area-CTTMA. (2004). Tokyo-ken
Person Trip chosa no tebiki (Guide for TMA person trip survey). Tokyo: Committee for
Transportation in Tokyo Metropolitan Area. (In Japanese).
Elena L. Zvereva, Eija Toivonen and Mikhail V. Kozlov. (2008). Changes in species richness
of vascular plants under the impact of air pollution: a global perspective. Global Ecology and
Biogeography. Volume 17 Issue 3, Pages 305-319.
GAMS homepage (2009) Retrieved on November 20, 2009. http://www.gams.com/
Gareth K. Phoenix, W. Kevin Hicks, Steve Cinderby, Johan C. I. Kuylenstierna, William D.
Stock, Frank J. Dentener, Ken E. Giller, Amy T. Austin, Rod D. B. Lefroy, Ben S. Gimeno,
Mike R. Ashmore, and Philip Ineson. (2006). Atmospheric nitrogen deposition in world
biodiversity hotspots: the need for a greater global perspective in assessing N deposition
impact. Global Change Biology. Volume 12 Issue 3, Pages 470 - 476.
International Energy Agency (IEA). 2006. The Road from Kyoto: Current CO2 and Transport
Policies in the IEA. Paris: IEA.
Kono, Noriko and Tomomi Hoshiko. (2007). Promoting Reduction in Travel Demand in
Transport Sector of Asian Cities: Case of Yokohama, Japan. In Air Pollution Control in the
Transportation Sector: Third Phase Research Report of the Urban Environmental
Management Project. Hayama: Institute for Global Environmental Studies (IGES).

34
Kono, Noriko and Yoshiki Yamagata. (2009). Mitigating Greenhouse Gas Emissions in the
Asia-Pacific Region through Land Use Planning. Paper presented at International Human
Dimension Program (IHDP) Open Meeting 2009. Presented on April 28, 2009 in Bonn,
Germany.
Kono, Noriko. (2010). Towards Low Carbon Cities through Land Use and Modal Shifts: A
Case of Yokohama. PhD diss., University of Hawaii at Manoa.
Kono, Noriko. (2009). Japanese Low Carbon Cities - a Role Model in the Asia-Pacific
Region? Indicators on Land Use and Transportation Planning of LCCs. Paper presented at
World Bank Workshop on Global City Indicator Program and Development of Greenhouse
Gas Index for Cities on June 22, 2009 in Tokyo, Japan.
Kono, Noriko, and Hidefumi Imura. (2005). Capacity Development for Cities through the
Environmental Asset Approach: Examples of its application in Japanese cities. In Working
paper for IGES. Hayama: IGES.
Kono, Noriko, Kiyomi Kawamoto, and Hidefumi Imura. (2004). Environmental Management
Capacity and International Environmental Cooperation: Case study on three industrial cities
in Japan (Kankyo-kanri-noryokushisan to kankyo-kokusai-kyoryoku: nihon no sandai
kogyotoshi o reini) Paper presented at Environmental Systems Committee Annual
Conference 2004. (In Japanese)
Loppi, Stefano, Luca Paoli, Carlo Gaggi. (2006). Diversity of Epiphytic lichens and Hg
contents of Xanthoria parientina Thalklli as Monitors of geothermal air pollution in the Mt.
Amiata Area (central Italy)
MDG in Asia and the Pacific. (n.d.). Retrieved on July 22, 2009. From Millennium
Development Goals in Asia and the Pacific. Web site: http://www.mdgasiapacific.org/
Metropolitan Statistics. (n.d.). Retrieved on July 22, 2009. From City of Yokohama
Homepage. Web site: http://www.city.yokohama.jp/me/stat/daitoshi/new/
Mie Prefecture Homepage (n.d.) Retrieved on November 20, 2009.
http://www.eco.pref.mie.jp/diary/details.asp?cd=2008100423&pno=3 (In Japanese)
Phillip R. Berke, Edward J. Kaiser; Donald Godschalk. (2006). Urban Land Use Planning.
Chicago: University of Illinois Press.

35
Rental Cycle Hama-Chari. (n.d.). Nice Yokohama homepage. Retrieved on July 22, 2009
from Nice Yokohama. Web site: http://niceyokohama.web.infoseek.co.jp/ (In Japanese)
Takagda, Shuichi and Takehiro, Horikawa. (2007). How to Promote Energy Efficiency in
Buildings (Shoene taisaku no kangaekata susumekata). Tokyo: Ohmu-sha. (in Japanese)
Tamura, Akira. (1983). Toshi Yokohama wo tsukuru (Making of the City of Yokohama).
Tokyo: Chuokoronsha. (In Japanese).
Tsutsumi, Morito, Kazuhiro Otoha, and Nao Shimizu. 2006. Computable Urban Economic
Model for Tsukuba-Tsuchiura-Ushiku Area. Tsukuba: University of Tsukuba. (In Japanese)
United Nations Department of Economic and Social Affairs (DESA) (2009) The Millennium
Development Goals Report 2008. New York: UNDESA.
United Nations Department of Economic and Social Affairs Population Division. (2007).
World Population Prospects: The 2006 Revision. New York: United Nations.
United Nations Department of Economic and Social Affairs Population Division. (2008).
World Urbanization Prospects: The 2007 Revision. New York: United Nations.
Urban Environmental Management Project, Institute for Global Environmental Studies-IGES.
(2005). Urban Energy Use and Greenhouse Gas Emissions in Asian Mega-Cities: Policies for
a sustainable future. Hayama: IGES.
Wescott, Clay and Doug Porter. (2002). Fiscal Decentralization and Citizen Participation in
East Asia. Conference Paper presented at the Citizen Participation in the Context of Fiscal
Decentralization: Best Practice in Municipal Management in Latin America and Asia. Manila:
Asia Development Bank.
Wolfe, Jeanne M. (1989). Theory, practice, explanation and action: the example of urban
planning. Remaking of Human Geography. Audrey Kobayashi and Suzanne MacKenzie.
Unwin Hyman: London, pp.62-77.
Zenkoku Sumitaitoshi Ranking (Ranking for the most popular cities to live in Japan) (n.d.).
Retrieved on July 22, 2009. From Seikatsu Guide Chiiki Joho. Web site:
http://www.seikatsu-guide.com/area/national_rank.html (In Japanese)

The United Nations University Institute of Advanced Studies (UNU-IAS) is a global think tank whose mission is “to advance knowledge and promote learning for policy-making to meet the challenges of sustainable development.” UNU-IAS undertakes research and postgraduate education to identify and address strategic issues of concern for all humankind, for governments, decision makers and, particularly, for developing countries.
The Institute convenes expertise from disciplines such as economics, law, social and natural sciences to better understand and contribute creative solutions to pressing global concerns, with research focused on the following areas:
• Biodiplomacy• Sustainable Development Governance• Science and Technology for Sustainable Societies • Education for Sustainable Development• Sustainable Urban Futures • Traditional Knowledge